Abstract
High-pressure die casting (HPDC) is a highly efficient method for producing aluminum parts that require high dimensional accuracy and complex shapes. However, the quality of the resulting castings, specifically their porosity and microstructure, is critically dependent on the setting of process parameters. Any deficiencies in these aspects can lead to a significant reduction in the mechanical properties of the components. This article deals with the influence of plunger speed during high-pressure die casting on microstructure homogeneity and the occurrence of porosity in critical areas of AlSi9Cu3(Fe) alloy castings. Numerical simulations and experimental evaluation demonstrated that with increasing plunger speed, there is a transition from a transitional to a laminar flow regime to a fully turbulent regime, which affects the homogeneity of the alloy and its solidification. Turbulent flow minimizes shrinkage porosity in castings but increases the risk of gas porosity and oxide inclusions due to reoxidation processes, leading to the entrainment of air and oxide layers. Microporosity analysis showed that the lowest occurrence of shrinkage-type pores was found at a plunger speed of 4 m/s due to rapid filling and shorter solidification time. The optimal plunger speed range is between 3 and 3.6 m/s, ensuring a compromise between microstructure stability and minimization of porosity in critical areas.
1. Introduction
High-pressure die casting is a widely used manufacturing process, especially for aluminum alloys, due to its ability to produce complex components with high precision, excellent surface finish, and minimal additional treatments. This technology involves the rapid injection of molten metal under high pressure into a metal mold, which leads to very rapid solidification. The HPDC process is widespread, especially in the automotive, electrical engineering, and consumer industries, where it enables the production of thin-walled, precise, and dimensionally stable castings with a short cycle and minimal need for subsequent machining. Despite many advantages, such as high production speed and cost-effectiveness, HPDC castings are prone to specific defects, primarily increased porosity and microstructural inhomogeneities, which can significantly affect their mechanical properties and final reliability [1,2].
One of the key process parameters that fundamentally influences the formation of these defects and the overall quality of the casting is the plunger speed during the second phase of mold filling. In this phase, the plunger speed typically reaches values from 1 to 6 m/s, leading to extremely fast melt flow in the gating system up to 30 to 100 m/s [3]. The melt flow rate in the runner, in direct connection with the mold geometry, defines the flow regime, which can be laminar, transitional, turbulent, or even dispersed. The flow regime during filling significantly affects the location and amount of porosity [4]. In addition to the flow regime, the solubility of gases in the melt is also crucial for the formation of gas pores. This solubility is governed by Sievert’s Law:
where C is the concentration of dissolved gas (e.g., hydrogen) in the melt, S is the gas solubility in the melt at standard pressure, and P is the partial pressure of the gas above the melt. This relationship physically explains why a drop in pressure (e.g., during solidification) or an increase in temperature leads to the release of gases from the solution and the formation of pores. The flow regime and associated pressure changes in the melt thus directly affect the amount of dissolved gas and, consequently, the susceptibility to pore formation [5]. However, it is important to emphasize that the main determinant of pore formation is the quality of melt degassing. Degassing efficiency, holding furnace time, and the presence of a protective gas have a major impact on the amount of dissolved gas present in the melt before injection, which is crucial for the total amount of pores in the casting. In the context of modern casting metallurgy, the model proposed by Professor Campbell represents a revised and widely accepted theoretical framework that fundamentally revises the conventional understanding of the origin of defects. The key premises of this theory are based on the assertion that a significant portion of defects, including gas porosity, do not arise from random processes during solidification, but have their primary origin in the stage of processing and filling the melt. The key mechanism is entrainment, in which surface turbulence during mold filling breaks down the surface oxide film and presses it into the volume of liquid metal. In highly reactive aluminum alloys, a robust oxide layer is formed immediately. When this film is deposited, its two dry, non-metallic sides do not bond, creating a bifilm—a latent internal crack. This bifilm serves as a key site for the heterogeneous precipitation of dissolved hydrogen, whose concentration is governed by Sievert’s law. Instead of spontaneous pore formation, supersaturated hydrogen precipitates onto the dry surfaces of the bifilm during solidification, causing the bifilm to “unfold” and inflate into a visible pore. The amount of hydrogen thus controls the potential pore size, while the number of bifilms carried away determines the number of pores in the casting. This theoretical model, confirmed by numerical simulations, clearly shows that high flow rates in processes such as high-pressure casting lead to intense turbulence and the subsequent formation of a biofilm population, which directly increases the risk of porosity [2,6,7]. The transition between laminar and turbulent flow is characterized by the Reynolds number (Re), defined as:
where ρ is the density of the melt, v is the characteristic flow velocity, L is the characteristic dimension, and μ is the dynamic viscosity of the melt. An increase in the number of Reynolds can lead to a transition to a supercritical regime, where the boundary layer becomes fully turbulent [8]. For Re values < 2300, laminar flow is typically assumed, while for Re > 4000, the flow is turbulent. In the range between these values, a transitional regime occurs. For aluminum alloys in HPDC, Re values are often on the order of 104, indicating a strongly turbulent or even dispersed flow regime [9].
Re = ρ · v · L/μ
The laminar regime is characterized by smooth and predictable melt flow, which minimizes turbulence and limits the entrainment of air and oxides from the mold surface into the melt volume. This type of flow ensures uniform mold filling, reduces the risk of misruns, promotes a consistent microstructure, and controlled solidification. The result is higher alloy purity, better strength, dimensional accuracy, and fatigue life [10,11]. The transitional regime represents a state between laminar and turbulent flow, where unstable flow occurs with velocity and pressure fluctuations. These conditions lead to local turbulences and backflows, which promote gas entrapment and uneven pore distribution, thereby reducing the reliability of the mechanical properties of the castings [12,13]. The turbulent regime is characterized by chaotic flow with high velocities that cause intensive mixing of the melt with air and the formation of vortices. These phenomena lead to increased formation of gas pores and oxide inclusions, which negatively affect strength and ductility. On the other hand, high filling speeds can contribute to the decomposition of larger inclusions into smaller particles and refinement of the structure, which is advantageous in thin-walled areas [8,14,15]. The dispersed regime occurs at extremely high filling speeds when the melt breaks down into droplets that mix with air. This results in the formation of fine, uniformly dispersed pores, but also an increased risk of reoxidation and the formation of oxide films that can weaken the casting structure [16,17].
The design of the gating system and the way the mold cavity is filled, particularly the melt flow rate in the gates, are key factors in determining the microstructure of the resulting casting [18]. An increase in injection speed leads to a significant refinement of the α-Al phase, which is particularly visible in thin-walled sections. This refinement manifests as a shorter primary and secondary dendritic arm spacing. Physically, this is due to shorter filling and solidification times in thin-walled areas, leading to high cooling rates and increased undercooling. These conditions promote a higher nucleation rate and limit dendrite growth, resulting in a finer grain structure [19,20,21]. Similarly, higher melt flow rates in the gates contribute to a reduction in dendritic cell size, with this effect being more pronounced in thicker areas of the casting, thus generally promoting finer dendritic structures. Slower cooling in thicker areas of the casting provides more time for diffusion and dendrite growth [22,23]. There is a direct inverse correlation between low values of secondary dendritic arm spacing and high tensile strength and elongation at break. A finer dendritic structure provides more grain boundaries, which hinder teras propagation, and ensures a more uniform stress distribution. These observations are consistent with the Hall-Petch relationship, which describes the dependence of yield strength on grain size [24]:
σy = σ0 + ky ⋅ d−1/2
In this relationship, σy is the yield strength, σ0 is a material constant, ky is the strengthening coefficient, and d is the average grain diameter of the α-Al phase. This relationship explains why grain refinement leads to an increase in strength. Grain boundaries act as obstacles to dislocation movement, thereby increasing the material’s resistance to plastic deformation. Furthermore, the relationship between α-Al grain size and cooling rate can be expressed as [19]:
where Q is the growth restriction factor and CR is the cooling rate. This relationship shows that an increase in cooling rate leads to a decrease in α-Al grain size. Physically, this is due to higher cooling rates promoting a higher nucleation rate and limiting the time available for grain growth, ultimately leading to a finer microstructure [25].
Understanding the influence of plunger speed on microstructure homogeneity and porosity formation during high-pressure die casting is a fundamental step towards optimizing the quality of AlSi9Cu3(Fe) alloy aluminum castings. This article specifically focuses on analyzing the correlation between mold filling speed and defect occurrence in critical casting areas, as well as changes in the local microstructure due to different melt flow regimes. It is important to note that plunger speed impacts melt temperature during filling, thus directly influencing the solidification process. Slower speeds lead to slower cooling rates in sections far from the in-gate. While prior research has demonstrated the effect of plunger speed on casting quality overall, a comprehensive understanding of how this parameter simultaneously impacts micro- and macroporosity in a single component is lacking. This study addresses a key challenge: the contradictory effect of filling speed. While higher speeds effectively suppress the formation of shrinkage pores (microporosity), they can also lead to an increase in large gas and oxide defects (macroporosity). This study aims to address this issue by providing a detailed quantitative and qualitative evaluation to identify the optimal speed that minimizes both types of defects, thereby improving the mechanical properties of the final product. Higher plunger speeds generate turbulent to dispersed flow regimes, which significantly affect eutectic phase morphogenesis and increase the risk of gas incorporation into the melt, leading to internal porosity formation. The analysis shows that optimizing plunger speed decisively influences achieving microstructural uniformity, reducing defect occurrence, and improving the mechanical properties of the final casting. These results improve our understanding of the relationships between mold filling dynamics, local solidification conditions, and the quality of castings produced by HPDC technology.
2. Materials and Methods
2.1. Experimental Alloy and Castings
Experimental castings, shown in Figure 1a, were made from a hypoeutectic aluminum alloy of type AlSi9Cu3(Fe), which is characterized by high thermal and chemical resistance, as well as favorable mechanical properties, especially strength. The chemical composition of the alloy used is given in Table 1.
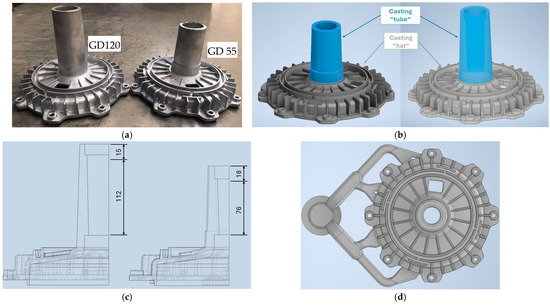
Figure 1.
Experimental castings: (a) Real casting; (b) Casting model with definition of tube and hat parts; (c) Changing the length [mm] of the casting tube; (d) Geometry of the gating system.

Table 1.
Chemical composition of AlSi9Cu3(Fe) alloy.
The production of castings took place at Rosenberg-Slovakia s.r.o. (Medzev, Slovania), in cooperation with the Department of Technological Engineering of the University of Žilina. The cast components were castings designated as Statorbuchse GD, produced in two height variants of the tube—Statorbuchse GD 120 and Statorbuchse GD 55. The geometry of the hat part remained unchanged in both cases, while the different dimensions of the tube length are shown in detail in Figure 1b,c. The tube of the casting, especially its lower part, represents a key area of the casting, on which the greatest attention is focused in terms of evaluating its quality.
2.2. Melt Preparation and Casting Process
The melting process took place in a STRIKO WESTOFEN MHS 750/350 melting furnace (StrikoWestofen, Wiehl, Germany), with a holding capacity of 750 kg. After melting, the melt was poured into a transport ladle and then subjected to automatic degassing with nitrogen using a rotary system. After degassing, oxide inclusions were mechanically removed from the melt surface, and the melt was transported to the holding furnace. Casting was carried out on a CLH 630.02P and CLH 400.02P pressure die casting machine (Frech, Schorndorf, Germany) with a horizontal cold chamber. Throughout the process, automated mold treatment was also ensured using a Wollin brand device (Wollin GmbH, Lorch, Germany).
For each of the two casting types, four technological variants were designed, in which the key parameter, the maximum plunger speed during the second stage of mold filling (vmax), was changed. Changes also occurred in the maximum pressure in the filling chamber and the length of the filling chamber itself, depending on the type of casting. Five castings from each variant were taken during the casting cycle for subsequent evaluation. The change in maximum pressure in the chamber directly affected the solidification time of the castings. Other technological conditions, such as mold and melt temperature, or mold treatment method, were also constant throughout the experiment, ensuring the stability and repeatability of the experimental process. An overview of the process parameters is given in Table 2. Figure 2 graphically represents the dependence of the plunger speed on its position.
Table 2.
Casting parameters of the GD 120 and GD 55 parts.
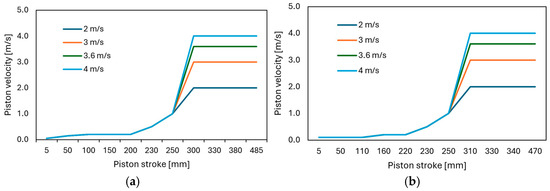
Figure 2.
The dependence of the plunger speed to its position: (a) GD 120; (b) GD 55.
2.3. Equipment and Evaluation Process
2.3.1. ProCAST Simulation
ProCAST software (version 2024.0, ESI Group, Paris, France) was used to perform numerical simulations, allowing detailed analysis of individual phases of high-pressure die casting processes. In the presented article, we focused on analyzing melt velocities and identifying dominant flow regimes, which fundamentally affect the quality of the final casting, through numerical simulations. The input parameters and boundary conditions of the simulation were defined based on real production data provided by Rosenberg-Slovakia, ensuring a high degree of correlation with actual process conditions. The basic simulation settings are given in Table 3.
Table 3.
Simulation input conditions and parameters.
2.3.2. Sample Preparation
Samples for metallographic analysis were prepared by a standardized procedure, which included sequential wet grinding (coarse and fine), mechanical polishing on automated equipment using diamond emulsion, and subsequent chemical etching. Samples were taken from the lower area of the tube part of the casting (Figure 3). This area is characterized by the formation of possible hot spots during solidification. It is also intended for mechanical machining from both the inner and outer sides where the bearings will be pressed into the EC motor assembly. To highlight structural phases, an etching solution consisting of 20 mL H2SO4 and 100 mL distilled water was applied. For in-depth analysis and three-dimensional visualization of eutectic silicon morphology and intermetallic phases, an etching solution composed of 36 mL HCl and 100 mL distilled water was used, with an etching exposure time of approximately 30 s. Aluminum matrix residues (α-phase) were removed after etching by intensive rinsing in ethanol.
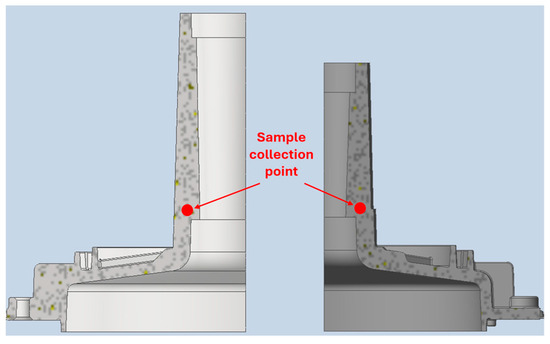
Figure 3.
Sample collection point for structural analysis.
2.3.3. Optical and Electron Microscopy
Structural characterization of the microstructure was performed using a Keyence digital microscope (VHX-7000 series, Keyence, Osaka, Japan), which enables high-resolution imaging with the possibility of 3D surface reconstruction. For more detailed morphological and chemical analyses, scanning electron microscopy (SEM, TESCAN VEGA LMU II, TESCAN, Brno, Czech Republic) was used in combination with energy-dispersive X-ray spectroscopy (EDX, TESCAN Bruker QUANTAX system, Bruker, Billerica, MA, USA). The surface of samples intended for SEM/EDX analysis was treated by etching in a 0.5% hydrofluoric acid solution before measurement, which significantly highlighted phase boundaries and intermetallic structures. To quantify the results of observing the tube parts of the castings using an optical microscope, the average length of the eutectic silicon (Si) needles was measured and the DAS index was calculated according to the following equation:
DAS = L/(n − 1)
Measurement was performed manually using Quick PHOTO INDUSTRIAL software (version 3.2, Promica, Holešovice, Czech Republic).
2.3.4. Prorosity Evaluation
Non-destructive porosity analysis was performed through a digital X-ray system with a fixed detector DeReO (V.J. Technologies, Bohemia, NY, USA). We performed a quantitative evaluation of porosity based on X-ray images processed using QuickPHOTO INDUSTRIAL software (version 3.2, Promica, Holešovice, Czech Republic). Using this program’s graphical filters, we marked and filled all pores in the selected areas with red, and then determined their surface area. Microporosity evaluation was performed using a Keyence digital microscope (VHX-7000 series, Keyence, Osaka, Japan). This device also performed microporosity evaluation on metallographic cross-sections through automated image analysis, which allows precise quantification of pore dimensions, shapes, and distribution. For each casting and its variant, 5 random areas were selected for analysis, from which the average values of the measured quantities were subsequently calculated.
3. Results
3.1. Numerical Simulation ProCAST
From the analyzed data (Table 4), it is clear that plunger speed has a direct and significant impact on the melt velocity in the five observed gates (1 to 5 Figure 4). With increasing plunger speed from 2 m/s to 4 m/s, a consistent increase in both maximum and average melt velocities was observed in all gates. The maximum velocity in gate 1 increased from 42.2 m/s at a plunger speed of 2 m/s to 82.4 m/s at 4 m/s. Similar trends were also recorded for average velocities. Differences between individual gates were also significant; gates 1 and 2 showed significantly higher maximum and average velocities compared to gates 3 and 4, especially at higher plunger speeds. This phenomenon indicates a substantial influence of geometry and gate placement on the local melt flow velocity. Gates 3 and 4, which achieved lower velocities, function as areas with smoother flow. Graphical representation of velocities for casting GD 120 at speeds of 2 m/s (Figure 4a) and 4 m/s (Figure 4b) visually confirms that maximum velocities are significantly higher at a plunger speed of 4 m/s (around 80 m/s) compared to 2 m/s (around 40 m/s).
Table 4.
Maximum and average melt flow velocities in the gates of the gating system depending on plunger speed.
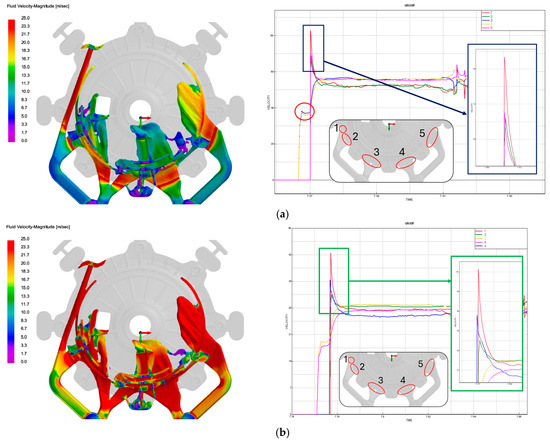
Figure 4.
Visualization of melt flow velocity distribution and time dependence of velocity in the gates of the GD 120 casting gating system during mold filling: (a) 2 m/s; (b) 4 m/s.
Based on the results of numerical simulation of flow regimes, it can be concluded that in all analyzed cases, mold filling occurs in a turbulent regime. The simulated maximum melt velocities in the gate area, ranging from 42.2 m/s to 82.4 m/s, significantly exceed the critical limit for transition to turbulent flow (~1.5 m/s) and also fall within the typical range of turbulent filling in high-pressure die casting of aluminum alloys (30 to 60 m/s in the gate area).
Although the dominant filling mechanism remains turbulent, the combination of high filling speed and complex mold cavity geometry can lead to manifestations of dispersed filling. This regime is characterized by the breakdown of the main melt stream into several separate branches that meet and merge in different parts of the mold cavity.
For a deeper understanding of the influence of plunger speed on the integrity of the final casting, a detailed analysis of melt flow dynamics in critical tube sections, which are visually represented by yellow rectangles with red outlines in the figures (Figure 5), was performed. These sections are particularly sensitive to defects in terms of casting functionality.
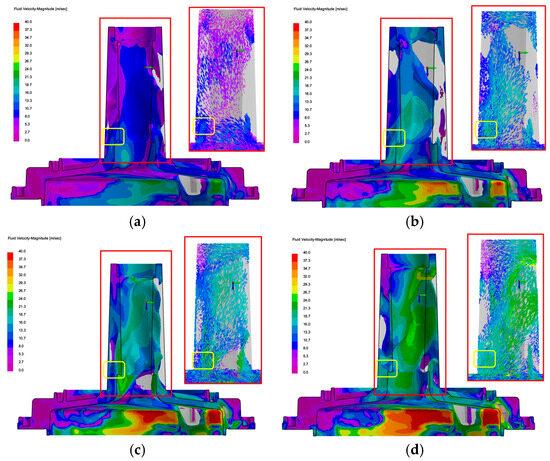
Figure 5.
Comparison of melt flow simulations—velocity magnitude distribution and detailed vector fields in key areas for GD 120 casting: (a) 2 m/s; (b) 3 m/s; (c) 3.6 m/s; (d) 4 m/s.
At lower speeds (2 m/s and 3 m/s), the melt in the tube area exhibits a partially ordered to transitional flow, meaning that the flow does not show significant turbulent behavior, but at the same time is not completely laminar. This state is typically characterized by local deviations in flow velocity, which are manifested primarily in the corner parts of the tube, in the area of cross-section changes, and at the contact of the melt with the mold walls. The melt progresses in the form of a continuous front; however, the vector fields from the visualizations indicate the presence of stagnant areas where flow is significantly slowed down, as well as insufficiently filled zones depending on the cavity geometry.
With increasing plunger speed to 3.6 m/s and 4 m/s, there is a significant intensification of the turbulent flow regime, which is characterized by a significant increase in the kinetic energy of the flow, disruption of directional flow order, and the occurrence of chaotic vortex structures. Detailed vector analyses in critical areas of the tube indicate the formation of local vortices and back currents, which are typical manifestations of turbulent filling. In this regime, the melt penetrates the mold cavity significantly faster and with higher energy, which results in better filling of complex geometry areas, including the upper parts of the tube. On the other hand, such intense turbulent flow can be accompanied by undesirable concomitant phenomena, such as an increased risk of melt surface oxidation, air ingress into the molten metal, and mechanical entrainment of particles from the mold walls.
Figure 6 shows a comparison of melt flow results when casting the GD 55 component. At the lowest plunger speed of 2 m/s (Figure 6a), a predominantly laminar flow character with lower velocity magnitude is observed in the tube area, while a stagnant zone forms in the lower part of the cavity. This zone increases the risk of porosity and cold shuts, as the melt flow is insufficiently intense to completely fill geometrically complex areas. Increasing the speed to 3 m/s (Figure 6b) leads to a significant activation of flow and the formation of a slightly turbulent regime, especially in the area of transition from the horizontal to the vertical part of the mold. The vector field indicates a more dynamic filling of the cavity, with a more uniform velocity profile than at lower speeds. This morphological state is more favorable from the perspective of mold filling; however, local swirling can lead to disruption of laminar grain growth during solidification. At a speed of 3.6 m/s (Figure 6c), the flow is already turbulent, with a higher flow velocity and the presence of more intense vortex structures. However, increased turbulence also increases the risk of air entrainment and disruption of the oxide layer. The highest analyzed speed of 4 m/s (Figure 6d) leads to a dominant turbulent regime with a very high magnitude of flow velocity.
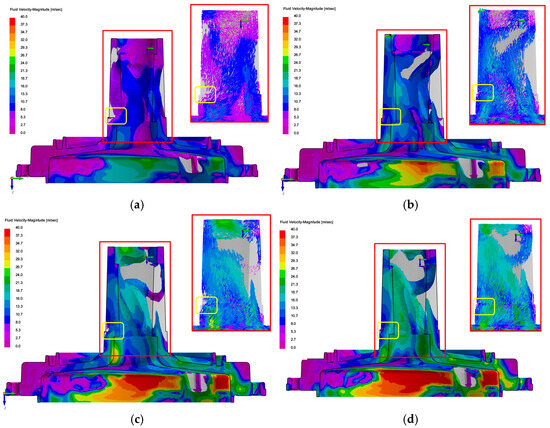
Figure 6.
Comparison of melt flow simulations—velocity magnitude distribution and detailed vector fields in key areas for GD 55 casting: (a) 2 m/s; (b) 3 m/s; (c) 3.6 m/s; (d) 4 m/s.
Figure 7 shows the simulation results demonstrating the influence of plunger speed on the solidification process of GD 120 and GD 55 castings. Figure 7a,d display solidification time maps for GD 120 and GD 55 castings at a speed of 2 m/s. Figure 7e,f show the same maps at a speed of 4 m/s. As can be seen from these visualizations, a faster plunger speed shortens the solidification time. At a low plunger speed of 2 m/s, the melt progressively solidifies from the mold walls, creating extensive areas with long solidification times (represented by yellow and orange). At a high speed (4 m/s), the yellow and orange areas are significantly reduced, indicating faster solidification of the melt. The graphs in Figure 7c,f display temperature evolution curves for critical points in the GD 120 and GD 55 castings. These curves confirm that as the plunger speed increases, the total solidification time and cooling rate decrease.
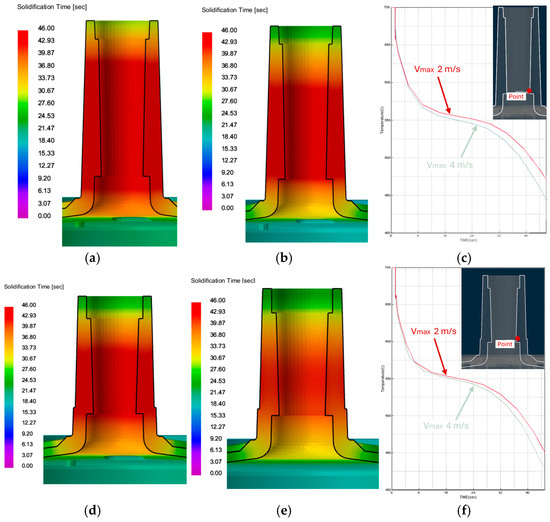
Figure 7.
Comparison of solidification time maps for GD 120 and GD 55 castings and temperature versus time dependencies in critical areas: (a) GD 120 − 2 m/s; (b) 120 − 4 m/s; (c) Cooling curves for GD 120 castings; (d) GD 55 − 2 m/s; (e) GD 55 − 4 m/s; (f) Cooling curves for GD 55 castings.
Figure 8 shows how plunger speed affects the formation of oxide inclusions during mold filling. Clearly, at lower plunger speeds (Figure 8a,c), the amount of oxide inclusions is minimal. The melt flows more smoothly, reducing interaction with the surrounding air. However, as the plunger speed increases (Figure 8b,d), the number of oxide inclusions increases. This phenomenon is a direct consequence of increased turbulence and transition to a dispersed flow regime where the melt breaks down into smaller streams that mix with the air.
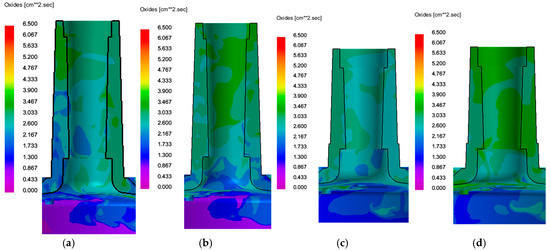
Figure 8.
Effect of Plunger Speed on the Formation of Oxide Inclusions: (a) GD 120 − 2 m/s; (b) 120 − 4 m/s; (c) GD 55 − 2 m/s; (d) GD 55 − 4 m/s.
Based on the Air Entrainment simulation in the cross-section of the tube part of the GD 55 and GD 120 castings in Figure 9, it is clear that at a speed of 2 m/s, areas with a higher concentration of trapped air occur in both casting variants (GD 55 and GD 120). This may be caused by slow and inefficient filling of the mold. At a piston speed of 4 m/s, the presence of trapped air is lower, which is a direct result of rapid filling and displacement of air from the mold cavity. These results demonstrate the opposite effect of piston speed on two different types of porosity. While a speed of 2 m/s causes large pores due to less efficient venting, a speed of 4 m/s, although effectively displacing air, can cause smaller but evenly distributed pores in other areas due to turbulence.
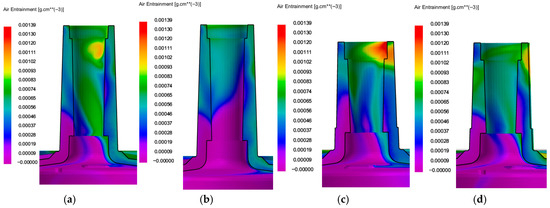
Figure 9.
Effect of Plunger Speed on Air Entrainment during Mold Filling: (a) GD 120 − 2 m/s; (b) 120 − 4 m/s; (c) GD 55 − 2 m/s; (d) GD 55 − 4 m/s.
3.2. Microstructure Evaluation
When looking at the microstructure image of the GD 120 − 2 m/s casting from the optical microscope (Figure 10a), α-phase dendrites and eutectic Si distributed in the interdendritic areas of primary α(Al) can be observed. Si particles at the lowest speed crystallized predominantly as dark gray needles/lamellae with various orientations. This state is referred to as an unmodified state, characterized by hexagonal plate-like formations. In the SEM image, the presence of intermetallic phases, primarily based on Fe and Cu, can be identified (Figure 10a). For the casting with a plunger speed of 3 m/s, no fundamental change in the α-phase grains and eutectic Si was observed in the optical microscope image (Figure 10b). Similarly, in the SEM image, intermetallic phases based on Fe with polyhedral grain morphology and Cu-rich phases are observed (Figure 10b). A similar character of the main structural components is also observed in the microstructure of castings with higher plunger speeds or higher filling speeds (approx. 15 m/s). A slight change can be observed in the morphology of eutectic Si, where a slight narrowing and elongation of the needles/lamellae of this phase observed in the plane of the cross-section occurred (Figure 10c,d).
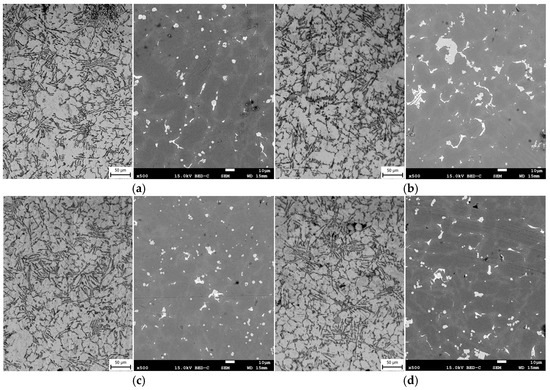
Figure 10.
Microstructure images of GD 120 casting, optical microscope and SEM: (a) 2 m/s; (b) 3 m/s; (c) 3.6 m/s; (d) 4 m/s.
When examining the microstructure of castings with a smaller tube using an optical microscope and SEM, no fundamental change in the character of individual microstructures occurred. The main difference is a slight decrease in the size of the α(Al) phase in all GD 55 castings. Similarly, a trend of slight narrowing and elongation of eutectic Si lamellae was observed with increasing melt flow rate in the mold cavity and also in the critical areas of the tube (Figure 11). This trend was confirmed by evaluating the average DAS index of the α(Al) phase. The index decreased from 23.9 μm to 20.8 μm for the GD 120 casting and from 19.4 μm to 17.9 μm for the GD 55 casting. The average length of the eutectic plates also increased, from 26.7 μm to 49.8 μm for the GD 120 casting and from 27.0 μm to 39.1 μm for the GD 55 casting. This confirms the morphological changes associated with increased plunger speed.
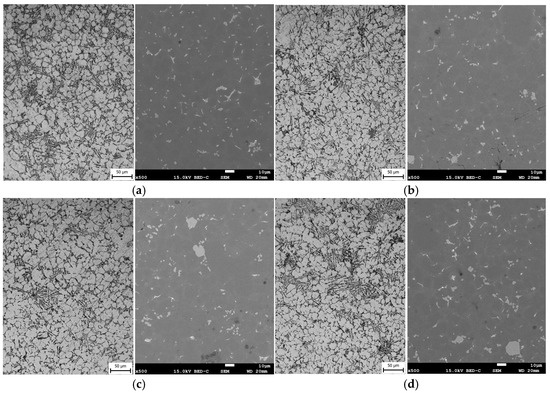
Figure 11.
Microstructure images of GD 55 casting, optical microscope and SEM: (a) 2 m/s; (b) 3 m/s; (c) 3.6 m/s; (d) 4 m/s.
For a detailed morphological characterization of eutectic Si, the deep etching method was applied. At lower plunger speeds of the GD 120 casting (2 and 3 m/s), clusters of fine eutectic Si lamellae forming characteristic fan-like structures were identified in the deep etch images (Figure 12a,b). With increasing plunger speed, the lamellae thinned, but at the same time increased in length, indicating a complex influence of mold filling dynamics on local cooling and eutectic morphology (Figure 12c,d). Higher plunger speed accelerates mold cavity filling, thereby reducing temperature gradients and simultaneously affecting the turbulence of the metal flow, which is secondarily manifested in the microstructure.
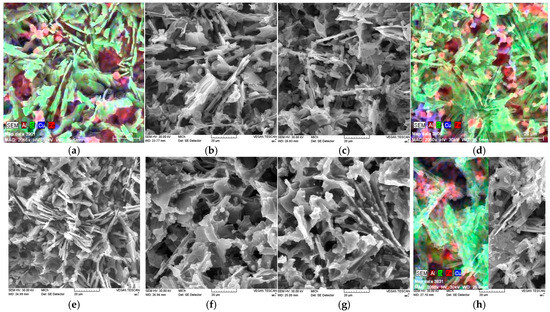
Figure 12.
Morphology of eutectic Si, SEM, Deep etching: (a) GD 120 − 2 m/s; (b) GD 120 − 3 m/s; (c) GD 120 − 3.6 m/s; (d) GD 120 − 4 m/s; (e) GD 55 − 2 m/s; (f) GD 55 − 3 m/s; (g) GD 55 − 3.6 m/s; (h) GD 55 − 4 m/s.
When comparing both casting geometries, it was shown that the change in size and morphology of eutectic silicon depending on the plunger speed was more pronounced in the case of GD 120 castings compared to GD 55. In the case of GD 120, clearer differences in eutectic morphology were observed at different mold filling speeds, which may be related to different flow dynamics and a larger volume of metal, which reduces the cooling rate and thus prolongs the crystallization time. In this area, the action of temperature gradients is more pronounced, which can lead to more significant segmentation and growth of eutectic silicon lamellae. In all evaluated samples, regardless of casting geometry and plunger speed, fine polyhedral phases of the α-Al(Fe,Mn,Cr)Si type were observed.
The graphs in Figure 13 show two microstructural properties of GD 120 and GD 55 castings depending on piston speed. The red dots represent the DAS index and the blue dots represent the average length of eutectic phases.
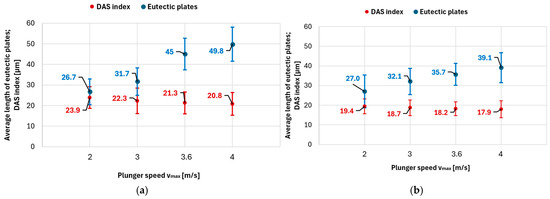
Figure 13.
DAS index and average lengths of eutectic plates: (a) GD 120; (b) GD 55.
Figure 14 shows EDX evaluations (point and line method). The point method confirmed the presence of Fe, Mn, and Cr elements in the present intermetallic with polyhedral morphology. On the other hand, the line analysis showed that Fe is also present in the copper-rich phase, and together they form the Al7Cu2Fe phase, which is typical for its hard and brittle lamellar or blocky morphology.
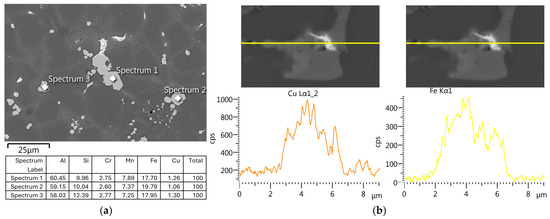
Figure 14.
EDX analysis of intermetallic phases: (a) Fe-based phases—α-Al(Fe,Mn,Cr)Si; (b) Cu-based phase—Al7Cu2Fe.
3.3. Porosity
3.3.1. X-Ray Evaluation
X-ray evaluation of macroporosity in the tube section of the casting demonstrated important changes in the presence, size, distribution, and number of pores depending on the plunger speed. At a maximum plunger speed of 2 m/s, the highest concentration of porosity was observed in the casting tube (Figure 15a). Pores were relatively uniformly distributed in the volume of the tube, which indicates a homogeneous distribution of porosity in this part. Increasing the maximum plunger speed to 3 m/s led to a rapid decrease in the number and size of pores (Figure 15b). Pore distribution was primarily concentrated in the lower part of the tube, with a gradual decrease in their number and size towards the upper part of the tube. Upon further increasing the maximum plunger speed to 3.6 m/s, a re-increase in the total amount and size of pores occurred compared to the conditions at 3 m/s (Figure 15c). At a maximum plunger speed of 4 m/s, a slight re-increase in the number and size of present pores occurred, but not in the same form as with the casting with a plunger speed of 2 m/s (Figure 15d).
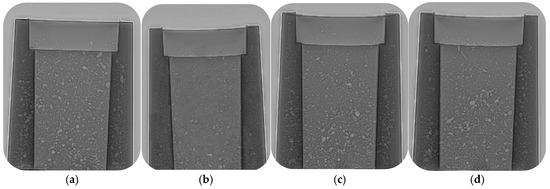
Figure 15.
X-ray of the tube part of GD 120 casting: (a) 2 m/s; (b) 3 m/s; (c) 3.6 m/s; (d) 4 m/s.
X-ray evaluation of macroporosity in the tube part of the GD 55 casting with a smaller height revealed similar, but altered trends in the character of porosity depending on the plunger speed. At a maximum plunger speed of 2 m/s, the highest concentration and largest size of pores were again recorded. Their distribution was predominantly concentrated in the lower and middle parts of the tube (Figure 16a). Increasing the maximum plunger speed to 3 m/s led to the lowest number of pores present, which indicates more optimal conditions for defect reduction (Figure 16b). Upon subsequent increase in plunger speed to 3.6 m/s, a re-increase in the number and size of pores occurred (Figure 16c). This increase, however, was not as significant as in the case of castings with a higher tube, which indicates the influence of casting geometry on porosity formation. The maximum plunger speed of 4 m/s was characterized by the presence of pores mainly in the central area of the tube (Figure 16d).
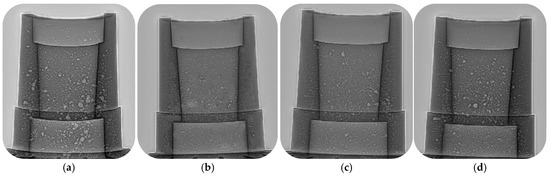
Figure 16.
X-ray of the tube part of GD 55 casting: (a) 2 m/s; (b) 3 m/s; (c) 3.6 m/s; (d) 4 m/s.
Table 5 provides a quantitative evaluation of macroporosity for GD 120 and GD 55 castings. As plunger speed increases, the average pore surface area and pore surface ratio first decrease significantly and then increase again for both casting types. The lowest porosity values were achieved at a speed of 3 m/s for both geometries. Although the mold fills faster at 3.6 and 4 m/s, turbulence causes air entrapment, leading to increased overall porosity. Conversely, slow filling at 2 m/s does not adequately vent gases, resulting in large defects. These quantitative results are consistent with our X-ray analysis observations and confirm their evaluation. Figure 17 illustrates the methodology for quantitatively evaluating macroporosity.
Table 5.
Quantitative evaluation of macroporosity in GD 120 and GD 55 castings.
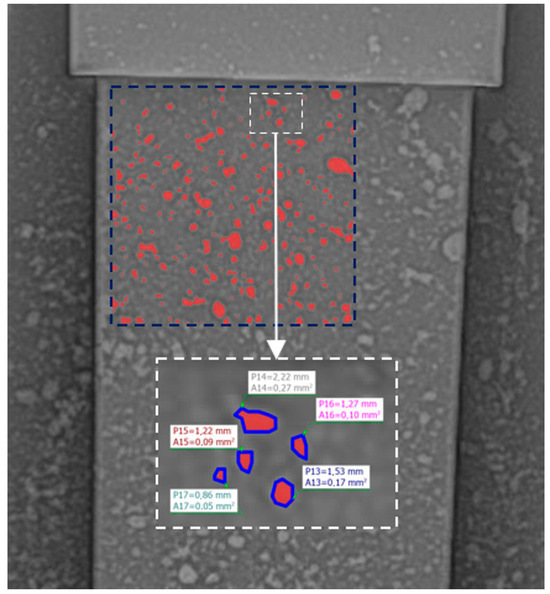
Figure 17.
Presentation of the quantitative evaluation of macroporosity methodology.
3.3.2. Microporosity Evaluation
Analysis of microporosity in the tube section of the castings was systematically examined on two different geometric variants depending on the plunger speed during high-pressure die casting. The measured values are recorded in Table 6.
Table 6.
Quantitative evaluation of microporosity in GD 120 casting.
On the lower part of the GD 120 casting tube, an average pore area of 126 µm2 and an average pore surface ratio of 1.56% were recorded at a low plunger speed of 2 m/s. Increasing the plunger speed to 3 m/s led to an increase in the average pore area to 279 µm2 and an average pore surface ratio to 3.3%. This increase indicates a potential connection between higher filling speed and the entrapment of gas bubbles into the melt, leading to the formation of larger pores. At a speed of 3.6 m/s, the average pore area increased to 277 µm2, although the pore surface ratio decreased to 2.1%. This phenomenon may indicate a change in the pore formation mechanism, probably due to turbulences or shear forces, which can lead to the fragmentation of larger pores into smaller ones. At the highest speed of 4 m/s, a decrease in the average pore area to 196 µm2 was again observed, with the lowest areal porosity of 0.9% for this type of casting, indicating the presence of a smaller number of pores and also a reduced amount of small shrinkages.
Similar trends were observed in the lower part of the tube of the GD 55 casting type. At a plunger speed of 2 m/s, the average pore area on the surface was 65 µm2 and the average pore surface ratio was 1.34%. An increase in plunger speed to 3 m/s, similar to the previous type, resulted in a significant increase in the average pore area to 269 µm2 and the pore surface ratio to 2.6%. At a speed of 3.6 m/s, there was a significant decrease in the average pore area to 121 µm2 and the pore surface ratio to 1.8%. The lowest values of average pore area (104 µm2) and pore surface ratio (0.57%) were found at a speed of 4 m/s for this specific casting. This consistency in trends between both types of castings underlines the universal influence of plunger speed on microporosity. A comparison of selected images with the highlighted pore area is shown in Figure 18.
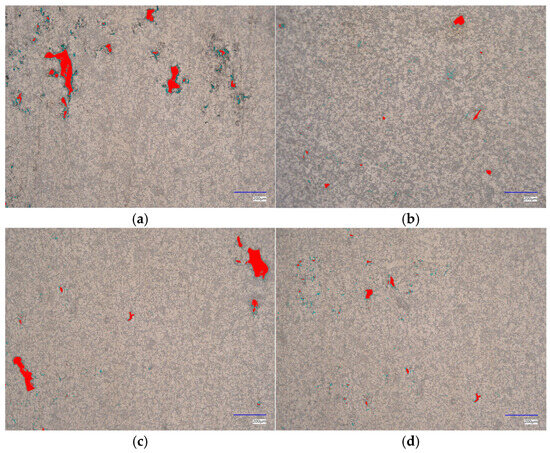
Figure 18.
Comparison of images with areal porosity evaluation: (a) GD 120 casting—3 m/s; (b) GD 120 casting—4 m/s; (c) GD 55 casting—3 m/s; (d) GD 55 casting—4 m/s.
4. Discussion
The results of the numerical analysis and experimental evaluation confirm that plunger speed during the second stage of mold filling significantly impacts melt flow and porosity and may affect the microstructure of AlSi9Cu3(Fe) alloy castings. With increasing plunger speed, a transition from predominantly laminar or transitional flow (2 and 3 m/s) to fully turbulent flow (3.6 and 4 m/s) occurs in the critical areas of the tube, which significantly affects the morphogenesis of microstructural components and the formation of defects.
In GD 120 castings (with a higher tube), the turbulent flow characteristics were more pronounced, which was reflected in greater variability in the morphology of eutectic silicon. At lower speeds (2 and 3 m/s), the microstructure was dominated by silicon lamellae arranged in fan-shaped structures with a distinct directional orientation, indicating gradual solidification at a moderate temperature gradient. With increasing speed (3.6 and 4 m/s), the lamellae became thinner and developed into elongated morphologies, while their number per unit area decreased. This development can be described as an accelerated solidification process and a change in the eutectic growth mechanism under the influence of faster cooling. Traditionally, this is attributed primarily to the influence of higher cooling rates, which are typical for high-pressure casting. However, the bifilm theory provides another convincing mechanism for this observation. Campbell’s work suggests that bifilms act as physical barriers within the melt, suppressing convection and isolating small areas of liquid. This isolation can lead to increased local undercooling, contributing to the observed grain refinement and reduction in DAS (Dendrite Arm Spacing), as well as overall microstructure refinement.
Jackson-Hunt theory predicts that with increasing growth rate, the interlaminar spacing decreases, which leads to lamella thinning. Limited diffusion of atoms in the transverse direction forces eutectic lamellae to grow along the solidification direction, with atoms arranging into thinner and longer bands [26]. This phenomenon is particularly pronounced in high-pressure die casting, where high filling speeds disrupt the stability of the temperature gradient and increase the cooling rate. The result is a significant refinement of the structure; coarse needles or lamellae of eutectic silicon transform into fine fibrous or granular formations, thereby improving the properties of the final casting [10,27,28].
In terms of macroporosity, evaluated by X-ray visualization, the most favorable results were recorded at a plunger speed of 3 m/s, followed by samples cast at 3.6 m/s. In both cases, only weakly contrasting point defects (pores) concentrated mainly in the central part of the tube were detected in the images. Such a configuration indicates that the melt at these speeds filled the mold uniformly, without significant stagnant zones and with sufficient venting. However, it is important to note that these results are dependent on the specific gating system studied.
Conversely, at the lowest speed of 2 m/s, voluminous cavities and more extensive macropore areas appeared, which is related to the low kinetic energy of the flow, slow mold filling, and insufficient discharge of entrapped gases. While this has traditionally been attributed to insufficient gas removal, modern knowledge suggests that the main cause is the trapping of oxide films in turbulent vortices that form in areas of slow flow. These films, known as bifilms, create ideal nucleation sites for pores that form in the early stages of solidification. On the other hand, at a speed of 4 m/s, although micropores were effectively suppressed, a re-increase in porosity was observed from the macroscopic integrity perspective. The extremely turbulent nature of the flow caused the entrainment of oxides and the ingestion of air into the melt, which manifested as scattered dark areas and bands of inhomogeneities in the evaluated parts of the castings. This observed porosity is consistent with the bifilm theory, which was described in detail by Prof. John Campbell [2,6]. According to this theory, the turbulence of the flowing metal causes the surface oxide films to be drawn into the melt and “folded,” causing them to “fold” and become trapped in the melt, and creating double layers called bifilms. These bifilms are not connected and form an internal air gap. The original hydrogen solution, which is always present in the melt, segregates in these gaps during solidification and causes them to grow, creating macropores and other defects. Therefore, pore formation is primarily associated with the presence and turbulent trapping of oxides, with soluble hydrogen serving as an expansion gas, but not as their main cause. A simulation of oxide formation visually confirmed this phenomenon. It showed that at a speed of 2 m/s, oxide formation in the tubular part of the casting occurs to a lesser extent. However, at 4 m/s, the oxide concentration increases significantly and penetrates deep into the casting volume. In addition, tertiary oxidation can occur during solidification. High metal flow velocity can cause “folding” of the liquid surface, which leads to air entrapment and entrainment of oxide films [29,30].
In the case of GD 55 castings (with a shorter tube), the same trend was observed, namely that the best macroporosity results were achieved at speeds of 3 and 3.6 m/s, while at 2 m/s, visible pores formed, especially in the lower parts. However, the difference was the smaller absolute pore size, which can be attributed to the lower melt volume and faster cooling in the case of the shorter tube geometry. In this case, the smaller metal volume favorably suppresses extensive zones with incomplete filling. More intense melt flow at higher speeds also helps suppress the formation of large gas inclusions, which can be trapped in closed parts of the mold at lower speeds. The transitional flow regime plays a key role in mitigating large gas inclusions. Slightly turbulent conditions, referred to as the transitional regime (in the range of 3 to 3.6 m/s), proved optimal for “breaking down” larger gas bubbles into smaller and uniformly dispersed pores. These smaller pores have a significantly lower negative impact on the mechanical properties of the casting [31]. Conversely, exceeding a certain turbulence threshold (in our case 4 m/s) leads to a significant increase in the risk of oxide inclusions, which is confirmed by study [32].
From the perspective of microporosity, the formation of shrinkage pores plays a significant role in the analyzed castings, resulting from local volume loss during melt solidification. The lowest occurrence of these shrinkages was recorded at a plunger speed of 4 m/s, where rapid mold filling in combination with a short solidification time contributed to reducing temperature gradients and limiting the separation of structural components. Under these conditions, more compact and homogeneously solidifying zones were created, which led to a significant suppression of volumetric defects due to metal contraction.
When comparing the results of GD 120 and GD 55 castings, it is clear that the different mold geometry, length, and volume of the tube part have a significant impact on the flow regime, cooling, and subsequently on the final quality. GD 120 exhibits higher thermal inertia, which leads to more complex solidification dynamics, and thus a greater range of microstructure change and higher sensitivity to filling speed.
5. Conclusions
Based on the microstructural analysis, porosity evaluation, and numerical simulation of melt flow during high-pressure die casting of AlSi9Cu3(Fe) alloy, the following conclusions can be drawn:
- Plunger speed has a decisive influence on casting quality. The results showed that with increasing speed from 2 m/s to 4 m/s, there is a transition from transitional to laminar flow to fully turbulent flow, which fundamentally affects the homogeneity of the alloy in the mold and its solidification process.
- The microstructure of eutectic silicon reacts to flow dynamics. At lower speeds, lamellae were observed. With increasing speed, the lamellae thinned and grew into elongated morphologies, which is related to the altered temperature field, faster solidification, and local undercooling caused by bifilms, which suppress convection and thus contribute to the overall refinement of the grain.
- GD 120 casting exhibits higher thermal inertia and higher sensitivity to changes in plunger speed. Conversely, in GD 55, due to faster cooling, no significant change in microstructure was observed depending on the filling speed.
- Analysis of the porosity of the casting showed that the most favorable results were achieved at a piston speed of 3 m/s, followed by samples cast at 3.6 m/s. At these speeds, optimal mold filling with effective venting was achieved. However, higher speeds led to a significant increase in defects due to turbulence, which carried surface oxides-bifilms into the melt. These bifilms serve as the primary sites of pore nucleation, while dissolved hydrogen serves as the gas for their expansion during solidification.
- The presence of intermetallic phases was consistent in all samples. Identified phases of type α-Al(Fe,Mn,Cr)Si and Al7Cu2Fe differed in morphology depending on the sampling location and filling speed. Compact αAl phases are less harmful, but the occurrence of lamellar Al7Cu2Fe can adversely affect casting strength.
The optimal plunger speed range is between 3 and 3.6 m/s for the specific casting geometry and gating system studied. This interval ensures a compromise between casting quality, namely microstructure stability and porosity minimization, without a significant increase in turbulent defects. However, the specific casting geometry and its thermal properties need to be taken into account. A combination of experimental and numerical approaches is essential for effective HPDC process optimization.
Author Contributions
Conceptualization, M.M., D.B. and R.P. (Richard Pastirčák); methodology, M.M. and D.B.; software, M.M. and R.P. (Richard Pastirčák); validation, D.B. and R.P. (Radka Podprocká); formal analysis, M.M. and R.P. (Richard Pastirčák); investigation, M.M. and R.P. (Radka Podprocká); resources, D.B. and R.P. (Radka Podprocká); data curation, M.M. and R.P. (Richard Pastirčák); writing—original draft preparation, M.M. and R.P. (Radka Podprocká); writing—review and editing, M.M., D.B., R.P. (Radka Podprocká) and R.P. (Richard Pastirčák); visualization, M.M. and R.P. (Richard Pastirčák); supervision, D.B. and R.P. (Radka Podprocká); project administration, M.M. and D.B.; funding acquisition, D.B. All authors have read and agreed to the published version of the manuscript.
Funding
The article was created as part of the VEGA grant agency project: VEGA 1/0160/22 and funded by the EU NextGenerationEU through the Recovery and Resilience Plan for Slovakia under the project No. 09I03-03-V05-00002. The authors thank for its support.
Data Availability Statement
The original contributions presented in this study are included in the article. Further inquiries can be directed to the corresponding author.
Conflicts of Interest
The authors declare no conflicts of interest.
References
- Matejka, M.; Bolibruchová, D.; Podprocká, R. The Influence of Returnable Material on Internal Homogeneity of the High-Pressure Die-Cast AlSi9Cu3(Fe) Alloy. Metals 2021, 11, 1084. [Google Scholar] [CrossRef]
- Campbell, J. Complete Casting Handbook, 2nd ed.; Butterworth-Heinemann: Oxford, UK, 2015; p. 639. ISBN 9780444635099. [Google Scholar] [CrossRef]
- Majernikova, M.; Majernik, J.; Podaril, M.; Sramhauser, K. Methodology Assessment of The Gating System Numerical Design of High-Pressure Die Casting with Regard to the Material Applicability. MM Sci. J. 2024, 8036. [Google Scholar] [CrossRef]
- Ragan, E. Die Casting of Metals; FMT TUKE: Presov, Slovakia, 2007; 383p, ISBN 978-80-8073-979-9. (In Slovak) [Google Scholar]
- Sigworth, G.K.; Williams, E.M.; Chesonis, D.C. Gas Fluxing of Molten Aluminum: An Overview. In Essential Readings in Light Metals; Springer: Cham, Switzerland, 2016; pp. 65–70. [Google Scholar] [CrossRef]
- Campbell, J. An overview of the effects of bifilms on the structure and properties of cast alloys. Metall. Mater. Trans. B 2006, 37, 857–863. [Google Scholar] [CrossRef]
- Campbell, J. A Personal View of Microstructure and Properties of Al Alloys. Materials 2021, 14, 1297. [Google Scholar] [CrossRef]
- Cao, H.; Shen, C.; Wang, C.; Xu, H.; Zhu, J. Direct Observation of Filling Process and Porosity Prediction in High Pressure Die Casting. Materials 2019, 12, 1099. [Google Scholar] [CrossRef]
- Ansari, S.; Bayans, M.; Rasimarzabadi, F.; Nobes, D. Flow visualization of the Newtonian and non-Newtonian behavior of fluids in a Tesla-diode valve. In Proceedings of the 5th International Conference on Experimental Fluid Mechanics ICEFM 2018 MunichAt, Munich, Germany, 2–4 July 2018. [Google Scholar]
- Adamane, A.R.; Arnberg, L.; Fiorese, E.; Timelli, G.; Bonollo, F. Influence of injection parameters on the porosity and tensile properties of high-pressure die cast Al-Si alloys: A review. Int. J. Metalcast. 2015, 9, 43–53. [Google Scholar] [CrossRef]
- Kumar, K.S.; Sawale, J.K.; Rao, S. Study of effect of process parameter setting on porosity levels of aluminium pressure die casting process using Taguchi Methodology. J. Mech. Civ. Eng. 2013, 9, 12–17. [Google Scholar] [CrossRef]
- Lin, C.F.; Kao, C.Y.; Chen, C.M.; Saputro, I.E.; Mardiono, I.; Ho, M.-H.; Huang, C.-F.; Lee, S.-C.; Fuh, Y.-K. Experimental and Numerical Investigation of Porosity Characteristics on the Variability in Mechanical Properties of High-Pressure Die Casting (HPDC) AlSi12MgMn Alloys of the Cover Plate of Hydraulic System. Int. J. Metalcast. 2025. [Google Scholar] [CrossRef]
- Zhang, Y.; Lordan, E.; Dou, K.; Wang, S.; Fan, Z. Influence of porosity characteristics on the variability in mechanical properties of high pressure die casting (HPDC) AlSi7MgMn alloys. J. Manuf. Process. 2020, 56, 500–509. [Google Scholar] [CrossRef]
- Cao, L.; Liao, D.; Sun, F.; Chen, T.; Teng, Z.; Tang, Y. Prediction of gas entrapment defects during zinc alloy high-pressure die casting based on gas-liquid multiphase flow model. J. Adv. Manuf. Technol. 2018, 94, 807–815. [Google Scholar] [CrossRef]
- Yang, J.; Liu, B.; Shu, D.; Li, H.; Yang, Q.; Hu, T.; Wang, Z.; Zeng, Y.; Haung, J.; Tang, X.; et al. Effect of Casting Pressure on Porosity, Microstructure, and Mechanical Properties of Large Die Casting Aluminum Alloy Parts. J. Metalcast. 2025. [Google Scholar] [CrossRef]
- Wang, T.; Huang, J.; Fu, H.; Yu, K.; Yao, S. Influence of Process Parameters on Filling and Feeding Capacity during High-Pressure Die-Casting Process. Appl. Sci. 2022, 12, 4757. [Google Scholar] [CrossRef]
- Govindarao, R.; Eshwara, K.; Srinivasa Rao, P. Defect analysis and remedies in the high pressure diecasting process with ADC-12 alloy. Am. J. Multidiscip. Res. Dev. 2025, 4, 1–8. [Google Scholar]
- Ramnath, V.; Elanchezhian, C.; Chandrasekhar, V.; Kumar, A.; Asif, S.; Mohamed, G.; Raj, D.; Kumar, C. Analysis and Optimization of Gating System for Commutator End Bracket. Procedia Mater. Sci. 2014, 6, 1312–1328. [Google Scholar] [CrossRef][Green Version]
- Easton, M.; StJohn, D.H. Improved prediction of the grain size of aluminum alloys that includes the effect of cooling rate. Mater. Sci. Eng. A 2008, 486, 8–13. [Google Scholar] [CrossRef]
- Wang, Y.; Gao, M.; Yang, B.; Bai, J.; Guan, R. A Calculation Model for Cooling Rate of Aluminum Alloy Melts during Continuous Rheo-Extrusion. Materials 2021, 14, 5684. [Google Scholar] [CrossRef] [PubMed]
- Li, H.; Zhang, H.; Peng, W.; Lin, B.; Shao, Y.; Lin, L.; Fu, B.; Yu, Z. The Effect of Process Parameters on the Properties and Microstructure of A380 Aluminum Alloy Casting with Different Wall Thicknesses. Crystals 2023, 13, 587. [Google Scholar] [CrossRef]
- Fiorese, E.; Bonollo, F.; Battaglia, E. A Tool for Predicting the Effect of the Plunger Motion Profile on the Static Properties of Aluminium High Pressure Die Cast Components. Metals 2018, 8, 798. [Google Scholar] [CrossRef]
- Kowalczyk, W.; Dańko, R.; Górny, M.; Kawalec, M.; Burbelko, A. Influence of High-Pressure Die Casting Parameters on the Cooling Rate and the Structure of EN-AC 46000 Alloy. Materials 2022, 15, 5702. [Google Scholar] [CrossRef]
- Xin, L.; Wang, G.; Qing, J. Understanding the intrinsic framework of the Hall-Petch relationship of metals from the view of the electronic-structure level. Acta Mater. 2025, 292, 121071. [Google Scholar] [CrossRef]
- de Gouveia, G.L.; Kakitani, R.; Gomes, L.F.; Afonso, C.R.M.; Cheung, N.; Spinelli, J.E. Slow and rapid cooling of Al–Cu–Si ultrafine eutectic composites: Interplay of cooling rate and microstructure in mechanical properties. J. Mater. Res. 2019, 34, 1381–1394. [Google Scholar] [CrossRef]
- Xiao, J.; Li, X. Asymptotic Solutions of Steady Lamellar Eutectic Growth in Directional Solidification for Small Tangent Values of the Contact Angles. Crystals 2024, 14, 93. [Google Scholar] [CrossRef]
- Risse, J.H.; Trempa, M.; Huber, F.; Höppel, H.W.; Bartels, D.; Schmidt, M.; Reimann, C.; Friedrich, J. Microstructure and Mechanical Properties of Hypereutectic Al-High Si Alloys up to 70 wt.% Si-Content Produced from Pre-Alloyed and Blended Powder via Laser Powder Bed Fusion. Materials 2023, 16, 657. [Google Scholar] [CrossRef] [PubMed]
- Luna, A.I.; Castro-Roman, M.; Escobedo-Bocardo, J.C.; Garcia-Pastor, F.; Herrera-Trejo, M. Effect of cooling rate and Mg content on the Al–Si eutectic for Al–Si–Cu–Mg alloys. Mater. Charact. 2014, 95, 211–218. [Google Scholar] [CrossRef]
- Laukli, H.I. High Pressure Die Casting of Aluminium and Magnesium Alloys—Grain Structure and Segregation Characteristics. Ph.D. Thesis, Norwegian University of Science and Technolog, Trondheim, Norway, 2004. [Google Scholar]
- Brůna, M.; Galcik, M.; Pastircak, R.; Kantorikova, E. Effect of Gating System Design on the Quality of Aluminum Alloy Castings. Metals 2024, 14, 312. [Google Scholar] [CrossRef]
- Pradhan, A.R.; Pattnaik, S.; Sutar, M.K. Defects caused by air bubbles during casting filling process: A review. Int. J. Manag. Tech. Eng. 2018, 8, 1–5. [Google Scholar]
- Bate, C.; King, P.; Sim, J.; Manogharan, G. A Novel Approach to Visualize Liquid Aluminum Flow to Advance Casting Science. Materials 2023, 16, 756. [Google Scholar] [CrossRef] [PubMed]
Disclaimer/Publisher’s Note: The statements, opinions and data contained in all publications are solely those of the individual author(s) and contributor(s) and not of MDPI and/or the editor(s). MDPI and/or the editor(s) disclaim responsibility for any injury to people or property resulting from any ideas, methods, instructions or products referred to in the content. |
© 2025 by the authors. Licensee MDPI, Basel, Switzerland. This article is an open access article distributed under the terms and conditions of the Creative Commons Attribution (CC BY) license (https://creativecommons.org/licenses/by/4.0/).