Article

Preparation of a Porous Tri-n-decylamine Modified Adsorbent for the Efficient Removal of Uranium and Iron from Rare Earth

1
School of Nuclear Science and Technology, University of South China, 28 Changsheng West Road, Hengyang 421001, China
2
Key Laboratory of Advanced Nuclear Energy Design and Safety, Ministry of Education, University of South China, 28 Changsheng West Road, Hengyang 421001, China
3
Institute of Nuclear Energy Safety Technology, Hefei Institutes of Physical Science, Chinese Academy of Sciences, Hefei 230031, China
*
Authors to whom correspondence should be addressed.
Metals 2025, 15(10), 1064; https://doi.org/10.3390/met15101064
Submission received: 22 July 2025 / Revised: 10 September 2025 / Accepted: 13 September 2025 / Published: 23 September 2025

Abstract

The presence of impurities Fe and trace radioactive U in rare earth elements (REEs) may lead to a significant decline in the performance of high-purity rare earth products. For deep removal from REEs in a green and efficient way, an amine-functionalized silica-based adsorbent, TNDA/SiO2-P, was prepared by a simple vacuum impregnation method, which had a high organic loading rate of 31.2 wt.%. The experimental results showed that it exhibited good adsorption selectivity for uranium and iron, with separation factors SFU/REE = 20147 and SFFe/REE = 88128 in 5 M HCl. The adsorption kinetics was fast, with equilibrium obtained in 120 min. The 0.1 M HCl can desorb U and Fe efficiently. The deep removal of U and Fe from REEs including Sc can be achieved through chromatographic column separation with high enrichment. FT-IR, XPS and DFT calculations mutually confirmed that protonated TNDA/SiO2-P exhibited a selective mechanism for uranium and iron in complex anion species in the hydrochloric acid system. This demonstrates its potential for efficiently removing trace impurities U and Fe from REEs.

Graphical Abstract

1. Introduction

Rare earth elements (REEs) are known as ‘industrial gold’. With the development of science and technology [1], REEs play an important role in various fields [2,3], including the new energy, information technology, aerospace, solid oxide fuel cells, and defense industries [4]. REEs are commonly used as doping elements to improve the strength, toughness, corrosion resistance, and other properties of materials [5]. REE minerals such as monazite, cerium fluorocarbon, yttrium phosphorite, and ion-adsorbed clay deposits usually associate with radioactive uranium (U) [5]. The radioactive nuclides and their decay daughters can cause REE products to carry slight radiation, which may change material parameters, affecting the performance and, in severe cases, causing product failure [6]. For example, Fe and other impurities in REEs may increase the leakage current when used in chip and color the glass, thus affecting the lithography performance, so deep removal of these impurity metals from REEs is also necessary, especially in high technology fields [7,8].
The solvent extraction method is the most widely used method in the production of RE2O3, with a purity of less than 5 N, due to its advantages of simple instrument and equipment, easy remote automatic control, and suitability for large-scale production. Typically, achieving an optimal extraction rate necessitates a relatively prolonged extraction time—ranging from several hours to even tens of hours—and the use of substantial amounts of solvent. While organic solvents effectively extract target components, they also tend to extract numerous impurities. This complicates the subsequent separation and purification processes, thereby increasing the costs and overall complexity. Moreover, most organic solvents employed in these extractions are toxic (such as methanol, chloroform, and benzene) or pose challenges for complete removal. If the subsequent purification process is not executed flawlessly, there is a risk of solvent residue remaining in the final product. However, chromatographic separation based on adsorption is a good option for the further removal of trace impurities in the product due to its high efficiency in a single column. At present, a large number of adsorbents have been designed and prepared, including modified zeolites [9], polymer materials [10], and carbon-based materials [11], for the adsorption and separation of Fe or U from rare earth. The functional materials modified by these functional groups such as phosphate groups [12], sulfonate groups [13], and amidoxime groups [14] have good affinity for Fe or U. Most of the aforementioned materials are capable of removing uranium or iron only under relatively low-acidity conditions. They lose adsorption capacity in high-acidity environments, where the acidity typically exceeds 1 M following the dissolution of rare earth oxides. Additionally, the presence of numerous components and elements including REEs significantly increases the challenge in separating U and Fe from them [15]. In contrast, recent advances in organic–inorganic composite materials have garnered significant attention due to their synergistic combination of efficient extraction from organic ligands and robust structural stability from inorganic matrices. By immobilizing extractants within stable inorganic frameworks such as porous silica [16], these composites achieve both high extraction efficiency and enhanced durability, making them promising candidates for separation applications [6].
In this study, a composite silica-based adsorbent was prepared by loading TNDA (tri-n-decylamine) into SiO2-P carrier for the deep separation of U and Fe in REEs. The as-prepared TNDA/SiO2-P was characterized by the SEM–EDS, BET, TG-DSC and FT-IR techniques to obtain its micromorphology, main structure parameters, organic ligand content and functional group information. The adsorption and desorption performance of the adsorbent for Fe and U was investigated by batch experiments, and the experimental data were fitted by kinetic models and isothermal models. The separation and reusability performance of TNDA/SiO2-P for the selective separation of Fe and U in REEs was studied by continuous column experiments. Finally, the changes in functional groups and chemical states of the adsorbent before and after adsorption of Fe and U were studied by the FT-IR, XPS and DFT calculation techniques, revealing the adsorption mechanism involved in the adsorption process.

2. Experimental

2.1. Materials and Reagents

Tri-n-decylamine (TNDA, C30H63N, 97%), uranyl nitrate hexahydrate (UO2(NO3)2·6H2O, 99%), iron nitrate nonahydrate (Fe(NO3)3·9H2O, 98.5%), REE(NO3)3·nH2O (REEs = Sc, Y, La, Ce, Pr, Nd, Sm, Eu, Gd, Tb, Dy, Ho, Er, Tm, Yb and Lu, 99%, n = 5 or 6), hydrochloric acid (HCl, AR), sulfuric acid (H2SO4, AR) and nitric acid (HNO3, AR) were purchased from Sinopharm Chemical Reagent Co., Ltd., Shanghai, China. Acetophenone (AcPh, AR ≥ 98%), diethyl phthalate (DEP, AR, 99.5%), styrene (St, AR, with 15 ppm tertbutyl-catechol), α,α’-azobisisobutyroni-trile (AIBN, 98%), methanol (MeOH, AR, 98%), divinylbenzene (DVB, 55%, with 1000 ppm tertbutyl-catechol) and dichloromethane (DCM, AR, 99.5%) were purchased from Macklin Biochemical Co., Ltd., Shanghai, China. All solutions used were prepared with ultrapure water, which had an electrical resistance greater than 18 MΩ·cm.

2.2. Preparation and Characterization of TNDA/SiO2-P

SiO2-P was synthesized through in situ polymerization of styrene and divinylbenzene into the inside of porous SiO2 particles with an average size of 75–150 μm, where ‘P’ was referred to as the copolymer of styrene divinylbenzene. The details of the synthesis conditions can be found in our previous work [17]. The adsorbent, TNDA/SiO2-P, was prepared by impregnating TNDA into the inside channels of SiO2-P, which is schematically shown in Figure 1. An amount of 5 g of TNDA was dissolved in CH2Cl2 and mixed with 10 g of SiO2-P in a round-bottom flask. Subsequently, the flask was mounted in a rotary evaporator and rotated at a constant speed (80 rpm) for 1.5 h at 298 K. The flask was then heated to 313 K in a water bath. Finally, the CH2Cl2 was removed by slow depressurization in the rotary evaporator and dried under vacuum conditions at 313 K for 12 h. Then, the adsorbent TNDA/SiO2-P was obtained [17].
The as-prepared TNDA/SiO2-P was analyzed using different characterization techniques. SEM–EDS (JSM-IT500LV, JEOL, Tokyo, Japan) was used to obtain the micromorphology and element constituent of the material. TG-DSC (NETZSCH STA 449F3, NETZSCH, Selb, Germany) was used to analyze the organic content of the adsorbent in a oxygen atmosphere. The specific surface area and pore size distribution were obtained through N2 adsorption–desorption isotherms using BET analysis (TriStar II 3020, micromeritics, Norcross, GA, USA). To conduct FT-IR analysis, the adsorbent was mixed thoroughly with KBr at a ratio of 1:100, followed by grinding and pressing using an infrared tablet press (IR-tracer 100, SHIMADZU, Kyoto, Japan). The adsorbent was further analyzed via X-ray photoelectron spectroscopy (XPS) (Thermo ESCALAB 250XI+ Waltham, MA, USA), which is equipped with a monochromatic Al Kα source operating at 15 kV. Both full spectra of the adsorbent and fine spectra of key elements were obtained. The binding energy for C 1s was adjusted to 284.8 eV, and the results were analyzed using Vantage 5.9 software. A pH meter fitted with a LE438 pH electrode (Mettler-Toledo, Shanghai, China) was used to measure the solution acidity.

2.3. Batch Experiments

An amount of 0.025 g of dried TNDA/SiO2-P adsorbent was mixed with 5 mL of feed solution in a glass vial with a lid and then placed in a shaker for a period of time with up-and-down oscillation. After that, we removed it to test the adsorption effect of the adsorbent. All suspensions were then separated by syringe. The metal ion concentrations in the aqueous phase were measured by ICP-OES (ICP-OES, Ultima Expert, HORIBA, Kyoto, Japan). The adsorption amount Q (mg/g), adsorption (or removal) efficiency E (%), distribution coefficient Kd (mL/g), separation factor SF, desorption amount Qd (mg/g), and desorption efficiency Ed (%) can be derived from Equations (1)–(6) [18].
Q = (C0C)/m × V × 100%
E = (C0C)/C0 × 100%
Kd = (C0C)/C × V/m
SFA/B = Kd A/Kd B
Q d = C d   ×   V m
Ed = Qd/Q × 100%
BV = π × (d/2)2 × H
where C0 (mg/L), Ce (mg/L) and Cd (mg/L) denote the initial, equilibrium and desorption concentrations of U and Fe, respectively; V (mL) represents the volume of the working solution; m (g) is the mass of TNDA/SiO2-P; and A and B correspond to distinct metal elements.
The kinetics and isotherms of the adsorbent were investigated by varying the adsorption time and the initial concentration of ions, and the experimental data were fitted with pseudo-first-order (Equation (S1)) and pseudo-second-order (Equation (S2)) kinetics and intraparticle diffusion models (Equation (S3)); the Langmuir (Equation (S4)), the Freundlich (Equation (S5)) [18] and Van’t Hoff equations (Equations (S6) and (S7)) [2]; the Redlich–Peterson model Equation (S8), the Dubinin–Radushkevich model Equation (S9) and the Temkin model Equation (S10).

2.4. Column Experiment

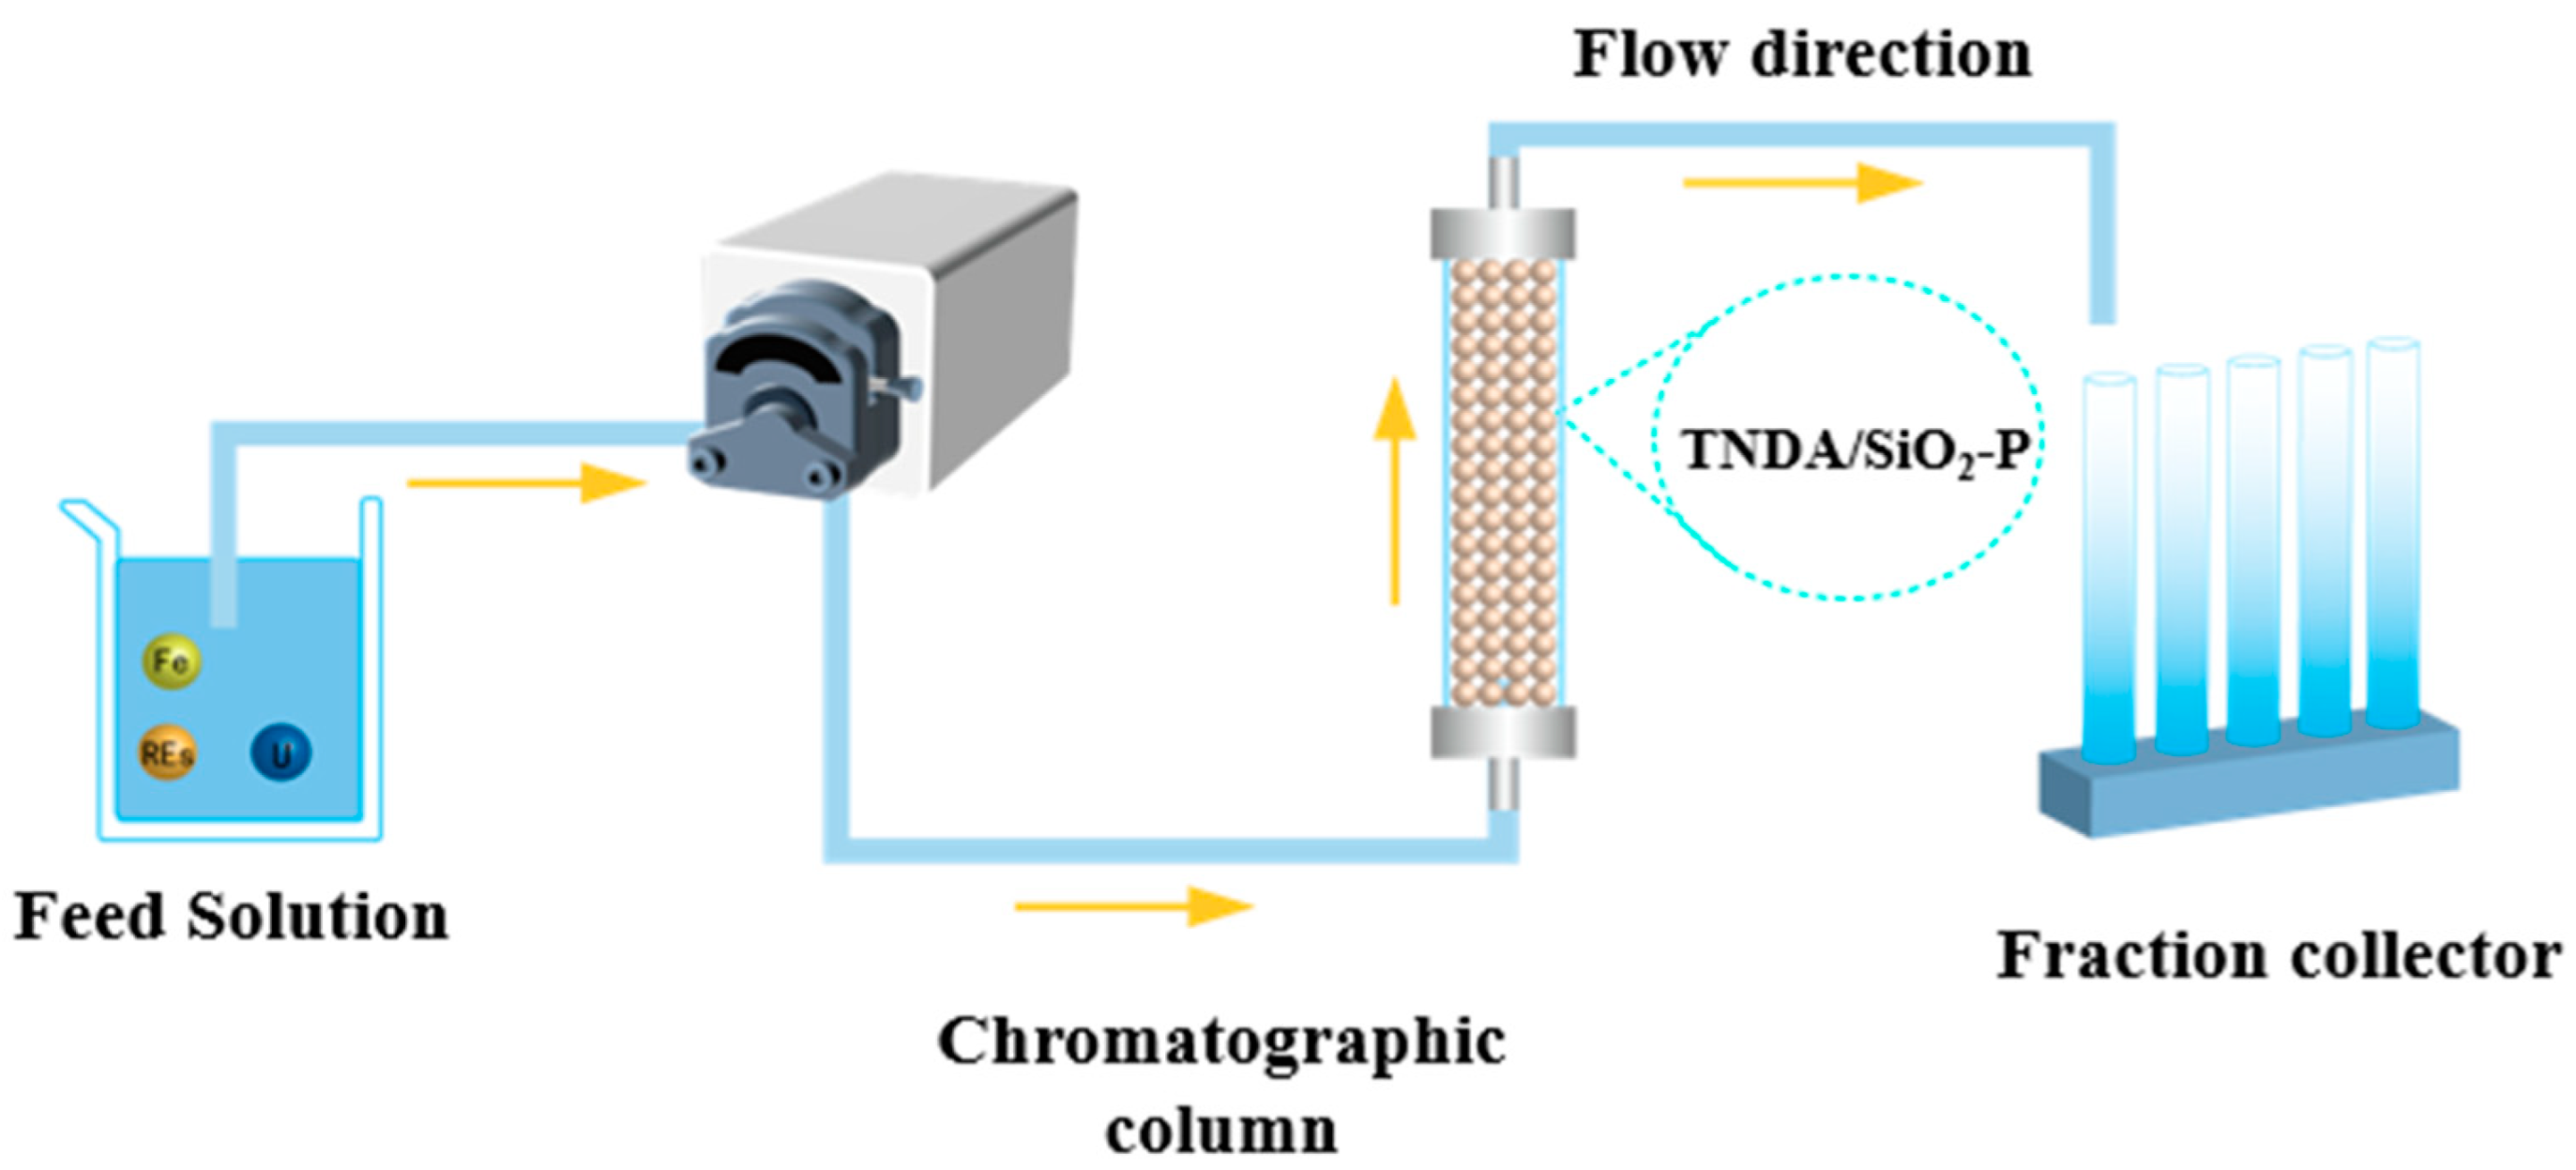
The dynamic adsorption and separation behavior of U and Fe from REEs in a 5 M HCl solution were studied by column chromatographic separation. Amounts of 1.0 g of TNDA/SiO2-P and 6.0 g of porous SiO2 were weighed, mixed and packed into a column (ϕ × h = 1 cm × 30 cm). The column was first pre-equilibrated with the same medium of feed solution without metal ions. Then, a peristaltic pump (EYELA MP 2000, EYELA, Tokyo, Japan) was used to pump the feed solution into the column at a flow rate of 10 BV/h. BV: Bed Volume, as shown in Equation (7). The effluent was collected by a fraction collector (EYELA DC 1500 C, EYELA, Tokyo, Japan). A diagram of the column separation system is shown in Figure 2, where d is the diameter of the packed column and H is the height of the packed adsorbent.

2.5. DFT Calculation

To study the adsorption mechanism, the Gaussian 16 program was used for density functional theory (DFT) calculation [19]. For TNDA, the B3LYP-D3/6-311G*(d) level was used for structure optimization and frequency calculation. For the complexes, B3LYP-D3/6-311G*(d)/SDD level was used for frequency calculation. Natural population analysis (NPA) was performed to determine the charge distributions.

3. Results and Discussion

3.1. Characterization of SiO2, SiO2-P and TNDA/SiO2-P

Figure 3a shows the SEM–EDS characterization results of the carrier particles and the prepared adsorbent. All the samples show good spherical particle morphology with an average particle size of approximately 85 um, indicating that the carrier remains in its initial spherical structure and has good mechanical stability during the modification process. In addition, the cross sections of SiO2-P, TNDA/SiO2-P and TNDA/SiO2-P loaded with U and Fe were scanned by EDS. The even distribution of C (carbon) indicates that styrene and divinylbenzene are effectively copolymerized in the SiO2 internal channels. N (nitrogen) is observed in TNDA/SiO2-P, indicating that TNDA is effectively impregnated into SiO2-P. In addition, the presence of U or Fe in TNDA/SiO2-P loaded with U or Fe implies that U or Fe is effectively adsorbed.
Figure 3b shows the results of the N2 adsorption–desorption isotherm. The N2 adsorption isotherms of SiO2-P and TNDA/SiO2-P exhibit a notable increase at relative pressures (P/P0) of 0.9–1.0. After TNDA was loaded onto SiO2-P, the resulting TNDA/SiO2-P demonstrates a significant reduction in N2 adsorption capacity, attributable to the partial pore occupied by TNDA in the SiO2-P carrier. Both SiO2-P and TNDA/SiO2-P display type IV isotherms, as evidenced by their narrow hysteresis loops, confirming the presence of mesoporous structures in these materials [20]. The results of specific surface area, pore volume and pore size distribution are shown in Figure 3c and Table S1. The main pore diameters of SiO2-P and TNDA/SiO2-P are between 10 and 90 nm. After loading TNDA, the specific surface area, pore volume and average pore diameter decrease from 94.6 m2/g, 0.74 mL/g and 49.7 nm to 15.625 m2/g, 0.124 mL/g and 23.22 nm, respectively. The above results confirmed that TNDA is successfully loaded onto the interior of SiO2-P. The prepared adsorbent has mesoporous and porous structures.
The mass analysis results in Figure 3d,e indicate that SiO2-P contains 15.6 wt.% copolymer (‘P’) and 84.4 wt.% SiO2, whereas the adsorbent (TNDA/SiO2-P) consists of 46.8 wt.% organic content (primarily TNDA and copolymer) and 53.2 wt.% SiO2. Given that the relative ratios of ‘P’ and SiO2 remain consistent in both SiO2-P and TNDA/SiO2-P, the calculated TNDA content in TNDA/SiO2-P is 31.2 wt.%, which closely matches the theoretical value of 33 wt.%.

3.2. Effect of Acid Medium and Concentration

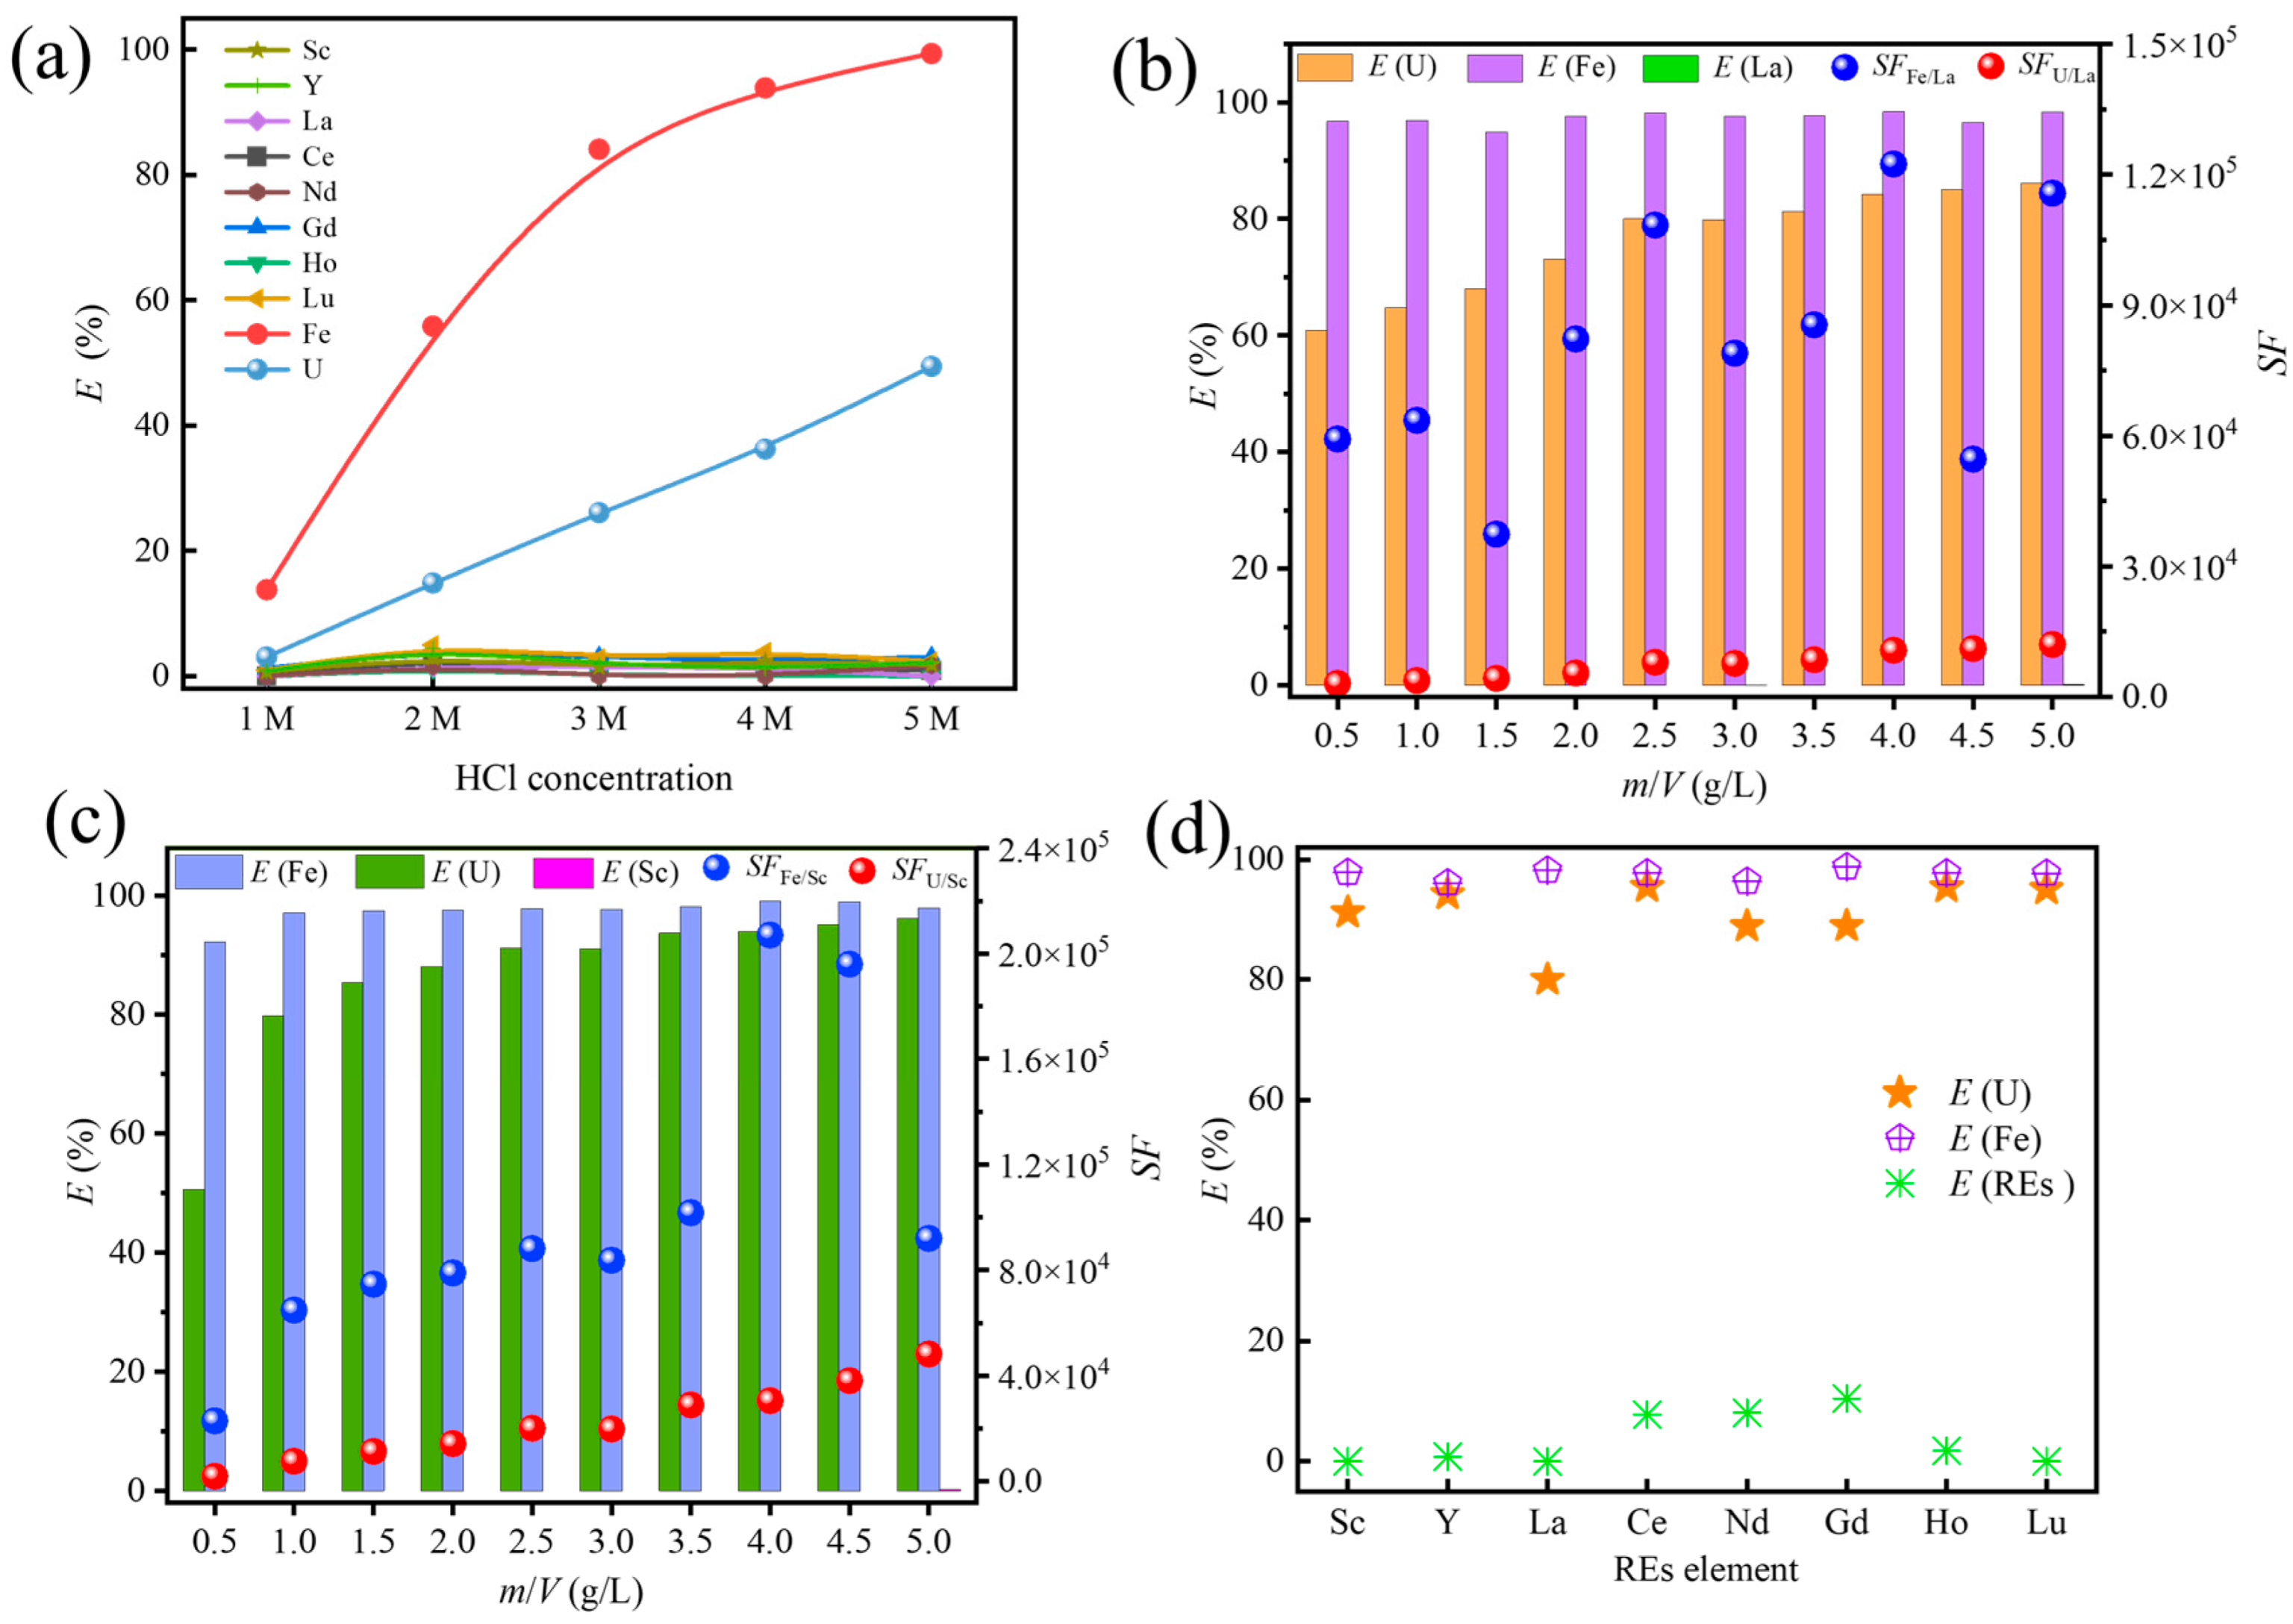
Hydrochloric acid, sulfuric acid, and nitric acid are three common acidic mediums used for metal ion separation and purification. Firstly, the effects of HCl, HNO3 and H2SO4 concentration on the adsorption and selectivity of TNDA/SiO2-P were studied. According to Figure 4a, in the HCl medium with the acidity change from 1 M to 5 M, TNDA/SiO2-P shows almost no adsorption towards REEs, such as Sc, Y, La, Ce, Nd, Gd, Ho, and Lu, which includes typical light, medium, and heavy REEs. While in the case of Fe and U, the adsorption efficiencies of U(VI) and Fe(III) by TNDA/SiO2-P increases with HCl concentration, reaching 49.4% and 99.3% for U(VI) and Fe(III) in a 5 M HCl solution, respectively. It exhibits excellent adsorption selectivity towards Fe and U with SFFe/REE = 88128 and SFU/REE = 20147. This phenomenon occurs because uranium and iron exist as anionic species such as UO2Cl3 and FeCl4 in the highly concentrated hydrochloric acid system [21], while TNDA becomes positively charged through protonation under highly acidic conditions [22], enabling it to form complexes with the uranium- or iron-derived anionic species.
The effects of HNO3 and H2SO4 concentration on the adsorption and selectivity of TNDA/SiO2-P are shown in Figure S1a,b, where TNDA/SiO2-P exhibits almost no or very poor adsorption towards the studied REEs, including Sc, Y, La, Ce, Nd, Gd, Ho, Lu, and impurity elements U and Fe. So a hydrochloric acid medium, particularly 5 M HCl, was chosen in the following research for the removal of U and Fe from REEs.

3.3. Effect of the Solid–Liquid Ratio

To improve the remove efficiency, the effect of the solid–liquid ratio on the removal efficiencies of U and Fe from La and Sc was studied, with the results shown in Figure 4b,c. The figure shows almost no adsorption towards La and Sc as the solid–liquid ratio increases. The removal efficiency of Fe(III) stays at a high level of over 97% and 98% in the experimental ratio range of 0.5–5 g/L. And the removal efficiency for U(VI) increases with the ratio and reaches 80% and 91% in the cases of La and Sc at a ratio ≥ 2.5 g/L. When the solid–liquid ratio is 2.5 g/L, the separation factors (SF) of U and Fe over Sc and La reach 20,147 and 88,128 in the Sc system and 7942 and 108,405 in the La system.
Moreover, the removal performance of U and Fe from typical REEs by TNDA/SiO2-P was studied at a solid–liquid ratio of 2.5 g/L, and is shown in Figure 4d. There was excellent selectivity towards U and Fe with removal rates over 80% and almost no adsorption towards REEs, including Y, Ce, Nd, Gd, Ho, and Lu. The above results indicate that TNDA/SiO2-P is a very promising material for efficient deep removal of the impurities U and Fe from REEs.

3.4. Adsorption Kinetics Towards U and Fe

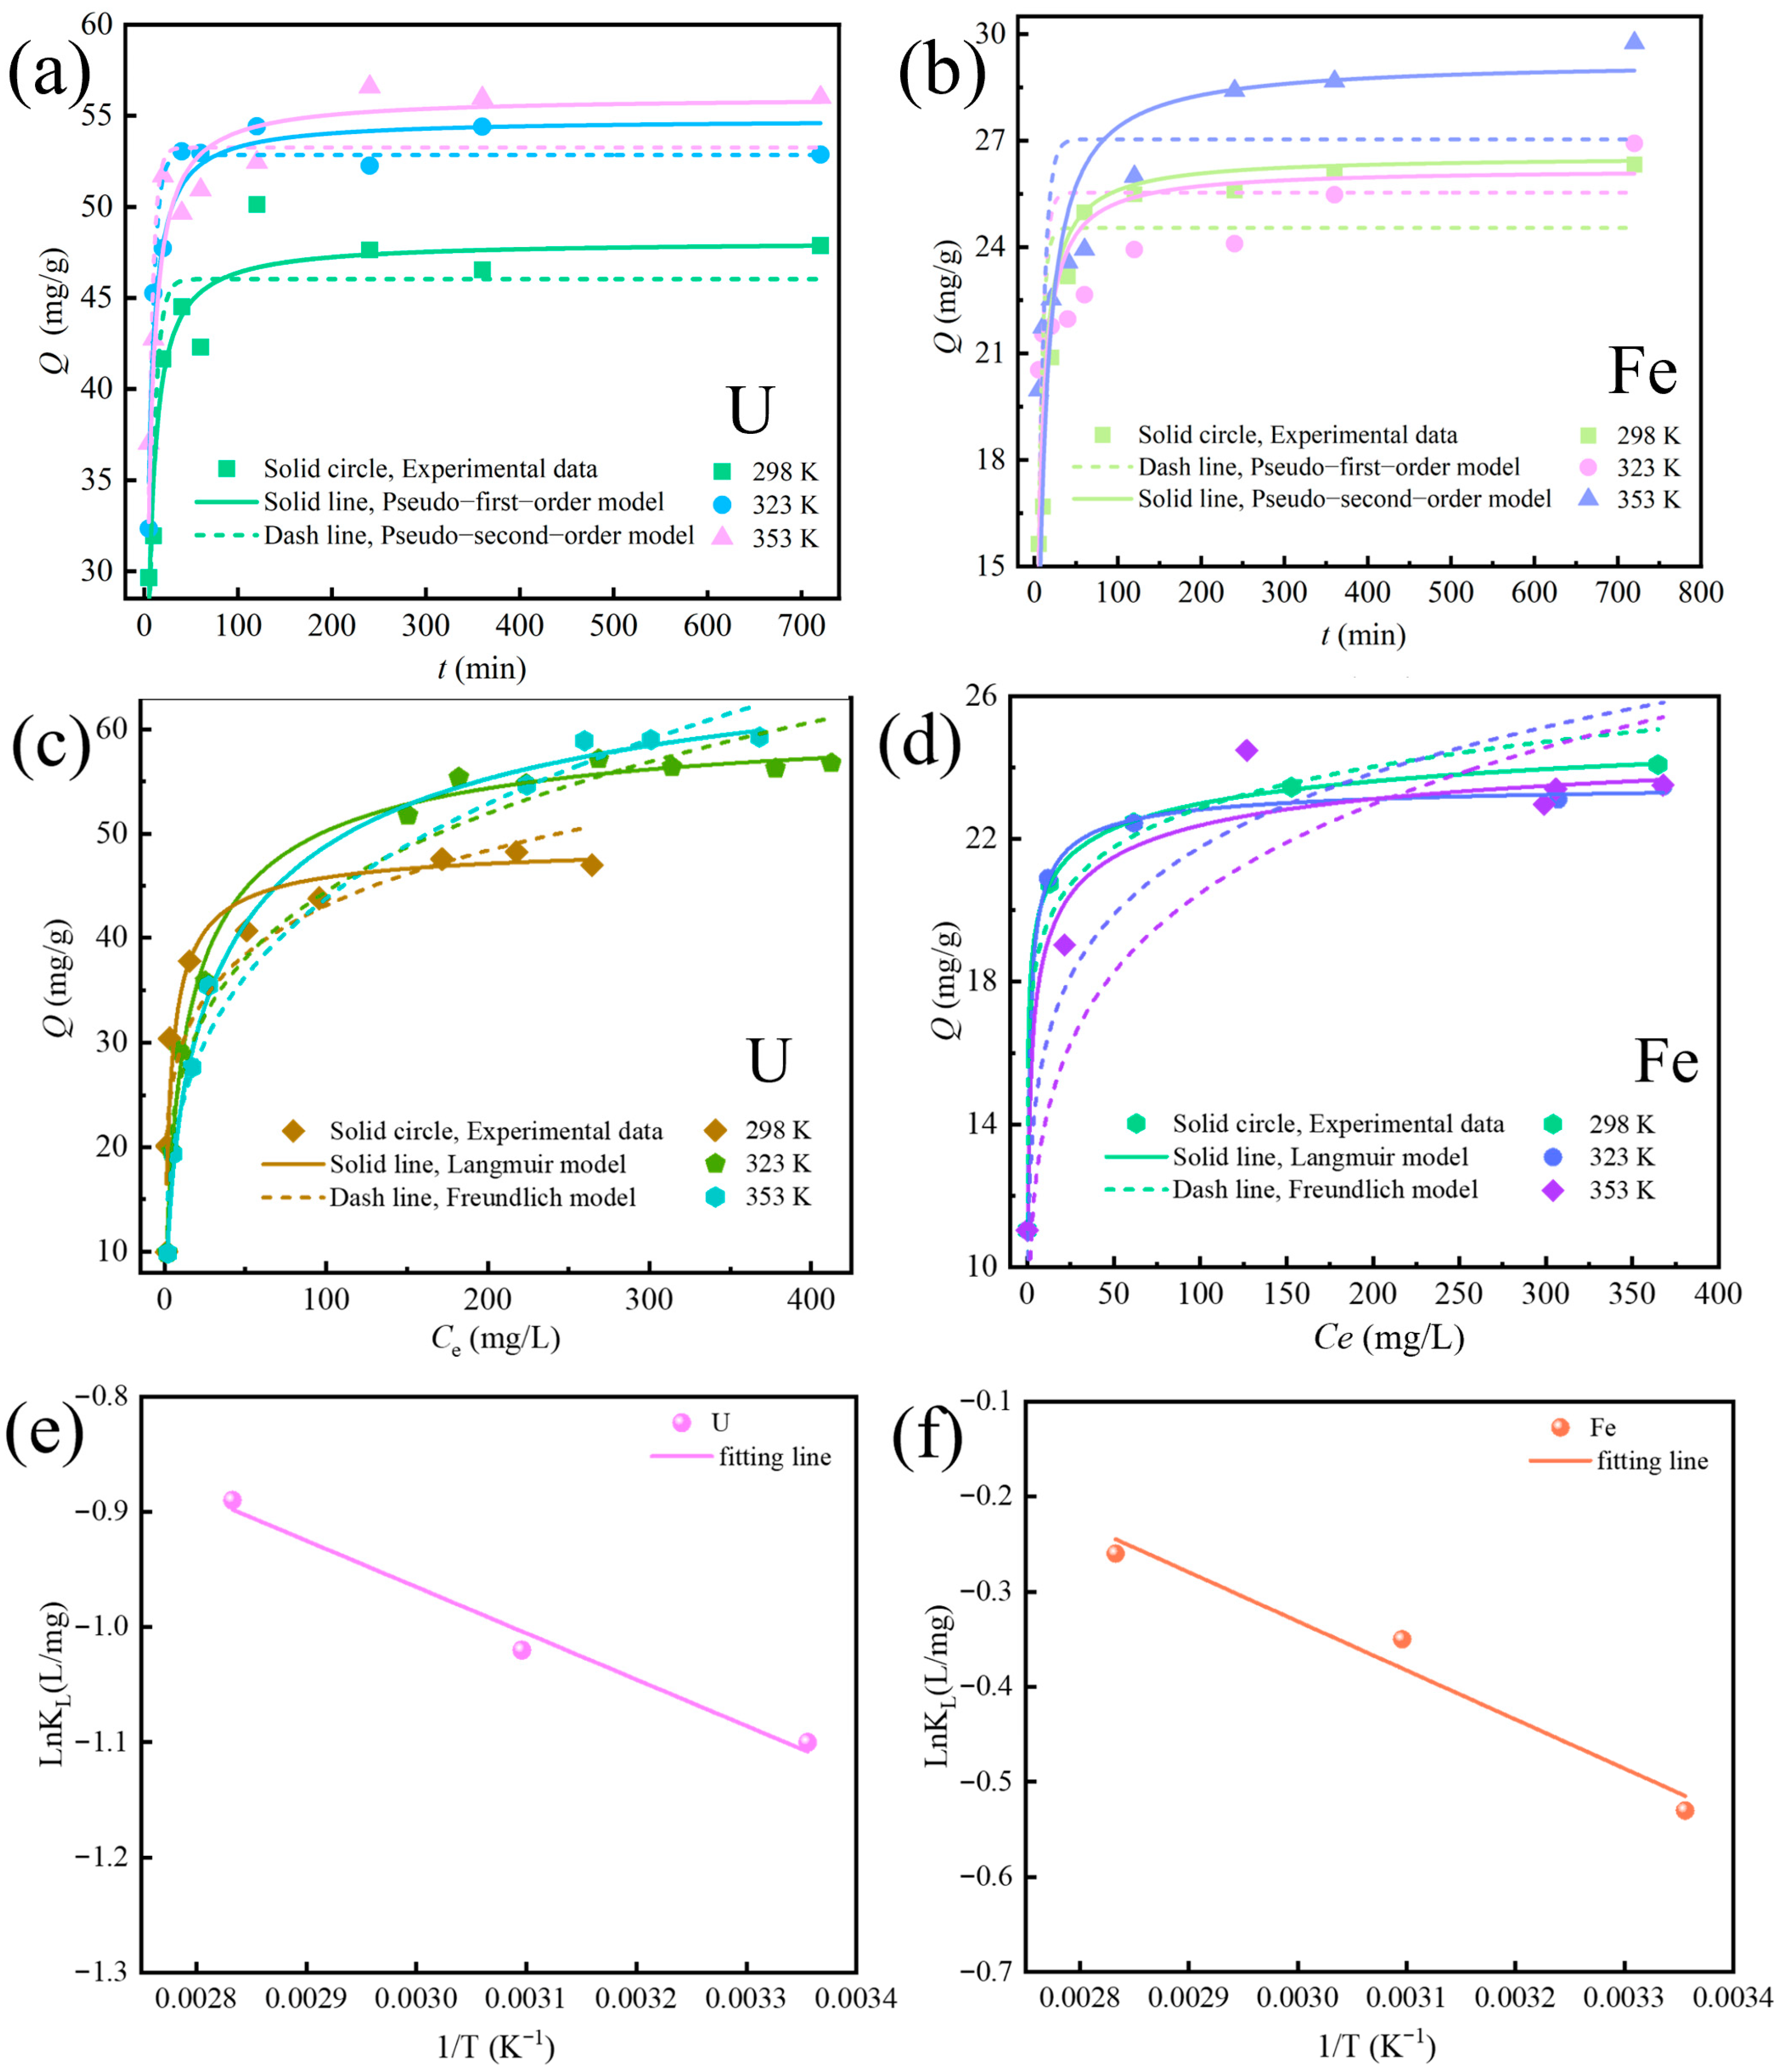
The adsorption kinetics of TNDA/SiO2-P towards U and Fe at different temperatures were studied for better evaluation of its removal performance of U and Fe from REEs, with the results shown in Figure 5a,b. With the increase in contact time, the adsorption amount of U and Fe by TNDA/SiO2-P increases rapidly, and the adsorption equilibrium reaches at approximately 120 min. The equilibrium adsorption capacity of the adsorbent towards U is 49 mg/g, 55 mg/g and 56 mg/g, and that 28 mg/g, 25 mg/g and 26.5 mg/g for Fe at 298 K, 323 K and 353 K, respectively. The pseudo-first-order kinetics (Equation (S1)) and pseudo-second-order kinetics (Equation (S2)) models were used to analyze the data, with the results shown in Table S2. The linear correlation coefficients (R2) of the pseudo-second-order kinetics model are higher with values of 0.9, 0.93, 0.91 (U) and 0.94, 0.89, 0.86 (Fe). The differences between the actual equilibrium adsorption capacity (Qe, exp) and the theoretical equilibrium adsorption capacity (Qe) at different temperatures are less than 2%. The above results indicate that the pseudo-second-order kinetics model is more suitable for the adsorption process of TNDA/SiO2-P towards U and Fe. Therefore, it can be assumed that the adsorption of U and Fe by TNDA/SiO2-P belongs to chemisorption [18]. Furthermore, from Figure S2a,b, the fitted curves of the intraparticle diffusion model are divided into two linear regions, suggesting that the adsorption of U by the adsorbent is divided into two stages. In step I, TNDA/SiO2-P shows favorable adsorption efficiency at 298–328 K. The rate constants KpFe for Fe(III) are 1.27, 0.49, and 0.48 mg/g·min1/2, respectively. The rate constants KpU for U(VI) are 3.7, 6.5, and 2.8 mg/g·min1/2, respectively. In this step, the porous structure promotes the adsorption sites on the internal pore channels to be fully exposed and occupied by metal ions to form new complexes. As the adsorption reaction proceeds to step II, the KpFe is 0.05, 0.06 and 0.02 mg/g·min1/2 at 298–328 K, respectively, and the KpU is 0.02, 0.03 and 0.06 mg/g·min1/2. It has been demonstrated that diffusion is not the rate-limiting step in U and Fe adsorption. Furthermore, as shown in Table S3, none of the fitted curves pass the origin of the coordinates, which indicates that the adsorption process consists of both chemical adsorption and diffusion, with chemical adsorption being the dominant mechanism [23].

3.5. Adsorption Isotherm Towards U and Fe

The adsorption isotherms of U and Fe by TNDA/SiO2-P at 298 K, 323 K and 353 K were investigated and are shown in Figure 5c,d. The adsorption amounts of U and Fe by the adsorbent increase rapidly with the increase in the equilibrium metal ion concentration in the solution and then tend to be steady. The saturation adsorption capacities of the adsorbent for Fe are 23.5 mg/g, 24 mg/g and 28 mg/g at 298 K, 323 K and 353 K, and 46 mg/g, 55 mg/g and 60 mg/g for U at 298 K, 323 K and 353 K, respectively.
The Langmuir isotherm model (Equation (S4)) and the Freundlich isotherm model (Equation (S5)) are used to analyze the data shown in Table S4. The Redlich–Peterson model Equation (S8), the Dubinin–Radosevich model Equation (S9) and the Temkin model Equation (S10) are shown in Figure S3. The correlation coefficients (R2) of the Langmuir model are much higher with a value over 0.94, 0.99, and 0.99 for U and 0.99, 0.96, and 0.96 for Fe. The difference between the theoretical sorption (Qe) and the actual sorption (Qe, exp) is less than 1.5%, which indicates that the Langmuir model is more suitable for the adsorption process of U and Fe by the adsorbent [18,24]. This means that the adsorption is a monolayer adsorption process.
The thermodynamic results of the TNDA/SiO2-P adsorption of U or Fe are shown in Figure 5e,f and Table S5. The positive values of ΔH0 and ΔS0 and the negative values of ΔG0 indicate that adsorption is an entropy-driven endothermic reaction [25].

3.6. Box–Behnken Statistical Analysis

The interactive effects of U and Fe concentration (C0), contact time (t) and temperature (T) on the U and Fe adsorption amount (Q) of TNDA/SiO2-P in a 5 M HCl medium were investigated. The experimental results were analyzed using response surface methodology (RSM) to obtain the quadratic polynomial regression equations between the experimental variables and adsorption capacity. Subsequently, the quadratic polynomial regression equation containing coded values was used to predict the response for U (Equation (8)) and Fe (Equation (9)) adsorption by the adsorbent in a 5 M HCl solution as follows.
Q = 53.35 + 2.38t + 0.28C0 + 4.99T + 3.69tC0 − 5.88tT − 5.18C0T − 4.15t2 − 7.97C02 − 7.21T2
Q = 19.46 − 0.33t + 0.014C0 + 0.98T − 1.20tC0 + 1.46Tt + 6.98C0T − 8.04t2 − 1.31C02 − 1.61T2
where Q (mg/g), C0 (mg/L), t (min) and T (K) are the adsorption capacity, initial concentration of U and Fe, contact time and temperature, respectively.
The quadratic polynomial models were analyzed using analysis of variance (ANOVA) and significance tests, with the results presented in Tables S6–S8. Both of the quadratic polynomials demonstrate excellent applicability, as evidenced by their respective correlation coefficients R2 of 0.925 and 0.960, indicating strong predictive capabilities. The difference between the predicted and actual values for both models is less than 0.2 mg/g, confirming the adequacy of the quadratic polynomial model.
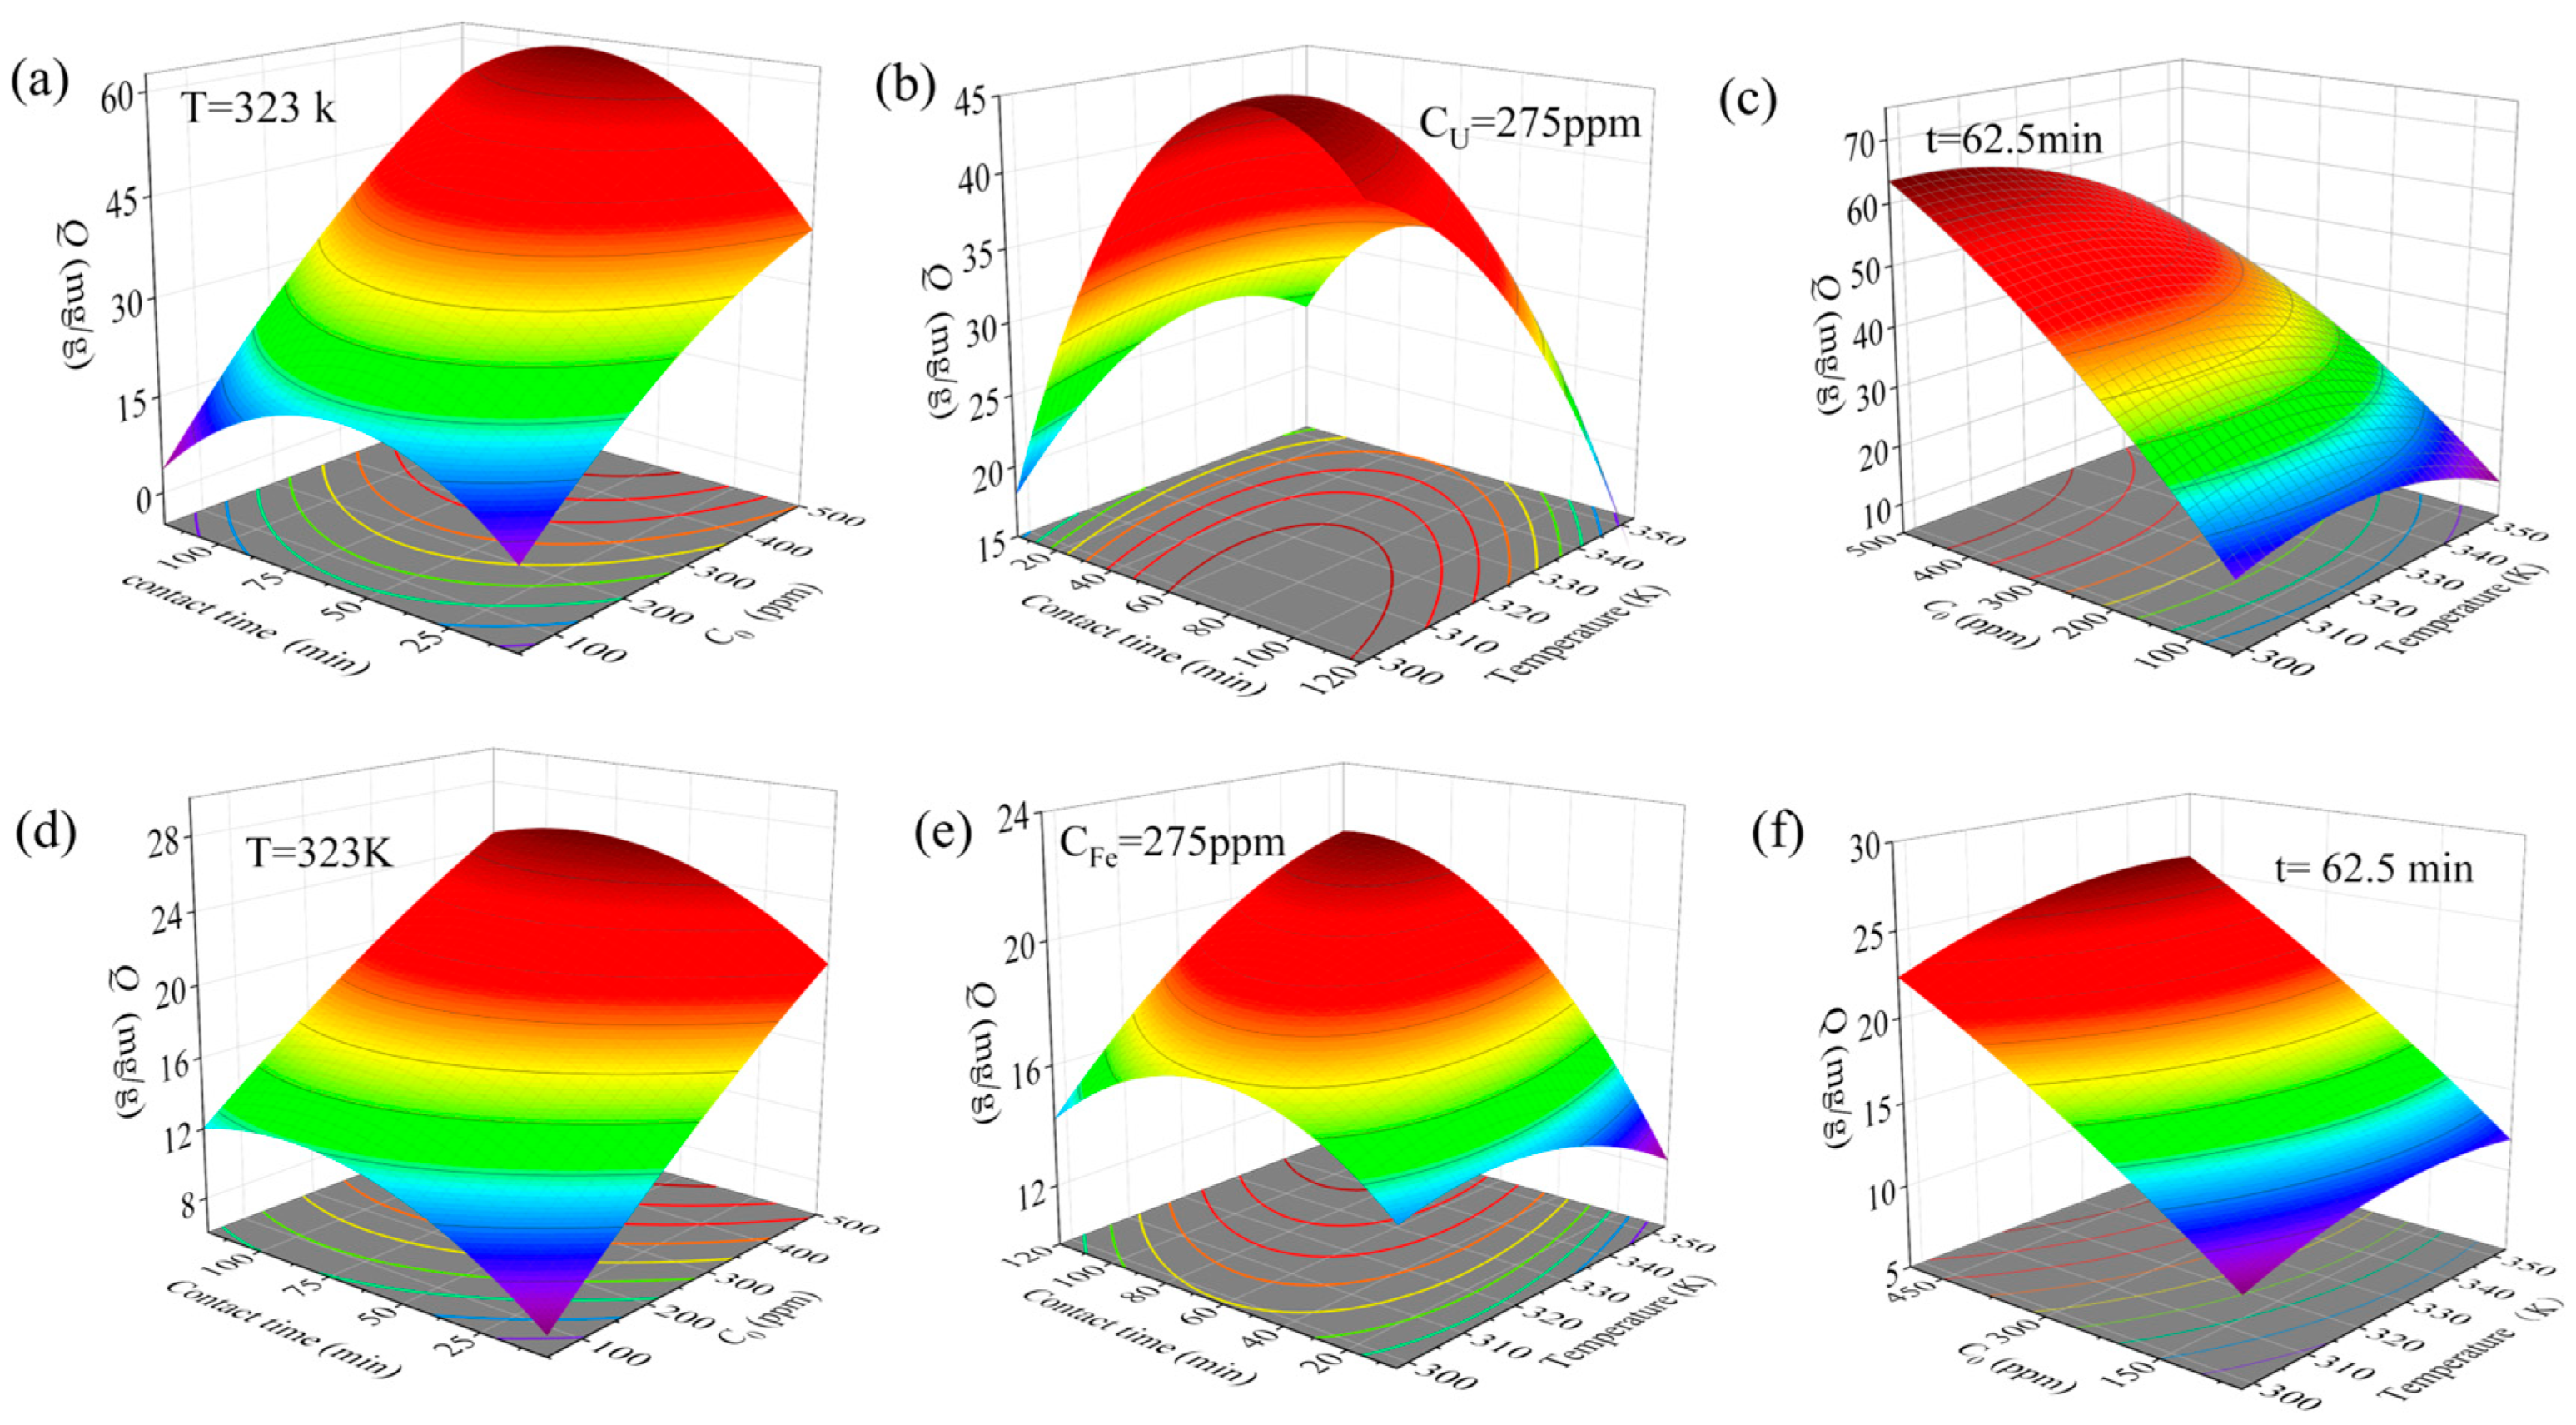
The response surface and contour plots are shown in Figure 6. The interaction influence of C0 and t on U and Fe adsorption capacities is shown in Figure 6a,d—U and Fe adsorption increase with the increase in C0 and t, and the maximum adsorption capacities at 298 K are approximately 53 mg/g and 21 mg/g for U and Fe, respectively. The results of the interaction between T and C0 in Figure 6b,e show that the increase in temperature is conducive to U and Fe adsorption. The interaction effect of T and t on U and Fe adsorption is shown in Figure 6c,f—the adsorption equilibrium is reached within 62.5 min. The desirability function of RSM was utilized to forecast the optimal values for each variable to determine the maximum U and Fe adsorption capacity. The optimal forecasted values for U and Fe adsorption capacities being 500 ppm, 62.5 min, 323 K, and 52.92 mg/g in a 5 M HCl solution, as well as 500 ppm, 62.5 min, 323 K, and 21.2 mg/g in a separate instance of a 5 M HCl solution. Validation experiments were carried out based on these optimal predicted values for the variables mentioned above, resulting in observed adsorption capacities of 53 mg/g and 22.7 mg/g for U and Fe, respectively, which are found to be consistent with the predicted values.

3.7. Desorption Performance

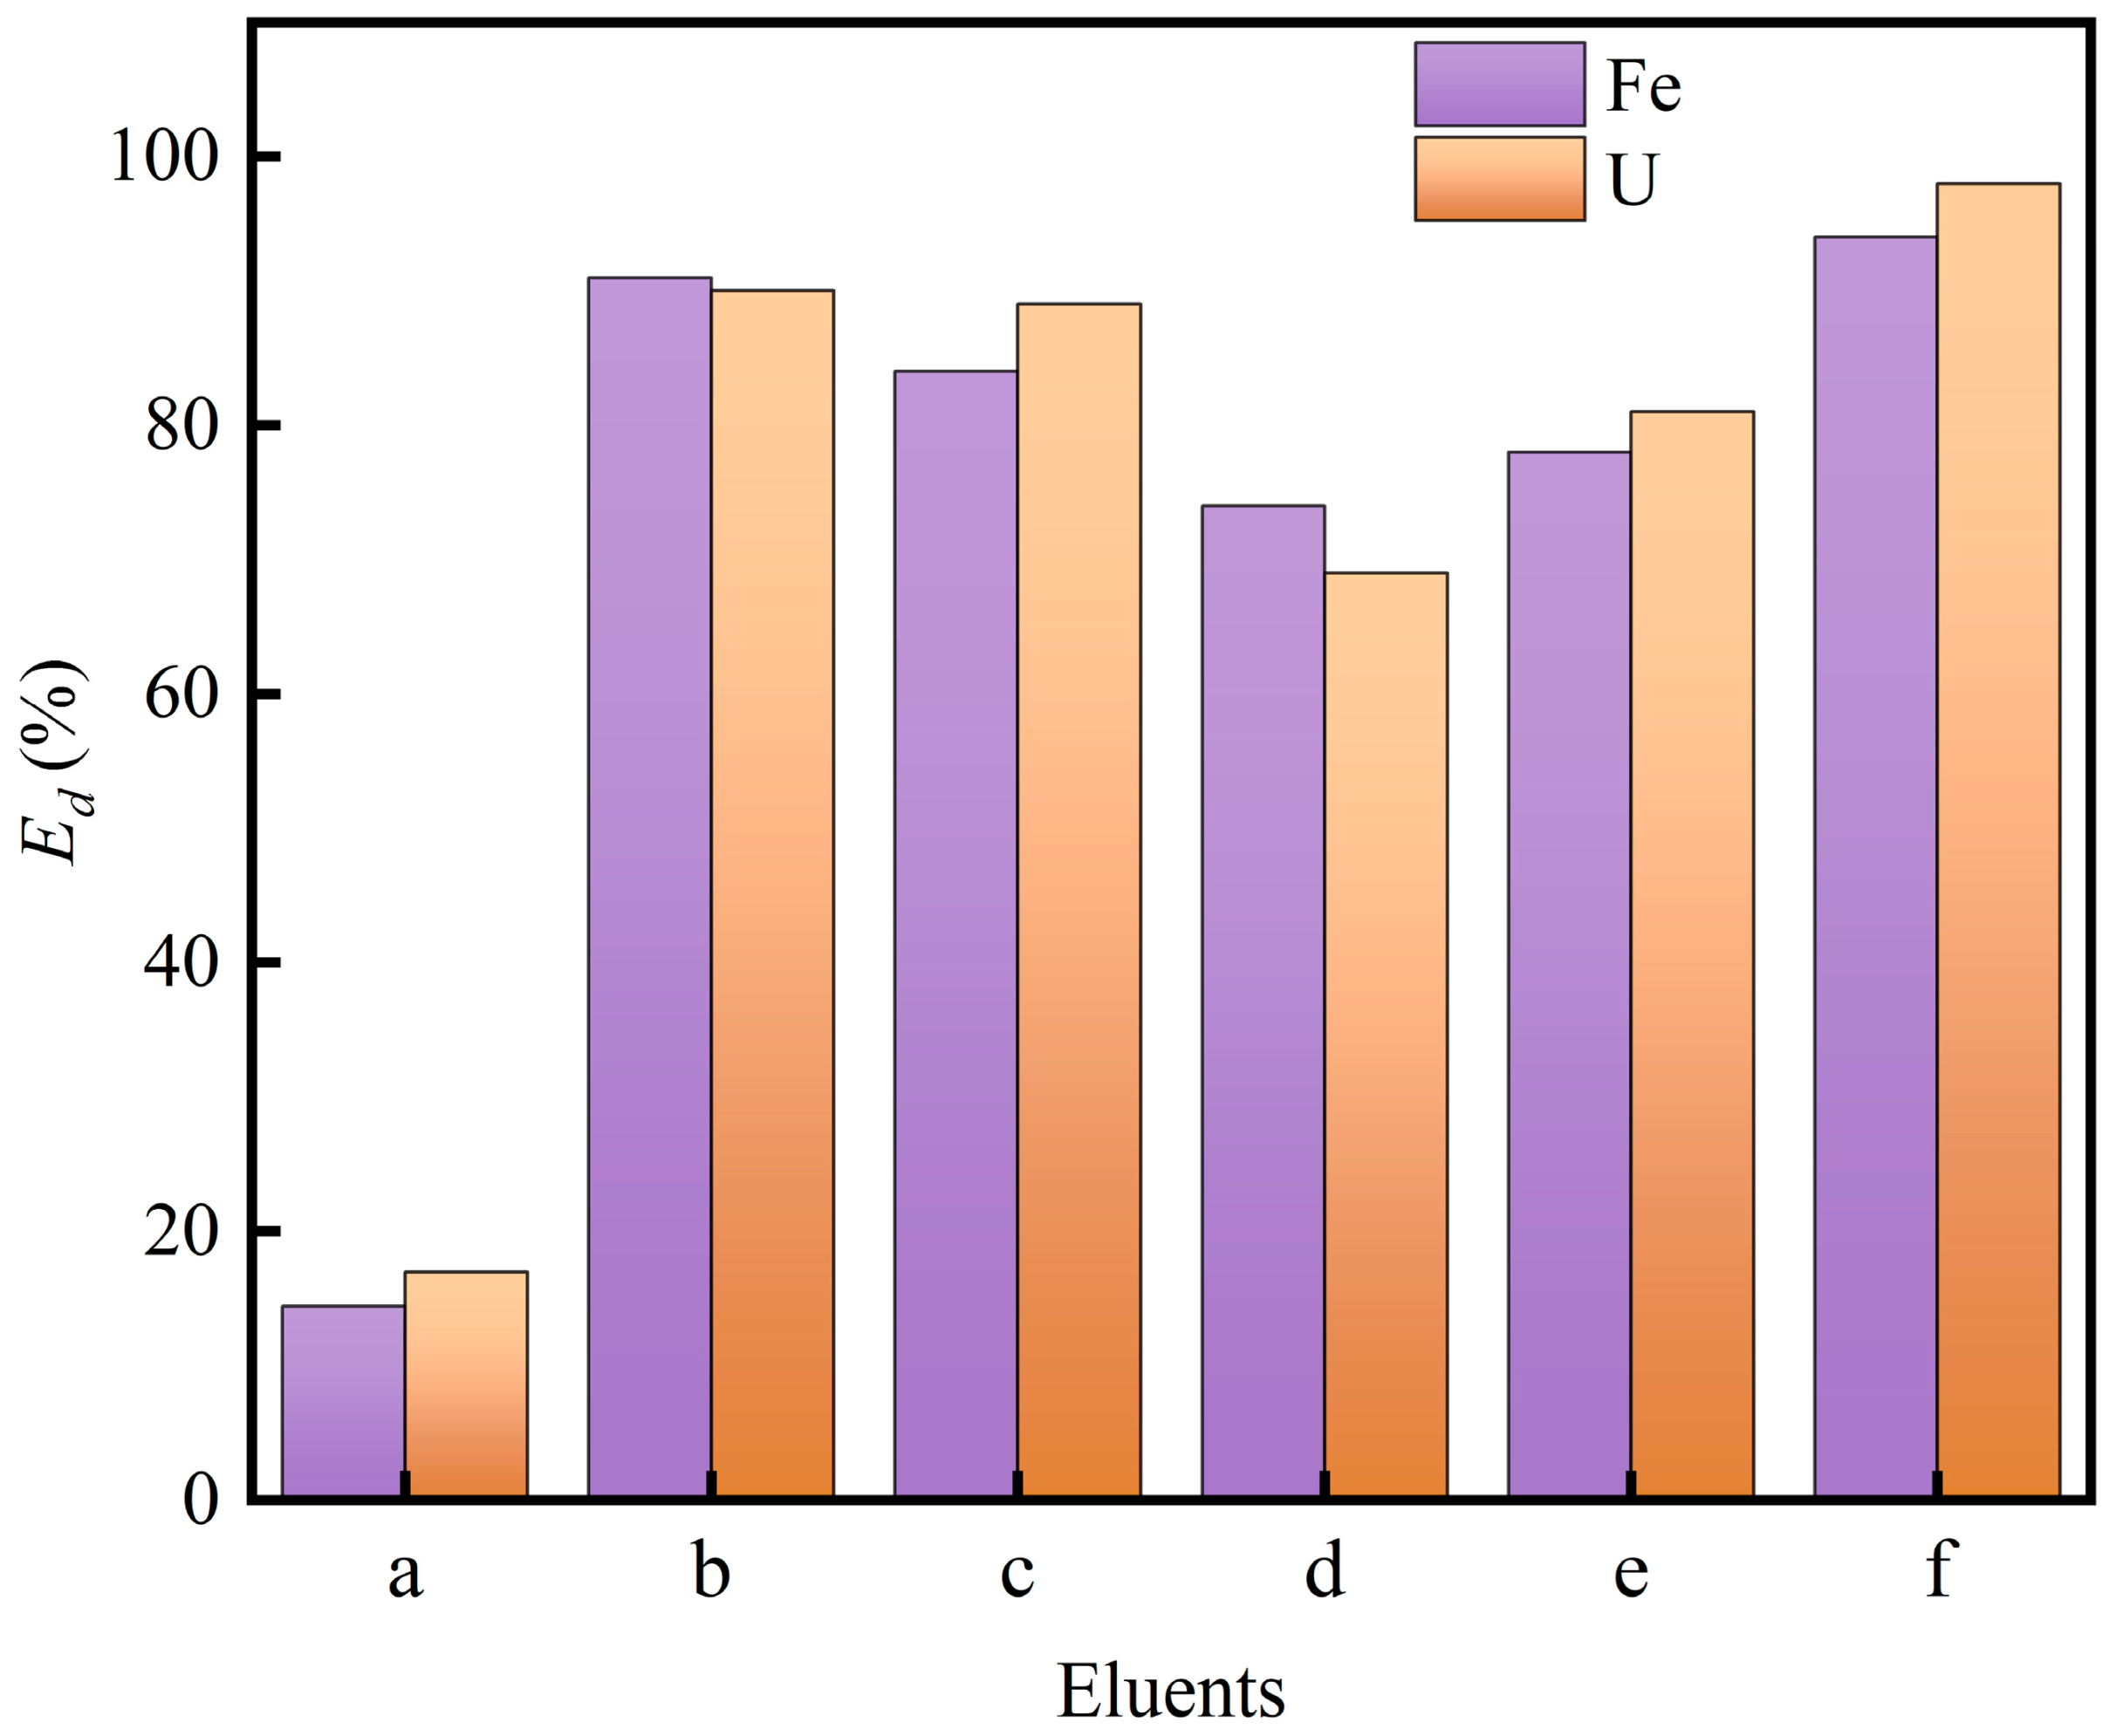
To effectively evaluate the applicability of TNDA/SiO2-P, the desorption performance of Fe with different eluents was firstly investigated, with the results shown in Figure 7. Fe adsorbed by TNDA/SiO2-P is difficult to desorb by EDTA, with a desorption rate less than 20%. However, UP water, 0.5 M thiourea (TU), 0.1 M DTPA, 0.1 M EDTA-2Na and 0.1 M HCl all show significant desorption ability, with desorption rates as high as 91%, 84%, 74%, 78% and 94%. U adsorbed by TNDA/SiO2-P is difficult to desorb by EDTA, with a desorption rate less than 20%, while UP water, 0.5 M thiourea (TU), 0.1 M DTPA, 0.1 M EDTA-2Na and 0.1 M HCl all show significant desorption ability, with desorption rates as high as 90%, 89%, 69%, 81% and 98%. In the following experimental procedures, 0.1 M hydrochloric acid (HCl) was utilized as the eluent.

3.8. Column Experiments

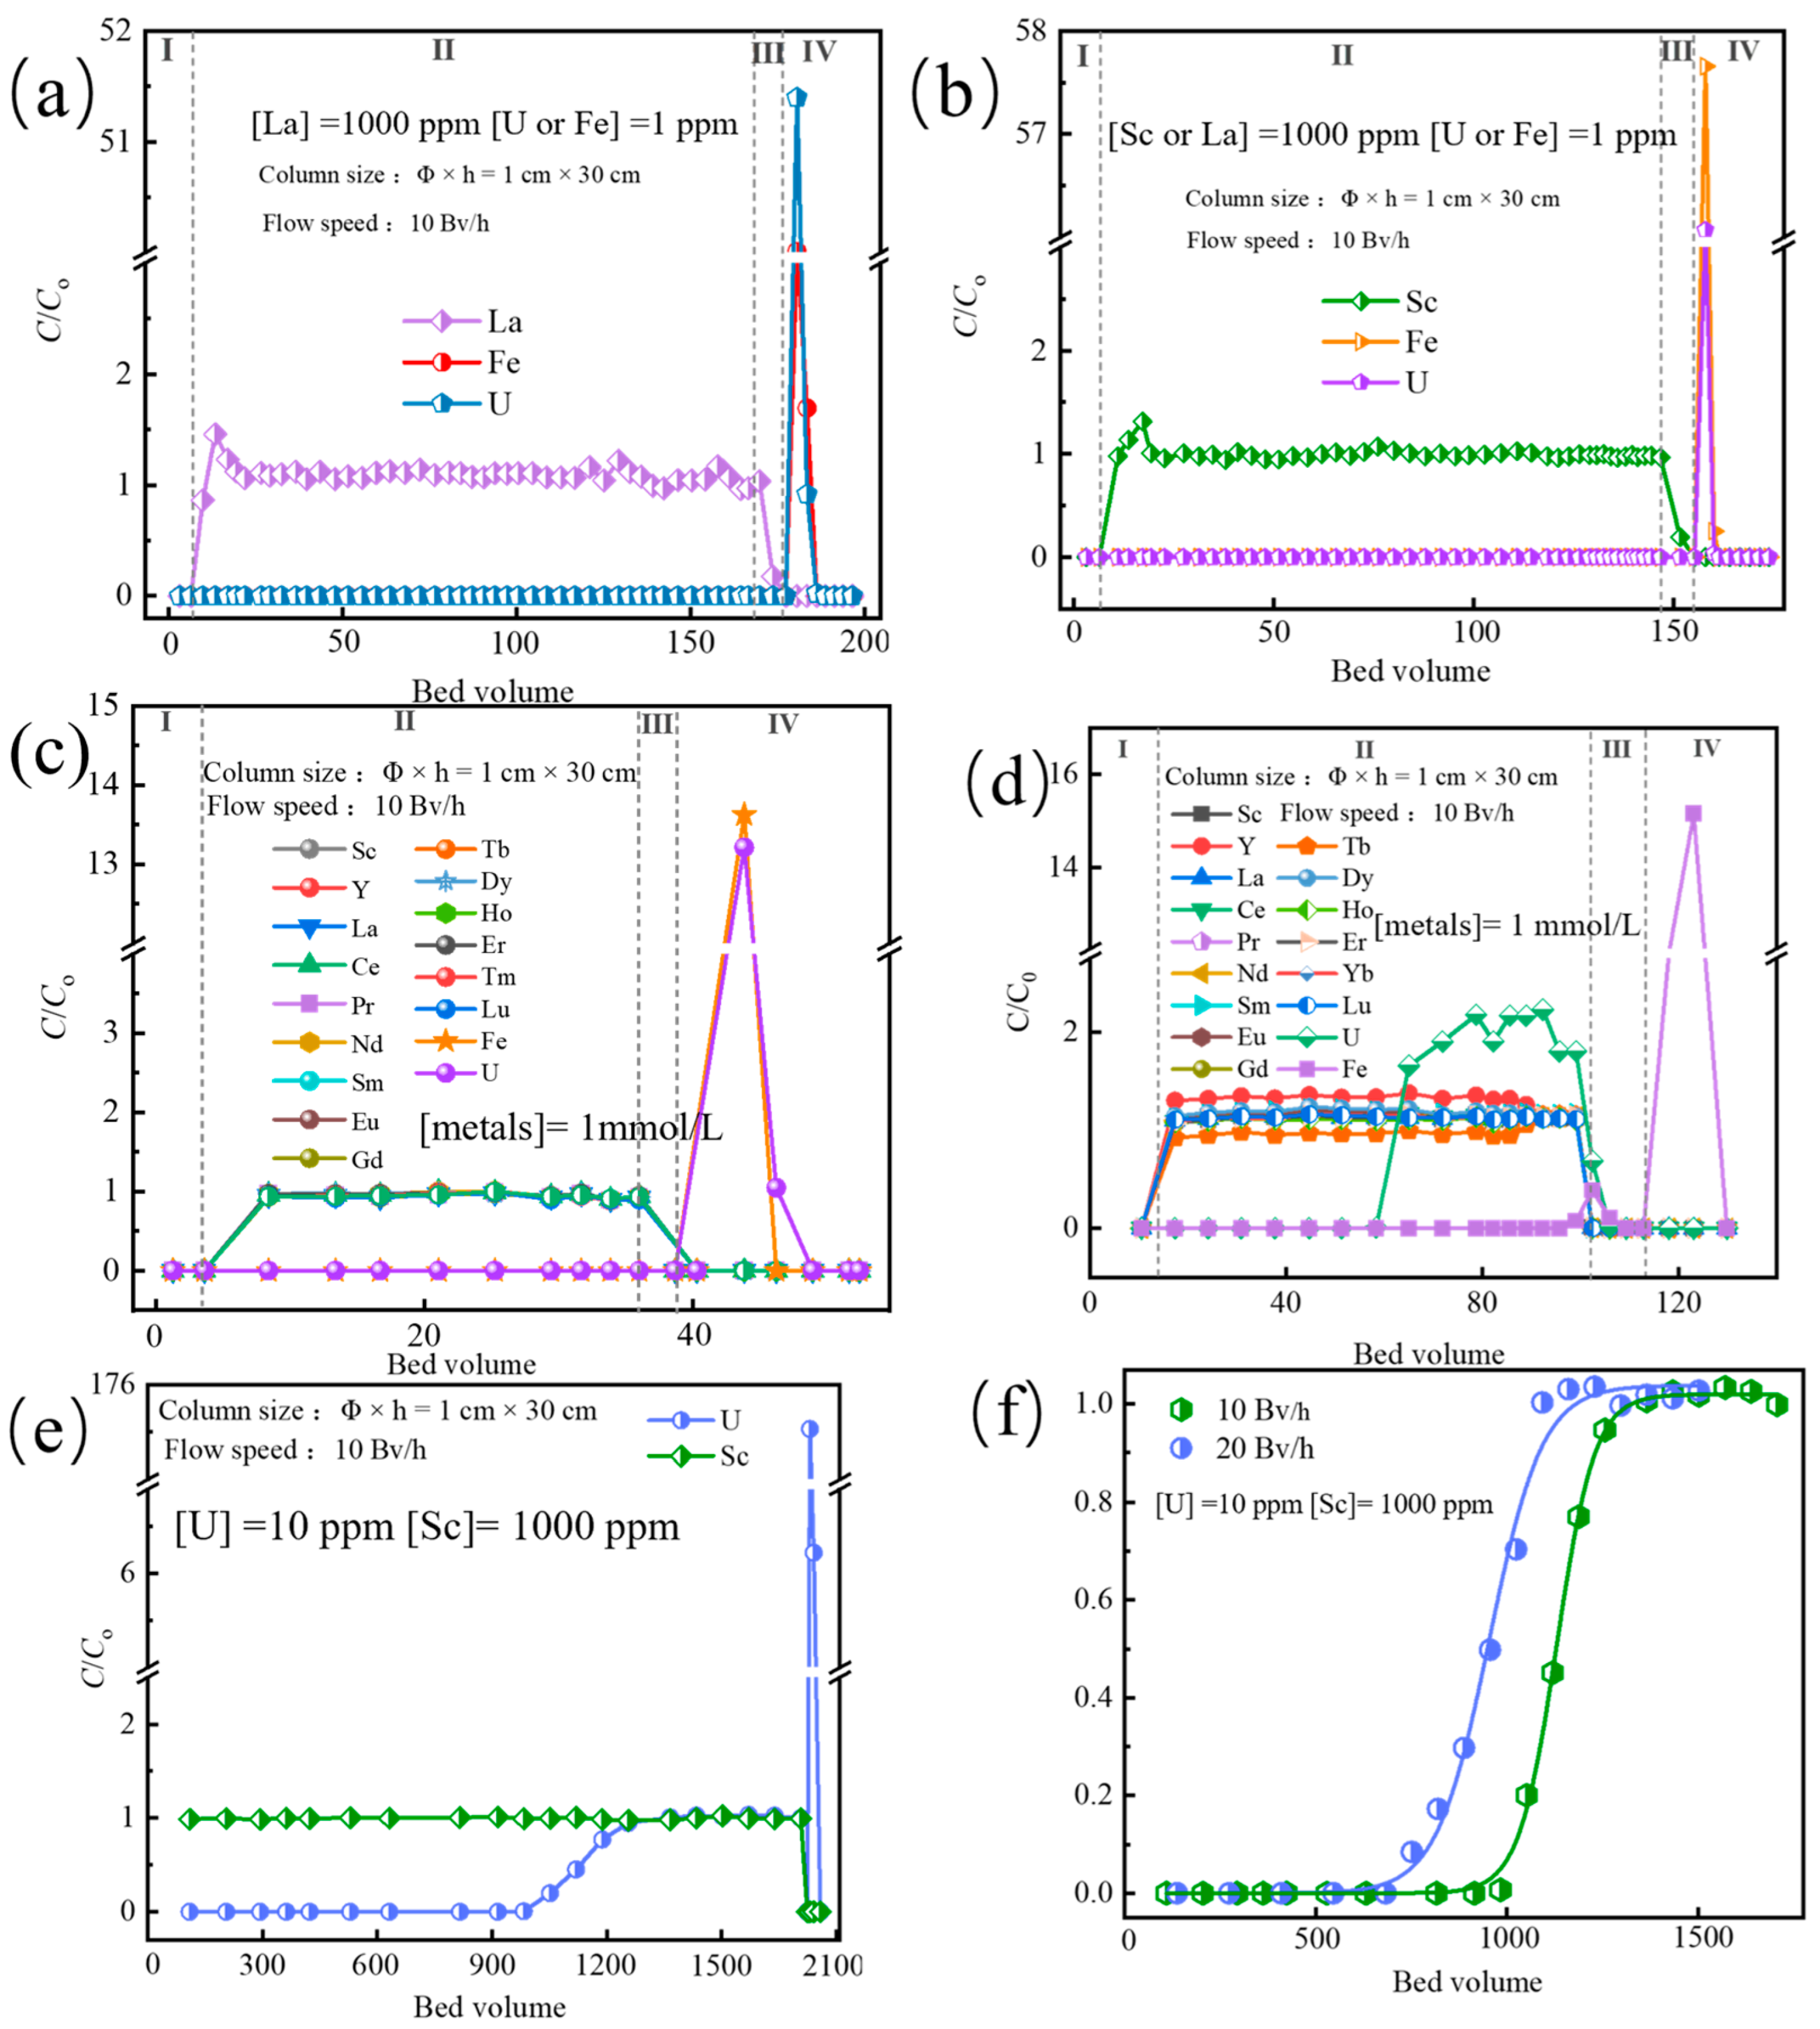
Based on the above results, a method for the efficient removal of U and Fe from La, Sc and mixed REE solutions by TNDA/SiO2-P adsorbent was proposed through continuous column experiments. In Figure 8a,b, in the case of a trace amount of U and Fe in large amounts of La or Sc, when the feed solution is approximately 130 BV, U and Fe are nearly completely adsorbed without any penetration, with C/C0 close to 0, and La or Sc are not adsorbed with C/C0 close to 1. The adsorbed U and Fe are efficiently desorbed by 0.1 M HCl, and the recovery rates of U and Fe are 99% and 98%, respectively. The removal rates of uranium and iron in the solution of La and Sc are higher than 99.7%.
Where there are multiple REEs in coexistence, as shown in Figure 8c, U and Fe are nearly completely adsorbed, while REEs are not adsorbed, and the recovery rate of REEs after the deep removal of U and Fe is as high as 99%. The adsorbed U and Fe can be completely desorbed by 0.1 M HCl. The above results show that TNDA/SiO2-P can efficiently remove the U and Fe impurities from REEs and has a good application prospect in the field of REE purification.
In Figure 8d, when the feed solution is continuously delivered, REEs firstly directly flow out without adsorption with the feed solution, but U and Fe are co-adsorbed firstly. When the feed solution is larger than 54.6 BV, U begins to penetrate, and Fe does not penetrate until 95.5 BV. The reason maybe that the affinity of TNDA/SiO2-P for Fe is larger than that for U, resulting in the adsorbed U being replaced by Fe.
Further, the breakthrough curve of U from a highly concentrated Sc solution was investigated, with the results shown in Figure 8e. TNDA/SiO2-P effectively adsorbs U in the feed solution when it is not more than 1051 BV with almost no adsorption towards Sc. The sharp increase in the breakthrough curve indicates that TNDA/SiO2-P has good diffusion and fast adsorption kinetics performance. When the content of U in the effluent solution reaches the feed solution with C/C0 close to 1, U completely penetrates. The Thomas model (Equation (S8)) was used to analyze the data shown in Figure S3. The R2, KTh and the calculated dynamic adsorption capacity Q are 0.999, 0.068 L·g/min and 40 mg/g, respectively. However, the actual dynamic adsorption capacity is 46 mg/g, which is higher than the theoretical value. The deviation may be caused by the fluctuation of the working fluid flow rate in the dynamic experiments. Moreover, in the desorption stage, the separated U can be efficiently enriched with the enrichment factor(C/C0) as high as 175.
As the flow rate of the feed solution is also a key factor in column experiments, the effect of the flow rate was studied, as shown in Figure 8f. At the flow rate of 10 BV/h, penetration occurs at 1024 BV, and when the flow rate increases to 20 BV/h, penetration occurs at 819 BV. The reason maybe that as the flow rate increases, the contact time of the solution with the adsorbent decreases, so the adsorption performance decreases. The test successfully isolates trace amounts of U and Fe from a dominant La/Sc background.

3.9. Reusability Evaluation and Stability of TNDA/SiO2-P

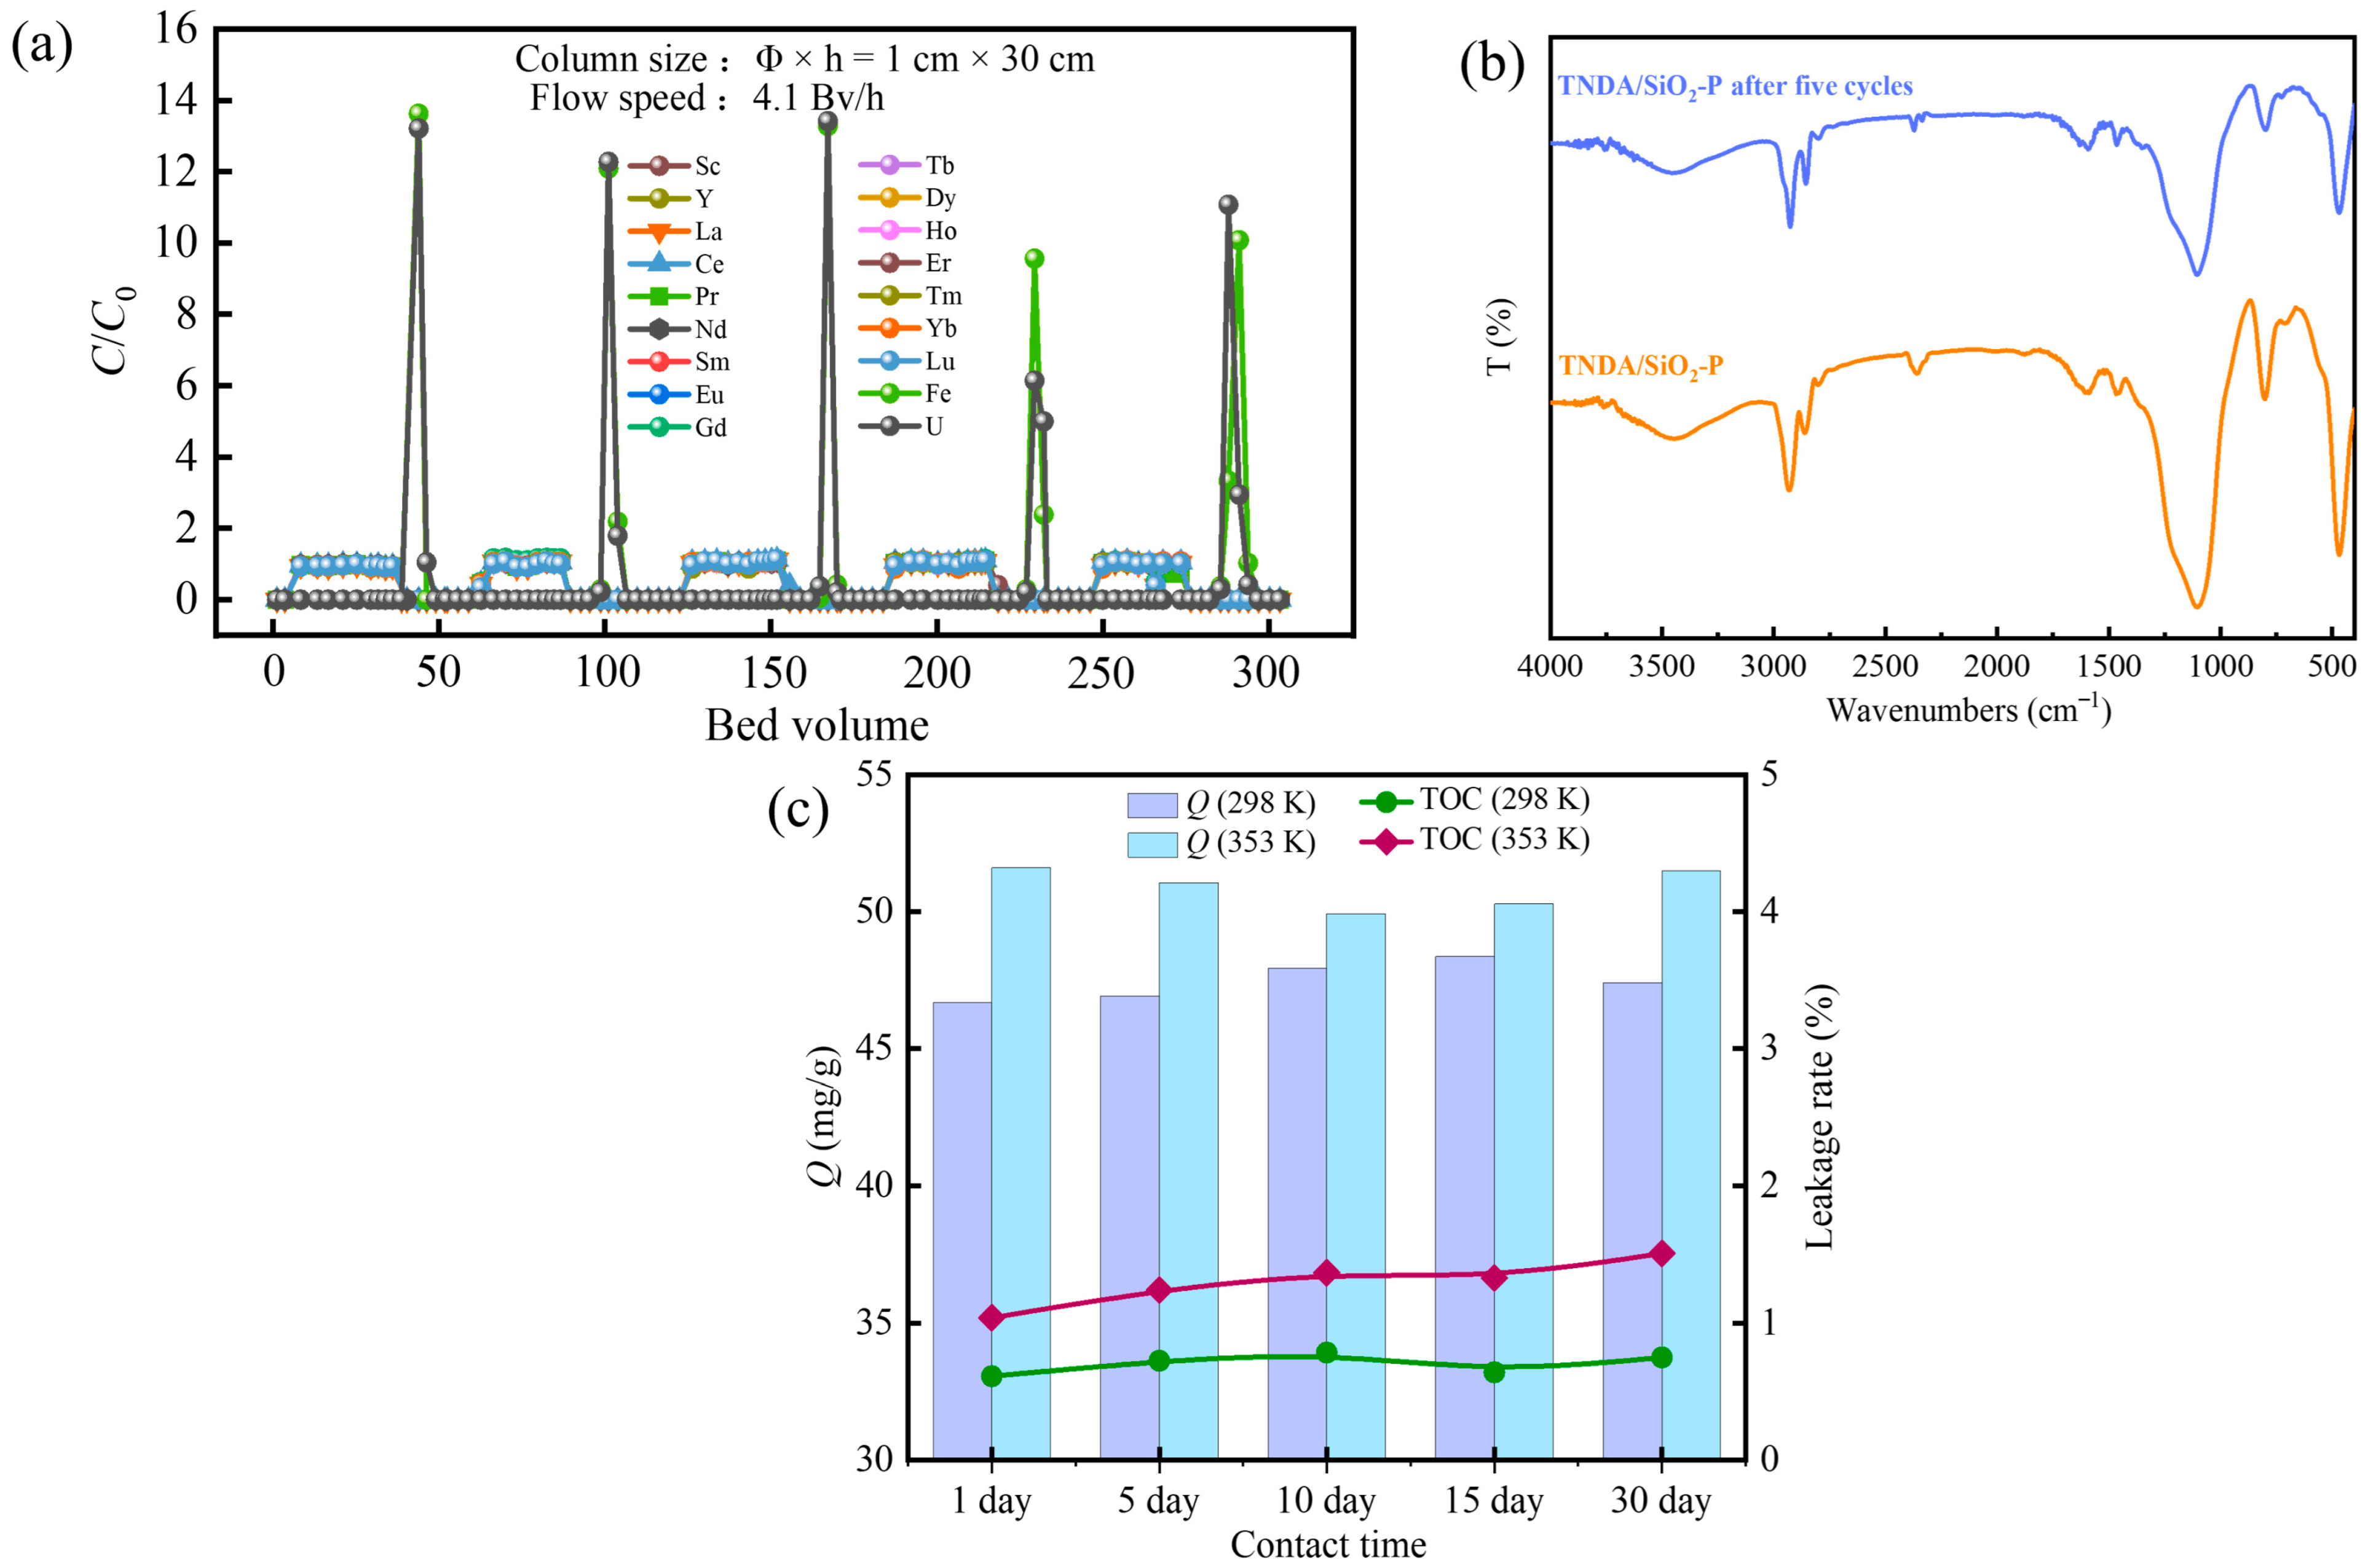
A continuous column experiment was used to evaluate the reusability performance of TNDA/SiO2-P. After 5 adsorption–desorption cycles, high removal efficiencies of U and Fe impurities from REEs are still achieved and the enrichment factor(C/C0) does not change much during the desorption process, as shown in Figure 9a, which proves the good reusability of TNDA/SiO2-P adsorbent and shows great potential in its practical application. Moreover, the functional groups on TNDA/SiO2-P after five cycles were assessed by FT-IR, as shown in Figure 9b, exhibiting no obvious changes, indicating that TNDA/SiO2-P has relatively excellent reusability. The stability was also evaluated by analyzing the adsorption capacity of TNDA/SiO2-P towards U and the TOC (total of organic carbon) in the liquid phase after contact with 5 M HCl solution at 298 K and 353 K for 1–30 days, with the results shown in Figure 9c. The TOC is from the leakage or degradation of the TNDA/SiO2-P into the liquid phase. It is supposed that all the TOC is from the leakage or degradation of TNDA and all the leakage or degradation of TNDA is dissolved in the liquid phase, so the stability of the TNDA/SiO2-P can be inferred from the TOC results. The changes in both the adsorption capacity of U and the TOC are very small over time, and those occurring at 353 K are slightly higher than those at 298 K. After thirty days of continuous adsorption, the leakage or degradation rate of TNDA/SiO2-P at both temperatures is less than 2%, which indicates that TNDA/SiO2-P has good stability.

3.10. Adsorption and Separation Mechanisms

3.10.1. FT-IR and XPS Analysis

The changes in FT-IR and XPS spectra of TNDA/SiO2-P before and after adsorption of U and Fe were studied and the results are shown in Figure 10a. The characteristic peaks at 470, 800, and 1103 cm−1 are from Si-O-Si stretching vibrations [26]. The peaks near 1351 and 1460 cm−1 originate from the C-H vibrations [27]. The peaks at 1630 and 2466 cm−1 arise from the adsorbed water [18]. The peaks at 1450 and 1542 cm−1 originate from C-N vibrations [28]. After adsorption of uranium and iron, the infrared peaks of C-N shifted to 1467 cm−1 and 1463 cm−1, respectively. In addition, the peak of U is observed near 906 cm−1, indicating that U is effectively adsorbed [29].
Figure 10b shows the full XPS spectra of the adsorbent before and after adsorption of U and Fe. Compared with the spectrum of TNDA/SiO2-P, the characteristic peaks of U 4f (approximately at 380.55 eV) and Fe 2p (approximately at 724 eV) are observed in the spectra of U-loaded TNDA/SiO2-P and Fe-loaded TNDA/SiO2-P, indicating that U and Fe have been successfully adsorbed by TNDA/SiO2-P [30,31]. The appearance of the characteristic peak of Cl at 198.5 eV [32] after the adsorption of U and Fe indicates the involvement of Cl in the adsorption of the material. In Figure 10c, the two peaks at 381.8 eV and 392.5 eV are attributed to U(VI) 4f7/2 and U(VI) 4f5/2, and those at 380.2 eV and 390.9 eV are attributed to U(IV) 4f7/2 and U(IV) 4f5/2 [33,34]. The semi-quantitative calculation result of U(VI) through XPS was approximately reduced by 43%. The presence of U(IV) peaks indicates that U(VI) is reduced by TNDA/SiO2-P through the loss of electrons from the amino group. In Figure 10d, two peaks at 701.4 eV and 723.7 eV are attributed to Fe(III) 2P1/2 and Fe(III) 2P3/2. As shown in Figure 10e, there are two binding states of N1s in fresh TNDA/SiO2-P adsorbent, -NH and N-C at 398.6 eV and 401.3 eV, respectively [26]. After the adsorption of U, the binding energies of N1s shift to 399.9 eV and 401.7 eV, and after the adsorption of Fe, the binding energies of N1s shift to 398.6 eV and 401.7 eV. In Figure 10f, two new peaks appear in the Cl 2p binding energy results after the adsorption of U or Fe, respectively, which can be attributed to U-Cl (198.9 eV) and Fe-Cl (196.8 eV) [35]. Under high concentrations of HCl such as 5 M, TNDA/SiO2-P is protonated by attracting H+ through lone pair electrons on N, followed by attracting Cl to maintain the charge balance, resulting in (TNDA·H+/SiO2-P)Cl. Further, the high concentration of Cl promotes the formation of anion species of U and Fe, such as UO2Cl3 and FeCl4, so that the uranium and iron are successfully adsorbed by TNDA/SiO2-P through anion exchange between (UO2Cl3, FeCl4) and Cl [21,36].

3.10.2. DFT Calculation

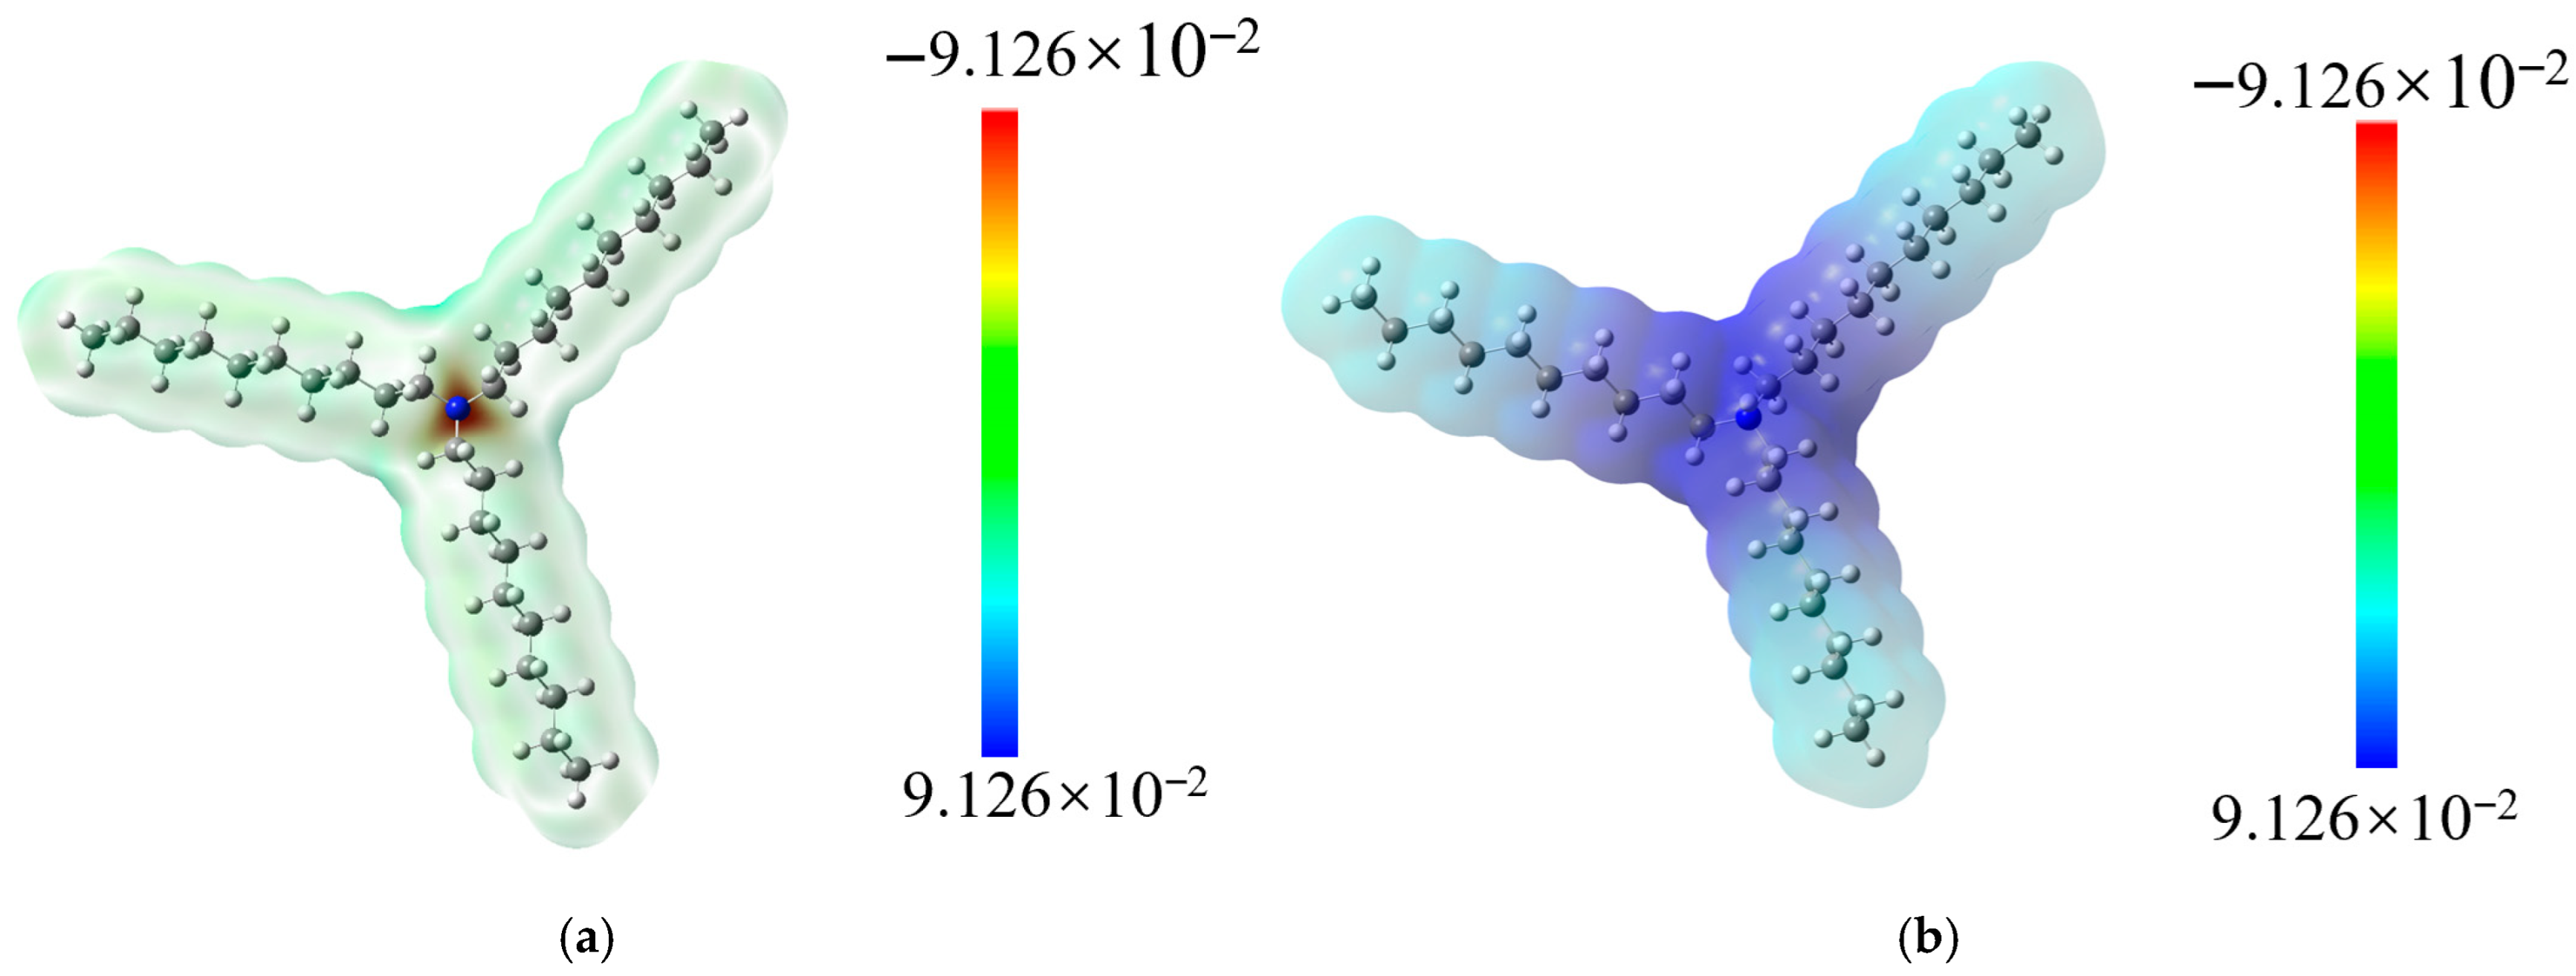
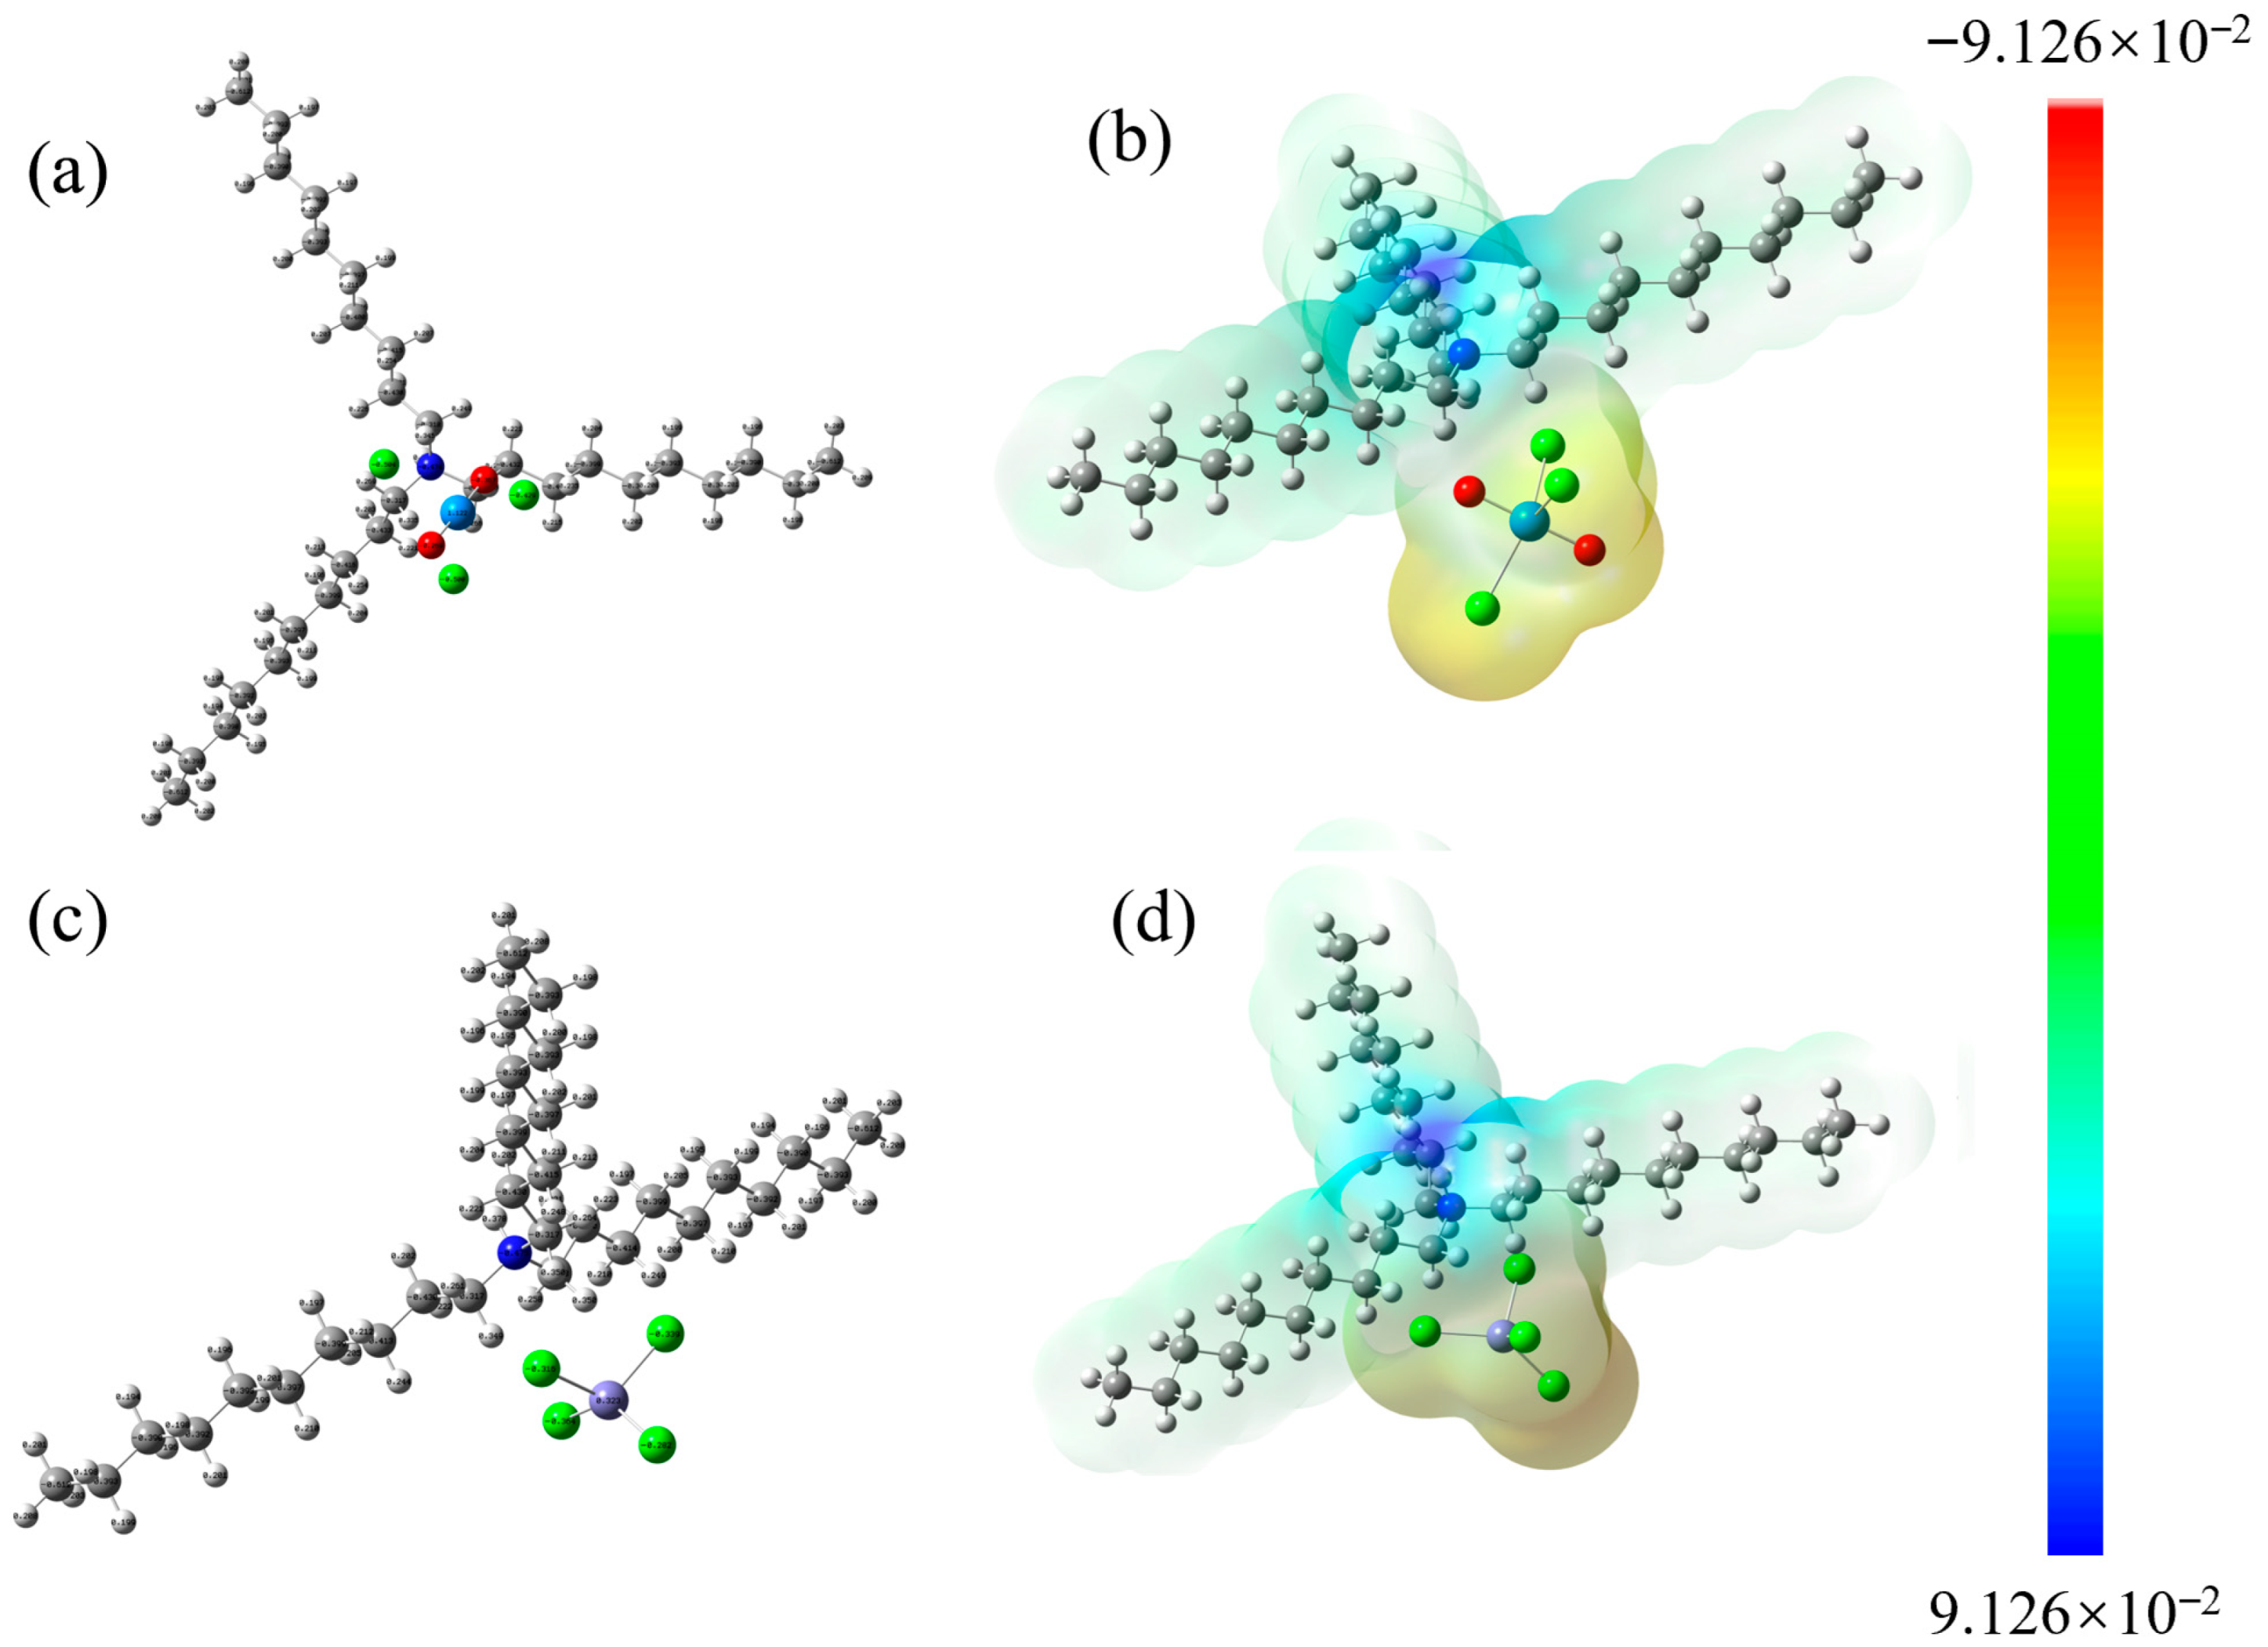
To further investigate the interaction mechanism, the structure optimization and frequency calculation of TNDA were performed through DFT calculations and the results are shown in Figure 11. As shown in the figure, the negative charge is mainly distributed around the nitrogen atom in the TNDA, and thus a negative electrostatic potential is generated around this region. In Figure 11a, the entire structure of TNDA remains unchanged. Conversely, in Figure 11b, the protonated form of TNDA (TNDA·H+) exhibits a complete positive charge throughout its structure, enabling it to attract anions effectively.
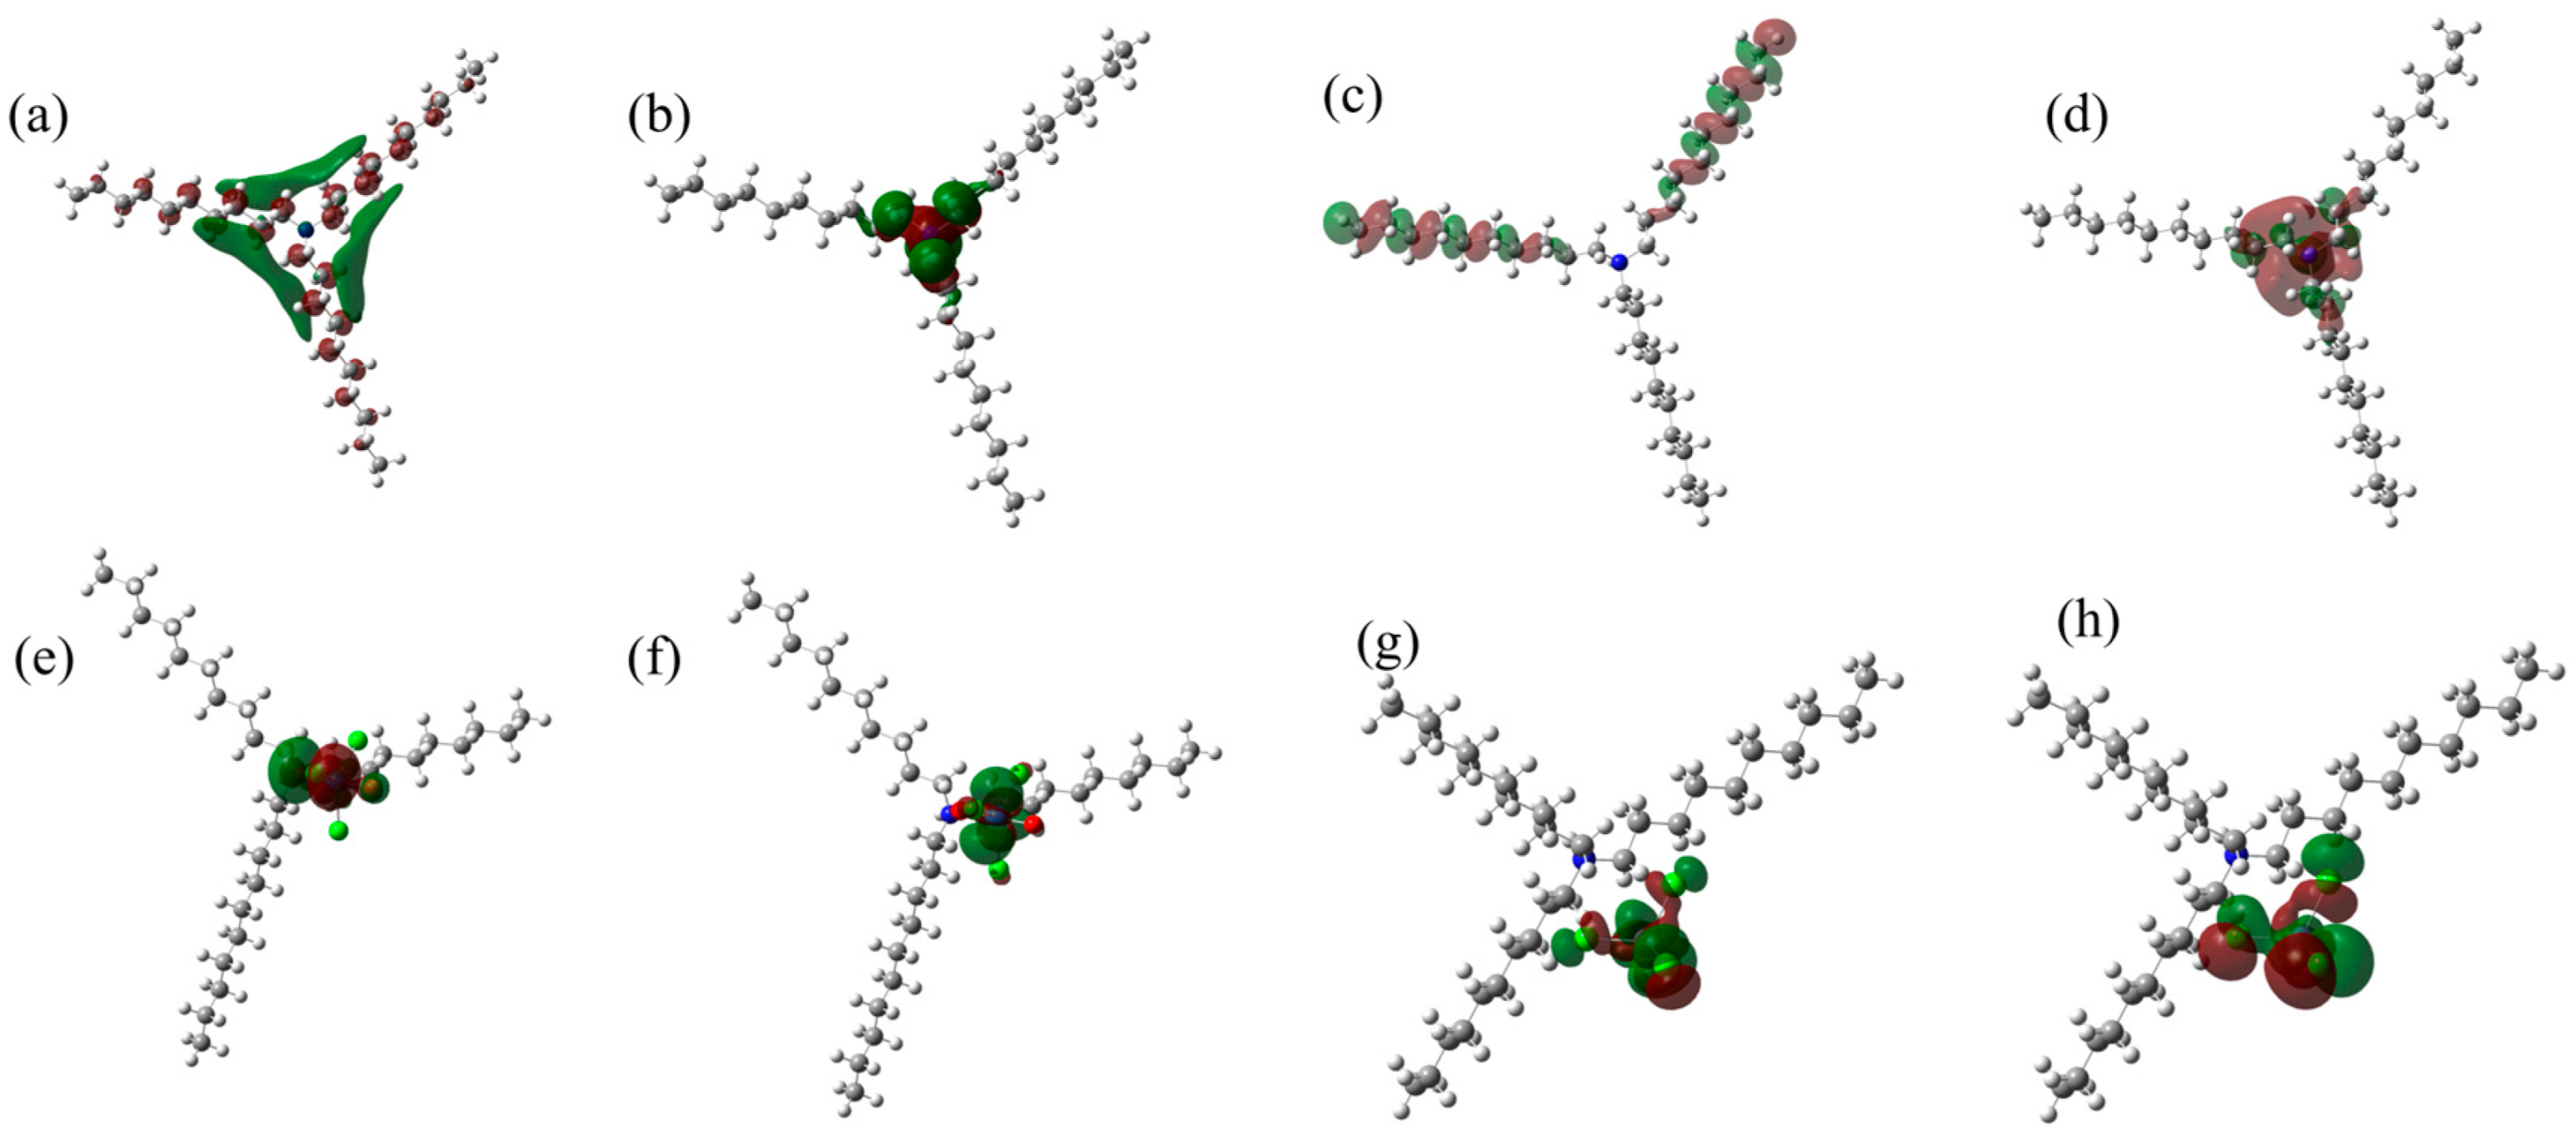
The HOMO and LUMO orbitals of TNDA and TNDA·H+ were calculated and the results are shown in Figure 12a–d and Table S9. The HOMO–LUMO energy gap of protonated TNDA (TNDA·H+) is significantly larger than that of neutral TNDA (9.43 eV vs. 6.46 eV), demonstrating enhanced structural stability after protonation [37].
Uranium and iron ions are mainly in the species of UO2Cl3 and FeCl4 in highly concentrated HCl solutions [36,38]. The main binding sites towards UO2Cl3 and FeCl4 are at the center of TNDA after protonation, as shown in Figure 13. The stability of the system was analyzed by calculating the harmonic vibration frequencies. The Gibbs free energy of the reaction was calculated from a thermodynamic perspective. The calculated ΔG values are all negative, as shown in Table S10, which indicates that the adsorption process is spontaneous. The HOMO and LUMO orbitals that bind U and Fe ions are shown in Figure 12e–h, and only one set of data is taken because the structure is an open-shell layer structure. As shown in Table S9, the energy difference between the HOMO and LUMO energies of bound Fe are both larger than those of bound U—the differences are 3.21 eV and 3.97 eV, respectively, so TNDA is preferentially adsorbed Fe ions, which verifies our experimental results.

4. Conclusions

A novel mesoporous-dominated TNDA/SiO2-P adsorbent was prepared by a vacuum impregnation method for the efficient removal of U and Fe from REEs. The adsorbent exhibits excellent adsorption selectivity towards U and Fe in highly concentrated HCl solutions, with a separation factor higher than 20,147 for SFU/REE and 88128 for SFFe/REEs. The adsorption of U and Fe is in agreement with the pseudo-second-order kinetics model and the Langmuir isotherm model, with an adsorption capacity of approximately 62.4 mg/g and 28 mg/g, respectively, in a 5 M HCl solution, and equilibrium is reached within 120 min. After five column test cycles, it still maintains excellent separation performance and stability. The functional groups do not shift after the cycles, and the leakage rate is less than 2% according to a TOC test at 353 K. Deep and efficient removal of U and Fe can be achieved from almost all REEs through continuous column experiments. The adsorption and selectivity mechanism is speculated to be the anion exchange between (TNDAH+/SiO2-P) Cl and UO2Cl3 or FeCl4 under high HCl concentrations. In summary, TNDA/SiO2-P has the potential to be used for the efficient removal of uranium and iron from rare earth elements in hydrochloric acid media. TNDA/SiO2-P is expected to achieve deep removal of trace impurities (U and Fe) in real rare earth oxides.

Supplementary Materials

The following supporting information can be downloaded at: https://www.mdpi.com/article/10.3390/met15101064/s1, Figure S1: Adsorption behaviors of TNDA/SiO2-P: effect of (a) H2SO4 concentration, (b) HNO3 con-centration. solid and liquid ratio of 0.025 g/5 mL (T = 298 K, t = 12 h, [M] = 1 mmol/L.; Figure S2: intra-particle diffusion models (a) U (b) Fe.; Figure S3: Redlich-Petersin models (a) U (b) Fe, Temkin model (c) U (d) Fe, Dubinin-Radushkevich model (e) U (f) Fe.; Figure S4: Breakthrough curves of U (U = 10 ppm, adsorbent: 1 g).; Table S1: The structure parameters of SiO2, SiO2-P and TNDA/SiO2-P.; Table S2: Kinetic parameters of adsorption of U and Fe by TNDA/SiO2-P at 298, 323, 353 K.; Table S3: The main fitting parameters of U and Fe by the three resins.; Table S4: Adsorption isotherms parameters values of U and Fe.; Table S5: Thermodynamics parameters of U and Fe by TNDA/SiO2-P.; Table S6: Variables and their levels used for Box-Behnken design.; Table S7: Box-Behnken design matrix and corresponding experimental results (U).; Table S8: Box-Behnken design matrix and corresponding experimental results (Fe).; Table S9: Energy magnitudes corresponding to HUMO and LUMO orbits.; Table S10: Gibbs free energy of the reaction. References [39,40,41,42] are cited in the supplementary materials.

Author Contributions

Conceptualization, J.L., L.C. and S.N.; methodology, Z.Y. (Zihang Yi) and S.Z.; software, J.L.; validation, S.Z., S.N. and Y.W.; formal analysis, M.F.H. and Z.Y. (Zhifu Ye); investigation, Z.Y. (Zhifu Ye), S.Z. and M.F.H.; resources, S.N., M.F.H. and Y.W.; data curation, Z.Y. (Zihang Yi) and J.L.; writing—original draft preparation, Z.Y. (Zihang Yi); writing—review and editing, L.C., and S.N.; visualization, M.F.H., L.C. and Z.Y. (Zhifu Ye); supervision, S.N.; project administration, S.N. and Y.W.; funding acquisition, S.N. All authors have read and agreed to the published version of the manuscript.

Funding

This research was supported by the National Key R&D Program of China [2022YFB3506100] and the Science and Technology Innovation Program of Hunan Province [2023RC1067].

Data Availability Statement

The original contributions presented in this study are included in the article/Supplementary Materials. Further inquiries can be directed to the corresponding author.

Conflicts of Interest

The authors declare no conflicts of interest.

References

  1. Praneeth, S.; Sakr, A.K.; Roy, P.K.; Dittrich, T.M. Efficient recovery of gadolinium from magnetic resonance imaging patient urine using a diglycolamide ligand-functionalized sorbent system. Environ. Chem. Lett. 2025, 23, 937–942. [Google Scholar] [CrossRef]
  2. Zhou, H.; Wang, J.; Yu, X.; Kang, J.; Qiu, G.; Zhao, H.; Shen, L. Effective extraction of rare earth elements from ion-adsorption type rare earth ore by three bioleaching methods. Sep. Purif. Technol. 2024, 330, 125305. [Google Scholar] [CrossRef]
  3. Yan, Q.; Liu, C.; Zhang, X.; Lei, L.; Xiao, C. Selective Dissolution and Separation of Rare Earths Using Guanidine-Based Deep Eutectic Solvents. Acs Sustain. Chem. Eng. 2021, 9, 8507–8514. [Google Scholar] [CrossRef]
  4. Hong, J.; Tian, H.; Zhang, L.; Zhou, X.; del Rosal, I.; Weng, L.; Maron, L. Reversing Conventional Reactivity of Mixed Oxo/Alkyl Rare-Earth Complexes: Non-Redox Oxygen Atom Transfer. Angew. Chem.-Int. Ed. 2018, 57, 1062–1067. [Google Scholar] [CrossRef] [PubMed]
  5. Jin, C.; Yang, X.; Fang, D.; Ni, S.; Wang, S.; Ding, A.; Cen, P.; Xiao, C. Selective separation of radioactive thorium and uranium from scandium using N-heterocyclic carboxamide ligands. Sep. Purif. Technol. 2024, 328, 125028. [Google Scholar] [CrossRef]
  6. He, D.; Ning, S.; Liu, J.; Zhang, S.; Chen, L.; Xu, Y.; Feng, Z.; Hamza, M.F.; Wei, Y. Efficiently selective removal of radioactive thorium and uranium from rare earths by trialkyl phosphine oxide modified porous silica-polymer based adsorbent. Sep. Purif. Technol. 2025, 364, 132426. [Google Scholar] [CrossRef]
  7. Wang, H.; Wang, J.; Lei, X.; Wen, X.; Li, D.; Liu, F.; Zhou, W.; Xu, S. Separation and Recovery of Rare Earths and Iron from NdFeB Magnet Scraps. Processes 2023, 11, 2895. [Google Scholar] [CrossRef]
  8. Liu, F.; Porvali, A.; Wang, J.; Wang, H.; Peng, C.; Wilson, B.P.; Lundstrom, M. Recovery and separation of rare earths and boron from spent Nd-Fe-B magnets. Miner. Eng. 2020, 145, 106097. [Google Scholar] [CrossRef]
  9. Gopalakrishnan, A.; Asare, S.; Adu-Boahene, F.; Schafer, A.I. Uranium adsorption by iron modified zeolite and zeolite composite membranes. Chemosphere 2024, 368, 143711. [Google Scholar] [CrossRef] [PubMed]
  10. Yuan, D.; Zhang, S.; Tan, J.; Dai, Y.; Wang, Y.; He, Y.; Liu, Y.; Zhao, X.; Zhang, M.; Zhang, Q. Highly efficacious entrapment of Th (IV) and U (VI) from rare earth elements in concentrated nitric acid solution using a phosphonic acid functionalized porous organic polymer adsorbent. Sep. Purif. Technol. 2020, 237, 116379. [Google Scholar] [CrossRef]
  11. Tuzen, M.; Sari, A.; Saleh, T.A. Synthesis, characterization and evaluation of carbon nanofiber modified-polymer for ultra-removal of thorium ions from aquatic media. Chem. Eng. Res. Des. 2020, 163, 76–84. [Google Scholar] [CrossRef]
  12. Tang, X.-Y.; Zhang, H.-D.; Li, Z.-J.; Wang, S.; Liu, S.-Y.; Xiu, T.-Y.; Yu, J.-P.; Wang, L.; Yuan, L.-Y.; Wu, W.-S.; et al. Synthesis of phosphorylated covalent organic frameworks with different linkages-Critical factors controlling the extraction of uranium from highly acidic media. Chem. Eng. J. 2025, 507, 160226. [Google Scholar] [CrossRef]
  13. Jiao, R.; Chen, Z.; Zeng, S.; Wang, D.; Li, J. Electrosorption of uranium (VI) by sulfonic acid-decorated FeOOH nanorods. J. Environ. Chem. Eng. 2023, 11, 111275. [Google Scholar] [CrossRef]
  14. Cui, J.; Chen, L.; Lou, Z.; Shan, W.; Xiong, Y. Noncovalent functionalization of graphene via perylene bisimide-amidoxime for highly efficient capture of uranium. Sep. Purif. Technol. 2025, 361, 131434. [Google Scholar] [CrossRef]
  15. Yang, B.; Zhang, X.; Tan, S.; Wang, H.; Kuang, S.; Liu, X.; Liao, W. Ultra-selective removal of thorium from rare earths by aminophosphonic acid-modified porous silica. Sep. Purif. Technol. 2024, 341, 126952. [Google Scholar] [CrossRef]
  16. Wang, Z.; Su, D.; Luo, T.; Yu, Q.; Wang, Y.; Liu, X.; Huang, X.; Ding, S. Highly Selective Separation of Thorium Using an Extraction Resin by Encapsulating an Amine-Based Ionic Liquid In Situ within a Porous Silica-Polymer Matrix Instead of Conventional Impregnation Method. Acs Sustain. Chem. Eng. 2025, 13, 5269–5281. [Google Scholar] [CrossRef]
  17. Shi, J.; Wang, J.; Wang, W.; Wu, X.; Wang, H.; Li, J. Efficient and Selective Removal of Palladium from Simulated High-Level Liquid Waste Using a Silica-Based Adsorbent NTAamide(C8)/SiO2-P. Nanomaterials 2024, 14, 544. [Google Scholar] [CrossRef]
  18. Zhang, S.; Huang, Q.; Chen, L.; Zhong, Y.; Hu, F.; Wu, K.; Yin, X.; Wei, Y.; Ning, S. Phosphination of amino-modified mesoporous silica for the selective separation of strontium. J. Hazard. Mater. 2024, 467, 133741. [Google Scholar] [CrossRef] [PubMed]
  19. Frisch, M.J.; Trucks, G.W.; Schlegel, H.B.; Scuseria, G.E.; Robb, M.A.; Cheeseman, J.R.; Scalmani, G.; Barone, V.; Petersson, G.A.; Nakatsuji, H.; et al. Gaussian 16 Rev. C.01; Gaussian, Inc.: Wallingford, CT, USA, 2016. [Google Scholar]
  20. Zhang, S.; Huang, Q.; Chen, L.; Zhang, W.; Yin, X.; Wei, Y.; Ning, S. Efficient separation of strontium in different environments with novel acid-resistant silica-based ion exchanger. Sep. Purif. Technol. 2023, 322, 124347. [Google Scholar] [CrossRef]
  21. Soderholm, L.; Skanthakumar, S.; Wilson, R.E. Structural Correspondence between Uranyl Chloride Complexes in Solution and Their Stability Constants. J. Phys. Chem. A 2011, 115, 4959–4967. [Google Scholar] [CrossRef]
  22. Yao, J.; Zhang, S.; Yan, Z.C.; Li, D.-S.; Wang, Y.; An, W.; Yang, H.Y. Effect of protonation and deprotonation on oxygen-containing groups functionalized graphene for boron adsorption removal. Desalination 2024, 583, 117692. [Google Scholar] [CrossRef]
  23. Isik, B.; Kurtoglu, A.E.; Gurdag, G.; Keceli, G. Radioactive cesium ion removal from wastewater using polymer metal oxide composites. J. Hazard. Mater. 2021, 403, 123652. [Google Scholar] [CrossRef]
  24. Hamza, M.F.; Wei, Y.; Khalafalla, M.S.; Abed, N.S.; Fouda, A.; Elwakeel, K.Z.; Guibal, E.; Hamad, N.A. U(VI) and Th(IV) recovery using silica beads functionalized with urea- or thiourea-based polymers—Application to ore leachate. Sci. Total Environ. 2022, 821, 153184. [Google Scholar] [CrossRef]
  25. Tangde, V.M.; Prajapati, S.S.; Mandal, B.B.; Kulkarni, N.P. Study of Kinetics and Thermodynamics of Removal of Phosphate from Aqueous Solution using Activated Red Mud. Int. J. Environ. Res. 2017, 11, 39–47. [Google Scholar] [CrossRef]
  26. Xu, S.; Ning, S.; Wang, Y.; Wang, X.; Dong, H.; Chen, L.; Yin, X.; Fujita, T.; Wei, Y. Precise separation and efficient enrichment of palladium from wastewater by amino-functionalized silica adsorbent. J. Clean. Prod. 2023, 396, 136479. [Google Scholar] [CrossRef]
  27. Tang, W.; Huang, H.; Gao, Y.; Liu, X.; Yang, X.; Ni, H.; Zhang, J. Preparation of a novel porous adsorption material from coal slag and its adsorption properties of phenol from aqueous solution. Mater. Des. 2015, 88, 1191–1200. [Google Scholar] [CrossRef]
  28. Kenawy, I.M.M.; Eldefrawy, M.M.; Eltabey, R.M.; Zaki, E.G. Melamine grafted chitosan-montmorillonite nanocomposite for ferric ions adsorption: Central composite design optimization study. J. Clean. Prod. 2019, 241, 118189. [Google Scholar] [CrossRef]
  29. Lefévre, G.; Noinville, S.; Fédoroff, M. Study of uranyl sorption onto hematite by in situ attenuated total reflection-infrared spectroscopy. J. Colloid Interface Sci. 2006, 296, 608–613. [Google Scholar] [CrossRef]
  30. Wen, C.; Yao, Y.; Meng, L.; Duan, E.; Wang, M.; Chen, Z.; Wang, X. Photocatalytic and Electrocatalytic Extraction of Uranium by COFs: A Review. Ind. Eng. Chem. Res. 2023, 62, 18230–18250. [Google Scholar] [CrossRef]
  31. Wang, S.; Ma, J.; Wang, C.; Xi, W.; Bai, Y.; Lu, W.; Wang, J. Elimination of radionuclide uranium (VI) from aqueous solutions using an α-MnO2@CTS composite adsorbent. J. Mol. Liq. 2022, 360, 119448. [Google Scholar] [CrossRef]
  32. He, X.; Feng, W.; Wang, Z.; Ning, S.; Lv, L.; Chen, L.; Li, W.; Yin, X.; Wei, Y.; Watabe, H. An advanced separation method for the acquisition of 212Pb/212Bi from natural thorium. Chem. Eng. J. 2024, 502, 157971. [Google Scholar] [CrossRef]
  33. Reda, A.T.; Zhang, D.; Lu, X. Rapid and selective uranium adsorption by glycine functionalized europium hydroxide. Colloids Surf. A Physicochem. Eng. Asp. 2018, 556, 299–308. [Google Scholar] [CrossRef]
  34. Peng, T.-Q.; Wang, Y.-F.; Xu, Y.-F.; Liu, Z.-C. Synthesis, characterization and uranium (VI) adsorption mechanism of novel adsorption material poly(tetraethylenepentamine–trimesoyl chloride). J. Radioanal. Nucl. Chem. 2023, 332, 409–422. [Google Scholar] [CrossRef]
  35. Schio, L.; Li, C.; Monti, S.; Salen, P.; Yatsyna, V.; Feifel, R.; Alagia, M.; Richter, R.; Falcinelli, S.; Stranges, S.; et al. NEXAFS and XPS studies of nitrosyl chloride. Phys. Chem. Chem. Phys. 2015, 17, 9040–9048. [Google Scholar] [CrossRef]
  36. Uchikoshi, M.; Akiyama, D.; Kimijima, K.I.; Shinoda, K. The Distribution and Structures of Ferric Aqua and Chloro Complexes in Hydrochloric Acid Solutions. ISIJ Int. 2022, 62, 912–921. [Google Scholar] [CrossRef]
  37. Yu, F.-D.; Zhao, J.-Z.; Wang, H.-N.; Wu, J.-H.; Lan, Z.; Xie, Y.-M.; Que, L.-F. Unveiling the Chemical Heterogeneity and Structural Evolution in Oxide Cathodes During Ion Exchange. Adv. Funct. Mater. 2025, 35, 2501977. [Google Scholar] [CrossRef]
  38. Buehl, M.; Sieffert, N.; Golubnychiy, V.; Wipff, G. Density functional theory study of uranium(VI) aquo chloro complexes in aqueous solution. J. Phys. Chem. A. 2008, 112, 2428–2436. [Google Scholar] [CrossRef]
  39. Zou, Q.; Wu, Y.; Shu, Q.; Ning, S.; Wang, X.; Wei, Y.; Tang, F. Separation of Palladium along with Minor Actinides by isoBu-BTP/SiO2-P Adsorbent from High-Level Liquid Waste. J. Chem. Eng. Data. 2018, 63, 2931–2939. [Google Scholar] [CrossRef]
  40. Ho, Y.S. Review of second-order models for adsorption systems. J. Hazard. Mater. 2006, 136, 681–689. [Google Scholar] [CrossRef]
  41. Xie, Y.; Chen, C.; Ren, X.; Tan, X.; Song, G.; Chen, D.; Alsaedi, A.; Hayat, T. Coupling g-C3N4 nanosheets with metal-organic frameworks as 2D/3D composite for the synergetic removal of uranyl ions from aqueous solution. J. Colloid Interface Sci. 2019, 550, 117–127. [Google Scholar] [CrossRef]
  42. Tiwari, D.; Bhunia, H.; Bajpai, P.K. Adsorption of CO2 on KOH activated, N-enriched carbon derived from urea formaldehyde resin: Kinetics, isotherm and thermodynamic studies. Appl. Surf. Sci. 2018, 439, 760–771. [Google Scholar] [CrossRef]
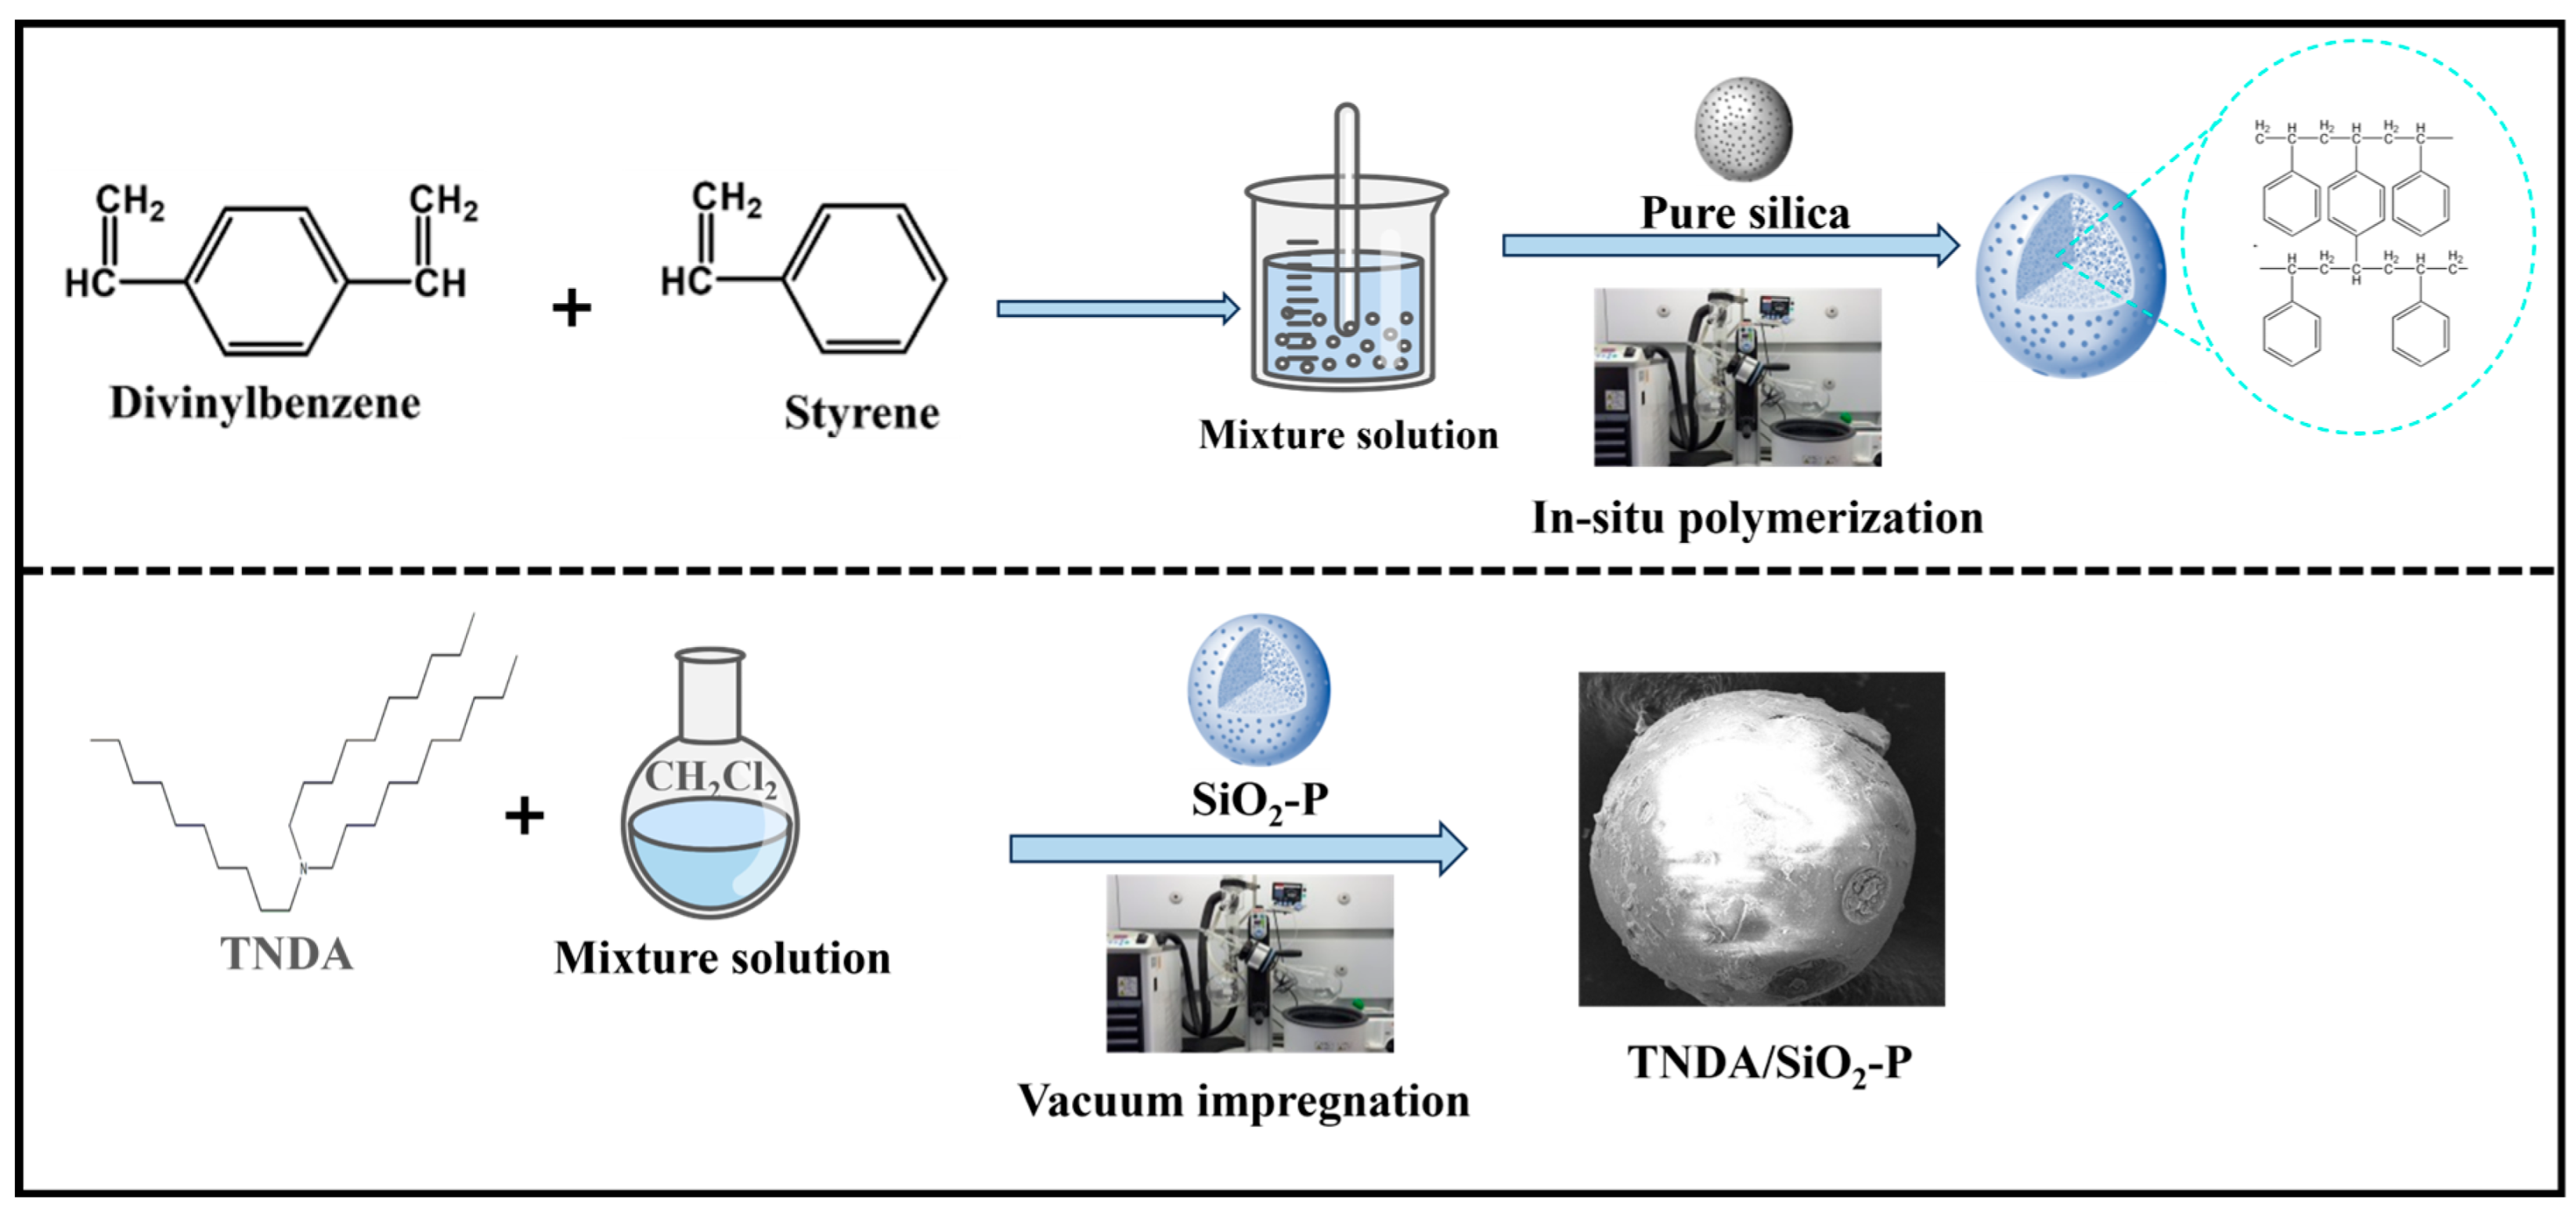
Figure 1. Schematic of the synthesis of TNDA/SiO2-P.
Metals 15 01064 g001
Figure 2. Diagram of the column separation system.
Metals 15 01064 g002
Figure 3. Characterization of the materials: (a) SEM–EDS analysis; (b) N2 adsorption–desorption isotherms; (c) pore size distributions of SiO2, SiO2-P and TNDA/SiO2-P; (d) SiO2-P TG-DSC analysis; (e) TNDA/SiO2-P TG-DSC analysis.
Metals 15 01064 g003
Figure 4. Adsorption behaviors of TNDA/SiO2-P: effect of (a) HCl concentration, (b) solid–liquid ratio on La, (c) solid–liquid ratio on Sc, and (d) adsorption towards REEs and trace U, and Fe at a solid–liquid ratio of 2.5 g/L (T = 298 K, t = 12 h, [M] = 1 mmol/L for (ac), U or Fe = 1 ppm for (d), REEs = 1000 ppm for (d), m/V = 0.025 g/5 mL for (a), and C HCl = 5 M for (bd)).
Metals 15 01064 g004
Figure 5. Adsorption of TNDA/SiO2-P towards U(VI) and Fe(III): (a) adsorption kinetics of (a) U(VI) and (b) Fe(III), adsorption isotherm of (c) U(VI) and (d) Fe(III), and plots of LnKL versus 1/T for (e) U and (f) Fe (C0 = 500 ppm for (a,b), m/V = 2.5 g/L, CHCl =5 M, and t = 12 h for (c,d)).
Metals 15 01064 g005
Figure 6. Response surface plots of U and Fe adsorption capacity versus three variables: (ac) U; (df) Fe.
Metals 15 01064 g006
Figure 7. Desorption of Fe and U with different eluents (a: UP water, b: 0.1 M EDTA, c: 0.5 M TU, d: 0.1 M DTPA, e: 0.1 M EDTA-2Na, and f: 0.1 M HCl).
Metals 15 01064 g007
Figure 8. Column experiments: (a) separation of trace amounts of uranium and iron from high-concentration lanthanum solutions, (b) separation of trace amounts of uranium and iron from high-concentration scandium solutions, (c) and (d) column separation results of TNDA/SiO2-P towards U and Fe from REEs, (e) column separation results of TNDA/SiO2-P towards U from Sc, and (f) breakthrough curves at different flow rates (T = 298 K, adsorbent: 1 g, I: 5 M HCl, II: feed solution, III: 5 M HCl, and IV: 0.1 M HCl).
Metals 15 01064 g008
Figure 9. Stability and reusability of TNDA/SiO2-P. (a) Column experimental cycle (Cmetals = 1 mmol/L, T = 298 K adsorbent: 1 g), (b) FT-IR spectra before and after recycling, and (c) evaluation of temperature resistance and stability of TNDA/SiO2-P (CU = 500 ppm and CFe = 500 ppm).
Metals 15 01064 g009
Figure 10. XPS and FT-IR analysis: (a) FT-IR spectra; (b) XPS full spectra; high-resolution XPS spectra of (c) U and (d) Fe, (e) N1s, and (f) Cl 2p.
Metals 15 01064 g010
Figure 11. ESP images before and after TNDA protonation, blue area: positive charge and red area: negative charge: (a) TNDA and (b) TNDA·H+ (C–grey ball, H–white ball, and N–blue ball).
Metals 15 01064 g011
Figure 12. HOMO and LUMO of TNDA and TNDA·H+ complexes with U or Fe: (a,b) TNDA; (c,d) TNDA·H+; (e,f) U-TNDA·H+; (g,h) Fe-TNDA·H+ (C–grey ball, O–red ball, H–white ball, N–blue ball, Cl–green ball, U–blue ball, and Fe–purple ball).
Metals 15 01064 g012
Figure 13. NPA charge distributions and molecular surface electrostatic potentials for (a,b) U-TNDA·H+; (c,d) Fe−TNDA·H+ (C—grey ball, O—red ball, H—white ball, N-blue ball, Cl—green ball, U—blue ball, and Fe—purple ball).
Metals 15 01064 g013
Disclaimer/Publisher’s Note: The statements, opinions and data contained in all publications are solely those of the individual author(s) and contributor(s) and not of MDPI and/or the editor(s). MDPI and/or the editor(s) disclaim responsibility for any injury to people or property resulting from any ideas, methods, instructions or products referred to in the content.