Article

Formation of Stainless Steel Welded Joints Produced with the Application of Laser and Plasma Energy Sources

1
China-Ukraine Institute of Welding, Guangdong Academy of Sciences, 363 Changxing Road, Tianhe, Guangzhou 510650, China
2
E.O. Paton Electric Welding Institute, National Academy of Sciences of Ukraine, 11 Kazymyr Malevych St., 03150 Kyiv, Ukraine
3
Welding Department, National Technical University of Ukraine «Igor Sikorsky Kyiv Polytechnic Institute», 37, Peremohy Ave, 03056 Kyiv, Ukraine
4
State Key Laboratory of Advanced Design and Manufacturing for Vehicle Body, Hunan University, Changsha 410082, China
*
Author to whom correspondence should be addressed.
Metals 2024, 14(6), 706; https://doi.org/10.3390/met14060706
Submission received: 11 April 2024 / Revised: 30 May 2024 / Accepted: 4 June 2024 / Published: 14 June 2024
(This article belongs to the Special Issue Advanced Laser Welding Technologies for Metals and Alloys)

Abstract

The objective of this study is to investigate the formation of the structure and stress–strain state in the joints of AISI 304 stainless steel with a thickness of 2 mm and produced by welding with laser and plasma energy sources. It is established that the microhardness and parameters of the grain and subgrain structures of the welded joint material differ with respect to the dimensions of crystallites, grains, and subgrains according to the welding process. It is shown that, in terms of structure formation, including substructural features, the most favorable structures of 2 mm AISI 304 welded joints are formed by laser–plasma welding. It is predicted that the residual stressed state is less localized with the application of laser–plasma welding than laser welding, and it is characterized by a lower level of residual stresses compared to plasma welding. In all the cases, the maximal stress values are concentrated in the HAZ, and the value obtained using laser–plasma welding is in an intermediate position (431.7 MPa) between those of the laser (443 MPa) and plasma (413.7 MPa) processes. With laser–plasma and laser welding, displacements (deformations) are minimal and close to 0.2 mm. The method of electron speckle interferometry was used, and the results reveal that the error between the calculated and experimental values of equivalent stresses is no more than 6%, which is acceptable. The results of mechanical testing show that, under uniaxial tension, the strength of the welded joints made of AISI 304 steel using laser–plasma and laser welding is the highest and equal to 97% of that of the base metal.

Graphical Abstract

1. Introduction

The British scientist W. M. Steen is believed to be the founder of the simultaneous use of a laser beam and electric arc for welding. He proposed making an impact using both energy sources on a product within one heating zone. The synergic effects of a laser beam and electric arc in the same weld pool result in an increase in welding speed and penetration depth, along with an enhancement of the gap bridging capability and process stability [1]. These advantages have contributed to the fact that, in the last two decades, the industrial use of hybrid laser–arc welding processes has become increasingly popular [2]. Laser–plasma processes, particularly those of stainless steels, occupy a special place among them [3]. The authors of [4] concluded that no direct interaction between two heat sources enhance the energy transfer into a workpiece. Instead, the improved process performance is a result of a more efficient energy usage inside the molten pool [5].
It is known that laser welding with deep penetration is based on the formation and containment of the vapor–gas channel (keyhole) [6,7]. The keyhole also forms in the case of laser–plasma welding [8]. However, according to the data of [9], when there is simultaneous action of the laser and plasma sources in one zone of the product being welded, the plasma arc pressure facilitates keyhole formation by means of laser radiation, creating the conditions for lowering its power. Previous experiments on laser–plasma welding of 6 mm steel plates at a laser power of up to 5 kW and an arc current of up to 150 A achieved an increase in the speed of full penetration welding by 100% or an increase in penetration depth by 25–100% compared to the use of laser only [10]. Moreover, experiments showed that laser and laser–plasma processes promoted an increase in corrosion resistance of the welded joints [11,12].
Laser–plasma welding of stainless steels can be applied in carriage building, for welding tanks (railways, trucks, and stationary equipment), in the chemical industry, for manufacturing of cars and small-sized vessels, and in instrument making [13,14]. The prevailing expediency of such a method is butt welding of blanks with edges of 1–10 mm in thickness [15]. It is exactly with such thicknesses that the following characteristic advantages of the laser–plasma welding process can be ensured: considerable process speeds, reduced residual strains and stresses, mechanical properties of the produced joints becoming close to those of the base metal, and lowered equipment cost due to the partial replacement of the laser power by plasma power [16].
However, the realization of the above-mentioned industrial applications of laser–plasma welding of stainless steels requires the availability of certain procedures to predict the residual stress–strain state and assess the formation of specific structures of the welded joint metal, as well as its respective mechanical properties [17,18]. An assessment of these factors will facilitate the optimized selection of mode parameters based on the criteria of minimizing the residual equivalent stresses and improving the mechanical properties.
The objective of this work was to study the impact of laser and plasma heat sources on the processes of laser, plasma, and laser–plasma welding of stainless steel, including the formation of the characteristic structures, the residual stress–strain state, and the mechanical properties of the joints.
To achieve this goal, the following tasks were performed: studying the features of the formation of the structure of stainless steel welds during laser, plasma, and laser–plasma welding; modeling the influence of the welding process on the stress–strain state of welded joints; experimental assessment of the residual stresses in the welded joints and verification of the results of theoretical studies; and studying the influence of the welding process on the physical and mechanical properties of the welded joints.
The welding modes (laser, plasma, and laser–plasma) were selected according to the criterion of achieving the formation of high-quality welds. Welds were obtained without undercuts and pores, and they showed a lack of penetration and other characteristic defects. Afterwards, the heat input, residual deformations, and stresses of these welded joints were studied. This allowed the prediction of which of the considered welding methods is more promising for industrial use.

2. Materials and Methods

Samples of stainless steel AISI 304 sheets were used in this work to conduct the experiments (Table 1). The sample dimensions were selected in the range of (100–200) × (100–200) × 2 mm. The structure of the base metal made of 2 mm thick AISI 304 steel was austenitic with a grain size of Dg = 5–20 µm and a microhardness of HV 0.1 of 202–253 (Figure 1).
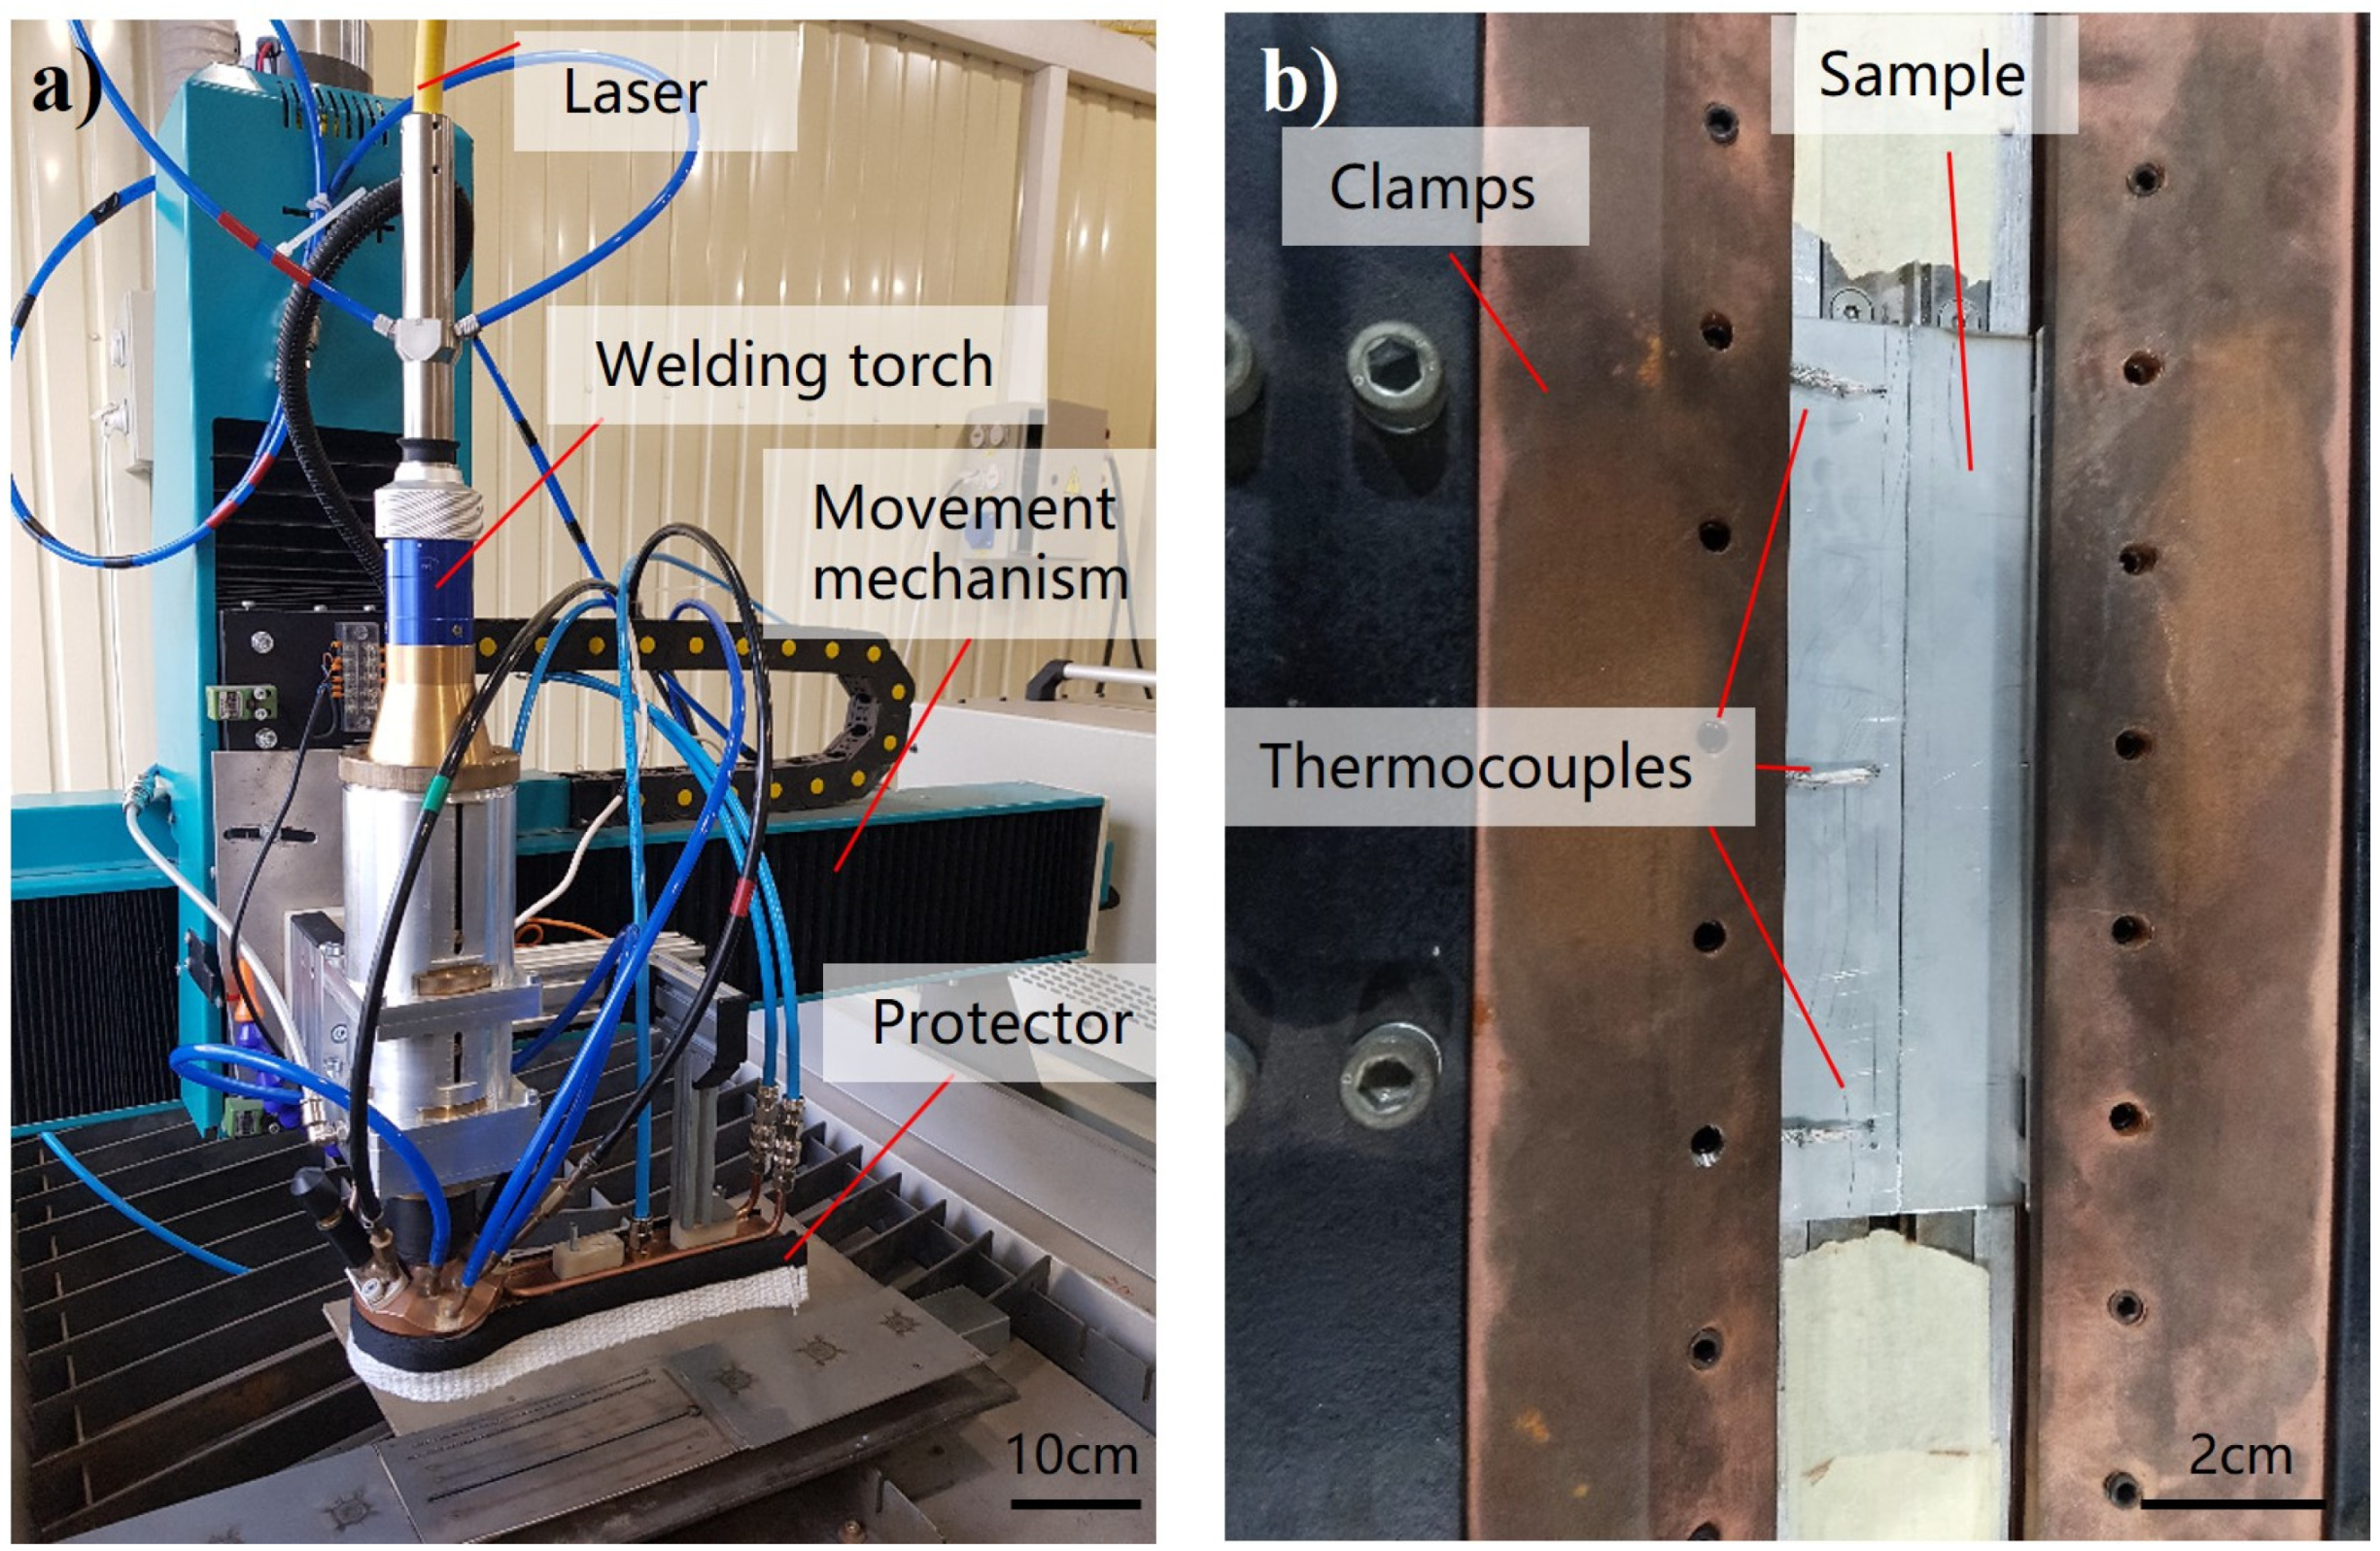
The experiments were conducted according to a coaxial scheme (with the focused laser beam in the central position and the tungsten electrode in an inclined position), using the equipment shown in Figure 2a. The samples were butt-fixed in the clamp for welding. The welding thermal cycles were recorded using MAX6675 thermocouples (TENSTAR ROBOT, Shenzhen, China), which allow measurements of up to 1000 °C in temperature within an accuracy of 2.5 °C. The thermocouples (in the quantity of 3 pcs. per sample) were located in the base metal of the samples along the weld in the start, middle, and end zones at a distance of 5–20 mm from the weld axis (Figure 2b).
The structures of the metal of the welds and heat-affected zone (HAZ) were studied using the methods of light microscopy (Neophot-32 microscope, Carl Zeiss, Jena, Germany). Metal microhardness was measured according to the Vickers test with 100 gf load using a hardness meter M400 (LECO, St. Joseph, MI, USA) in triplicate, and the mean value was taken as the sample’s hardness value. Microstructural studies were conducted using scanning electron microscopy with a Mira 3 LMU microscope (Tescan VEGA, Brno, Czech Republic) at an accelerating voltage of 30 kV, according to the method described in [19]. Mechanical testing was performed using a versatile servo–hydraulic complex MTS 318.25 testing machine (MTS Systems Corporation, Eden-Prairie, MN, USA) with a maximal force of 250 kN.
The mechanical test data of the welded samples were compared with the mechanical characteristics of the base metal; the latter were derived from the results of mechanical testing for static tension, which was performed using the MTS 318.25 testing machine (Table 2).
The stressed state of the welded joint samples was measured using the method of electron speckle interferometry. This method is based on the measurement of displacements during elastic unloading of a metal volume in the studied points on the sample surface, caused by drilling blind holes of about 1 mm diameter using a specialized drilling device [20].
Joints of the 2 mm thick AISI 304 steel were produced via laser, plasma, and laser–plasma welding. The parameters of these welding modes were selected based on the criterion of satisfactory weld formation (Table 3) [21].
Finite element modeling of the stress–strain state of the AISI 304 steel welded joints was performed using a model consisting of 60,960 prismatic elements and 73,382 nodes [22]. To determine the stress–strain state, modeling of the heating of the parts being welded according to the welding thermal cycles was first performed. This was followed by establishing the residual stresses and strains. The temperature distribution in the parts being welded was determined using a model of heating of plates with thickness H during time t by a heat source with specific energy q [23]:
C ( T ) ρ ( T ) T t = z λ T T z ,   0 < z < H , t > 0
where C(T), ρ(T) and λ(T) are the effective heat capacity of metal (allowing for latent heat of melting), density, and thermal conductivity coefficient, respectively. The boundary conditions for Equation (1) were determined according to the following equation:
T z z = H = 0 ; λ ( T ) T z z = 0 = q q r q e v
where q r ( T s ) = ε σ ( T s 4 T 0 4 ) denotes the heat losses through radiation from the surface into the environment; ε is the degree of blackness of the metal surface, represented by the Stefan–Boltzmann constant; T 0 is the ambient temperature; q e v ( T s ) = κ q m ( T s ) is the specific heat loss due to vapor formation; κ is the specific heat of vapor formation, q m ( T s ) = ρ _ u _ is the specific mass flow of vapor; and ρ _ and u _ denote the metal vapor density and speed of its expansion near the evaporating surface, respectively. The initial condition for Equation (1) was determined according to the following equation:
      T ( z , 0 ) = T 0 , 0 < z < H
Each joint consisted of two plates of the following dimensions: Plate 1 with dimensions of 200 ×100 × 2 mm and Plate 2 with dimensions of 200 × 100 × 2 mm. These plates were assembled end-to-end with zero gap for further longitudinal welding (Figure 3a).
In the zone of intensive heating of a welded joint, the finite element grid was irregular. The dimensions of the 3D elements were selected as follows to allow for the desired values of temperature gradients and stress–strain components: 0.3 × 0.3 × 0.25, 0.6 × 0.6 × 0.5 and 1.25 × 1.25 × 1.0 mm. Beyond the limits of the area heated up to high temperatures, the finite element dimensions were increased to 2.5 × 2.5 × 1.0 and 5.0 × 5.0 × 1.0 mm to shorten the calculation time. The transition between the zones modeled by elements with different dimensions of grid cells was ensured by employing finite elements with rectangular/trapezoidal cells of appropriate dimensions.
Welding was performed on a 40 mm thick “Back-Plate” backing with milled-out slots of the keyhole type. The plates to be welded were fastened along the direction of welding by Clamps 1 and 2 (clamping pressure of 400–500 MPa), the distance between which was 60 mm (Figure 3b).
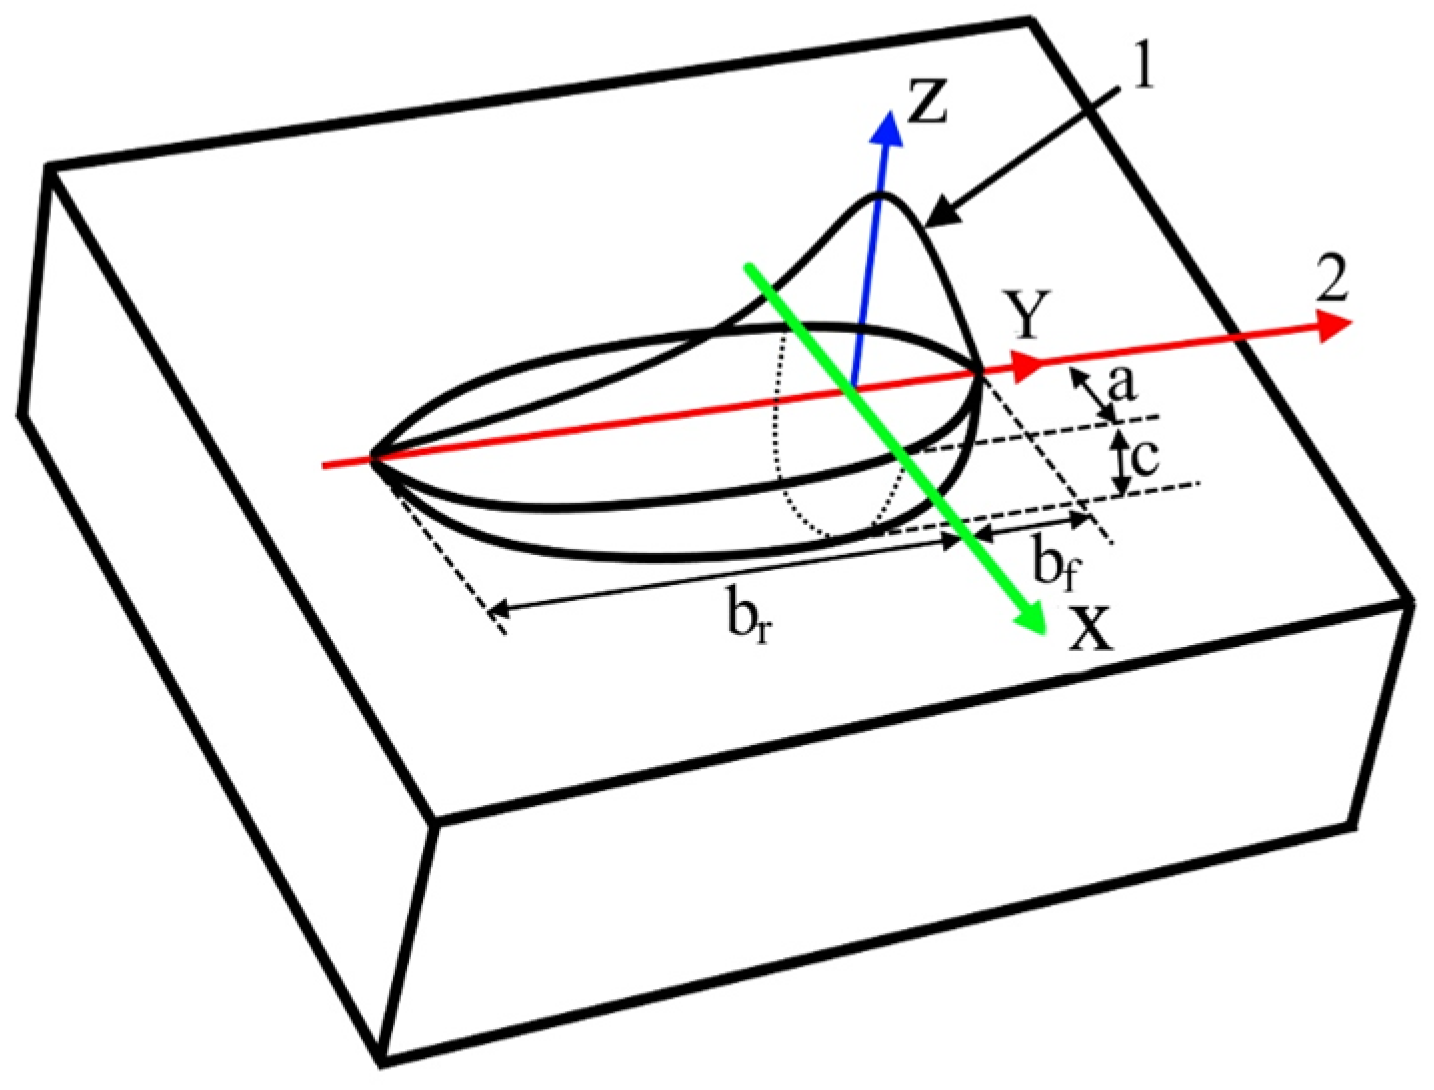
The thermal Equations (1)–(3) were solved for three welding processes, laser, laser–plasma, and plasma. In keeping with the recommendations of [24], modeling of the heat source for plasma welding was approximated by employing a double-ellipsoid model with independent normal (Gaussian) distribution of the source power density (Figure 4), as proposed by J. Goldak [25].
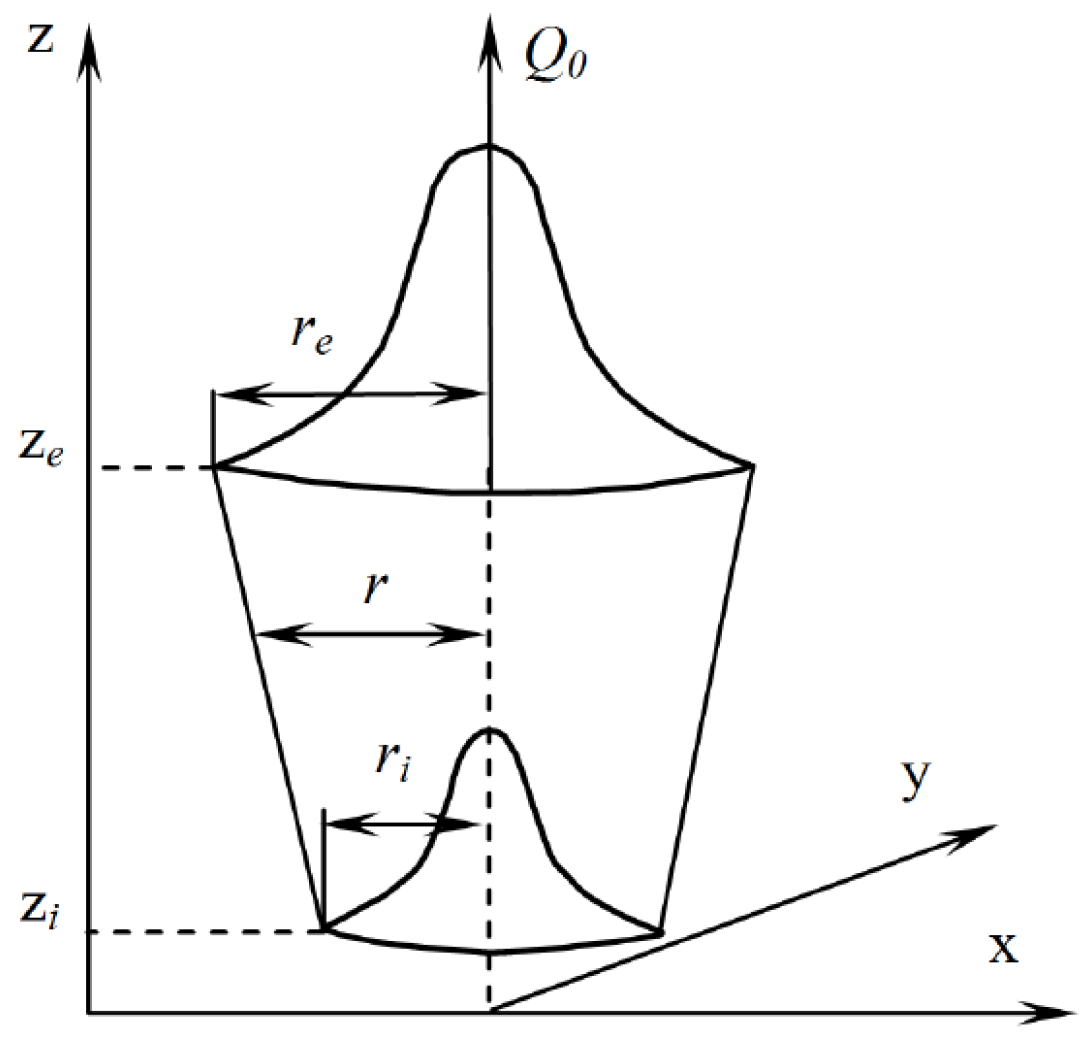
A model of bulk conical heat source was used for laser welding, with transformation of the conical shape into a cylindrical shape and normal (Gaussian) distribution of the power density based on the known beam parameters (Figure 5). This model envisages that the laser beam moves along the y-coordinate at a constant speed that is equal to the welding speed, and it is directed along a normal to the product surface.

3. Results

3.1. Investigation of Weld Structure Produced by Laser, Plasma, and Laser–Plasma Welding

In the welded joint produced by laser–plasma welding, the size of the weld metal crystallites is equal to h × l = (10–15) × (40–170) µm at a microhardness of HV 0.1 of 232 (Table 4, Figure 6a); a schematic image is presented in Figure 6d. In transition to the fusion line, the crystallite length increases from the weld side (h × l = (8–15) × (80–150) µm) with an increase in grain shape factor from æ = 7 (weld) to æ = 11 (fusion line) on average (Figure 6b). Here, the microhardness is slightly increased (HV 0.1 of 238). Along the fusion line, the formation of grains of an equiaxed shape is observed, both from the side of the weld (Dg = 8–17 µm) and in the HAZ (Dg = 5–15 µm). In the HAZ, the metal grain size is Dg = 5–15 µm, with a decrease in microhardness by 9% compared to the weld metal, by 11% compared to the fusion line, and by 9% compared to the base metal (Table 4, Figure 6c,d). The welded joint is characterized by a relatively uniform level of microhardness with the formation of a homogeneous dendritic structure in the weld metal and a fine-grained structure in the HAZ metal (Table 4, Figure 6).
In the laser-welded joint, the size of the weld metal crystallites is equal to h × l = (8–15) × (30–80) µm at a microhardness of HV 0.1 of 190 (Table 4, Figure 7a); a schematic image is shown in Figure 7d. In transition to the fusion line, the crystallite length increases only slightly (h × l = (5–10) × (50–100) µm) from the weld side, with an increase in the shape factor from æ = 4.6 (weld) to æ = 10 (fusion line) on average (Figure 7b). Here, the microhardness (HV 0.1 of 253) grows noticeably (by 33%). Along the fusion line, the formation of equiaxed grains is also observed, both from the weld side (Dg = 8–16 µm) and from the HAZ side (Dg = 4–12 µm). In the HAZ metal, the grain size is Dg = 5–15 µm, with a slight increase in microhardness (by 6%) compared to the fusion line and BM (Figure 1 and Figure 7b). The welded joint is characterized by a nonuniform level of microhardness. In the weld metal, the microhardness decreases 1.3 times relative to the fusion line, HAZ, and base metal (Figure 7c). However, no significant gradients in crystallite size are observed in the weld metal (Figure 7a). A fine-grained structure forms in the HAZ (Figure 7c).
In the 2 mm thick plasma-welded joint, the size of the weld metal crystallites is equal to h × l = (10–50) × (100–300) µm at a microhardness of HV 0.1 of 248 (Table 4, Figure 8a); a schematic representation is shown in Figure 8d. In transition to the fusion line, the crystallite length decreases (h × l = (10–30) × (60–200) µm) from the weld side, with the formation of a grain structure with Dg = 10–20 µm (Figure 8b). The grain shape factor does not change (æ = 6–10). From the HAZ side, the microhardness (HV 0.1 of 220) decreases only slightly by 11% (Table 4). In the HAZ metal, both crystallites (h × l = (5–20) × (30–100) µm, æ = 5–6) and fine grains (Dg = 10–15 µm) are present along the fusion line (Figure 8c). In the HAZ, the grain size is Dg = 10–30 µm, with a decrease in microhardness by 6% compared to the weld metal, by 5% compared to the fusion line, and by 12% compared to the base metal (Figure 8d). The welded joint is characterized by the formation of a coarse-grained dendritic structure in the welded metal (Figure 8a) with a slight decrease in microhardness in the HAZ metal (Table 4).
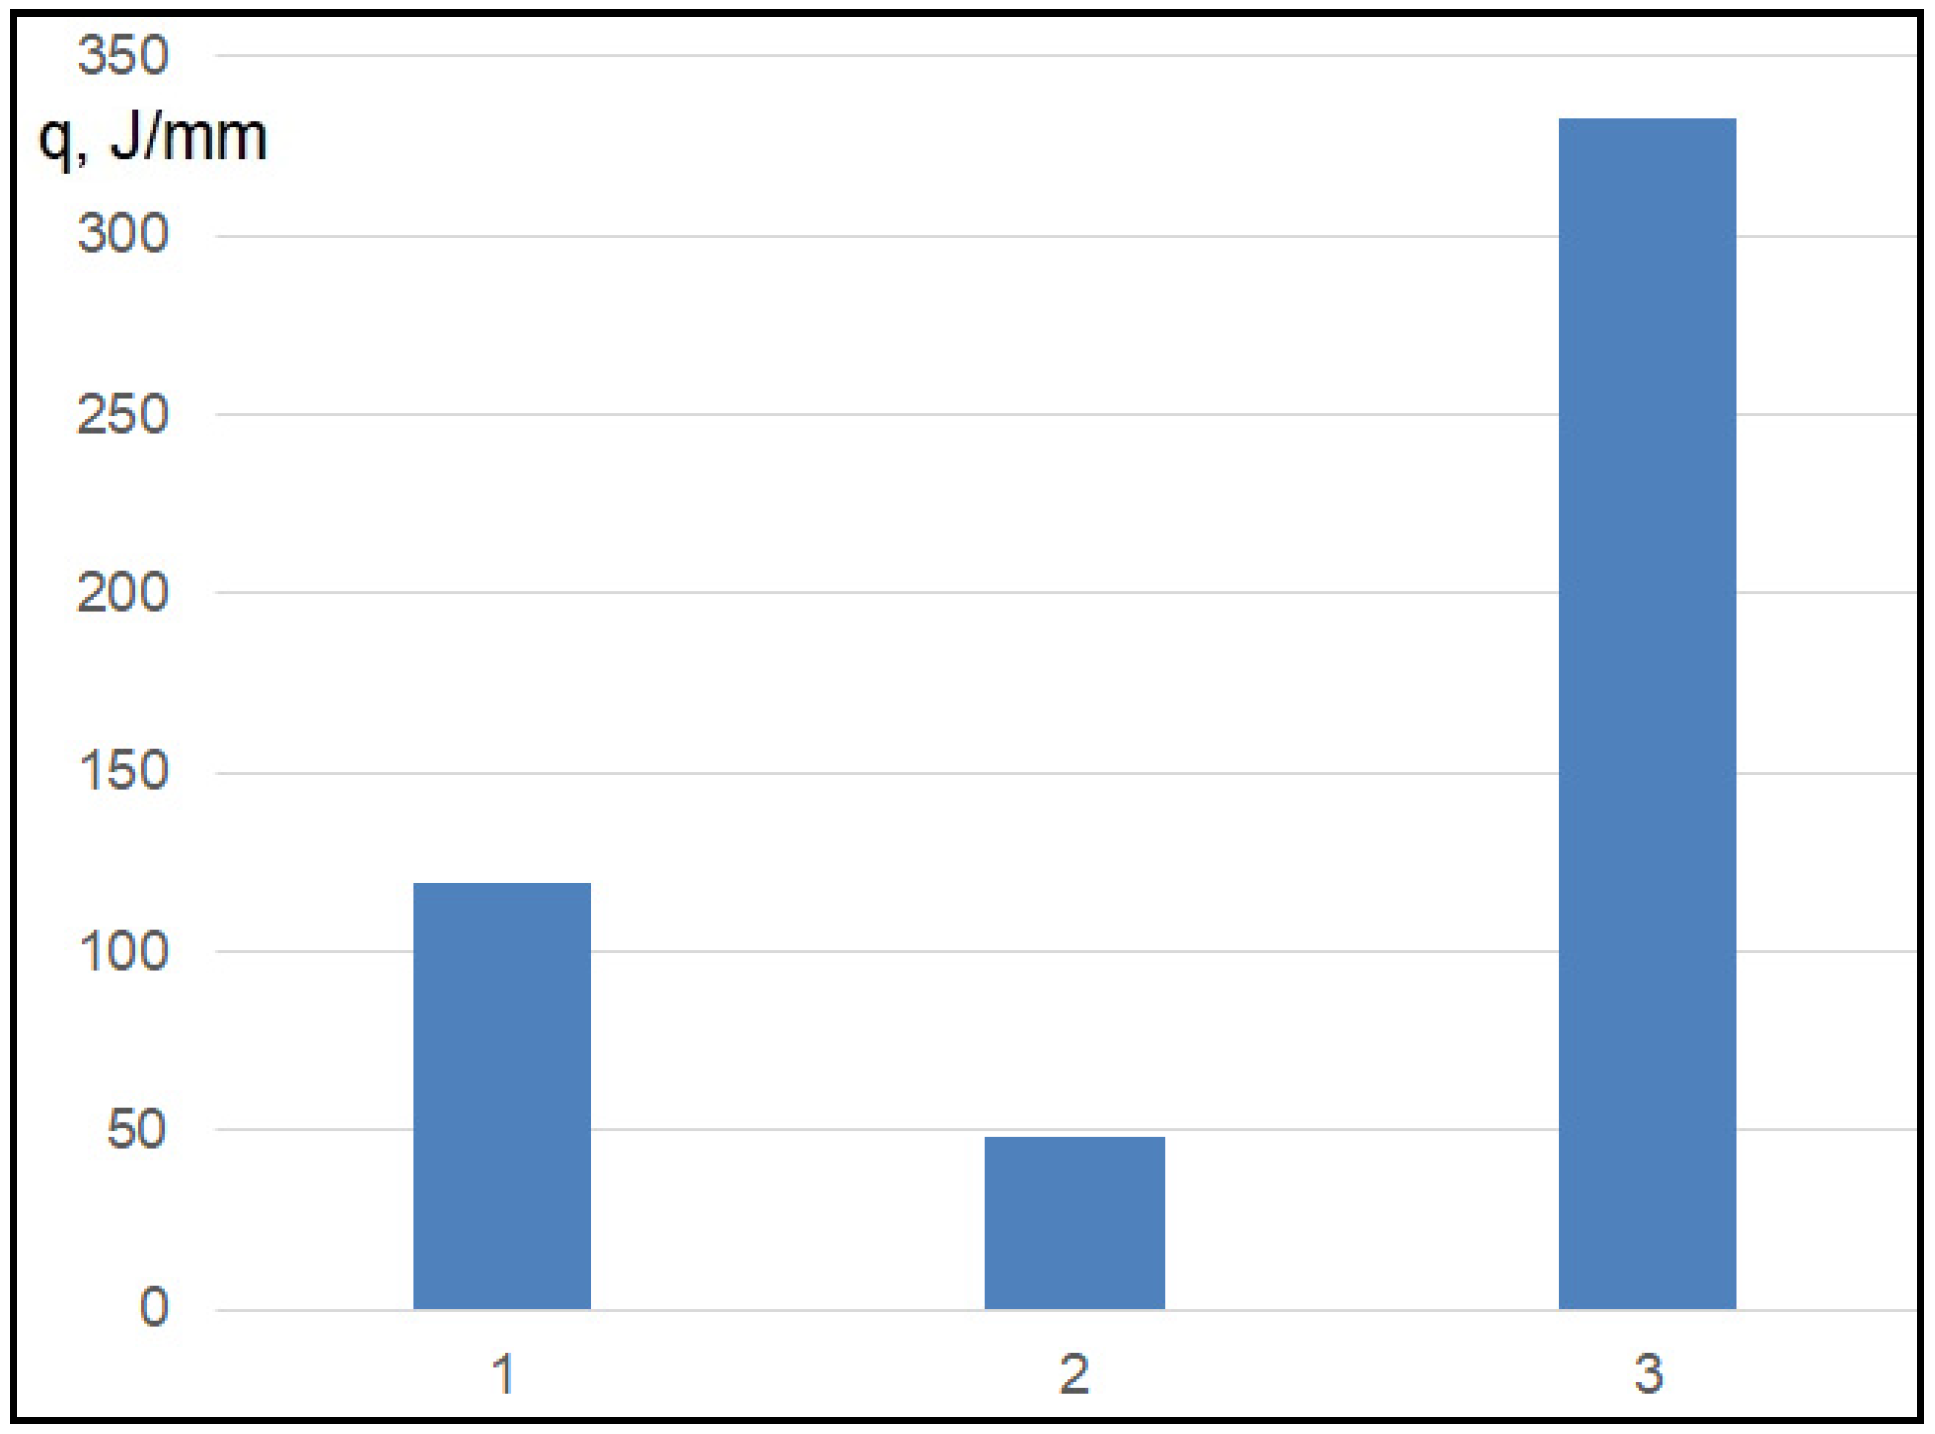
In the case of laser welding of the 2 mm AISI 304 steel at a speed of 1 m/min, the size of the crystallites in the weld metal is the smallest (h × l = (8–15) × (30–80) µm) with a minimal grain shape factor (æ = 3.8–4.5) (Table 4, Figure 7). In the case of laser–plasma welding at a speed of 1.5 m/min and the same laser radiation power (P = 800 W), the crystallite width is approximately the same, but the length increases by 1.7 times (h × l = (8–15) × (60–200) µm) on average and æ increases up to 4–10 times (Table 4, Figure 6). A similar tendency is observed near the fusion line (Figure 6b). Here, a structure with the same grain dimensions (Dg = 5–15 µm) forms in the HAZ with laser and laser–plasma welding (Figure 6 and Figure 7). In the case of plasma welding at a speed of 0.3 mm/min, the structure becomes 2–3 times coarser, both in the metal of the weld (h × l = (10–50) × (100–300) µm) and in the HAZ (Dg = 10–30 µm) (Table 4, Figure 8). The obtained results regarding the change in grain structure parameters with laser and laser–plasma welding can be linked to the high process speeds, namely the welding speeds and cooling rates, which greatly accelerate the crystallization processes. The level of heat input (energy input q) in the case of laser welding is equal to q = 48 kJ/m, and in the case of laser–plasma welding, q = 119 kJ/m (Table 3). With plasma welding, the low welding speed of 0.3 mm/min leads to an increase in heat input (q = 332.8 kJ/m), which promotes the formation of a coarse-crystalline grain structure.
Thus, in terms of structure formation, the most favorable structures of AISI 304 welded joints with the considered thicknesses are developed using laser–plasma welding.
Investigations of the grain substructure parameters were conducted using scanning electron microscopy (SEM). The results are presented in Table 5.
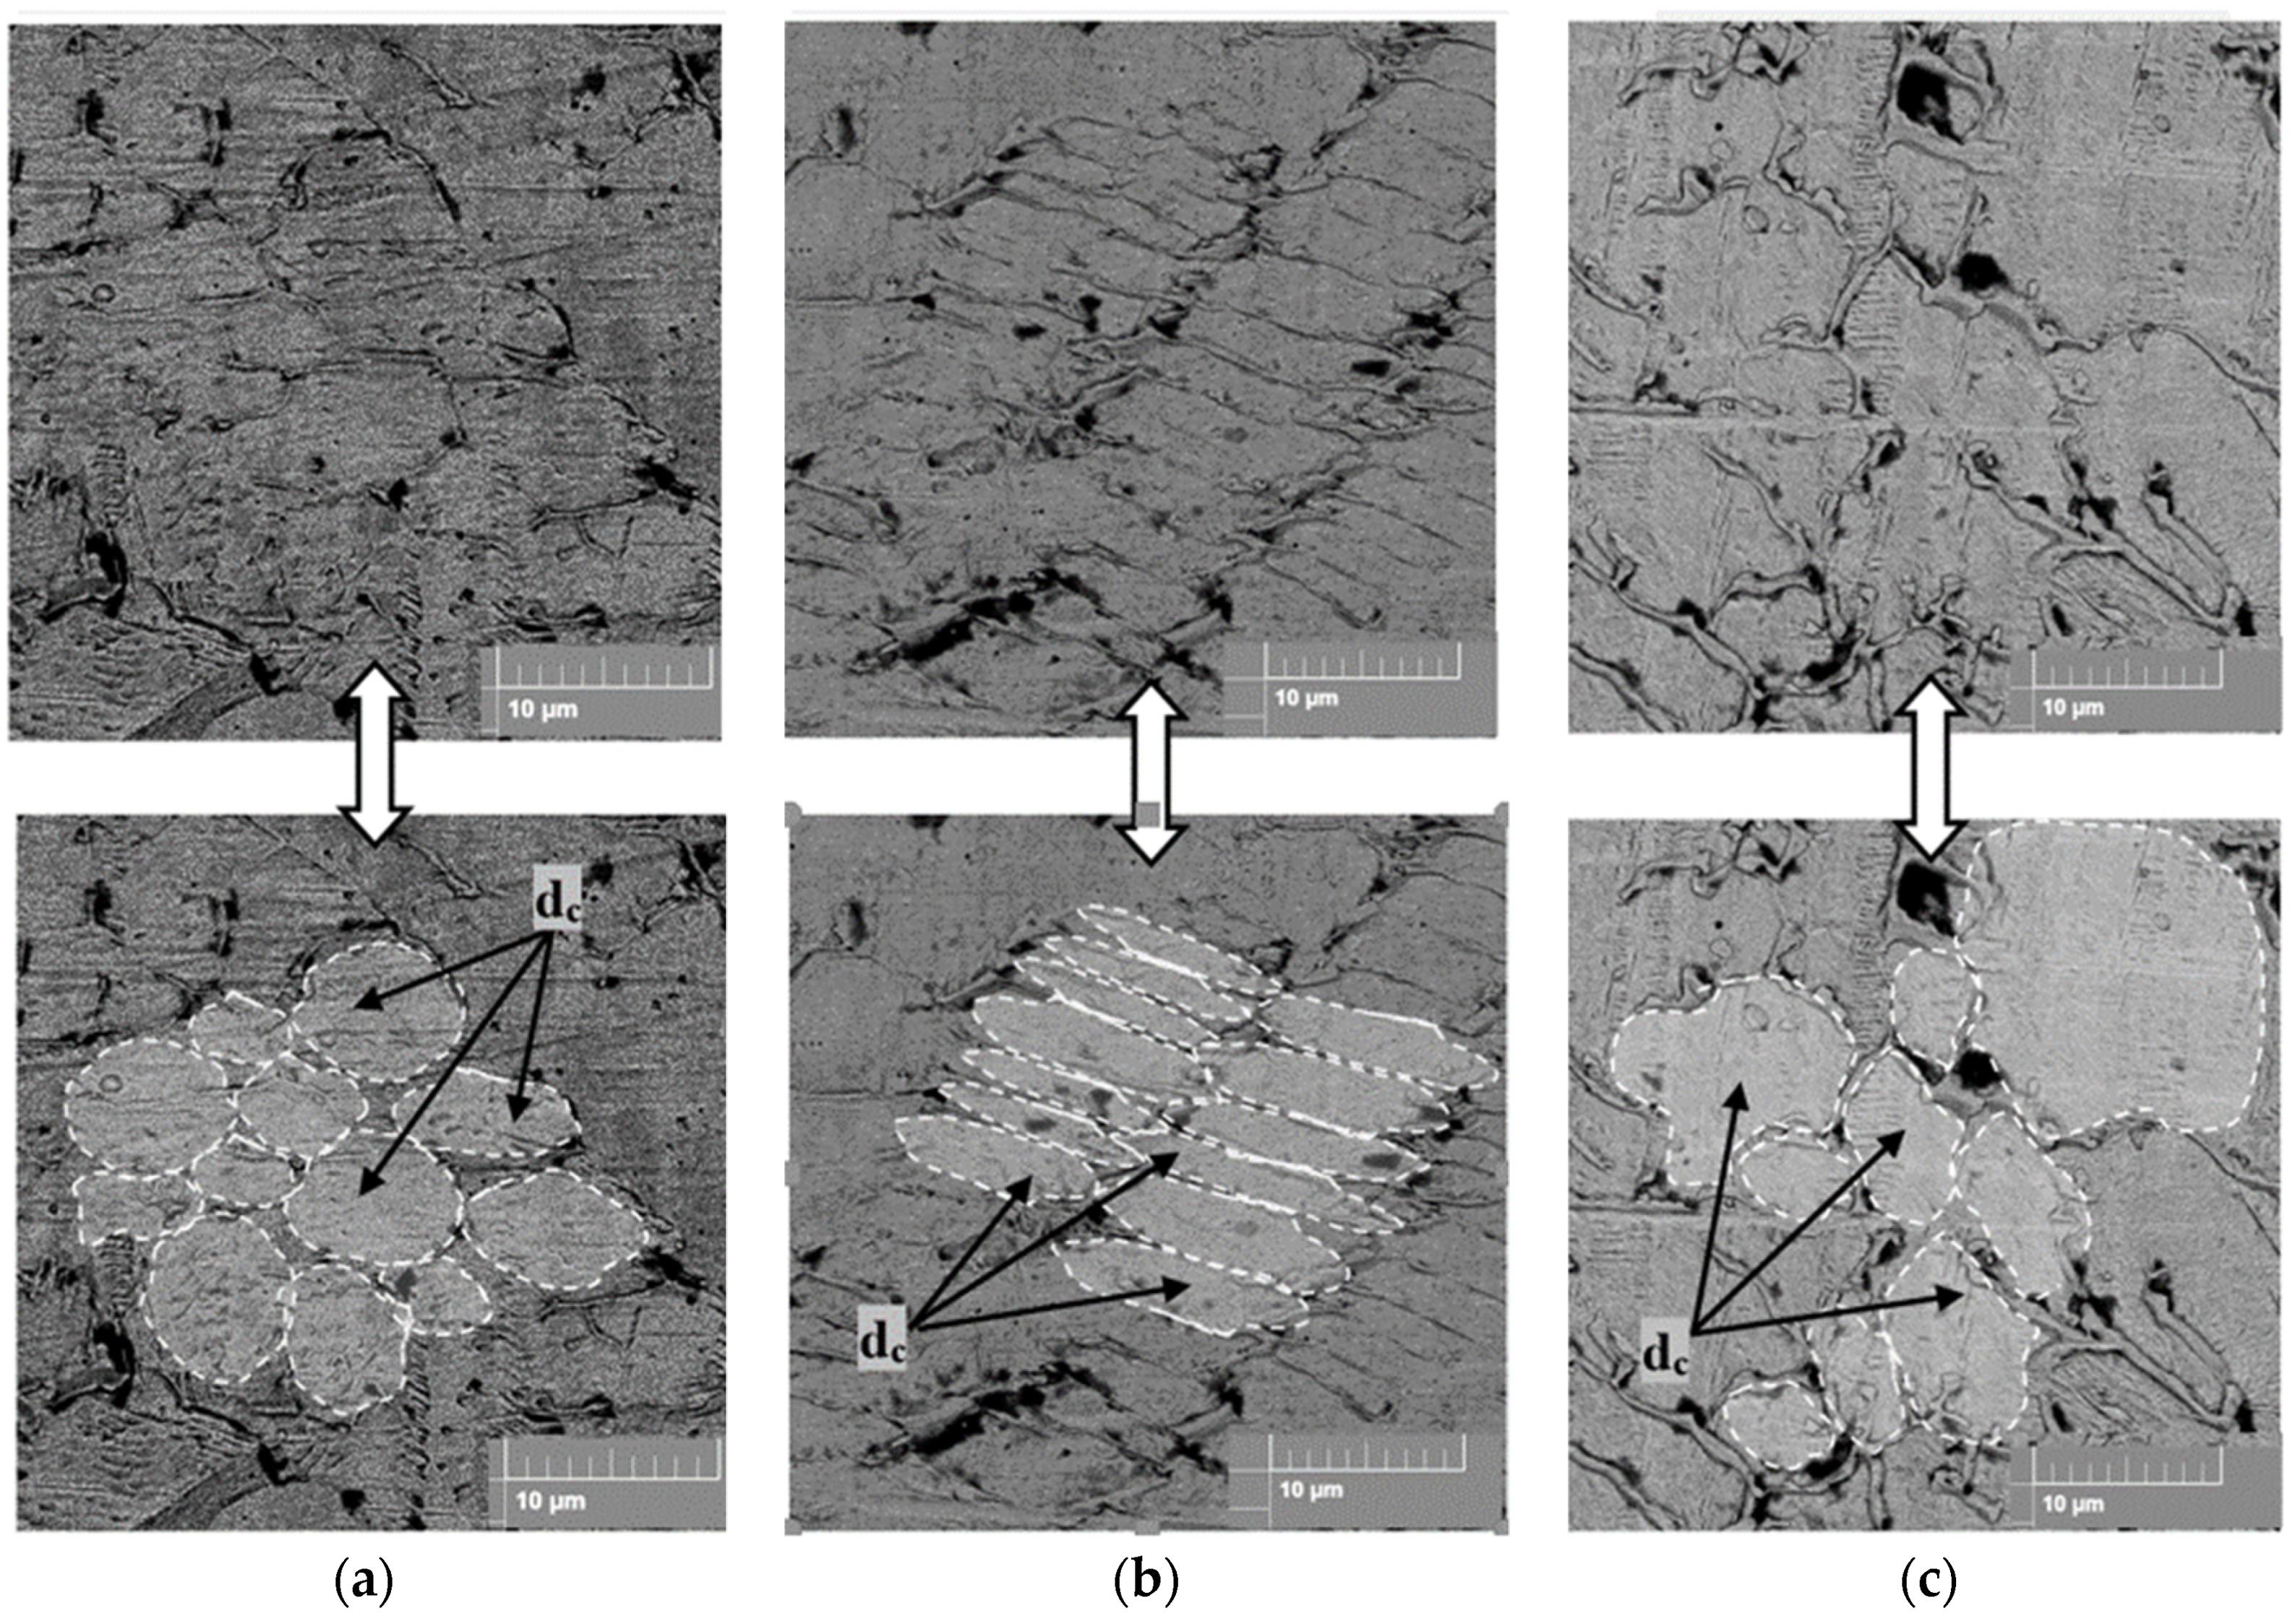
In the case of laser–plasma and laser welding of the AISI 304 steel, the size of the subgrains in the weld metal is the smallest (dS = 2–10 µm), as shown in Figure 9a. With laser welding, a substructure of an elongated (“block”) shape with the dimensions of dS = 2–4 × 8–12 µm and clear-cut subgrains also forms in the weld metal (Figure 9b). In the case of plasma welding, the substructure becomes two times coarser (dS = 5–20 µm) (Figure 9c), and subgrains of an elongated shape are also observed (dS = 3–6 × 10–20 µm). With laser and plasma welding, the subgrain shape is elongated near the fusion line, with dS= 3–4 × 5–20 µm and dS = 5–7 × 20–40 µm, respectively. Such structural features may lead to a nonuniform level of mechanical properties in the welded joint zones due to a decrease or an increase in substructural strengthening in line with Hall–Petch dependence [26]. In the case of laser–plasma welding, the formation of gradient-free cellular structures of a predominantly equilibrium shape is observed in all the zones of the welded joint, which will ensure the isotropy of the strength and crack resistance properties of the welded joint. Thus, in terms of substructure parameters of welds, the most favorable structure forms in the metal of welded joints produced by laser–plasma welding.

3.2. Modeling the Stress–Strain State of Welded Joints Produced by Laser, Plasma and Hybrid Laser–Plasma Processes

For laser–plasma welding, the modeling of thermal processes was performed with simultaneous use of the two above-mentioned sources. The parameters of the modes of butt joint welding via the considered processes are presented in Table 3.
The geometrical parameters of the heat source were assigned in the program based on an analysis of the results regarding the macrostructure of the welded joints produced by the studied welding processes, in keeping with the selected model of a mobile heat source (Table 6). The penetration shapes obtained during modeling, and their geometrical parameters satisfactorily correlate with the values obtained from the macrosection analysis.
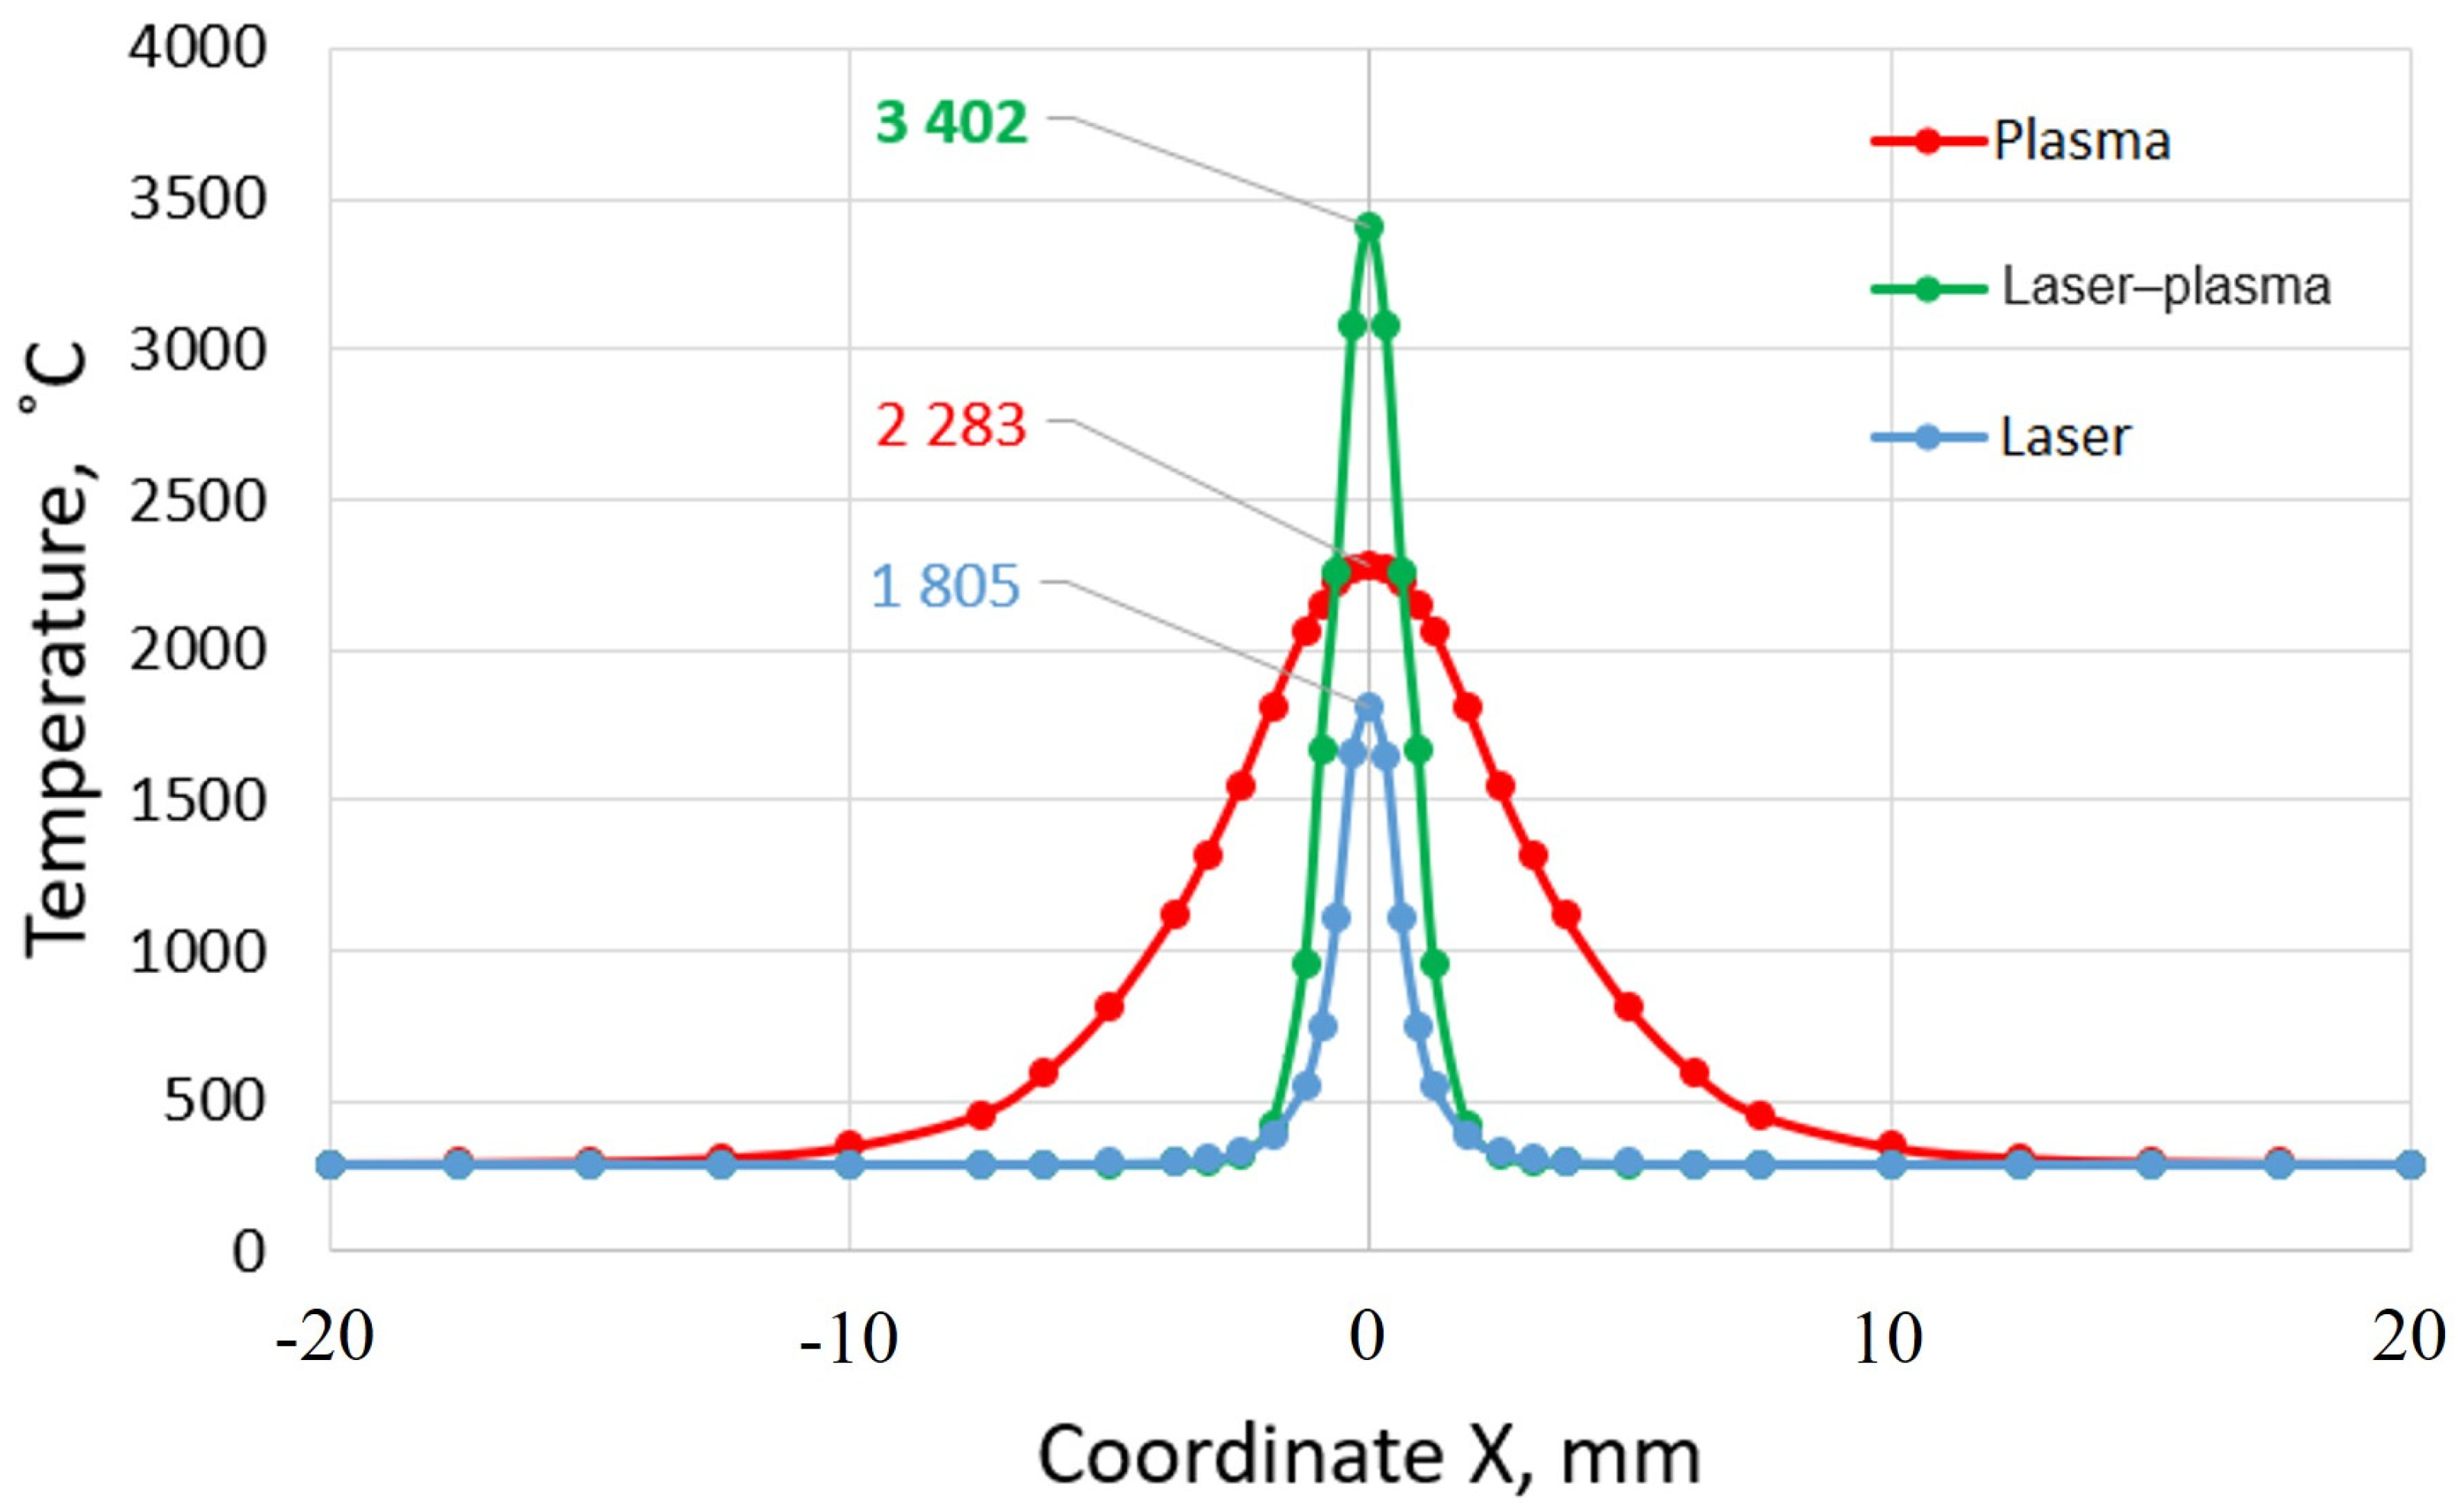
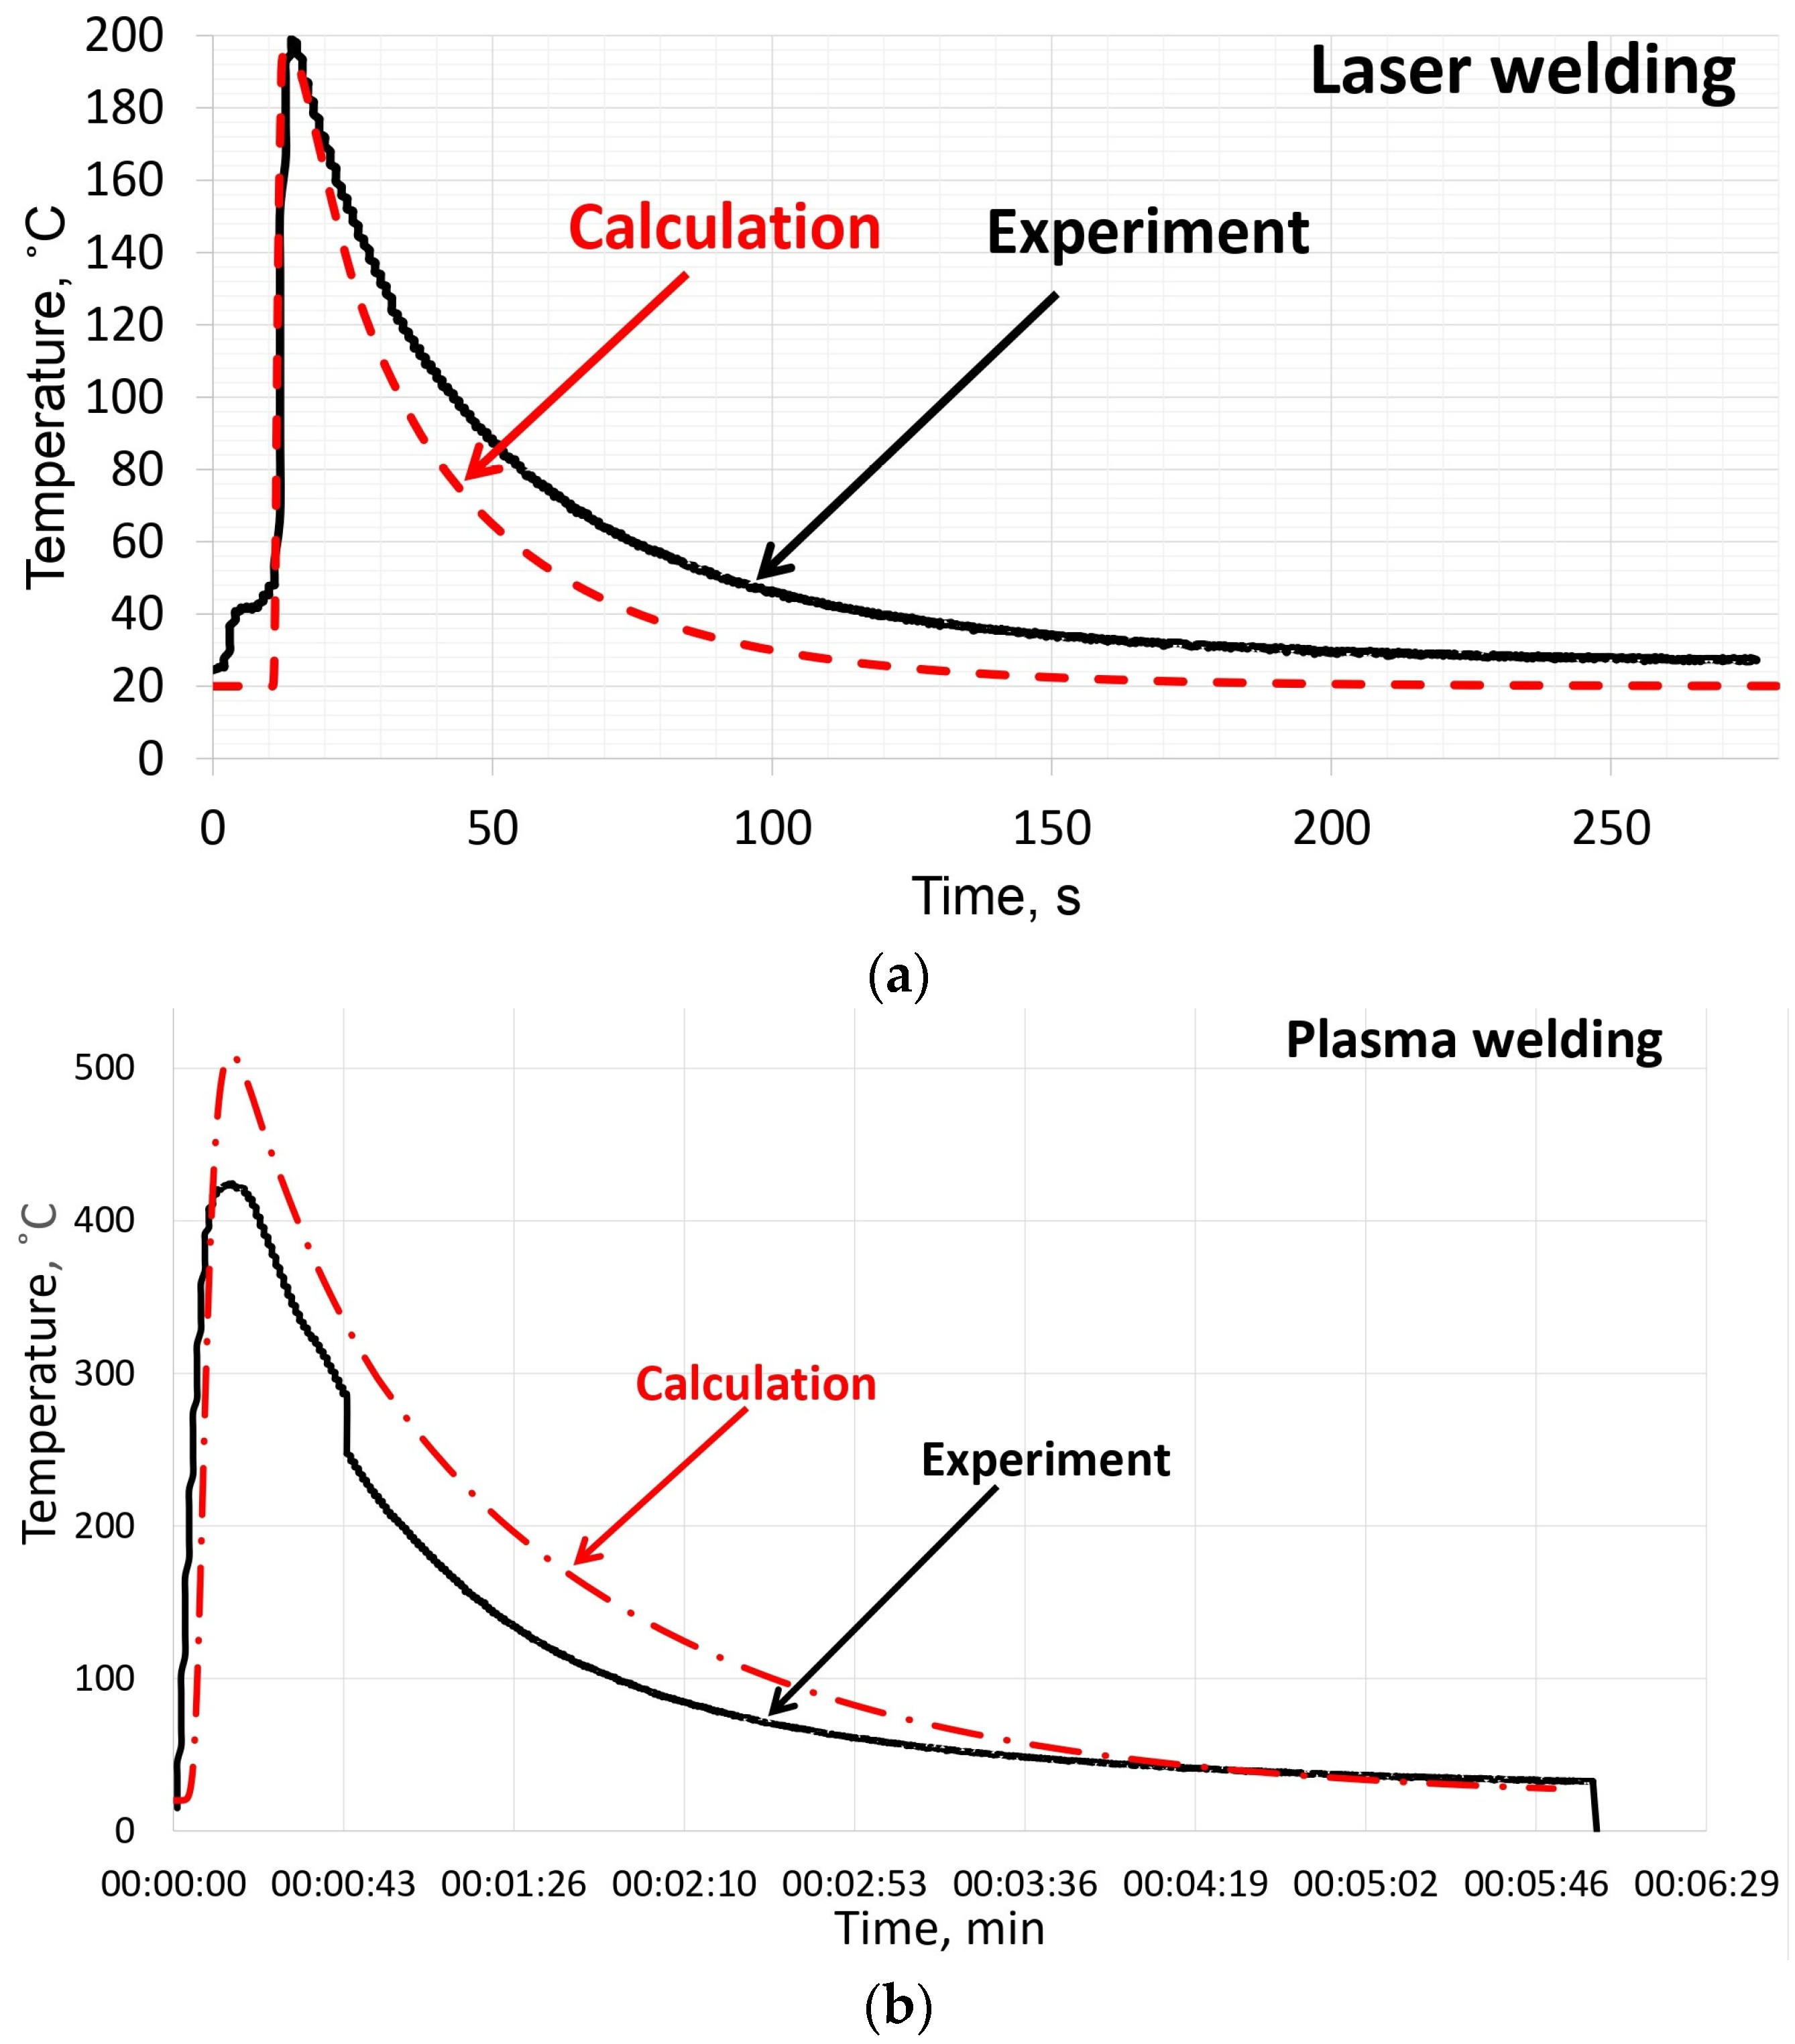
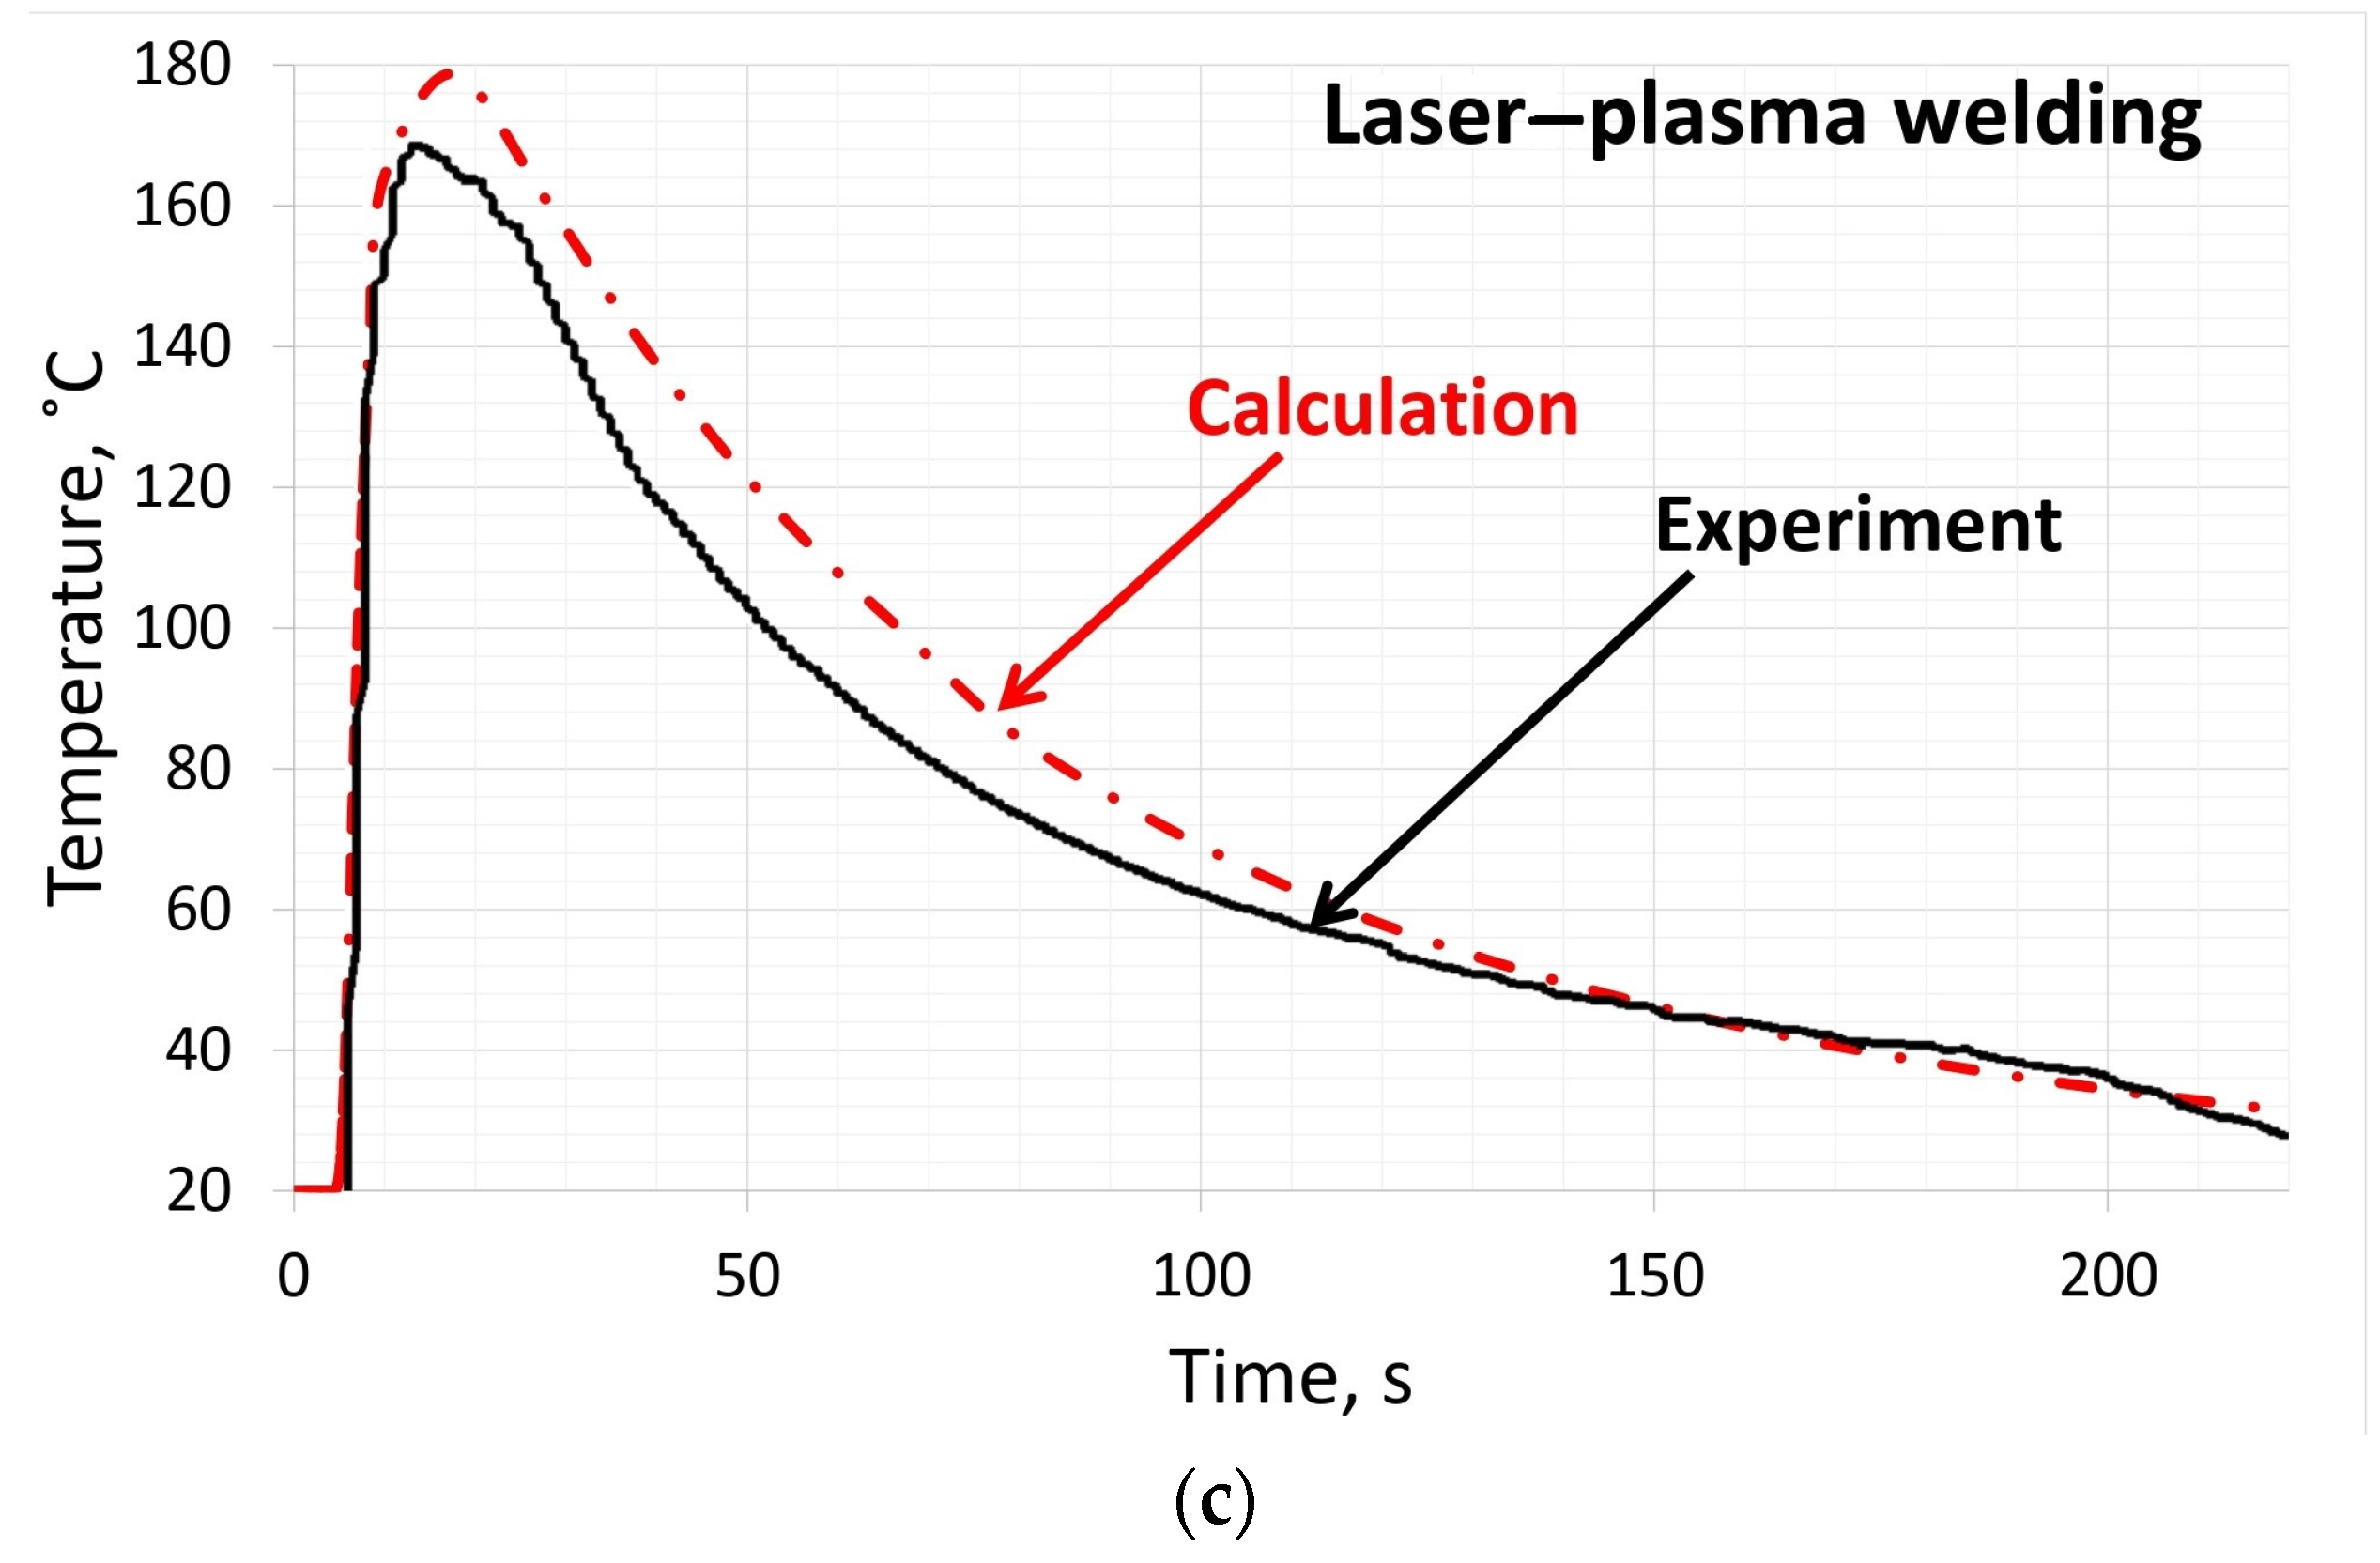
A comparative analysis of the temperature distribution according to the performed calculations (Figure 10) showed that for different welding processes, the maximal temperatures in the model problem are different and equal to 1805 °C for laser welding, 3402 °C for laser–plasma welding, and 2268 °C for plasma welding. Based on the results of thermal problem modeling, the obtained welding thermal cycles were compared with the experimental data derived from the measurements performed during welding using thermocouples (Figure 2b). Calculation of the welding thermal cycles was performed for those HAZ points on the experimental samples where the thermocouples were located (Figure 11). When experimentally recording the thermal cycles, the thermocouples were installed at a certain distance from the weld axis (usually 5–10 mm). Therefore, data were recorded in the range of up to 500 °C. Calculations using the FE model were carried out for the corresponding temperature intervals (Figure 11). The accuracy of the simulation was judged based on the magnitude of the discrepancy between the experimental and calculated curves.
The modeled thermal cycles satisfactorily correspond to the shape of the experimental ones recorded by the thermocouples. The peak values of the actual and modeled temperatures are in agreement with up to 15% error, which is acceptable for further modeling of the stressed state components. Using the finite element method to further solve the thermo-mechanical problem allowed the determination of the distribution of residual stresses, displacements and plastic deformations (Figure 12, Figure 13, Figure 14, Figure 15, Figure 16, Figure 17 and Figure 18).
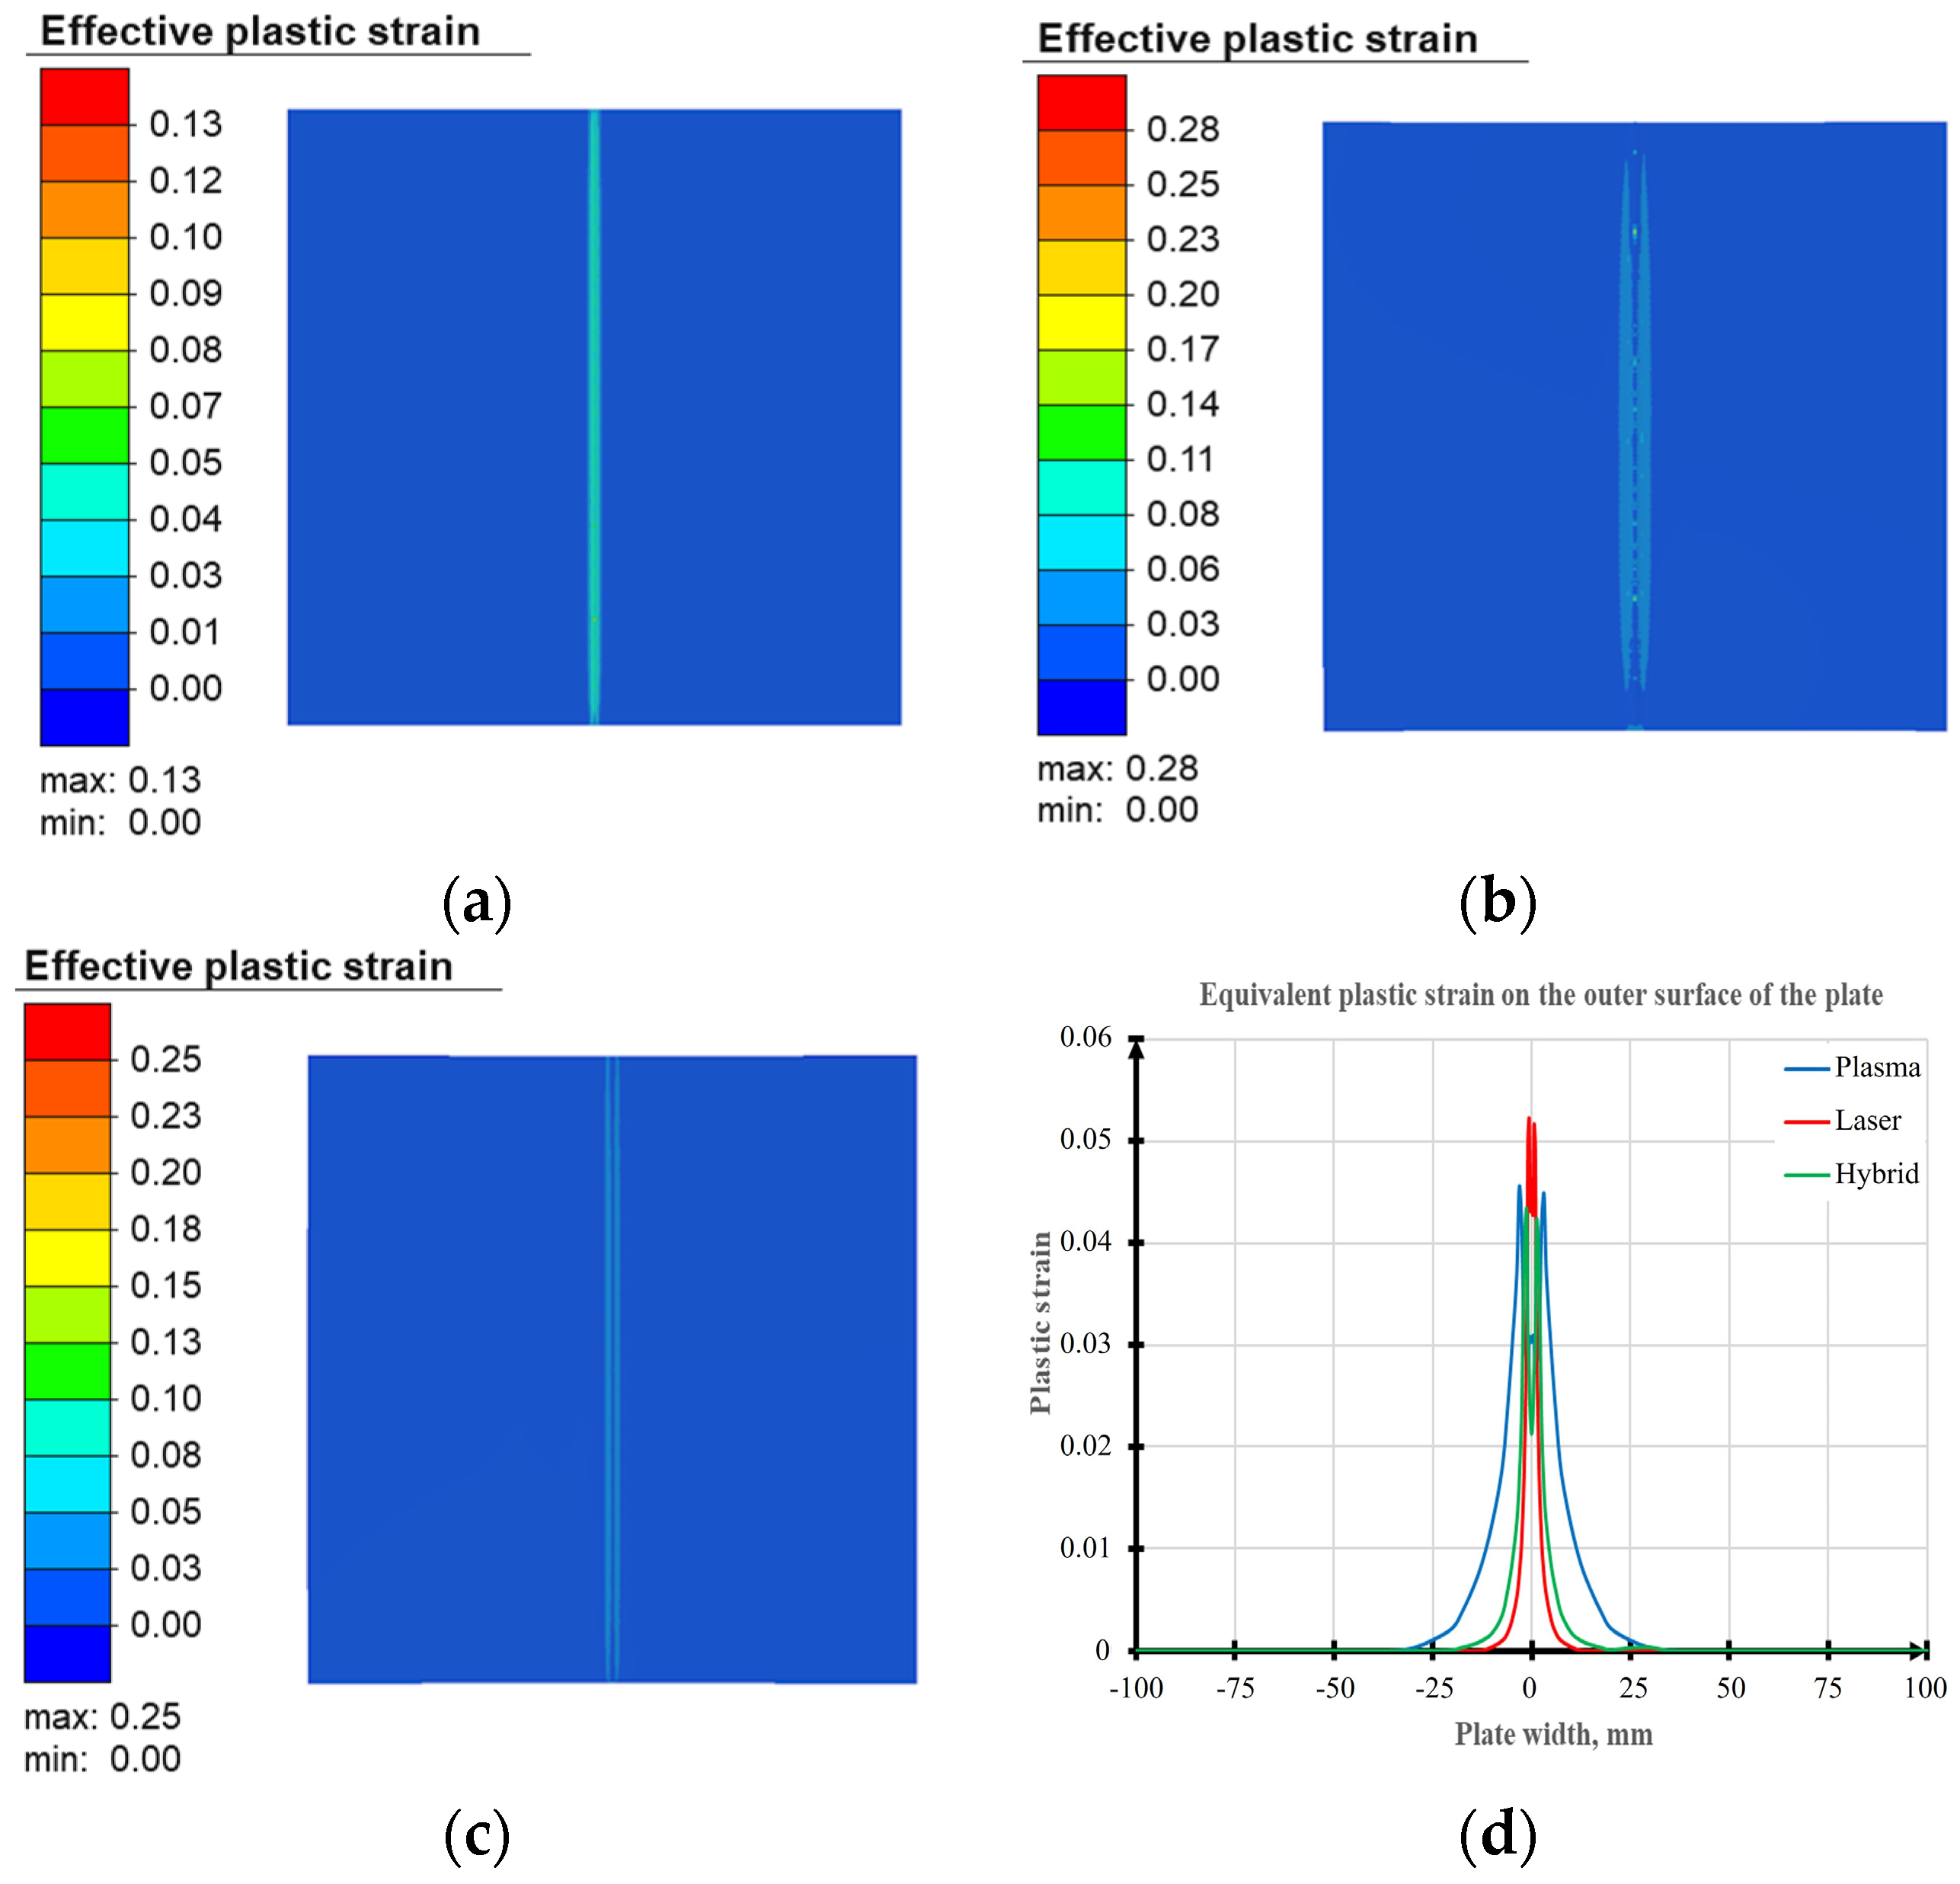
The equivalent plastic deformations (Figure 12), derived from the calculation of the laser, plasma, and laser–plasma welding processes, have the same distribution pattern and are concentrated in a rather narrow range of 20–30 mm for the laser and hybrid processes and in the range of 50–55 mm for plasma welding, which is attributable to the higher heat input of the latter.
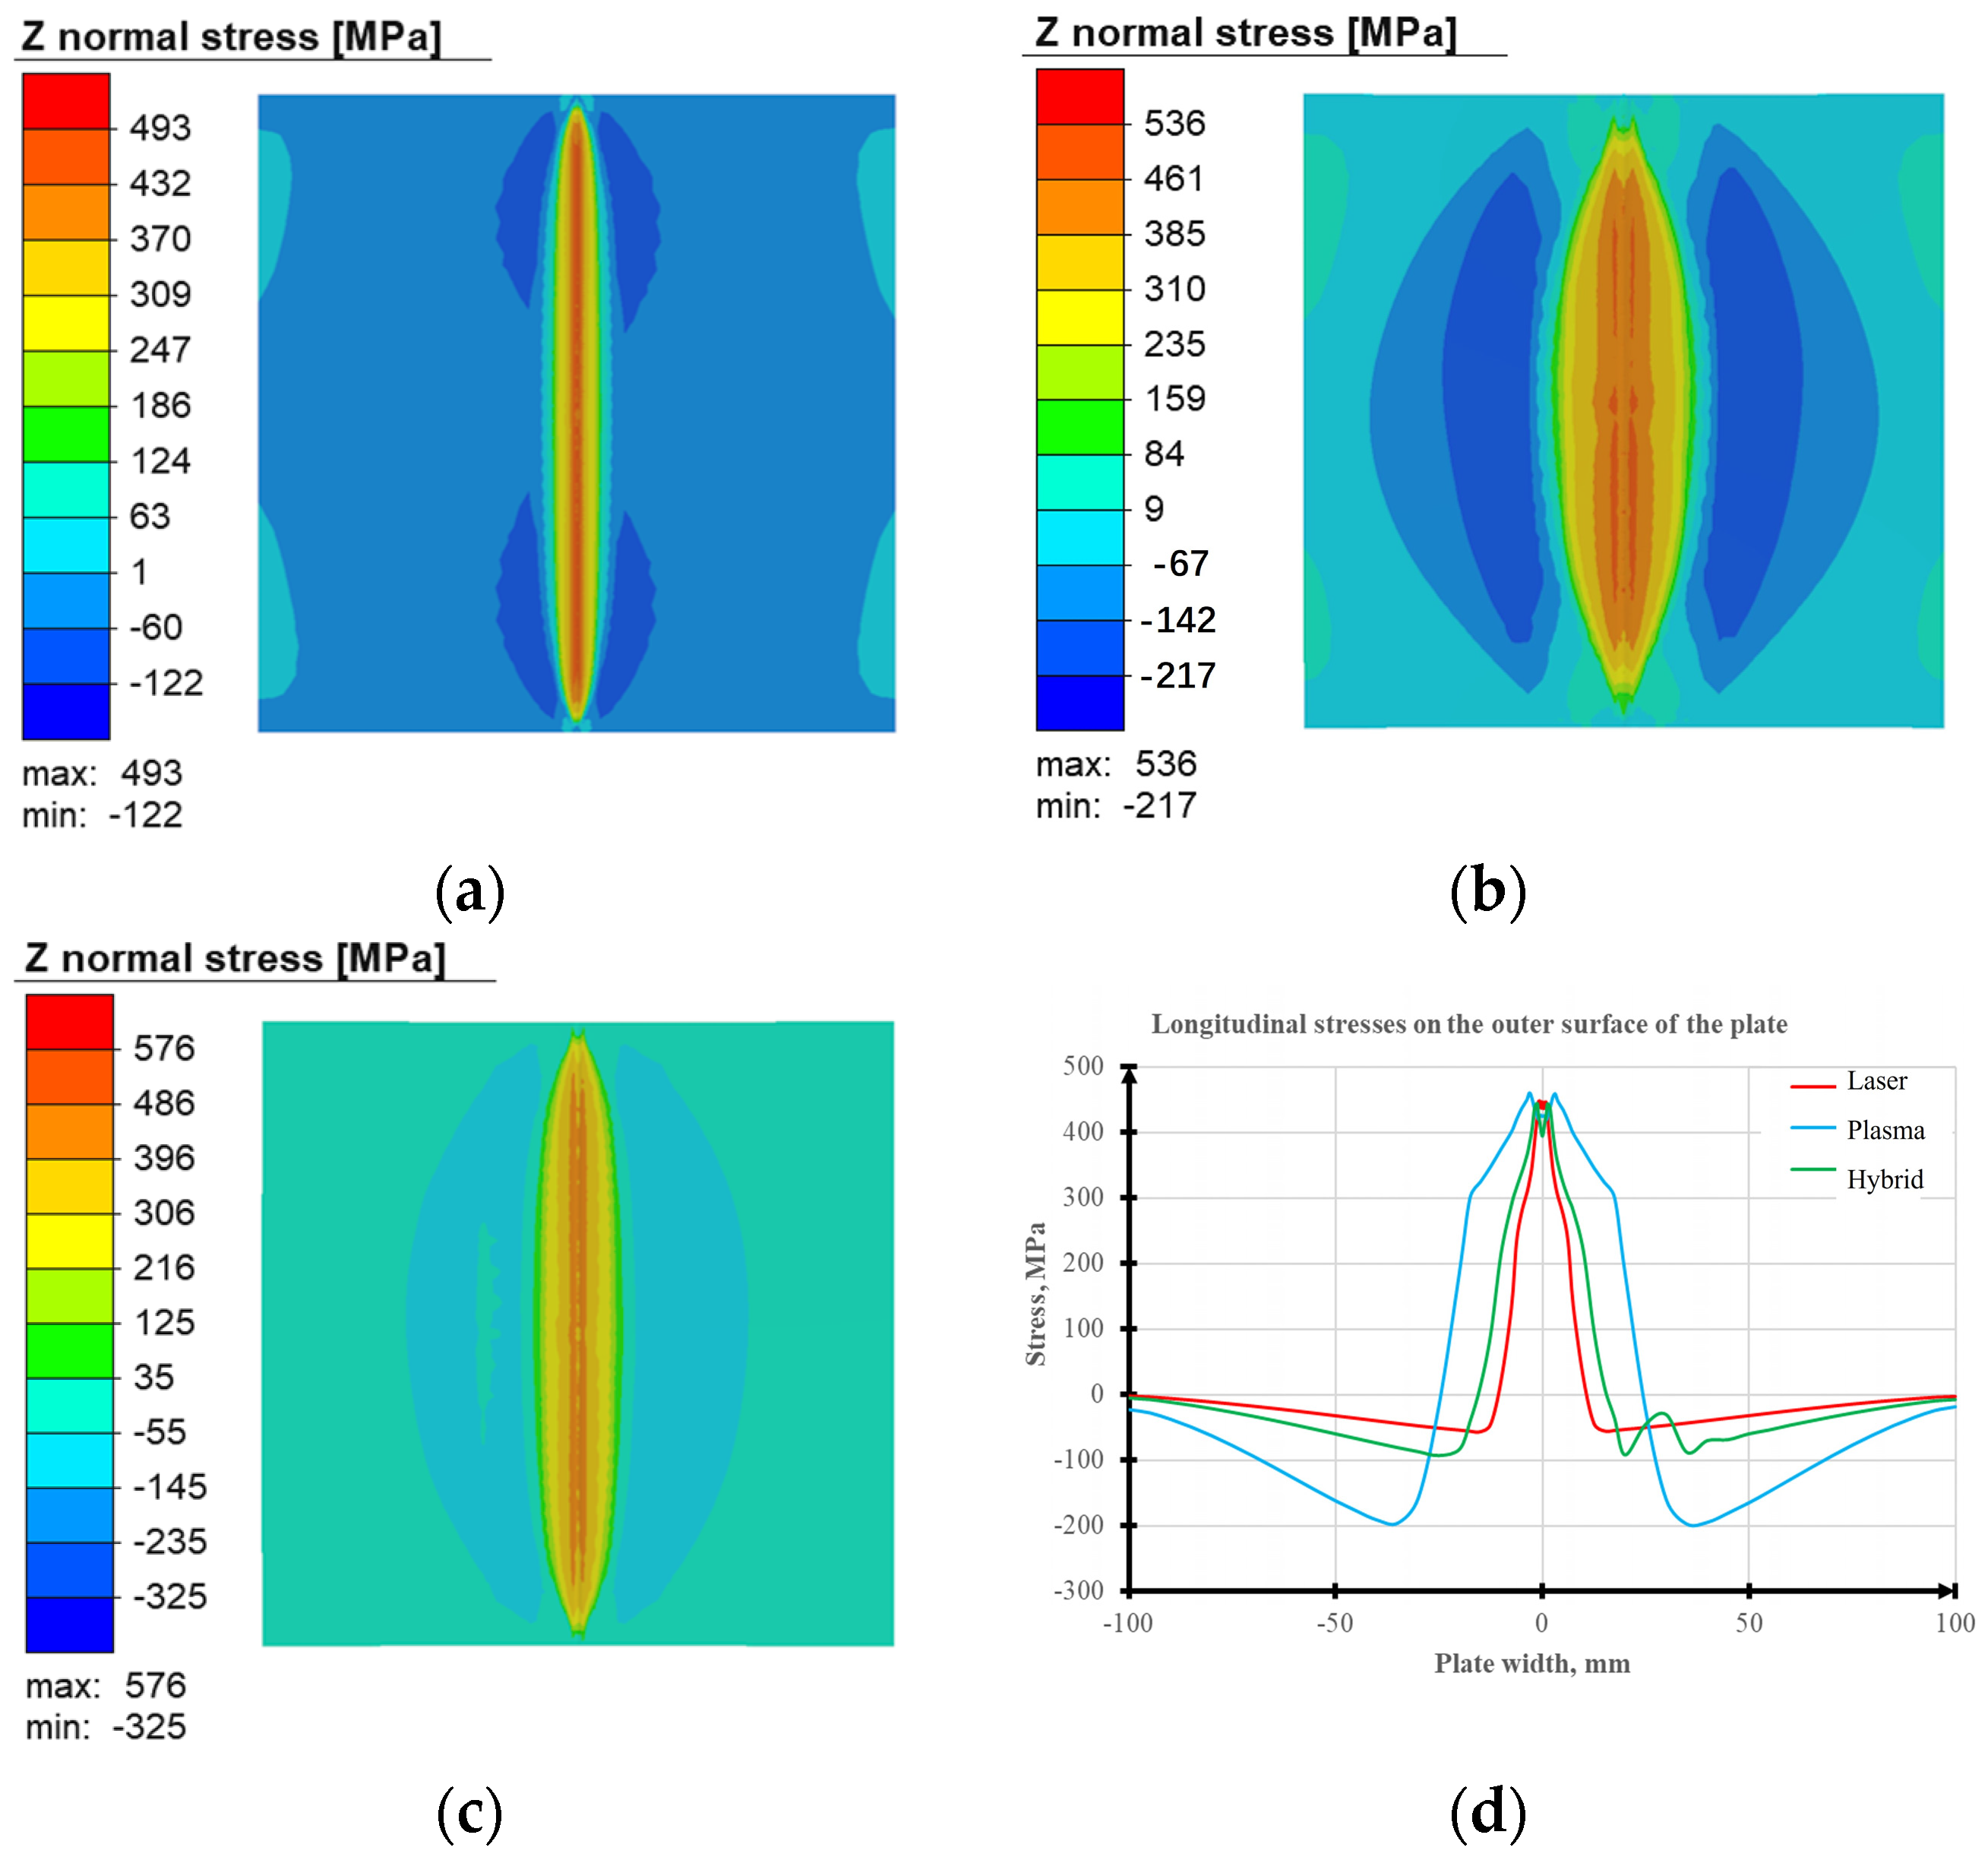
In a detailed analysis of the fields of longitudinal stresses developed with the use of laser welding, considerable tensile stresses reaching approximately 450 MPa were found to form on the weld axis (see Figure 13a).
These stresses decrease and gradually change to compressive stresses reaching approximately −45 MPa at the plastic zone boundary, and when moving further away from the weld axis, they drop to approximately −5 MPa at the joint ends. In the case of plasma welding, in the residual state, the tensile stresses on the weld axis reach approximately 450 MPa; within the plastic zone, they drop to approximately −200 MPa, and at the joint ends, they drop to approximately −24 MPa (see Figure 13b).
In regard to the hybrid welding process, the nature of the distribution of longitudinal stresses is similar to that of previously considered methods. In the weld zone, the stresses reach about 450 MPa; at the boundaries of the zone of residual plastic deformations (Figure 12d), they decrease to approximately −100 MPa; and at the joint edges, they drop to approximately −5 MPa (see Figure 13c). Stress values, which are minimal at the plate edges, are indicative of an absence of an out-of-plane bending component, which is typical for welding methods using high energy density sources, such as laser and plasma.
As shown in Figure 14a,b, with laser and hybrid welding, the transverse stress fields in the near-end regions have tensile stresses that reach 25 MPa outside the plastic zone; transverse tensile stresses of up to 0–15 MPa act on the weld axis in the central part, while at the weld start and end, these stresses change their sign abruptly and compressive stresses of a magnitude of −380 MPa are formed. In the plasma welding process, tensile stresses of 100 MPa act on the weld axis, while in the near-end regions of the weld, they decrease to 0 MPa, and compressive stresses of up to −300 MPa act at the weld start and end (Figure 14c).
A certain asymmetry in the distribution of transverse stress fields relative to the weld axis forms due to the peculiarities of the change in contact interaction between the plates and the backing, allowing for their sagging during modeling and rotation relative to the current coordinate system.
In the context of assessment of the risk of hazards arising from materials during loading, it is important to understand that such a risk is not due to the dimensions of individual components of the stress tensor. Instead, the interaction between these components is a key factor. As different combinations of stresses may lead to critical states, it is important to use the concepts of equivalent stresses according to von Mises for an adequate assessment of the materials’ ultimate strength [27].
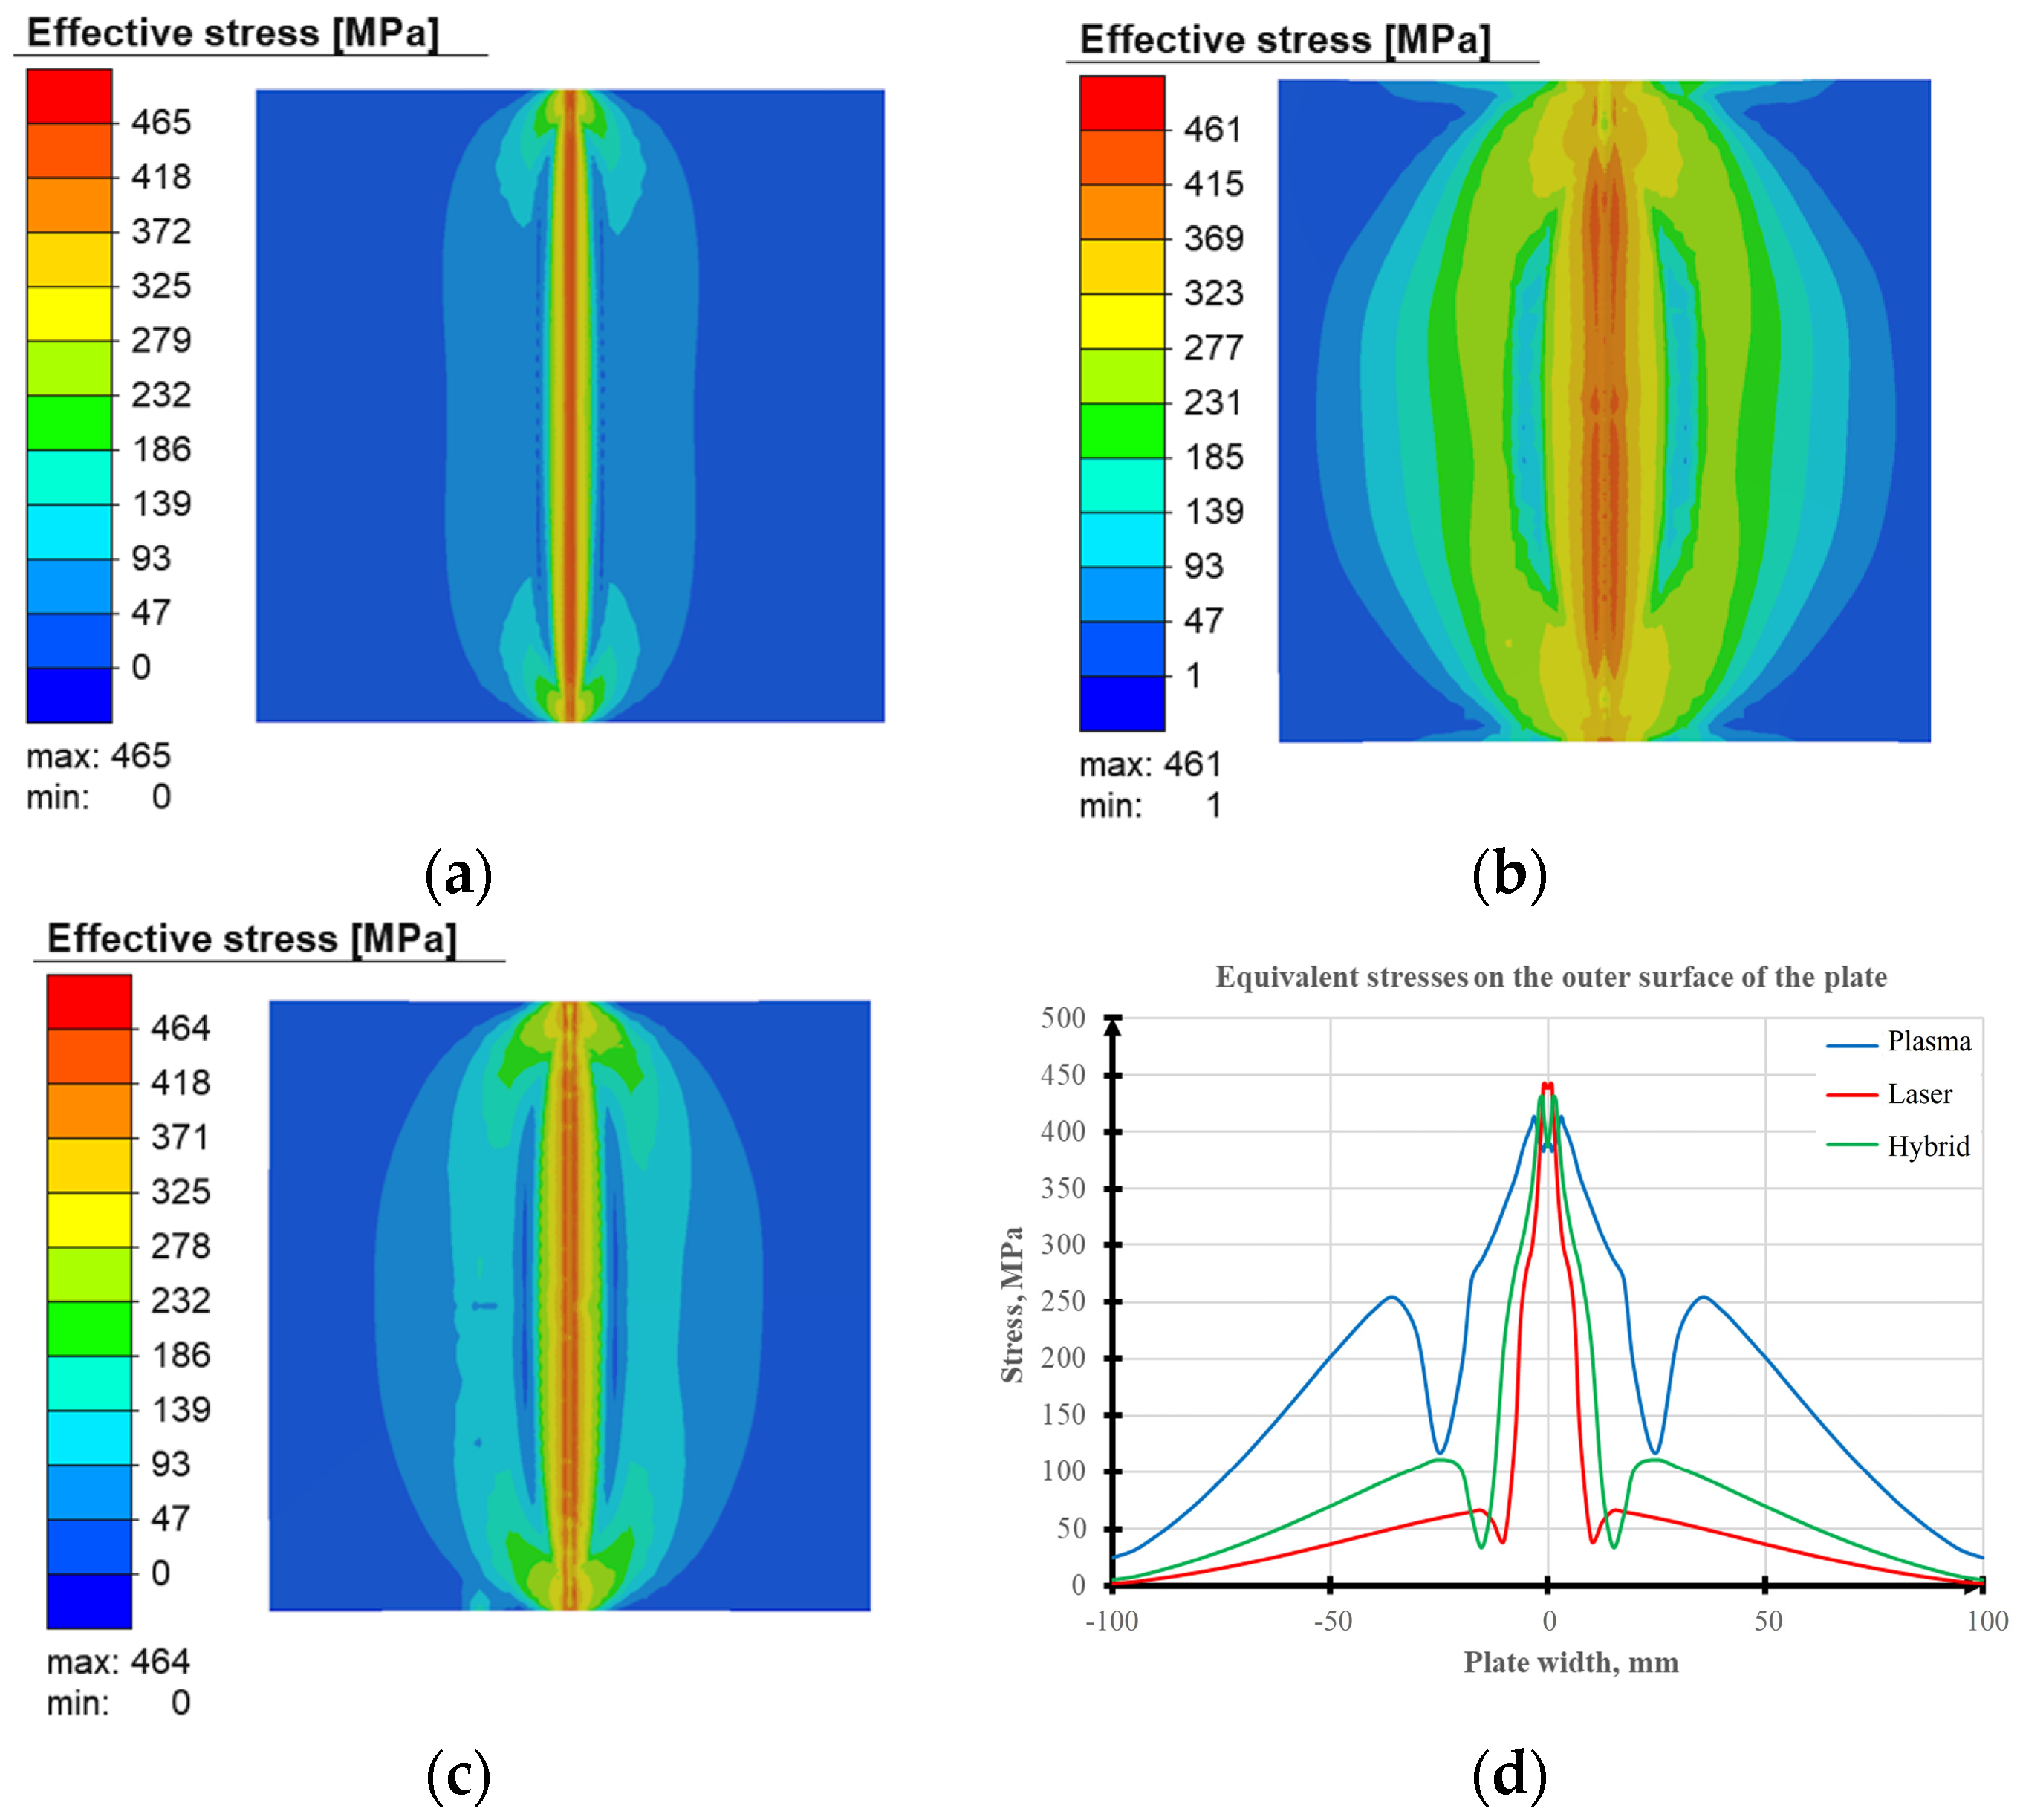
This method is based on an analysis of the scope of potential energy of shape change, which has accumulated in an object during its deformation. When modeling laser welding, maximal equivalent stresses of about 465 MPa arise in the weld, while in the near-weld zone, their magnitude decreases to 350 MPa (Figure 15a). In a 5–7 mm wide zone at a 10 mm distance from the weld, the residual stresses are close to 40–45 MPa.
In the case of modeling the plasma welding process, the maximal stresses are concentrated in the HAZ due to the greater volumetric shrinkage of the weld metal compared to laser welding (Figure 15b). This zone is 4 mm wide, and the maximal equivalent stresses in it reach up to 460 MPa.
When modeling the laser–plasma welding process, maximal equivalent stresses close to 450 MPa develop in the weld. Their magnitude in the near-weld zone reaches 325 MPa (Figure 15c). Residual equivalent stresses of approximately 40 MPa form in a 5–7 mm wide zone at a 15–20 mm distance from the weld, and with a greater distance from the weld axis, the stresses decrease to 5–10 MPa.
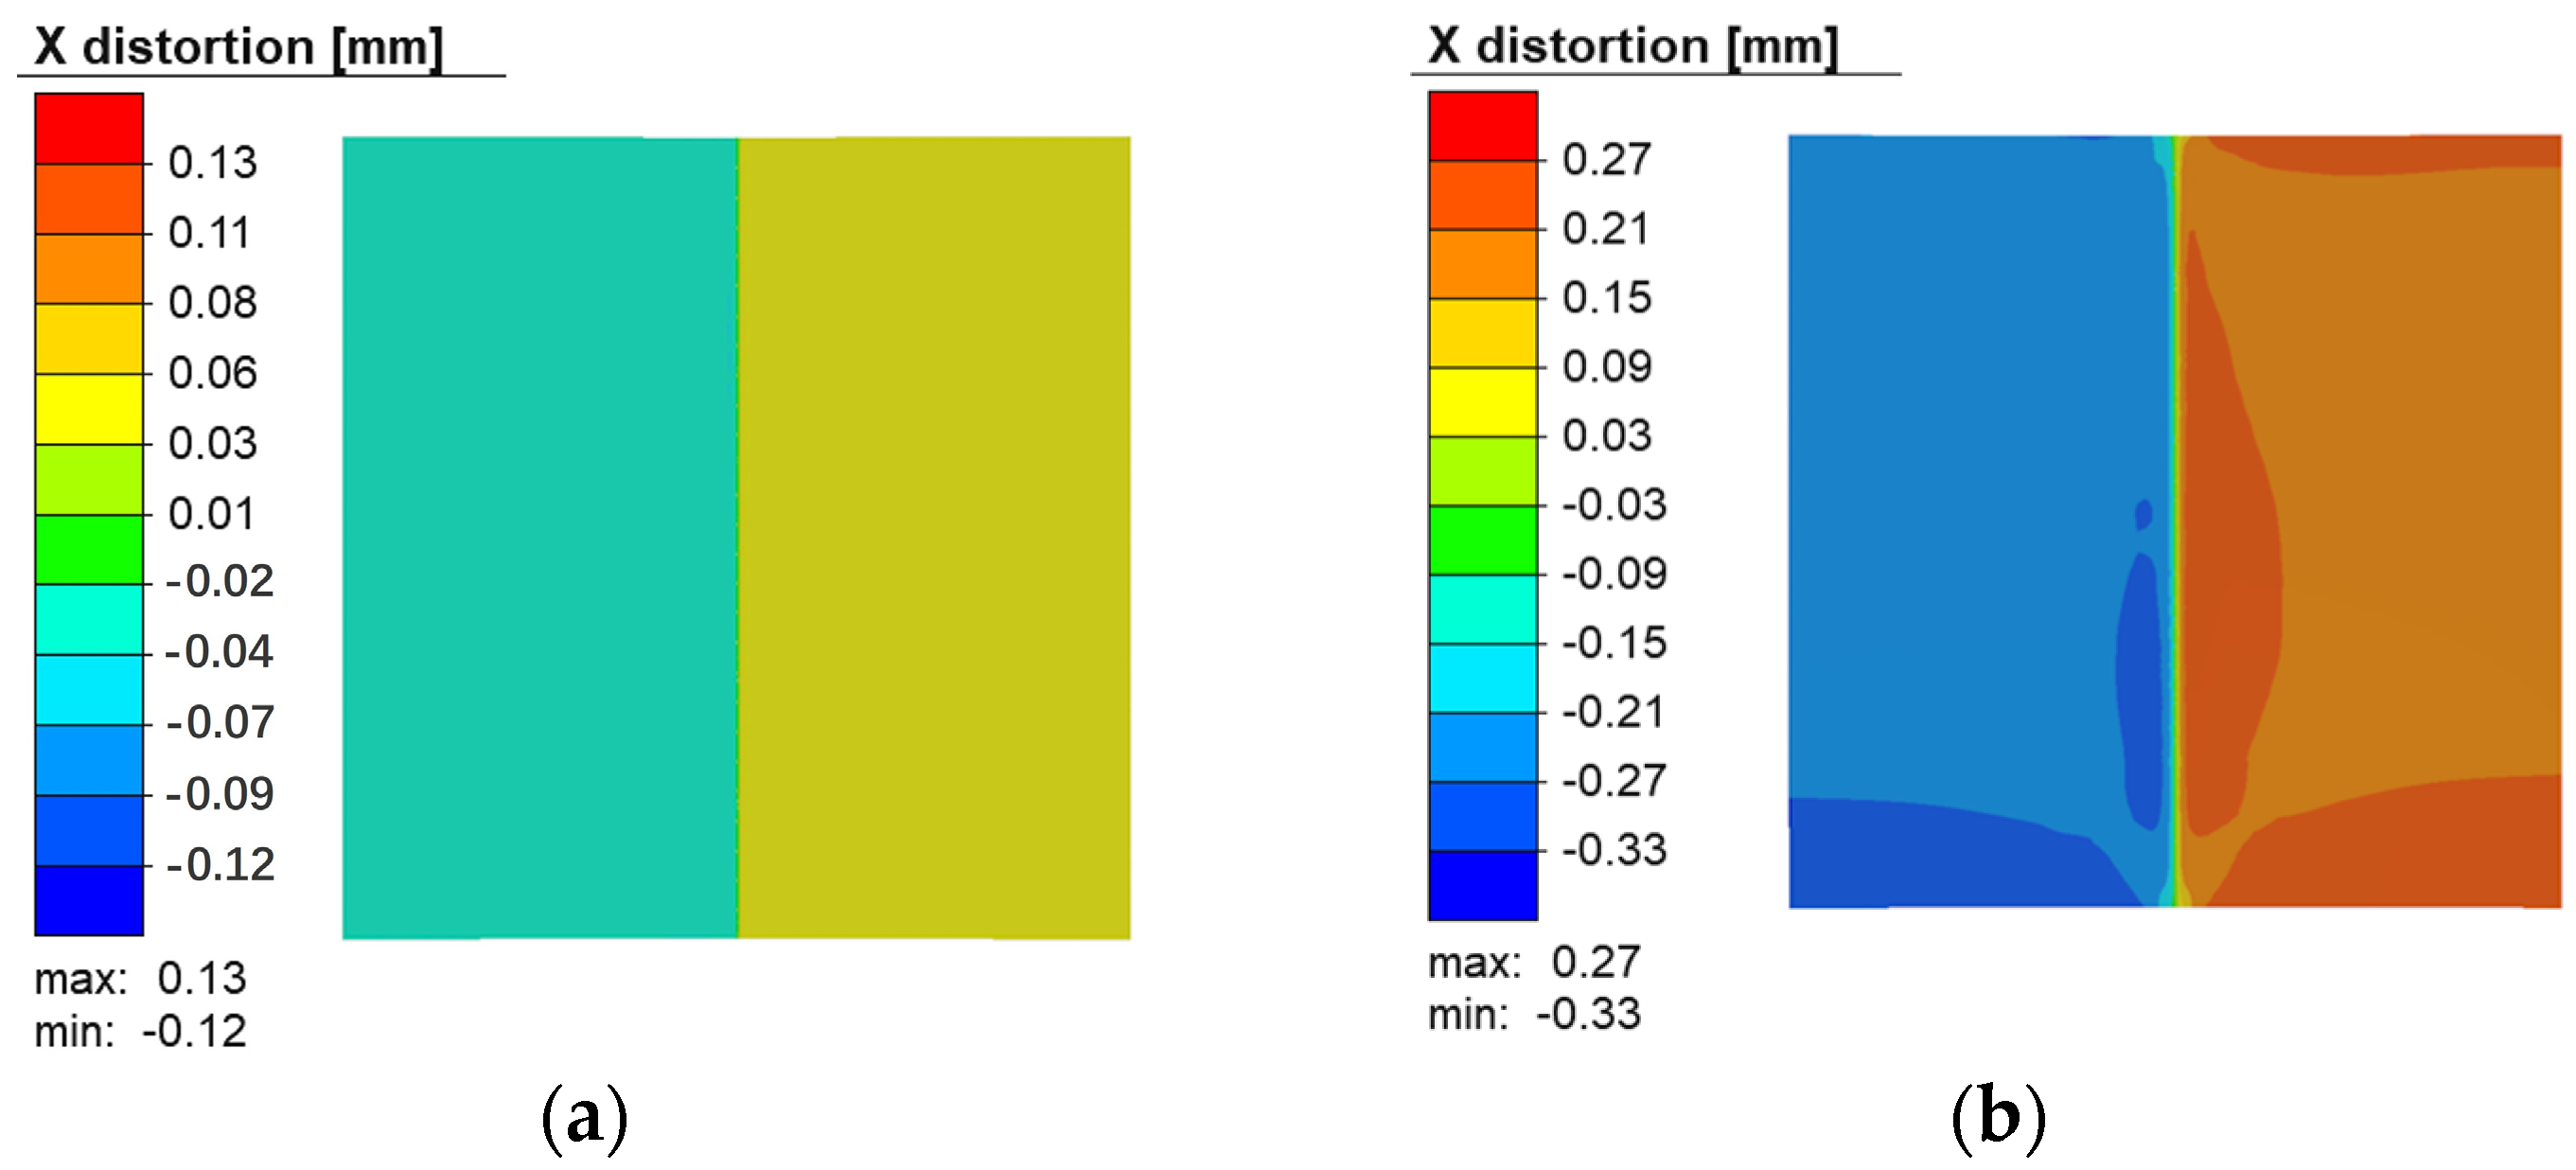
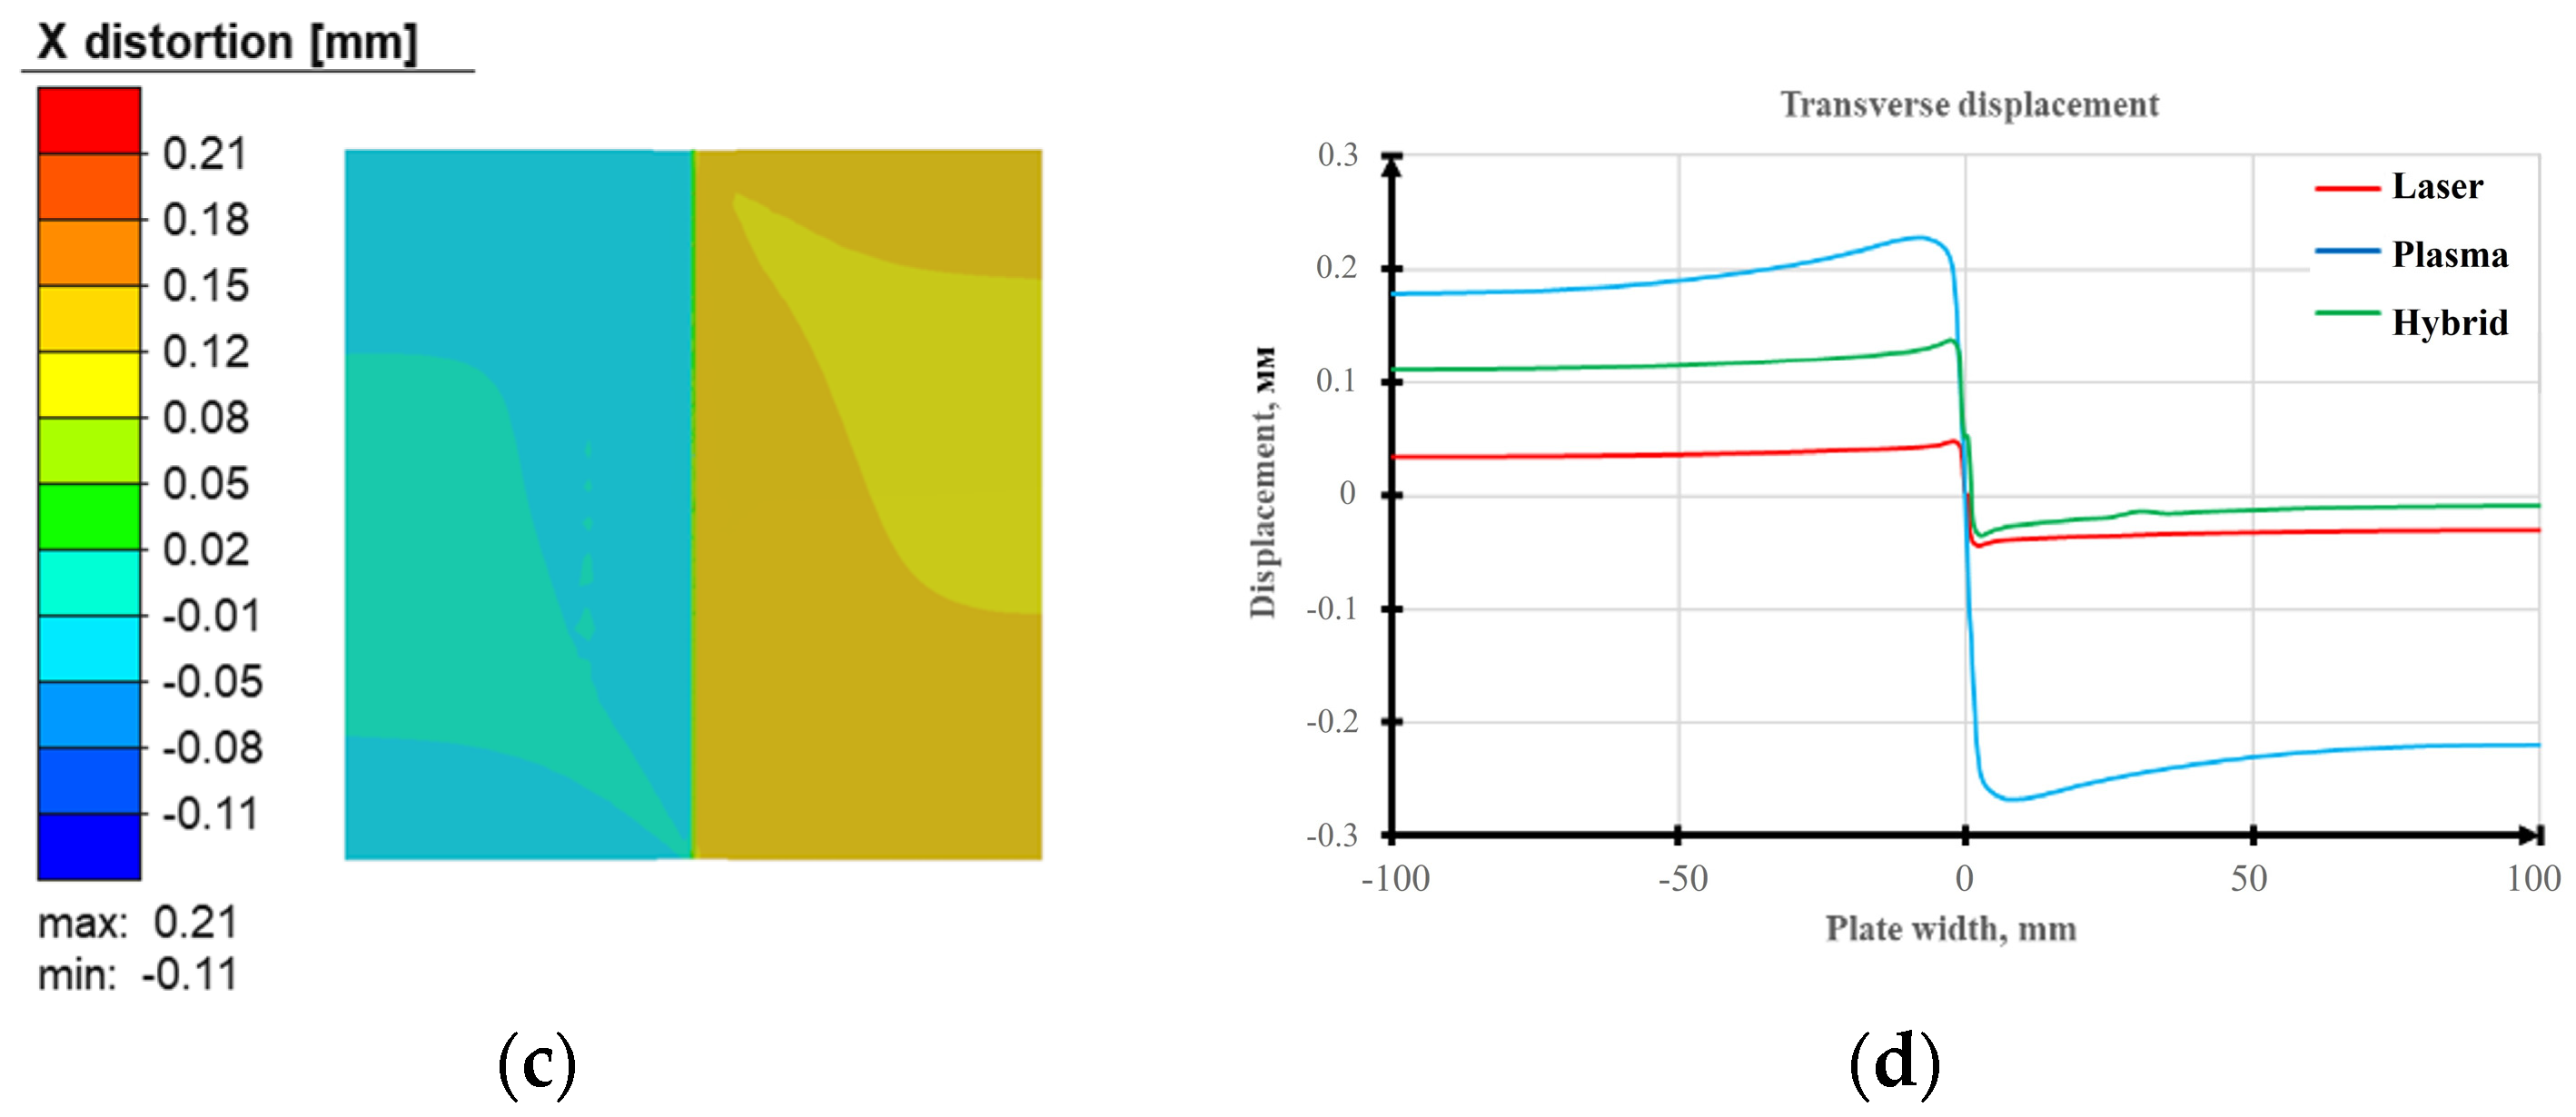
A characteristic shortening of the plates and the welded joint in the transverse direction takes place during welding, which is a generally known phenomenon for the studied welding processes. By analyzing the calculation results presented in Figure 16, one can trace the dependence of the transverse displacements on the thermal impact intensity. This correlation is shown in a complex graph that records the transverse displacements, which are equal to 0.03 mm with the application of laser welding, 0.14 mm in the case of hybrid welding, and 0.23 mm in the case of plasma welding. It was found that for all the welding processes, the maximal transverse displacements are concentrated in the sample’s central part on both sides of the weld.
An analysis of the fields of longitudinal shortening (Figure 17) of the welded joints revealed that they are similar for the applied welding processes. In particular, for the plasma welding process, the greatest shortening (0.45 mm) is concentrated on the weld axis in the near-end area of the welded joint (weld end).
The general nature of the distribution of longitudinal shortening is not uniform, both along the joint width and length, and it is indicative of the distortion of the joint shape. In the case of laser and hybrid welding, the highest values (0.18 mm) of longitudinal shortening also form at the weld end as a result of its shrinkage. In the weld central part, the longitudinal displacements are smaller (up to 0.1 mm), which are attributable to the presence of restraining connections from the near-end regions. The slight asymmetry of the distribution of longitudinal shortening relative to the weld axis is due to the contact interaction of the plates with the backing, which is caused by plate rotation (a feature of process modeling); however, this fact does not have a critical importance.
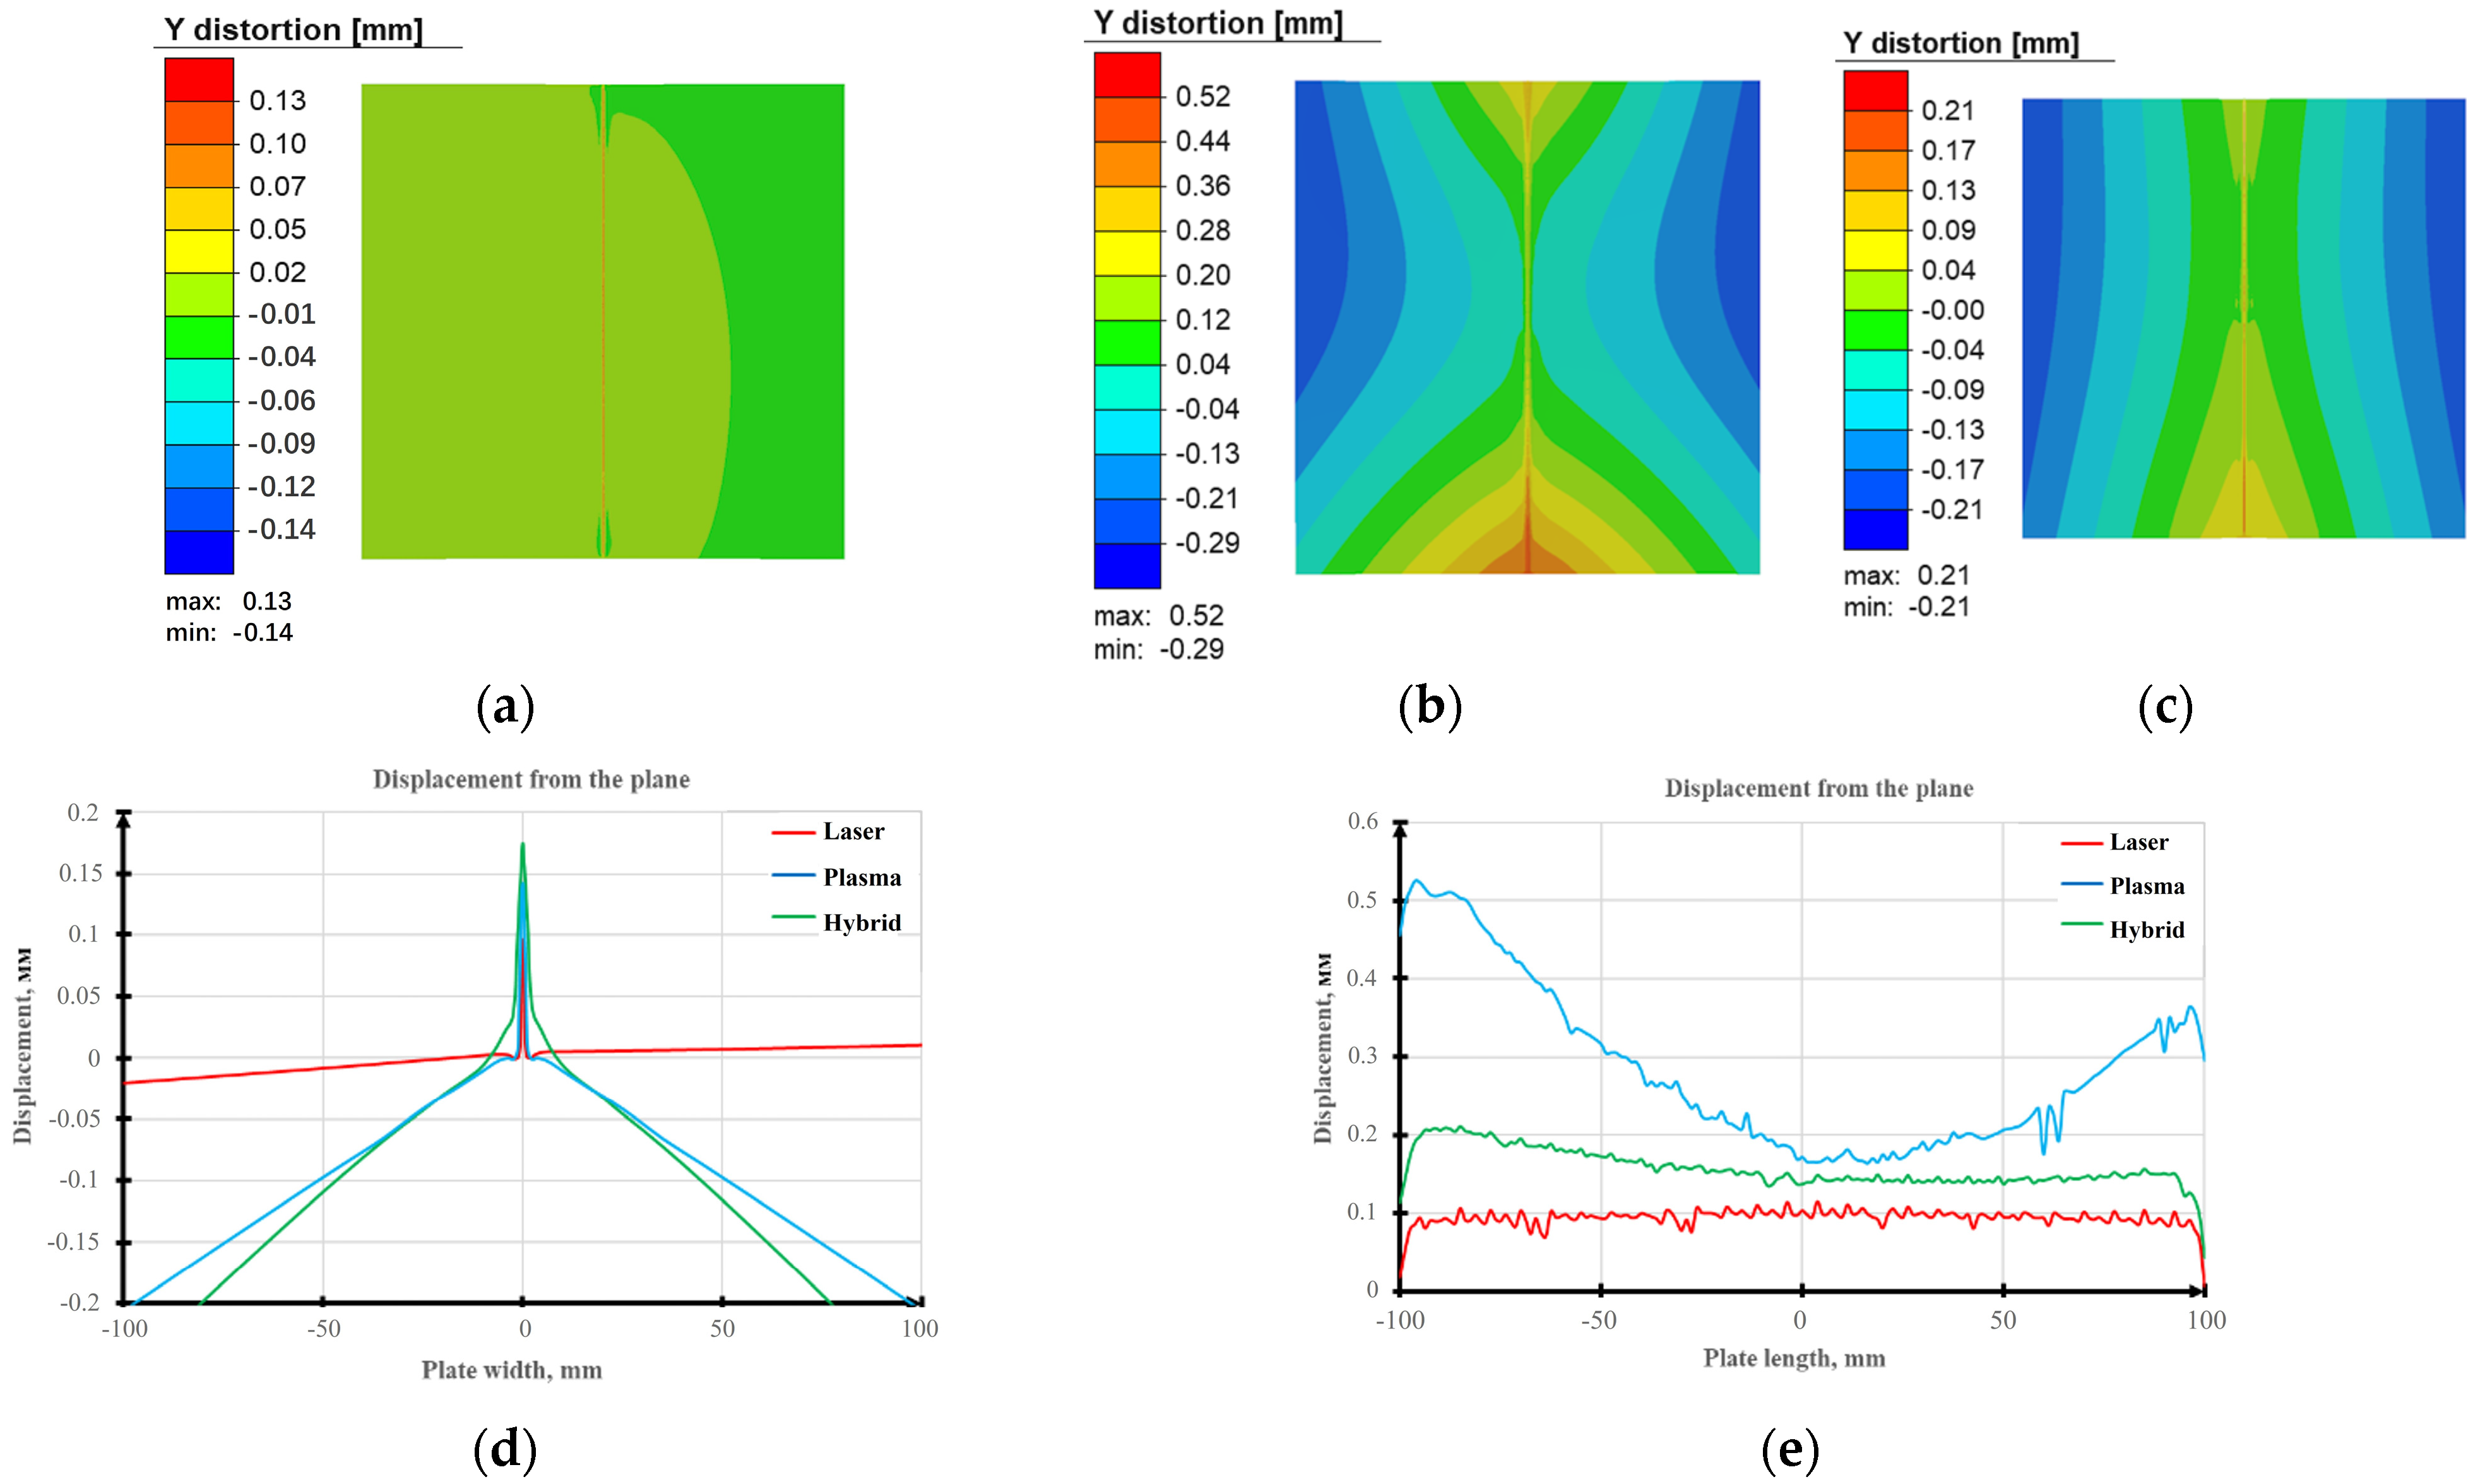
An analysis of the distribution of the fields of residual out-of-plane displacements, as shown in (Figure 18), revealed that after plasma and hybrid welding, relatively small out-of-plane displacements are formed, which are approximately up to 0.52 mm and 0.21 mm, respectively. These displacements are observed at the weld start and end, particularly in the central zone, which is not restrained. In the context of laser welding, where the heat input is much smaller, the distribution of displacements is less intense, but the aforementioned tendency is preserved. An analysis of the data presented in Figure 18d shows that, in the case of laser welding, the displacements reach a maximum of 0.02 mm at the plate edges.
Table 7 presents the model-derived predicted values of stresses and displacements. The maximal values of equivalent stresses for the three considered processes are close and equal to 460–465 MPa. The maximal displacements (approximately 0.5 mm) are expected in the case of plasma welding. The displacements in the cases of laser–plasma and plasma welding are minimal (0.2 mm). The characteristic zones with smaller equivalent stresses (at 150 MPa) in the sample cross-section arise due to the conditions of plate assembly in the assembly–welding fixture with rigid restraints.

3.3. Experimental Evaluation of Residual Stresses in Welded Joints and Verification of Modeling Results

To experimentally verify the calculated predicted values of the residual stressed state, an empirical study was performed on a butt-welded joint made of AISI 304 steel with the size of 200 × 200 mm (δ = 2 mm) that was produced by laser–plasma welding (Figure 19). These investigations were performed using the method of speckle interferometry [28]. The parameters of the welding modes of the studied sample are presented in Table 3.
An electron speckle interferometer (described in [29,30]) was used, and the values of stresses on the sample face side were determined. This method in combination with the hole drilling method has become widely used to determine residual stresses. The applied method consists of recording the displacements arising in the elastic unloading field during hole drilling, and further calculation of the residual stresses using dependencies is derived through finite element modeling of the stressed state [29,31]. The points of stress determination were located on the fusion line (0 mm) and at distances of 2, 4, 6, 10, 15, 25, 35, 45, 60 and 80 mm from the fusion line (0 mm point).
The complexity of residual stress determination using the method of speckle interferometry consists of a need to ensure the diffusion-reflective characteristics of the surface of the AISI 304 steel samples, which will promote the formation of speckle structures during their exposure to laser radiation. For this purpose, the sample surface was etched in a mixture of nitric and hydrochloric acid in the proportion of 1:3. Machining of the studied sample was additionally performed to experimentally determine the residual stresses.
A comparison of the curves of the calculated and experimental values of equivalent stresses showed that, on average, the error between them does not exceed 6% (Figure 20). This is close to the value of the admissible error in stress determination using the speckle interferometry method reported by its developers [32]. Based on the results obtained from the comparison of the curves (Figure 20), we can conclude that the developed calculation procedure for determination of residual welding stresses using the finite element method is suitable for the prediction of equivalent stresses in welded joints, particularly those produced by laser–plasma welding.

3.4. Influence of the Conditions of the Technology and Process of Welding on the Physical–Mechanical Properties of the Produced Joints

Ensuring the required level of mechanical properties is one of the most important components of welded structure reliability, so it is important to understand the influence of hybrid laser–plasma welding on the strength and ductility characteristics of welded joints produced with its application [33]. For this purpose, tensile mechanical testing was performed on a series of samples of AISI 304 steel welded joints fabricated via laser, plasma, and laser–plasma welding without filler wire application.
Testing was conducted using an all-purpose servo–hydraulic MTS 318.25 testing system with a maximal force of 250 kN. During testing, the parameters were monitored using the standard software TestWorks 4 of the MTS 318.25 system.
During static tensile testing of the welded joints, the strength of the weaker region of the welded joints was determined [34]. Ultimate strength was calculated based on a deformation diagram of the procedure envisaged in the ISO 6892-1:2016 standard [35]. During testing, the sample fracture site was determined (weld, HAZ, and base metal) [36]. The test results are shown in Table 8. The tensile strength values were averaged over the data obtained from the three series of testing, each with three samples.

4. Discussion

In order to study the impact of the laser and plasma heat sources on the processes of laser, plasma, and laser–plasma welding of the AISI 304 stainless steel, these welding modes were selected according to the criterion of the best weld formation (Table 3). In this study, the laser–plasma welding mode was additionally selected according to the criterion of minimizing the energy input. A comparison of the energy inputs (q, measured as J/mm) of the studied processes is shown in Figure 21. A comparison of the impact of the laser and plasma heat sources on welded joint formation was conducted by studying the characteristic metal structures, residual stress–strain states and mechanical properties of the joints (Table 4 and Table 5).
The decrease in HV 0.1 microhardness in the weld with the application of laser welding (up to 190 MPa) is attributable to the partial loss of carbon under the impact of laser radiation (Table 4). At the same time, carbon diffusion into the fusion line and HAZ takes place with laser welding, increasing their hardness to 253 MPa and 237 MPa, respectively. With plasma welding, owing to the long period of time of the weld pool existence, carbon diffuses from the fusion line and HAZ into the weld pool, but it does not burn in these areas because of the low intensity of the heat source (Table 4). Softening of the fusion line and HAZ occurs with a simultaneous increase in weld hardness of up to 248 MPa. In the case of laser–plasma welding, in all probability, the processes of carbon diffusion (from the HAZ) and carbon loss compensate each other, leading to the close values of hardness in the weld metal and along the fusion line (232 and 238 MPa, respectively). This makes the laser–plasma welding process preferable. According to [37], the structures produced in the metal of the weld, fusion line, and HAZ should most likely be austenitic.
Investigations of structure formation using laser, plasma, and laser–plasma welding of AISI 304 steel showed that the most favorable structures of the welded joints (with grain shape factor of 4–10) form with laser–plasma welding. More detailed studies revealed that laser–plasma welding allows for the formation of the most favorable grain substructures in the welds. In this case, the subgrain size is 2–10 microns, which is almost half that of plasma welding and close to that of laser welding.
The stress–strain state of the welded samples was studied using a procedure based on calculations of the welding thermal cycles using the finite element method. The developed finite element model was experimentally verified using data recorded by the thermocouples and its acceptable accuracy was determined (up to 15% error) (Figure 11). This model was further used to calculate the equivalent stresses remaining in the AISI 304 steel samples after welding by the studied processes (Figure 12, Figure 13, Figure 14, Figure 15, Figure 16, Figure 17 and Figure 18).
Among the studied welding processes on the whole, the stress–strain state after the hybrid laser–plasma process is less localized than after the laser process, and it is characterized by a lower level of residual stresses and displacements compared to the plasma welding process. Based on these results, hybrid laser–plasma welding is a more favorable process for producing welded joints in terms of the stressed state compared to laser and plasma welding (Table 7, Figure 20).
Based on a comparison of the curves of residual equivalent stresses derived from the experimental and calculation methods (Figure 18), we can conclude that the developed calculation procedure for the determination of residual welding stresses using the finite element method is suitable for predicting stresses and displacements (deformations) in welded joints, including those produced by laser–plasma welding. The experimental verification of this procedure confirmed the calculated pattern of distribution of residual equivalent stresses using laser–plasma welding (Figure 20).
An analysis of the mechanical testing results showed that the strength values of the welded joints produced by hybrid laser–plasma welding are close to the strength of the laser-welded joints and correspond to 97% of the base metal’s strength; these values also exceed the respective values obtained using plasma welding by 10–20 MPa (Table 2 and Table 8). No reduction in the ductility of the welded joint metal relative to the base metal was observed. Here, the relative elongation of the samples produced by hybrid welding is higher than the respective value of the plasma-welded joints by 5–9% (Table 8).
The nature of destruction of a series of samples produced by laser–plasma and laser welding are similar. Initiation of destruction occurs in the HAZ, which is related to metal grain growth due to local overheating, under the impact of the welding thermal cycle with a highly concentrated heat source and as a result of HAZ softening.
Initiation of destruction in the samples welded using the plasma process without filler wire application occurs in the zone of fusion of the weld root with the base metal, and destruction takes place in the weld metal, which is associated with intensive crystal growth, the formation of a coarse-crystalline grain structure and a decrease in microhardness in the weld metal and HAZ (Table 4 and Table 5).
The laser-welded AISI 304 samples also failed along the welds due to internal porosity. This defect is characteristic of high-speed laser welding because of the short time of weld pool existence, which is insufficient for complete degassing of the weld pool from vapors that are formed during the burning-out of nonmetallic inclusions and alloying elements [38,39]. Studies of laser–plasma-welded samples showed an absence of such a defect.
The results of the static tensile tests show that the best values of welded joint mechanical characteristics are ensured using laser and laser–plasma welding (Table 8). The somewhat lower value in ultimate strength obtained with laser–plasma welding than with laser welding (up to 5 MPa) is due to experimental error.
Thus, based on the totality of the studied factors, laser–plasma welding is the most relevant for industrial application. However, the rather high cost of equipment required for such welding limits the possibilities of its application. Laser–plasma welding is best used in large-scale industrial production, which is carried out in closed premises (shops). This can be the manufacturing of round or profiled stainless pipes, structures for the food or chemical industry, instrument making, etc. Owing to an improvement in mechanical properties, a reduction in the number of defects of the internal-pore type, and a decrease in the residual strains and stresses, laser–plasma welding provides good-quality welded joints. Due to its high speed, such welding increases productivity when making extended welds, and the conditions of large-scale production enable a rather quick payback on the cost of equipment.

5. Conclusions

As a result of studying the structure of welds produced by stainless steel welding using laser and plasma energy sources, it was found that the microhardness and grain and the subgrain structure parameters of the welded joint material differ with respect to the dimensions of crystallites, grains, and subgrains. This is associated with the different temperature conditions of weld formation. In the case of laser–plasma welding, a structure with close dimensions of crystallites forms in the weld metal (æ = 4–10). With laser welding, a structure with approximately the same crystallite width forms in the weld metal with a grain shape factor æ = 3.8–5.3, which is associated with the low heat input. With plasma welding, a uniform equiaxed dendritic structure with æ = 6–10 forms in the weld metal. A predominantly coarse-grained structure forms in the HAZ at a relatively uniform level of microhardness in the welded joint zones, and the grains become three times coarser. With laser–plasma and laser welding, the formation of gradient-free cellular structures of a predominantly equiaxed shape was observed in all the welded joint zones, which facilitates and ensures the isotropy of the properties of the strength and crack resistance of the welded joint. With plasma welding, the formation of a substructure with a larger subgrain size in the weld metal results in a decrease in microhardness (compared to laser–plasma and laser welding), which may lead to anisotropy of the mechanical properties in the welded joint zones.
The predicted stress–strain state with the application of laser–plasma welding is less localized than with laser welding, and it is characterized by a lower residual stress level relative to plasma welding. In all samples, the maximal stress values are concentrated in the HAZ. The highest stress (464.6 MPa) forms in the laser-welded sample, and the lowest in the plasma-welded one (461 MPa); however, the highest stress of laser–plasma welding is close to that of the laser process (464 MPa). Maximal displacements (deformations) in the order of 0.5 mm are anticipated with plasma welding. The displacements (deformations) with the application of laser–plasma and laser welding are minimal and close to 0.2 mm.
The method of electron speckle interferometry was used to verify the calculation procedure for predicting the residual stressed state of welded joints produced by laser–plasma welding. The error between the calculated and experimental values is not greater than 6%, which is indicative of the possibility of a wide variety of applications of the developed procedure.
The results of mechanical testing show that under uniaxial tension, the destruction of welded joints made of AISI 304 steel using laser–plasma and laser welding occurs in the zone of transition from the fusion line to the HAZ, and with plasma welding, it runs through the weld metal. With laser–plasma and laser welding, the destruction is attributable to the greater crystallite length, an increase in grain shape factor, and a change in microhardness in the zone of transition from the fusion line to the HAZ. In the case of plasma welding, the destruction in the weld is attributable to the presence of coarse crystallites in it. The strength of the welded joints produced by laser–plasma and laser welding is the highest and equal to 97% of the base metal’s strength.

Author Contributions

Conceptualization, V.S. and V.K. (Volodymyr Korzhyk); methodology, V.S. and V.K. (Volodymyr Korzhyk); validation, S.G., V.K. (Vladyslav Khaskin), D.C., Z.L. and Y.I.; software, V.K. (Viktor Kvasnytskyi), Y.I. and A.P.; formal analysis, V.K. (Viktor Kvasnytskyi), D.C. and Y.I.; investigation, Z.L., Y.I. and A.P.; resources, S.G. and V.K. (Volodymyr Korzhyk); data curation, V.K. (Viktor Kvasnytskyi) and D.C.; writing—original draft preparation, V.S.; writing—review and editing, S.G., Y.I., Z.L., V.K. (Viktor Kvasnytskyi) and A.P.; visualization, V.K. (Vladyslav Khaskin) and D.C.; supervision, V.K. (Volodymyr Korzhyk) and A.P.; project administration, Z.L. and V.K. (Viktor Kvasnytskyi); funding acquisition, S.G. All authors have read and agreed to the published version of the manuscript.

Funding

This work was funded within the following programs: Strategic project of the Academy of Sciences of Guangdong Province (GDAS’ Project of Science and Technology Development [2020GDASYL-20200301001]), China; Research projects of China [G2023030004L], China; National Key Research and Development Program of China [2023YFE0201500]; and GDAS’ Project of Science and Technology Development [2022GDASZH–2022010203, 2021GDASYL-20210103085], China.

Data Availability Statement

The original contributions presented in the study are included in the article, further inquiries can be directed to the corresponding author.

Conflicts of Interest

The authors declare no conflicts of interest.

References

  1. Acherjee, B. Hybrid laser arc welding: State-of-art review. Opt. Laser Technol. 2018, 99, 60–71. [Google Scholar] [CrossRef]
  2. Gook, S.; El-Batahgy, A.M.; Gumenyuk, A.; Biegler, M.; Rethmeier, M. Application of Hybrid Laser Arc Welding for Construction of LNG Tanks Made of Thick Cryogenic 9% Ni Steel Plates. Lasers Manuf. Mater. Process. 2023, 10, 659–680. [Google Scholar] [CrossRef]
  3. Stelling, K.; Schobbert, H.; Kannengiesser, T.; Boellinghaus, T. Vertical-up and -down Laser Plasma Powder Hybrid Welding of a High Nitrogen Austenitic Stainless Steel. Weld. World 2013, 49, 45–49. [Google Scholar] [CrossRef]
  4. Mu, Z.; Chen, X.; Zheng, Z.; Huang, A.; Pang, S. Laser cooling arc plasma effect in laser-arc hybrid welding of 316L stainless steel. Int. J. Heat Mass Transfer. 2019, 132, 861–870. [Google Scholar] [CrossRef]
  5. Górka, J.; Stano, S. Microstructure and Properties of Hybrid Laser Arc Welded Joints (Laser Beam-MAG) in Thermo-Mechanical Control Processed S700MC Steel. Metals 2018, 8, 132. [Google Scholar] [CrossRef]
  6. Schultz, V.; Woizeschke, P. High Seam Surface Quality in Keyhole Laser Welding: Buttonhole Welding. J. Manuf. Mater. Process. 2018, 2, 78. [Google Scholar] [CrossRef]
  7. Han, J.; Shi, Y.; Zhang, G.; Korzhyk, V.; Le, W.-Y. Minimizing defects and controlling the morphology of laser welded aluminum alloys using power modulation-based laser beam oscillation. J. Manuf. Process. 2022, 83, 49–59. [Google Scholar] [CrossRef]
  8. Svenungsson, J.; Choquet, I.; Kaplan, A.F.H. Laser Welding Process—A Review of Keyhole Welding Modelling. Phys. Procedia 2015, 78, 182–191. [Google Scholar] [CrossRef]
  9. Emmelmann, C.; Kirchhoff, M.; Petri, N. Development of Plasma-Laser-Hybrid Welding Process. Phys. Procedia 2011, 12, 194–200. [Google Scholar] [CrossRef]
  10. Swanson, P.T.; Page, C.J.; Read, E.; Wu, H.Z. Plasma augmented laser welding of 6 mm steel plate. Sci. Technol. Weld. Join. 2007, 12, 153–160. [Google Scholar] [CrossRef]
  11. Xu, Y.; Hou, X.; Shi, Y.; Zhang, W.; Gu, Y.; Feng, C.; Korzhyk, V. Correlation between the microstructure and corrosion behaviour of copper/316 L stainless-steel dissimilar-metal welded joints. Corros. Sci. 2021, 191, 109729. [Google Scholar] [CrossRef]
  12. Gu, Y.; Xu, Y.; Shi, Y.; Feng, C.; Korzhyk, V. Corrosion resistance of 316 stainless steel in a simulated pressurized water reactor improved by laser cladding with chromium. Surf. Coat. Technol. 2022, 441, 128534. [Google Scholar] [CrossRef]
  13. Mahrle, A.; Rose, S.; Schnick, M.; Beyer, E.; Füssel, U. Laser-assisted plasma arc welding of stainless steel. J. Laser Appl. 2013, 25, 032006. [Google Scholar] [CrossRef]
  14. Clemens, M.; Warnecke, L.; Olschok, S.; Reisgen, U.; Steiner, M.F. Direction-independent laser-GMA hybrid welding with coaxial wire feed and annular beam. Weld. World 2023, 67, 89–97. [Google Scholar] [CrossRef]
  15. Markashova, L.I.; Poznyakov, V.D.; Shelyagin, V.D.; Berdnikova, E.N.; Bernatsky, A.V.; Alekseenko, T.A. Effect of metal structure on service properties of high-strength steel welded joints produced using different methods of welding. Paton Weld. J. 2018, 2, 7–13. [Google Scholar] [CrossRef]
  16. Hipp, D.; Mahrle, A.; Beyer, E.; Jäckel, S.; Hertel, M.; Füssel, U. Thermal Efficiency Analysis for Laser-Assisted Plasma Arc Welding of AISI 304 Stainless Steel. Materials 2019, 12, 1460. [Google Scholar] [CrossRef] [PubMed]
  17. Deng, D. FEM prediction of welding residual stress and distortion in carbon steel considering phase transformation effects. Mater. Des. 2009, 30, 359–366. [Google Scholar] [CrossRef]
  18. Evin, E.; Tomáš, M. The Influence of Laser Welding on the Mechanical Properties of Dual Phase and Trip Steels. Metals 2017, 7, 239. [Google Scholar] [CrossRef]
  19. Yu, T.; Zhong, F.; Zhang, F.; Ying, C.; Geng, G. Application of Scanning Electron Microscopy in Metal Material Detection. J. Phys. Conf. Ser. 2021, 2002, 012010. [Google Scholar] [CrossRef]
  20. Lobanov, L.M.; Pivtorak, V.A.; Savitsky, V.V.; Tkachuk, G.I. Procedure for determination of residual stresses in welded joints and structural elements using electron speckle-interferometry. Paton Weld. J. 2006, 1, 24–29. [Google Scholar]
  21. Korzhyk, V.M.; Grynyuk, A.A.; Khaskin, V.Y.; Illiashenko, Y.V.; Klochkov, I.M.; Ganushchak, O.V.; Yu, X.; Liuyi, H. Improving the efficiency of robotic fabrication of steel truss welded structures. Paton Weld. J. 2021, 5, 12–18. [Google Scholar] [CrossRef]
  22. Anca, A.; Cardona, A.; Risso, J.; Fachinotti, V.D. Finite element modeling of welding processes. Appl. Math. Model. 2011, 35, 688–707. [Google Scholar] [CrossRef]
  23. Tritt, T.M. Thermal Conductivity: Theory, Properties, and Applications; Physics of Solids and Liquids (PSLI); Springer: New York, NY, USA, 2004; 290p. [Google Scholar] [CrossRef]
  24. Khudyakov, A.; Korobov, Y.; Danilkin, P.; Kvashnin, V. Finite element modeling of multiple electrode submerged arc welding of large diameter pipes. IOP Conf. Ser. Mater. Sci. Eng. 2019, 681, 012025. [Google Scholar] [CrossRef]
  25. Goldak, J.A.; Akhlagi, M. Computational Welding Mechanics; Springer: New York, NY, USA, 2005; 322р. [Google Scholar] [CrossRef]
  26. Li, Y.; Bushby, A.J.; Dunstan, D.J. The Hall–Petch effect as a manifestation of the general size effect. Proc. Math. Phys. Eng. Sci. 2016, 472, 20150890. [Google Scholar] [CrossRef] [PubMed]
  27. Asgari, M.; Kouchakzadeh, M.A. An equivalent von Mises stress and corresponding equivalent plastic strain for elastic-plastic ordinary peridynamics. Meccanica 2019, 54, 1001–1014. [Google Scholar] [CrossRef]
  28. Lobanov, L.; Pivtorak, V.; Savitsky, V.; Tkachuk, G. Technology and Equipment for Determination of Residual Stresses in Welded Structures Based on the Application of Electron Speckle-Interferometry. Mater. Sci. Forum 2013, 768–769, 166–173. [Google Scholar] [CrossRef]
  29. Lobanov, L.M.; Pivtorak, V.A.; Savitsky, V.V.; Tkachuk, G.I. Determination of residual stresses in structural elements based on application of electronic speckle-interferometry and finite element method. In Proceedings of the 13th International Conference on Fracture, Beijing, China, 16–21 June 2013. [Google Scholar]
  30. Korzhyk, V.; Khaskin, V.; Savitsky, V.; Klochkov, I.; Kvasnytsyi, V.; Perepichay, A.; Peleshenko, S.; Grynyuk, A.; Aloshyn, A.; Shutkevych, O. Calculation-experimental procedure for determining welding deformations and stresses based on a digital image correlation method. East.-Eur. J. Enterp. Technol. 2022, 5, 44–52. [Google Scholar] [CrossRef]
  31. Lobanov, L.M.; Kondratenko, I.P.; Mikhalskyi, V.M.; Pashchin, M.O.; Karlov, O.M.; Chopyk, V.V.; Mykhodui, O.L. Electrotechnical Complex for Electrodynamic Processing of Welded Joints. Tech. Electrodyn. 2020, 2020, 1–3. [Google Scholar] [CrossRef]
  32. Lobanov, L.; Savitsky, V. Residual Stresses Determination with Plasticity Effects by Electron Speckle-Interferometry Hole-Drilling Method. Mater. Res. Proc. 2016, 2, 389–394. [Google Scholar] [CrossRef]
  33. Zhang, W.; Xu, Y.; Shi, Y.; Su, G.; Gu, Y.; Korzhyk, V. Intergranular corrosion characteristics of high-efficiency wire laser additive manufactured Inconel 625 alloys. Corros. Sci. 2022, 205, 110422. [Google Scholar] [CrossRef]
  34. Viňáš, J.; Brezinová, J.; Sailer, H.; Brezina, J.; Sahul, M.; Maruschak, P.; Prentkovskis, O. Properties Evaluation of the Welded Joints Made by Disk Laser. Materials 2021, 14, 2002. [Google Scholar] [CrossRef] [PubMed]
  35. ISO 6892-1:2019; Metallic Materials—Tensile Testing—Part 1: Method of Test at Room Temperature. ISO: Geneva, Switzerland, 2019.
  36. Viňáš, J.; Brezinová, J.; Brezina, J.; Maruschak, P.O. Structural and Mechanical Features of Laser-Welded Joints of Zinc-Coated Advanced Steel Sheets. Mater. Sci. 2019, 55, 46–51. [Google Scholar] [CrossRef]
  37. Meng, Y.; Fengping, Z.; Liuyi, H.; Shuo, J.; Chao, P.; Korzhyk, V. Study on Efficient Determination of the Content of Key Elements in Thin Stainless Steel by Spark Discharge Optical Emission Spectrometry with Contrivable Sample Thickening. J. Phys. Conf. Ser. 2023, 2539, 012068. [Google Scholar] [CrossRef]
  38. Hafez, K.M. The influence of shielding gases on keyhole-induced porosity and nitrogen absorption in SS 304 stainless steel fiber laser welds. Int. J. Adv. Manuf. Technol. 2023, 127, 1887–1894. [Google Scholar] [CrossRef]
  39. Sun, J.; Nie, P.; Feng, K.; Li, Z.; Guo, B.; Jiang, E. The elimination of pores in laser welds of AISI 304 plate using different shielding gases. J. Mater. Process. Technol. 2017, 248, 56–63. [Google Scholar] [CrossRef]
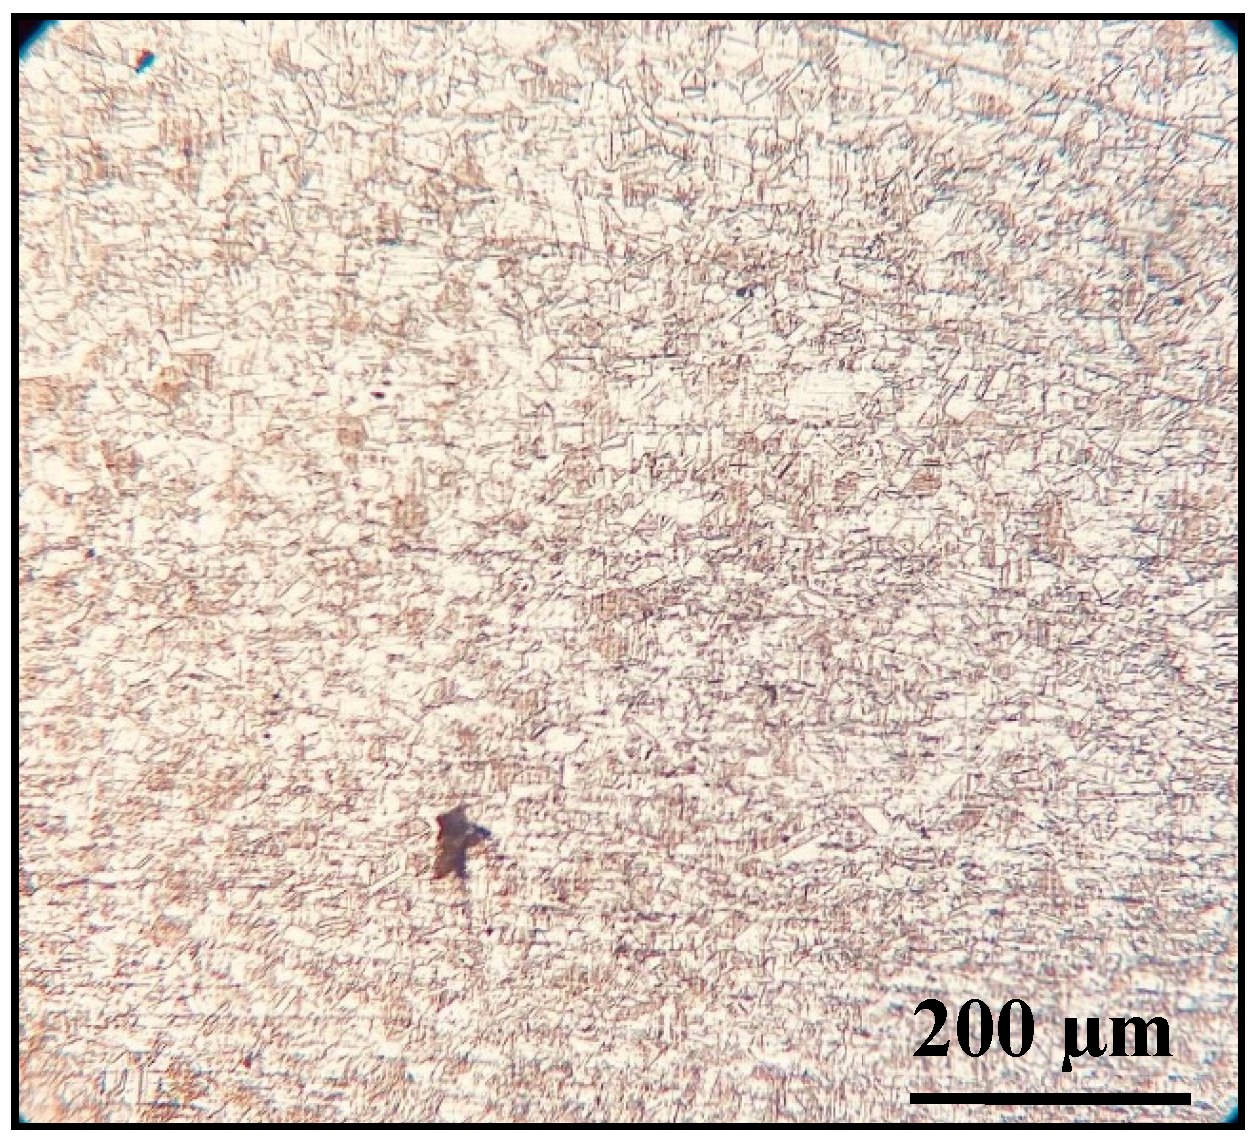
Figure 1. Microstructure of the 2 mm thick AISI 304 base metal.
Metals 14 00706 g001
Figure 2. Equipment (a) for conducting the experiments with a coaxial head for laser–plasma welding, and a clamp (b) with the sample prepared for welding with caulked-in thermocouples.
Metals 14 00706 g002
Figure 3. Three-dimensional finite element models of (a) a butt joint and (b) a butt joint in a fixture.
Metals 14 00706 g003
Figure 4. Model of bulk welding heat source, adapted from J. Goldak [25].
Metals 14 00706 g004
Figure 5. Model of a conical heat source for laser welding: re is the beam radius on the product surface; ri is the beam radius on the product back surface; ze is the distance along the z-coordinate from the origin of the system of coordinates to the product surface; zi is the distance along the z-coordinate from the origin of the system of coordinates to the product back surface; y is the coordinate in the longitudinal direction of the welded joint; x is the coordinate in the transverse direction of the welded joint; and Q0 is the specific amount of energy within the bulk conical heat source, J/mm3.
Metals 14 00706 g005
Figure 6. Microstructure of welded joint (2 mm) produced by laser–plasma welding: (a) weld metal; (b) fusion line; (c) HAZ; (d) schematic image of crystallites.
Metals 14 00706 g006
Figure 7. Microstructure of laser-welded joint (2 mm): (a) weld metal; (b) fusion line; (c) HAZ: (d) schematic representation of crystallites.
Metals 14 00706 g007
Figure 8. Microstructure of plasma-welded joint (2 mm): (a) weld metal; (b) fusion line; (c) HAZ; (d) schematic image of crystallites.
Metals 14 00706 g008
Figure 9. Microstructure of cast metal sections of AISI 304 welded joints obtained via laser–plasma (a), laser (b) and plasma (c) welding.
Metals 14 00706 g009
Figure 10. Temperature distribution in the middle cross-section at the moment of the source impact for the considered welding processes.
Metals 14 00706 g010
Figure 11. Calculated and experimental thermal cycles when welding the AISI 304 steel: (a) laser; (b) plasma; and (c) laser–plasma.
Metals 14 00706 g011aMetals 14 00706 g011b
Figure 12. Distribution of equivalent plastic deformations in the weld cross-section: (a) laser welding, (b) plasma welding, (c) hybrid welding, and (d) combined graph of plastic deformation distribution.
Metals 14 00706 g012
Figure 13. Distribution of longitudinal residual welding stresses in the cross-section of the weld: (a) laser welding, (b) plasma welding, (c) hybrid welding, and (d) combined graph of stress distribution.
Metals 14 00706 g013
Figure 14. Distribution of transverse residual welding stresses: (a) laser welding, (b) plasma welding, (c) hybrid welding, and (d) combined distribution graph.
Metals 14 00706 g014
Figure 15. Distribution of equivalent residual welding stresses: (a) laser welding, (b) plasma welding, (c) hybrid welding, and (d) combined graph of stress distribution.
Metals 14 00706 g015
Figure 16. Distribution of transverse displacements: (a) laser welding, (b) plasma welding, (c) hybrid welding, and (d) combined graph of movement distribution.
Metals 14 00706 g016aMetals 14 00706 g016b
Figure 17. Distribution of longitudinal displacements: (a) laser welding, (b) plasma welding, (c) hybrid welding, and (d) combined graph of displacement distribution.
Metals 14 00706 g017
Figure 18. Distribution of out-of-plane displacements of the plate: (a) laser welding, (b) plasma welding, (c) hybrid welding, (d) combined graph of movement distribution in the cross-section, and (e) combined graph of distribution of displacements in the longitudinal section along the weld axis.
Metals 14 00706 g018
Figure 19. Performance of stressed state measurements (a) and sample appearance after taking the measurements (b).
Metals 14 00706 g019
Figure 20. Curves of the calculated and experimental values of equivalent stresses in the AISI 304 welded joint produced by laser–plasma welding.
Metals 14 00706 g020
Figure 21. Energy inputs of hybrid (1), laser (2), and plasma (3) welding of AISI 304 steel.
Metals 14 00706 g021
Table 1. Chemical element content (wt. %) of AISI 304 stainless steel and filler wire used for welding.
MaterialFeCSiMnNiCrCuPS
AISI 304 steel Base0.080.8-8–1018–200.5–1.00.0450.03
Table 2. Mechanical properties of AISI 304 steel.
Young’s Modulus, GPaYield Limit σ0.2, MPaUltimate Strength, σt, MPaRelative Elongation, %
193300654.444.45
Table 3. Parameters of AISI 304 steel welding modes (parameters that provided the best results are highlighted in bold).
ProcessP, kWI, AU, VV, m/minΔF, * mmq, J/mm
Laser0.6--0.80.445
0.810.748
1.01.21.050
Plasma-7019.80.2-416
8020.80.3333
9021.20.4286
Hybrid0.67025.41.10.4130
0.88027.21.50.7119
1.09028.51.71.0126
* ΔF—depth of focus, in mm; q—energy input, in J/mm.
Table 4. Structure parameters of AISI 304 welded joints produced by laser, plasma, and laser–plasma welding.
ProcessParametersZone
WeldFusion LineHAZBM
Hybrid weldingh 1 × l 2, µm(10–15) × (40–150)(8–15) × (80–170)--
æ 3 (l/h)4–1010–11--
Dg 4, µm-8–17 Weld, 5–15 (20) HAZ,65–155–18
HV 5 0.1232238212220
Laser weldingh × l, µm(8–15) × (30–80)(5–10) × (50–100)--
æ (l/h)3.8–5.310--
Dg, µm-8–16 Weld, 4–12 HAZ5–155–18
HV 0.1190253237241
Plasma weldingh × l, µm(10–50) × (100–300)(10–20) × (60–200) Weld
(5–20) × (30–100) HAZ
--
æ (l/h)6–106–10 Weld, 5–6 HAZ--
Dg, µm-10–20 Weld, 10–15 HAZ10–305–20
HV 0.1248220208231
1 h—grain height (on the microsection); 2 l—grain length (on the microsection), in µm; 3 æ—grain shape factor (æ = l/h); 4 Dg—grain size, in µm; 5 HV—microhardness, in MPa; 6 weld and HAZ—corresponding values for the weld and HAZ.
Table 5. Substructure parameters of AISI 304 welded joints produced by laser–plasma, laser, and plasma welding.
ProcessParametersZone
WeldFusion Line HAZBM
Laser–plasma weldingdS 1, µm 2–102–105–153–5
hTW 2, µm 0.1–0.20.1–0.2-0.1–0.5
Laser weldingdS, µm6–10
2–4 × 8–12
2–62–4 × 5–203–5
hTW, µm0.1–0.30.1–0.3-0.1–0.8
Plasma weldingdS, µm5–20
3–6 × 10–20
5–105–7 × 20–403–8
hTW, µm0.1–0.50.1–0.5-0.1–0.8
1 dS—subgrain size, in µm; 2 hTW—twin width, in µm.
Table 6. Actual and modeled shapes of AISI 304 steel penetration and comparison of their geometrical parameters.
ProcessWeld Width, mm
Face Side/Back
Pool Section in the Macrosection Pool Section in the Calculation Model
LaserActual1.6/0.5Metals 14 00706 i001Metals 14 00706 i002
Modeled1.6/0.5
PlasmaActual4.2/1.5Metals 14 00706 i003Metals 14 00706 i004
Modeled4/1.7
HybridActual2.4/0.7Metals 14 00706 i005Metals 14 00706 i006
Modeled2.5/0.5
Table 7. Magnitudes of equivalent residual welding stresses and displacements (strains) derived from modeling.
ProcessEquivalent Stresses, MPaDisplacements, mm
MaximumMinimumMaximumMinimum
Laser464.560.090.170
Plasma461.181.290.52−0.29
Hybrid4640.140.20.1
Table 8. Results of static tensile testing of welded joint samples.
Welding Process Fracture SiteUltimate Strength σt, MPaRelative Elongation, d %
HybridInitiation and fracture in the HAZ near the fusion line 645.651.55
LaserInitiation and fracture in the HAZ near the fusion line 647.152.5
PlasmaInitiation in the zone of fusion of the weld root with the base metal; fracture in the weld metal 638.845.9
Disclaimer/Publisher’s Note: The statements, opinions and data contained in all publications are solely those of the individual author(s) and contributor(s) and not of MDPI and/or the editor(s). MDPI and/or the editor(s) disclaim responsibility for any injury to people or property resulting from any ideas, methods, instructions or products referred to in the content.