Article

Effect of a Gradient Temperature Rolling Process on the Microstructure and Mechanical Properties of the Center of Ultra-Heavy Plates

1
Collaborative Innovation Center of Steel Technology, University of Science and Technology Beijing, Beijing 100083, China
2
Xiangtan Iron & Steel Group Co., Ltd., Xiangtan 411200, China
*
Author to whom correspondence should be addressed.
Metals 2024, 14(2), 199; https://doi.org/10.3390/met14020199
Submission received: 20 December 2023 / Revised: 25 January 2024 / Accepted: 4 February 2024 / Published: 6 February 2024
(This article belongs to the Special Issue Design, Preparation and Properties of High Performance Steels)

Abstract

:
As there is a small amount of deformation in the center during the rolling process of ultra-heavy plates, it is extremely easy to cause poor mechanical properties in the center. Increasing the deformation in the center is the most feasible method to eliminate the deformation effects in the cross-section of ultra-heavy plates. In this study, the gradient temperature rolling (GTR) process is compared with the traditional uniform temperature rolling (UTR) process. It is found that the GTR process can significantly increase the deformation in the center and thereby refine the grains. The room temperature tensile test and instrumented Charpy impact test are used to test the strength at room temperature and impact energy at low temperature. Combined with the obtained impact load/energy displacement curve, the deformation and damage process under impact load are analyzed. The microstructure morphology and impact fracture obtained by different rolling processes in the center are analyzed by experimental methods such as OM, SEM, EBSD, etc. The prior austenite grain (PAG) boundary morphology is analyzed and the densities of grain boundaries are statistically quantified. The results showed that the strength, plasticity, and low-temperature toughness of the GTR process are improved compared to the UTR process, with increased dislocation density in the center microstructure, the density of PAG boundaries, and the density of packet boundaries. The size of the PAG in the center is refined by ~49%, the density of PAG boundaries increased by ~140%, the density of high-angle packet boundaries increased by ~39%, and the density of low-angle packet boundaries increased by ~49%. The crack propagation in the instrumented Charpy impact test of the GTR process showed stable expansion, indicating a ductile fracture compared to the semi-brittle fracture of the UTR process. The densities of PAG boundaries and high-angle packet boundaries are the most important factors affecting the strength and low-temperature toughness.

1. Introduction

The application prospects of an ultra-heavy plate in major technical equipment manufacturing fields such as marine engineering, pressure vessels, nuclear power, wind power, military, heavy machinery, mold manufacturing, etc., are enormous and the functional requirements for its welding performance, high strength, low-temperature toughness, etc., are also increasing [1,2,3,4,5]. At present, the primary problem affecting the quality of ultra-heavy plates is the uneven distribution of microstructures and mechanical properties in the thickness direction (cross-sectional effect) [4,6,7,8,9]. The difference in the properties of the center of ultra-heavy plates compared to other locations is mainly due to the differences in transformation and precipitates caused by temperature and strain fields, especially the microstructure, grain boundaries, and precipitates.
The elimination of the cross-sectional effect of ultra-heavy plates is mainly achieved through the TMCP (thermomechanical control) process and heat treatment process [4,5,8,10,11,12]. Due to the limitation of thermal conductivity, the center is prone to insufficient cooling capacity, resulting in uneven microstructural properties during the heat treatment process, especially the appearance of granular bainite, which affects the strength and toughness. The TMCP process is a key technology for the production of ultra-heavy plates with low cost and high efficiency. However, due to the uneven deformation during rolling and the uneven distribution of the temperature field during cooling, it is bound to cause problems such as uneven microstructural properties in the thickness direction, difficulty in quality controlling, and large differences in section characteristics, mainly due to poor toughness of the central microstructure, which affects the application of the material [8]. The GTR process is an effective method to solve this problem. It uses a laminar cooling/rapid cooling process to form a temperature gradient in the thickness direction of the slab before rolling, with the center temperature being far higher than the surface temperature [4,8]. The lower deformation resistance of the higher center temperature makes deformation easier to penetrate into the center, resulting in more uniform deformation and recrystallization of the steel plate in the thickness direction [8,13].
Research on the GTR process mainly focuses on the simulation of temperature gradients during the rolling process, the deformation penetration at different locations after rolling, and the impact on mechanical properties. However, there is a lack of research on microstructural refinement, especially the impact of various types of grain boundary densities on the strength and toughness. This study compares the GTR process with the traditional UTR process, distinguishes different grain boundary types, and analyzes the impact of different rolling processes on the microstructure and mechanical properties of the center from dislocation density, grain boundary types, and grain boundary density.

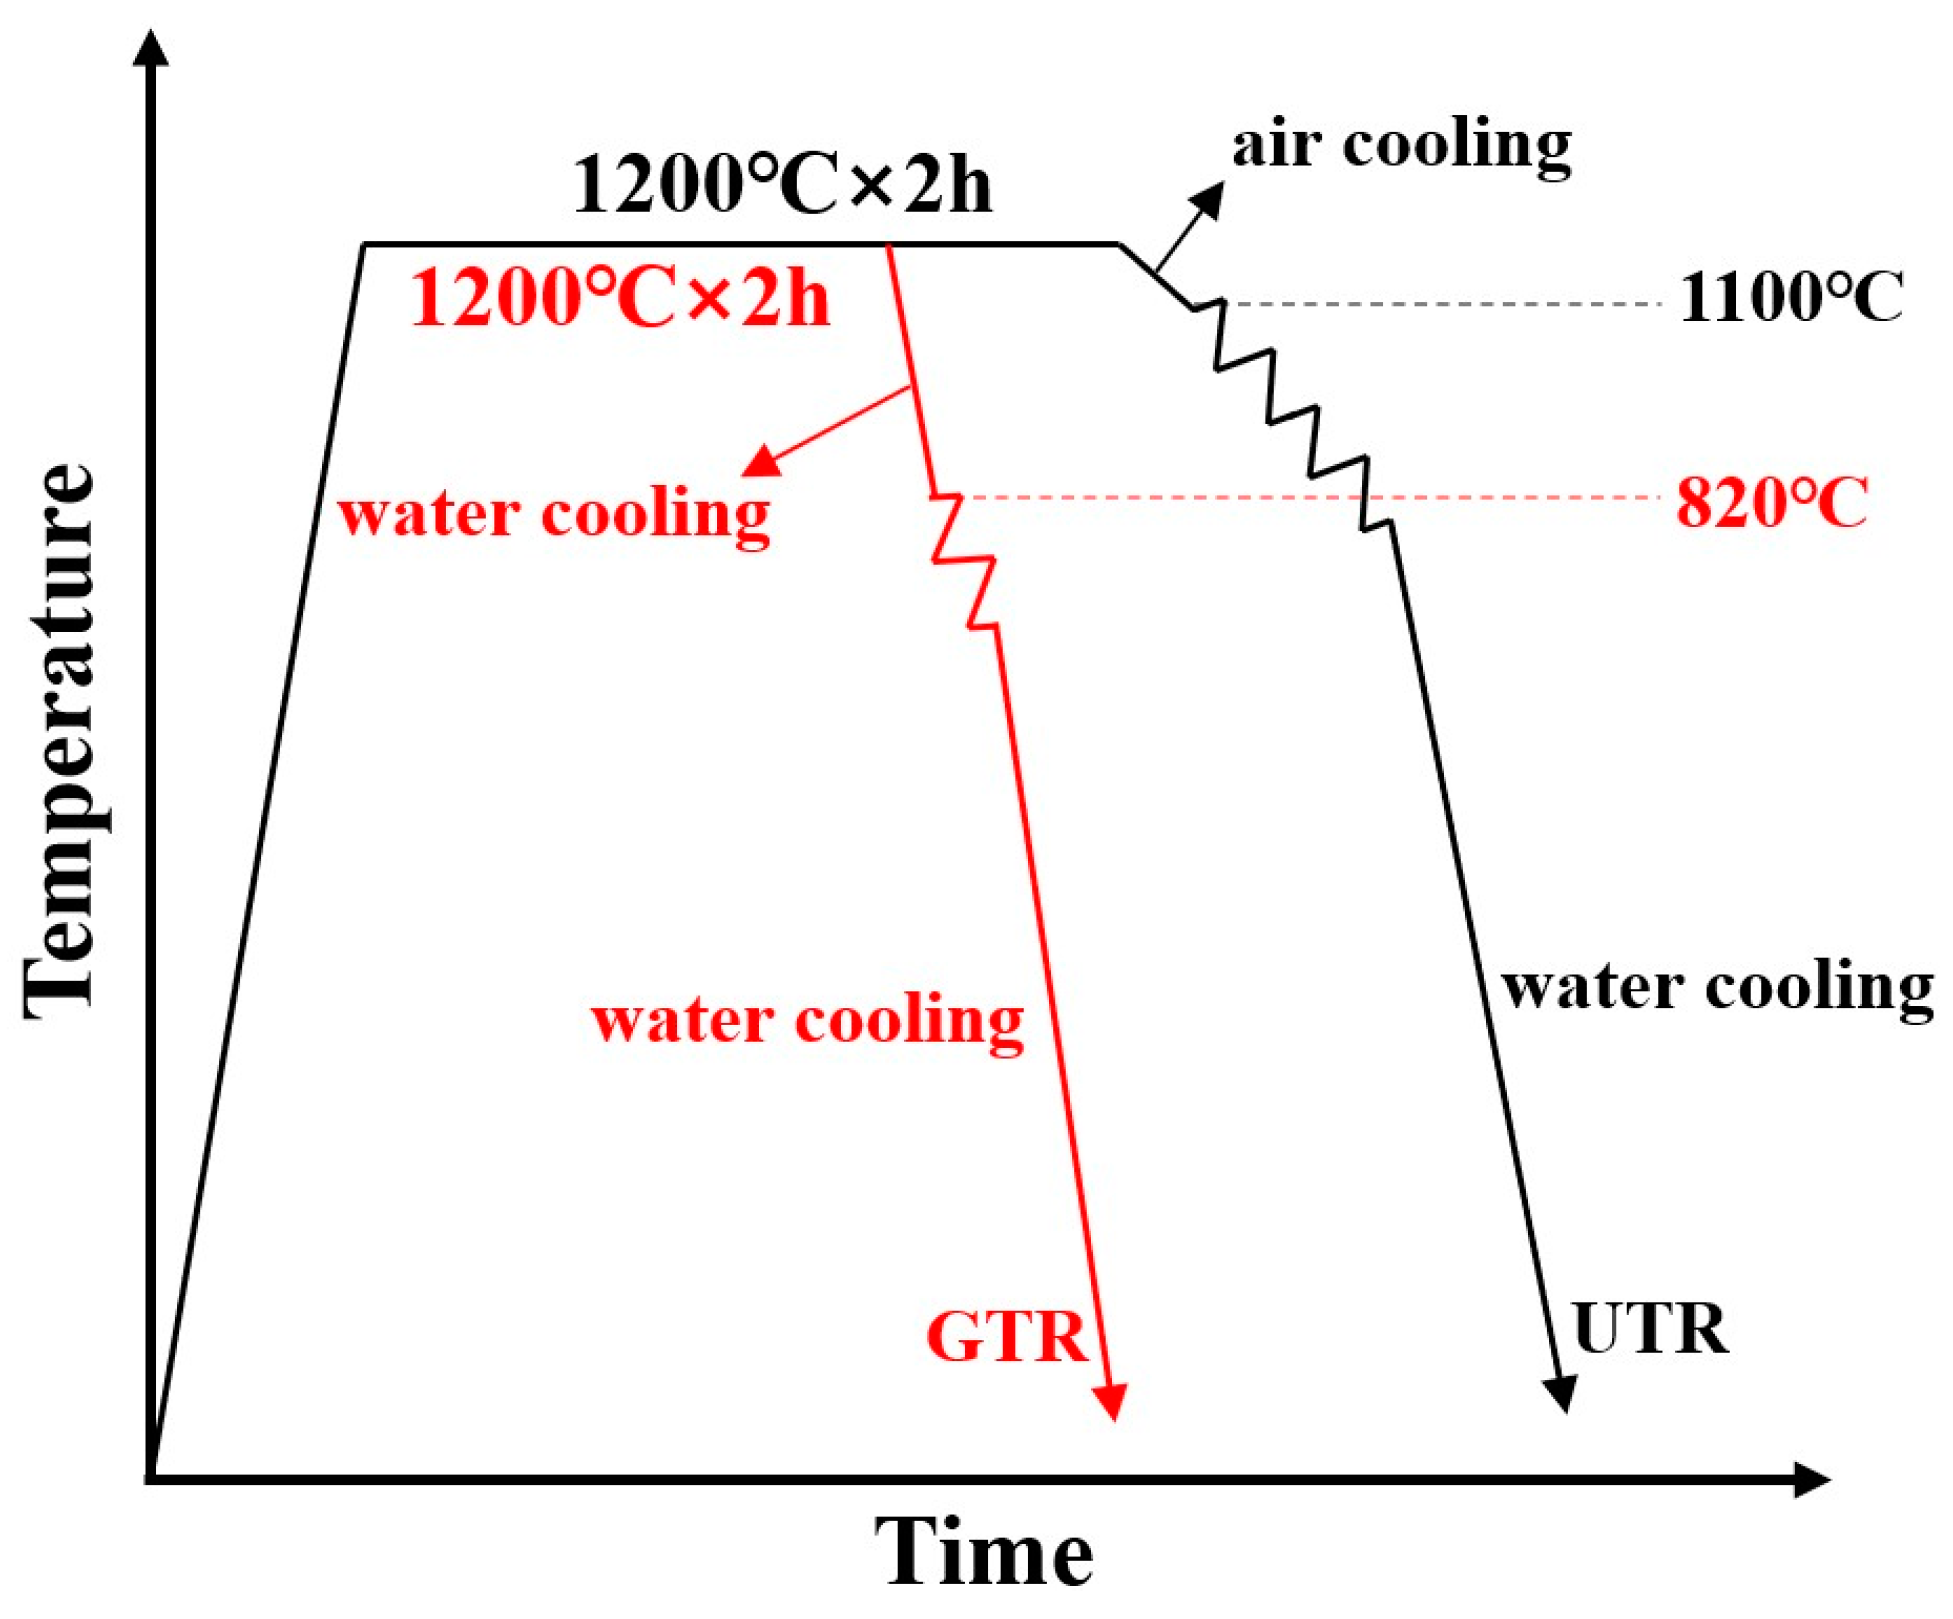
2. Materials and Methods
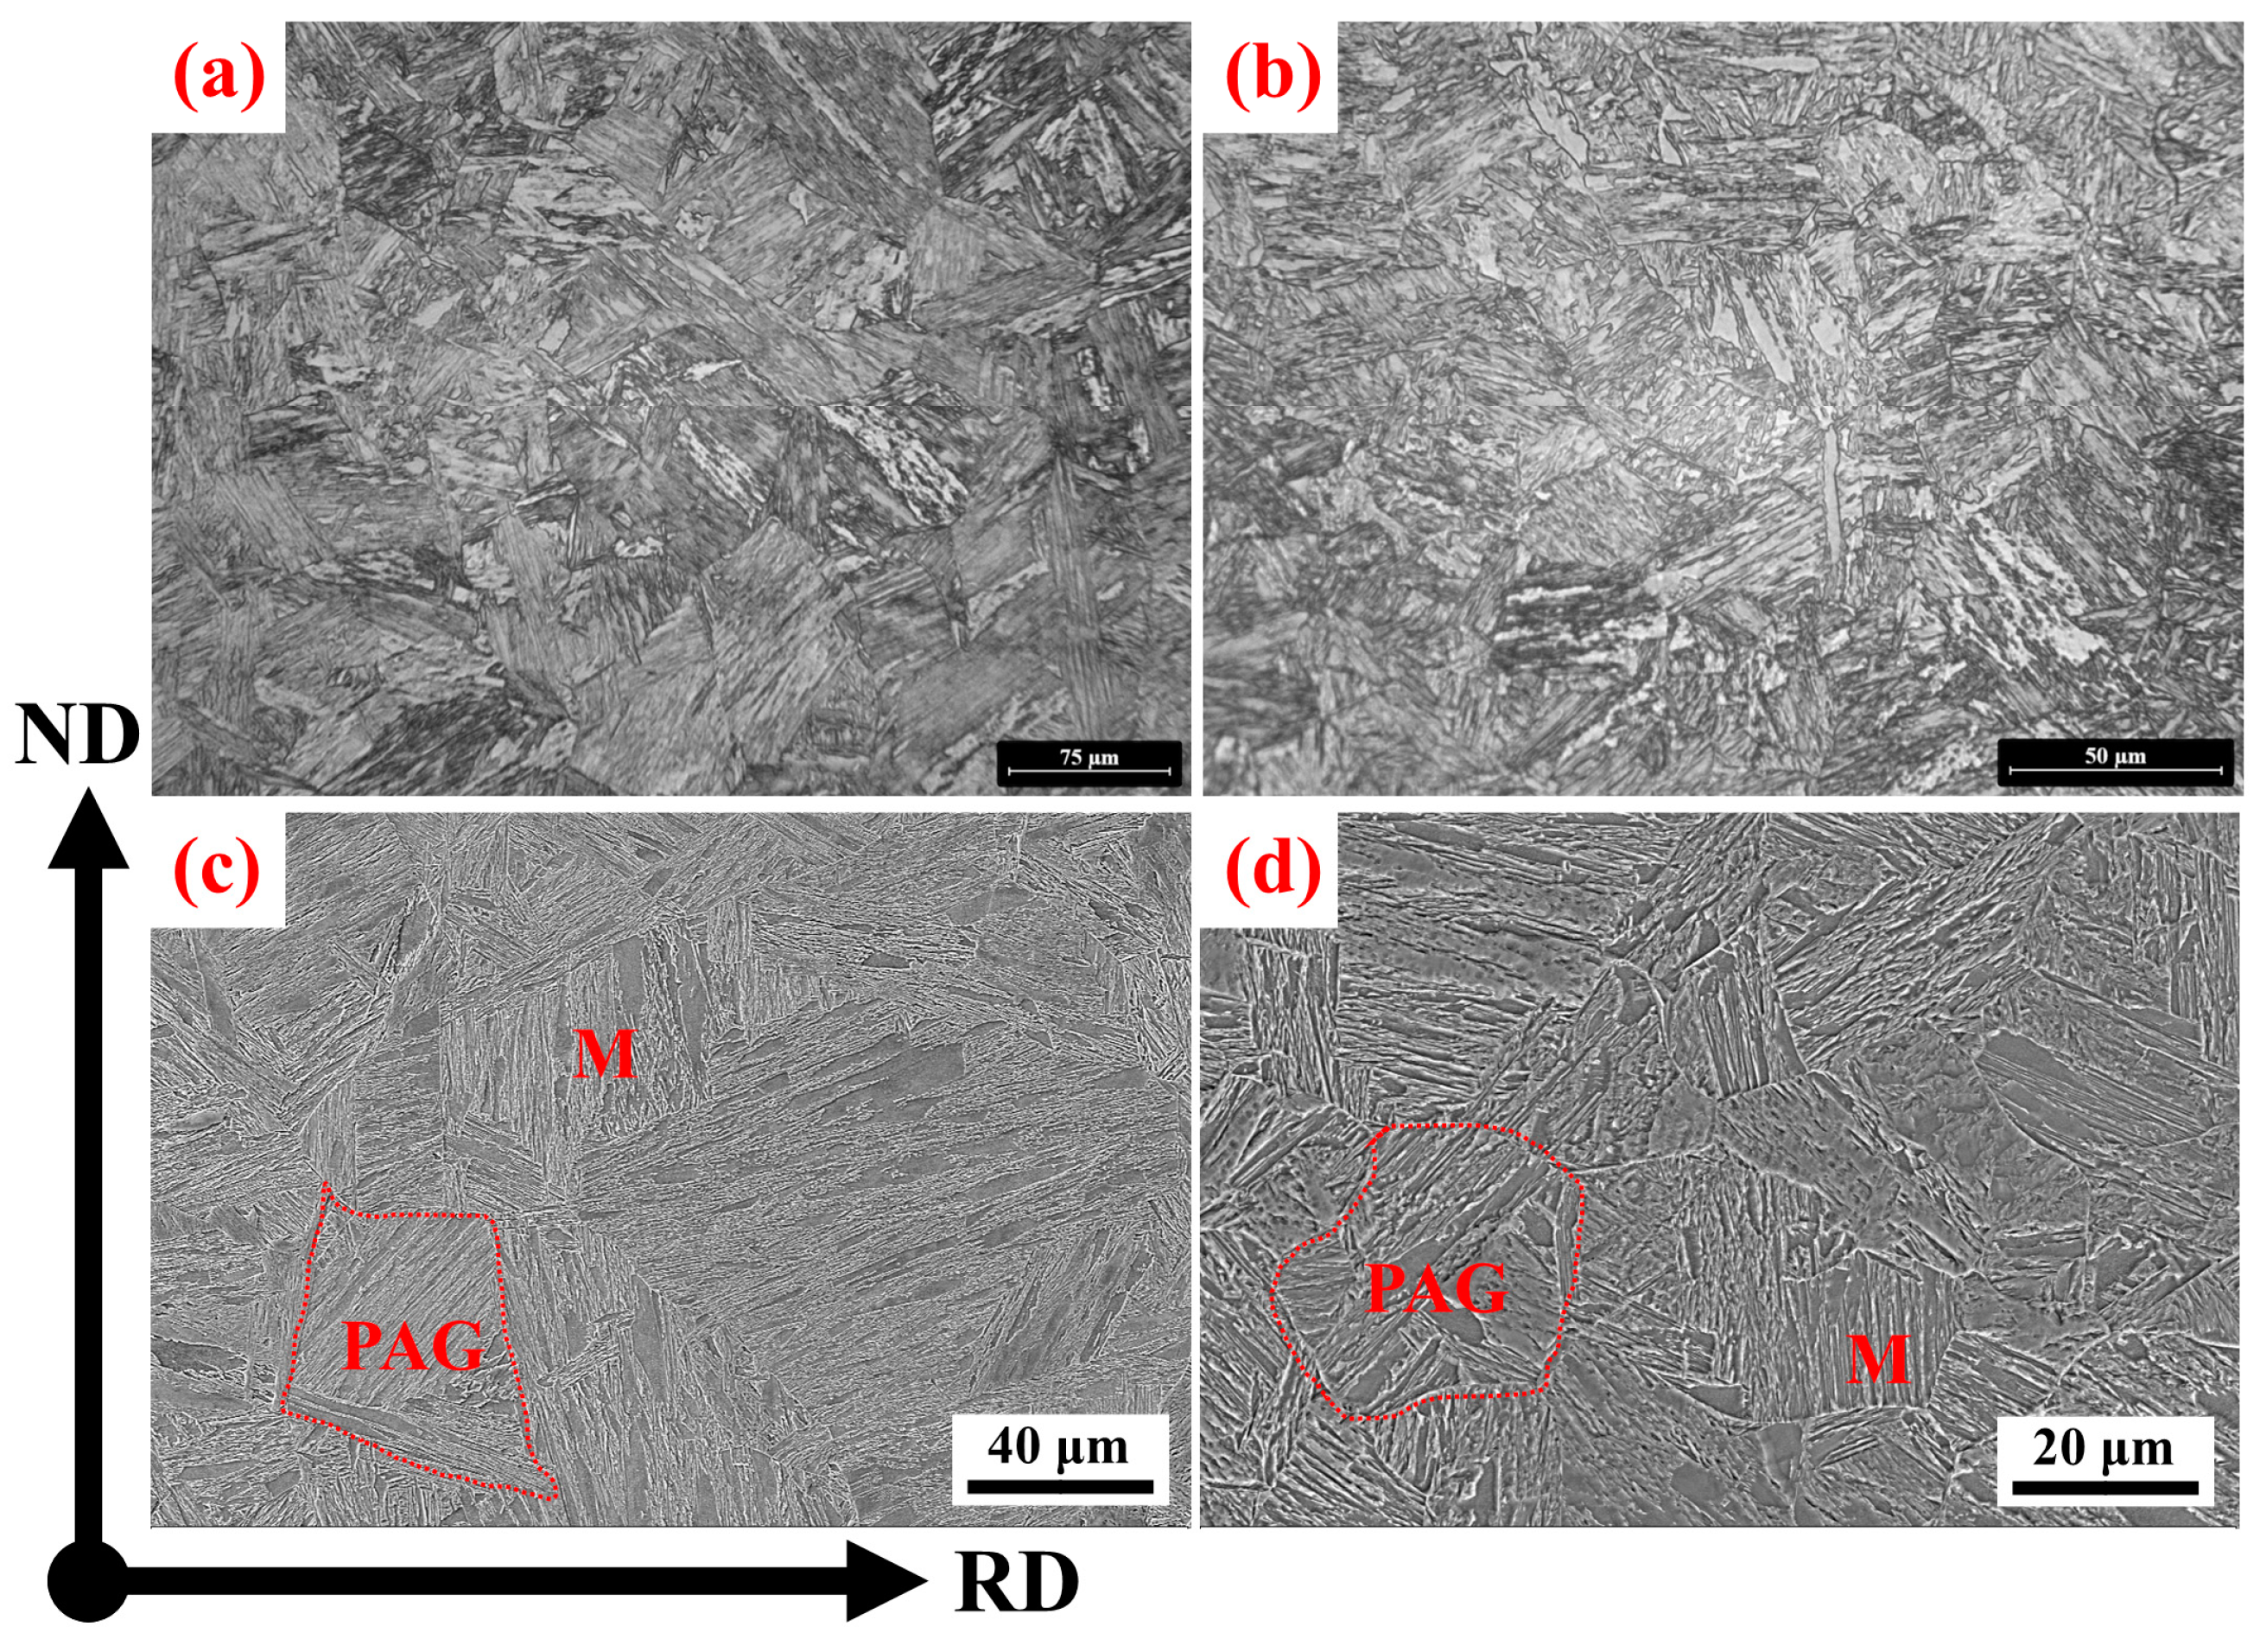
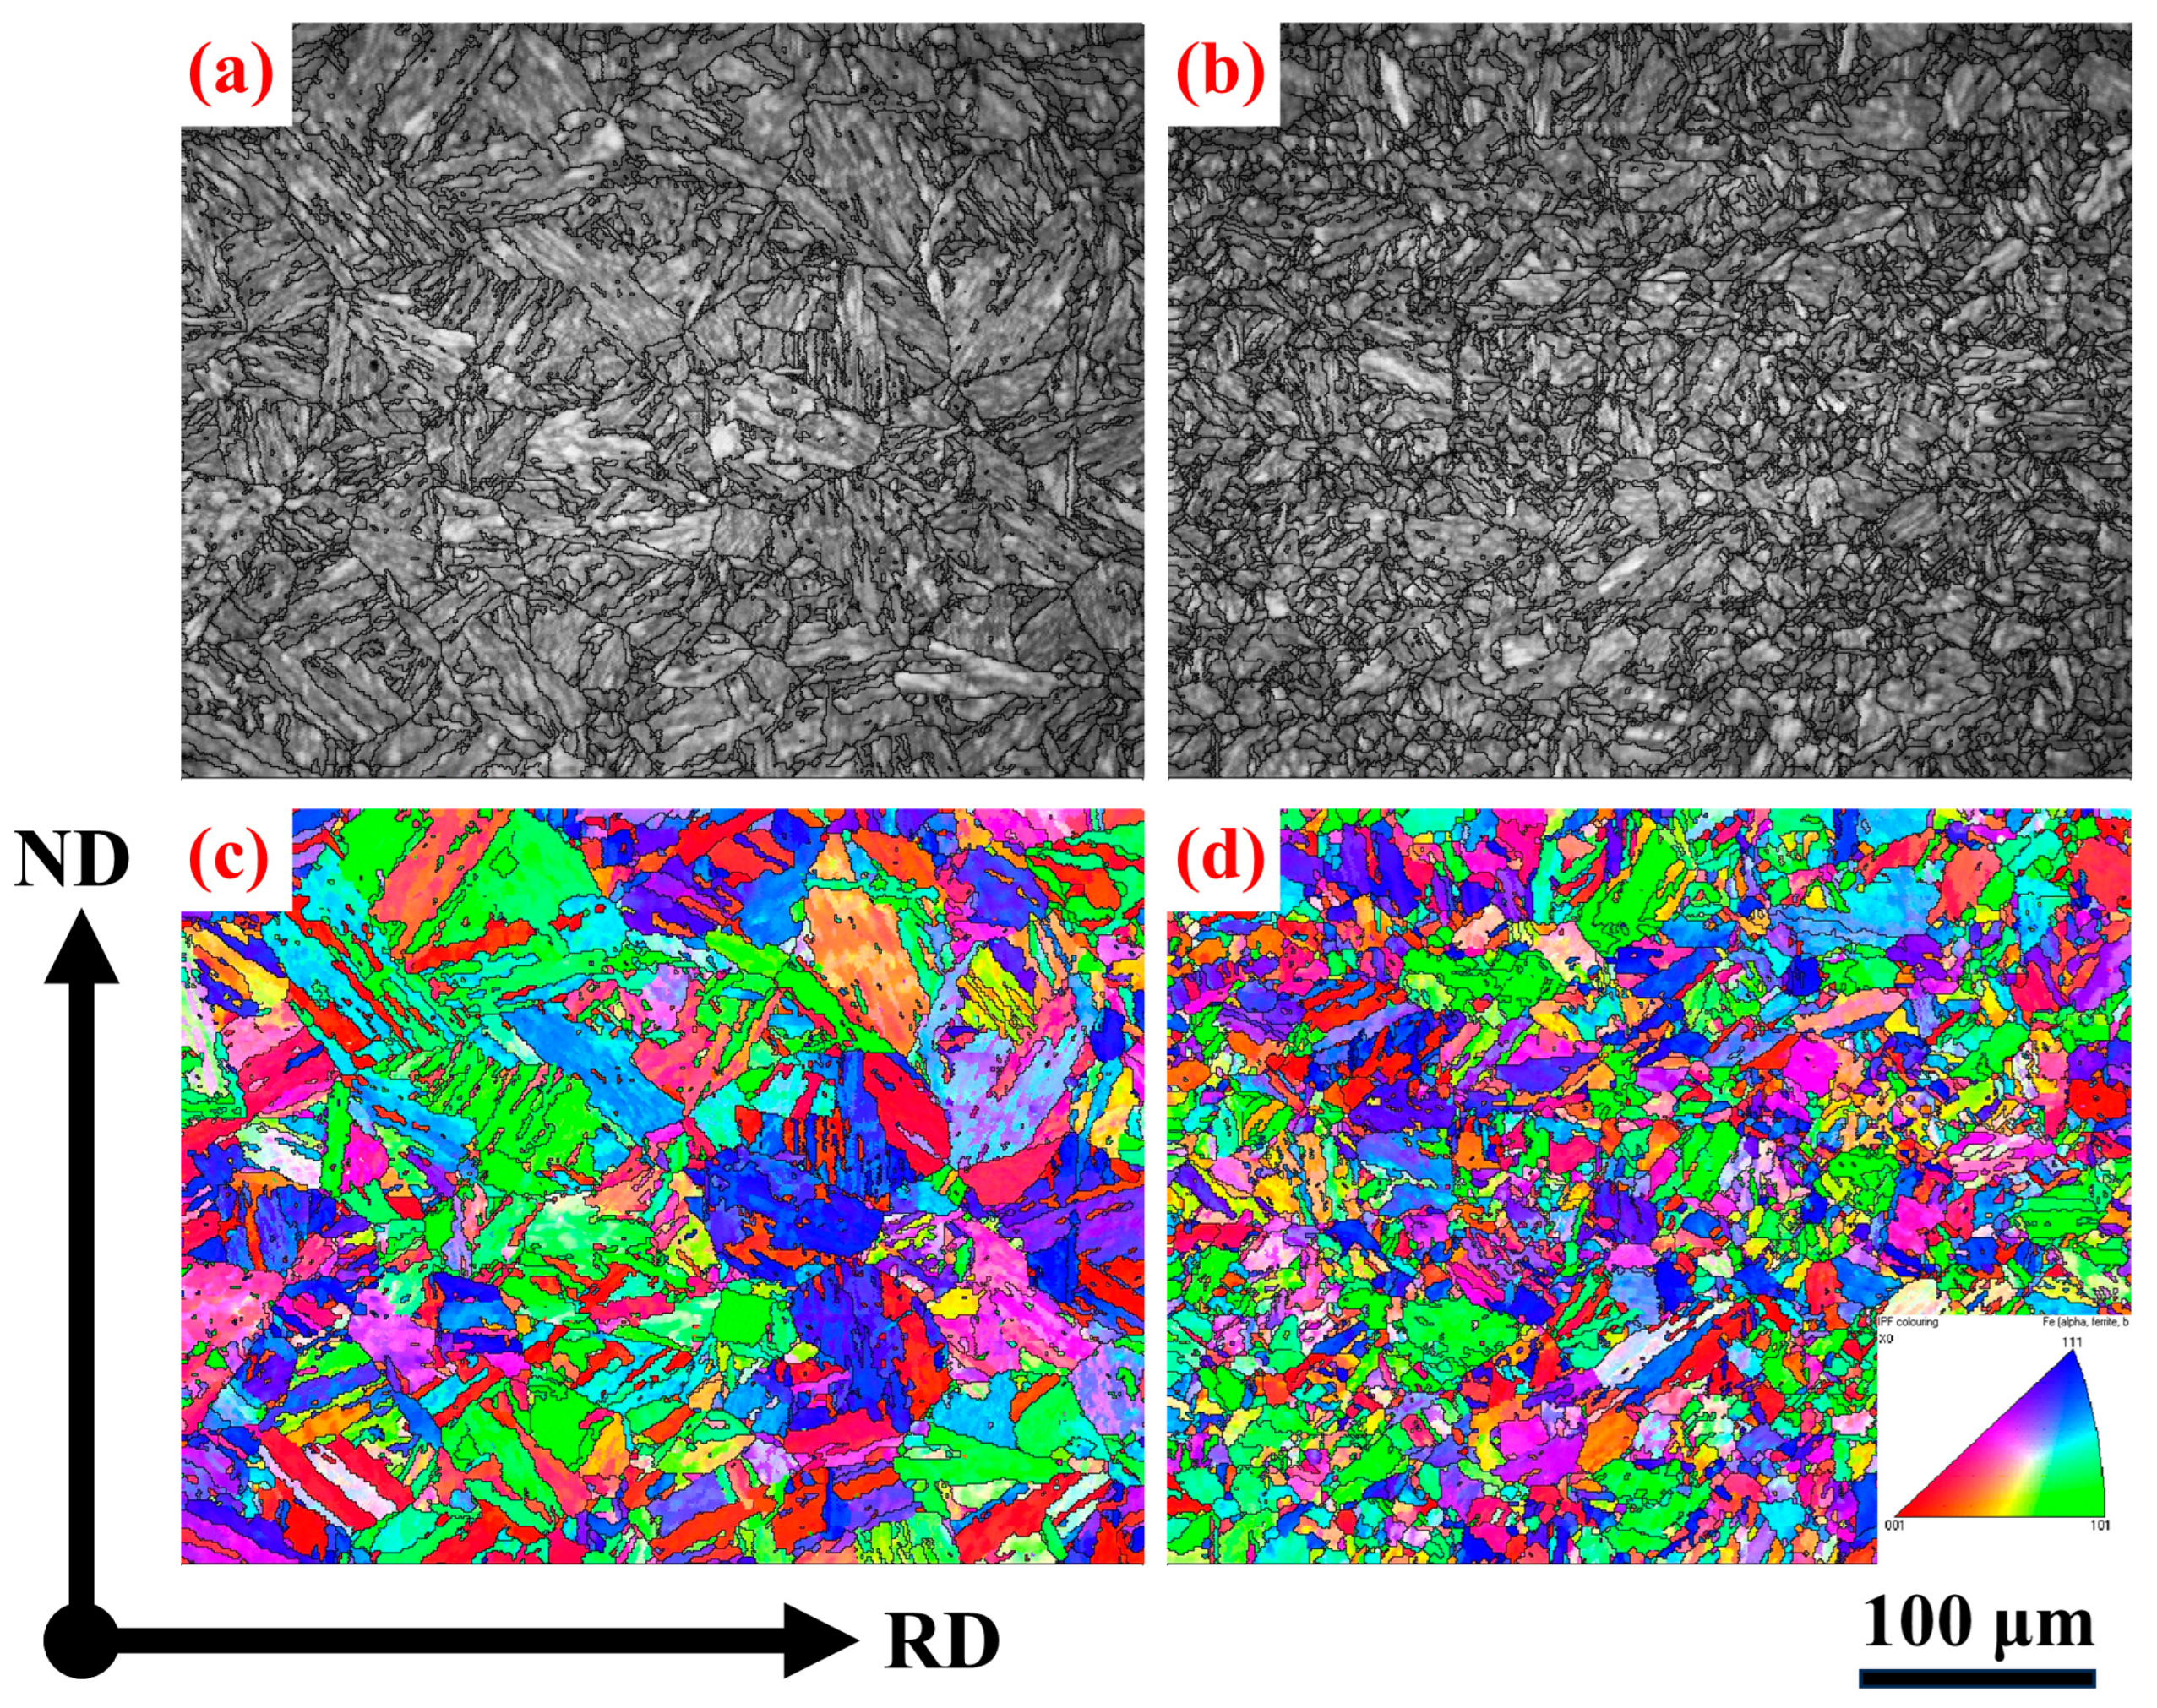
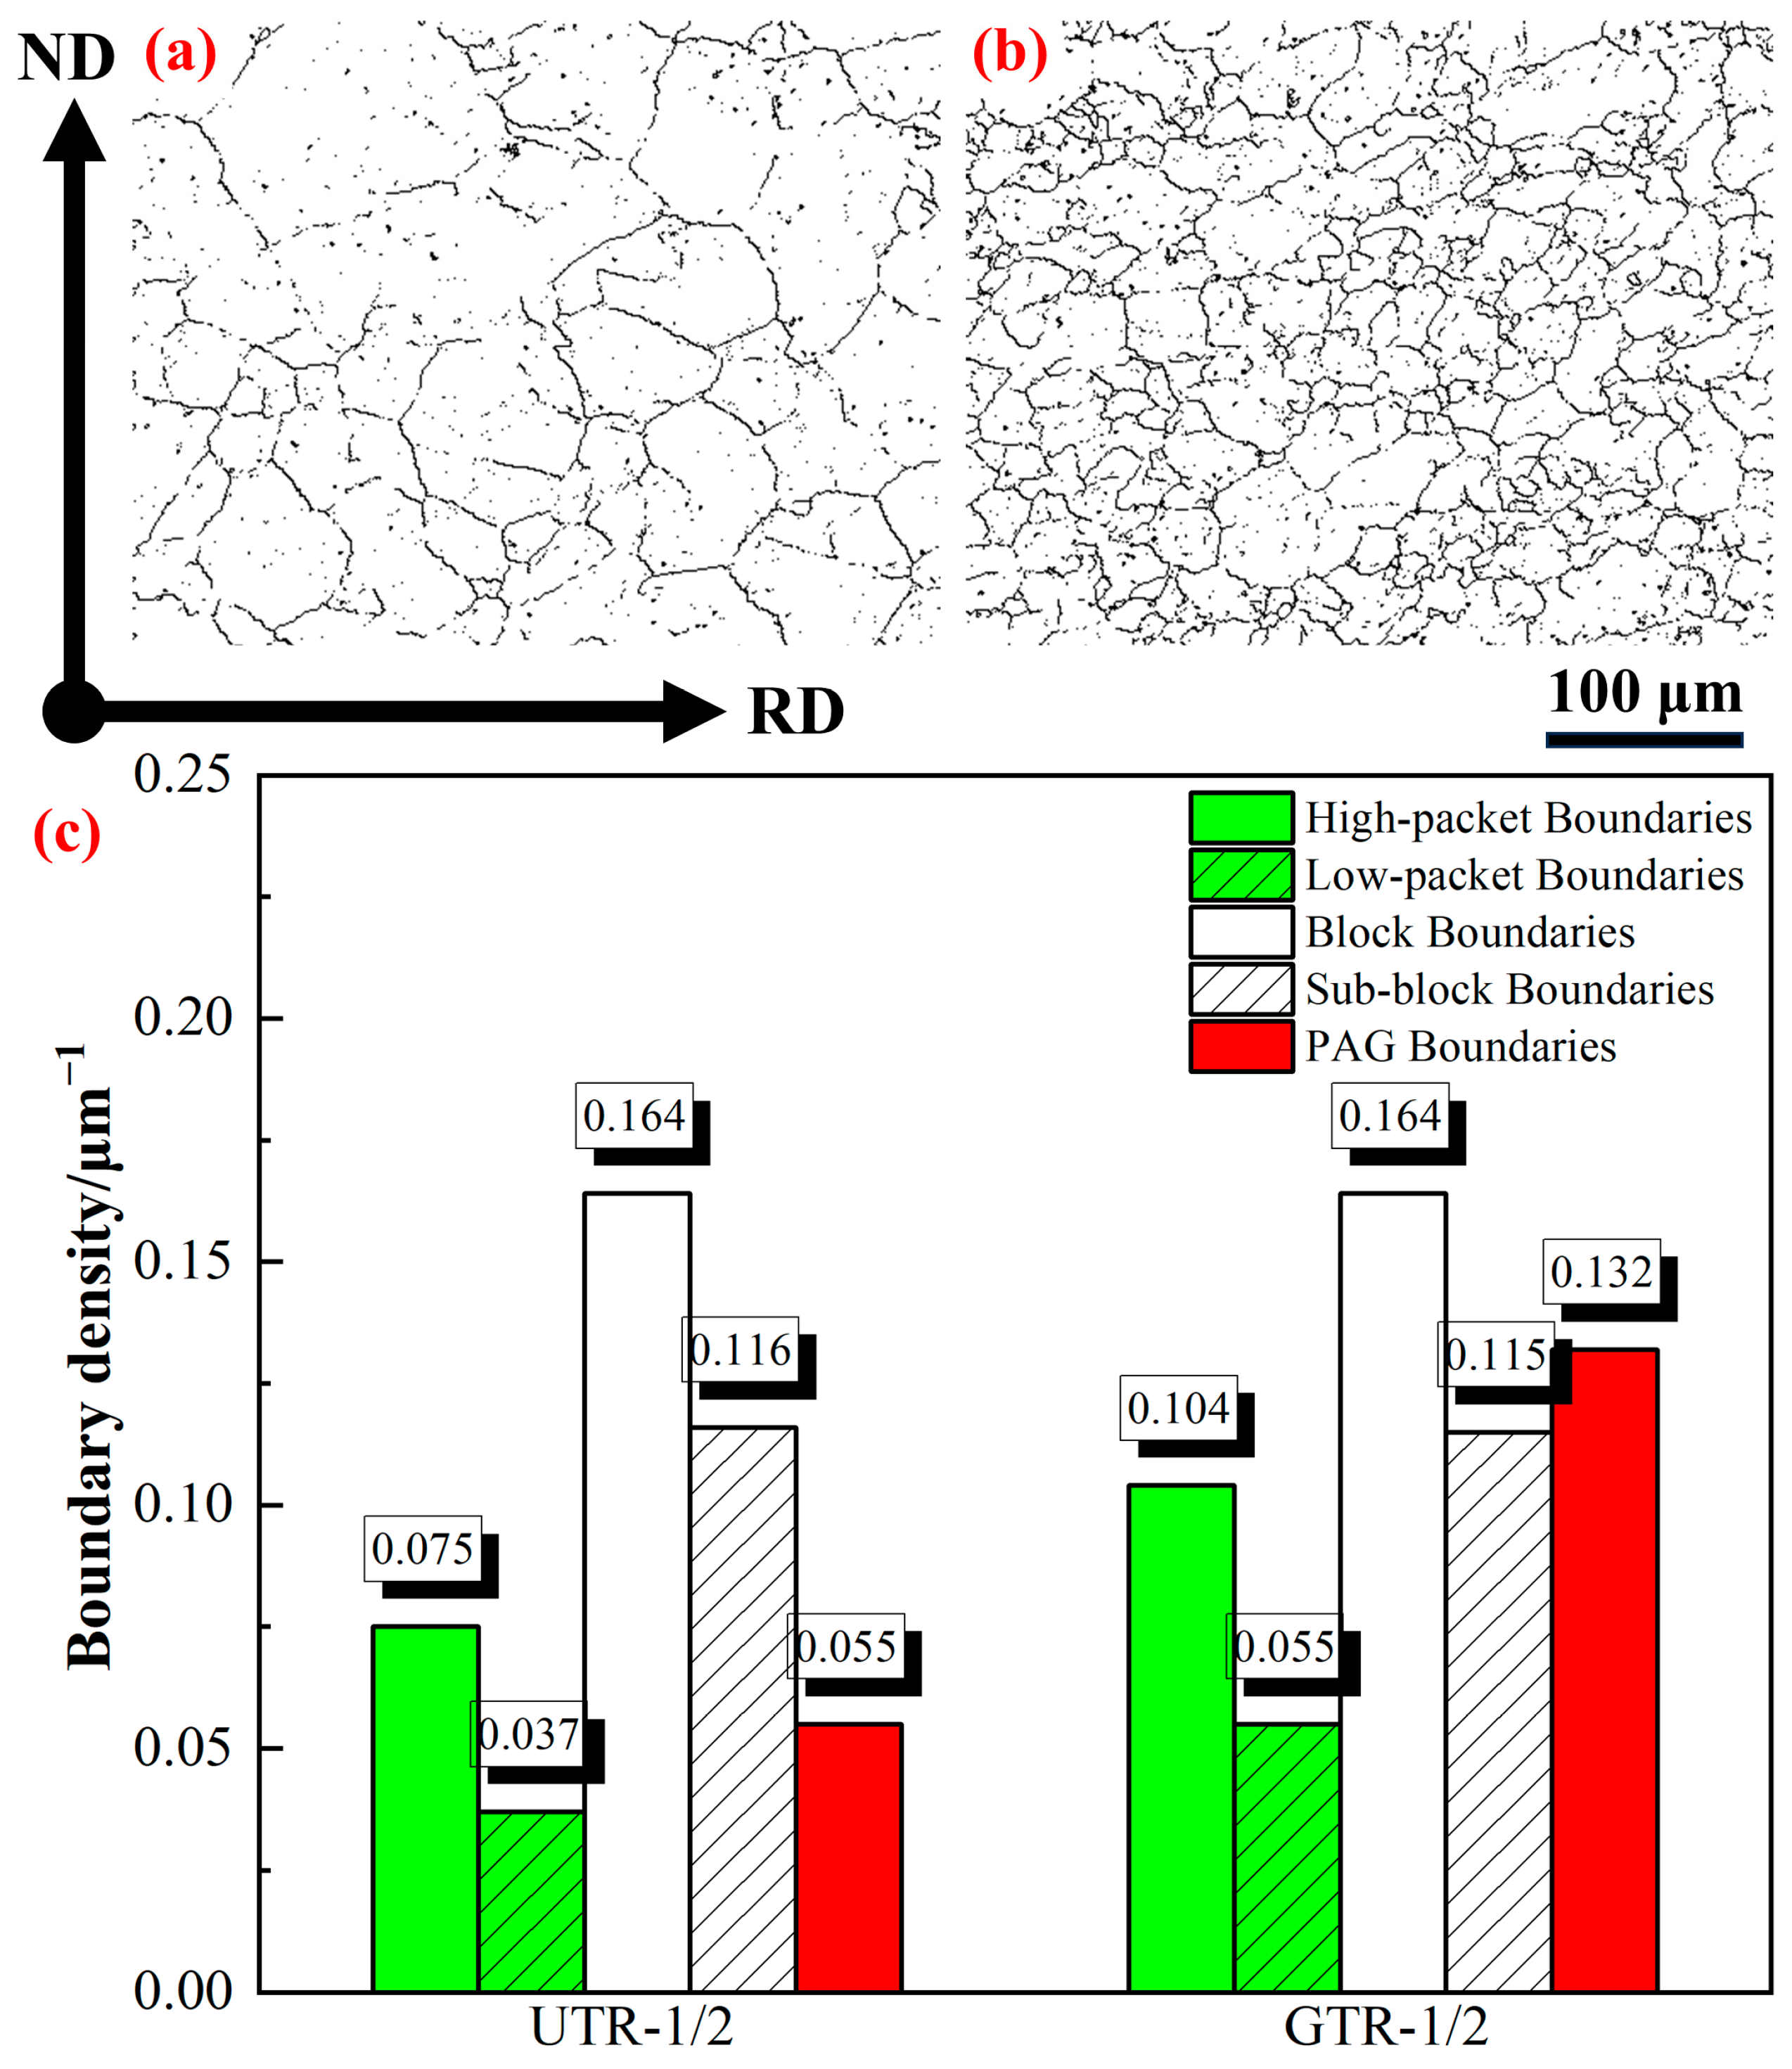
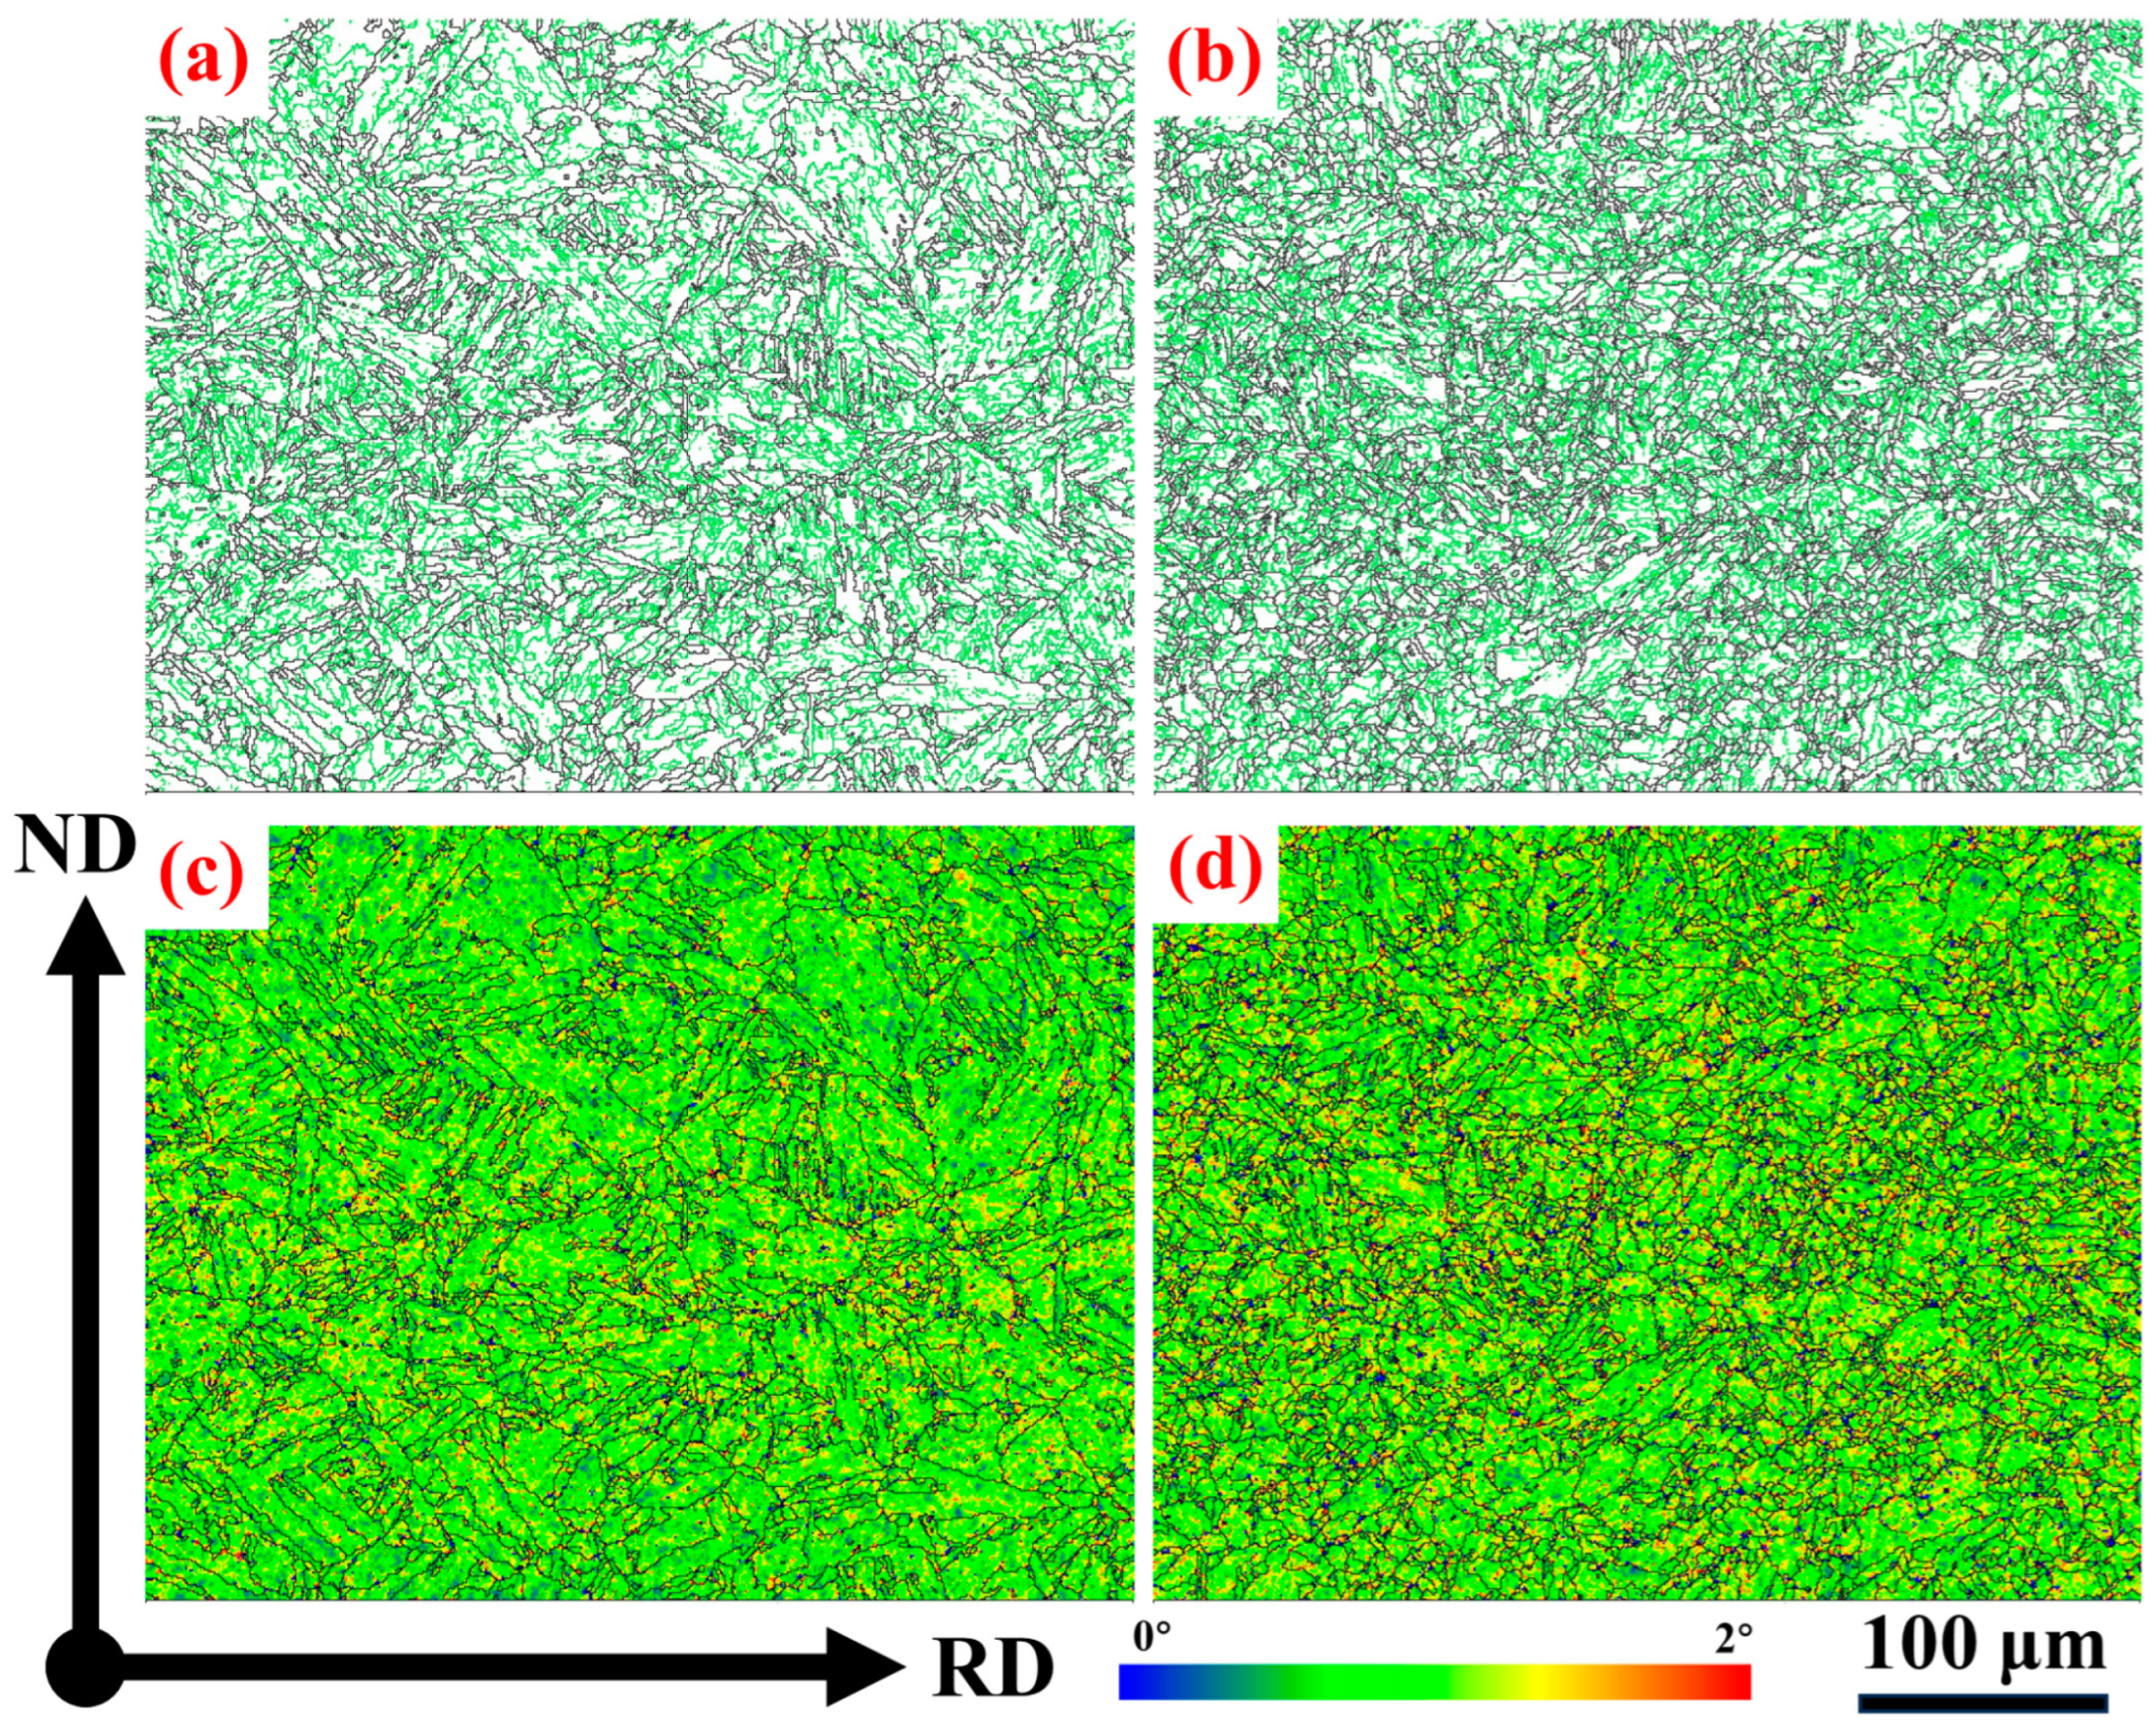
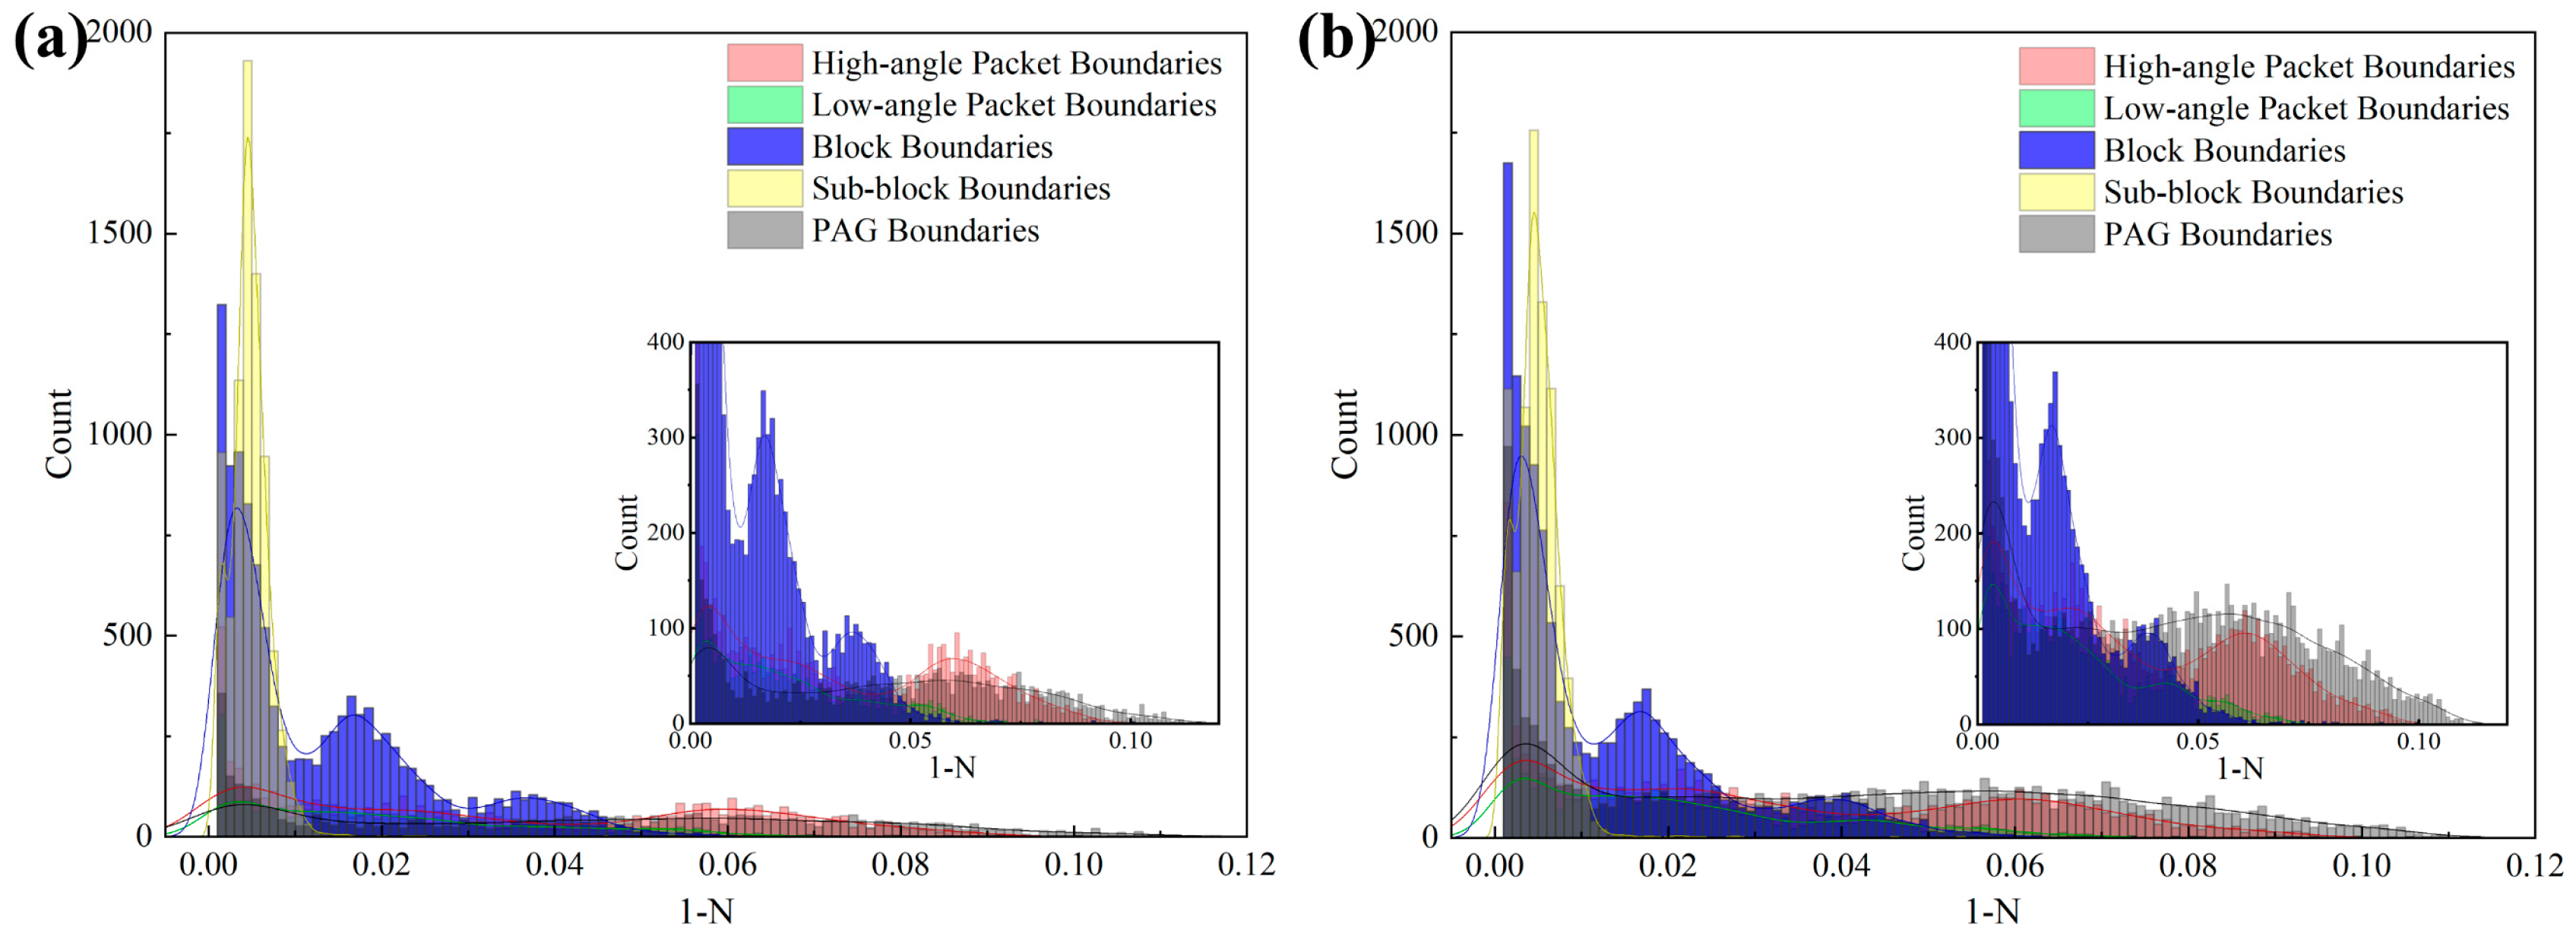
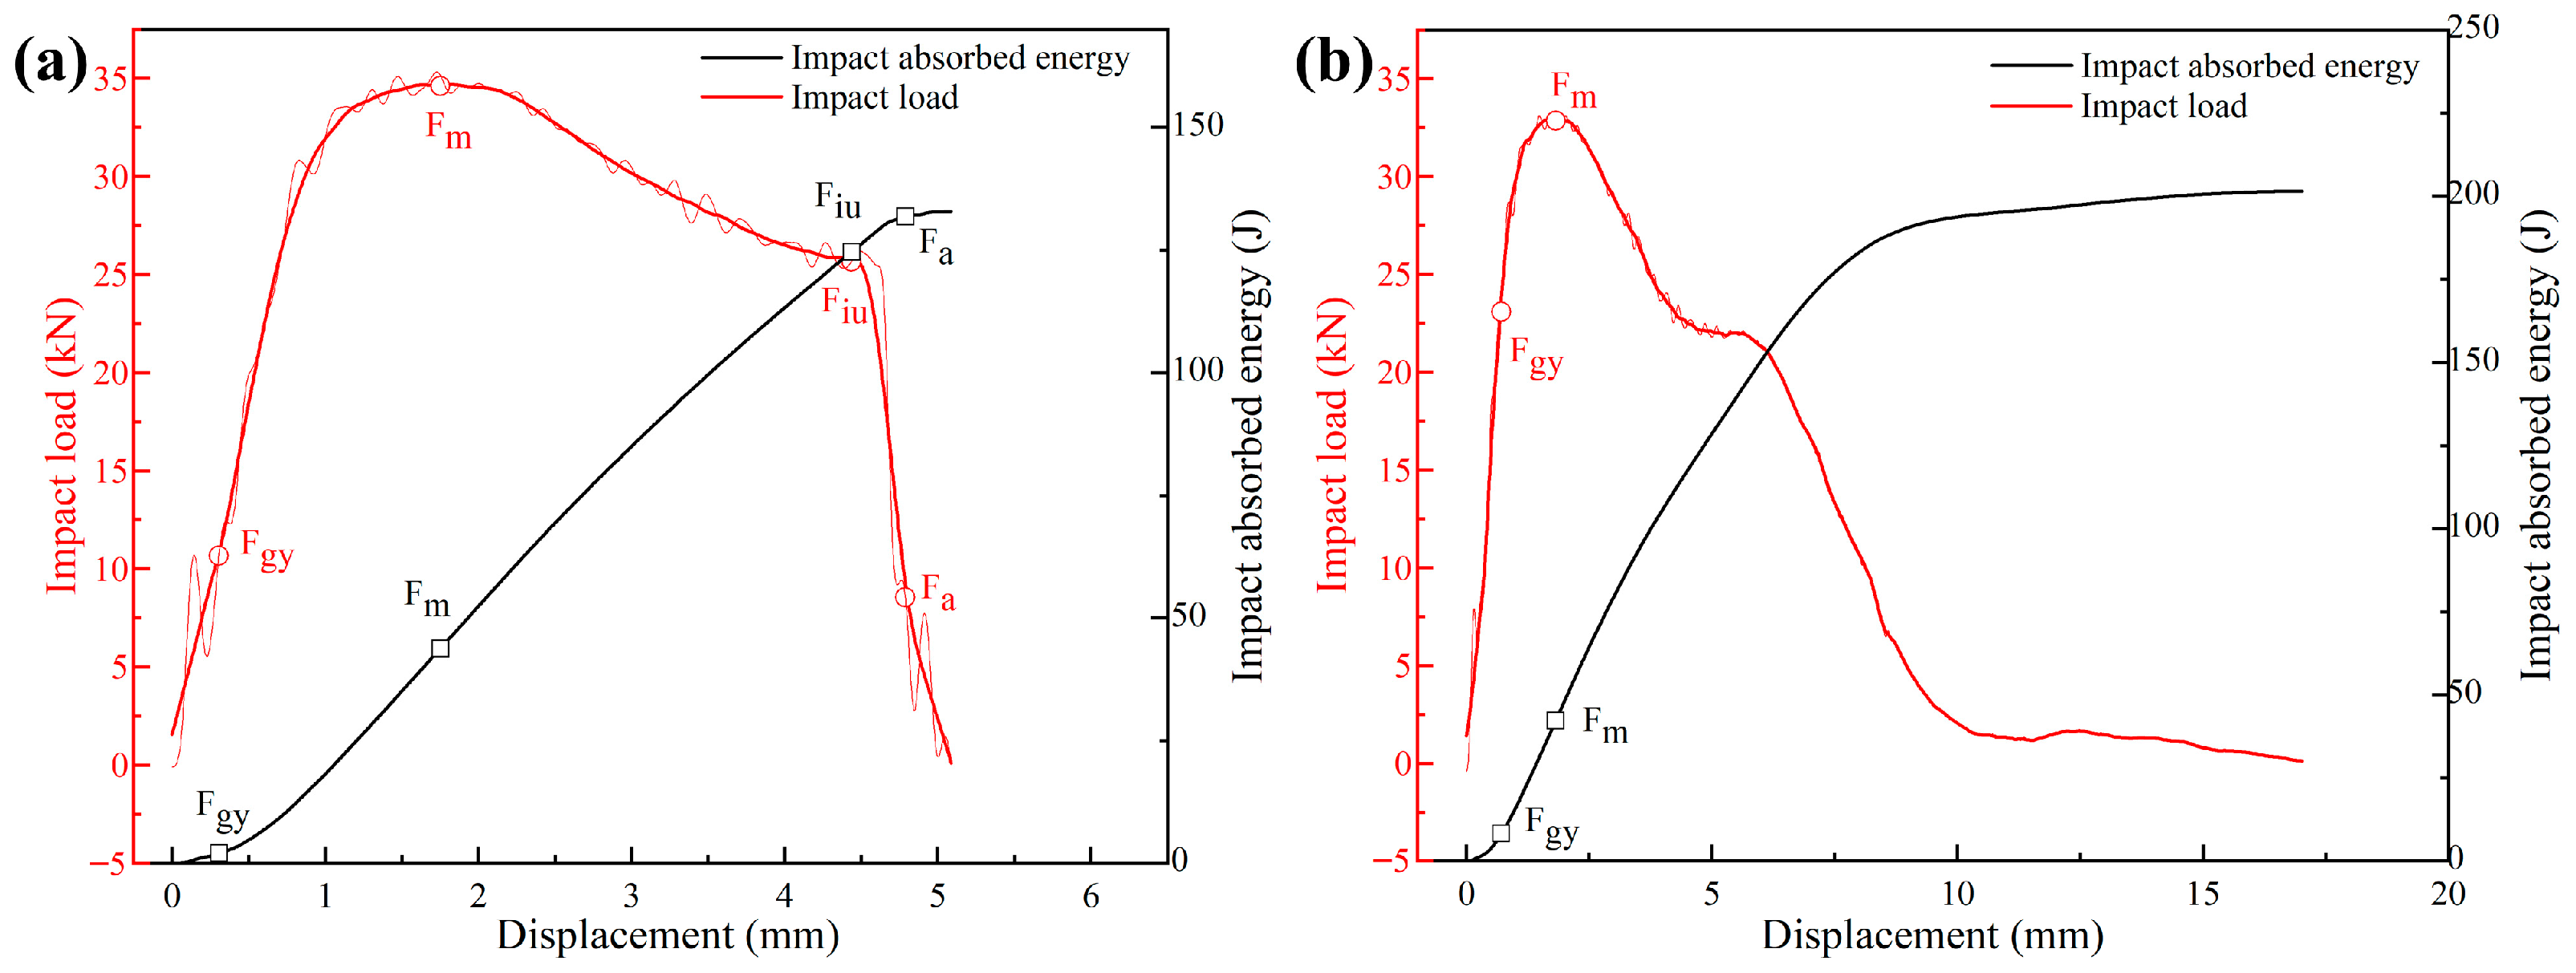
Table 1 shows the chemical composition of the experimental steel. The steel was smelted, forged, and cut into a rectangular samples with 120 mm thickness, 120 mm width, and 200 mm length. The samples were soaked at 1200 °C for 2 h to dissolve microalloying elements and subsequently rolled to 50 mm via multiple passes, as shown in Figure 1. Both rolling processes were performed in a continuous manner without changing the rolling direction. The two as-rolled steel samples are henceforth referred as UTR (uniform temperature rolling) and GTR (gradient temperature rolling), respectively. Research has shown that rapid cooling of the surface before rolling can create a temperature gradient between the center and the surface (with lower temperatures closer to the surface), with the center temperature still around 1100 °C [4,6,7,8,9]. The surface temperature decreases as the rapid cooling time increases. The center–surface temperature difference in UTR processes is very small. The start rolling temperature of the UTR process in this study is ~1100 °C on the surface and the center temperature is also close to 1100 °C [8]. The resistance to deformation of the surface and center are close. The GTR process involves water cooling for ~20 s and ~10 s before the first two passes of rolling (surface cooling rate of approximately 10–15 °C/s) to reduce the surface temperature to ~820 °C to establish a temperature gradient between the center and the surface. Subsequent passes of rolling do not require water cooling and are continuous. Due to the different resistance to deformation at different locations caused by the temperature gradient, it is beneficial for the deformation of the center during the rolling process.
The specimens for optical microscope (OM), scanning electron microscopy (SEM), and electron backscattered diffraction (EBSD) observations were cut along the RD–ND plane (RD: rolling direction, ND: normal direction). They were taken from 1/2 location along the thickness direction and henceforth referred to as UTR-1/2 and GTR-1/2, respectively. Specimens for microstructural studies were observed using a Sigma 300 field emission scanning electron microscopy (FE-SEM) (Sigma, Livonia, MI, USA). EBSD analysis was conducted using TESCAN MIRA 3 LMH FE-SEM equipped (TESCAN MIRA, Dublin, Ireland) with an Oxford Nordlys Nano Max 3 EBSD detector (Oxford Instruments, Oxford, UK) at an acceleration voltage of 20 kV and a step size of 0.9 μm. EBSD data were post-processed by HKL CHANNEL 5 (Version 5.12.72.0, Oxford Instruments, Oxford, UK) flamenco software to acquire the necessary information. The results of EBSD were used to analyze boundary density by a Python program.
Two tensile specimens were tested for each experimental steel (after rolling and water cooling to room temperature) and the average values were taken for the results of tensile tests. Round bar tensile specimens with a 5 mm gage diameter and 25 mm gage length were tested at room temperature at a crosshead speed of 1 mm/min. Three impact specimens with dimensions of 55 mm × 10 mm × 10 mm were tested for each experimental steel at −80 °C and the average values were taken for the results of instrumented Charpy v-notch (CVN) impact tests. Tensile specimens and CVN impact specimens were cut from the plates along the longitudinal direction.

3. Results

Figure 2 shows the OM micrographs and SEM micrographs of different positions of the experimental steels. It can be seen from the figure that for both steel UTR and steel GTR, the microstructure is mainly martensite, with obvious martensite lath. It can be seen from the prior austenite marked by the red dotted line in Figure 2 that the prior austenite grain size of steel GTR is obviously smaller than that of steel UTR and that the martensite lath is finer.
In order to analyze the boundary information more precisely, the EBSD experimental data are analyzed using the HKL CHANNEL 5 flamenco software. The resulting inverse pole figure color map is shown in Figure 3. Different colors represent martensitic crystal units that are aligned with the observation plane in the vertical direction, as shown in the inset. The closer the color is, the smaller the difference in orientation is, and vice versa. It can be seen from Figure 3 that the grain size of steel GTR in the center is significantly smaller, which is mainly due to the microstructural refinement effect brought about by the GTR process, which will be further explained later.
The results of tensile tests at room temperature and instrumented CVN impact tests at −80 °C are shown in Table 2. It can be seen that the yield strength ratio of steel GTR-1/2 is not much different from steel UTR-1/2, the yield strength of steel GTR-1/2 is ~22 MPa higher than steel UTR-1/2, and the tensile strength of steel GTR-1/2 is ~37 MPa higher. In addition, the plasticity and toughness have been significantly improved, especially the toughness, which is ~71.2 J higher than steel UTR-1/2. These are the differences brought about by different rolling processes; the reasons for the differences will be emphasized later.
Figure 4 is the SEM images of the fracture surface of impact specimens. It can be seen from the figure that the shear lip area of steel GTR-1/2 is larger than steel UTR-1/2. From the enlarged fracture surface, it can be seen that the fracture surface of steel UTR-1/2 is mainly composed of cleavage planes, shear cracks, and a few dimples, showing a clear brittle fracture. The fracture surface of steel GTR-1/2 is mainly composed of large and small dimples, with the presence of dimples with tearing ridges, indicating plastic deformation during the crack propagation process and high crack propagation resistance. The crack propagation requires a large amount of energy, showing a clear ductile fracture [14,15]. The characteristics of the fracture surface also confirm the difference in low-temperature toughness between steel UTR-1/2 and steel GTR-1/2. The GTR process can significantly increase the proportion of dimples and improve the low-temperature toughness.

4. Discussion

4.1. Research on Strength

Figure 5 shows the prior austenite grain boundaries distribution map and various grain boundary density statistical diagrams calculated by the software [16]. Through the statistics of the prior austenite grain size in Figure 5a,b, the average prior austenite grain size of steel UTR-1/2 and steel GTR-1/2 is 41.1 ± 6.6 μm and 20.9 ± 3.4 μm, respectively. Compared with the UTR process, the GTR process significantly reduces the prior austenite grain size, which is mainly due to the reduction in the surface temperature to ~820 °C before rolling, forming a temperature gradient from low to high from the surface to the center, increasing the strain and accumulative deformation in the center, and refining the prior austenite grain size in the center. The refinement of austenite grain increases the crystal defects such as vacancies, dislocations, deformation bands, etc., inside the austenite. This causes an increase in non-uniform nucleation points, which is beneficial to grain refinement after transformation [17,18,19,20]. Meanwhile, the research shows that the refinement of the prior austenite grain is conducive to the increase in the density of the packet boundaries and block boundaries in martensite [15,21]. As can be seen from Figure 5c, compared to the UTR process, the GTR process does not significantly increase the density of block boundaries and sub-block boundaries in the center but significantly increases the density of PAG boundaries, high-packet boundaries, and low-packet boundaries. Compared to steel UTR-1/2, the high-packet boundaries density of steel GTR-1/2 increases from 0.075 μm−1 to 0.104 μm−1, the low-packet boundaries density increases from 0.037 μm−1 to 0.055 μm−1, and the PAG boundaries density increases from 0.055 μm−1 to 0.132 μm−1.
In addition to grain boundaries, dislocations are also an important factor affecting strength. The dislocation density can be estimated using GND (geometrically necessary dislocation) density. The grain boundary distribution and GND density of the experimental steels are shown in Figure 6. The closer the color is to red, the higher the dislocation density is, and the closer the color is to blue, the lower the dislocation density is. Some studies have shown that GND can be calculated by kernel average misorientation (KAM) and the dislocation density can be estimated by calculating GND density using Equation (1) [22,23]. The calculation results are shown in Table 3.
ρ = 2 θ ub
where θ is the misorientation angle, which is directly obtained from EBSD data and is less than 2°, u is the unit length (step size = 0.9 μm), and b is the Burgers vector and is equal to 0.248 nm.
As can be seen from Table 3, there is a difference in dislocation density between steel GTR-1/2 and steel UTR-1/2 and the strength contribution of dislocation strengthening is calculated using Equation (2) [24].
Δ σ Dis = α M G b ρ
where α is a constant with value of 0.435 [25], M is the Taylor factor and for ferritic steel is 2.75 [26], G is the shear modulus of 80,300 MPa [25], b is the Burgers vector of 0.248 nm, and ρ is the dislocation density (Table 3). The calculation results of dislocation strengthening contributions are shown in Table 3. The strength contribution of dislocation strengthening for steel GTR-1/2 is 292.7 MPa and the strength contribution of dislocation strengthening for steel UTR-1/2 is 283.9 MPa, with a small gap between the two. However, from the strength data in Table 2, it can be seen that there is still a larger gap in the yield strength between the two, indicating that in addition to dislocation strengthening, other strengthening methods also have a certain influence. For the same composition and with less precipitation, grain boundary strengthening is the only possible strengthening method that can affect the strength.
From Figure 6a,b, it can be seen that there is a slight difference in the density of high-angle and low-angle grain boundaries between steel GTR-1/2 and steel UTR-1/2. The strength contribution estimation based on the density of high-angle and low-angle grain boundaries is limited, as not all grain boundaries have a significant impact on strength. Therefore, refined analysis of grain boundaries is necessary. Some studies have shown that both block boundaries and sub-block boundaries can hinder dislocation motion and significantly improve strength [27]. At the same time, some studies have shown that block boundaries are the grain boundary factor with the highest impact on strength [28]. For steel GTR-1/2 and steel UTR-1/2, the densities of block boundaries and sub-block boundaries are basically the same, indicating that other grain boundary types also have a certain contribution to strength.
Some studies have used the slip transmission factor m′ as a geometric factor to measure the ability of adjacent grains to slip transfer without loss of the coherence at the grain boundary, calculated by m′ = cos(ϕ)cos(κ), where ϕ is the angle between the slip directions in the neighboring grains and κ is the angle between normal to the slip planes of neighboring grains [29,30]. At the same time, the slip transmission coefficient between different variants is related to plasticity and strength [30,31]. According to the relevant research method, the value of N (the maximum m′ of all slip systems in the adjacent sub-volumes) is used to represent the difficulty of slip transmission of a grain boundary, so the larger the value of 1-N, the stronger the resistance to slip transmission [31]. Based on phase transformation crystallography calculations, Packet boundaries, especially high-angle packet boundaries, have higher 1-N values compared to block boundaries or sub-block boundaries. The orientation of PAG approximates a random orientation distribution; hence, they also possess higher 1-N values [32]. The statistical results of the 1-N values for actual specimens are shown in Figure 7. As can be seen from the figure that the block boundary accounts for a higher proportion in steel GTR-1/2 compared to steel UTR-1/2 but due to its lower 1-N value, it has little effect on improving the anti-slip ability of the grain boundary and is not the main reason for the difference in strength. Instead, the local enlarged image shows that there are significant differences between the PAG boundaries and the high-angle packet boundaries, especially the PAG boundaries. That is mainly because the GTR process significantly increases the deformation penetration in the center to refine the prior austenite grains. Furthermore, the refinement of the austenite grains also affects the tendency for variant selection, resulting in the formation of more Packet boundaries. The increased density of PAG boundaries and Packet boundaries with higher 1-N values implies that the effective grains contributing to strength enhancement have been refined. Therefore, it can significantly improve the strength of the center.

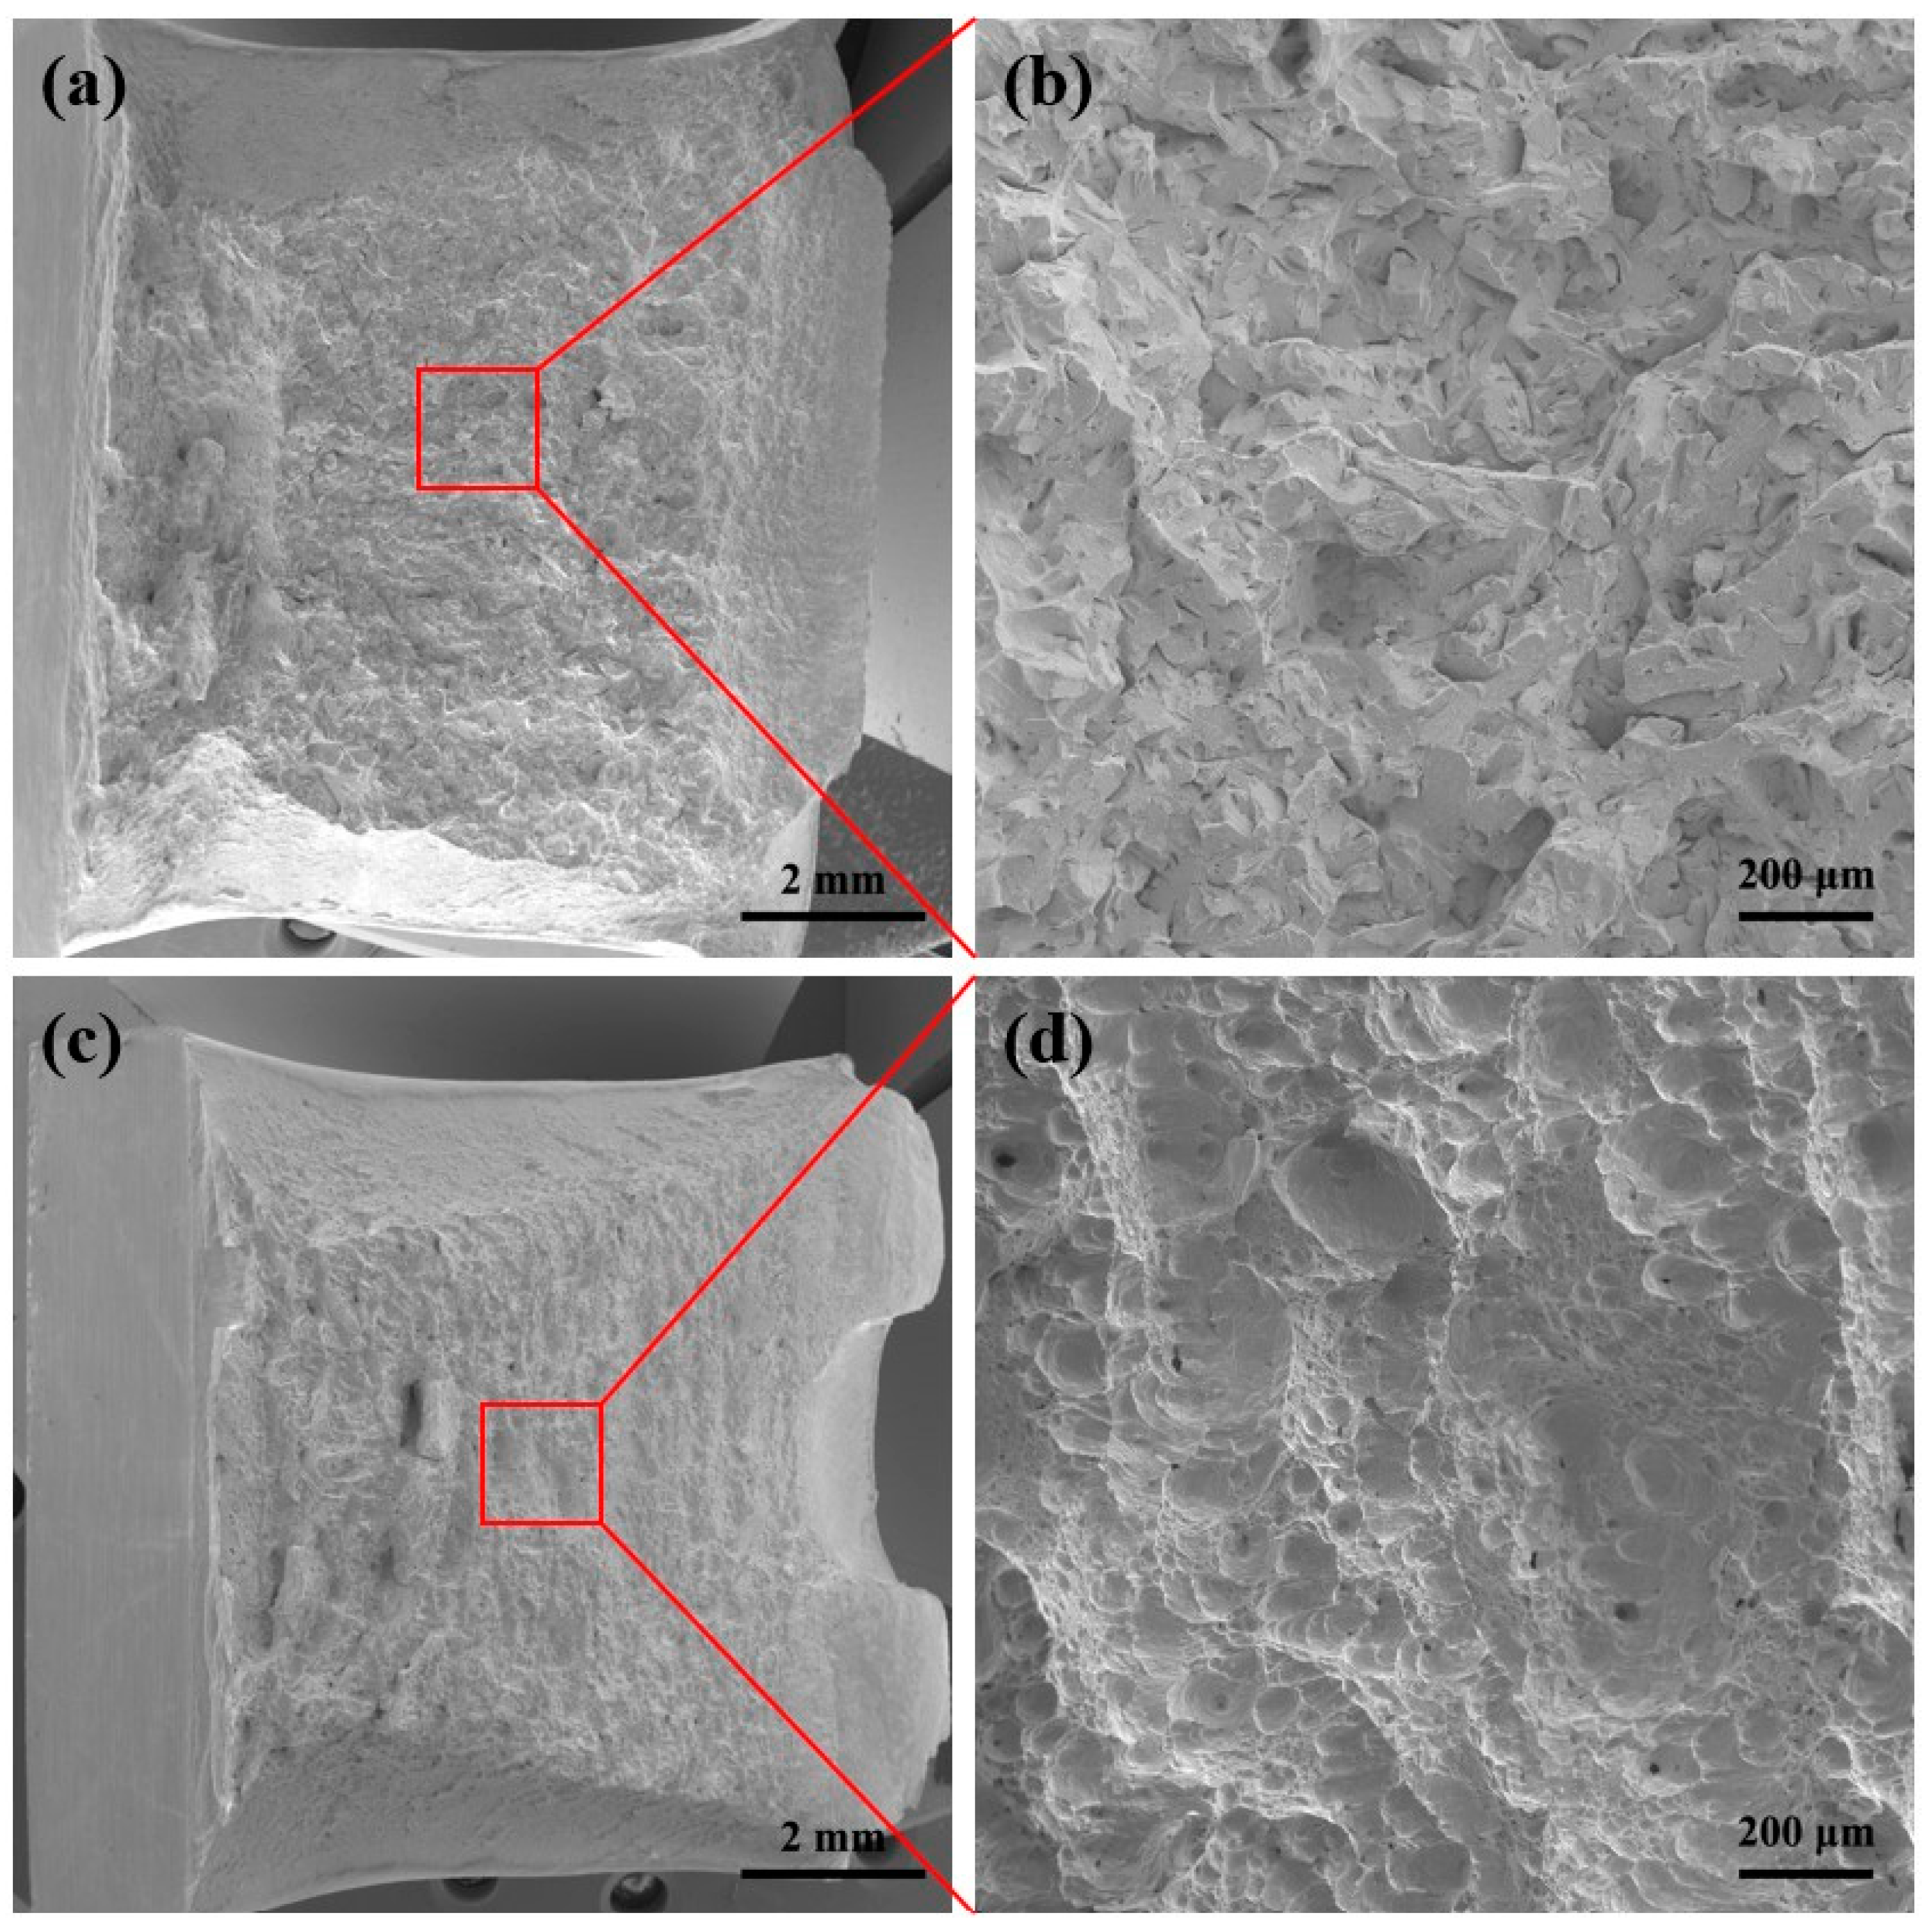
4.2. Research on Toughness

The impact load/energy displacement curve obtained from the instrumented Charpy impact test is shown in Figure 8. In the figure, Fm is the starting point of stable crack propagation, before which the crack initiation is stable and the energy consumed before Fm is the crack initiation energy (CIE). Fiu is the starting point of unstable crack propagation. Fa is the starting point of plastic fracture, where the unstable fracture is suppressed and enters the plastic fracture stage. The plastic fracture front is formed between the Fgy (general yield force) and Fm. The initial expansion of the crack is stable until unstable expansion occurs and the expansion then stops in the suppression stage [33]. During this period, the energy absorbed by the impact specimen is crack propagation energy (CPE). During stable crack propagation, plastic deformation and cleavage crack propagation occur simultaneously but once unstable propagation begins, the crack will rapidly extend and lead to specimen failure within a short time. Therefore, the impact absorption energy during the unstable crack propagation stage is much lower than during the stable propagation stage. The impact load/displacement curve of steel UTR-1/2 corresponds to the “E” type in the standard curve, with plastic deformation before Fm followed by stable and unstable crack propagation [34]. The impact load/displacement curve of steel GTR-1/2 corresponds to the “F” type in the standard curve, with plastic deformation before Fm followed only by stable crack propagation [34]. Compared to steel GTR-1/2, steel UTR-1/2 has a smaller elastic deformation work, while the plastic deformation work is essentially the same. After reaching the starting point of stable crack propagation, steel UTR-1/2 undergoes a certain degree of stable crack propagation, while when the crack propagates to a certain size, it undergoes unstable crack propagation, exhibiting semi-brittleness. The crack of steel GTR-1/2 stably propagated to fracture without instability, showing good low-temperature toughness.
The overall misorientation angle (OMA) is often used as a standard to define high-angle grain boundaries and low-angle grain boundaries. The specific misorientation angle (SMA) is used to define the misorientation angle between specific crystallographic planes. The [28] planes are the primary slip plane, so it is believed that the {110}-SMA controls plastic deformation and grain boundaries with high {110}-SMA can be effective for the free slip [31]. This study statistically analyzes the density of {110}-SMA as a basis for analyzing toughness differences and the statistical results are shown in Figure 9. From the figure, it can be seen that block boundaries and sub-block boundaries are mainly concentrated in areas with lower {110}-SMA and the difference between the two is not significant. Although there are some differences in the density of low-angle packet boundaries, they are mainly concentrated in the lower {110}-SMA. The effect of these three types of grain boundaries on hindering dislocation gliding is not obvious. However, the density of high-angle packet boundaries and PAG boundaries in steel GTR-1/2 are significantly higher than steel UTR-1/2 and mainly concentrated in areas with higher {110}-SMA. Therefore, these two types of grain boundaries can effectively hinder dislocation gliding, thereby enhancing the plastic deformation capability of the steel plate. Although the GTR process and the UTR process lead to similar CIE at −80 °C, the differences in CPE reflect the differences in their plastic deformation capabilities. Due to the presence of a plastic zone at the crack tip, during stable crack propagation, boundaries with higher {110}-SMA can alleviate stress concentration, allowing for the absorption of more impact energy. That reduces the propensity for unstable crack propagation, increasing impact absorption capacity. The absence of unstable crack propagation and the significantly higher CPE in GTR-1/2 steel compared to UTR-1/2 can be attributed to the higher density of high-angle Packet boundaries and PAG boundaries. Therefore, the GTR process can significantly refine the size of PAG in the center compared to the UTR process. Meanwhile, they increase the density of {110}-SMA in the PAG boundaries and high-angle packet boundaries, playing a role in alleviating stress concentration at the crack tip and thus improving the stable crack propagation, improving low-temperature toughness.

5. Conclusions

Compared to the traditional UTR process, the GTR process can significantly refine the size of the PAG in the center while improving the strength, plasticity, and low-temperature toughness of the center. The GTR process not only increases the PAG boundaries density in the center but also significantly increases the packet boundaries density. Through the analysis of dislocation density and grain boundary density, it is shown that the GTR process contributes more to the dislocation strengthening of the center and the proportion of PAG boundaries and high-angle packet boundaries with larger 1-N values is higher, resulting in stronger resistance to slip transfer. Through instrumented Charpy impact test and grain boundary density analysis, it is shown that the GTR process has a higher proportion of high {110}-SMA of the PAG boundaries and high-angle packet boundaries in the center, effectively hindering dislocation gliding, increasing the stable crack propagation, and improving low-temperature toughness.

Author Contributions

Conceptualization, J.C. and X.W.; methodology, J.C.; software, J.Z.; validation, J.C. and X.W.; formal analysis, J.C.; investigation, Z.W.; resources, X.W.; data curation, J.C.; writing—original draft preparation, J.C.; writing—review and editing, J.C.; visualization, J.Z. and Z.W.; supervision, X.W.; project administration, X.W.; funding acquisition, X.W. All authors have read and agreed to the published version of the manuscript.

Funding

This research was funded by the Fundamental Research Business Funds for Central Universities (FRF-BD-22-02).

Data Availability Statement

The raw data supporting the conclusions of this article will be made available by the authors on request.

Acknowledgments

The authors are grateful to Hongyu Wu, Yu Li, and Zhaowan Xie for their help with writing and English editing.

Conflicts of Interest

Author Zhongwen Wu was employed by the company Xiangtan Iron & Steel Group Co., Ltd. The remaining authors declare that the re-search was conducted in the absence of any commercial or financial relationships that could be construed as a potential conflict of interest.

References

  1. Zhou, T.; Yu, H.; Wang, S. Effect of microstructural types on toughness and microstructural optimization of ultra-heavy steel plate: EBSD analysis and microscopic fracture mechanism. Mater. Sci. Eng. A 2016, 658, 150–158. [Google Scholar] [CrossRef]
  2. Liu, D.; Cheng, B.; Chen, Y. Strengthening and Toughening of a Heavy Plate Steel for Shipbuilding with Yield Strength of Approximately 690 MPa. Metall. Mater. Trans. A 2012, 44, 440–455. [Google Scholar] [CrossRef]
  3. Zhou, T.; Yu, H.; Wang, S. Microstructural Characterization and Mechanical Properties across Thickness of Ultra-Heavy Steel Plate. Steel Res. Int. 2017, 88, 1700132. [Google Scholar] [CrossRef]
  4. Xie, B.-S.; Cai, Q.-W.; Yun, Y.; Li, G.-S.; Ning, Z. Development of high strength ultra-heavy plate processed with gradient temperature rolling, intercritical quenching and tempering. Mater. Sci. Eng. A 2017, 680, 454–468. [Google Scholar] [CrossRef]
  5. Guo, K.; Pan, T.; Zhang, N.; Meng, L.; Luo, X.; Chai, F. Effect of Microstructural Evolution on the Mechanical Properties of Ni-Cr-Mo Ultra-Heavy Steel Plate. Materials 2023, 16, 1607. [Google Scholar] [CrossRef] [PubMed]
  6. Wang, Q.; Ye, Q.; Tian, Y.; Fu, T.; Wang, Z. Superior Through-Thickness Homogeneity of Microstructure and Mechanical Properties of Ultraheavy Steel Plate by Advanced Casting and Quenching Technologies. Steel Res. Int. 2021, 92, 2000698. [Google Scholar] [CrossRef]
  7. Zhang, S.; Hu, X.; Du, Y.; Jiang, H.; Pang, H.; Rong, L. Cross-section effect of Ni-Cr-Mo-B ultra-heavy steel plate for offshore platform. Acta Met. Sin. 2020, 56, 1227–1238. [Google Scholar]
  8. Wei, Y.; Gaosheng, L.; Qingwu, C. Effect of a novel gradient temperature rolling process on deformation, microstructure and mechanical properties of ultra-heavy plate. J. Mater. Process. Technol. 2015, 217, 317–326. [Google Scholar] [CrossRef]
  9. Tao, P.; Yu, H.; Fan, Y.; Fu, Y. Effects of cooling method after intercritical heat treatment on microstructural characteristics and mechanical properties of as-cast high-strength low-alloy steel. Mater. Des. (1980–2015) 2014, 54, 914–923. [Google Scholar] [CrossRef]
  10. Tsuyama, S. Thick Plate Technology for the Last 100 Years: A World Leader in Thermo Mechanical Control Process. ISIJ Int. 2015, 55, 67–78. [Google Scholar] [CrossRef]
  11. Nishioka, K.; Ichikawa, K. Progress in thermomechanical control of steel plates and their commercialization. Sci. Technol. Adv. Mater. 2012, 13, 023001. [Google Scholar] [CrossRef] [PubMed]
  12. Omata, K.; Yoshimura, H.; Yamamoto, S. Leading high performance steel plates with advanced manufacturing technologies. NKK Technol. Rev. 2003, 88, 8. [Google Scholar]
  13. Gaosheng, L.; Wei, Y.; Qingwu, C. Investigation of the Evolution of Central Defects in Ultra-Heavy Plate Rolled Using Gradient Temperature Process. Metall. Mater. Trans. B 2015, 46, 831–840. [Google Scholar] [CrossRef]
  14. Kang, J.; Wang, C.; Wang, G.D. Microstructural characteristics and impact fracture behavior of a high-strength low-alloy steel treated by intercritical heat treatment. Mater. Sci. Eng. A 2012, 553, 96–104. [Google Scholar] [CrossRef]
  15. Li, X.; Lu, G.; Wang, Q.; Zhao, J.; Xie, Z.; Misra RD, K.; Shang, C. The Effects of Prior Austenite Grain Refinement on Strength and Toughness of High-Strength Low-Alloy Steel. Metals 2021, 12, 28. [Google Scholar] [CrossRef]
  16. Li, X.C.; Zhao, J.X.; Cong, J.H.; Misra RD, K.; Wang, X.M.; Wang, X.L.; Shang, C.J. Machine learning guided automatic recognition of crystal boundaries in bainitic/martensitic alloy and relationship between boundary types and ductile-to-brittle transition behavior. J. Mater. Sci. Technol. 2021, 84, 49–58. [Google Scholar] [CrossRef]
  17. Cong, J.; Li, J.; Fan, J.; Misra, R.D.K.; Xu, X.; Wang, X. Effect of austenitic state before ferrite transformation on the mechanical behavior at an elevated temperature for seismic-resistant and fire-resistant constructional steel. J. Mater. Res. Technol. 2021, 13, 1220–1229. [Google Scholar] [CrossRef]
  18. Han, P.; Liu, Z.P.; Li, Q.; Xie, Z.J.; Wang, X.L.; Misra, R.D.K.; Shang, C.J. A phenomenological understanding of the novel design of hierarchical structure for 1 GPa ultrahigh strength and high toughness combination low alloy steel. Mater. Sci. Eng. A 2023, 881, 145387. [Google Scholar] [CrossRef]
  19. Xie, Z.J.; Han, P.; Liu, Z.P.; Wang, X.L.; Shang, C.J. Influence of initial microstructure on reaustenitization behavior in low alloy steel by in-situ high-temperature EBSD characterization. Mater. Lett. 2023, 350, 134876. [Google Scholar] [CrossRef]
  20. Han, P.; Liu, Z.; Xie, Z.; Wang, H.; Jin, Y.; Wang, X.; Shang, C. Influence of band microstructure on carbide precipitation behavior and toughness of 1 GPa-grade ultra-heavy gauge low-alloy steel. Int. J. Miner. Metall. Mater. 2023, 30, 1329–1337. [Google Scholar] [CrossRef]
  21. Furuhara, T.; Kikumoto, K.; Saito, H.; Sekine, T.; Ogawa, T.; Morito, S.; Maki, T. Phase Transformation from Fine-grained Austenite. Isij Int. 2008, 48, 1038–1045. [Google Scholar] [CrossRef]
  22. Kubin, L.P.; Mortensen, A. Geometrically necessary dislocations and strain-gradient plasticity: A few critical issues. Scr. Mater. 2003, 48, 119–125. [Google Scholar] [CrossRef]
  23. Calcagnotto, M.; Ponge, D.; Demir, E.; Raabe, D. Orientation gradients and geometrically necessary dislocations in ultrafine grained dual-phase steels studied by 2D and 3D EBSD. Mater. Sci. Eng. A 2010, 527, 2738–2746. [Google Scholar] [CrossRef]
  24. Cong, J.; Li, J.; Fan, J.; Liu, P.; Misra, R.D.K.; Shang, C.; Wang, X. The Impact of Interphase Precipitation on the Mechanical Behavior of Fire-Resistant Steels at an Elevated Temperature. Materials 2020, 13, 4294. [Google Scholar] [CrossRef] [PubMed]
  25. Gladman, T. The Physical Metallurgy of Microalloyed Steels; The Institute of Materials: London, UK, 1997. [Google Scholar]
  26. Sun, X.; Choi, K.S.; Soulami, A.; Liu, W.N.; Khaleel, M.A. On key factors influencing ductile fractures of dual phase (DP) steels. Mater. Sci. Eng. A 2009, 526, 140–149. [Google Scholar] [CrossRef]
  27. Du, C.; Hoefnagels, J.P.M.; Vaes, R.; Geers, M.G.D. Block and sub-block boundary strengthening in lath martensite. Scr. Mater. 2016, 116, 117–121. [Google Scholar] [CrossRef]
  28. Wang, J.; Hong, H.; Huang, A.; Yang, X.; Qian, R.; Shang, C. New insight into the relationship between grain boundaries and hardness in bainitic/martensitic steels from the crystallographic perspective. Mater. Lett. 2022, 308, 131105. [Google Scholar] [CrossRef]
  29. Weaver, J.S.; Nan, L.; Mara, N.A.; Jones, D.R.; Hansohl, C.; Bronkhorst, C.A.; Fensin, S.J.; Gray, G.T. Slip transmission of high angle grain boundaries in body-centered cubic metals: Micropillar compression of pure Ta single and bi-crystals. Acta Mater. 2018, 156, 356–368. [Google Scholar] [CrossRef]
  30. Wang, J.; Qian, R.; Huang, S.; Shang, C. Effect of Double-Quenching on the Hardness and Toughness of a Wear-Resistant Steel. Metals 2022, 13, 61. [Google Scholar] [CrossRef]
  31. Wang, Z.; Guo, Z.; Shang, C.; Chen, B.; Hui, Y. Characterization of the Stretch Flangeabitity of High-Strength Bainitic Steel: The Significance of Variant Pairs. Materials 2022, 15, 276. [Google Scholar] [CrossRef]
  32. Zhao, J.; Li, X.; Wang, X.; Liu, S.; Wang, X.; Shang, C. Distribution feature of specific misorientation angle in a bainitic steel. Mater. Charact. 2021, 172, 110874. [Google Scholar] [CrossRef]
  33. Chaouadi, R.; Fabry, A. On the utilization of the instrumented Charpy impact test for characterizing the flow and fracture behavior of reactor pressure vessel steels. In European Structural Integrity Society; Elsevier: Amsterdam, The Netherlands, 2002; Volume 30, pp. 103–117. [Google Scholar]
  34. ISO 14556:2015; Metallic Materials—Charpy V-Notch Pendulum Impact Test—Instrumented Test Method. ES-AENOR: Madrid, Spain, 2016; Volume UNE-EN ISO 14556-2016.
Figure 1. Thermo-mechanical controlled processing (TMCP) process flow chart of experimental steels.
Metals 14 00199 g001
Figure 2. OM micrographs ((a) 128×, (b) 256×) and SEM micrographs ((c) 500×, (d) 1000×) of steel UTR and steel GTR in the center. ((a): UTR-1/2, (b): GTR-1/2, (c): UTR-1/2, (d): GTR-1/2, RD: Rolling direction, ND: Normal direction).
Metals 14 00199 g002
Figure 3. BC (Band contrast) map and IPFX (inverse pole figure X-axis) color map of steel UTR and steel GTR in the center. ((a): UTR-1/2, (b): GTR-1/2, (c): UTR-1/2, (d): GTR-1/2, RD: Rolling direction, ND: Normal direction).
Metals 14 00199 g003
Figure 4. SEM appearance of fractures of the UTR-1/2 ((a) 27×, (b) 200×)) and GTR-1/2 ((c) 27×, (d) 200×).
Metals 14 00199 g004
Figure 5. (a,b) PAG (prior austenite grain) boundaries skeleton map; (c) Boundary density computed by the Python program (PAG boundaries-prior austenite grain boundaries; High-packet boundaries (misorientation angle ≥ 15°); Low-packet boundaries (misorientation angle < 15°)). (a) and (b) are maps for UTR-1/2 and GTR-1/2, respectively.
Metals 14 00199 g005
Figure 6. (a,b) Distribution map of high-angle grain boundaries (misorientation angle ≥ 15°) and low-angle grain boundaries (misorientation angle < 15°) (black lines: high-angle grain boundaries, green lines: low-angle grain boundaries); (c,d) GND (geometrically necessary dislocation) density maps. (a,c) and (b,d) are maps for UTR-1/2 and GTR-1/2, respectively.
Metals 14 00199 g006
Figure 7. The 1-N value of different types of grain boundaries distribution map (the small image is a locally enlarged image): (a) UTR-1/2; (b) GTR-1/2.
Metals 14 00199 g007
Figure 8. CVN impact load and absorbed energy vs. displacement curves obtained in the instrumented Charpy impact tests conducted at −80 °C: (a) UTR-1/2; (b) GTR-1/2.
Metals 14 00199 g008
Figure 9. {110}-SMAs of different types of grain boundaries (the small image is a locally enlarged image): (a) UTR-1/2; (b) GTR-1/2.
Metals 14 00199 g009
Table 1. The chemical composition of the experimental steel (wt.%).
CSiMnCrNiCuMoVPS
0.0690.340.590.644.790.0240.50.0650.00530.0004
Table 2. Mechanical properties of experimental steels.
NumberYS 1 (MPa)TS 2 (MPa)Yield RatioEl 3 (%)−80 °C CVN 4 (J)
UTR-1/2769.51083.50.7115.6168.8
GTR-1/2791.51120.50.7117.7240.0
1 Yield strength; 2 Tensile strength; 3 Elongation; 4 Charpy v-notch impact toughness.
Table 3. The density of grain boundaries and dislocations.
NumberDislocation Density (ρ)/m−2σDis/MPa
UTR-1/21.42 × 1014283.9
GTR-1/21.51 × 1014292.7
Disclaimer/Publisher’s Note: The statements, opinions and data contained in all publications are solely those of the individual author(s) and contributor(s) and not of MDPI and/or the editor(s). MDPI and/or the editor(s) disclaim responsibility for any injury to people or property resulting from any ideas, methods, instructions or products referred to in the content.

