Article

A Comparison of Experimental and Ab Initio Structural Data on Fe under Extreme Conditions

by
Anatoly B. Belonoshko
1,2,3,4,* and
Grigory S. Smirnov
3,5
1
Frontiers Science Center for Critical Earth Material Cycling, School of Earth Sciences and Engineering, Nanjing University, Nanjing 210023, China
2
Condensed Matter Theory, Department of Physics, AlbaNova University Center, Royal Institute of Technology (KTH), 10691 Stockholm, Sweden
3
International Laboratory for Supercomputer Atomistic Modelling and Multi-Scale Analysis, Moscow Institute of Electronics and Mathematics, HSE University, 123458 Moscow, Russia
4
Department of Physics, University of South Florida, Tampa, FL 33620, USA
5
Joint Institute for High Temperatures of the Russian Academy of Sciences, 125412 Moscow, Russia
*
Author to whom correspondence should be addressed.
Metals 2023, 13(6), 1096; https://doi.org/10.3390/met13061096
Submission received: 2 May 2023 / Revised: 22 May 2023 / Accepted: 6 June 2023 / Published: 9 June 2023
(This article belongs to the Special Issue Application of First Principle Calculation in Metallic Materials)

Abstract

:
Iron is the major element of the Earth’s core and the cores of Earth-like exoplanets. The crystal structure of iron, the major component of the Earth’s solid inner core (IC), is unknown under the high pressures (P) (3.3–3.6 Mbar) and temperatures (T) (5000–7000 K) and conditions of the IC and exoplanetary cores. Experimental and theoretical data on the phase diagram of iron at these extreme PT conditions are contradictory. Though some of the large-scale ab initio molecular dynamics (AIMD) simulations point to the stability of the body-centered cubic (bcc) phase, the latest experimental data are often interpreted as evidence for the stability of the hexagonal close-packed (hcp) phase. Applying large-scale AIMD, we computed the properties of iron phases at the experimental pressures and temperatures reported in the experimental papers. The use of large-scale AIMD is critical since the use of small bcc computational cells (less than approximately 1000 atoms) leads to the collapse of the bcc structure. Large-scale AIMD allowed us to compare the measured and computed coordination numbers as well as the measured and computed structural factors. This comparison, in turn, allowed us to suggest that the computed density, coordination number, and structural factors of the bcc phase are in agreement with those observed in experiments, which were previously assigned either to the liquid or hcp phase.

1. Introduction

The phase diagram of iron is of special importance in geophysics [1,2,3,4,5], not only because the Earth’s core consists mainly of iron but also because the inhabited exoplanets also most likely possess an iron core. The Earth’s core protects life on Earth from cosmic radiation, and the same mechanism likely protects the life on exoplanets (and does not protect it if there is no iron core). Our ability to predict the existence of an iron core critically depends on our knowledge of the phase diagram of iron and the properties of iron phases under the extreme P–T conditions of the Earth’s IC and possibly the even more extreme P–T conditions of exoplanetary cores. Knowledge of the stable Fe phase in the IC allows for the right interpretation of seismic signals and, thus, opens the way to understanding the history of the Earth and the prediction of its future. The core of the Earth consists of two parts: liquid and solid. As the Earth cools down, the solid core grows. Most of the solid (inner) core is close to the temperatures of iron melting at corresponding pressures. Therefore, we need to know which phase of iron is the stable one before it becomes liquid after temperature increases at high pressures in a planetary interior. Two phases are the most promising candidates for the sub-melting phase, namely bcc and hcp. While the properties of the bcc phase [6,7,8,9,10,11,12] are nearly identical to the properties of the IC as they are known from seismological observations [4,13,14,15,16], the hcp phase is almost a direct opposite of the IC material [11,12]. At the same time, most of the theoretical [17,18,19,20,21] and experimental [22,23,24,25,26,27,28,29] papers suggest the stability of the hcp phase. On the theoretical side, most of the confusion stems from considering too small computational cells and/or neglecting the electronic entropy when computing the bcc phase. Small bcc cells are not even metastable, they are dynamically unstable [9]. If the size of the computational cell containing the bcc lattice is less than about 1000 atoms, such a cell collapses into a distorted close-packed configuration [9]. Therefore, one needs to simulate large cells of bcc structures. Some authors model the bcc phase using bcc computational cells as small as two atoms [18]. Unsurprisingly, the results they are getting are quite expected—the two-atom bcc phase is unstable. The bcc phase becomes stable at large sizes of at least about a thousand atoms, and the stability converges at much higher sizes (on the order of millions of atoms) [11]. Recently, we computed the iron phase diagram using a combination of classical and ab initio molecular dynamics [11]. A combination of classical molecular dynamics along with accounting for electronic entropy using ab initio MD results in the stability of the bcc phase under the melting curve starting from a pressure of about 120 GPa [11]. While confusion among the authors of theoretical papers seems comparably easy to explain, the experimental approaches—most of these report stability of the hcp phase—are more difficult to reconcile. There are numerous experiments reporting hcp phase stability and rather few [30,31,32,33,34,35] that report bcc phase stability. We are convinced that there are no wrong experiments. If all the details of the experimental procedure are reported along with the exact description of observations, what actually might be wrong? Unfortunately, when an experiment is performed under extreme conditions of pressure and temperature, direct measurements of the structure of the material subjected to extreme P and T are not always possible, and when they are possible, they might be ambiguous. The interpretation of the observations becomes a difficult task, especially when the nature of the emerging phase is not well known (as is the case with the high PT bcc phase where a number of properties are not expected). Recently, Kraus et al. [29] and, not so recently, Ping et al. [28] reported the properties of the submelting phase of iron measured up to very high pressures. It is of interest to compare the experimental data and the data computed for iron phases using the robust AIMD approach. In what follows, we explain the details of our AIMD calculations in the Method section and then provide the results of these calculations and compare them with experiments. We demonstrate good agreement between experimental data and the properties of the bcc phase. This agreement and its consequences are further discussed and summarized in the conclusions.

2. Method

Our AIMD simulations were performed using the Vienna Ab initio Simulation Package (VASP). In our DFT (density functional theory)-based AIMD runs we used the generalized gradient approximation (GGA) of the electronic exchange correlation energy [36] and the Fe potential with 16 3 p 6 3 d 7 3 s 2 4 s 1 valence electrons. Choosing another exchange correlation functional would probably somewhat change the results. However, even such drastic changes as the acceptance of a semi-empirical treatment of interactions does not result in qualitatively different data [9]. The functional we rely on in this study is well tested in the literature and we use a well-tested method.
Electronic structure calculations [37,38,39] were performed with a plane wave set corresponding to a 400.0 eV energy cut-off, and the electronic iterations were converged to within 10 4 eV. These parameters are routinely used by many research groups, including the authors of the present work. Nevertheless, we checked the convergence by running AIMD with the 600.0 eV energy cut-off and the convergence on electronic iterations within 10 6 eV. Note that for a system size of the order of 1000 atoms, such convergence is extreme, and it took about 40 electronic iterations at each AIMD step. Despite such extreme parameters, the radial distribution functions (RDF), computed using two sets of parameters, were identical (Figure 1). This suggests that our calculations are converged for the chosen cut-off energy as well as for the parameters for the precision of electronic calculations.
We used a 1.0 femtosecond timestep for the AIMD and classical molecular dynamics simulations. We approximated the hcp phase with a supercell with 1024 atoms ( 8 × 8 × 8 unit cells) and the bcc phase by a supercell with 2000 atoms ( 10 × 10 × 10 unit cells). The liquid phase was obtained by heating the hcp phase to a very high temperature and then equilibrating it around the melting temperature. The lattice constants were chosen by running NVT (constant N, V (volume), and T) ensemble AIMD runs that produced pressures of 360 and ≈550 GPa at the temperatures of 7000 K and 9000 K, correspondingly (temperatures close to melting at corresponding pressures of ≈550 GPa were estimated in a recent experiment). We note that neither the pressure nor the temperature are known very precisely in the experiment, in part due to the extreme conditions of pressure and temperature.
The structure of the phases was monitored by calculating the radial distribution function (RDF). The AIMD runs durations were normally about 8000 timesteps. The AIMD runs were performed for Γ -point only. At the sizes of the supercells we use, the Γ -point is sufficient. Finite temperatures for the electronic structure and force calculations were implemented within the Fermi–Dirac smearing approach [40]. In all our AIMD runs, we used the VASP [38,39] software package.

3. Results

A few years ago, Ping et al. [28] compressed iron by multiple shocks to 560 GPa. The results of extended X-ray absorption fine structure (EXAFS) spectroscopy were reported. These results allowed us to obtain the density, temperature, and local structure of compressed iron. The locus of the experimental P–T points at pressures above approximately 250 GPa belongs to the P–T range of bcc Fe stability as computed recently [11]. The experimental paper reported that the coordination number of Fe atoms at these P–T points is nearly constant and is equal to 11. While the coordination number was derived from the fit of the EXAFS signal to some expression that involves the coordination number as one of the parameters [28], we treated the reported coordination number as experimental data. The authors [28] are sure that the phase is solid and considered two candidates, namely hcp and bcc. The bcc phase was ruled out for two reasons (as argued in the paper): the too low density (if the EXAFS data are due to the bcc phase stability onset) in comparison with the measured one and the too low coordination number (eight) compared to the measured one (eleven). Ping et al. speculated that if the EXAFS signal is considered as being caused by the bcc lattice, then the volume of the bcc lattice would be too large. Both of these reasons are based on a model of the static T = 0 K bcc lattice. While some AIMD simulations have been performed, the size of the simulated bcc phase was just 128 atoms. We now know that such a size is insufficient to stabilize bcc [9]. The hcp phase was deemed to be stable because its density is reasonably close to the experimentally measured density, and its coordination number (12) is reasonably close to the measured one (11). The apparent mismatch of the coordination numbers (11 and 12) was explained by a presumably large number of defects that decrease the coordination and large error bars (in our opinion, both of these explanations are untenable). Such assumptions (a coordination number of 8 and the low density of bcc) require further testing. We computed both and compared them with the experimental data. The bcc phase properties were computed at P = 360 GPa and T = 7000 K and at P = 550 GPa and 9000 K (the conditions close to the melting curve). The densities of the bcc and hcp phases were computed at P = 360 GPa and T = 6600 K. The corresponding densities, 13.49 g/cm 3 and 13.54 g/cm 3 , are indistinguishable in the experiment. This removes the claim of the ’too low density’ of the bcc phase.
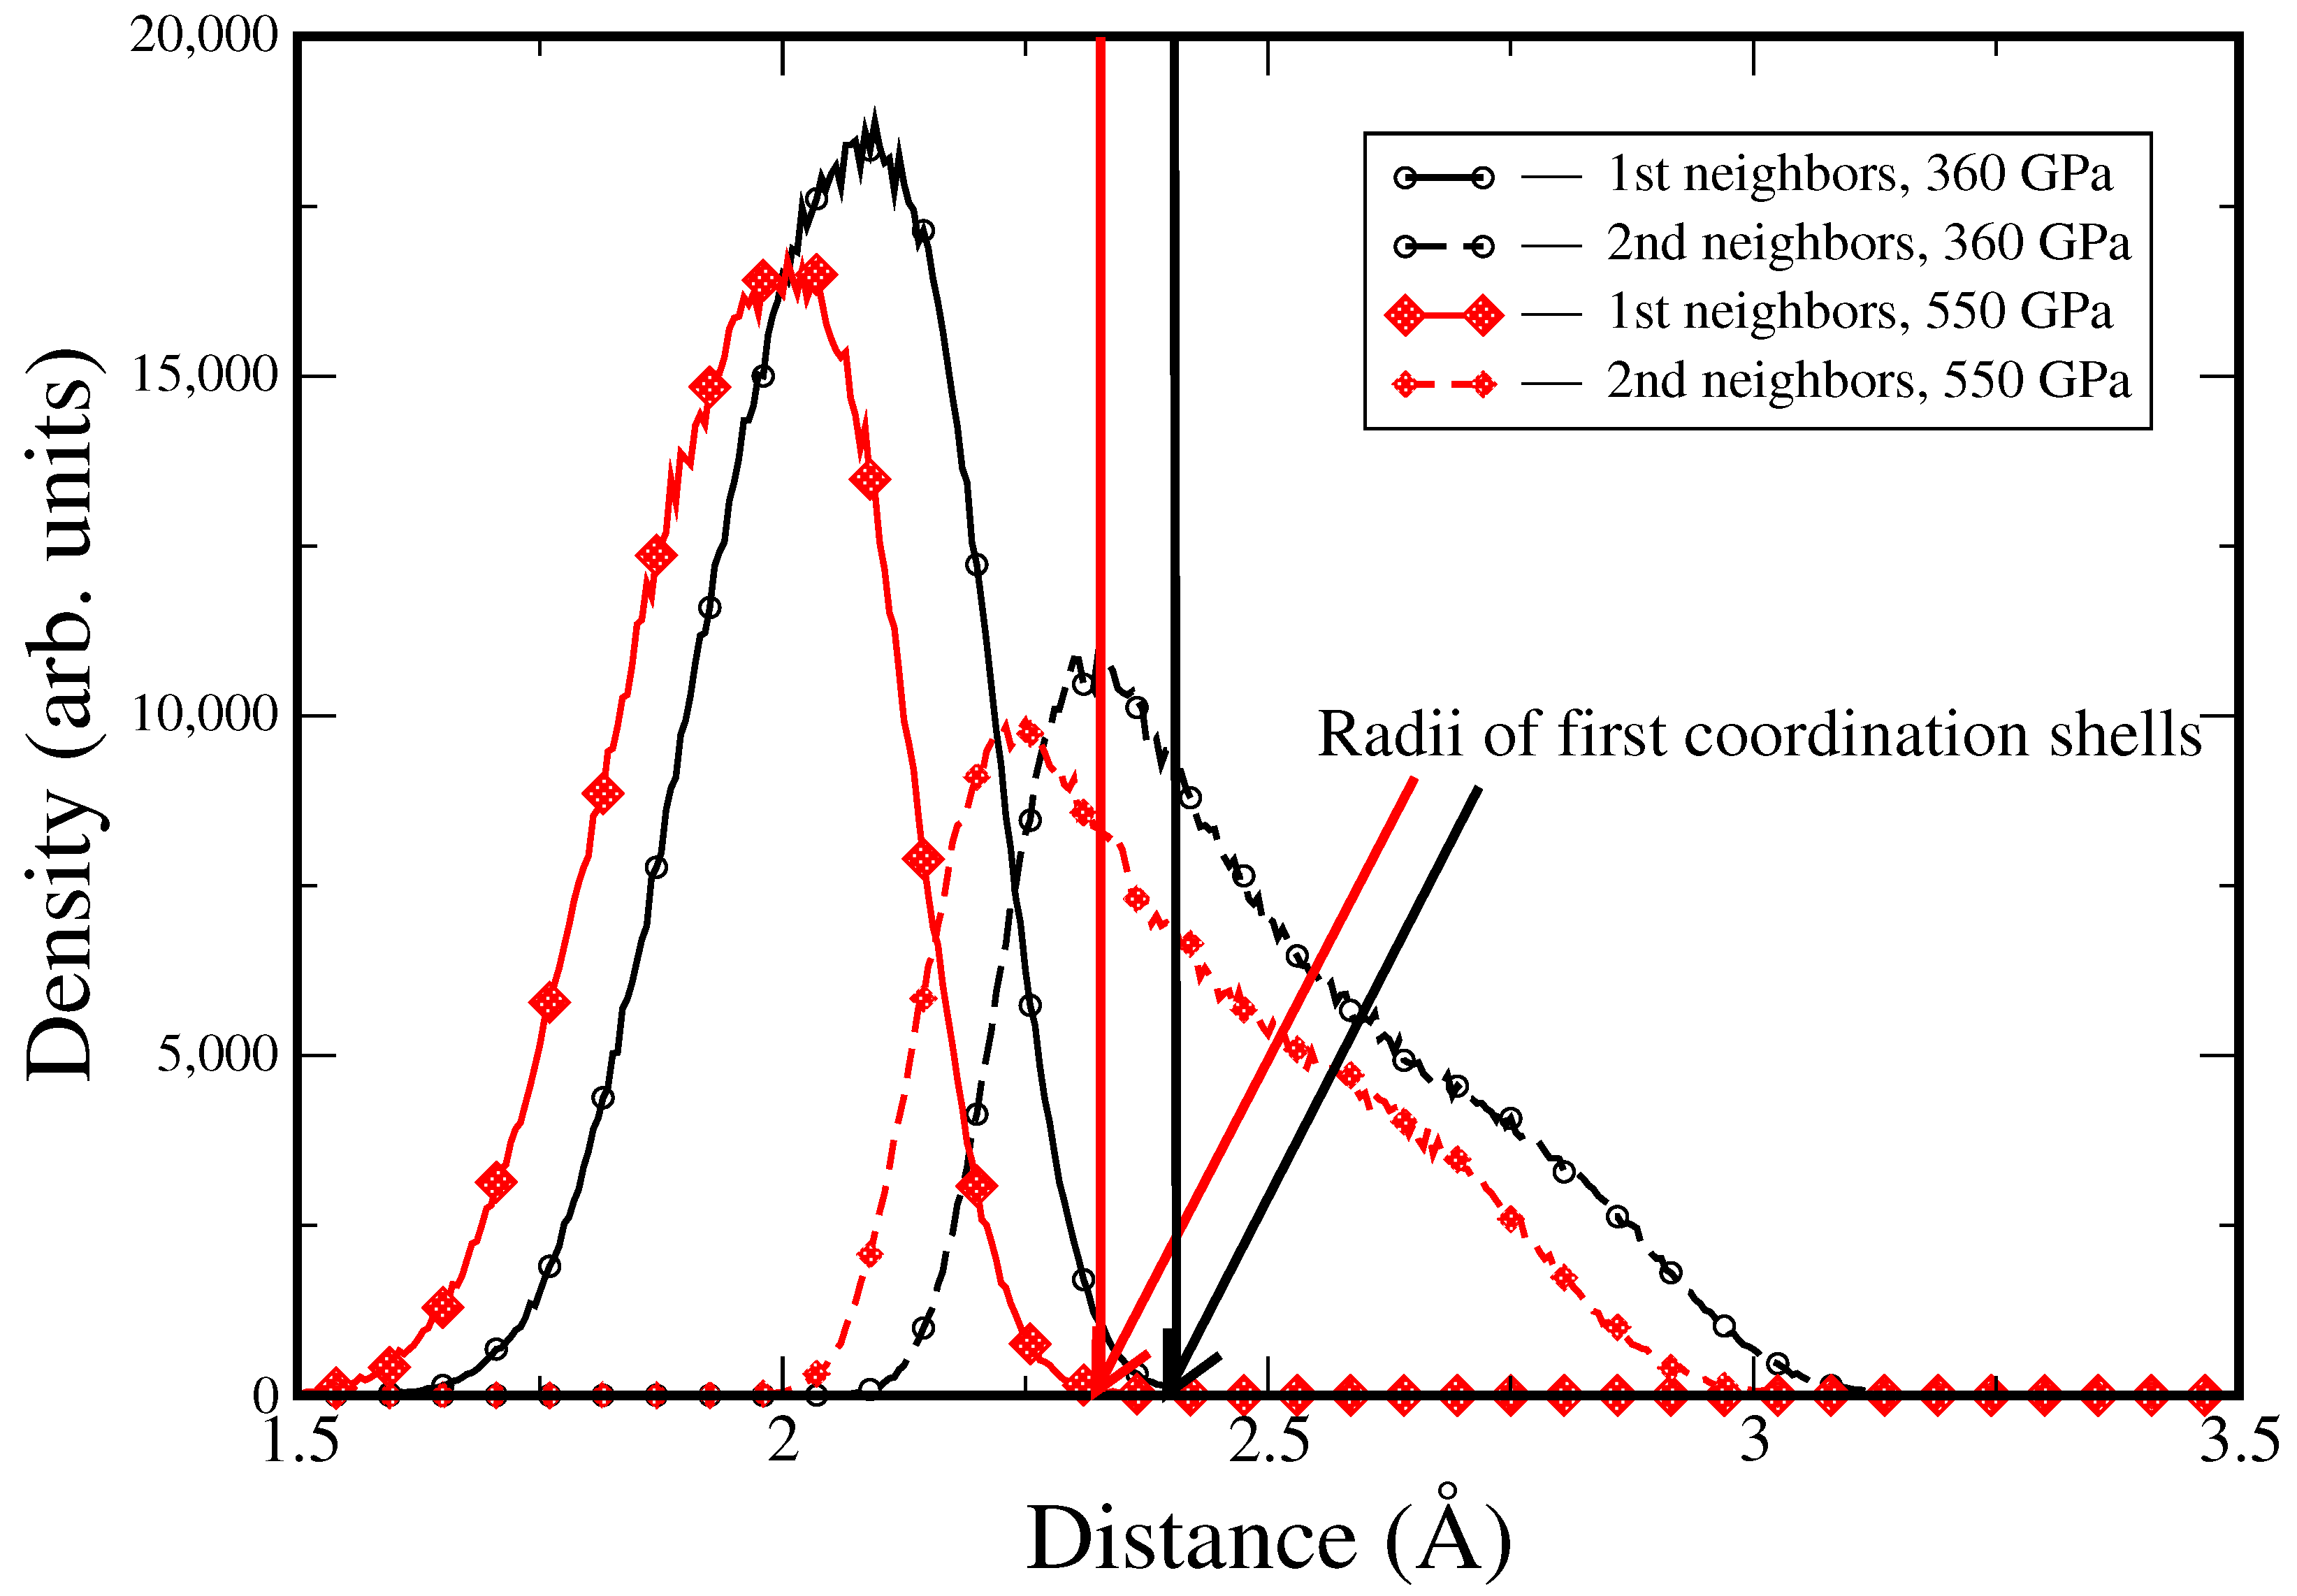
We define the radius of the first coordination shell as the radius of a sphere that contains the eight nearest neighbors in the bcc structure. In the ideal 0 K bcc lattice, the atom in the center of the cube has eight nearest neighbors in the corners of the cube. Unfortunately, the 0 K model of the bcc lattice was used by the experimentalists to rule out the bcc phase. The claim for the eight-coordinated bcc Fe at high P–T conditions is off by a big margin. In the ideal bcc lattice, it is true, of course. However, the situation is drastically different at high P–T. An Fe atom in the bcc lattice has eight nearest neighbors and six neighbors at a somewhat larger distance. When the thermal motion is accounted for, the difference between the first and second coordination shells is not as straightforward. As a result of thermal motion, the first coordination shell radius increases—indeed, it should include all first eight neighbors, and these neighbors are now moving, resulting in the appearance of both shorter and longer distances. Those longer distances become the effective radius of the first coordination shell because the first coordination shell has to confine all eight atoms. The second coordination shell is also spread in space, forming both shorter and longer distances between the central atom and the atoms in the second coordination shell. Some of these distances are shorter than the radius of the first coordination shell, and these atoms effectively enter the first coordination shell. Figure 2 shows the histogram of the distances to the eight atoms in the first coordination shell and the six atoms in the second coordination shell.
The two shells overlap, and from Figure 2, one can see that approximately half of the atoms in the second shell are at a distance that is shorter than the radius of the first coordination shell. The radius of the first coordination shell is equal to the distance where the first peak goes to zero. From Figure 2, we see that the increase in the radius of the first coordination shell results in an effective coordination number of 11 at both pressures of 360 GPa and 550 GPa. Therefore, we have found the phase of iron with a coordination number of 11 observed in the experiment. It is the high P–T bcc Fe.
Figure 2 demonstrates that the analysis of the bcc incompatibility with the obtained EXAFS spectra is not applicable to the high P–T bcc phase. Indeed, in our AIMD simulations at 360 GPa and 6600 K (Figure 2), the radius of the first coordination shell is equal to approximately 2.4 Å. The lattice constant is equal to 2.395 Å. In Ping et al.’s [28] analysis, the radius of the first coordination shell is equal to 0.866 (half of the cube diagonal) of the lattice constant, considerably different from the AIMD data. Since Ping et al.’s [28] assumptions do not match the reality as it comes from the robust large scale AIMD computations, those assumptions (and what follows from those assumptions) can be safely dismissed. There is no reason to claim a priori the incompatibility of the experimental data and the data of the bcc phase. On the contrary, we suggest that since there is a match of the coordination numbers from the experiment and those calculated for the bcc, the bcc is the preferred candidate to explain the experimental data.
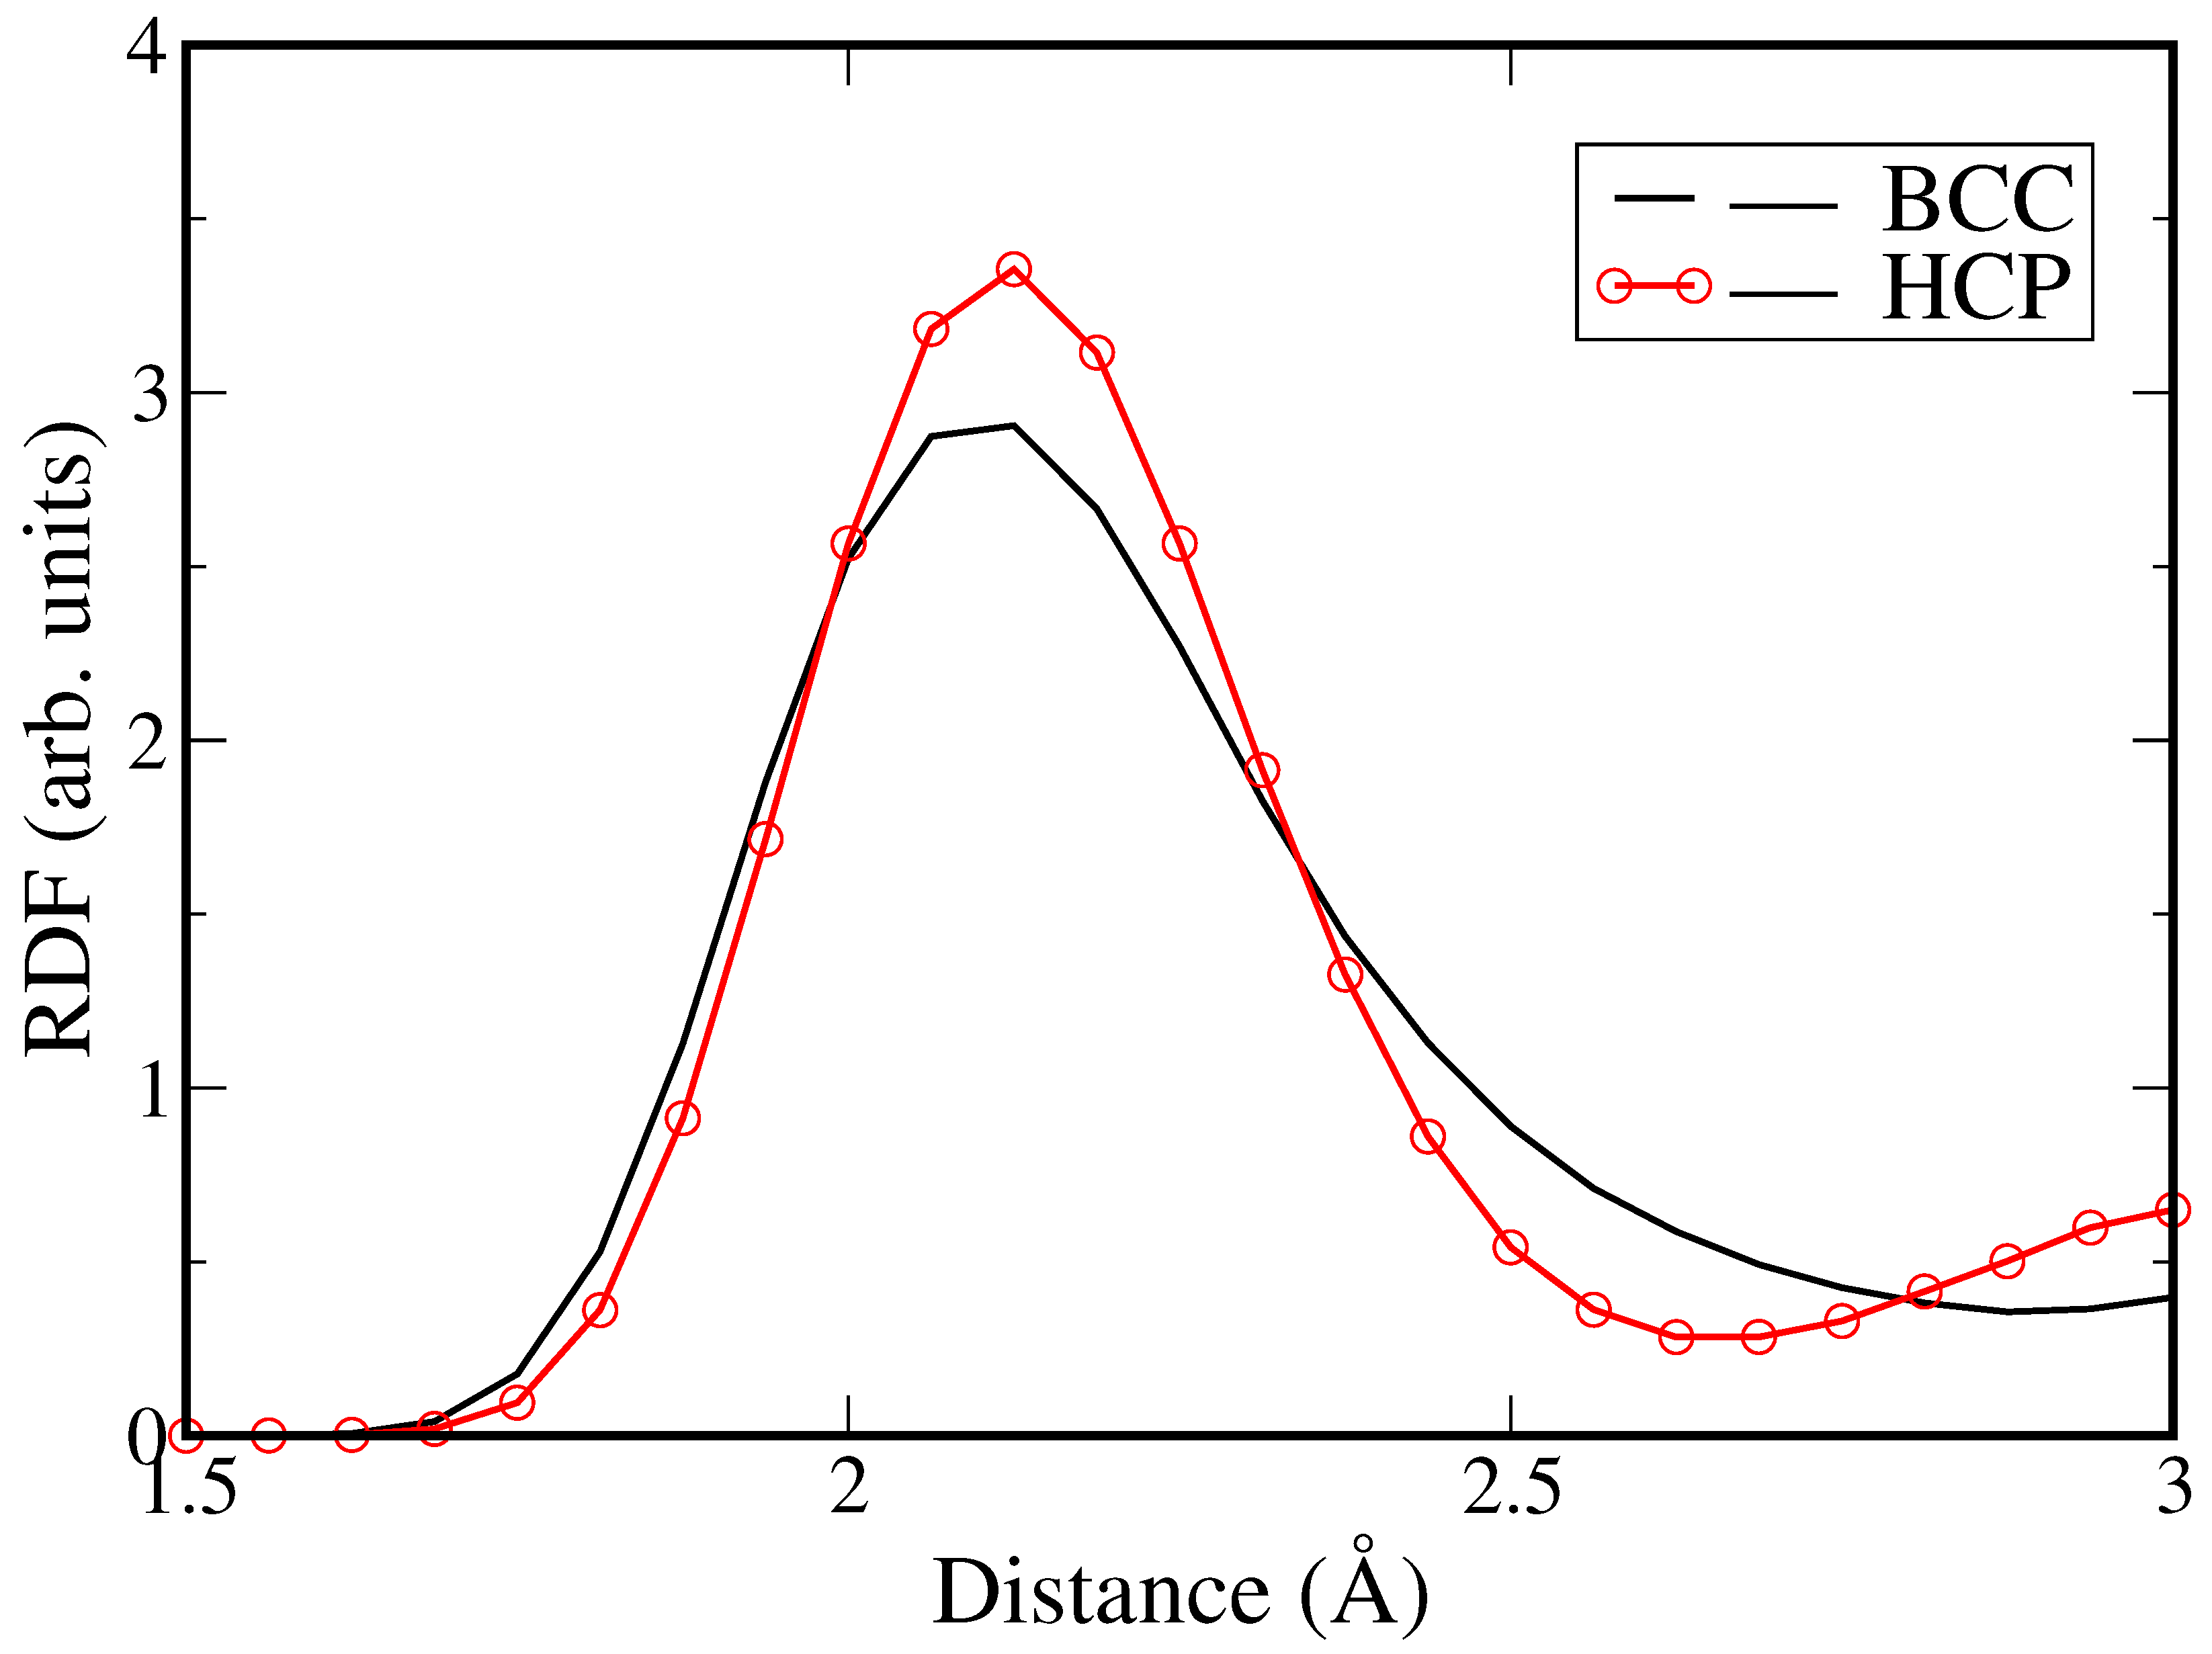
The EXAFS signal is generated at the distance where the backscattering atom approaches the central atom. Figure 3 allows us to compare those distances in the bcc phase and the hcp phase. Those distances are practically identical; the RDFs of both phases become non-zero at identical distances. The number of backscattering atoms increases with identical pace; the slope of the bcc phase’s RDF is identical to the slope of the hcp phase’s RDF. However, the number of backscattering atoms in the first coordination shell is 11 in the case of the bcc phase and 12 in the case of the hcp phase. Out of the two RDFs (Figure 3) that would produce the same shape of the EXAFS signal, we naturally have to choose the one that fits the experimental one, namely the bcc phase matches the experimental data with a coordination number of 11. It becomes obvious that the analysis of the densities by Ping et al. [28], which relied on the analysis of the perfect 0 K lattices provided by Ping et al. [28] in Table I of their Supplementary Materials is not applicable to the high-PT bcc phase. The fitting of the EXAFS signal, however, performed by Ping et al. [28] was not affected by the bcc 0 K analysis and a coordination number of 11 and therefore holds. The interpretation is, of course, different: the match between the experiment and the bcc phase is very good. We note that if the analysis by Ping et al. [28] is correct, then none of the known iron phases match experimental observations, which would be rather strange.
The observation [28] that gets an explanation is the very high anelasticity of the 11-coordinated phase. Indeed, the high P–T bcc Fe possesses a very low viscosity as it is diffusive [10]. Compression of such a phase leads to unusually high plastic heating as observed and discussed in the experimental paper [28]. Such anelasticity is unlikely to be explained by the hcp stability. The large experimental error bars for the measured coordination number of 11 are likely due to the strong dependence of the coordination number on the radius of the first coordination shell. That impacts the fit of the EXAFS signal where a subtle change in the radius (the parameter of the theoretical formula for EXAFS intensity) results in a strong change in the coordination number. This is in contrast to hcp, where the coordination number–distance curve has an inflection point at the coordination number of 12, and the change in the radius of the first coordination shell does not impact the fit as strong as in the bcc case.
Furthermore, we discuss the last remark regarding the definition of coordination number. A naive idea of the radius of the first coordination sphere is that the radius is equal to the position of the first minimum of the RDF. That is true for close-packed structures, where the first and second coordination shells are clearly separated, but is not the case for more complicated structures where a more elaborated analysis is required.
The primary reasons for the original interpretation and denial of bcc Fe by the authors of [28] were the model of bcc Fe with clearly separated first and second coordination shells and the assignment of a coordination number of 8 to the bcc Fe phase. Insight gained from the large-scale AIMD simulations allows us to provide a more adequate model of the high-PT bcc Fe phase and, correspondingly, a better justified explanation of the measured data.
Now, we turn to the recent experimental paper by Kraus et al. [29], where a similar experiment was performed [29]. In this study, liquid iron was compressed using a technique similar to the one employed by Ping et al. [28] in their experimental EXAFS paper [28]. However, Kraus et al. [29] collected X-ray spectra from the experimental samples, allowing direct observations of the sample structure. Since the pressure in such experiments increases with a comparably (in comparison to the slope of the melting curve of iron, for example) modest increase in temperature, eventually the P–T path crosses the melting curve and enters the P–T range of solid iron. The phase that demonstrates the existence of solid peaks is the submelting phase. Unfortunately, because of the extreme nature of the P–T conditions (pressure of about 550 GPa, similar to those in the experimental EXAFS paper [28] and even higher), the collected X-ray spectra were subjected to uncertainties that prevented the authors (as explained by the authors themselves) from the robust refinement of the crystal structure [29]. In addition, the spectra contain pinhole peaks that might conceal the peaks in iron phases. Four experimental spectra were collected after an increase in compression at P ≈ 550 GPa. These four spectra were interpreted as belonging to liquid, liquid + hcp, liquid + hcp again, and finally pure hcp, correspondingly. The temperature in these experiments was deemed to be very close to each other and equal to about 9000 K.
We have computed the same spectra of bcc, hcp, and liquid Fe at several pressures and temperatures. The TRAVIS [41,42] code that we used in our calculations of spectra allows direct processing of the files produced by the VASP code. The TRAVIS code has been widely applied in similar studies and is well tested. Since our computational cells are the largest ever applied in AIMD simulations of iron phases, the computed spectra are the most precise ever obtained for Fe from first principles. This allowed us to make a direct comparison of measured (tabulated spectra were provided to us by R. G. Kraus, of which we are very grateful) and computed spectra. Note that the experimental spectra are provided in arbitrary units [29]. To be able to compare experimental and computed spectra, we need to scale the computed spectrum and shift it to align the computed curve with the experimental units and limits. Scaling was performed with a coefficient equal to the ratio of the most intense peaks from the experiment and AIMD simulations. After that, the scaled computed spectra were shifted. The scaling and shifting are described by the following two equations:
S n e w t h ( Q ) = ( S o l d t h ( Q ) S m i n t h ) K + S m i n e x p
where
K = ( S m a x e x p S m i n e x p ) ( S m a x t h S m i n t h )
and the indexes new and old are for scaled and non-scaled spectra, respectively, and t h and e x p are for theoretical and experimental data, respectively. m a x and m i n are the maximum and minimum intensities of the spectra.
This procedure allows for a direct comparison of spectra. It does not affect the position or relative intensity of the peaks nor does it affect the intensity of the peaks in relation to the background.
Figure 4 shows the comparison of the experimental spectrum, interpreted as collected from the liquid iron just above the melting curve (note that the assignment of the P–T conditions is also subjected to certain assumptions), and the spectrum calculated for the bcc and liquid phases at about the same (as estimated in the experiment) P and T.
We see that the major experimental and computed peaks are positioned at about the same Q. Provided that the experimental pressure is not known particularly precisely, the match of positions is very good. Furthermore, the shapes of the major peaks are also close. The shape is sensitive to the temperature, which is close to the melting temperature at this pressure; however, the melting curve itself is not known very precisely. We note that the computed spectrum for liquid produces a similar major peak; therefore, by comparing only major peaks, it would be highly speculative to provide a robust interpretation of which phase is actually observed in the experiment. Nevertheless, looking at the widths of the three major peaks (Figure 4), we might suggest that both liquid and bcc phases are present in the experiment, because the major experimental peak is broader than the major peak for the bcc phase but narrower than the major peak for the liquid phase. In the experimental spectrum, we can observe a number of other peaks interpreted as the pinhole peaks. Since the quality of the data is particularly noisy at low Q, we shall consider in detail the peaks at a Q of about 4.5 Å, indicated by the boxes in Figure 4. The question we want to answer is whether the experimental peak is due to a pinhole or due to the superposition of the pinhole peak and the bcc peak (no liquid peaks are there). How we can answer this? The solution is to compare it with a spectrum where the pinhole peak is clearly from a pinhole only. For that, we need to turn to the experimental spectrum collected after further compression (Figure 5).
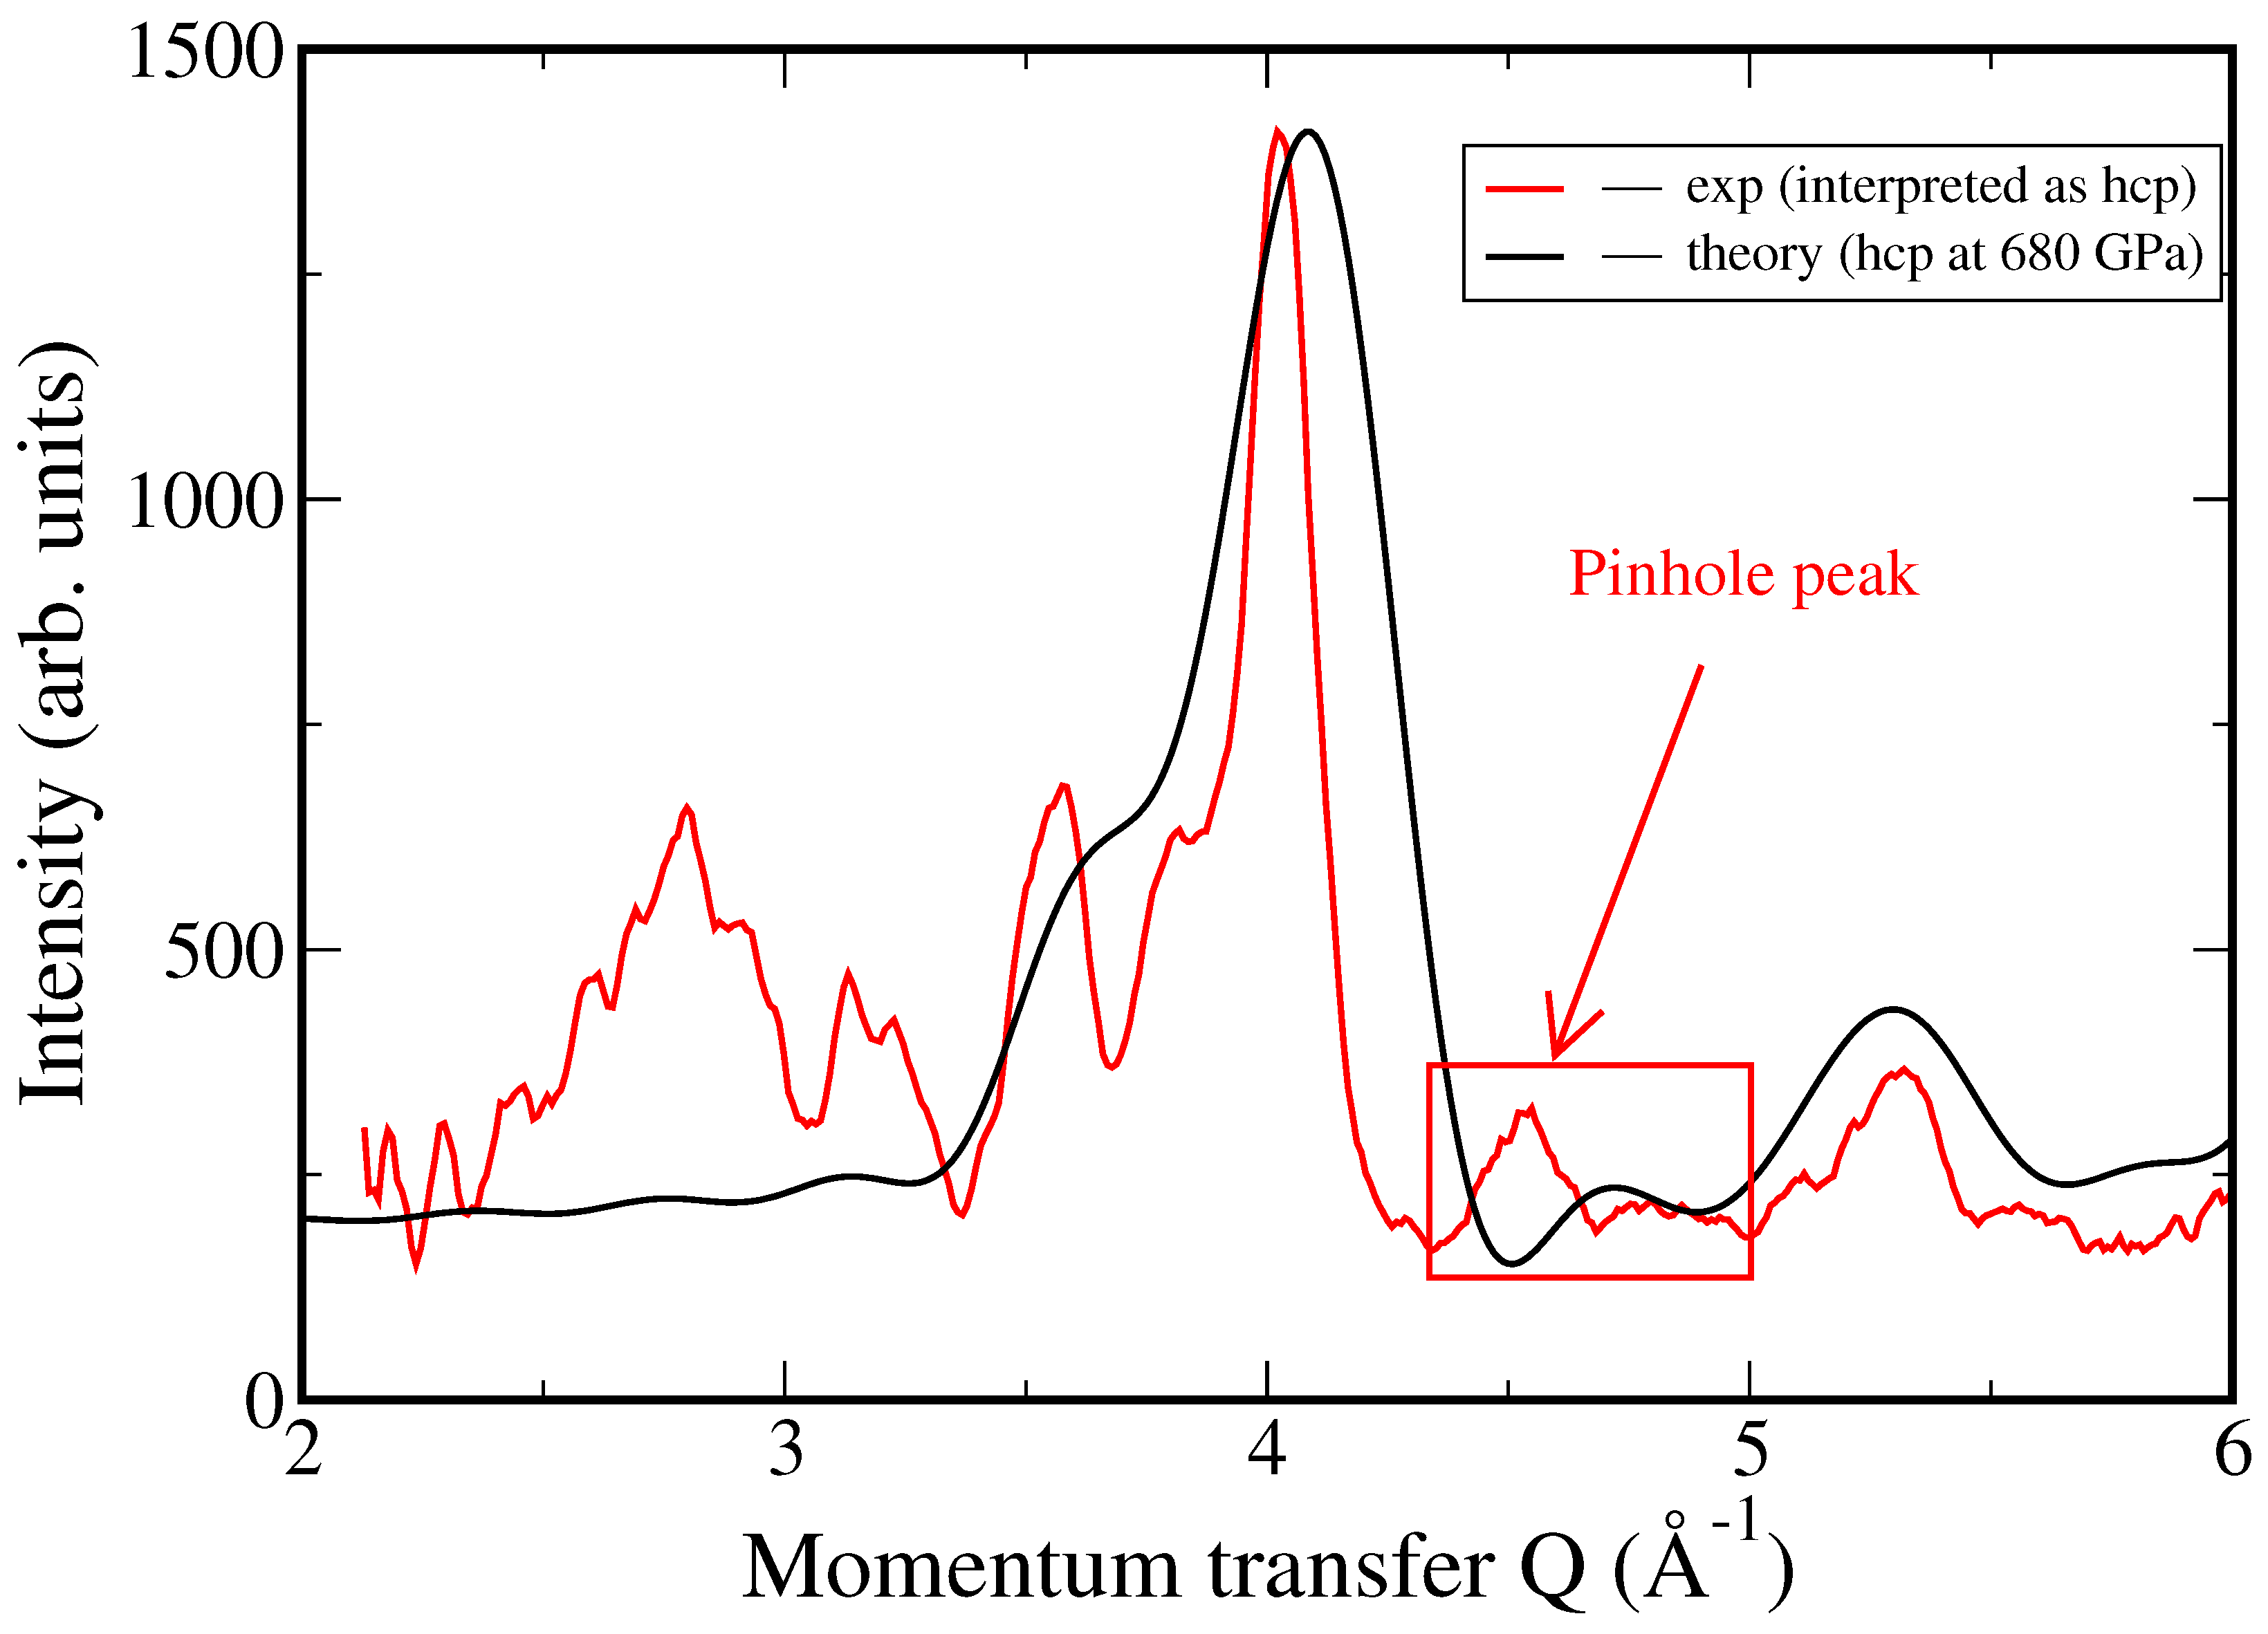
In this figure, we can observe the experimental spectrum of hcp iron compared to the computed hcp spectrum. The spectrum computed at the reported experimental conditions of P = 550 GPa and T = 9000 K was a poor match to experiment. This is in contrast to the comparison depicted in Figure 4. However, the spectrum computed at a higher pressure and lower temperature (Figure 5) in the P–T range of bcc stability [11] fits the experimental spectrum reasonably well. We see that the pinhole peak at the same Q as in the case of the presumably liquid spectrum (Figure 4) does not overlap with any computed peaks. Therefore, we can safely assume that the intensity of that pinhole peak is not affected by iron peaks.
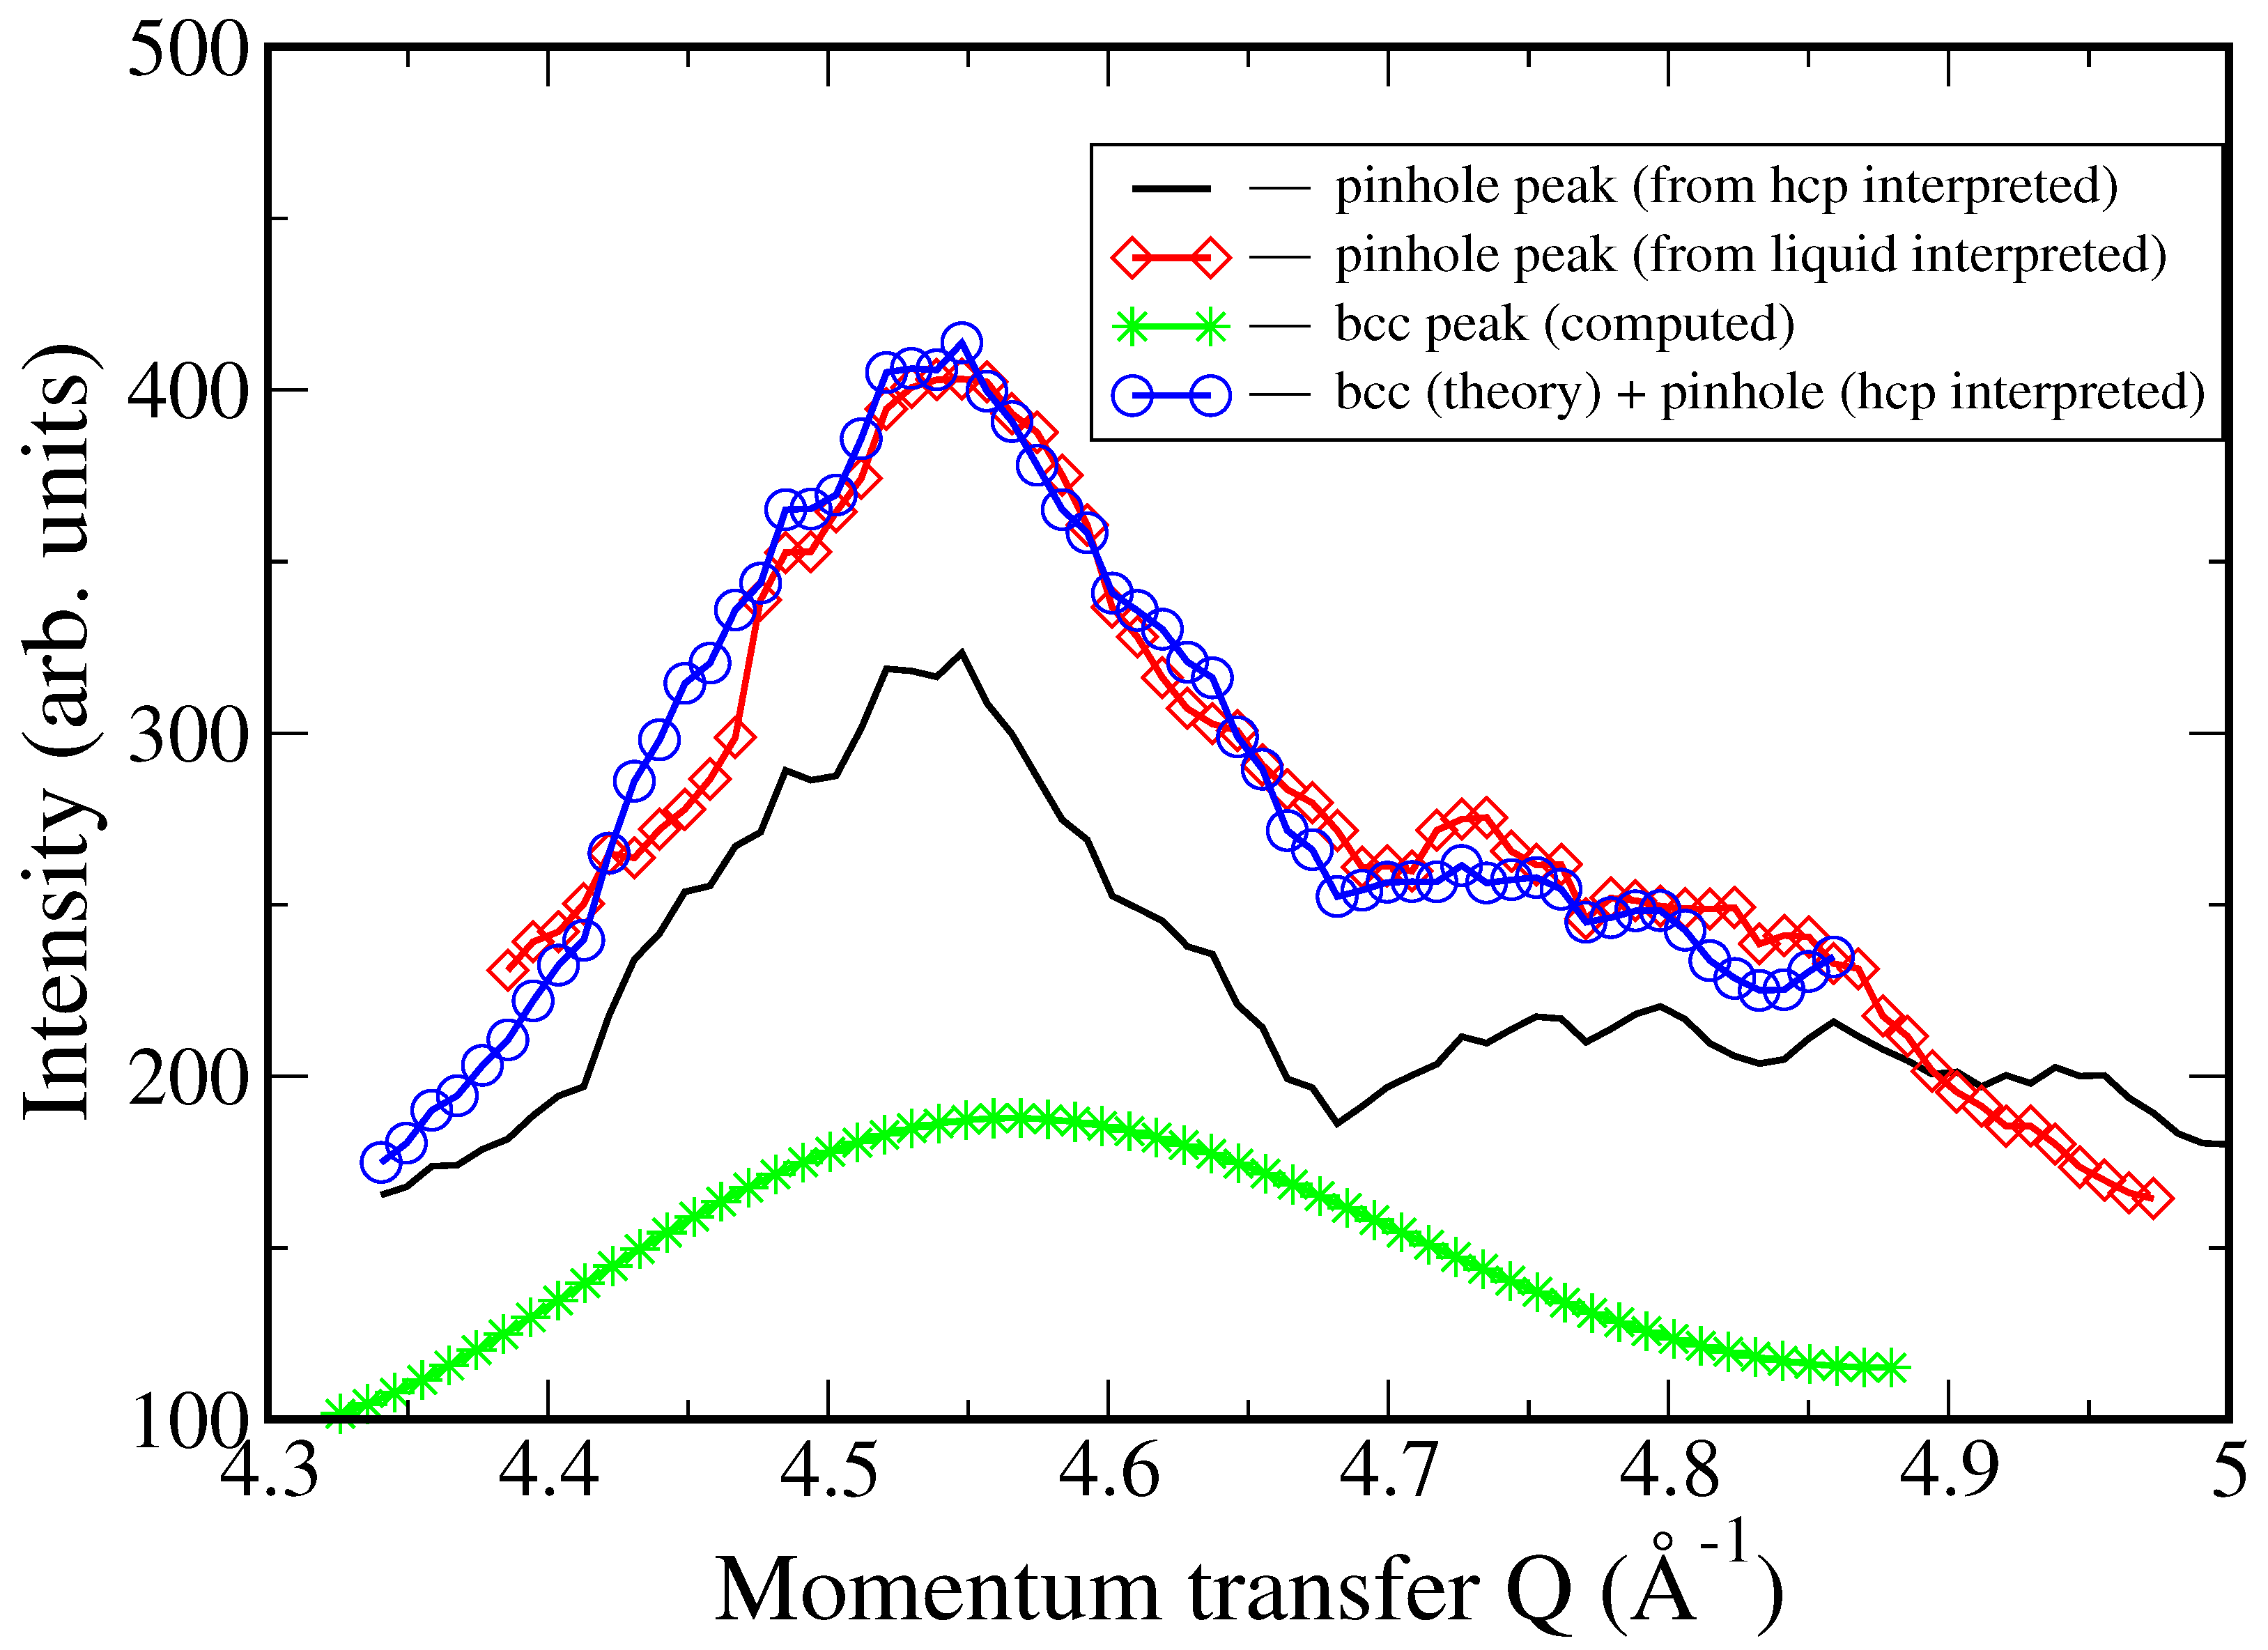
Now, we have three peaks in the range of Q as indicated in Figure 4 and Figure 5. One can observe immediately the intensities of the pinhole peaks reported in the measurements of the presumably liquid phase in Figure 4 and the presumably hcp phase in (Figure 5). Of course, the intensities are provided using arbitrary units, but it is expected that those are still the same units. The intensities might be affected by the somewhat different conditions; however, the authors reported that these conditions were very close in these two cases. Let us do the following. We plot the pinhole peaks in a separate figure (Figure 6). We also plot the computed bcc peak as boxed in Figure 4 in the same figure. Now, we add the intensity of the pinhole peak from the spectrum collected for hcp (undoubtedly pinholes are only involved there) to the computed bcc peak. We have to strip the bcc peak from the intensity of the background to not to account for it twice.
Now, what we see in Figure 6 is that the pinhole peak from the presumably liquid iron almost exactly overlaps with the superposition of the pinhole peak and theoretical bcc peak. The match is very good. Actually, it is surprisingly good providing the uncertainty of the experimental conditions, experimental errors, and imperfections of calculations. It is remarkable that the only correction to the computed spectrum we made was scaling to match the units of the computed spectrum to the units (provided in arbitrary units) of the experimental spectrum. We have to conclude that the spectrum in Figure 4 was collected from a sample where bcc is present. We cannot exclude, of course, that the spectrum was collected from a mixture of liquid (with only the main peak similar to that of the main bcc peak) and bcc phases. However, the presence of the bcc phase is demonstrated.

4. Discussion

We have demonstrated the 11-coordinated phase (in agreement with experiments [28]) and a phase that explains the intensity of the experimental spectrum [29]. In both cases, this is the bcc phase of iron. We have shown that there is no reason to reject the bcc phase a priori as was done by the authors of the experimental paper [28]. This allows us to suggest that the bcc phase is consistently observed in the most advanced experiments and consistently ignored. While there are both direct [30] and indirect [23,31,32,33,34,35,43] experimental confirmations of bcc stability, for the first time the spectroscopic footprint of the bcc phase is confirmed by experiments at the conditions of the Earth’s inner core and exoplanetary cores. We emphasize once again that we do not doubt the experimental data [28,29]. However, a detailed analysis on the basis of our unique large-scale AIMD simulations allows us to provide likely the most reliable ground for the interpretation of the experimental data. One might ask why the bcc phase was not observed in a number of diamond anvil cell (DAC) experiments (yet observed in some). First, the overwhelming majority of DAC experiments are performed at a P and T in the field of hcp stability—at least as predicted in a recent paper [11]. Those DAC experiments that do reach the predicted P–T conditions of bcc stability report a sudden onset of various changes. For example, one paper [43] reports melting at a P and T considerably below the Fe melting curve, another paper [23] reports the coexistence of both crystal and liquid X-ray signals, and yet another [24] reports the drastic onset of contamination when crossing the predicted [11] P–T boundary of bcc stability.
Since bcc is missing from the picture, the whole topology of the Fe phase diagram is interpreted differently, and the possible assignment of P–T conditions might be flawed. The sequence of spectra obtained in experiments [29], according to our interpretation, is bcc (or possibly a mixture of liquid and bcc), then a mixture of bcc and hcp, and finally pure hcp. This is in contrast with the interpretation in the experimental paper, where the sequence is liquid, then mixture of liquid and hcp, and finally pure hcp.
To perform our calculations of spectra, we used the largest cells of Fe ever simulated by AIMD (up to 2000 atoms). This makes the calculations highly reliable, although further increases in the cell size will likely improve the quality of calculations, especially in the range of small Q. Note, however, that the experimental spectra in the range of small Q demonstrate irregular behavior.
We note in passing that most of the AIMD studies of Fe bcc phase stability rely on AIMD simulations of insufficiently large cells (e.g., ref. [21]), despite unambiguous demonstrations that at least around 1000 atoms are needed in those kinds of studies [9]. Moreover, since the stability converges at much larger sizes, thermodynamic studies on the basis of exclusively first principles become problematic. All MD studies of bcc phase stability report extremely close free energies of bcc and hcp phases. Recently, it was demonstrated [44] that accounting for spin dynamics is critical for the correct calculation of the temperature of the fccbcc transition at P = 1 bar. Such an account might considerably affect the properties of the bcc phase at high P–T conditions of planetary cores, along with a comparably minor impact on the properties of hcp [45]. Accounting for the spin dynamics will likely ultimately affect the theoretical final judgment on the nature of the submelting phase of iron at extreme pressures. Of course, all phases at high-PT conditions become non-magnetic, and spin-nonpolarized calculations are fully legitimate, unlike a pressure of 1 bar where stress and magnetism are correlated [46]. The situation is reminiscent of the stabilization of the 1 bar bcc phase right before melting. According to G. Grimvall [47], the magnetic entropies of the bcc and liquid phases are about 5 J/mole/deg, while the magnetic entropy of fcc is about 1 J/mole/deg. Although it is unclear how these numbers change at much higher pressures and temperatures, the difference in magnetic entropies, that so far has been unaccounted for in practically all calculations of iron phase diagrams at extreme P and T, might potentially contribute to the stability of bcc Fe.

5. Conclusions

We demonstrated that bcc phase stabilization at pressures above 250 GPa and experimental (high) temperatures explains such experimental observations as the shape and intensity of the peak interpreted as pinhole peaks (Figure 6). bcc stabilization allows us to explain the observation of 11-coordinated iron under the same P–T conditions (Figure 2).
According to our interpretation, the phase with the bcc structure is the stable phase in the Earth’s core and the hot exoplanetary iron cores. The bcc phase is 11-coordinated, exactly as is the phase observed in experiments [28], with a density quite close to the density of the hcp phase. A phase with bcc peaks was observed in experiments at a pressure of ≈550 GPa and a temperature close to 9000 K. Although pinhole peaks overlap with the bcc peaks, the intensity of the so-called pinhole peaks quantitatively match the intensity of the overlapping bcc and pinhole peaks. This supports our free energy calculation results and the computed stability of the bcc phase. Since the emphasis so far has been on studies of the properties of the hcp phase, a focused effort on studies of bcc properties is urgently needed.

Author Contributions

A.B.B. designed the research. A.B.B. and G.S.S. contributed equally to calculations, analysis of results and paper writing. All authors have read and agreed to the published version of the manuscript.

Funding

This article was prepared within the framework of the HSE University Basic Research Program. A.B.B. is grateful to the Swedish Research Council (VR) and the Olle Engkvist Byggmästare Foundation for financial support. A.B.B. appreciates the financial support from Nanjing University.

Data Availability Statement

All data generated during calculations are available on request from the authors.

Acknowledgments

Computations were performed using the facilities at the Swedish National Infrastructure for Computing (SNIC) located at NSC in Linköping.

Conflicts of Interest

The authors declare no conflict of interest.

References

  1. Lehmann, I.P. Publications du Bureau Central séIsmologique Internationale. Série A: Travaux Scientifiques; International Council of Scientific Unions: Paris, France, 1936; Volume 14, pp. 87–115. [Google Scholar]
  2. Birch, F. Elasticity and constitution of the Earth’s interior. In Elastic Properties and Equations of State; American Geophysical Union: Washington, DC, USA, 1988; pp. 31–90. [Google Scholar]
  3. Al’tshuler, L.V.; Krupnikov, K.K.; Ledenev, B.N.; Zhuchikhin, V.I.; Brazhnik, M.I. Dynamic Compressibility and Equation of State of Iron under High Pressure. J. Exp. Theor. Phys. 1958, 7, 606–614. [Google Scholar]
  4. Dziewonski, A.M.; Anderson, D.L. Preliminary reference Earth model. Phys. Earth Planet. Inter. 1981, 25, 297–356. [Google Scholar] [CrossRef]
  5. Hemley, R.J.; Mao, H.K. In Situ Studies of Iron under Pressure: New Windows on the Earth’s Core. Int. Geol. Rev. 2001, 43, 1–30. [Google Scholar]
  6. Belonoshko, A.B.; Ahuja, R.; Johansson, B. Stability of the body-centred-cubic phase of iron in the Earth’s inner core. Nature 2003, 424, 1032–1034. [Google Scholar] [CrossRef]
  7. Belonoshko, A.B.; Skorodumova, N.V.; Davis, S.; Osiptsov, A.N.; Rosengren, A.; Johansson, B. Origin of the low rigidity of the Earth’s inner core. Science 2007, 316, 1603–1605. [Google Scholar] [CrossRef]
  8. Belonoshko, A.B.; Skorodumova, N.V.; Rosengren, A.; Johansson, B. Elastic anisotropy of Earth’s inner core. Science 2008, 319, 797–800. [Google Scholar] [CrossRef]
  9. Belonoshko, A.B.; Lukinov, T.; Fu, J.; Zhao, J.; Davis, S.; Simak, S.I. Stabilization of body-centred cubic iron under inner-core conditions. Nat. Geosci. 2017, 10, 312–316. [Google Scholar] [CrossRef]
  10. Belonoshko, A.B.; Fu, J.; Bryk, T.; Simak, S.I.; Mattesini, M. Low viscosity of the Earth’s inner core. Nat. Commun. 2019, 10, 2483. [Google Scholar] [CrossRef] [Green Version]
  11. Belonoshko, A.B.; Fu, J.; Smirnov, G. Free energies of iron phases at high pressure and temperature: Molecular dynamics study. Phys. Rev. B 2021, 104, 104103. [Google Scholar] [CrossRef]
  12. Belonoshko, A.B.; Simak, S.I.; Olovsson, W.; Vekilova, O.Y. Elastic properties of body-centered cubic iron in Earth’s inner core. Phys. Rev. B 2022, 105, L180102. [Google Scholar] [CrossRef]
  13. Mattesini, M.; Belonoshko, A.B.; Buforn, E.; Ramírez, M.; Simak, S.I.; Udías, A.; Mao, H.K.; Ahuja, R. Hemispherical anisotropic patterns of the Earth’s inner core. Proc. Natl. Acad. Sci. USA 2010, 107, 9507–9512. [Google Scholar] [CrossRef] [PubMed] [Green Version]
  14. Tkalcic, H. The Earth’s Inner Core; Cambridge University Press: Cambridge, UK, 2017. [Google Scholar]
  15. Stephenson, J.; Tkalčić, H.; Sambridge, M. Evidence for the innermost inner core: Robust parameter search for radially varying anisotropy using the neighborhood algorithm. J. Geophys. Res. Solid Earth 2021, 126, e2020JB020545. [Google Scholar] [CrossRef]
  16. Mattesini, M.; Belonoshko, A.B.; Tkalčić, H.; Buforn, E.; Udías, A.; Ahuja, R. Candy Wrapper for the Earth’s inner core. Sci. Rep. 2013, 3, 2096. [Google Scholar] [CrossRef] [PubMed] [Green Version]
  17. Modak, P.; Verma, A.K.; Rao, R.S.; Godwal, B.K.; Stixrude, L.; Jeanloz, R. Stability of the hcp phase and temperature variation of the axial ratio of iron near Earth-core conditions. J. Phys. Condens. Matter 2007, 19, 016208. [Google Scholar] [CrossRef]
  18. Stixrude, L. Structure of iron to 1 gbar and 40,000 K. Phys. Rev. Lett. 2012, 108, 055505. [Google Scholar] [CrossRef] [PubMed]
  19. Godwal, B.K.; González-Cataldo, F.; Verma, A.K.; Stixrude, L.; Jeanloz, R. Stability of iron crystal structures at 0.3–1.5 TPa. Earth Planet. Sci. Lett. 2015, 409, 299–306. [Google Scholar] [CrossRef] [Green Version]
  20. Vocadlo, L.; Alfè, D.; Gillan, M.J.; Wood, I.G.; Brodholt, J.P.; Price, G.D. Possible thermal and chemical stabilization of body-centred-cubic iron in the Earth’s core. Nature 2003, 424, 536–539. [Google Scholar] [CrossRef]
  21. Sun, Y.; Mendelev, M.I.; Zhang, F.; Liu, X.; Da, B.; Wang, C.Z.; Wentzcovitch, R.M.; Ho, K.M. Ab initio melting temperatures of bcc and hcp iron under the earth’s inner core condition. Geophys. Res. Lett. 2023, 50, e2022GL102447. [Google Scholar] [CrossRef]
  22. Nguyen, J.H.; Holmes, N.C. Melting of iron at the physical conditions of the Earth’s core. Nature 2004, 427, 339–342. [Google Scholar] [CrossRef]
  23. Anzellini, S.; Errandonea, D.; Burakovsky, L.; Proctor, J.E.; Turnbull, R.; Beavers, C.M. Characterization of the high-pressure and high-temperature phase diagram and equation of state of chromium. Sci. Rep. 2022, 12, 6727. [Google Scholar] [CrossRef]
  24. Tateno, S.; Hirose, K.; Ohishi, Y.; Tatsumi, Y. The structure of iron in Earth’s inner core. Science 2010, 330, 359–361. [Google Scholar] [CrossRef] [PubMed]
  25. Turneaure, S.J.; Sharma, S.M.; Gupta, Y.M. Crystal structure and melting of Fe shock compressed to 273 GPa: In situ X-ray diffraction. Phys. Rev. Lett. 2020, 125, 215702. [Google Scholar] [CrossRef] [PubMed]
  26. Merkel, S.; Hok, S.; Bolme, C.; Rittman, D.; Ramos, K.J.; Morrow, B.; Lee, H.J.; Nagler, B.; Galtier, E.; Granados, E.; et al. Femtosecond visualization of hcp-iron strength and plasticity under shock compression. Phys. Rev. Lett. 2021, 127, 205501. [Google Scholar] [CrossRef] [PubMed]
  27. Sakai, T.; Ohtani, E.; Hirao, N.; Ohishi, Y. Stability field of the hcp-structure for Fe, Fe-Ni, and Fe-Ni-Si alloys up to 3 Mbar. Geophys. Res. Lett. 2011, 38, L09302. [Google Scholar] [CrossRef]
  28. Ping, Y.; Coppari, F.; Hicks, D.G.; Yaakobi, B.; Fratanduono, D.E.; Hamel, S.; Eggert, J.H.; Rygg, J.R.; Smith, R.F.; Swift, D.C.; et al. Solid iron compressed up to 560 GPa. Phys. Rev. Lett. 2013, 111, 065501. [Google Scholar] [CrossRef] [Green Version]
  29. Kraus, R.G.; Hemley, R.J.; Ali, S.J.; Belof, J.L.; Benedict, L.X.; Bernier, J.; Braun, D.; Cohen, R.E.; Collins, G.W.; Coppari, F.; et al. Measuring the melting curve of iron at super-Earth core conditions. Science 2022, 375, 202–205. [Google Scholar] [CrossRef]
  30. Hrubiak, R.; Meng, Y.; Shen, G. Experimental evidence of a body centered cubic iron at the Earth’s core condition. arXiv 2018, arXiv:1804.05109. [Google Scholar]
  31. Brown, J.M.; McQueen, R.G. Phase transitions, Grüneisen parameter, and elasticity for shocked iron between 77 GPa and 400 GPa. J. Geophys. Res. 1986, 91, 7485–7494. [Google Scholar] [CrossRef]
  32. Brown, M.J. The equation of state of iron to 450 GPa: Another high pressure solid phase? Geophys. Res. Lett. 2001, 28, 4339–4342. [Google Scholar] [CrossRef]
  33. Dubrovinsky, L.; Dubrovinskaia, N.; Narygina, O.; Kantor, I.; Kuznetzov, A.; Prakapenka, V.B.; Vitos, L.; Johansson, B.; Mikhaylushkin, A.S.; Simak, S.I.; et al. Body-centered cubic iron-nickel alloy in Earth’s core. Science 2007, 316, 1880–1883. [Google Scholar] [CrossRef]
  34. Mikhaylushkin, A.S.; Simak, S.I.; Dubrovinsky, L.; Dubrovinskaia, N.; Johansson, B.; Abrikosov, I.A. Pure iron compressed and heated to extreme conditions. Phys. Rev. Lett. 2007, 99, 165505. [Google Scholar] [CrossRef] [PubMed]
  35. Belonoshko, A.B.; Derlet, P.M.; Mikhaylushkin, A.S.; Simak, S.I.; Hellman, O.; Burakovsky, L.; Swift, D.C.; Johansson, B. Quenching of bcc-Fe from high to room temperature at high-pressure conditions: A molecular dynamics simulation. New J. Phys. 2009, 11, 093039. [Google Scholar] [CrossRef]
  36. Perdew, J.P.; Chevary, J.A.; Vosko, S.H.; Jackson, K.A.; Pederson, M.R.; Singh, D.J.; Fiolhais, C. Atoms, molecules, solids, and surfaces: Applications of the generalized gradient approximation for exchange and correlation. Phys. Rev. B 1992, 46, 6671–6687. [Google Scholar] [CrossRef]
  37. Blöchl, P.E. Projector augmented-wave method. Phys. Rev. B 1994, 50, 17953–17979. [Google Scholar] [CrossRef] [Green Version]
  38. Kresse, G.; Joubert, D. From ultrasoft pseudopotentials to the projector augmented-wave method. Phys. Rev. B 1999, 59, 1758–1775. [Google Scholar] [CrossRef]
  39. Kresse, G.; Furthmüller, J. Efficient iterative schemes for ab initio total-energy calculations using a plane-wave basis set. Phys. Rev. B 1996, 54, 11169–11186. [Google Scholar] [CrossRef] [PubMed]
  40. Mermin, N.D. Thermal properties of the inhomogeneous electron gas. Phys. Rev. 1965, 137, A1441–A1443. [Google Scholar] [CrossRef]
  41. Brehm, M.; Kirchner, B. TRAVIS—A free analyzer and visualizer for Monte Carlo and molecular dynamics trajectories. J. Chem. Inf. Model. 2011, 51, 2007–2023. [Google Scholar] [CrossRef] [Green Version]
  42. Brehm, M.; Thomas, M.; Gehrke, S.; Kirchner, B. TRAVIS-A free analyzer for trajectories from molecular simulation. J. Chem. Phys. 2020, 152, 164105. [Google Scholar] [CrossRef] [Green Version]
  43. Boehler, R. Temperatures in the Earth’s core from melting-point measurements of iron at high static pressures. Nature 1993, 363, 534–536. [Google Scholar] [CrossRef]
  44. Gambino, D.; Klarbring, J.; Alling, B. Phase stability of Fe from first principles: Atomistic spin dynamics coupled with ab initio molecular dynamics simulations and thermodynamic integration. Phys. Rev. B 2023, 107, 014102. [Google Scholar] [CrossRef]
  45. Ruban, A.V.; Belonoshko, A.B.; Skorodumova, N.V. Impact of magnetism on Fe under Earth’s core conditions. Phys. Rev. B 2013, 87, 014405. [Google Scholar] [CrossRef]
  46. Qiu, G.; Cai, Y.; Li, Z. Multiscale investigation of magnetic field distortion on surface of ferromagnetic materials caused by stress concentration for metal magnetic memory method. Comput. Mater. Sci. 2022, 209, 111353. [Google Scholar] [CrossRef]
  47. Grimvall, G. Polymorphism of Metals. III. Theory of the Temperature-Pressure Phase Diagram of Iron. Phys. Scr. 1976, 13, 59–64. [Google Scholar] [CrossRef]
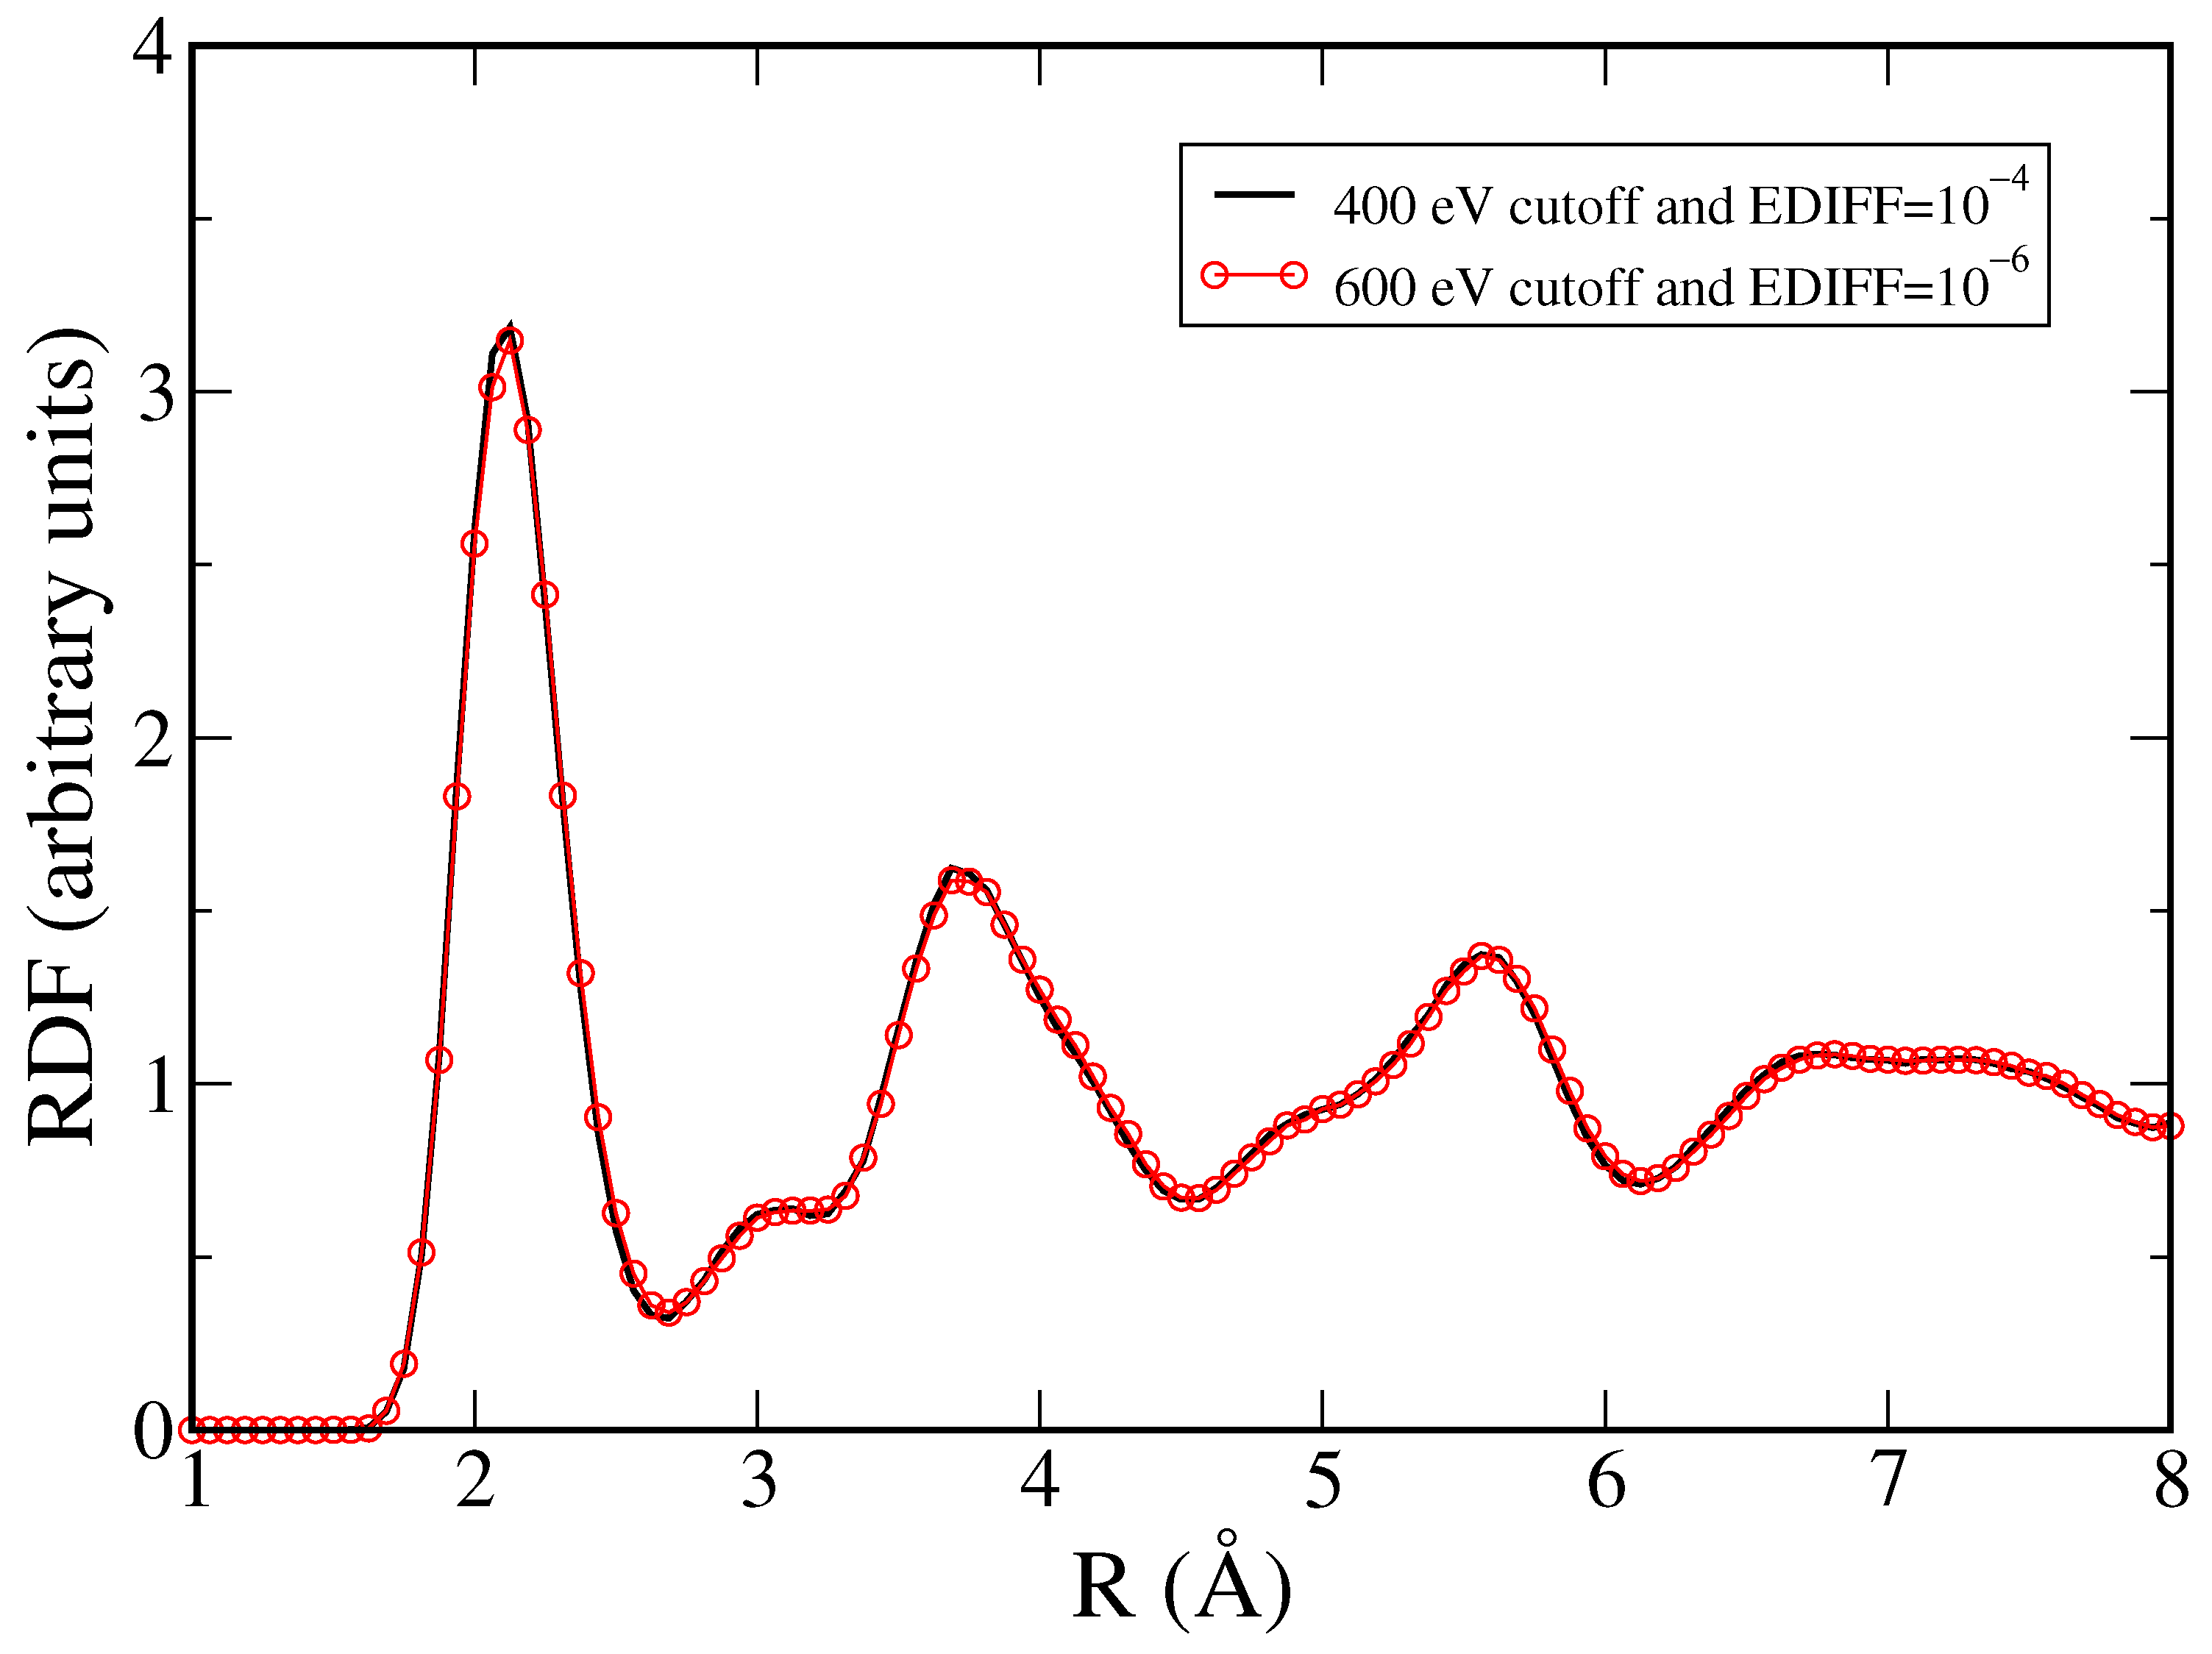
Figure 1. Radial distribution functions of hcp iron computed using two sets of parameters as indicated in the legend. The simulations were performed for 1024 atoms using the NPT ensemble (N—number of particles, P = 360 GPa and T = 7000 K). The resulting RDFs are identical, proving the convergence of our computed RDFs.
Metals 13 01096 g001
Figure 2. Distribution of first eight atoms (first peak) and second six atoms (second peak) as a function of distance. Half of the second peak, that is three atoms, enters the sphere containing eight atoms and in total it leads to the coordination number of eleven, as reported by Ping et al. [28] in their experimental paper [28].
Metals 13 01096 g002
Figure 3. Radial distribution functions of bcc and hcp iron at P = 360 GPa and T = 6600 K. Simulations performed by AIMD in an NPT ensemble. The size of the system is 1024 for hcp and 2000 for bcc. The densities of the bcc and hcp are 13.49 g/cm 3 and 13.54 g/cm 3 , respectively. The RDFs are very similar at short distances, resulting in the similarity of the EXAFS signal. The RDFs are clearly different at larger distances because of the very different structures.
Metals 13 01096 g003
Figure 4. The experimental spectrum of iron interpreted by Kraus et al. [29] as belonging to liquid compared to the spectrum calculated for the bcc and liquid (presumably at the same P–T conditions, that is ≈550 GPa and 9000 K). Three experimental peaks match the peaks of the calculated bcc spectrum. One experimental peak matches the peak of the spectrum calculated for liquid.
Metals 13 01096 g004
Figure 5. The experimental spectrum of iron interpreted by Kraus et al. [29] as belonging to hcp (presumably at P ≈ 550 GPa) compared to the spectrum calculated for hcp (at P = 680 GPa and T = 6600 K) in the stability field of hcp [11].
Metals 13 01096 g005
Figure 6. Four peaks of iron spectra around Q≈ 4.55 Å 1 . Two of them are the peaks assigned by Kraus et al. [29] as pinholes. The third one is the calculated peak of bcc iron. The fourth one is the sum of the bcc peak and the peak assigned to a pinhole in the hcp spectrum (Figure 5). The sum of the pinhole and bcc peaks is identical to the peak interpreted as the pinhole peak in the spectrum interpreted as liquid by Kraus et al. [29]. This suggests that the original interpretation might be erroneous and the spectrum in Figure 4 belongs to bcc iron.
Metals 13 01096 g006
Disclaimer/Publisher’s Note: The statements, opinions and data contained in all publications are solely those of the individual author(s) and contributor(s) and not of MDPI and/or the editor(s). MDPI and/or the editor(s) disclaim responsibility for any injury to people or property resulting from any ideas, methods, instructions or products referred to in the content.