Article

Effect of Heat Treatment on Microstructural Evolution in Additively Manufactured 316L Stainless Steel

School of Materials Science and Engineering, Tsinghua University, Beijing 100084, China
*
Authors to whom correspondence should be addressed.
Metals 2023, 13(6), 1062; https://doi.org/10.3390/met13061062
Submission received: 28 April 2023 / Revised: 25 May 2023 / Accepted: 28 May 2023 / Published: 1 June 2023
(This article belongs to the Special Issue EBSD of Additively Manufactured Metals)

Abstract

:
316L stainless steel samples were prepared by selective laser melting (SLM) and annealed at 1000 °C for durations of between 1 and 6 h to investigate both the kinetics of microstructural evolution during heat treatment and the effect of annealing on mechanical properties. The as-printed materials contain a high density of oxide particles and dislocations, forming a dislocation cell substructure that shows high thermal stability during heat treatment. Moreover, coarsened oxide particles act as pinning barriers for moving dislocations and grain boundaries, thus extending the recovery and recrystallization process. The process of recrystallization can be effectively tracked by measuring the density of the low-angle misorientation boundaries associated with the oxide particles and dislocations, as characterized by high-resolution EBSD. The evolution of mechanical properties during annealing shows a strong relationship with the observed microstructural changes, suggesting possible optimization of strength and ductility of SLM-prepared metal samples by use of appropriate heat treatments.

1. Introduction

The selective laser melting (SLM) technique is one form of laser powder bed fusion (LPBF) technique, where near-net-shape metal parts with near-full density can be directly prepared by fully melting metal powders using a laser beam, followed by solidification of the melt pools in a layer-by-layer manner [1,2,3,4]. The SLM technique is characterized by higher temperature gradients (104–107 K/m), higher cooling rates (105–108 K/s), and smaller molten pool sizes (about 100 μm) compared to conventional methods, such as casting or welding, due to the use of a high-energy-density focused laser beam to melt the metal powders [1,5]. These special conditions result in a complicated solidification behavior in the SLM process that takes place under non-equilibrium conditions. As a result, the solidification structure in metals prepared by SLM is complex, exhibiting features over a range of length scales, including melt pools, a microscale grain structure, dislocations, solidification dendrites, and nanoscale precipitates. Among these features, the nanoscale precipitates and dislocation cells associated with SLM in several alloying systems, including 316L stainless steel, are particularly unique [1,6,7,8,9].
The existence of oxide particles in SLMed 316L SS has frequently been observed by many researchers, though only a few studies have investigated the formation mechanism, with the most popular opinion being that the oxygen contained in the powder will remain in the matrix, where it can react with high-oxygen-affinity elements in steel to form inclusions [10,11]. Some other studies have suggested that oxygen in the chamber will also promote the formation of oxide particles [12,13]. Despite their unclarified formation mechanism, oxide particles have been found to be important in the formation of dislocation cell structures through their ability to pin mobile dislocations [7,13]. These microstructural features also play an important role in the improvement of mechanical properties and thermal stability of SLMed 316L SS.
The microstructural evolution during annealing is expected to be different to that of metals prepared by conventional methods, due to the microstructural heterogeneity. One notable characteristic of SLM-prepared 316L stainless steel is the enhanced thermal stability of the as-printed microstructure [14,15,16,17]. Previous studies have shown, for example, that SLM-prepared 316L stainless steel exhibits excellent stability during thermal annealing with regard to both the dislocation cell structures and oxide particles, due to pinning effects [18,19,20,21]. Moreover, the heat treatment conditions required to achieve full recrystallization of SLM-prepared 316L stainless steel are reported to be more demanding compared to conventionally processed counterparts. Specifically, a higher temperature is required to initiate recrystallization, and the kinetics of recrystallization are more sluggish [22,23,24,25]. For example, recrystallization takes place at 700 °C after 1 h annealing in 95% cold-rolled 316L stainless steel [26], and at about 800 °C after 1 h in 90% cold-rolled 316L stainless steel [27]. In contrast, in additively manufactured 316L stainless steel, recrystallization only takes place at temperatures of 1000 °C or higher after similar annealing durations [19,20,21,22,25]. These observations suggest a continued interaction between the oxide particles and dislocations that is expected to contribute to the mechanical properties in the heat-treated samples. Several previous studies have suggested that the maintenance of a high yield strength of additively manufactured metals after heat treatment could be attributed to the existence of oxide particles in the annealed samples [13,18]. It is of interest, therefore, to study the kinetics of microstructural evolution during annealing to optimize the mechanical properties of SLM metals during heat treatment. One aspect that is still only poorly characterized is the evolution of the oxide particles and dislocation cell structures during heat treatment over different durations, together with the effect of such microstructural evolution on the kinetics of recovery and recrystallization. In this work, therefore, we investigate the microstructural evolution and mechanical properties of 316L stainless steel samples via the investigation of samples annealed at 1000 °C for 1, 2, 3, and 6 h, and analyze the influence of the microstructural thermal stability both on recovery and recrystallization, and on mechanical properties.

2. Materials and Methods

Samples were prepared using a SLM 280 printing machine (SLM Solutions, Lübeck, Germany). The 316L stainless steel powder was purchased from Sichuan Skytech Additive Co., Ltd., Chengdu, China, and was produced by gas atomization with 90% of powder particles within the size range of 10–45 μm. The oxygen content in the powder was measured to be about 250 ppm. Prior to printing, the powder was dried in a vacuum at 80 °C for 6 h to remove moisture from the powder. The printing parameters were selected as a laser power of 180 W, a laser scanning speed of 600 mm·s−1, a powder layer thickness of 30 μm, and a rotation angle between layers of 67°. The printing process was carried out under an argon atmosphere, with oxygen content in the chamber measured as 1500 ppm. Using these printing conditions, the density of the printed samples was >99.9%, as measured using the Archimedes method. A bulk sample of 25 × 10 × 20 mm3 in size was printed, from which dog-bone-shape tensile samples for tensile experiments, and square plate samples for EBSD and TEM characterization of microstructures in the as-printed state and heat-treated state, were cut by electron discharge machining (see schematic in Figure 1). Note that, in this work, we investigate the mechanical properties of the samples with the tensile loading axis perpendicular to the build direction (BD). Samples for heat treatment were sealed in vacuum tubes to limit oxidation, and placed in a furnace with the temperature already stabilized at 1000 °C. All samples were quenched in water to room temperature in the sealed vacuum tubes after annealing.
The microstructure of both as-printed and annealed samples was investigated using secondary electron imaging (SEM) and electron back-scatter diffraction (EBSD) microscopy using a TESCAN MIRA 3 LMH scanning electron microscope, equipped with a CMOS-based EBSD detector from Oxford Instruments, and operated at 20 kV. Samples for SEM and EBSD characterization were first ground to 2000 grit SiC paper, then electrochemically polished in a solution of 10% perchloric acid and 90% alcohol to achieve a flat polished surface free of mechanical damage and residual deformation. All SEM images were captured at a size of 69.2 × 69.2 μm2 at a resolution of 4096 × 4096 pixels. The EBSD maps were captured over an area of 1.05 × 1.05 mm2 using a step size of 0.15 μm. Analysis of the EBSD data was conducted using the Channel 5 software and the MTEX toolbox [28,29]. Detailed investigations of the dislocation cells and oxide particles were carried out via a transmission electron microscope using a FEI Tecnai G2 F20 TEM equipped with a Bruker XFlash 5030 EDS detector. Samples for TEM characterization were first ground to 2000 grit SiC paper to reduce the sample thickness to 60 μm, after which, the samples were thinned to electron transparency using a twin-jet polisher with an electrolyte consisting of 10% perchloric acid and 90% alcohol. The average size and number density of oxide particles were evaluated using the ImageJ image analysis software.
Tensile tests were carried out using an AG-X tensile machine under displacement control at a displacement rate of 0.5 mm/min (initial strain rate of about 1.6 × 10⁻³ s−1) and continued until failure. The as cut dog-bone-shape samples for tensile testing were first ground to 2000-grit SiC paper, with the sample thickness in the gauge region reduced to about 0.8 mm. A non-contact optical strain measurement method was used to measure strain and obtain engineering stress–strain curves. Three tests for each sample condition were carried out, with average values calculated for further analysis.

3. Results and Discussion

3.1. Evolution of Microstructures during Heat Treatment

Figure 2 shows the microstructure, as seen under SEM observation, of samples in the as-printed state (as viewed parallel and perpendicular to the BD) and after different annealing times (as viewed along the BD). A substructure corresponding to dislocation cells with a 3D prismatic morphology [30,31] is present in the as-printed sample (see the magnified view in Figure 2a), appearing either as an equiaxed or a striped structure in different locations, depending on the inclination of the prismatic structure to the sectioning (observation) plane. The size of the cellular substructure, as defined by the equiaxed cell diameter, is typically in the range of 600–800 nm. A large number of precipitate particles are also present in the as-printed sample, and are mainly located at the boundaries forming the prismatic cellular substructure. The oxygen content in the as-printed samples was measured by infrared absorption method as 0.05%.
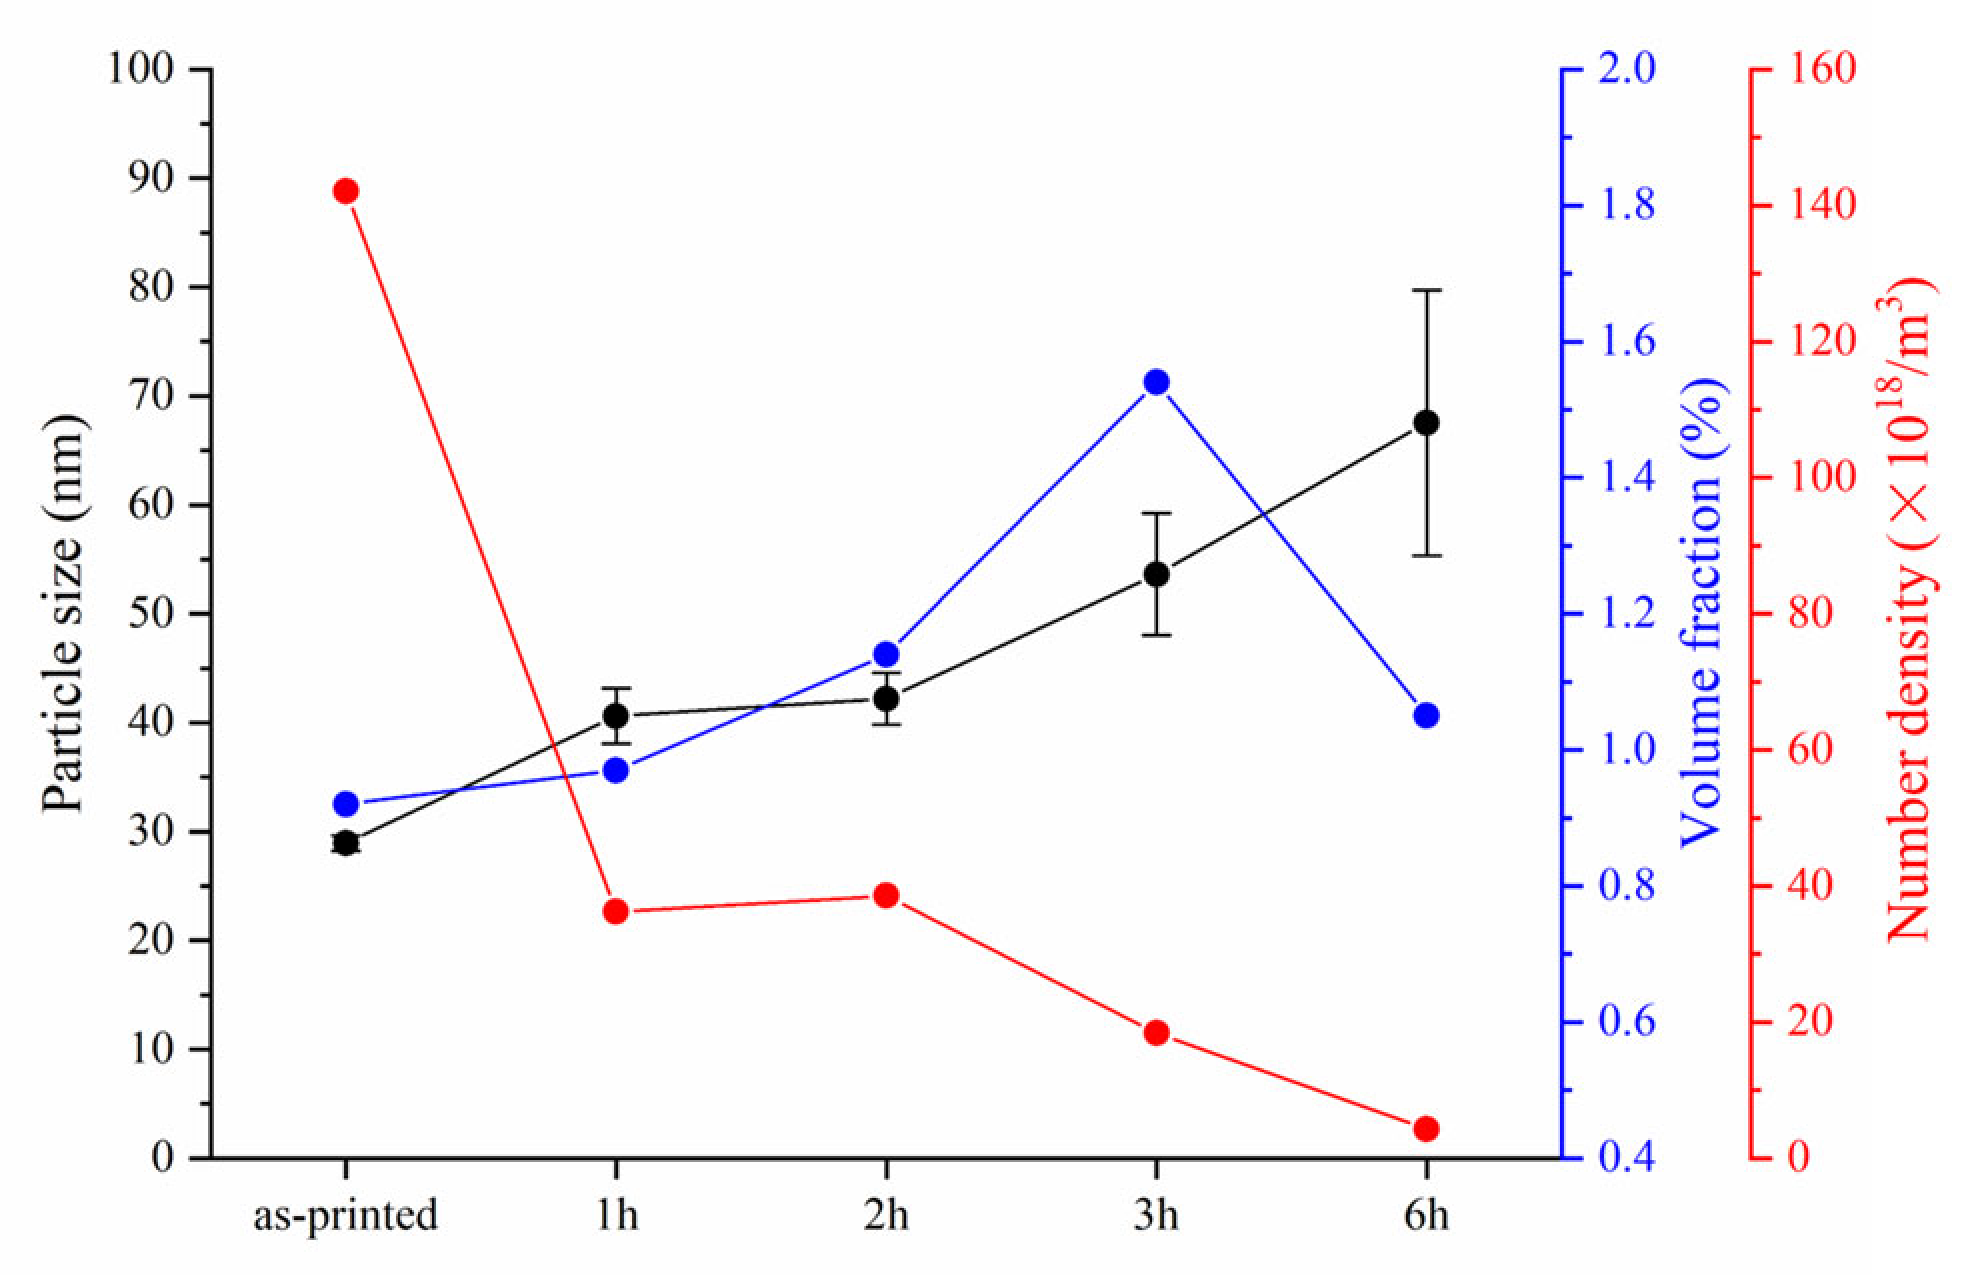
With increasing heat treatment time, the cellular substructure in non-recrystallized regions becomes less and less visible under SEM observation, and the number density of precipitate particles decreases. After 6 h, when the sample is almost fully recrystallized, the particles are predominantly distributed on the recrystallized grain boundaries. The average size of the precipitate particles, as determined from SEM observation, increases from about 28 nm in the as-printed state to 66 nm after annealing at 1000 °C for 6 h, with the volume fraction of particles increasing until the annealing time reaches 3 h, as shown in Figure 3, followed by a small decrease.
The reason for the complex morphology of the substructure in SLM-prepared 316L stainless steel is mainly related to the instability of the solidification interface, as a result of the rapid solidification that takes place during the SLM process [1,2]. According to solidification theory, with increasing solidification rate, a solidification interface goes through a series of transitions in the sequence “flat plane growth–cellular growth–dendritic growth–cellular growth–flat plane growth” [32,33,34]. The solidification conditions in the SLM melt pool are close to those of “dendritic growth–cellular growth” solidification behavior, hence the occurrence of these solidification substructures. The growth direction of the solidification substructure is regulated by the temperature gradient, and is, in general, perpendicular to the tangential direction of the neighboring melt pool interface, and is predominantly in line with the local temperature gradient.
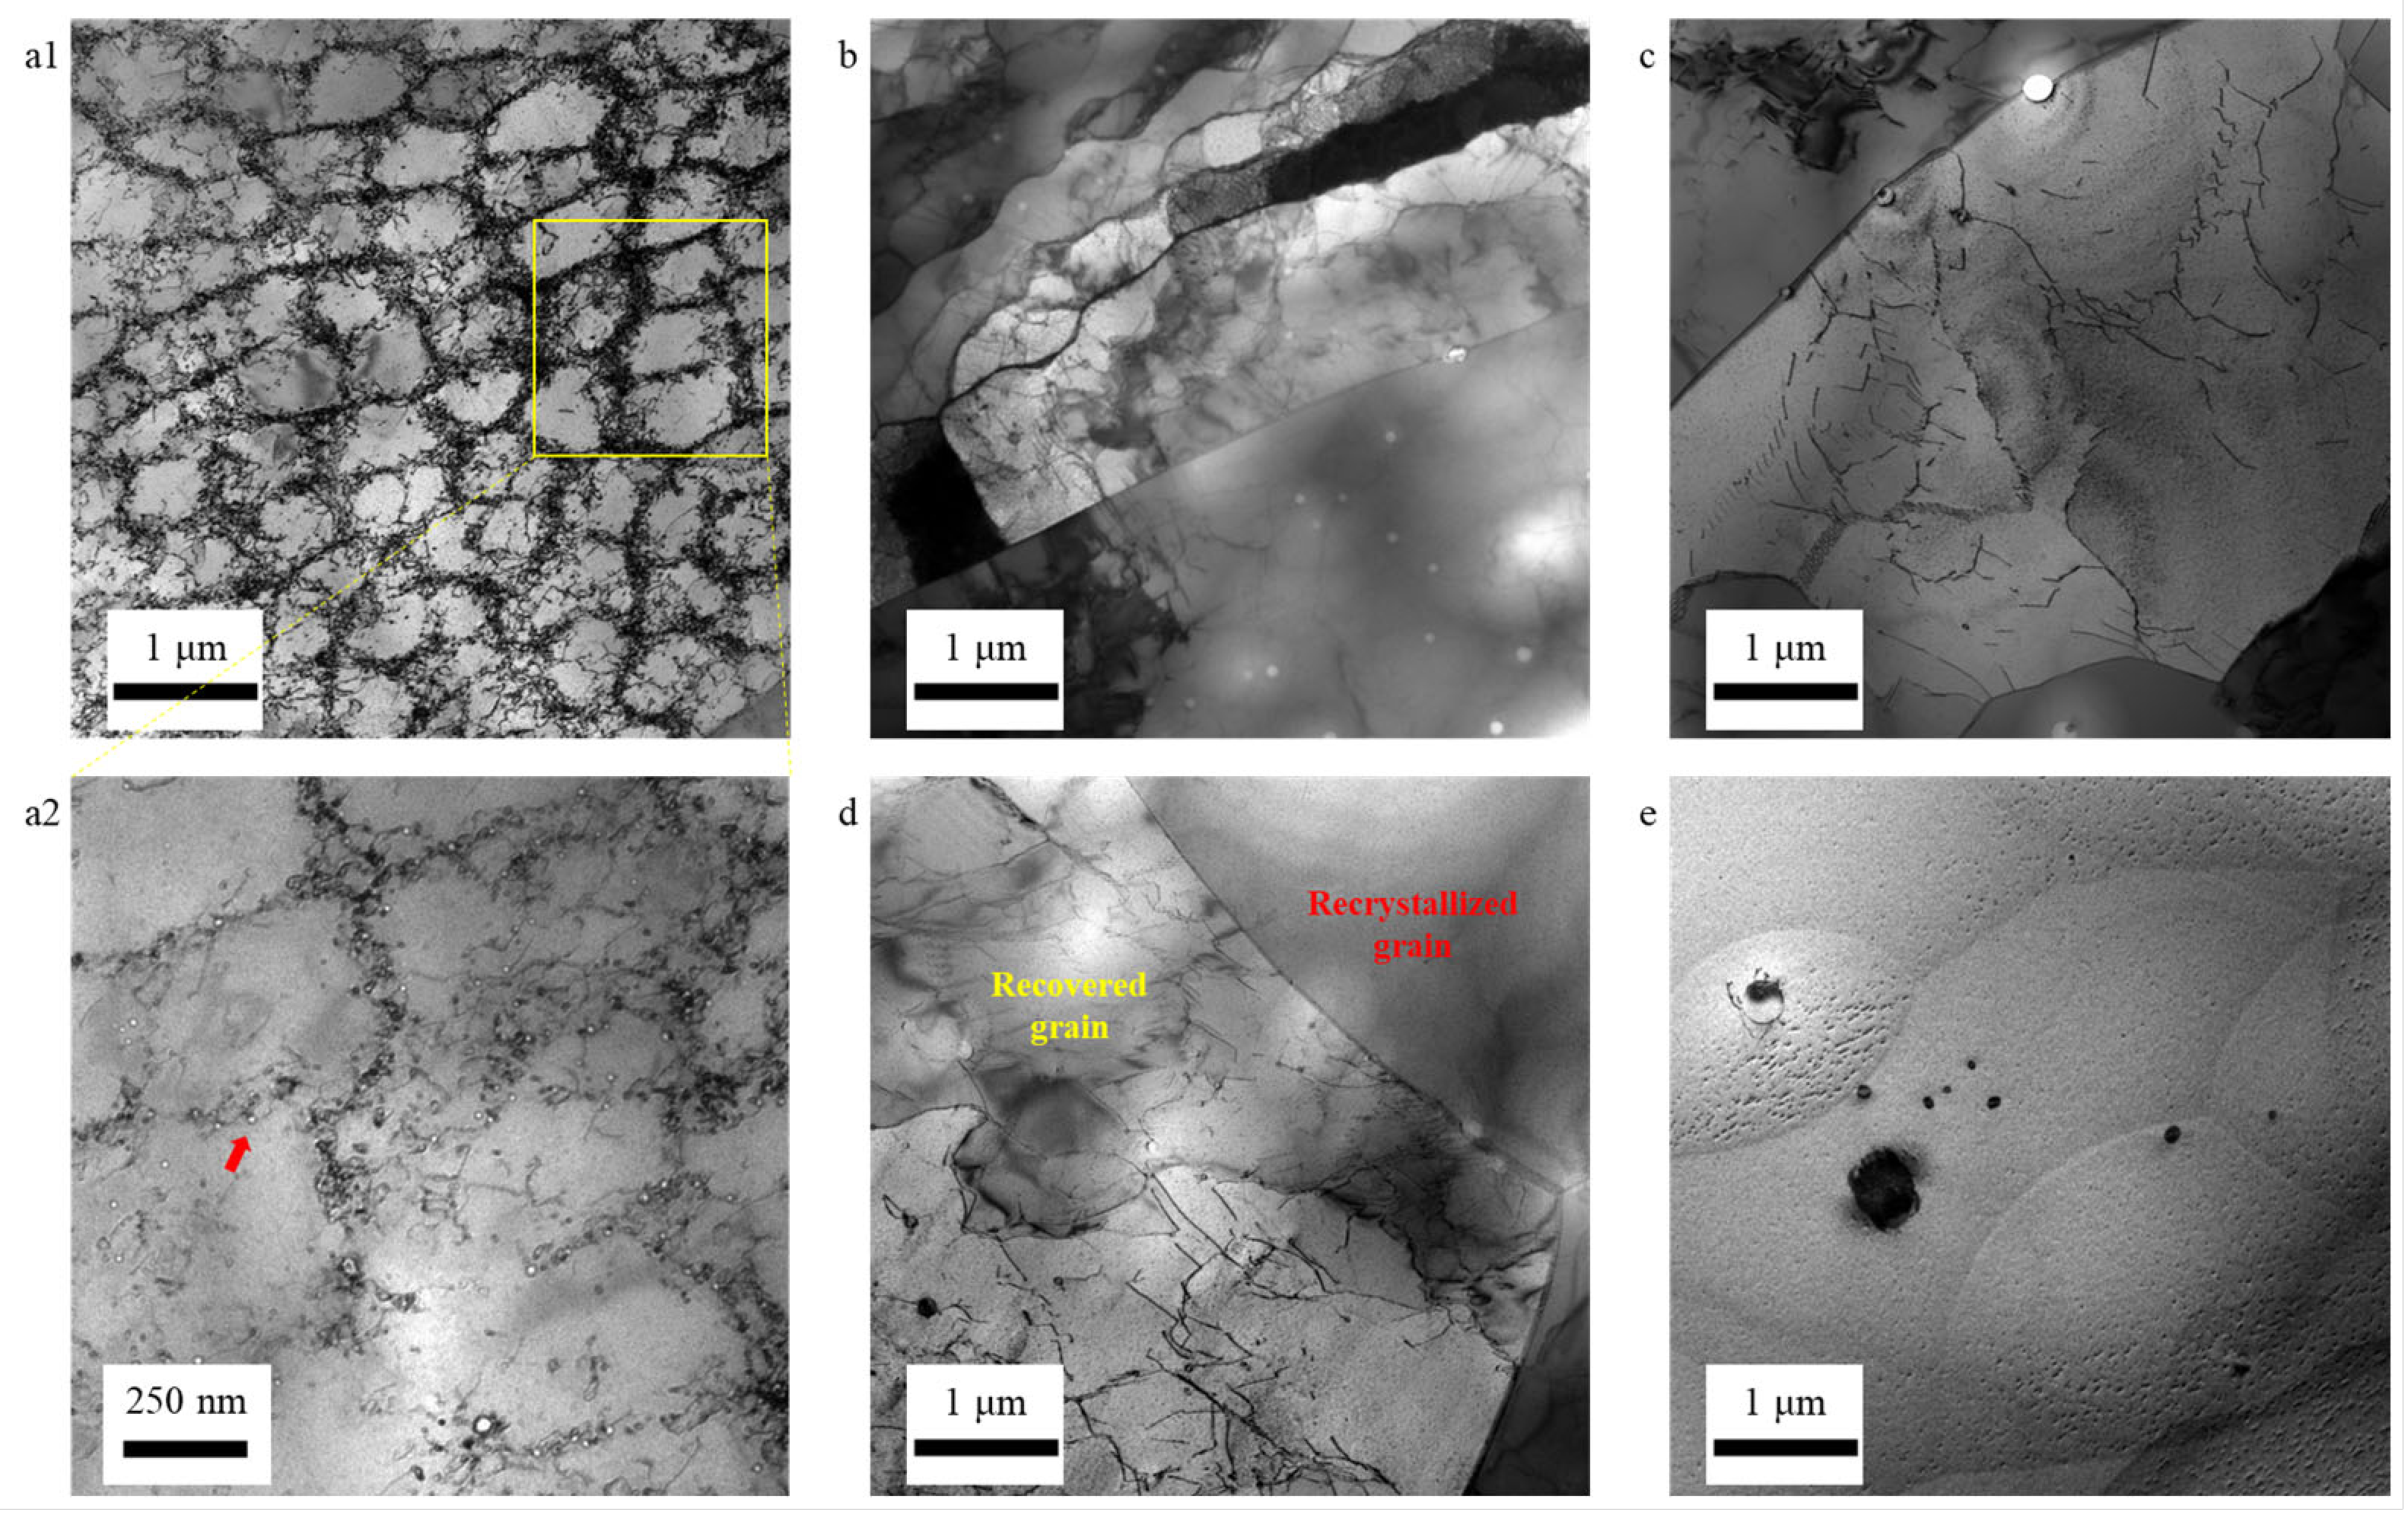
Detailed TEM characterization of the as-printed sample (Figure 4a) reveals the presence of a large number of dislocation cells, similar in size and shape to the cellular substructure observed under SEM observation (Figure 3a). Higher magnification observation reveals the dislocation cell walls to consist of a high density of entangled dislocations. The nanoscale particles are predominantly located at the cell walls, and can only be easily observed under a defocus imaging condition, due to the high density of dislocations forming the cell walls.
After 1 h of annealing, dislocation cells similar to those in the printed sample are still observed in some areas, with almost no change in size but with a significant decrease in the cell wall thickness, where the cell walls no longer consist of a high density of entangled dislocations. In other places, however, dislocation cells are no longer visible, or are only weakly visible, indicating extensive recovery has taken place. The oxide particles both coarsen and decrease in number density substantially after 1 h annealing, consistent with the results observed through SEM observations (Figure 4b). After 2 h annealing, the dislocation density in non-recrystallized volumes is further reduced, with weakly defined dislocation cell arrangements observed, and in some places, dislocation arrays forming low-angle boundaries are clearly visible (Figure 4c). Similar features are observed in non-recrystallized volumes after 3 h annealing, with the obvious presence of recrystallized grains also observed in the examined TEM thin-foil samples (Figure 4d). After 6 h annealing, most of the sample is fully recrystallized, and TEM observation reveals only a typical low dislocation density (Figure 4e).
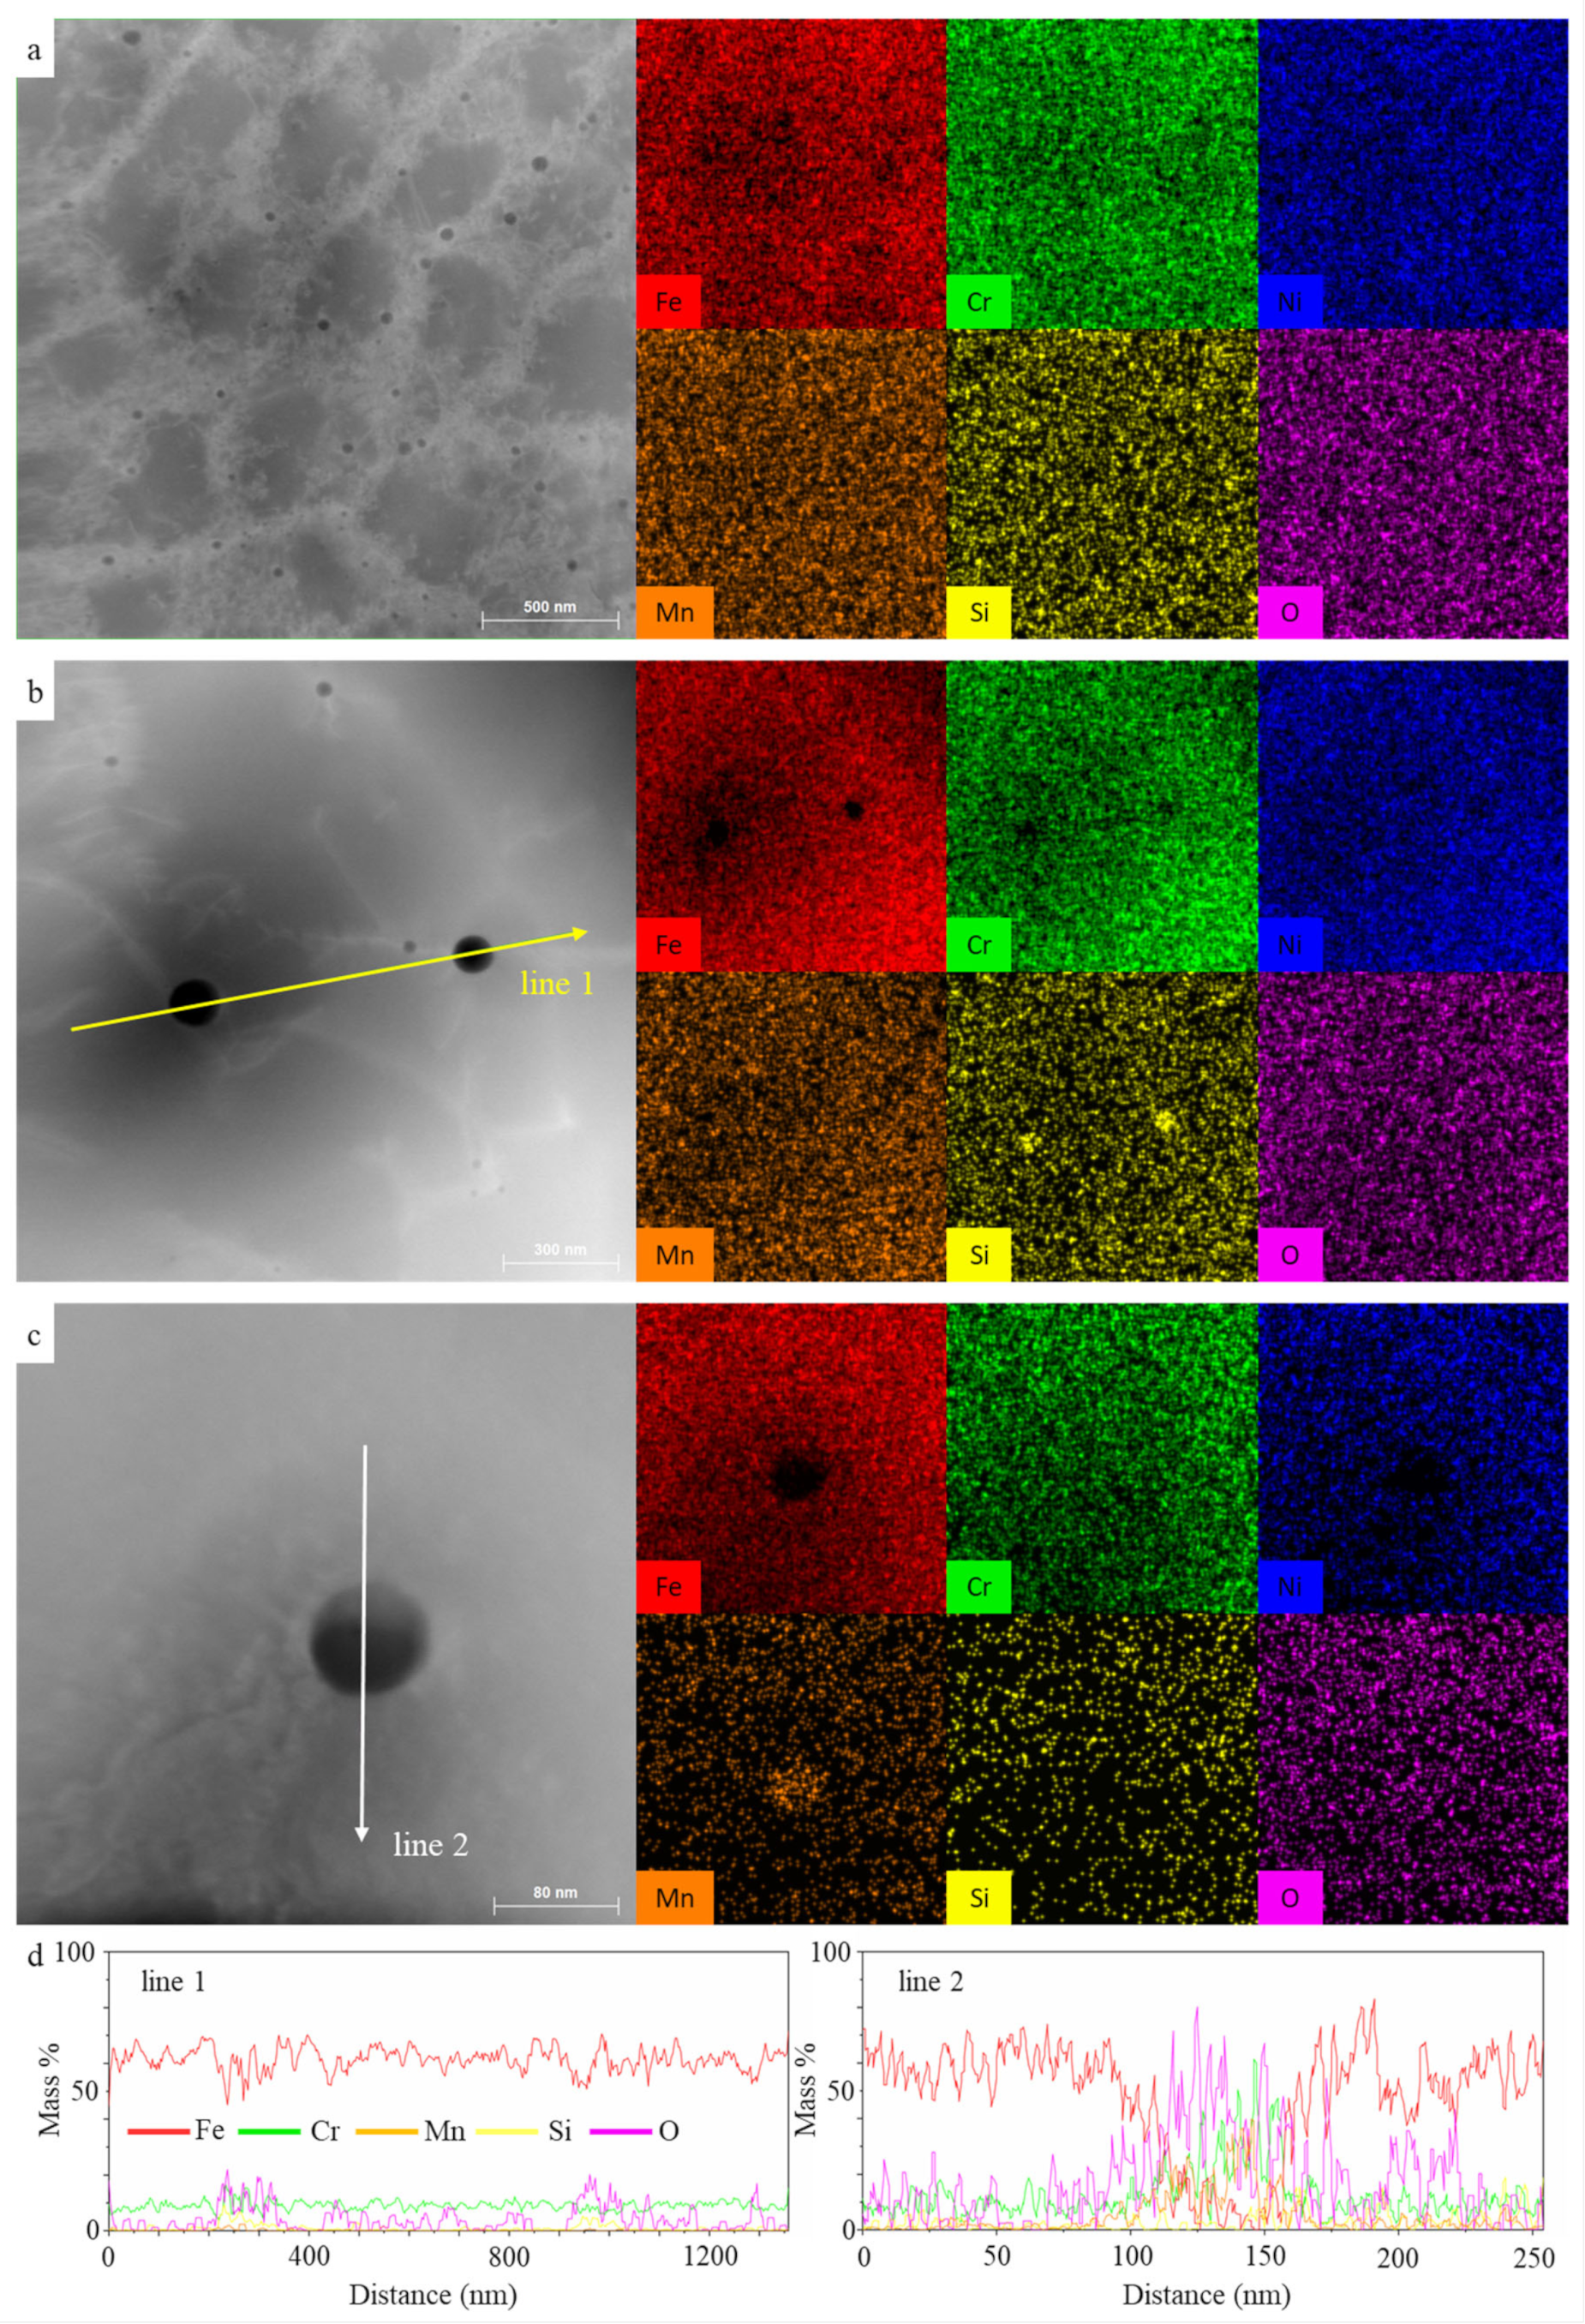
The chemical composition of typical precipitate particles, in both the as-printed state and in the heat-treated state, was investigated using energy dispersive spectroscopy (EDS) mapping in scanning TEM (STEM) mode. Example results are shown in Figure 5, where, from the EDS line profiles, it can be seen that the particles are oxides, enriched mainly with silicon, molybdenum, and chromium. After annealing for 6 h, some further enrichment of the oxides is observed, in agreement with some previous work, suggesting some phase transformation of the oxide particles during heat treatment [11,35]. The EDS maps also show that no obvious element segregation is present at the cell boundaries, which is in agreement with some previous studies [36], but different from some other studies on similar material [6,9].
Considering the relatively high (1500 ppm) oxygen content in the chamber during the SLM process, it can be deduced that the cellular substructure in the SLM 316L examined in this work is a type of solidification structure, formed during rapid solidification, where the heavy alloy elements become enriched at the front of the solid–liquid interface, and where elements prone to form oxides, including Si and Mn, react with the oxygen in the chamber in situ to form oxide particles. As a result, the oxides are distributed at the boundaries within the solidification substructure. The thermal stress caused by thermal expansion and contraction of the sample during cooling generates a large number of dislocations in order to accommodate the deformation caused by the thermal stress, and these dislocations are then pinned by the oxide particles at the solidification substructure boundaries, thus forming the observed cellular substructure. The presence of the oxide particles retards the movement of the dislocations, which raises the recovery temperature and time for the SLM 316L samples. Notably, even after a long high-temperature heat treatment, some dislocations remain inside the recovered regions. During the heat treatment, the large number of oxide particles coarsen with increasing annealing time, eventually pinning the grain boundaries in the nearly fully recrystallized sample after 6 h annealing.
The existence of oxide particles also influences the grain morphology and recrystallization process in the SLM 316L samples. Figure 6 shows the microstructure of the as-printed and heat-treated samples obtained from EBSD mapping using inverse pole figure coloring (according to the BD). A strongly non-uniform grain size distribution can be seen in the as-printed sample, consisting of both large columnar grains and regions of smaller equiaxed grains between the columnar grains. The average grain size was determined as approx. 8 μm from the EBSD data using an area reconstruction method and a 15° grain boundary definition. With increasing annealing time, an increasing number of large equiaxed grains and annealing twins appear, indicating the onset and progress of recrystallization. After 3 h annealing time, most of the grains show an equiaxed morphology. Close inspection, however, of the EBSD data reveals that recrystallization is only nearly complete in the sample annealed for 6 h at 1000 °C, as reflected also in the continuous increase in grain size (Figure 6f).
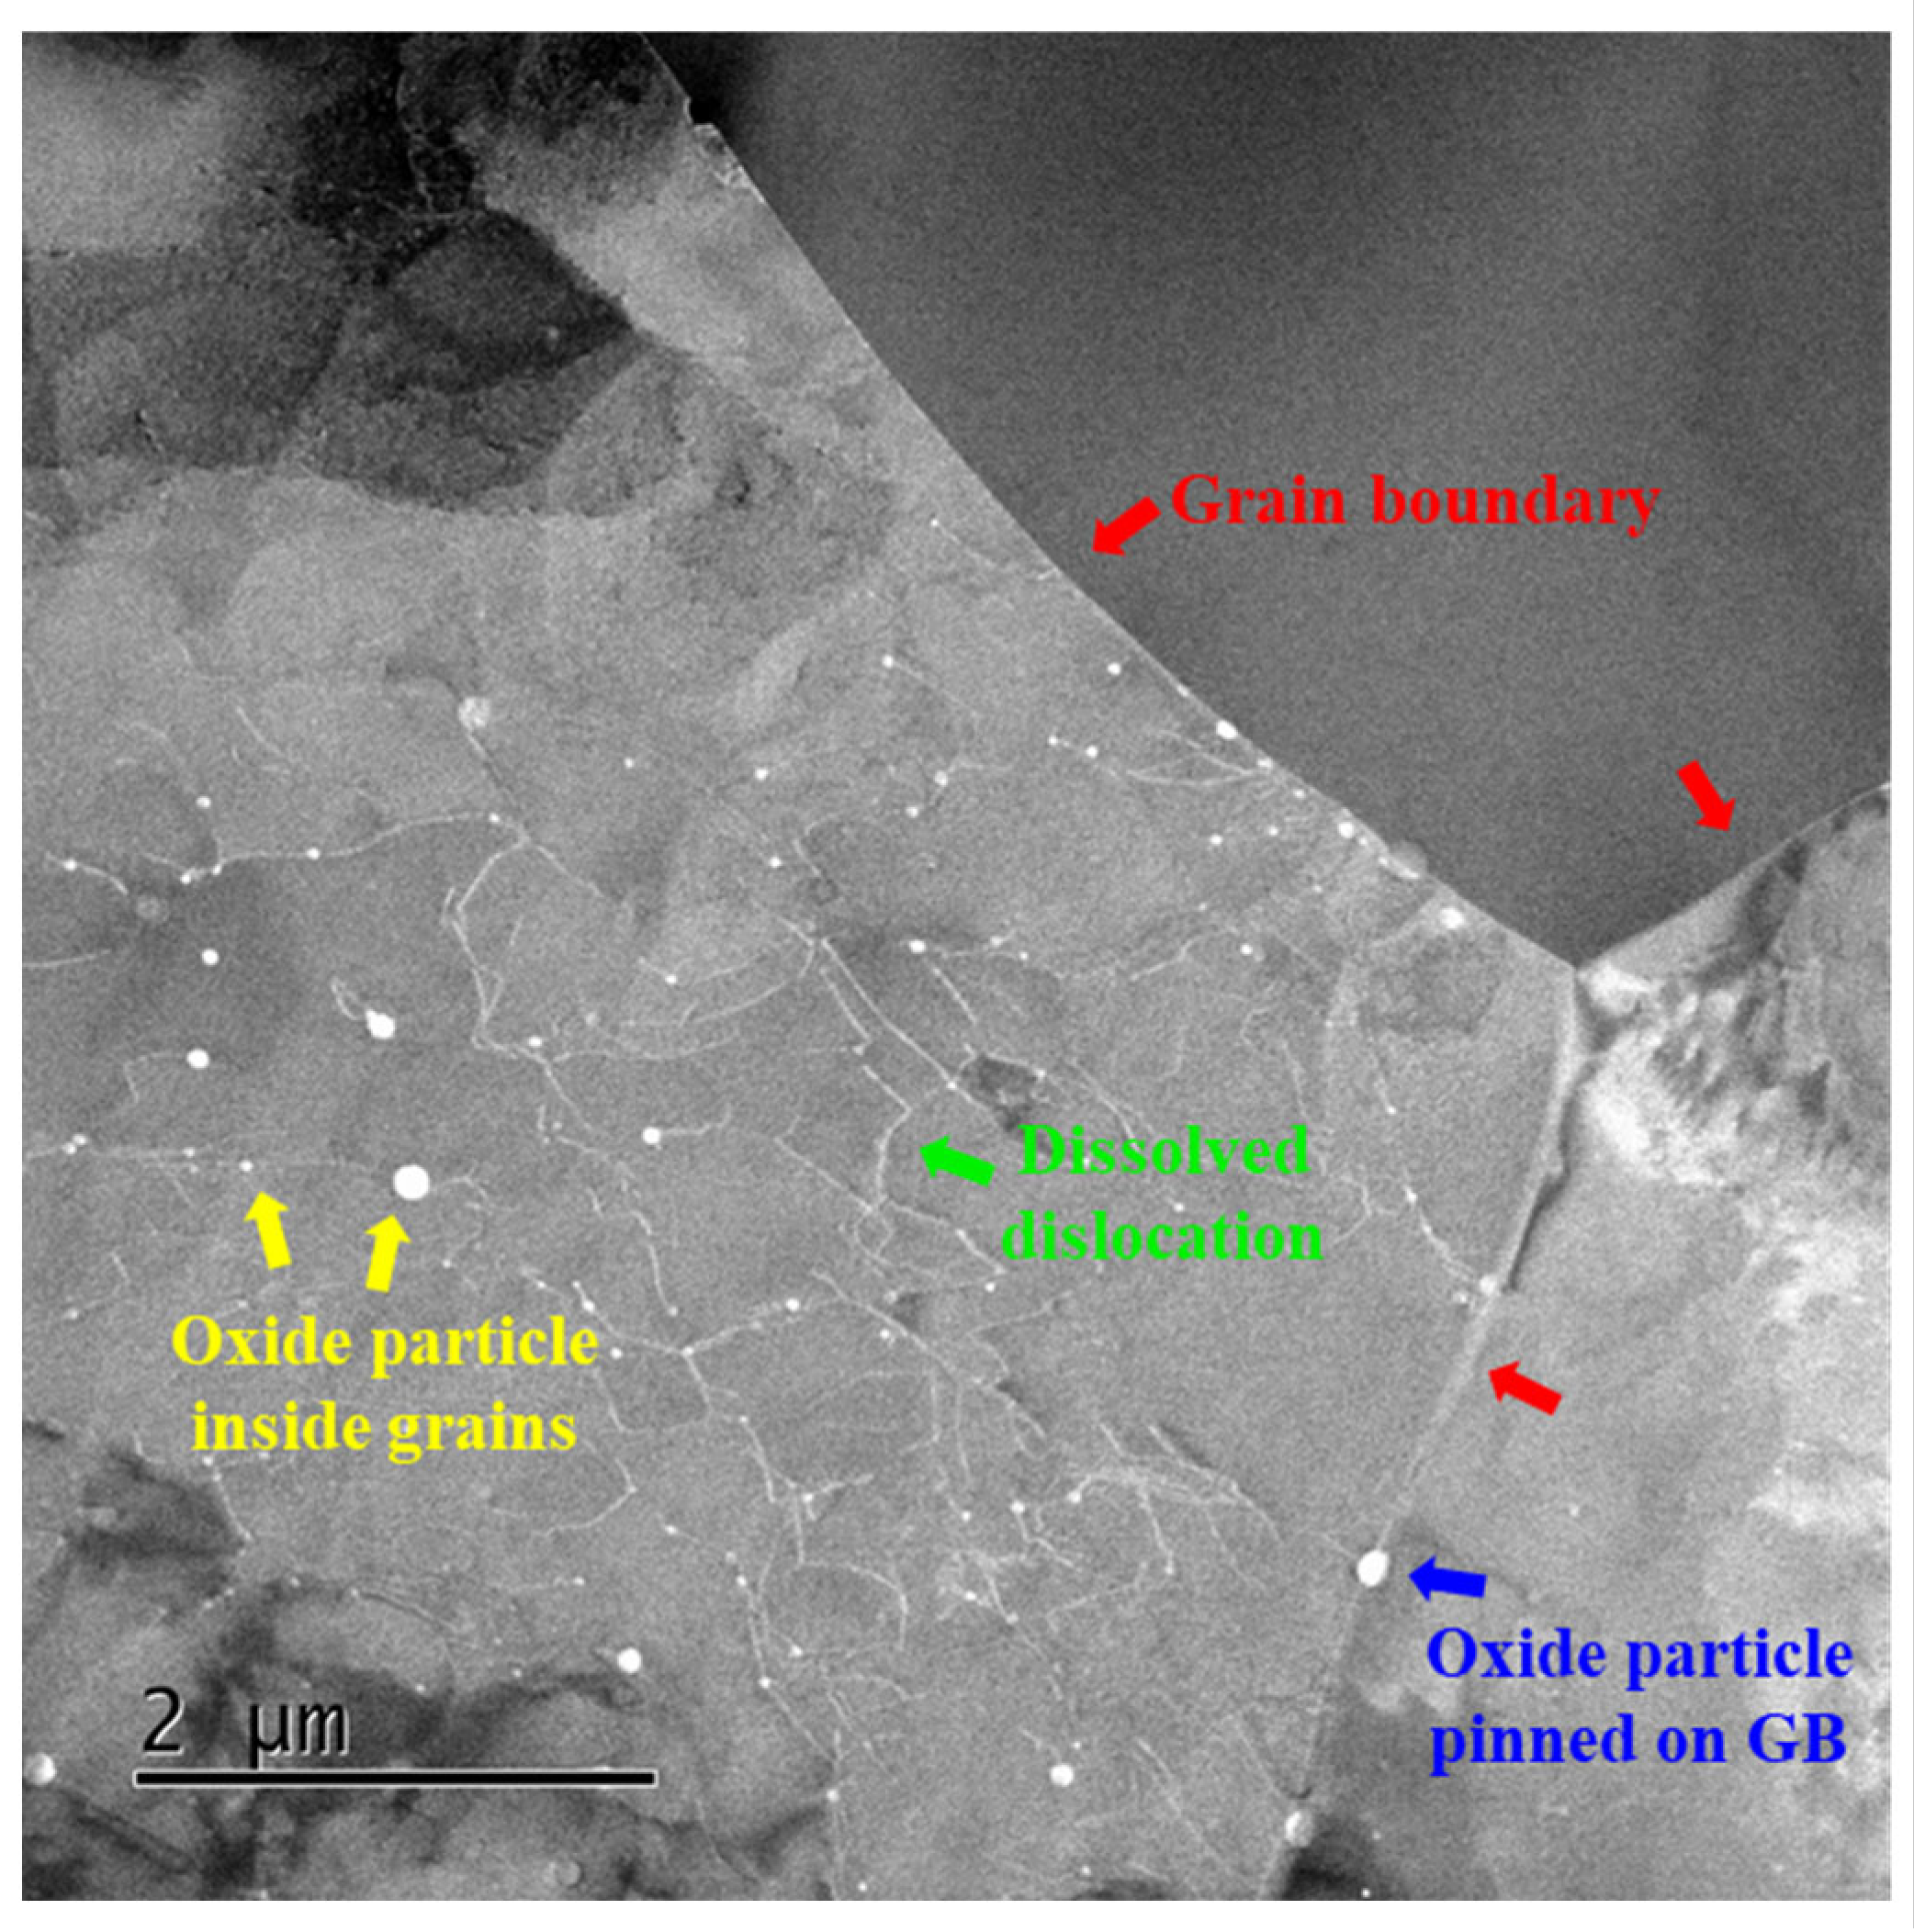
Full recrystallization requires at least 6 h at an annealing temperature of 1000 °C for the SLM 316L stainless steel, indicating a significant delay in recrystallization. Nanoscale precipitates are a well-known cause of slow recrystallization kinetics in LPBF 316L SS due to their pinning effect on grain boundaries [22,24,25]. Local variations in particle density may also play a role in the recrystallization kinetics. A local characterization of a sample annealed for 3 h in TEM, shown in Figure 7, illustrates differences both in the intragranular oxide particle density, and in the distribution of oxide particles at grain boundaries, suggesting different recrystallization rates between different grains.
To follow the microstructural changes during annealing, the EBSD data were further analyzed by calculating the density of boundaries in different misorientation angle ranges. Four ranges of misorientation angles were considered, namely, ultra-low-angle grain boundaries (ULAGBs, 0.6°–2°), low-angle grain boundaries (LAGBs, 2°–15°), high-angle grain boundaries (HAGBs, >15°), and twin boundaries (TBs, defined here as ∑3 coincidence site lattice boundaries with misorientation angle 60° and rotation axis <111> using tolerances of ±2° and ±5°, respectively). The length per area (LA) of boundaries in each range was determined according to Equation (1) below:
L A = n mo × l N x × N y × l 2
where nmo is the total number of adjacent pixel misorientations in the EBSD map with misorientation angle in the chosen angular range, Nx and Ny are the dimensions of the scanned area (in pixels), and Δl is the step size used for EBSD characterization (i.e., the length associated with one pixel). The lower limit of 0.6° was chosen as a compromise between the limited angular resolution of EBSD data and previous reports that the average angle associated with the dislocation cell boundaries is close to this value [36,37].
The results are shown in Figure 8, where it is seen that the linear density (LA) of boundaries for all misorientation angle ranges (except for TBs) decreases continuously with annealing time. These changes directly reflect the process of recrystallization, where the initial microstructure, consisting of a bimodal mixture of fine grains separated by high-angle boundaries, and coarser grains containing low- and ultra-low-angle boundaries, are replaced by a new set of recrystallized grains, separated by high-angle boundaries, and containing a large number of twins. The density of ULAGBs in particular provides a convenient way to follow the process of recrystallization, given the initial presence everywhere in the as-printed microstructure of the dislocation cell structure.

3.2. Influence of on Heat Treatment Mechanical Properties

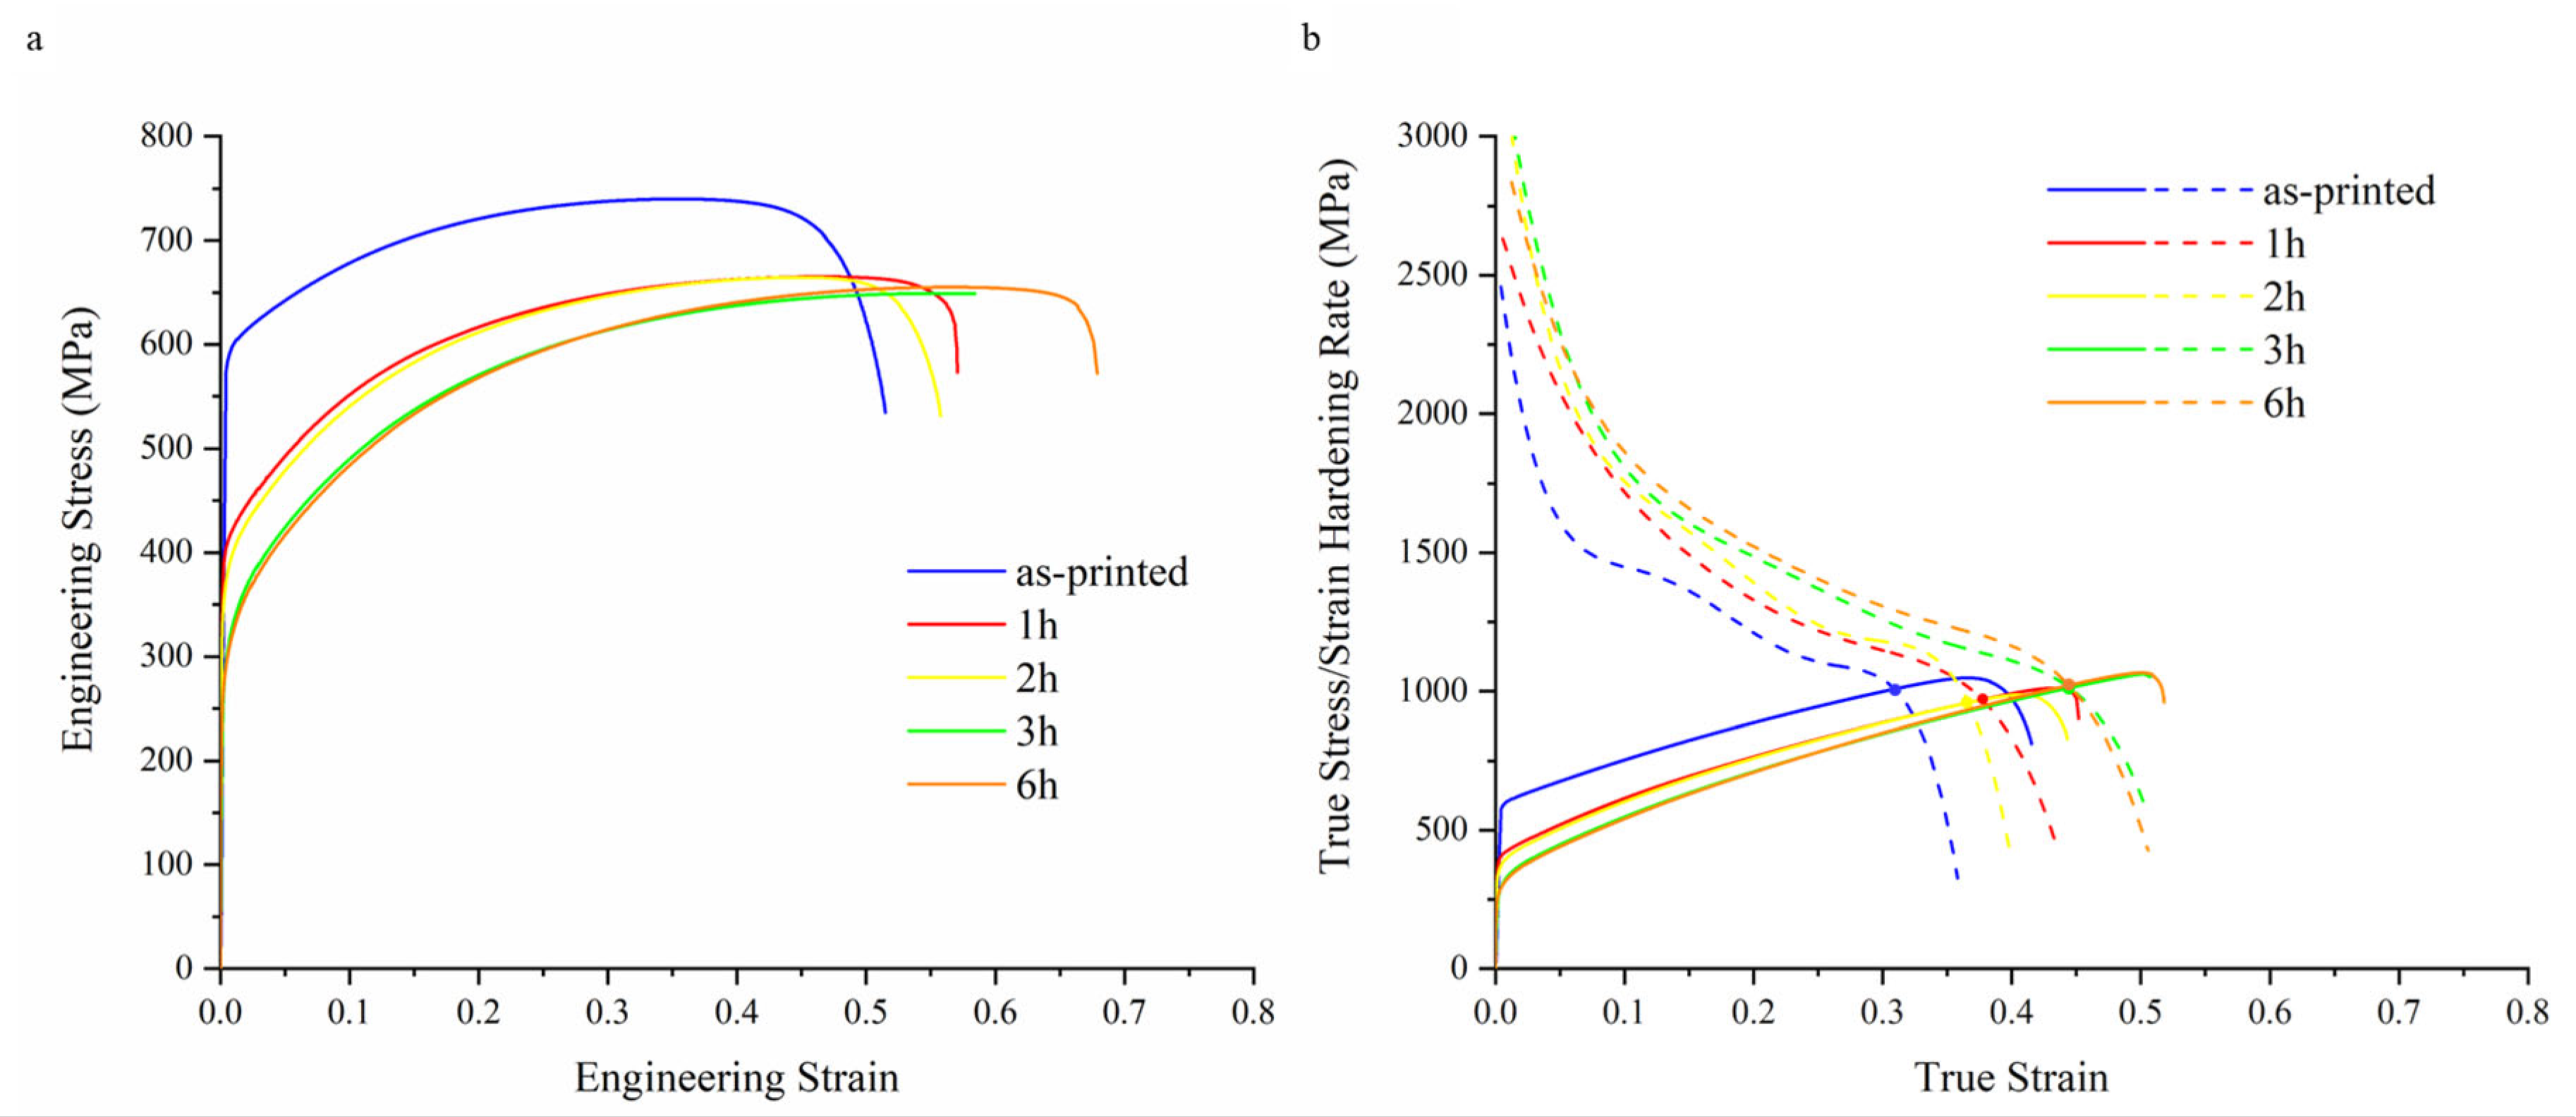
The engineering stress–strain curves of the as-printed and heat-treated samples are shown in Figure 9a, with a summary of the key mechanical properties (yield strength, ultimate tensile strength, and uniform elongation) listed in Table 1. Figure 9b shows the true stress–strain curves together with the work hardening curves of the as-printed and heat-treated samples. It is observed that the yield strength of the samples gradually decreases with the increasing the annealing time, while in contrast, the work hardening ability of the samples gradually improves with increasing annealing time. The high yield strength of the as-printed sample can be attributed to the presence of a dislocation cell structure, composed of oxide particles and dislocations, where the cell walls can be considered as high-angle boundaries that contribute to the yield strength via a Hall–Petch relationship, as proposed in previous studies [6,36,38,39,40,41,42,43]. After 1 h annealing, there is a significant drop in yield strength, from 590 MPa to 401 Mpa. Based on the EBSD data (Figure 8), the recrystallization fraction after 1 h annealing is only a few percent, so this cannot be the cause for the large drop in yield strength. Similarly, the TEM observations (Figure 4a,b) show that the dislocation cell size remains similar to that in the as-printed state. The large drop in yield strength is attributed, therefore, to the significant change in the dislocation density in the dislocation cell walls that takes place during recovery, as seen from the decrease in width of the cell walls in the TEM observations. Surprisingly, the engineering stress–engineering strain curves of the samples annealed for 1 h and 2 h are almost identical, although the microstructural characterization of both samples by EBSD and TEM shows significant differences. In particular, after 2 h annealing, a significant amount of recrystallization has taken place, with many large (>100 mm diameter) recrystallized grains present in the microstructure, and the TEM observations show a further decrease in the dislocation density associated with the dislocation cell structure, both of which would be expected to lead to a decrease in yield strength. This, together with the observation of improved work hardening ability with increasing annealing time, suggests a continued contribution to strength from nanosized oxide particles, and further TEM investigations will be carried out to explore this possibility.
With increasing annealing time, the percentage of fully recrystallized grains greatly increases, reaching nearly 80% after 3 h annealing (Figure 8d) and 100% after 6 h annealing (Figure 8e), based on the ULAGB length density. This microstructural evolution is in accordance with the change of mechanical properties, where the yield strength of sample annealed for 3 h is significantly lower than that of the sample annealed for 2 h, and similar to that of the sample annealed for 6 h.

4. Conclusions

The effect of annealing heat treatment time on microstructural evolution and mechanical properties of SLM-printed 316L stainless steel has been explored by the characterization of samples annealing at 1000 °C for between 1 and 6 h. In the as-printed state, a high density of nanoscale Si–Mn–Cr-enriched oxide particles are present, in combination with a dislocation cell structure, where the cell walls are characterized by a high dislocation density and low misorientation angle. During annealing at 1000 °C, recrystallization takes place in parallel with recovery of the dislocation cell structure, and with a coarsening and decreasing in density of the oxide particles. The presence of nanoscale oxide particles results in the presence of a low-density dislocation network, even after extensive recovery. The area density of the ultra-low-angle misorientations associated with the dislocation cell structure provides a convenient method to follow the progress of recrystallization from EBSD data. The mechanical properties of the examined samples reflect, to a large extent, the observed microstructural evolution during annealing, where the high strength of the as-printed sample is attributed to the high dislocation density of the cell walls, and to the size and distribution of the oxide particles. The drop in yield strength of annealed SLM-printed 316L stainless steel is the result of continuous dislocation recovery, together with nucleation and growth of recrystallized grains during heat treatment.

Author Contributions

Conceptualization, W.-Y.W. and W.L.; methodology, W.-Y.W.; formal analysis, W.-Y.W.; investigation, W.-Y.W.; writing—original draft preparation, W.-Y.W.; writing—review and editing, A.G.; funding acquisition, A.G. and W.L. All authors have read and agreed to the published version of the manuscript.

Funding

This research was funded by the National Natural Science Foundation of China (project number 51971117).

Data Availability Statement

The data presented in this study are available upon reasonable request.

Conflicts of Interest

The authors declare no conflict of interest.

References

  1. DebRoy, T.; Wei, H.L.; Zuback, J.S.; Mukherjee, T.; Elmer, J.W.; Milewski, J.O.; Beese, A.M.; Wilson-Heid, A.; De, A.; Zhang, W. Additive manufacturing of metallic components—Process, structure and properties. Prog. Mater. Sci. 2018, 92, 112–224. [Google Scholar] [CrossRef]
  2. Herzog, D.; Seyda, V.; Wycisk, E.; Emmelmann, C. Additive manufacturing of metals. Acta Mater. 2016, 117, 371–392. [Google Scholar] [CrossRef]
  3. King, W.E.; Anderson, A.T.; Ferencz, R.M.; Hodge, N.E.; Kamath, C.; Khairallah, S.A.; Rubenchik, A.M. Laser powder bed fusion additive manufacturing of metals; physics, computational, and materials challenges. Appl. Phys. Rev. 2015, 2, 0410304. [Google Scholar] [CrossRef]
  4. Yin, Y.; Tan, Q.; Bermingham, M.; Mo, N.; Zhang, J.; Zhang, M.-X. Laser additive manufacturing of steels. Int. Mater. Rev. 2021, 67, 487–573. [Google Scholar] [CrossRef]
  5. Oliveira, J.P.; Santos, T.G.; Miranda, R.M. Revisiting fundamental welding concepts to improve additive manufacturing: From theory to practice. Prog. Mater. Sci. 2020, 107, 100590. [Google Scholar] [CrossRef]
  6. Wang, Y.M.; Voisin, T.; McKeown, J.T.; Ye, J.; Calta, N.P.; Li, Z.; Zeng, Z.; Zhang, Y.; Chen, W.; Roehling, T.T.; et al. Additively manufactured hierarchical stainless steels with high strength and ductility. Nat. Mater. 2018, 17, 63–71. [Google Scholar] [CrossRef]
  7. Bertsch, K.M.; Meric de Bellefon, G.; Kuehl, B.; Thoma, D.J. Origin of dislocation structures in an additively manufactured austenitic stainless steel 316L. Acta Mater. 2020, 199, 19–33. [Google Scholar] [CrossRef]
  8. Bajaj, P.; Hariharan, A.; Kini, A.; Kürnsteiner, P.; Raabe, D.; Jägle, E.A. Steels in additive manufacturing: A review of their microstructure and properties. Mater. Sci. Eng. A 2020, 772, 138633. [Google Scholar] [CrossRef]
  9. Birnbaum, A.J.; Steuben, J.C.; Barrick, E.J.; Iliopoulos, A.P.; Michopoulos, J.G. Intrinsic strain aging, Σ3 boundaries, and origins of cellular substructure in additively manufactured 316L. Addit. Manuf. 2019, 29, 100784. [Google Scholar] [CrossRef]
  10. Deng, P.; Karadge, M.; Rebak, R.B.; Gupta, V.K.; Prorok, B.C.; Lou, X. The origin and formation of oxygen inclusions in austenitic stainless steels manufactured by laser powder bed fusion. Addit. Manuf. 2020, 35, 101334. [Google Scholar] [CrossRef]
  11. Yan, F.; Xiong, W.; Faierson, E.; Olson, G.B. Characterization of nano-scale oxides in austenitic stainless steel processed by powder bed fusion. Scr. Mater. 2018, 155, 104–108. [Google Scholar] [CrossRef]
  12. Saeidi, K.; Gao, X.; Zhong, Y.; Shen, Z.J. Hardened austenite steel with columnar sub-grain structure formed by laser melting. Mater. Sci. Eng. A 2015, 625, 221–229. [Google Scholar] [CrossRef]
  13. Saeidi, K.; Kvetková, L.; Lofaj, F.; Shen, Z. Austenitic stainless steel strengthened by the in situ formation of oxide nanoinclusions. RSC Adv. 2015, 5, 20747–20750. [Google Scholar] [CrossRef]
  14. Chao, Q.; Thomas, S.; Birbilis, N.; Cizek, P.; Hodgson, P.D.; Fabijanic, D. The effect of post-processing heat treatment on the microstructure, residual stress and mechanical properties of selective laser melted 316L stainless steel. Mater. Sci. Eng. A 2021, 821, 141611. [Google Scholar] [CrossRef]
  15. Chen, N.; Ma, G.; Zhu, W.; Godfrey, A.; Shen, Z.; Wu, G.; Huang, X. Enhancement of an additive-manufactured austenitic stainless steel by post-manufacture heat-treatment. Mater. Sci. Eng. A 2019, 759, 65–69. [Google Scholar] [CrossRef]
  16. Fonda, R.W.; Rowenhorst, D.J.; Feng, C.R.; Levinson, A.J.; Knipling, K.E.; Olig, S.; Ntiros, A.; Stiles, B.; Rayne, R. The Effects of Post-processing in Additively Manufactured 316L Stainless Steels. Metall. Mater. Trans. A 2020, 51, 6560–6573. [Google Scholar] [CrossRef]
  17. Kong, D.; Dong, C.; Ni, X.; Zhang, L.; Yao, J.; Man, C.; Cheng, X.; Xiao, K.; Li, X. Mechanical properties and corrosion behavior of selective laser melted 316L stainless steel after different heat treatment processes. J. Mater. Sci. Technol. 2019, 35, 1499–1507. [Google Scholar] [CrossRef]
  18. Riabov, D.; Leicht, A.; Ahlström, J.; Hryha, E. Investigation of the strengthening mechanism in 316L stainless steel produced with laser powder bed fusion. Mater. Sci. Eng. A 2021, 822, 141699. [Google Scholar] [CrossRef]
  19. Saeidi, K.; Akhtar, F. Subgrain-controlled grain growth in the laser-melted 316 L promoting strength at high temperatures. R. Soc. Open Sci. 2018, 5, 172394. [Google Scholar] [CrossRef]
  20. Salman, O.O.; Gammer, C.; Chaubey, A.K.; Eckert, J.; Scudino, S. Effect of heat treatment on microstructure and mechanical properties of 316L steel synthesized by selective laser melting. Mater. Sci. Eng. A 2019, 748, 205–212. [Google Scholar] [CrossRef]
  21. Voisin, T.; Forien, J.-B.; Perron, A.; Aubry, S.; Bertin, N.; Samanta, A.; Baker, A.; Wang, Y.M. New insights on cellular structures strengthening mechanisms and thermal stability of an austenitic stainless steel fabricated by laser powder-bed-fusion. Acta Mater. 2021, 203, 116476. [Google Scholar] [CrossRef]
  22. Aota, L.S.; Bajaj, P.; Zilnyk, K.D.; Jägle, E.A.; Ponge, D.; Sandim, H.R.Z.; Raabe, D. Recrystallization kinetics, mechanisms, and topology in alloys processed by laser powder-bed fusion: AISI 316L stainless steel as example. Materialia 2021, 20, 101236. [Google Scholar] [CrossRef]
  23. Chadha, K.; Tian, Y.; Spray, J.; Aranas, C. Effect of Annealing Heat Treatment on the Microstructural Evolution and Mechanical Properties of Hot Isostatic Pressed 316L Stainless Steel Fabricated by Laser Powder Bed Fusion. Metals 2020, 10, 753. [Google Scholar] [CrossRef]
  24. de Sonis, E.; Dépinoy, S.; Giroux, P.-F.; Maskrot, H.; Lemarquis, L.; Hercher, O.; Villaret, F.; Gourgues-Lorenzon, A.-F. Dependency of recrystallization kinetics on the solidification microstructure of 316L stainless steel processed by laser powder bed fusion (LPBF). Mater. Charact. 2022, 194, 112370. [Google Scholar] [CrossRef]
  25. Pinto, F.C.; Aota, L.S.; Souza Filho, I.R.; Raabe, D.; Sandim, H.R.Z. Recrystallization in non-conventional microstructures of 316L stainless steel produced via laser powder-bed fusion: Effect of particle coarsening kinetics. J. Mater. Sci. 2022, 57, 9576–9598. [Google Scholar] [CrossRef]
  26. Chowdhury, S.G.; Das, S.; Ravikumar, B.; De, P.K. Twinning-induced sluggish evolution of texture during recrystallization in AISI 316L stainless steel after cold rolling. Metall. Mater. Trans. A Phys. Metall. Mater. Sci. 2006, 37, 2349–2359. [Google Scholar] [CrossRef]
  27. Chowdhury, S.G.; Datta, S.; Kumar, B.R.; De, P.K.; Ghosh, R.N. Randomization of texture during recrystallization of austenite in a cold rolled metastable austenitic stainless steel. Mater. Sci. Eng. A 2007, 443, 114–119. [Google Scholar] [CrossRef]
  28. Bachmann, F.; Hielscher, R.; Schaeben, H. Texture Analysis with MTEX—Free and Open Source Software Toolbox. Solid State Phenom. 2010, 160, 63–68. [Google Scholar] [CrossRef]
  29. Bachmann, F.; Hielscher, R.; Schaeben, H. Grain detection from 2d and 3d EBSD data--specification of the MTEX algorithm. Ultramicroscopy 2011, 111, 1720–1733. [Google Scholar] [CrossRef]
  30. Godec, M.; Zaefferer, S.; Podgornik, B.; Šinko, M.; Tchernychova, E. Quantitative multiscale correlative microstructure analysis of additive manufacturing of stainless steel 316L processed by selective laser melting. Mater. Charact. 2020, 160, 110074. [Google Scholar] [CrossRef]
  31. Wang, Y.; Zhang, C.; Yu, C.; Xing, L.; Li, K.; Chen, J.; Ma, J.; Liu, W.; Shen, Z. Construction of Cellular Substructure in Laser Powder Bed Fusion. Metals 2019, 9, 1231. [Google Scholar] [CrossRef]
  32. Kurz, W.; Bezençon, C.; Gäumann, M. Columnar to equiaxed transition in solidification processing. Sci. Technol. Adv. Mater. 2001, 2, 185–191. [Google Scholar] [CrossRef]
  33. Kurz, W.; Fisher, D.J.; Trivedi, R. Progress in modelling solidification microstructures in metals and alloys: Dendrites and cells from 1700 to 2000. Int. Mater. Rev. 2018, 64, 311–354. [Google Scholar] [CrossRef]
  34. Kurz, W. Solidification microstructure processing maps: Theory and application. Adv. Eng. Mater. 2001, 3, 443–452. [Google Scholar] [CrossRef]
  35. Deng, P.; Song, M.; Yang, J.; Pan, Q.; McAllister, S.; Li, L.; Prorok, B.C.; Lou, X. On the thermal coarsening and transformation of nanoscale oxide inclusions in 316L stainless steel manufactured by laser powder bed fusion and its influence on impact toughness. Mater. Sci. Eng. A 2022, 835, 142690. [Google Scholar] [CrossRef]
  36. Chen, S.; Ma, G.; Wu, G.; Godfrey, A.; Huang, T.; Huang, X. Strengthening mechanisms in selective laser melted 316L stainless steel. Mater. Sci. Eng. A 2022, 832, 142434. [Google Scholar] [CrossRef]
  37. Gao, S.; Hu, Z.; Duchamp, M.; Krishnan, P.S.S.R.; Tekumalla, S.; Song, X.; Seita, M. Recrystallization-based grain boundary engineering of 316L stainless steel produced via selective laser melting. Acta Mater. 2020, 200, 366–377. [Google Scholar] [CrossRef]
  38. Cui, L.; Jiang, S.; Xu, J.; Peng, R.L.; Mousavian, R.T.; Moverare, J. Revealing relationships between microstructure and hardening nature of additively manufactured 316L stainless steel. Mater. Des. 2021, 198, 109385. [Google Scholar] [CrossRef]
  39. Hong, Y.; Zhou, C.; Zheng, Y.; Zhang, L.; Zheng, J. The cellular boundary with high density of dislocations governed the strengthening mechanism in selective laser melted 316L stainless steel. Mater. Sci. Eng. A 2021, 799, 140279. [Google Scholar] [CrossRef]
  40. Li, Z.; He, B.; Guo, Q. Strengthening and hardening mechanisms of additively manufactured stainless steels: The role of cell sizes. Scr. Mater. 2020, 177, 17–21. [Google Scholar] [CrossRef]
  41. Liu, L.; Ding, Q.; Zhong, Y.; Zou, J.; Wu, J.; Chiu, Y.-L.; Li, J.; Zhang, Z.; Yu, Q.; Shen, Z. Dislocation network in additive manufactured steel breaks strength–ductility trade-off. Mater. Today 2018, 21, 354–361. [Google Scholar] [CrossRef]
  42. Zhong, Y.; Liu, L.; Wikman, S.; Cui, D.; Shen, Z. Intragranular cellular segregation network structure strengthening 316L stainless steel prepared by selective laser melting. J. Nucl. Mater. 2016, 470, 170–178. [Google Scholar] [CrossRef]
  43. Zhang, C.; Juul Jensen, D.; Yu, T. Effects of initial 3D printed microstructures on subsequent microstructural evolution in 316L stainless steel. Acta Mater. 2023, 242, 118481. [Google Scholar] [CrossRef]
Figure 1. (a) Relative orientation of the tensile samples and square plate samples cut from the as-printed bulk sample, (b) dimensions of the tensile samples. BD indicates the build direction.
Metals 13 01062 g001
Figure 2. SEM observations of the samples: (a) as-printed, as viewed parallel to the BD, with a small region magnified to show the cell structure, (b) as-printed, as viewed perpendicular to the BD, and samples annealed at 1000 °C for (c) 1 h, (d) 2 h, (e) 3 h, and (f) 6 h.
Metals 13 01062 g002
Figure 3. Effect of annealing time on oxide particle size, volume fraction, and number density as measured from SEM observations.
Metals 13 01062 g003
Figure 4. TEM observations of the samples: (a1) as-printed, with a small region in the yellow frame magnified in (a2) to show the cell structure in more detail (the red arrow in (a2) indicates one of the many fine-scale oxide particles), and samples annealed at 1000 °C for (b) 1 h, (c) 2 h, (d) 3 h, and (e) 6 h.
Metals 13 01062 g004
Figure 5. EDS element mapping the cell substructures and precipitate particles in (a,b) the as-printed sample, and (c) a sample annealed at 1000 °C for 6 h. The change in chemistry along line scans across example oxide particles are shown in (d). The elemental maps are plotted using quantitative values; the line profiles are plotted as weight fractions of each element.
Metals 13 01062 g005
Figure 6. EBSD orientation maps of the SLM 316L samples plotted using inverse pole figure coloring according to the BD: (a) as-printed, and annealed at 1000 °C for (b) 1 h, (c) 2 h, (d) 3 h, and (e) 6 h; (f) variation in average grain size with annealing time, showing values calculated both where twins are merged (not counted) or not merged (counted). For the EBSD data, in each case, the viewing direction is parallel to the BD.
Metals 13 01062 g006
Figure 7. Illustration of oxide particle and remnant dislocation characteristics in the sample annealed at 1000 °C for 3 h.
Metals 13 01062 g007
Figure 8. EBSD orientation maps of the SLM 316L samples showing boundary misorientations in different angle ranges: (a) as-printed, and annealed at 1000 °C for (b) 1 h, (c) 2 h, (d) 3 h, and (e) 6 h; (f) variation of length density (LA) for the four ranges/types of boundaries analyzed.
Metals 13 01062 g008
Figure 9. (a) Engineering stress–engineering strain curves and (b) true stress/work hardening rate–true strain curves of as-printed and annealed samples.
Metals 13 01062 g009
Table 1. Yield strength (YS), ultimate tensile strength (UTS), and uniform elongation (UE) of as-printed and annealed samples.
As-Printed1000 °C—1 h1000 °C—2 h1000 °C—3 h1000 °C—6 h
YS (MPa)590 ± 6401 ± 7361 ± 5291 ± 4280 ± 3
UTS (MPa)740 ± 3665 ± 5665 ± 3649 ± 2665 ± 2
UE (%)35 ± 346 ± 645 ± 455 ± 256 ± 2
Disclaimer/Publisher’s Note: The statements, opinions and data contained in all publications are solely those of the individual author(s) and contributor(s) and not of MDPI and/or the editor(s). MDPI and/or the editor(s) disclaim responsibility for any injury to people or property resulting from any ideas, methods, instructions or products referred to in the content.