Abstract
The 7050 alloy is a kind of Al-Zn-Mg-Cu alloy that is widely used for aircraft structures. Although the deformation behavior of the solid solution state 7050 aluminum alloy is critical for engineering and manufacturing design, it has received little attention. In this study, the room and warm compression behavior of the solid solution-state 7050 alloy was researched, and a modified model with variable parameters was built for the flow stress and load prediction. The isothermal compression tests of the solid solution-state 7050 alloy were performed under the conditions of a deformation temperature of 333–523 K, a strain rate of 10−3–10−1 s−1, and a total reduction of 50%. The strain-stress curves at different temperatures were corrected by considering interface friction. The flow stress model of aluminum was established using the modified Voce model. For evaluating the modified Voce model’s prediction accuracy, the flow stresses calculated by the model were compared with the experimental values. Consequently, for assessing its prediction abilities in finite element applications, the whole compression process was simulated in the finite element analysis platform. The results sufficiently illustrated that the modified Voce-type model can precisely predict the complex flow behaviors during warm compression. This study will guide the prediction of the warm compression load and the optimization of the heat treatment process of the alloy.
1. Introduction
The high-strength, age-hardened 7050 alloy is a kind of Al-Zn-Mg-Cu alloy that is widely used for aircraft structures. After the forging of the 7050 alloy, it will be heated to a solid solution temperature and kept for some time [1]. Then the alloy will be quenched and finally artificially aged for improved performance [2,3]. The treatment will induce large residual stresses on the structures, resulting in severe distortion and even failure in the subsequent machining stage [4,5].
In previous studies, the warm compression between solid solution and aging treatment has been proven to have a good residual stress reduction effect on large aluminum alloy forgings [6,7]. The load of the warm compression process is large due to the high strength of the solid solution-state 7050 alloy [8]. To predict the load precisely, the deformation behavior and applicative constitutive model of solid solution-state 7050 aluminum at medium temperature are essential, but they are little studied. Some constitutive models, such as Swift, Ludwik, and Voce, have been used to predict flow stresses and loads in cold or warm forming designs [9,10,11]. At low temperatures, there is also softening due to mechanical work converting. However, the indicated constitutive models ignore softening phenomena in the deformation and are insufficient to predict flow stresses and loads during warm compression for the alloy.
Therefore, the goal of this research is to build a model of 7050 aluminum alloy in its solid solution state for flow stress and load prediction during warm compression. Room temperature and isothermal warm compress tests from 333 to 523 K were performed. The flow properties of the aluminum in its solid solution state were studied. By considering the friction compensation, the modified Voce-type model with parameters variable by the effects of strain, temperature, and strain rate was established for flow stress prediction. For evaluating the modified model’s prediction accuracy, the flow stresses calculated by the model were compared with the experimental values. The model’s prediction abilities in finite element applications have also been assessed.
2. Materials and Methods
The 7050 aluminum alloy for the research was from Deyang Wanhang Die Forging Co., Ltd. (Deyang, China). The chemical compositions of the aluminum alloy are listed in Table 1.

Table 1.
Chemical composition of 7050 alloy (wt, %).
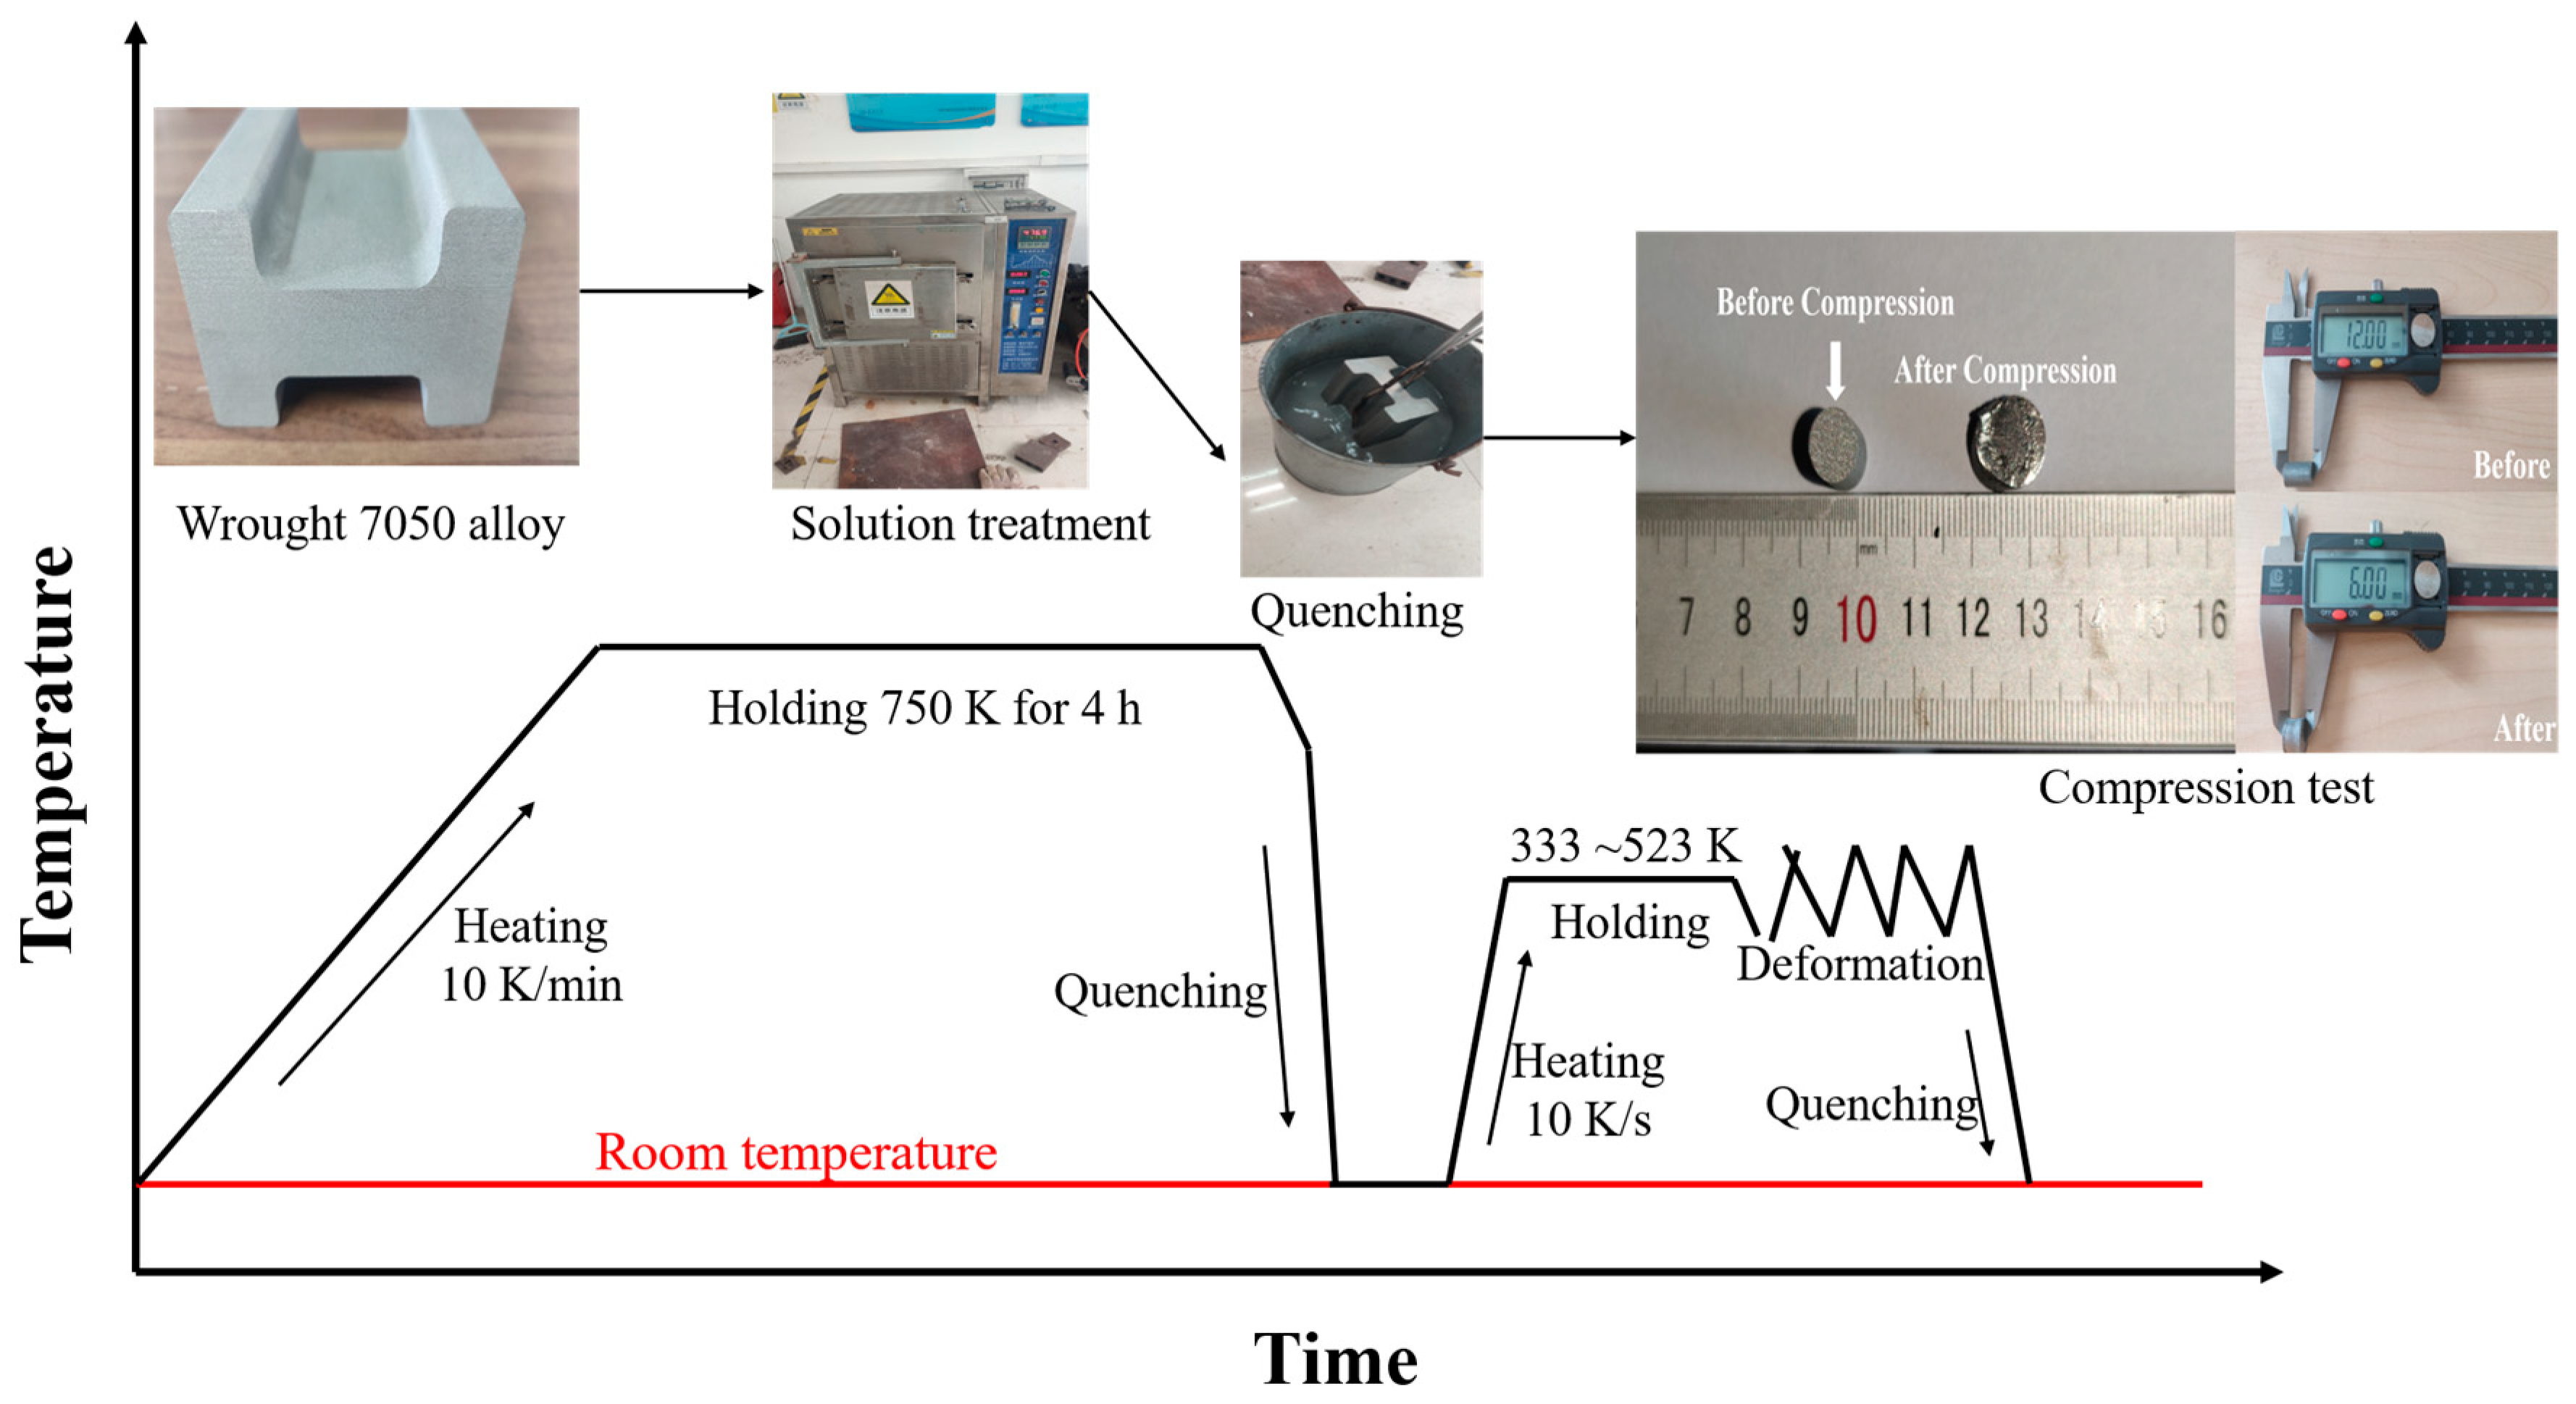
The solid solution treatment and compressing processes are shown in Figure 1. The wrought 7050 alloy was heated and solution treated at 750 K for 4 h with 333 K water quenching. The quenched alloys were prepared into some cylinders of Φ8 × 12 mm for subsequent compressive tests. The warm upsetting tests were conducted on a Gleeble−3180 unit at different temperatures of 333, 423, 473, and 523 K for strain rates of 10−3, 10−2, and 10−1 s−1. The total reduction is 50%, with stress-strain data recorded automatically. Before upsetting, tantalum with graphite lubricant was applied to the surfaces of both specimens and dies to minimize the friction effect. The specimens were heated at 10 K/s to deformation temperatures and then held for some time to eliminate the temperature gradient and microstructure inhomogeneity. The room-temperature compression tests of forged and solid solution states were carried out on a WDW-100 universal tester (Beijing Sinofound Co., Ltd, Beijing, China). The strain-stress curves are recorded by the tester automatically.
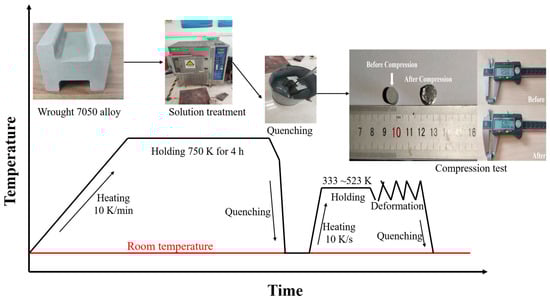
Figure 1.
Schematic diagram of the experimental process for the 7050 alloy.
The samples before and after heat treatment were also wire-electrode cut and metallographically observed for comparison. The samples were ground and polished to eliminate any trace of cutting. Then they were etched with Graff-Sargent solutions. Optical micrographs of the samples in different states were characterized by an OLYMPUS GX-41 type microscope(Olympus Corporation, Tokyo, Japan). The microstructure was further examined using a TESCAN VEGA3 LMH scanning electron microscope (TESCAN CHINA Ltd., Shanghai, China).
3. Results and Discussion
3.1. Flow Behavior
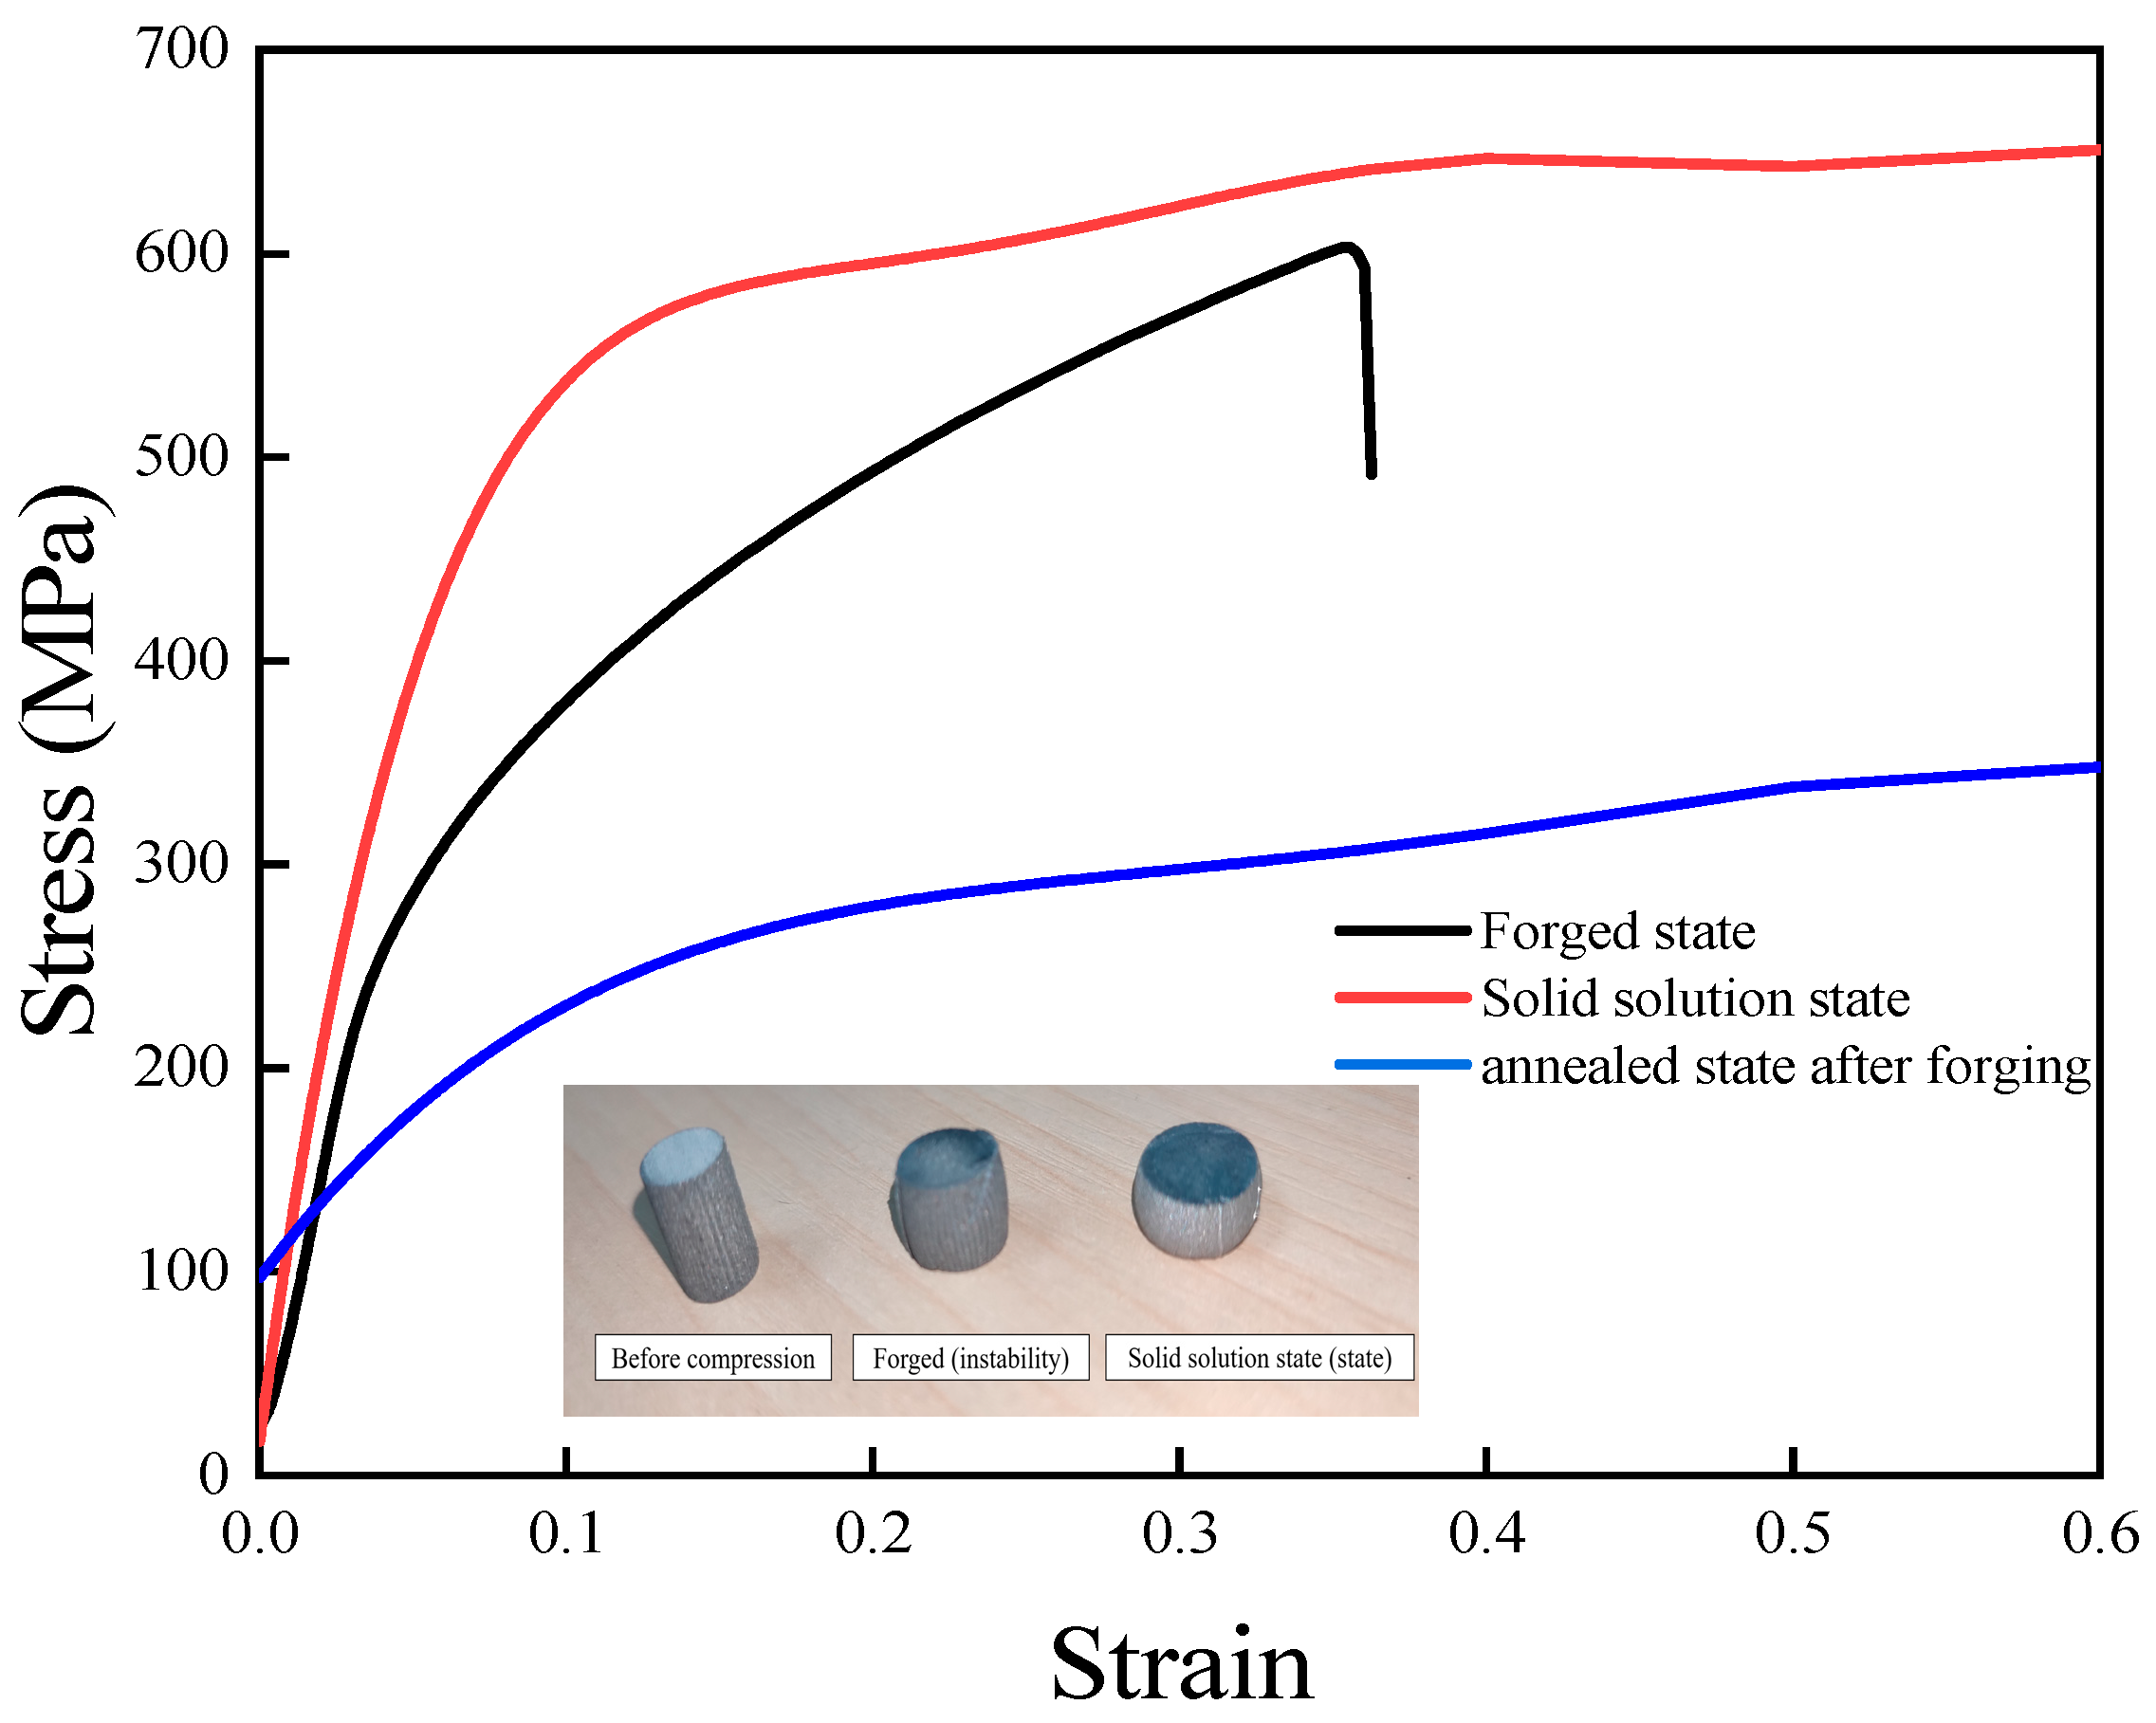
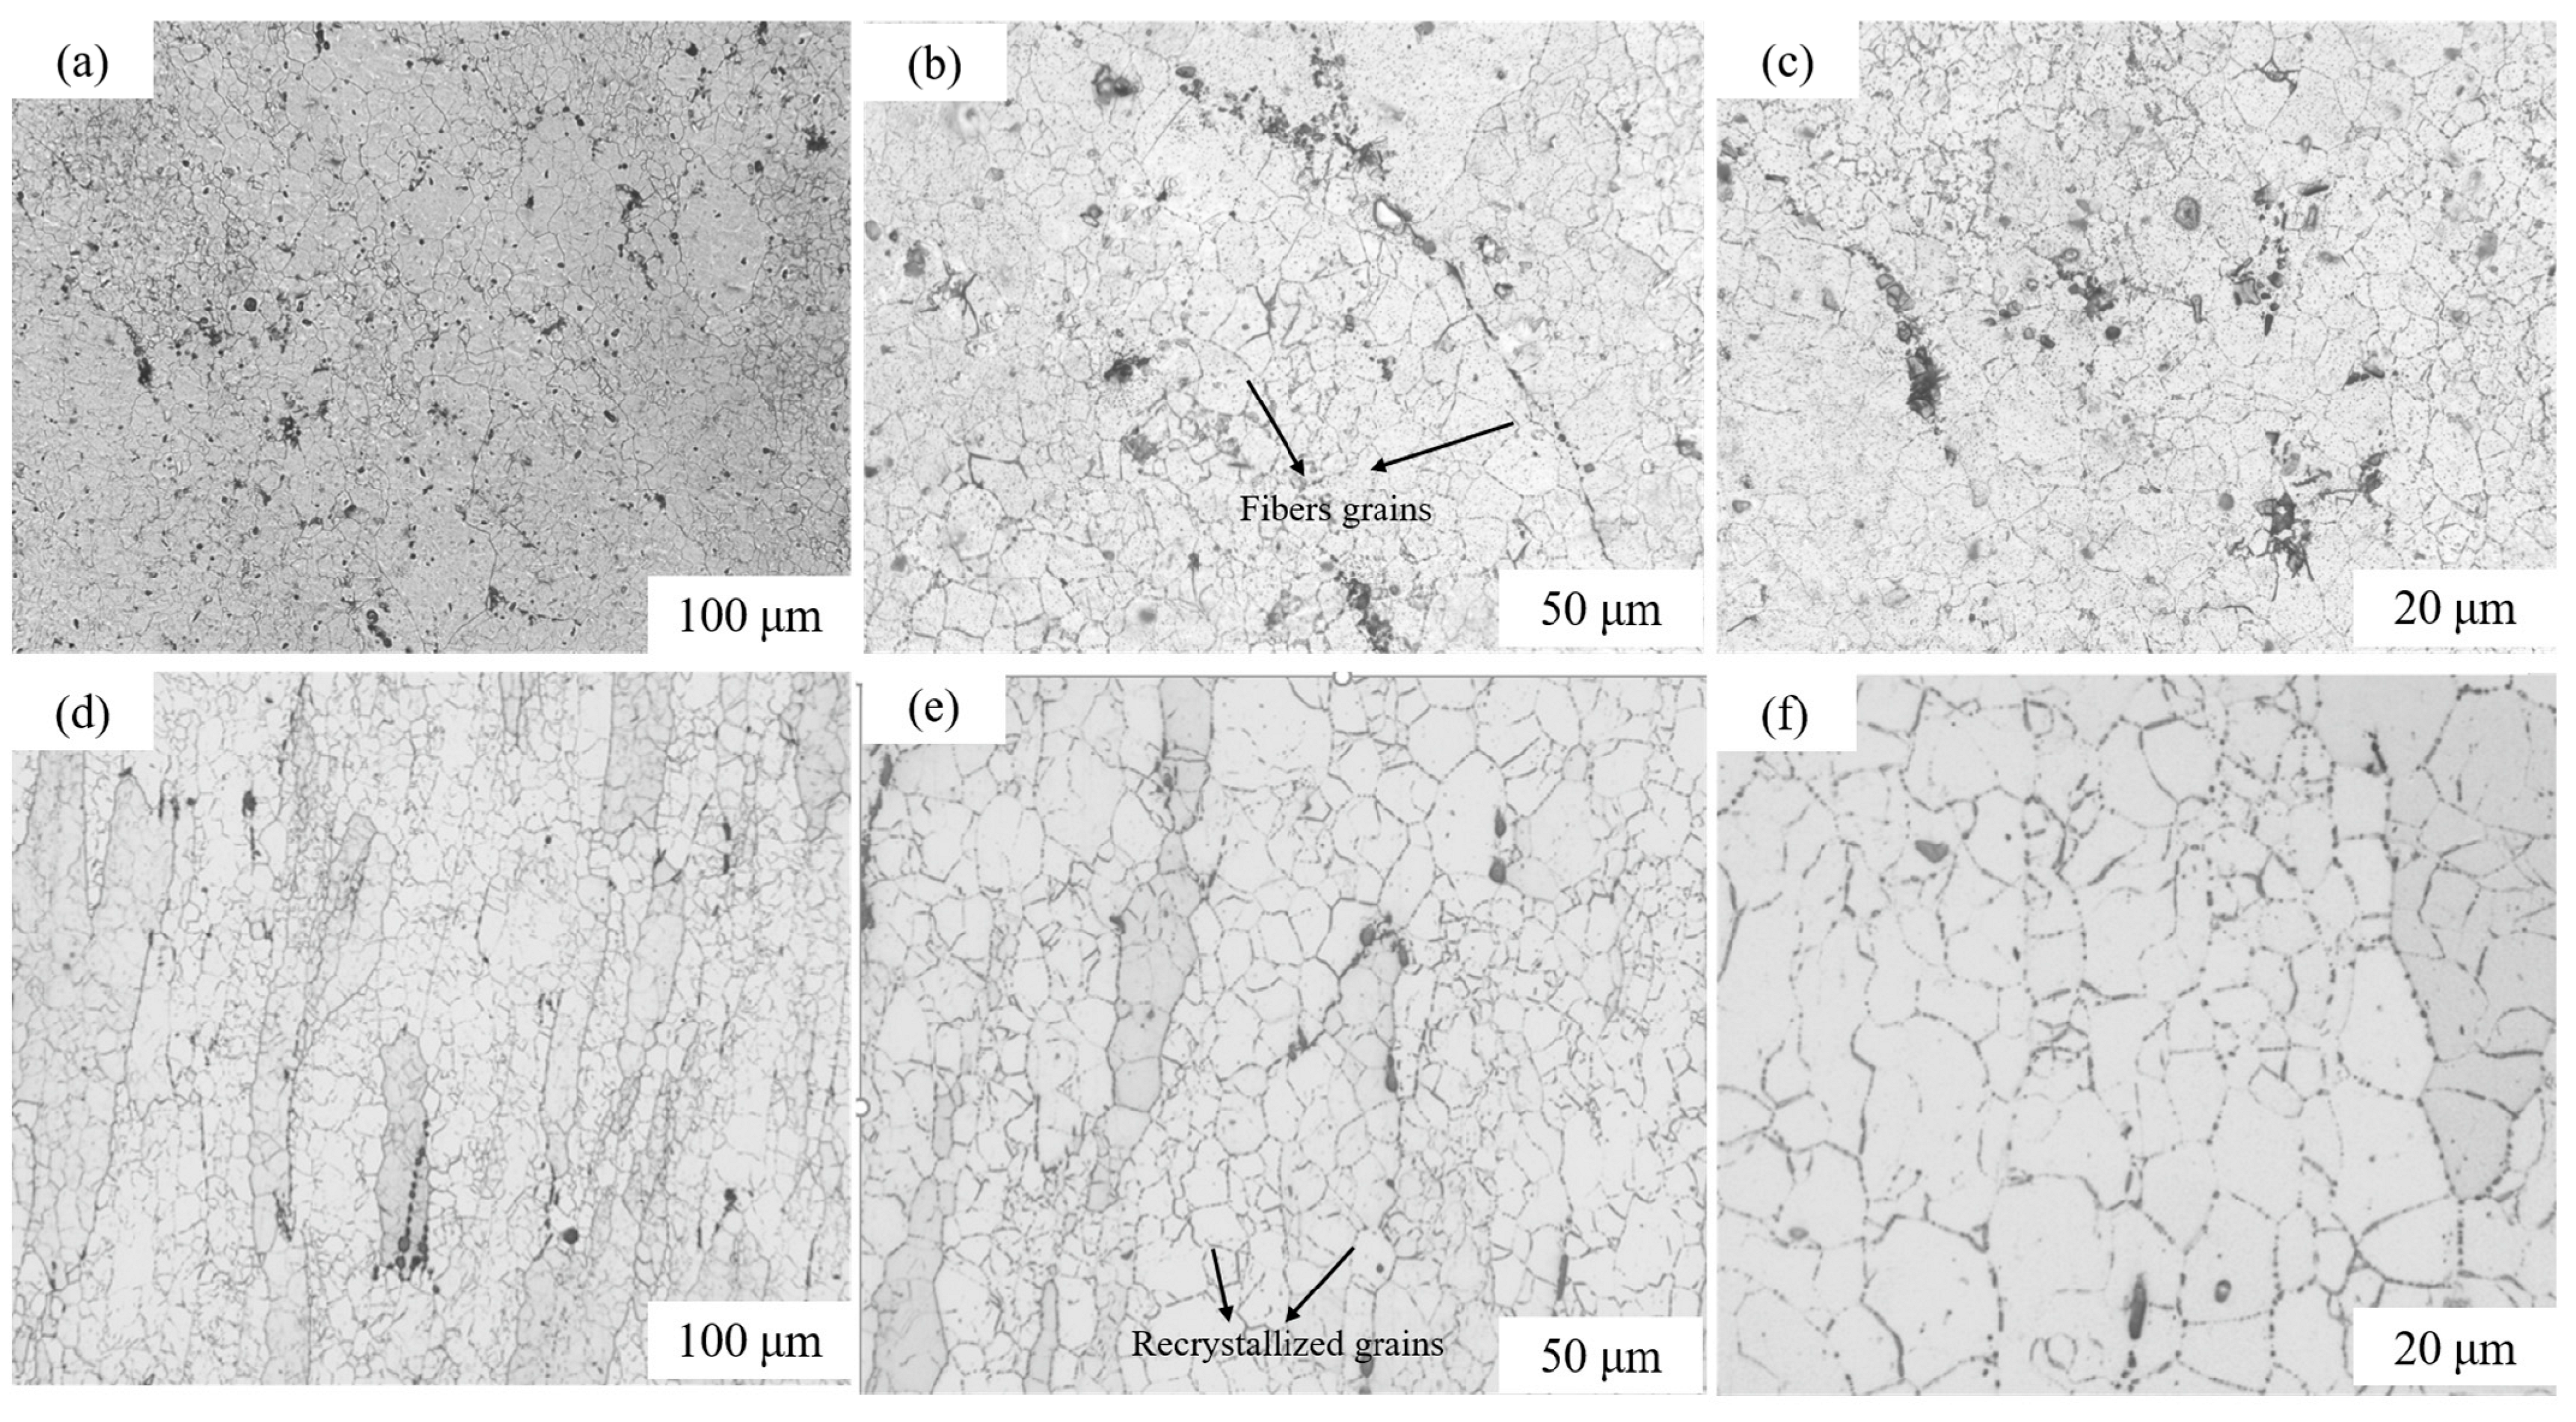
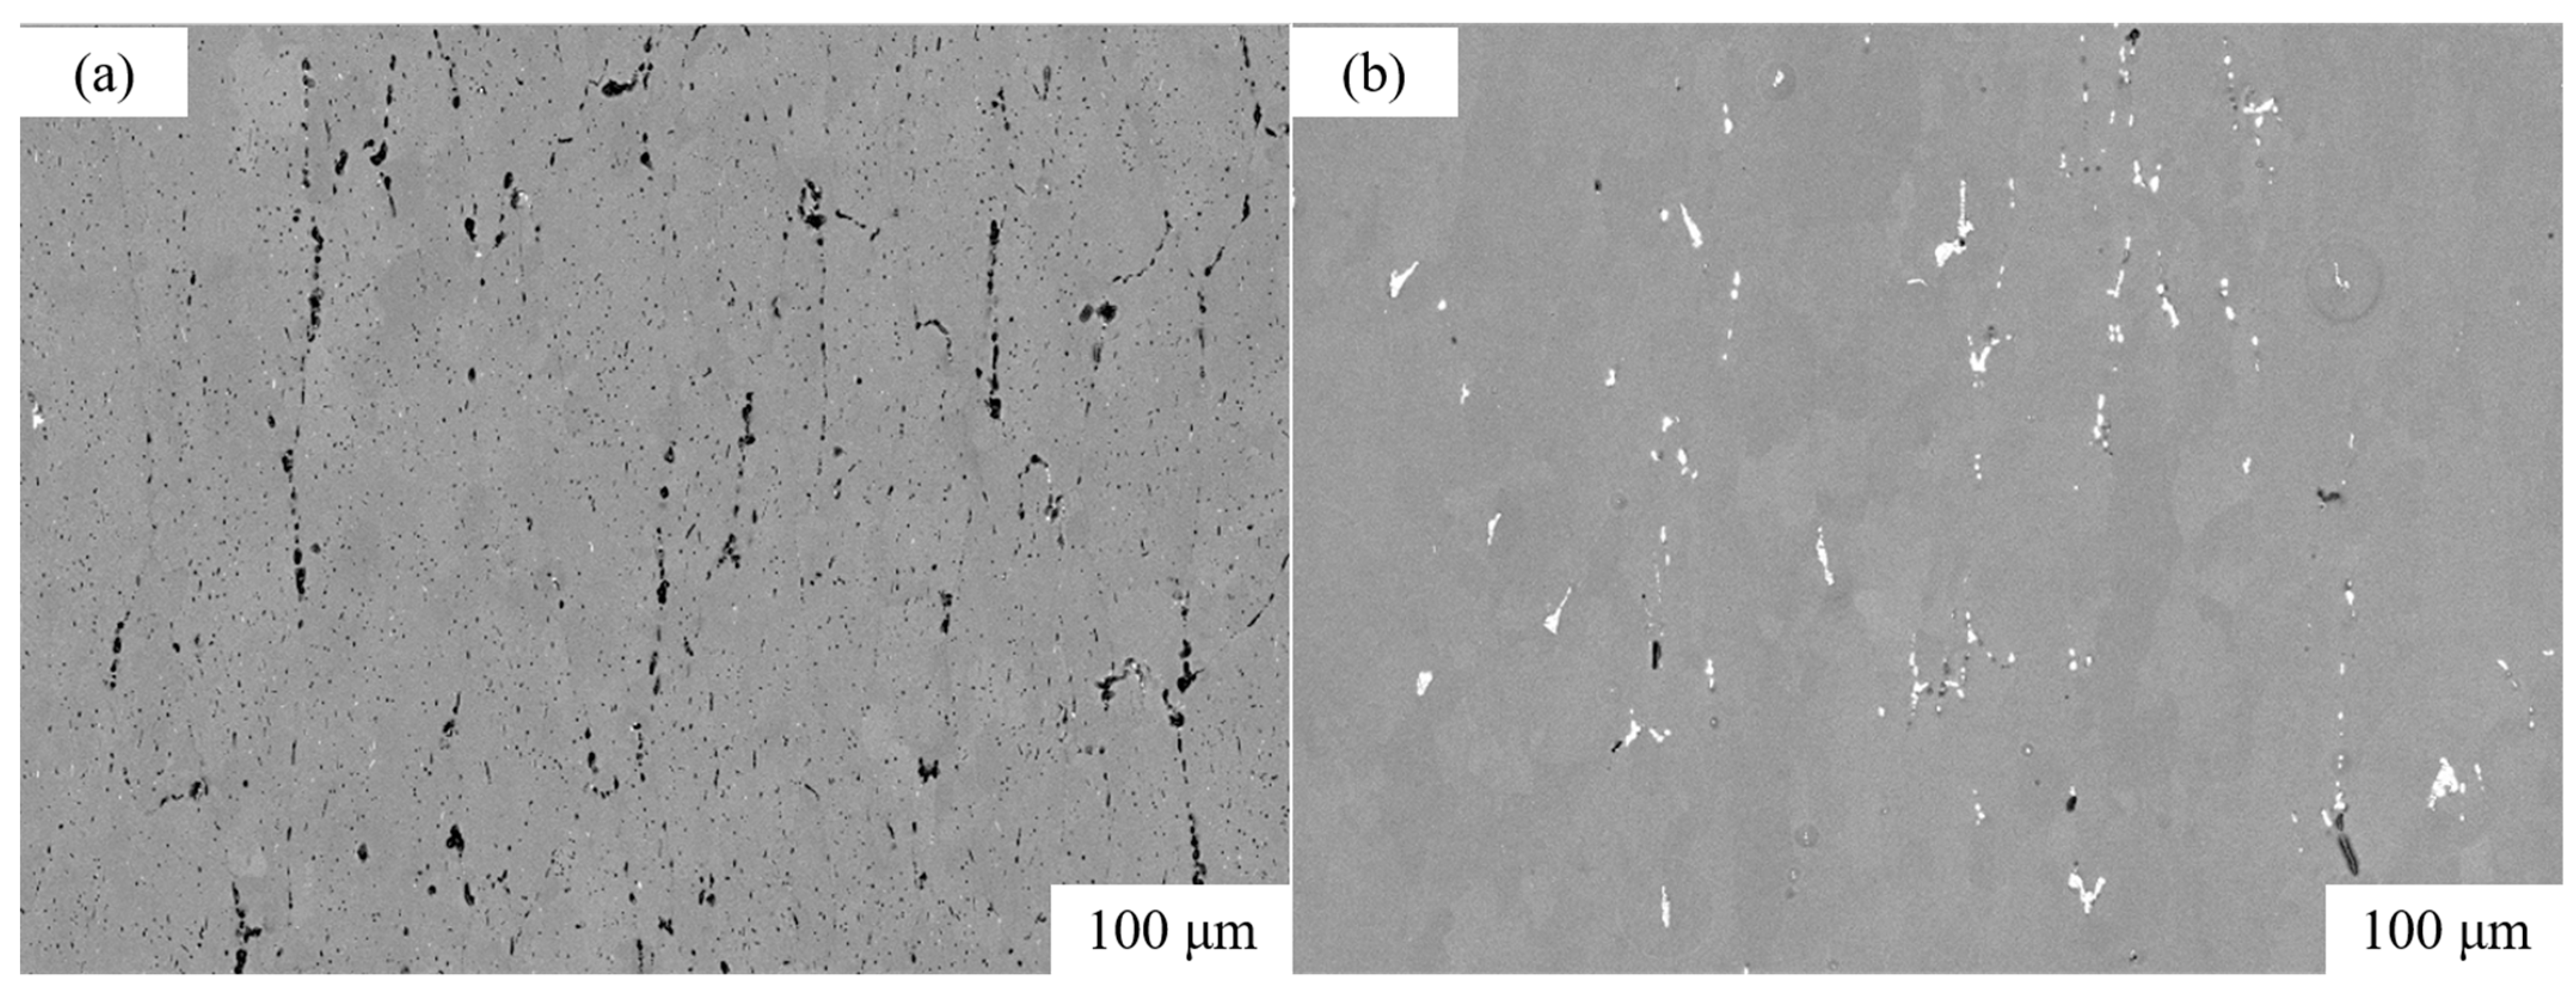
The stress-strain curves of the 7050 alloy at room temperature in three states (forged state, solid solution state, and annealed state after forging) were obtained and depicted in Figure 2. From the comparison, it can be concluded that the solid solution-stated alloy has greater strength, plasticity, and fracture toughness. Firstly, as shown in Figure 3a–c, the grains in the wrought state were fibrous. After quenching, the grain is equiaxial (shown in Figure 3d–f), indicating that the treatment enhances recrystallization grain generation [12,13,14]. The volume fraction of recrystallized grains of 7050 alloy before and after solid solution treatment is measured by the software Image-Pro-Plus 6.0 (Media Cybernetics Inc., Rockville, MD, USA). The values are 18.9% and 52.6%, respectively. The volume fraction of recrystallized grains of 7050 alloy measured in other experiments is shown in Figure 4 [15,16,17]. The treatment can enhance the recrystallization of the 7050 aluminum. The recrystallization reduces intragranular dislocation density and intragranular-grain boundary strength differences, which will decrease work-hardening and increase plasticity. Secondly, the supersaturated solid solution generated in the treatment will finally transfer to the strengthening phase (the white region of the SEM image in Figure 5b), which will pin dislocation and improve the alloy strength [18]. Thirdly, the coarse second-phase particles of the alloy (the black part in Figure 5a) lessened during the treatment [19]. The coarse particles (above 2 nm) of 7050 alloy decreased by about 70% after solid solution treatment [20]. The refined particles hinder void generation and crack propagation to enhance the fracture toughness of the 7050 alloy.
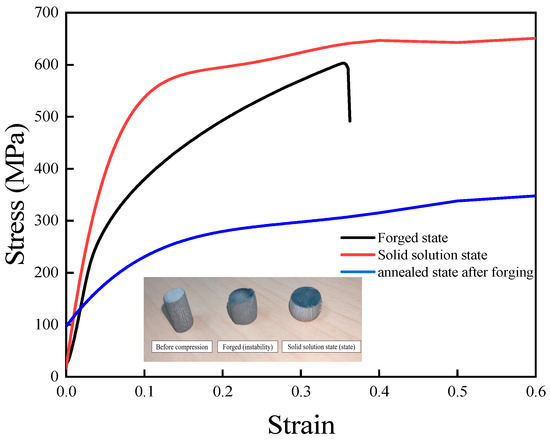
Figure 2.
Stress-strain curve for room temperature compression of 7050 alloys in different states.
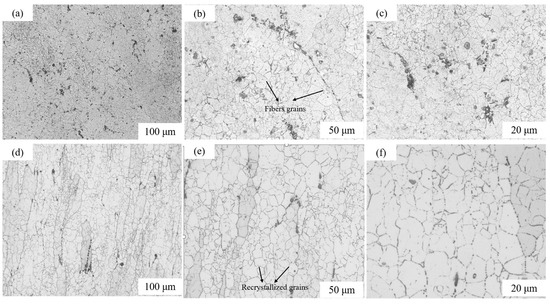
Figure 3.
Optical micrographs of 7050-aluminum alloy before and after solid solution treatment (a–c) Before solid solution treatment; (d–f) After solid solution treatment.
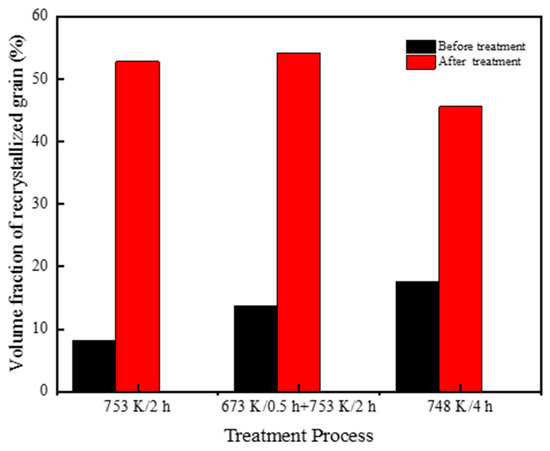
Figure 4.
The volume fraction of recrystallized grains before and after solid solution treatment [15,16,17].

Figure 5.
SEM images of the 7050 alloy (a) without heat treatment; (b) after quenching.
The true stress-strain curves of aluminum in the solid solution state at elevated temperatures from 333 K to 523 K at different strain rates are shown in Figure 6a–c. All curves could be divided into three distinct stages. In the first stage, the flow stress increases linearly with strain, and only elastic deformation predominates. In the second stage, plastic deformation happens and flow stress slowly increases. In the third stage, the flow stress will approach saturation and weave. Furthermore, it is seen that flow stress is negatively correlated with deformation temperature. The microstructure evolution (precipitation or recrystallization), deform-mechanism conversion (shear mechanism to Orowan mechanism), and reduction of dislocation movement resistance occurring at warmer temperatures can all alter the flow characteristics and decrease flow stress [21,22,23]. At lower temperatures, only the strain-hardening tendency exhibits itself in the curve. When the deformation temperature is approximately 423 K, the work hardening occurs first, and then the 7050 alloy begins to soften at a higher plastic strain. The tendency for flow softening becomes more obvious at warmer deformation temperatures. Moreover, the flow stress of solid solution-state 7050 alloys has a positive correlation with strain rate. At high strain rates, dislocation density and dislocation slip velocity increase, resulting in a magnification of dislocation interaction and deformation resistance [24,25]. Additionally, at the same compression temperature, the amplification of flow stress with increasing strain rate is roughly the same. It is due to the balance of work hardening and deformation thermal softening at medium temperatures [26]. The strain rate effect of solid solution 7050 aluminum alloy is not obvious during the medium-temperature compression process, and the stress-strain curve is not sensitive to the strain rate [27].
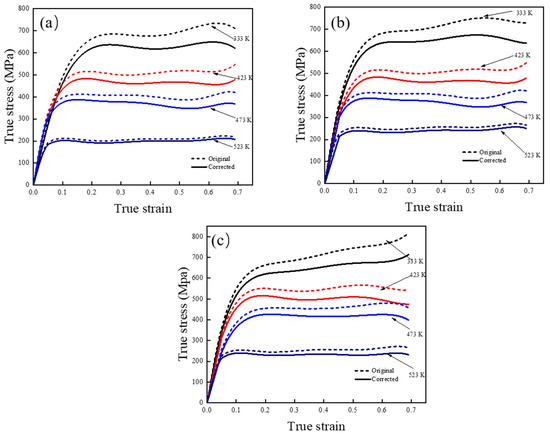
Figure 6.
The flow stress of solid solution-state 7050 alloy in different conditions: (a) 0.001 s−1; (b) 0.01 s−1 (c) 0.1 s−1.
In compression tests, the friction will change the stress state, leading to heterogeneous deformation and non-negligible errors in the obtained flow stress, although the necessary lubricant was applied [28]. Friction correction is necessary for the accurate calculation of flow stress. The correction method is expressed in Equation (1) [29,30]:
where σ is the corrected stress, 𝜎̅ is the measured stress without correction, and ε is the strain, respectively. For this specimen, R0 and h0 respectively, represent the initial radius and height of the compressed sample (unit: mm). The R0-value is 4 and the h0-value is 12 for this compression. Additionally, m is the friction factor for warm upsetting, and the value is 0.2. Compared with the flow stress with and without correction, the measured values are significantly higher than the actual ones. The deviation increases with strain due to the incremental contact area. Also, the work-hardening effects are reduced after correction.
3.2. Construction and Comparison of Constitutive Models
The flow stress in the room and at medium temperature can be analyzed using Hollomon [31], Swift [32], Ludwigson [33], and Voce hardening models [34]. All constitutive models are shown in Equations (2)–(4) below:
where σ is the true stress in the compression, ε is the true strain, n is the strain hardening index, σ0, ε0, k and A are material constants.
Besides, some classical viscoplastic models, such as the Arrhenius-type model [35,36,37] and the Johnson–Cook model [38], were applied for comparison. The two models are shown in the equation as follows:
where α, and n are material constants. Q is the activation energy of plastic deformation (J/mol); R is the gas constant; and T is the temperature.
where A, B, and C are material constants. is the reference strain rate; is the relative temperature.
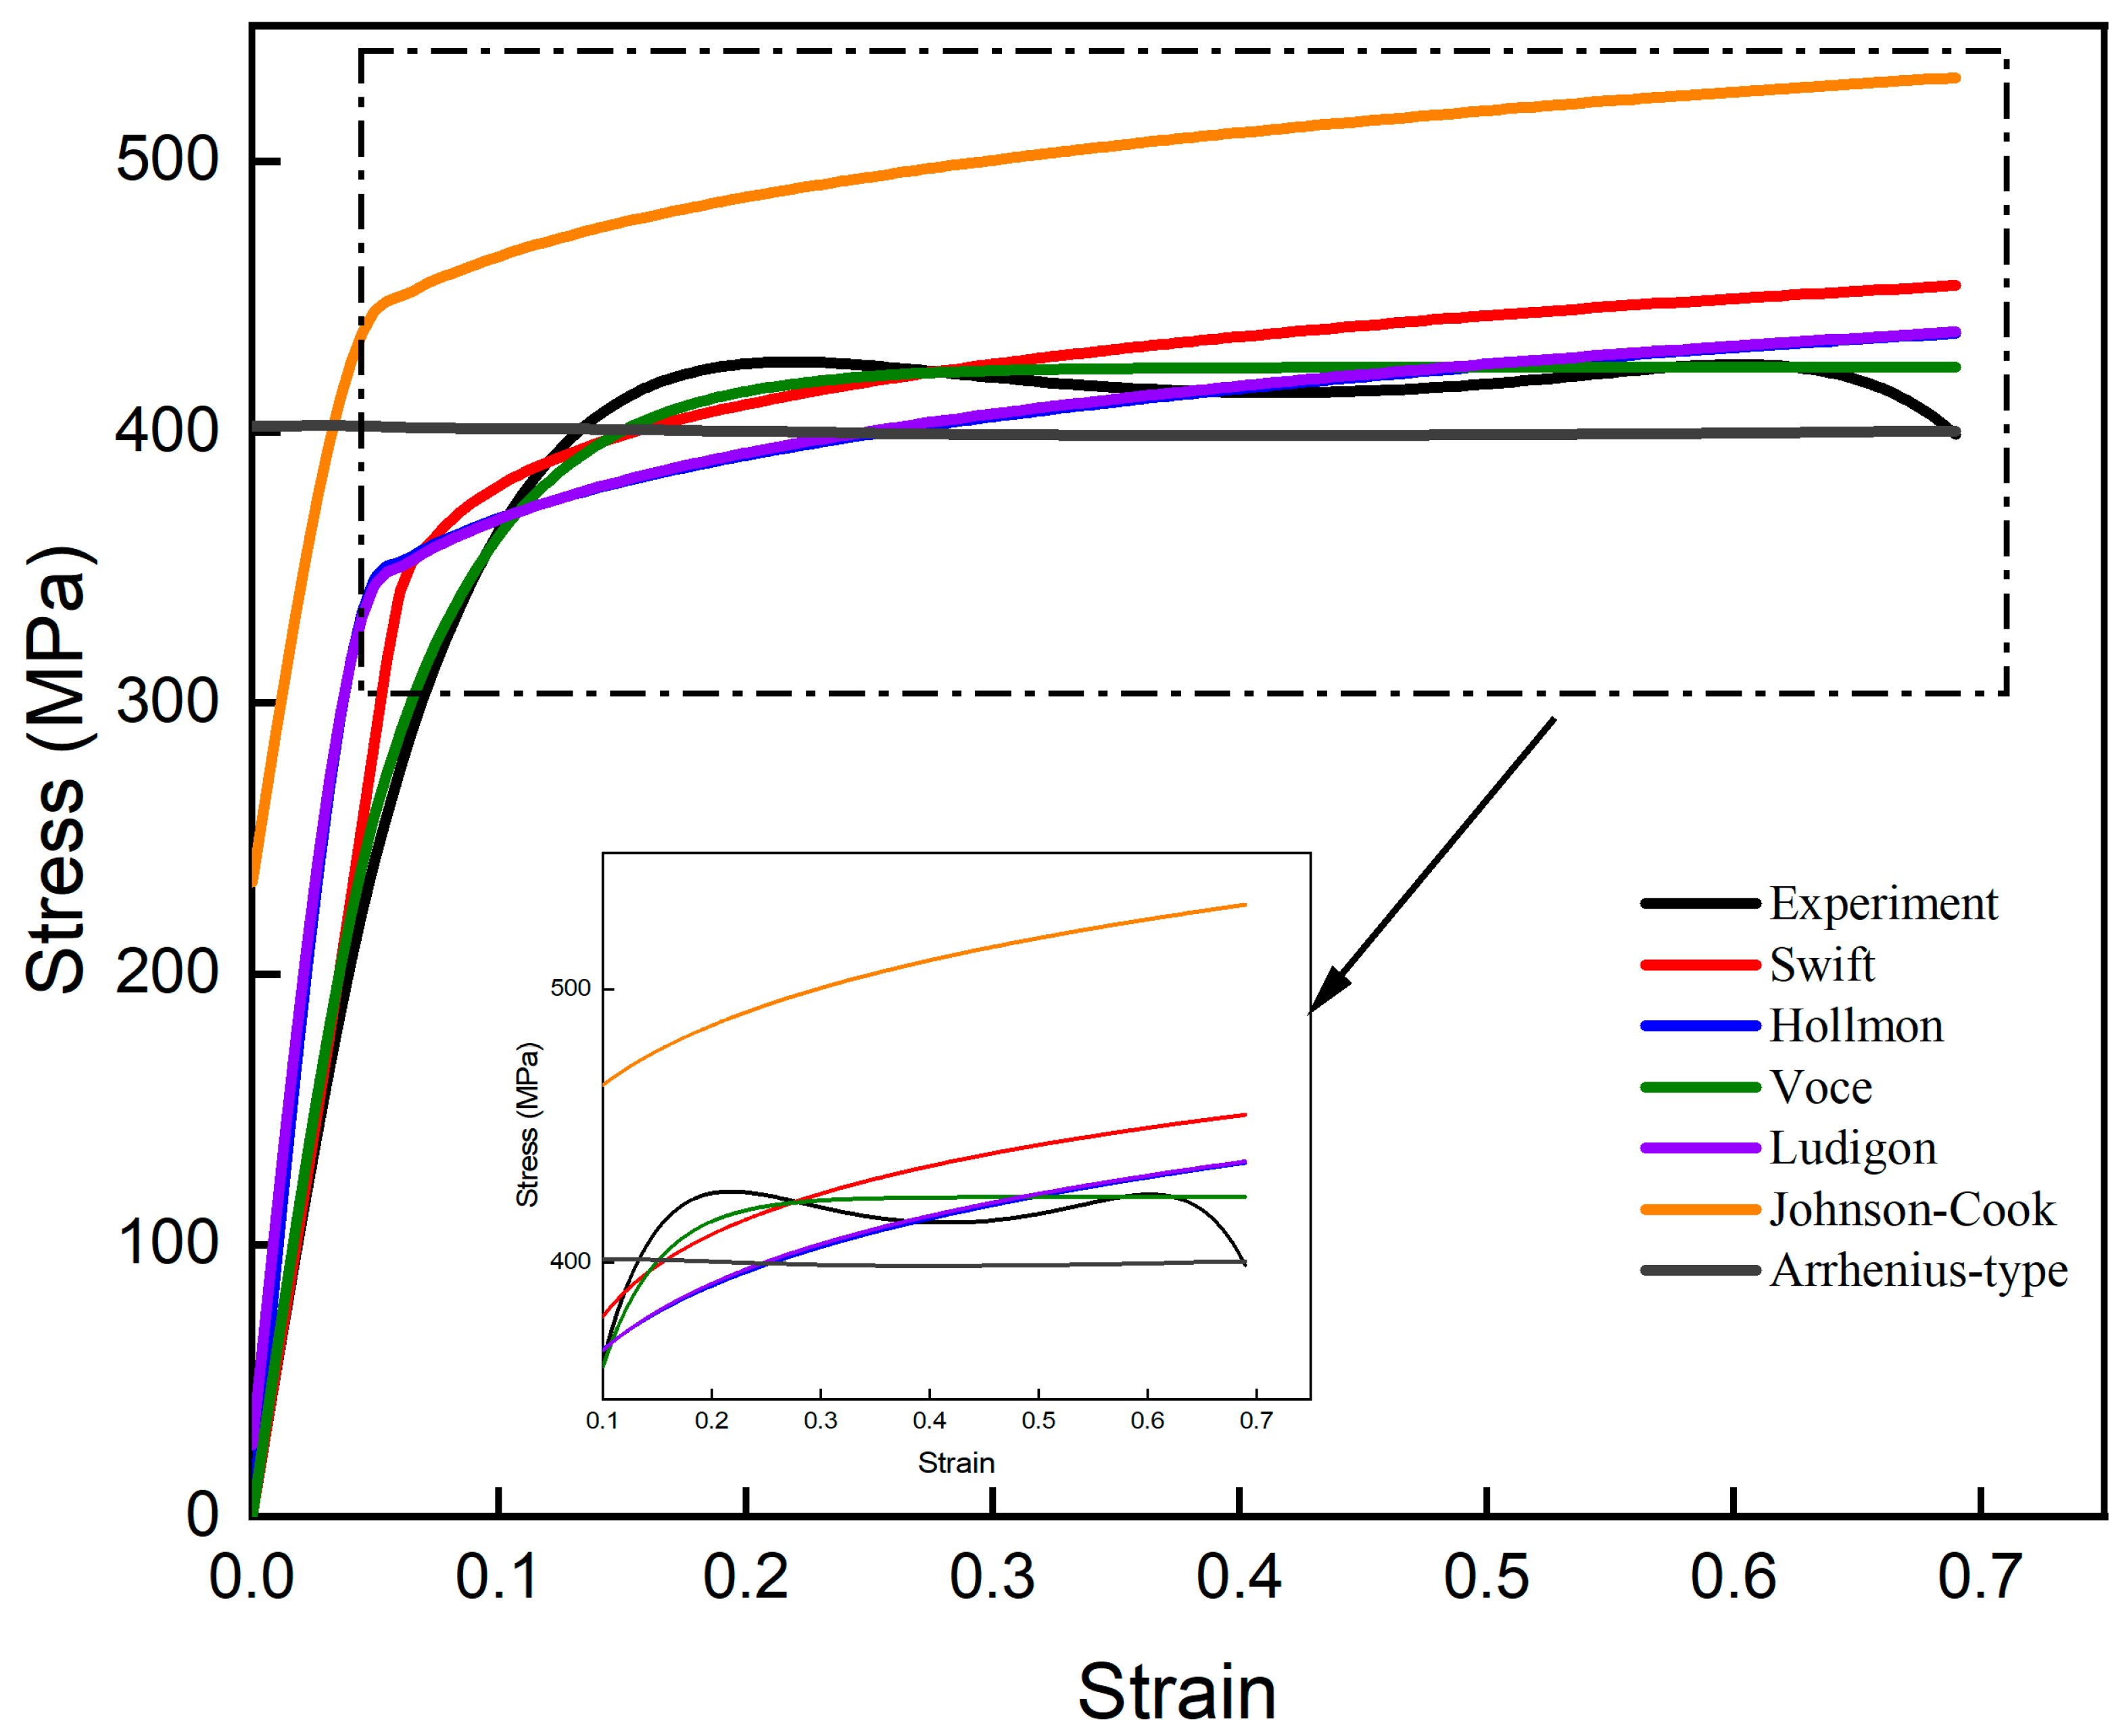
In the above equations, all the parameters are obtained by the reference or fitted by the Levenberg-Marquardt approach. The predictions of the flow stress at 423 K and 0.1 s−1 by the four models are shown and compared in Figure 7. The fitting degrees of the four models are different, and the order of priority is as follows: Voce > Swift > Ludwigson > Hollmon > Johnson-Cook > Arrhenius. The Arrhenius-type model uses a hyperbolic sine function to predict the flow stress of the material, and it cannot accurately predict the hardening behavior of the alloy at medium temperature. The unsaturated models (Johnson-Cook, Swift, Ludwigson, and Hollmon) utilize a certain exponent to predict the flow stress with strain hardening. The flow stress calculated by the models was greatly less than the measurement before the peak point. Due to the identical hardening exponent in the models, flow stress in the middle and late stages of compression will be exaggerated. [39]. However, for the saturation models (Voce model), it can better fit the different hardening rates at different states with variable exponents, and it can also better predict the saturated flow stress at stable states. For solid solution-state 7050 alloy during warm compression, the flow stress has a saturated value after the hardening stage, and the voice-type model is best for prediction.

Figure 7.
Fitting results of the flow stress at 423 K in 0.01 s−1.
3.2.1. Voce-Type with Softening Coefficient
The original Voce model ignores the softening in high strain and the effects of temperature and strain rate on flow stress. To improve accuracy, a Voce-type with a hardening and softening coefficient is employed to describe the deformation behaviors with saturated flow stress at room and medium temperatures as follows [40,41]:
where σ is the flow stress (unit: MPa), T is the absolute temperature (unit: K), is the strain strengthening index, and stands for the softening index. Besides, β, m0, m1, r0, and r1 are dimensionless material constants.
Both sides of Equations (8) and (9) are taken as the natural logarithm and changed to Equation (10);
All the material constants in the Voce model can be determined from the corrected strain-stress curves. At a given temperature and strain, hardening and softening coefficients are fixed. Therefore, Equation (8) can be simplified as follows:
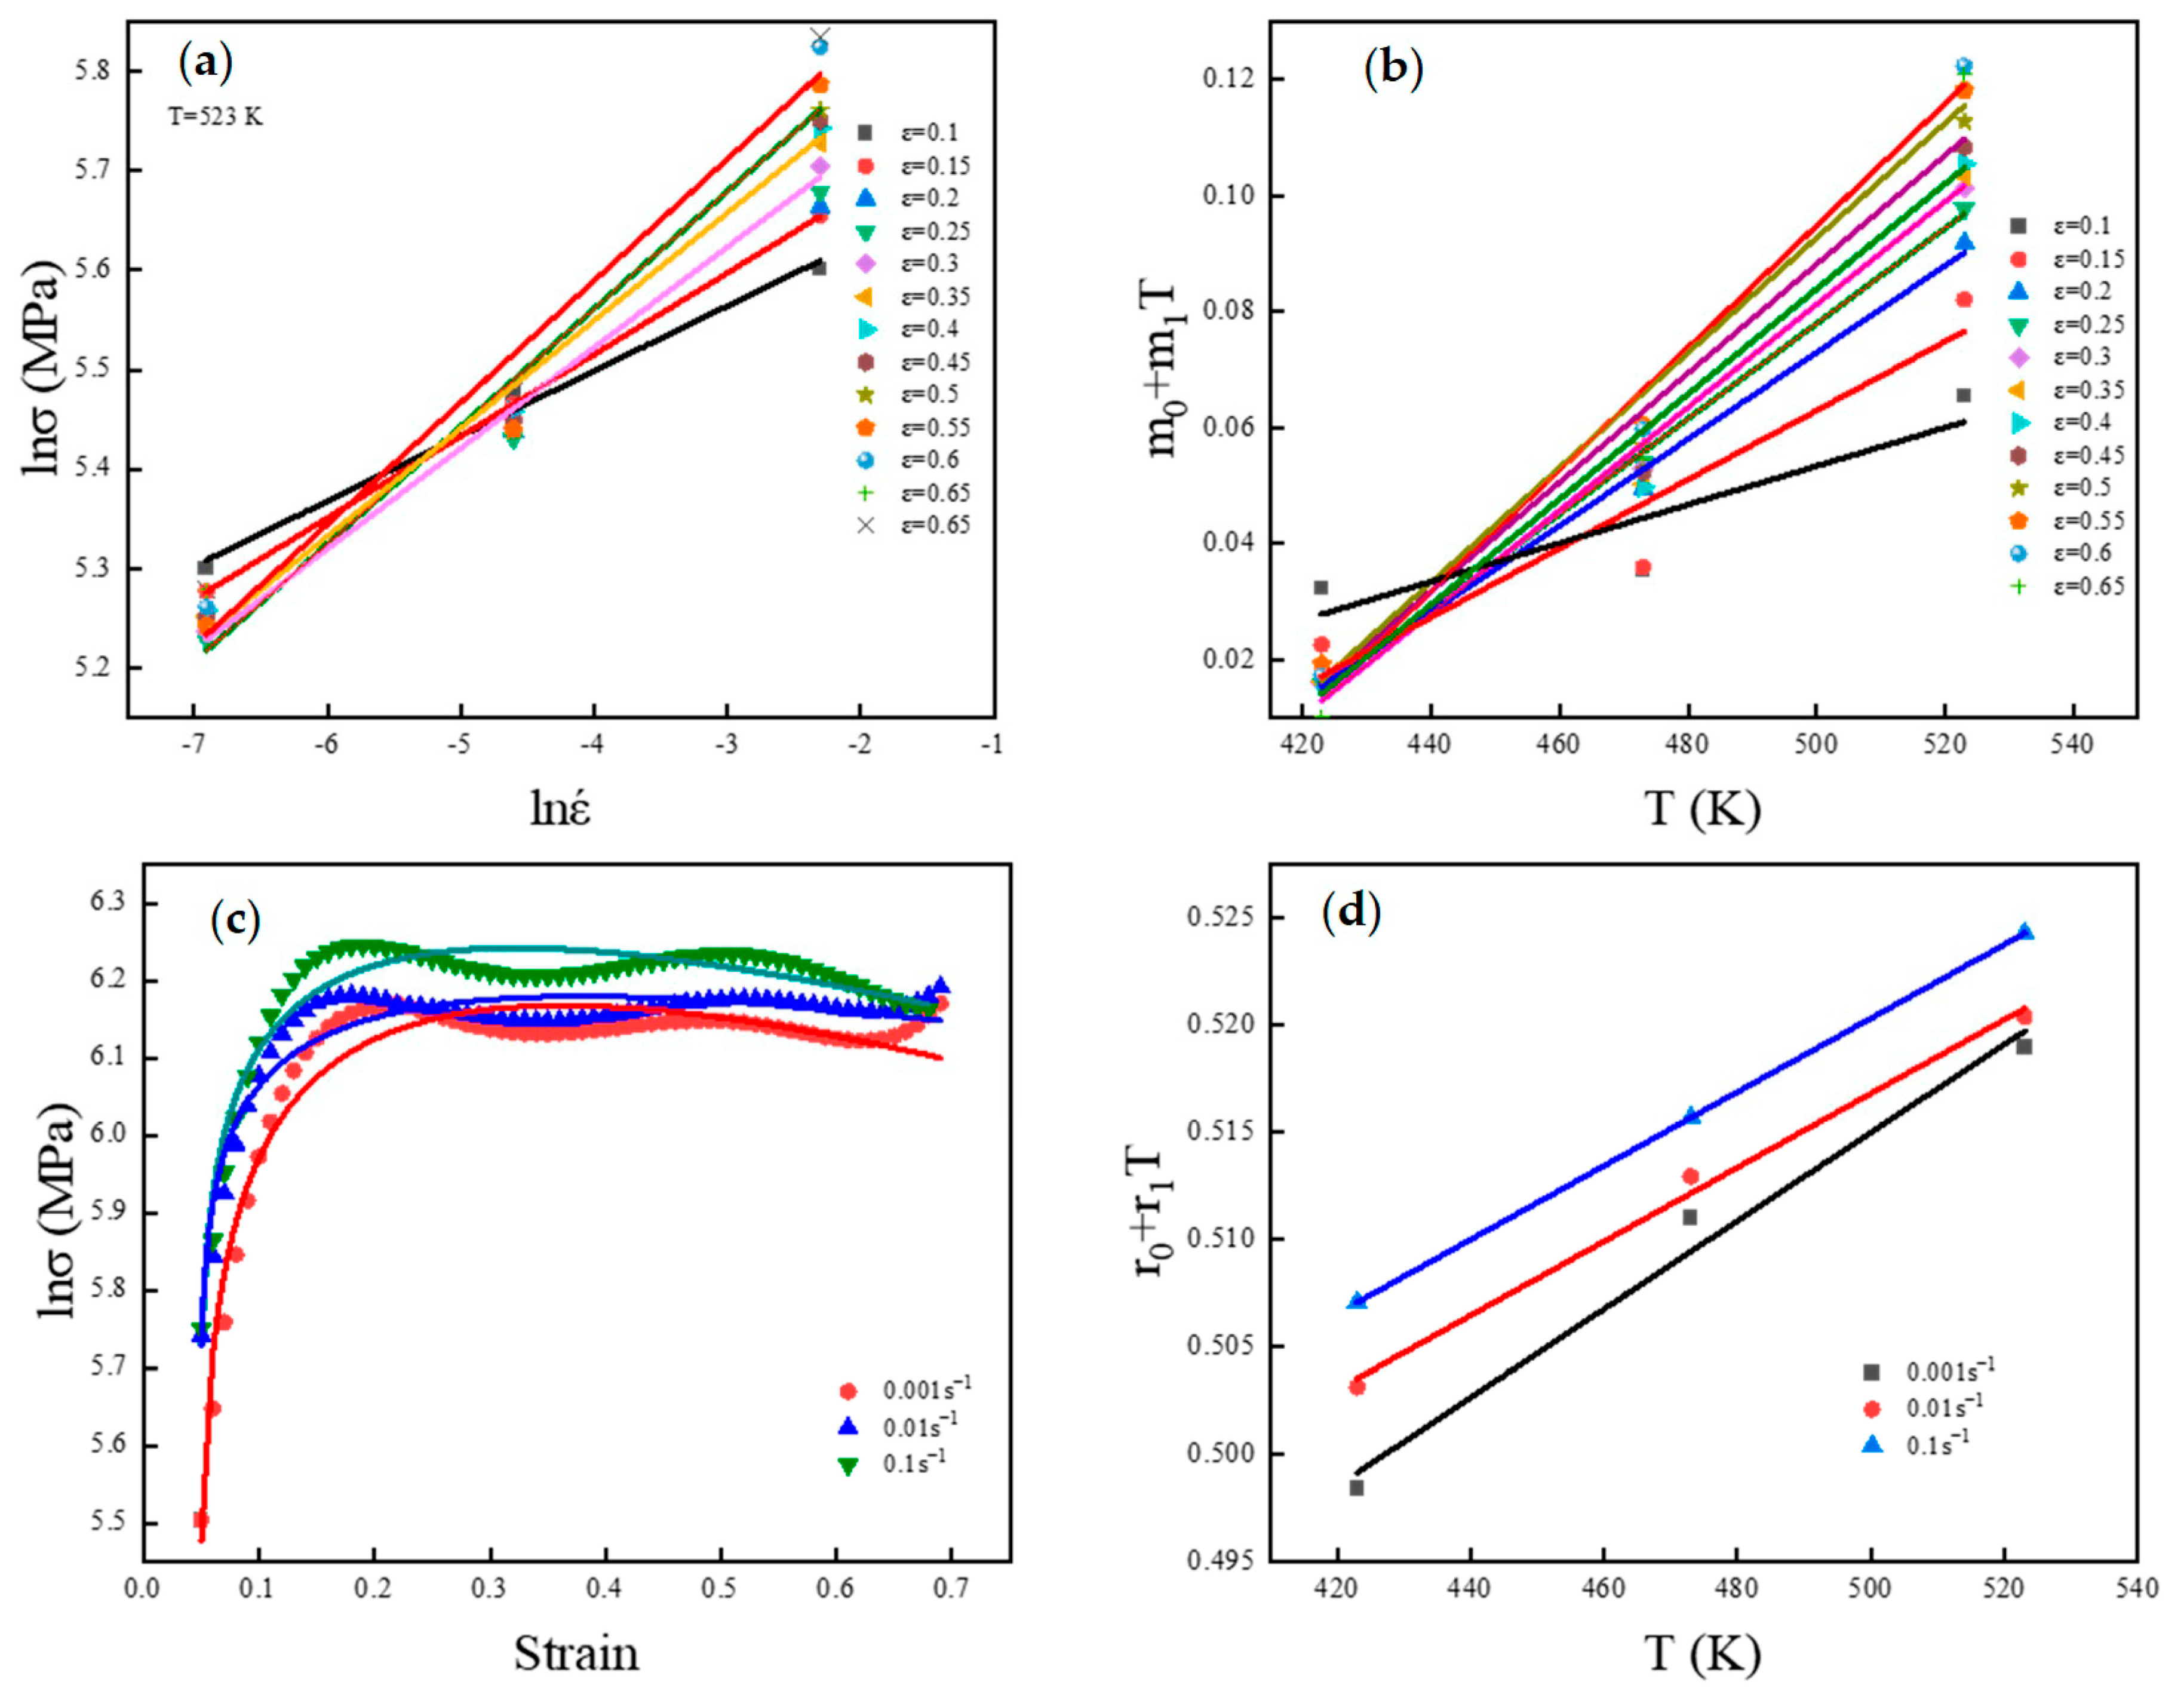
Therefore, m0 + m1T is the slope of lnσ-lnέ plot shown in Figure 8a. Then, the slopes in different conditions are shown in Figure 8b. The m0-value can be determined from the slope of plots, and the m1-value is obtained from the plots’ intercept in Figure 8b.
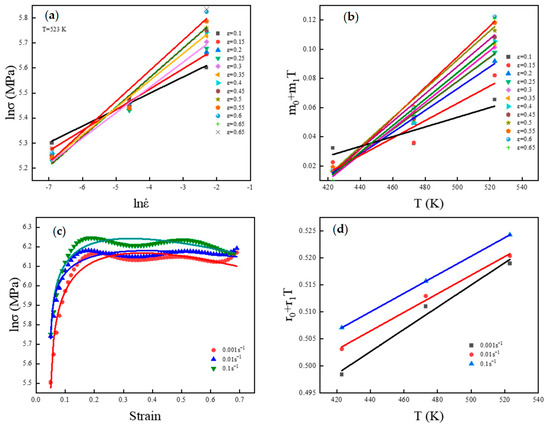
Figure 8.
Parameters fitting under different conditions: (a) lnσ-lnέ (b) m0+m1T-T (c) lnσ-strain (d) r0 + r1T-T.
At a given temperature, r0+r1T is a constant and is set to k3. lnk + nln (ε + ε0) + (m0 + m1T) lnε is also a constant at a certain temperature and the strain rate and should be set to K4. Equation (11) is changed to Equation (12);
Figure 8c shows the relation between lnσ and ε, and Equation (12) is employed to characterize the relationship. The fitting result reveals the value of the material constants in different conditions. Besides, k3-T plots are shown in Figure 8d. The slopes and intercepts of the plots were calculated to determine the r0-value and r1-value in the model. Similarly, the constants K and β can be obtained from the k4-T plots. All the material constants in the voce-type model are obtained, and the constitutive model is shown as follows:
3.2.2. Modified Voce-Type Model with Variable Parameters
The material parameters in the conventional voce-type model are invariable. However, they are influenced by temperature and other conditions in the warm deformation due to microstructure evolution, which decreases simulation accuracy. The modification to the constitutive model is that the wave of material parameters can be corrected. The modified constitutive model with variable material parameters includes two parts: the Voce constant prediction and parameter wave correction. The prediction of the Voce constant ( is based on the traditional model in Equations (8) and (9). Then, a corrected function is set as a compensation for the parameter wave in warm deformation. Therefore, Equation (8) can be rewritten as follows:
where σ is the flow stress (unit: MPa), T is the absolute temperature, and m0, m1, r0, r1, ε0 are dimensionless material constants. kT, Kε and Kε are the compensation coefficients that can be used to describe the effects of temperature, strain, and strain rate on flow stress respectively.
In the isothermal compression process, the deformation heat raises the alloy’s temperature and affects the deformation behavior [42,43]. Therefore, the coupling effect of strain and deformation temperature on material parameter evolution must be considered. Meanwhile, the flow stress of 7050 alloy at warm temperatures is not sensitive to the strain rate due to the balance between work hardening and deformation thermal softening. The interaction between strain rate and deformation temperature and material parameter evolution could be neglected, and the compensation can be described as follows:
where means interaction effect of strain and deformation temperature with compensation coefficients.
The aim is to fit the function between deformation conditions and compensation coefficients. The compensation coefficients in different conditions are calculated and shown in Figure 9. It could be seen that the compensation coefficients and strain rate are positively correlated. The parameters n and –(r0+r1T) in the FVoce part are constant, but they are positively correlated with the strain rate by calculation. When the strain rate is increased, the value of the FVoce part increases more slowly than the truth, resulting in a larger error at a higher strain rate. Moreover, as shown in Figure 9, the strain rate increases by 10 times, k increases by a certain multiple, which means the value of and logarithm of strain rate show an approximately linear relationship, and the -value can be predicted by a logarithmic function. Meanwhile, a polynomial approach as follows was applied for describing the interaction among kT,ε, strain, and temperature [44]:
where n is the polynomial order. Fitting the functions in different orders used the correlation coefficient (R) [45] (shown in Equation (13)) to evaluate the fitting precision, and the results are shown in Table 2.
where stands for the true value of Kc, is the calculation by a polynomial function, and stand for the mean-value of the true value and calculated value, respectively.
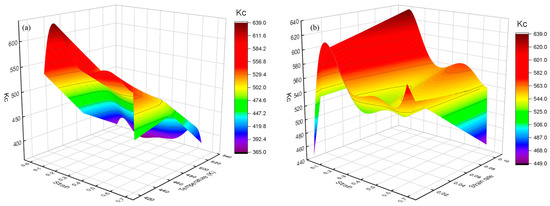
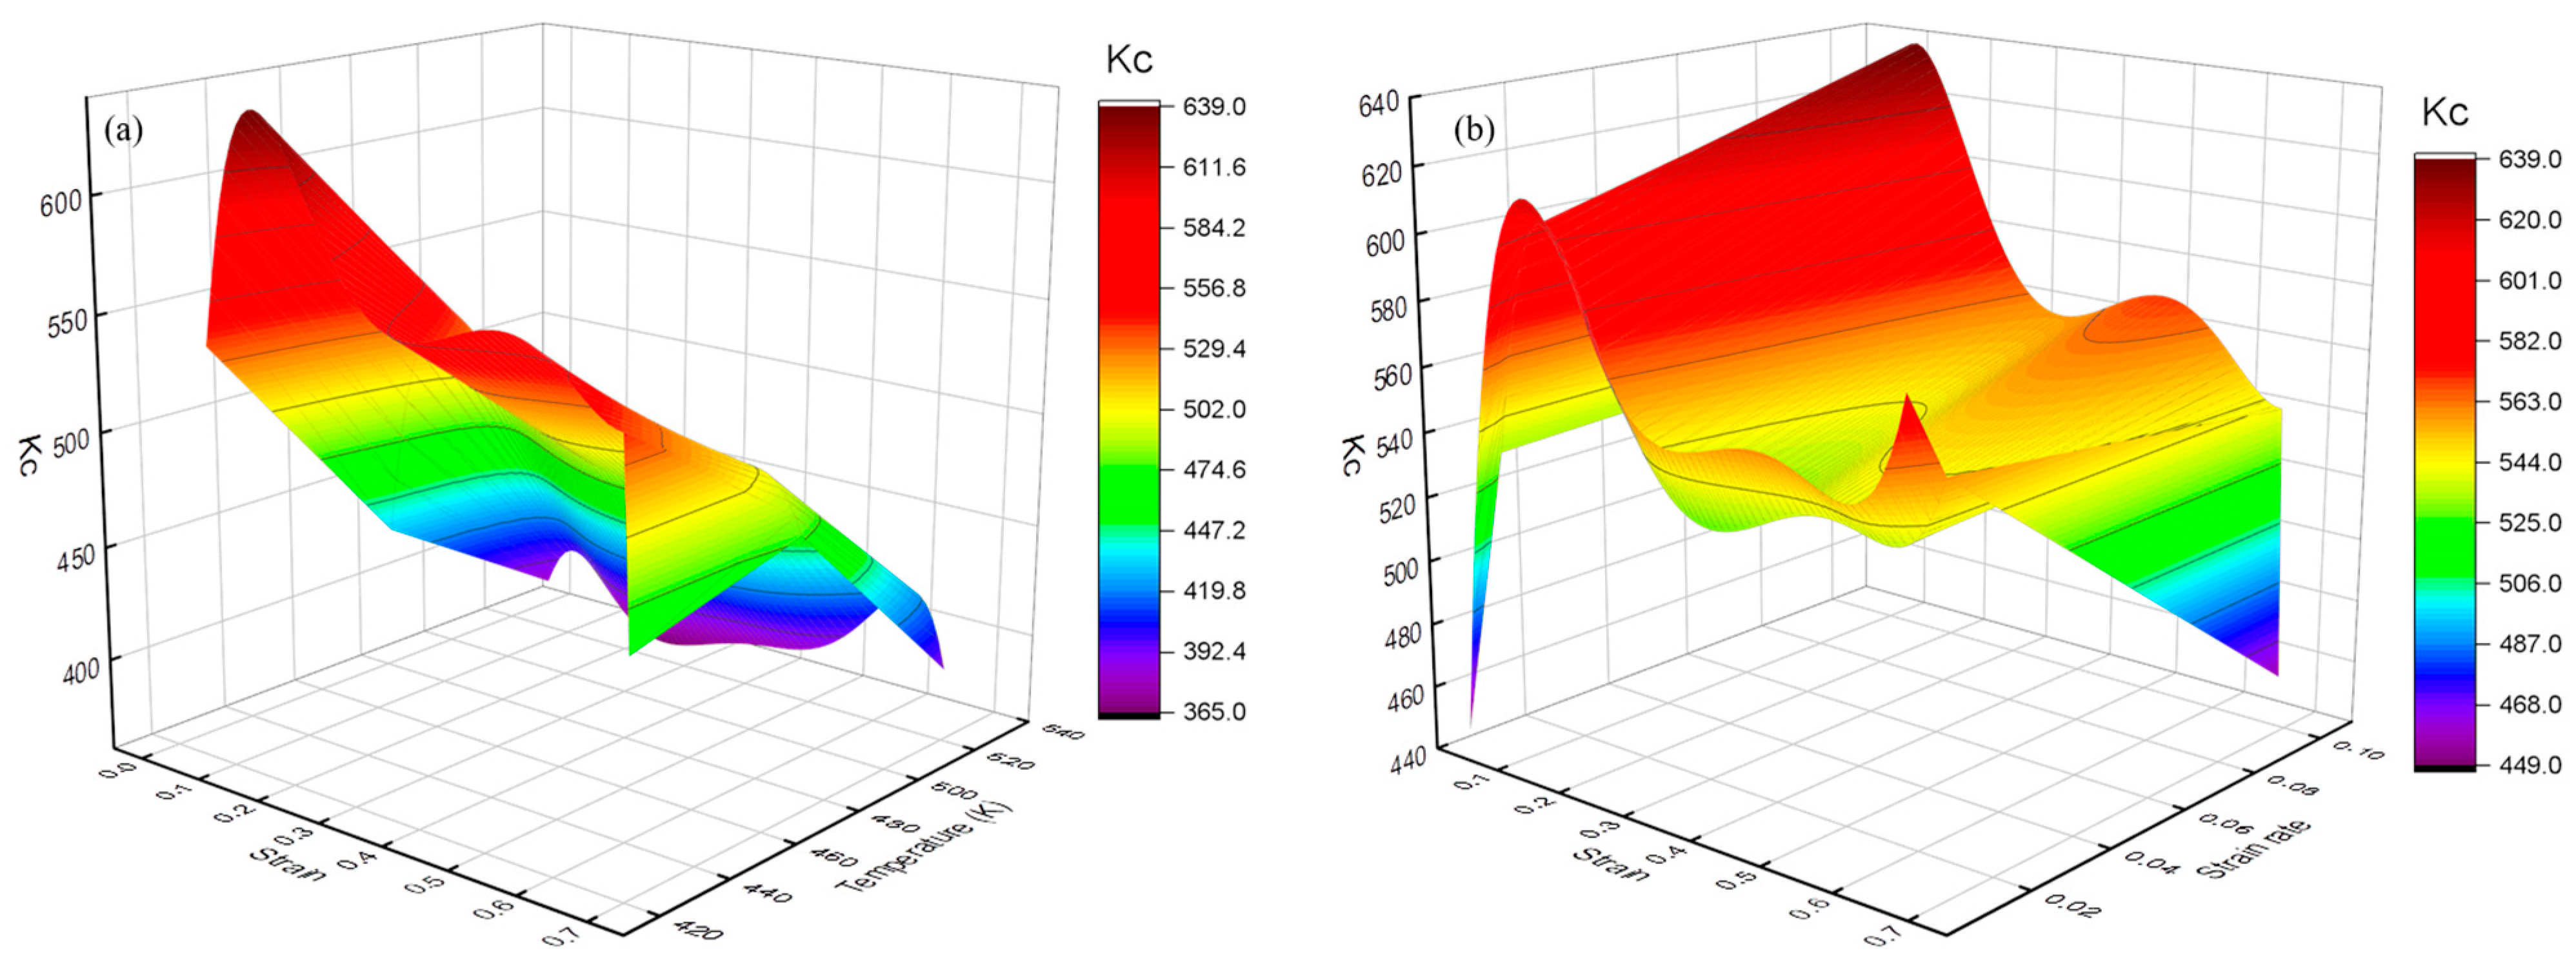
Figure 9.
The value of Kc in different conditions (a) Kc in different strains and temperatures (b) Kc in different strains and strain rates.
Table 2.
The correlation coefficient in different orders.
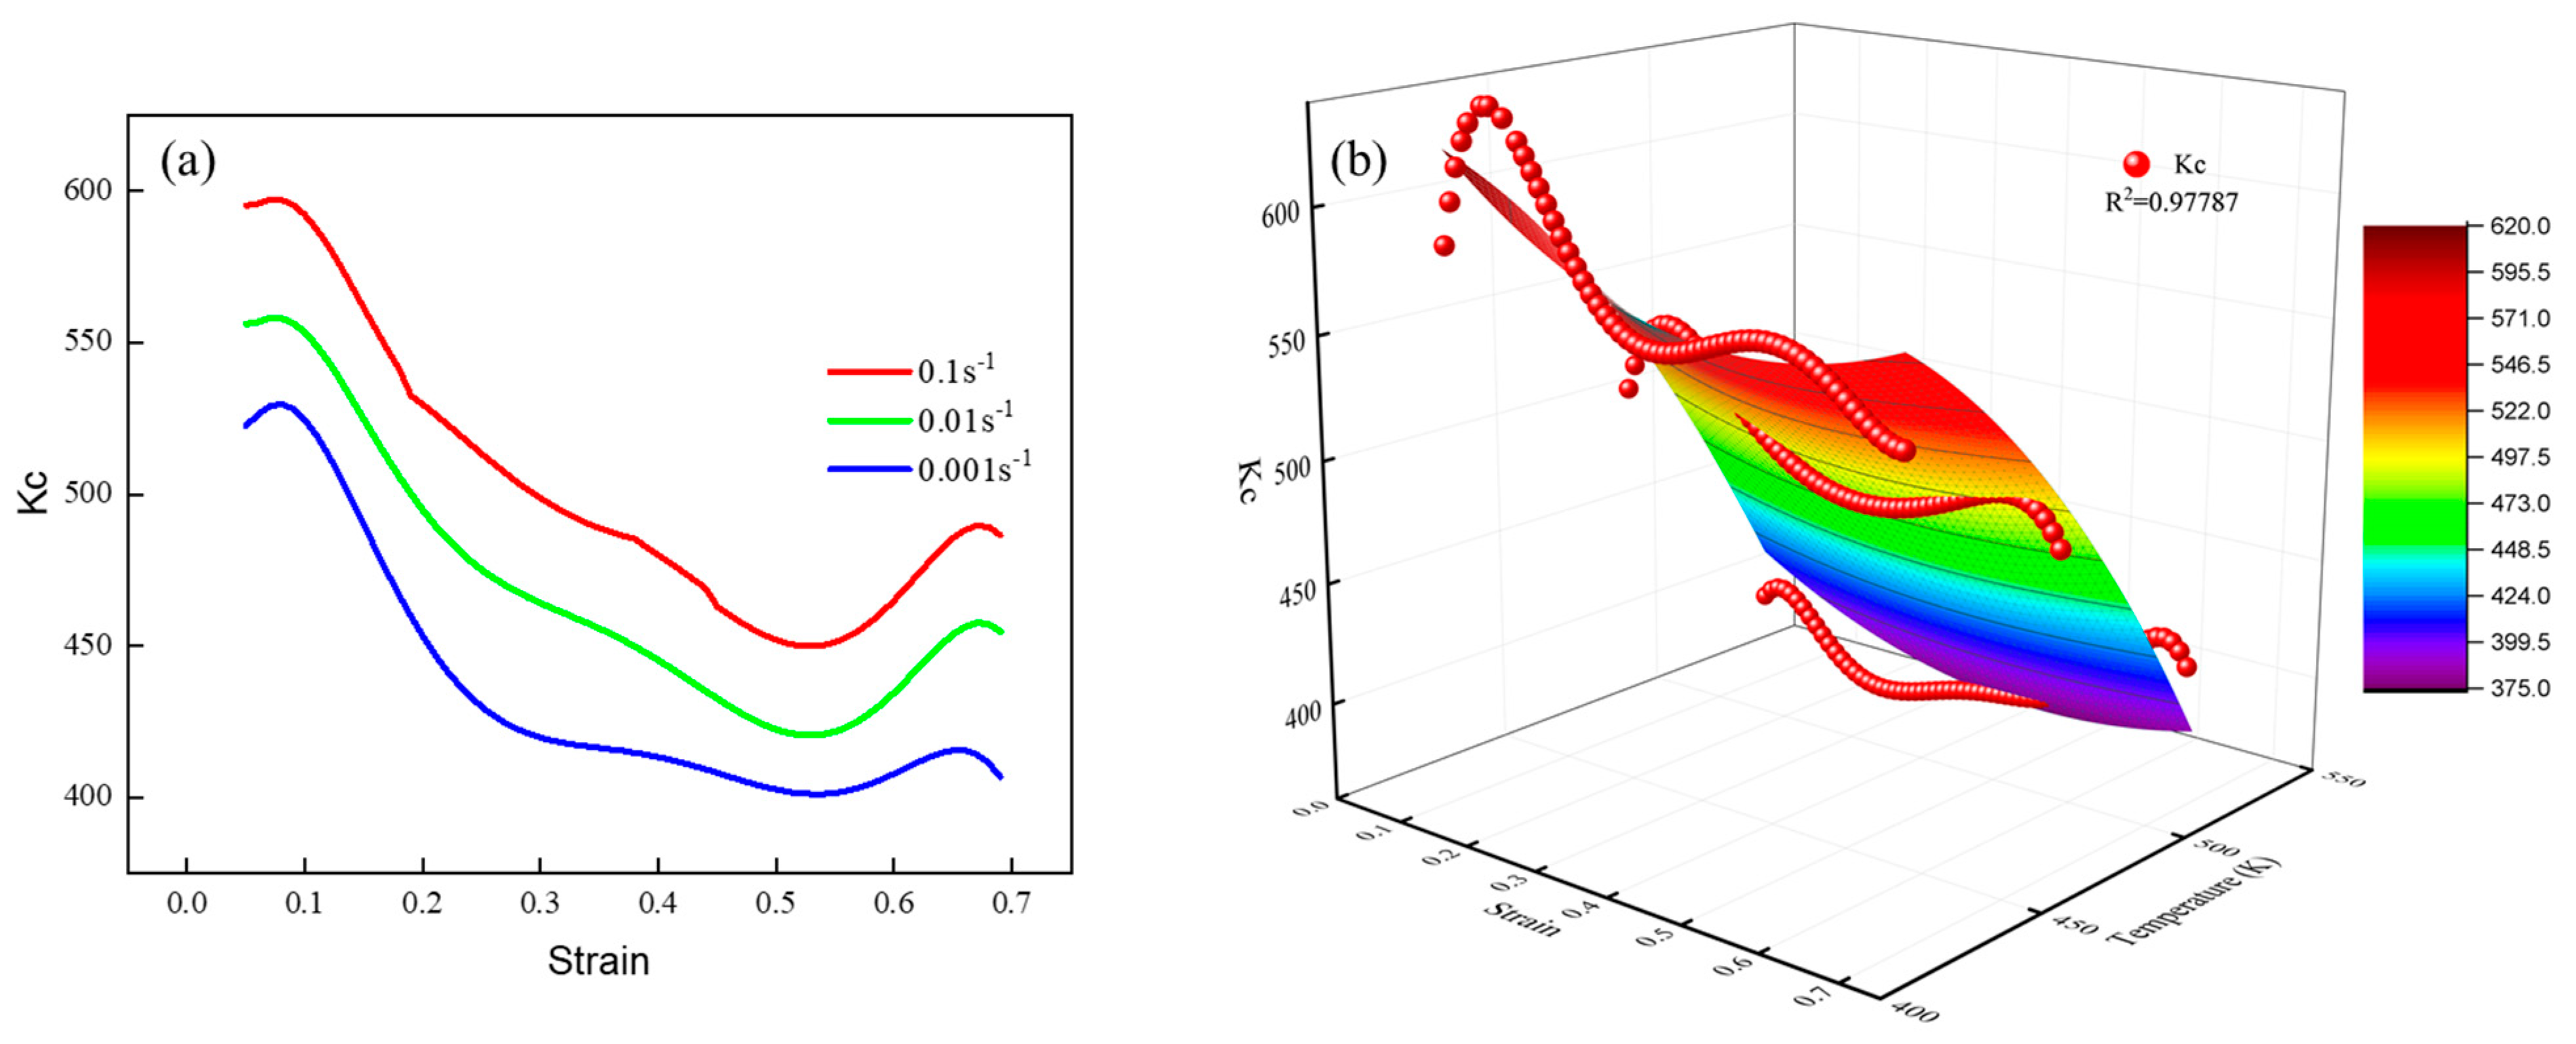
The correlation coefficients in the second to fifth orders are all above 0.95. To avoid the error of overfitting, a second-order polynomial function may be best for describing the interaction during the medium temperature range. The second-order polynomial function is shown in Figure 10b. Ultimately, the modified Voce-type constitutive model for 7050 alloy in medium-temperature compression is mathematically described below.

Figure 10.
The relationship between (a) strain, strain rate, and Kc; (b) strain, temperature, and Kc.
3.3. Constitutive Model Evaluation and Application
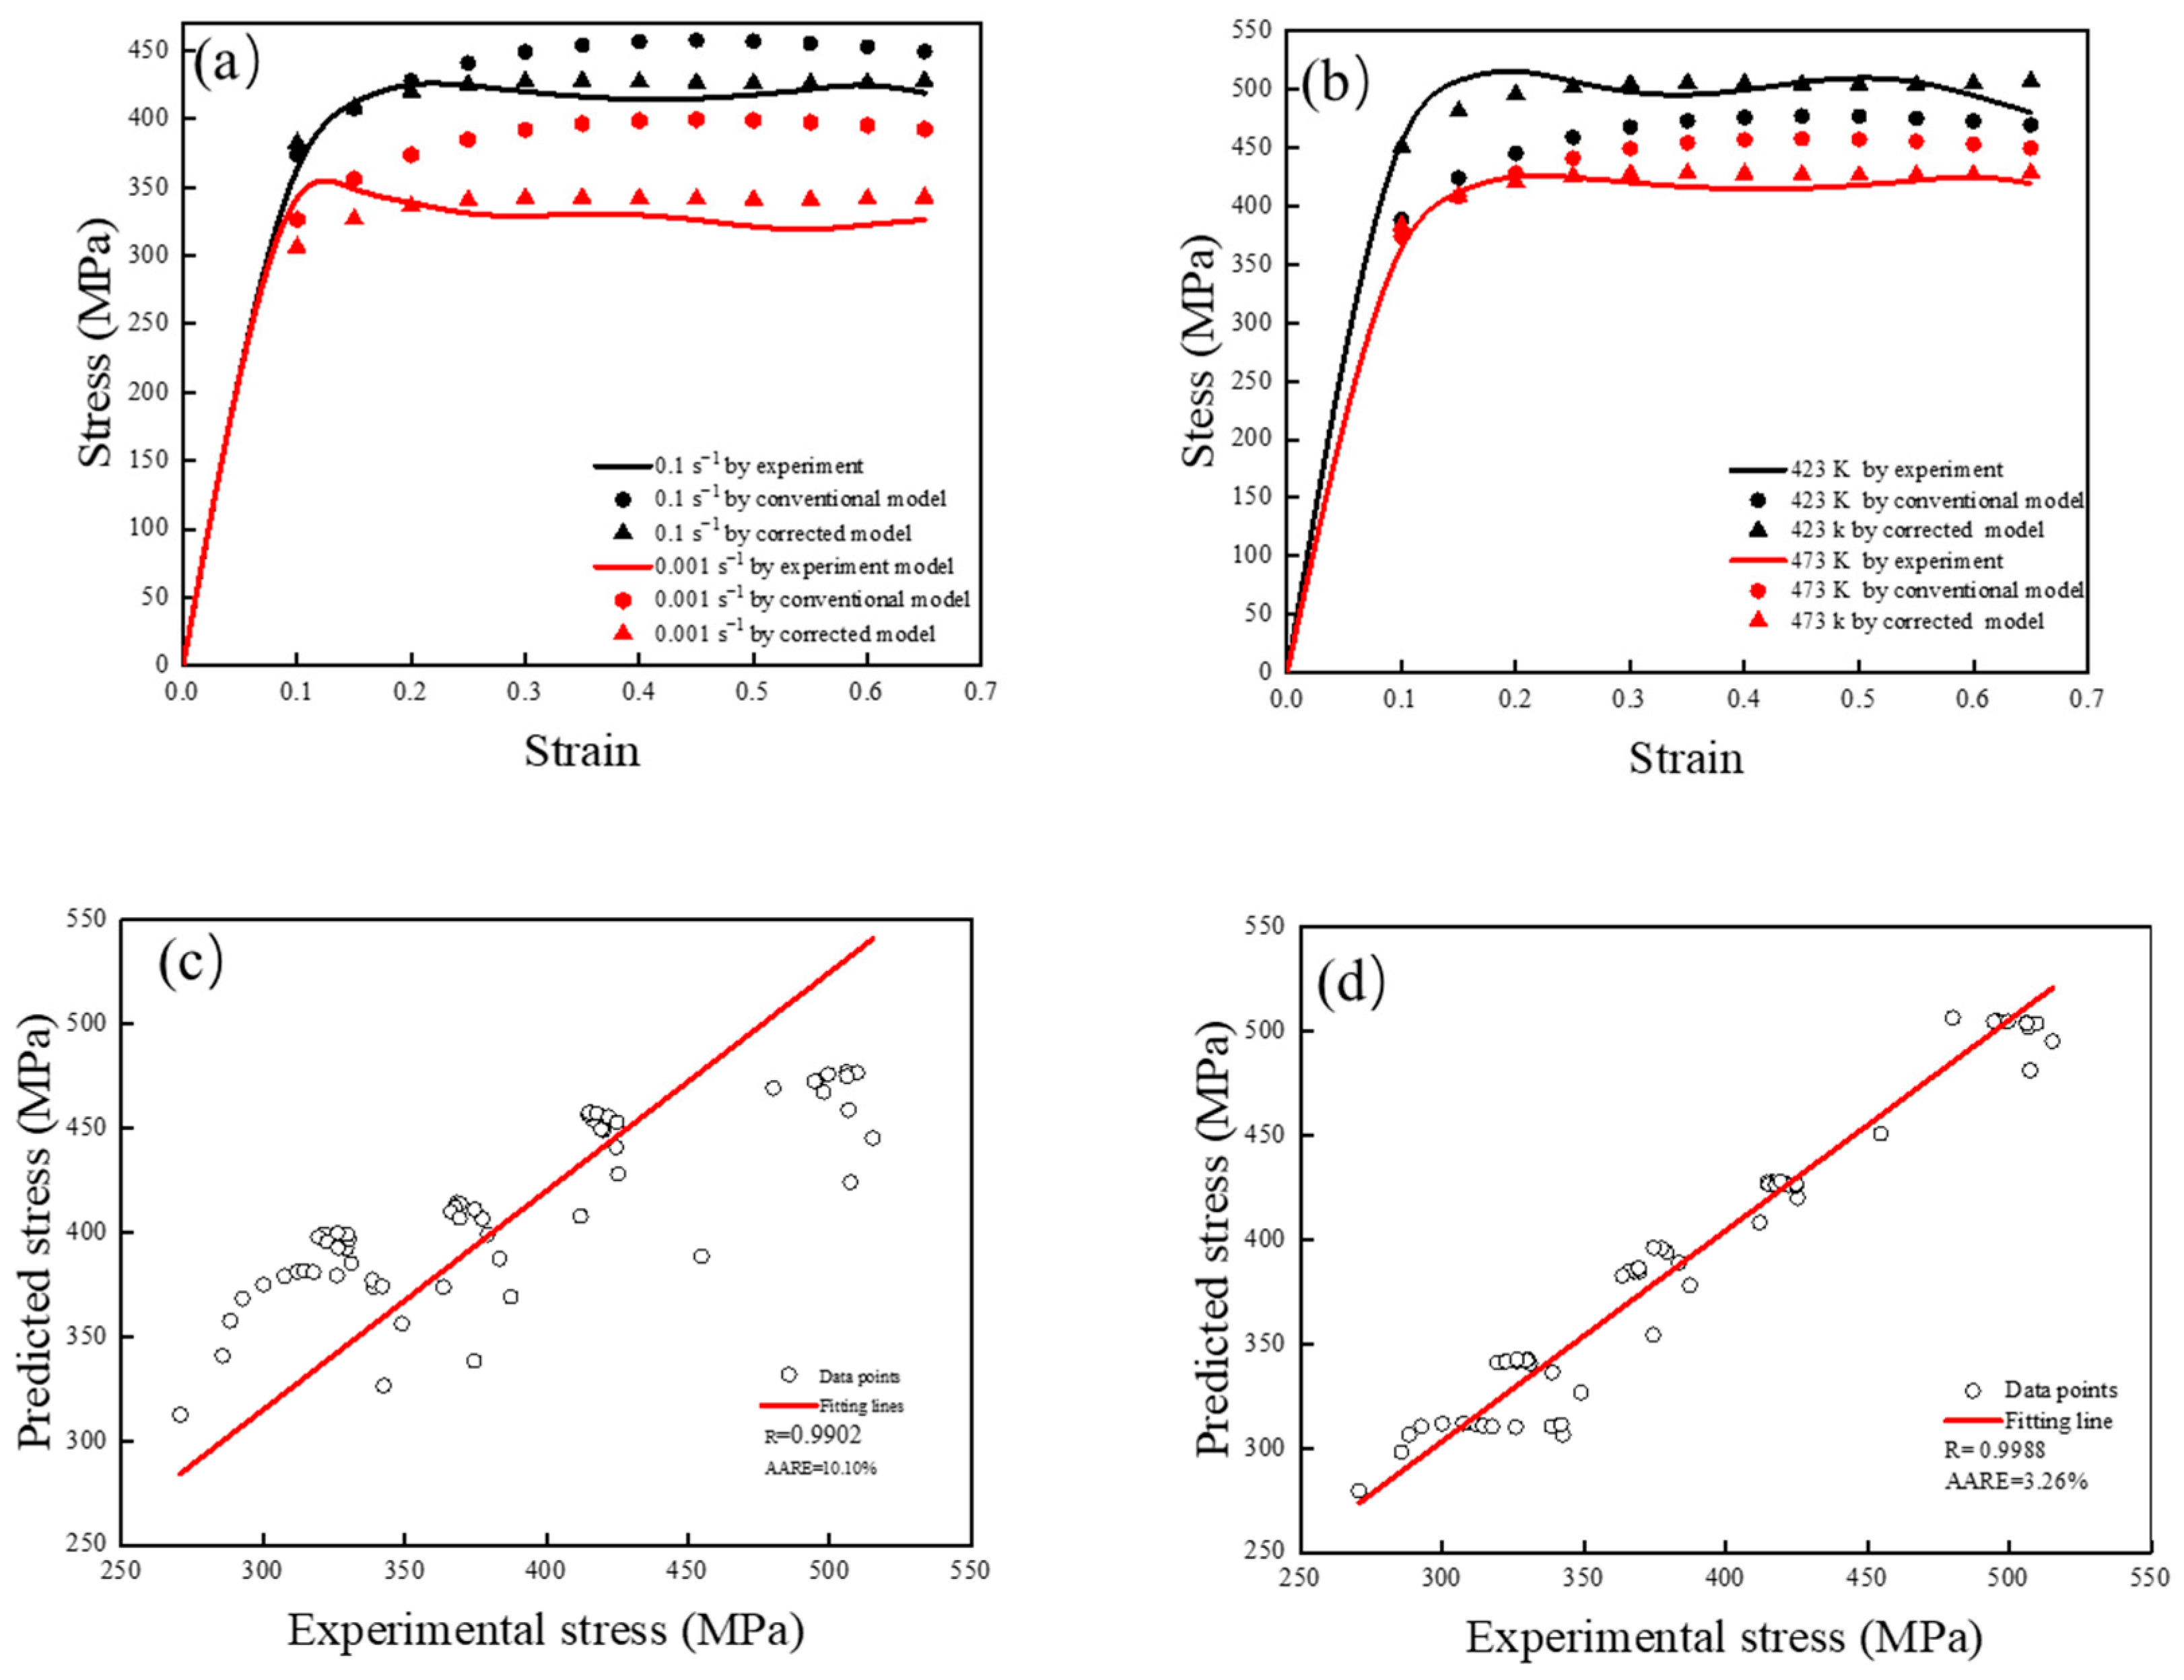
A good constitutive model cannot only fit the modeling data used but also accurately calculate all the flow stresses during the actual compressive process. Therefore, the data used for the model establishment and the load of thermal compression were calculated and compared. The comparison between the predicted stresses by the conventional and corrected Voce models and the experimental values is shown in Figure 11a,b. The comparison indicates that the predicted stresses by the conventional Voce model have remarkable deviations from the measurements. However, the calculations by the modified model are well matched to the measured ones.
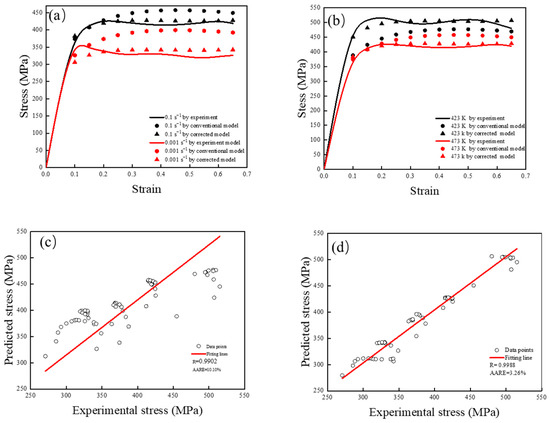
Figure 11.
Comparisons between experimental and predicted stress by conventional and corrected Voce models: (a) 473 K at different strain rates; (b) 0.1 s−1 at different temperatures; (c) conventional model; (d) modified Voce model.
To compare the accuracy of the two models further, two statistical indexes, the correlation coefficient (R) and the average absolute relative error (AARE), were used as the evaluation criteria in this research [33]. The two indexes are expressed as follows:
where stands for the measurement, is the calculation by the constitutive model, and and stand for the mean value of the flow stress obtained by experiment and calculation, respectively.
Figure 11c,d show the comparison results for the two models. The R-value of the conventional Voce model and the AARE-value of the conventional Voce model are 0.9902 and 10.10%, respectively, while they are 0.9988 and 3.26%, respectively, for the modified model. Hence, the modified Voce model has better fitting ability than the convention for experimental data in a wide range.
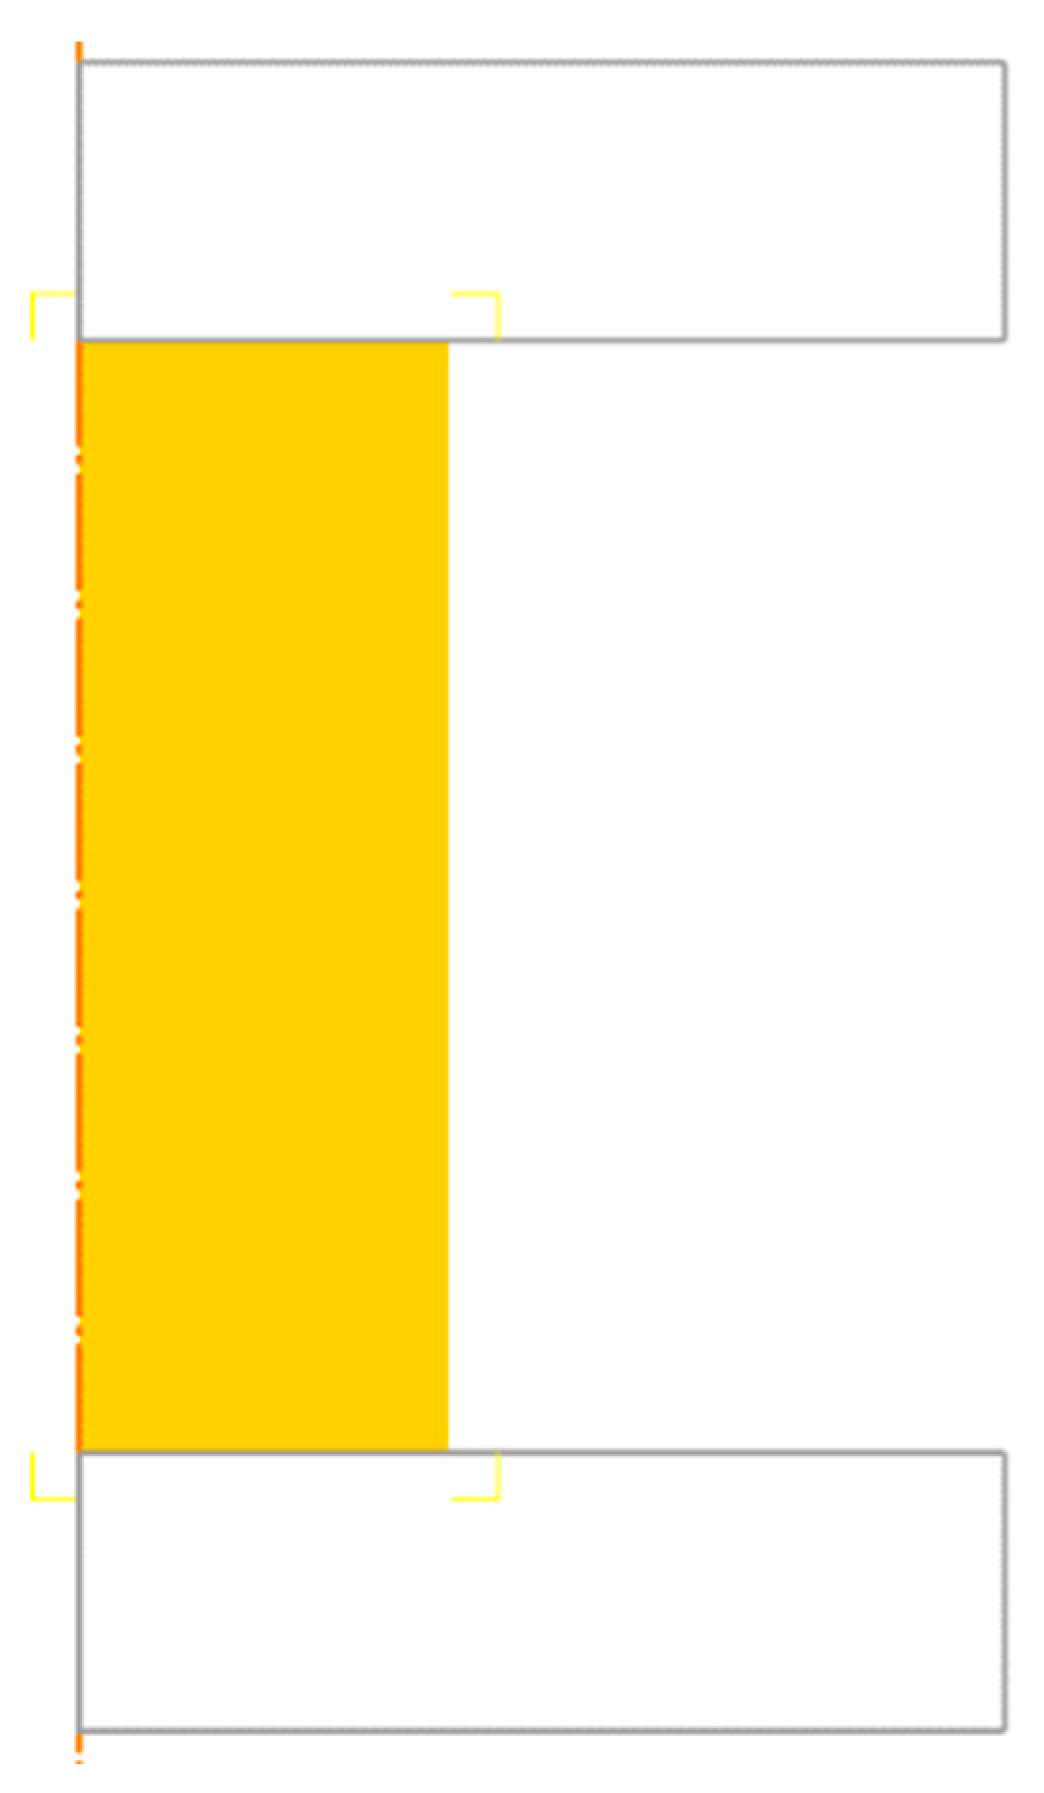
The characterization of the flow behaviors of the 7050 aluminum alloy in its solid solution state contributes significantly to its warm forge process design. The final purpose of the modified Voce-type constitutive model is for better practical load prediction. In order to verify the prediction abilities of the practical loads of the modified model, the whole warm compression process was calculated and compared. The accuracy of flow stress correction and prediction for non-data points can also be evaluated by the FE simulation. The calculation was done on the Deform-2D 11.0 platform (Scientific Forming Technologies Corporation, Raleigh, North Carolina, USA). Here, we enrich the stress-strain data of the alloy utilizing the modified model. Then we simulated two compression processes at 333 K at different strain rates. The simulation model is shown in Figure 12. Only a representative plane was used for cylindrical compression. The size of the specimens is Φ8 mm × 12 mm. The aluminum specimen was assumed to be rigid viscoplastic and meshed with about 32,000 tetrahedral elements. The grid size was calculated by the simulation software from the curvature of the initial geometry. The deformation solver uses a conjugate gradient solver. It uses an iterative method to gradually approximate the optimal value. The parts were re-meshed between every 5 computational steps to avoid simulation errors since the mesh geometry changes significantly during compression. The heat transfer between the specimen and the air was neglected, and interface friction was characterized using the shear friction law with a friction factor of 0.2. Speed of top anvil and the strain rate of specimen can be converted as Equation (14) [46]:
where HB is the height of the specimen before compression, and in this simulation, HB is 12. HA is the height after compression, namely 6 mm. εT is the true strain after compression, and it is approximately 0.69. έ is the strain rate of the specimen.
Figure 12.
Finite element model for isothermal comparisons.
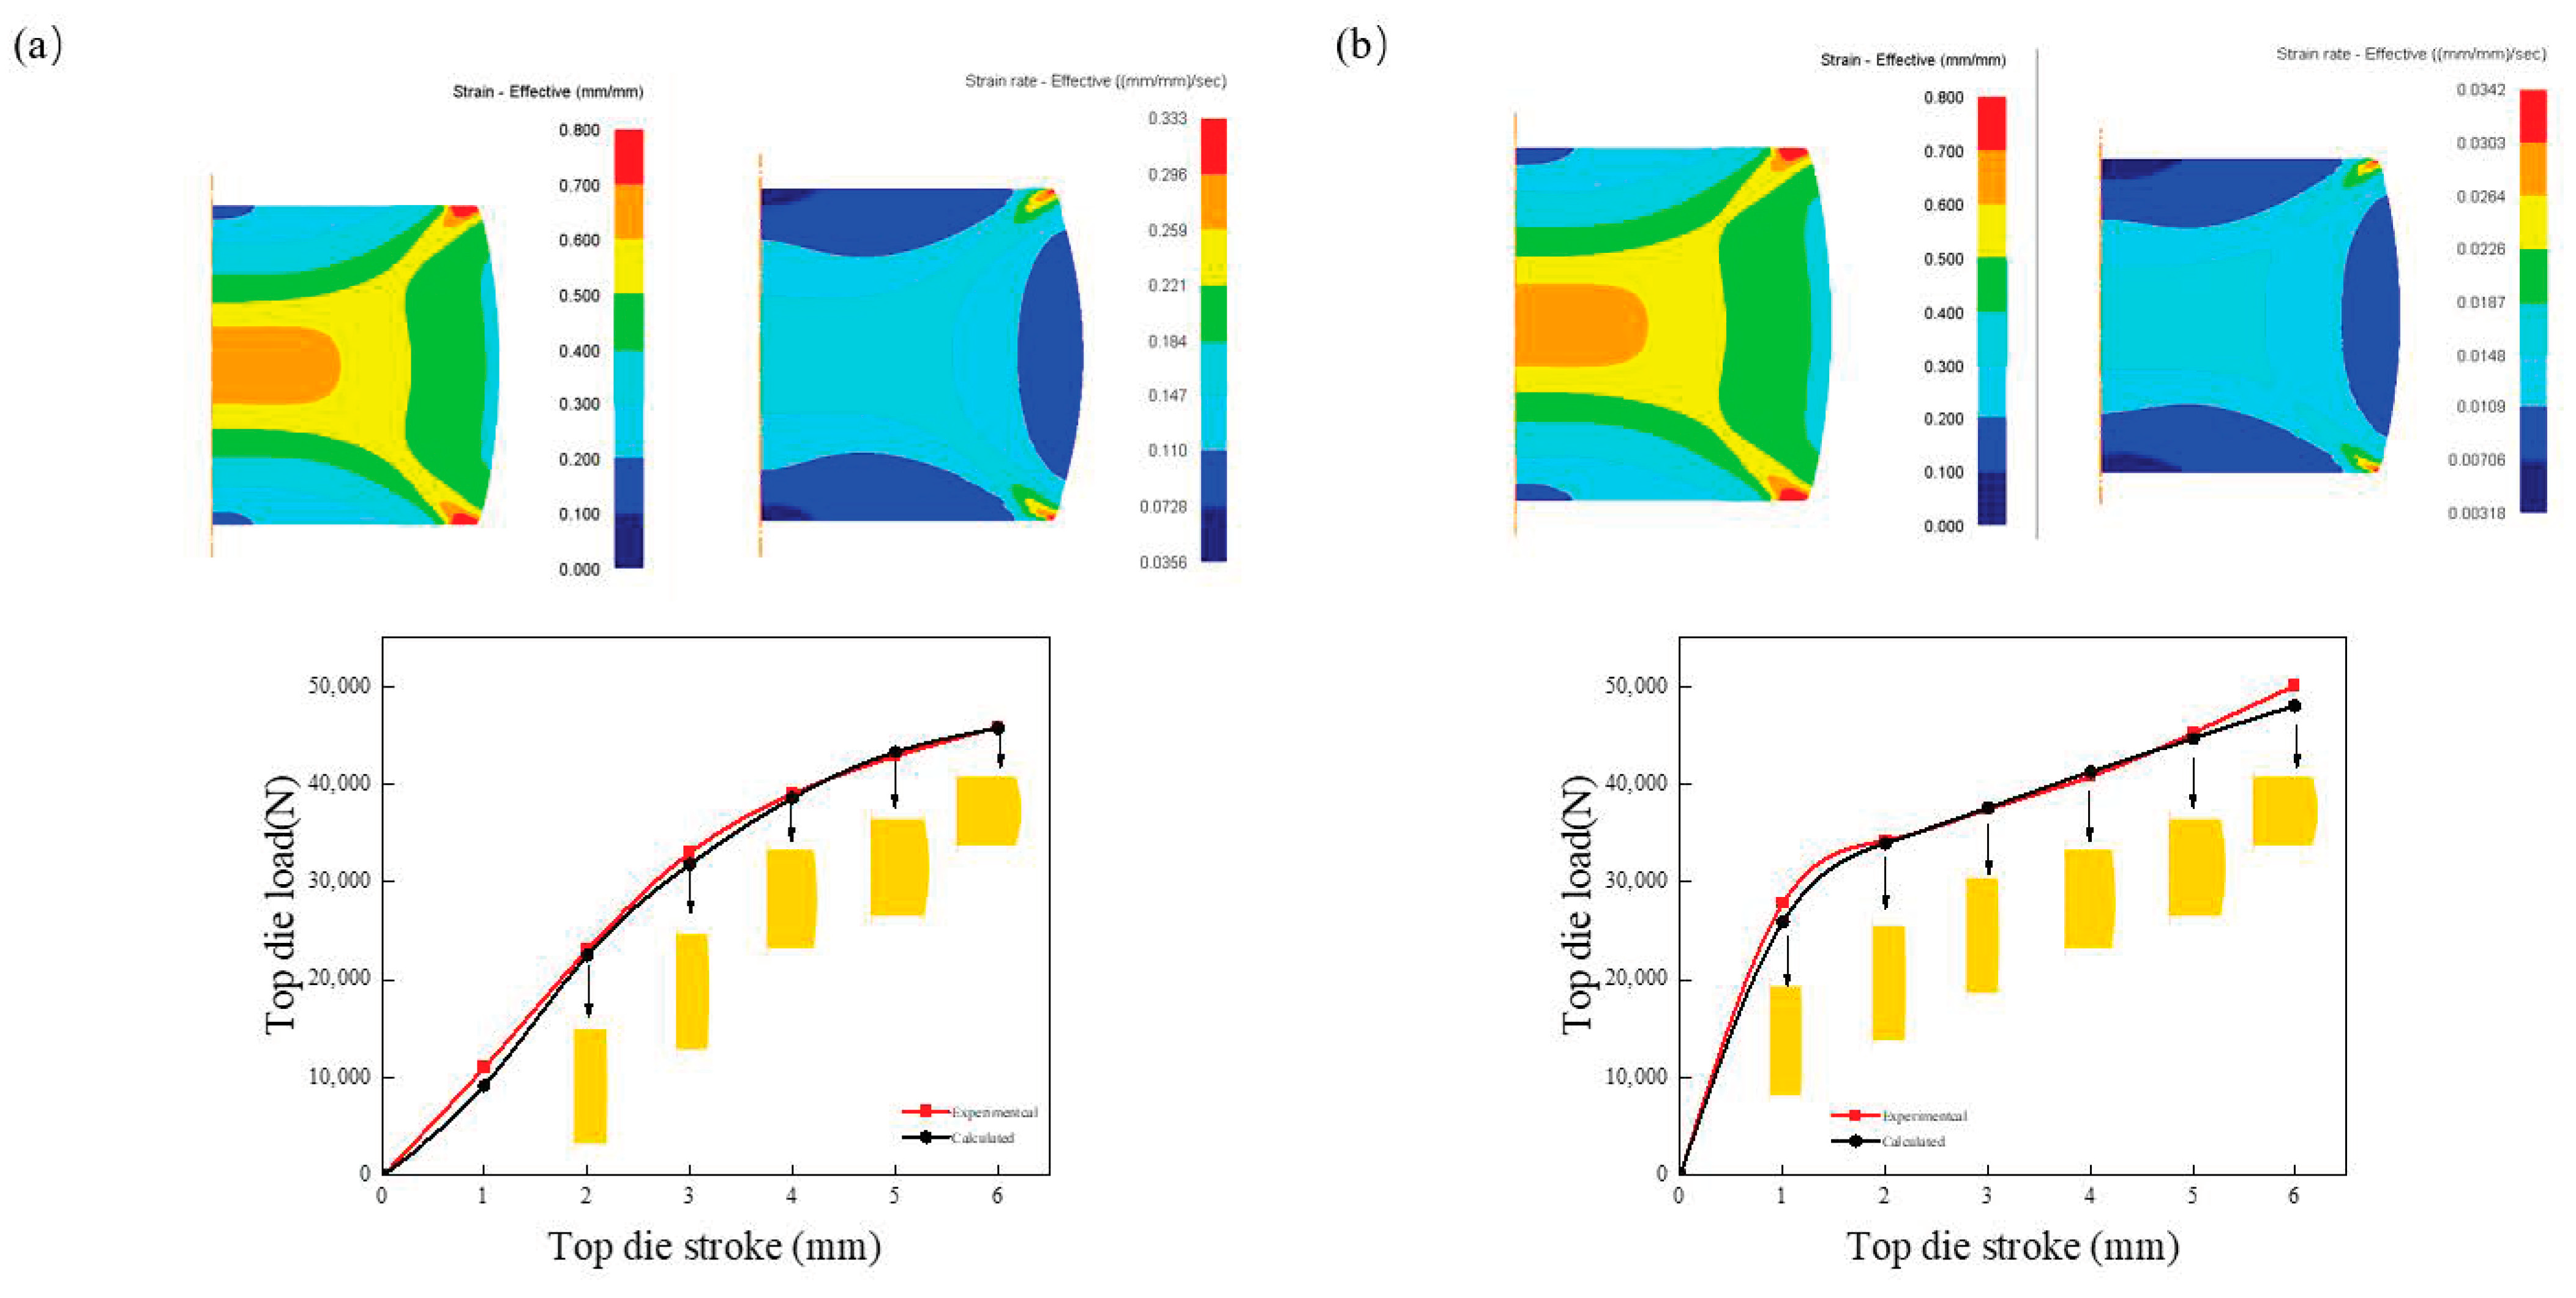
The simulation results are shown in Figure 13a,b. Due to friction and heterogeneous deformation, the periphery of the specimen became typical drum-type. At the end of this compression, the inner region indicates a true strain of 0.69, and the true strain rates are about 0.1 s−1 and 0.01 s−1, respectively, manifesting the simulated physical quantities having good agreement with the compression conditions. The upsetting loads, along with the top die stroke, were calculated and compared. The load trend is basically consistent with the experimental result. According to Equation (13), the AARE of the two is 5.71% and 4.61%, respectively. Consequently, it shows the positive accuracy of the friction correction, and the modified Voce model can be effectively applied in the FEM for stress calculation and load prediction during warm forming of the solid solution-state 7050 aluminum alloy.
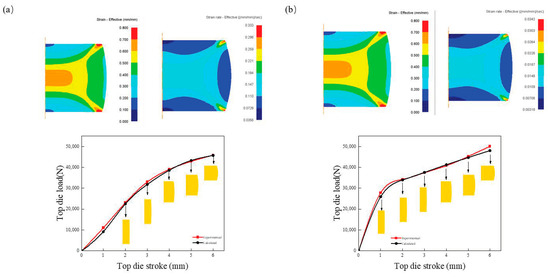
Figure 13.
Comparison between simulated and measured load-stroke curves: (a) strain rate is 0.01 s−1; (b) strain rate is 0.1 s−1.
4. Conclusions
In this study, the room and warm compression behaviors of the solid solution-state 7050 alloy were researched. Furthermore, a modified Voce-type constitutive model with variable parameters was built to enhance the prediction precision of the warm compression behavior of solid solution-state 7050 alloy. Meanwhile, the prediction accuracy of the modified Voce is evaluated in two ways. The following conclusions could be obtained:
- (1)
- The Voce-type model has better precision of warm compression behavior for solid solution-state 7050 alloy than the unsaturated models;
- (2)
- The prediction accuracy of the conventional Voce model with softening coefficient on solid solution-state alloys during the warm compression process is not very high. In the conventional Voce model, the material parameters are regarded as independent of the deformation parameters. However, the parameters are variable due to microstructure deformation mechanism evolution, which decreases simulation accuracy;
- (3)
- The modified model has good predictability for warm compression behavior for solid solution-state 7050 alloy. The fitting and FEA results indicate the validity of a modified Voce-type constitutive model with variable parameters and friction correction in the warm compression process. The modified Voce-type constitutive model can be applied to the warm forge process design of the 7050 alloy in its solid solution state.
Author Contributions
Investigation, methodology, data curation, and writing—original draft, H.T. and Y.X.; resources, conceptualization, formal analysis, and writing—review and editing, C.P. and Y.L. All authors have read and agreed to the published version of the manuscript.
Funding
The research was funded the National Natural Science Foundation of China (No. 51775068) and the Chongqing Natural Science Foundation general project [No. cstc2021jcyj-msxmX1085].
Institutional Review Board Statement
Not applicable.
Informed Consent Statement
Not applicable.
Data Availability Statement
The data presented in this study are not publicly available due to ongoing research in this field.
Conflicts of Interest
The authors declare that they have no known competing financial interest or personal relationships that could have appeared to influence the work reported in this paper.
References
- Feng, D.; Xu, R.; Li, J.; Huang, W.; Wang, J.; Liu, Y.; Zhao, L.; Li, C.; Zhang, H. Microstructure Evolution Behavior of Spray-Deposited 7055 Aluminum Alloy During Hot Deformation. Metals 2022, 11, 1982. [Google Scholar] [CrossRef]
- Wei, S.L.; Feng, Y.; Zhang, H.; Xu, C.T.; Wu, Y. Influence of Aging on Microstructure, Mechanical Properties and Stress Corrosion Cracking of 7136 Aluminum Alloy. J. Cent. South Univ. 2021, 28, 2687–2700. [Google Scholar] [CrossRef]
- Wu, C.H.; Feng, D.; Ren, J.J.; Zang, Q.H.; Li, J.C.; Liu, S.D.; Zhang, X.M. Effect of Non-Isothermal Retrogression and Re-Ageing On through-Thickness Homogeneity of Microstructure and Properties of Al-8Zn-2Mg-2Cu Alloy Thick Plate. J. Cent. South Univ. 2022, 29, 960–972. [Google Scholar] [CrossRef]
- Liu, Y.; Zhang, T.; Gong, H.; Wu, Y. Effect of Cold Pressing and Aging on Reduction and Evolution of Quenched Residual Stress for Al-Zn-Mg-Cu T-Type Rib. Appl. Sci. 2021, 11, 5439. [Google Scholar] [CrossRef]
- Zhang, Z.; Yang, Y.; Li, L.; Chen, B.; Tian, H. Assessment of Residual Stress of 7050-T7452 Aluminum Alloy Forging Using the Contour Method. Mater. Sci. Eng. A 2015, 644, 61–68. [Google Scholar] [CrossRef]
- Xu, L.; Zhan, L.; Xu, Y.; Liu, C.; Huang, M. Thermomechanical Pretreatment of Al-Zn-Mg-Cu Alloy to Improve Formability and Performance During Creep-Age Forming. J. Mater. Process. Technol. 2021, 293, 117089. [Google Scholar] [CrossRef]
- Koc, M.; Culp, J.; Altan, T. Prediction of Residual Stresses in Quenched Aluminum Blocks and their Reduction through Cold Working Processes. J. Mater. Process. Tech. 2006, 174, 342–354. [Google Scholar] [CrossRef]
- Rometsch, P.A.; Zhang, Y.; Knight, S. Heat Treatment of 7Xxx Series Aluminium Alloys—Some Recent Developments. Trans. Nonferrous Met. Soc. China 2014, 24, 15. [Google Scholar] [CrossRef]
- Zhang, C.; Chu, X.; Guines, D.; Leotoing, L.; Ding, J.; Zhao, G. Dedicated linear–Voce model and its application in Dedicated Linear-Voce Model and its Application in Investigating Temperature and Strain Rate Effects on Sheet Formability of Aluminum Alloys. Mater. Des. 2014, 67, 522–530. [Google Scholar] [CrossRef]
- Hartloper, A.R.; de Castro e Sousa, A.; Lignos, D.G. Constitutive Modeling of Structural Steels: Nonlinear Isotropic/Kinematic Hardening Material Model and its Calibration. J. Struct. Eng. 2021, 147. [Google Scholar] [CrossRef]
- Sung, J.H.; Kim, J.H.; Wagoner, R.H. A Plastic Constitutive Equation Incorporating Strain, Strain-Rate, and Temperature. Int. J. Plast. 2010, 26, 1746–1771. [Google Scholar] [CrossRef]
- Wu-Jiao, L.F.N.T. Effect of Solution Treatment Time on Mechanical Properties and Corrosion Resistance of Extruded 7050 Aluminum Alloy. Trans. Mater. Heat Treat. 2021, 42, 10. [Google Scholar]
- Li, P.Y.; Xiong, B.Q.; Zhang, Y.A.; Li, Z.H.; Zhu, B.H.; Wang, F.; Liu, H.W. Quench Sensitivity and Microstructure Character of High Strength Aa7050. Trans. Nonferrous Met. Soc. China 2012, 22, 268–274. [Google Scholar] [CrossRef]
- Feng, D.; Wang, G.; Chen, H.; Zhang, X. Effect of Grain Size Inhomogeneity of Ingot on Dynamic Softening Behavior and Processing Map of Al-8Zn-2Mg-2Cu Alloy. Met. Mater. Int. 2016, 24, 195–204. [Google Scholar] [CrossRef]
- Robson, J.D.; Prangnell, P.B. Predicting Recrystallised Volume Fraction in Aluminium Alloy 7050 Hot Rolled Plate. Met. Sci. J. 2002, 18, 607–614. [Google Scholar] [CrossRef]
- Fan, X. Homogenization of 7050 Plates by a Novel Differential Temperature Rolling. Mater. Manuf. Process. 2018, 33, 1822–1829. [Google Scholar] [CrossRef]
- Han, N.M.; Zhang, X.M.; Liu, S.D.; He, D.G.; Zhang, R. Effect of Solution Treatment on the Strength and Fracture Toughness of Aluminum Alloy 7050. J. Alloys Compd. 2011, 509, 4138–4145. [Google Scholar] [CrossRef]
- Juan, Y.; Niu, G.; Jiang, H.; Yang, J.; Tang, W.; Dai, Y.; Yang, Y.; Zhang, J. Influence of Solution Heat Treatment on Strength and Fracture Toughness of Aluminum Alloy 7050. J. Cent. South Univ. 2012, 43, 855–863. [Google Scholar]
- Li, C.; Wang, H.; Wang, W.; Ye, C.; Jin, Z.; Zhang, X.; Zhang, H.; Jia, L. Effect of Solution Treatment on Recrystallization, Texture and Mechanical Properties of 7a65-T74 Aluminum Alloy Super-Thick Hot Rolled Plate. J. Wuhan Univ. Technol.-Mater. Sci. Ed. 2022, 37, 460–469. [Google Scholar] [CrossRef]
- Zhou, Y.; Zhou, J.; Xiao, X.; Li, S.; Cui, M.; Zhang, P.; Long, S.; Zhang, J. Microstructural Evolution and Hardness Responses of 7050 Al Alloy During Processing. Materials 2022, 15, 5629. [Google Scholar] [CrossRef]
- Amit, B. Mechanical Properties and Working of Metals and Alloys; Springer: Singapore, 2018. [Google Scholar]
- Chen, S.; Chen, K.; Peng, G.; Chen, X.; Ceng, Q. Effect of Heat Treatment on Hot Deformation Behavior and Microstructure Evolution of 7085 Aluminum Alloy. J. Alloys Compd. 2012, 537, 338–345. [Google Scholar] [CrossRef]
- Gasson, C.P. Light Alloys: From Traditional Alloys to Nanocrystals—Fourth Edition. Aeronaut. J. 2006, 110, 394–395. [Google Scholar] [CrossRef]
- Lu, J.; Song, Y.; Hua, L.; Zheng, K.; Dai, D. Thermal Deformation Behavior and Processing Maps of 7075 Aluminum Alloy Sheet Based on Isothermal Uniaxial Tensile Tests. J. Alloys Compd. 2018, 767, 856–869. [Google Scholar] [CrossRef]
- Zhu, R.H.; Qing LI, U.; Li, J.F.; Chen, Y.L.; Zhang, X.H.; Zheng, Z.Q. Flow Curve Correction and Processing Map of 2050 Al–Li Alloy. Trans. Nonferrous Met. Soc. China 2018, 28, 404–414. [Google Scholar] [CrossRef]
- Luo, J.; Li, M.Q.; Ma, D.W. The Deformation Behavior and Processing Maps in the Isothermal Compression of 7a09 Aluminum Alloy. Mater. Sci. Eng. A 2012, 532, 548–557. [Google Scholar] [CrossRef]
- Zhao, J.; Deng, Y.; Tang, J.; Zhang, J. Influence of Strain Rate on Hot Deformation Behavior and Recrystallization Behavior Under Isothermal Compression of Al-Zn-Mg-Cu Alloy. J. Alloys Compd. 2019, 809, 151788. [Google Scholar] [CrossRef]
- Liu, L.; Wu, Y.X.; Gong, H.; Wang, K. Modification of Constitutive Model and Evolution of Activation Energy On 2219 Aluminum Alloy During Warm Deformation Process. Trans. Nonferrous Met. Soc. China 2019, 29, 448–459. [Google Scholar] [CrossRef]
- Jiang, F.; Tang, J.; Fu, D.; Huang, J.; Zhang, H. A Correction to the Stress–Strain Curve During Multistage Hot Deformation of 7150 Aluminum Alloy Using Instantaneous Friction Factors. J. Mater. Eng. Perform. 2018, 27, 3083–3090. [Google Scholar] [CrossRef]
- Wu, D.X.; Long, S.; Li, S.S.; Zhou, Y.T.; Wang, S.Y.; Dai, Q.W.; Lin, H.T. Hot Deformation Behavior of Homogenized Al-7.8Zn-1.65Mg-2.0Cu (Wt.%) Alloy. J. Mater. Eng. Perform. 2022, 32, 3431–3442. [Google Scholar] [CrossRef]
- Hollomon, J.H. Tensile Deformation. Met. Technol. 1945, 12, 268–290. [Google Scholar]
- Swift, H.W. Plastic Instability Under Plane Stress. J. Mech. Phys. Solids 1952, 1, 1–18. [Google Scholar] [CrossRef]
- Ludwigson, D. Modified Stress-Strain Relation for Fcc Metals and Alloys. Metall. Trans. 1971, 2, 2825. [Google Scholar] [CrossRef]
- Voce, E. The Relationship Between Stress and Strain for Homogeneous Deformation. J. Inst. Met. 1948, 74, 537–562. [Google Scholar]
- Verlinden, B.; Suhadi, A.; Delaey, L. A Generalized Constitutive Equation for an Aa6060 Aluminium Alloy. Scr. Metall. Mater. 1993, 28, 1441–1446. [Google Scholar] [CrossRef]
- Pelaccia, R.; Santangelo, P.E. A Homogeneous Flow Model for Nitrogen Cooling in the Aluminum-Alloy Extrusion Process. Int. J. Heat Mass Transf. 2022, 195, 1–14. [Google Scholar] [CrossRef]
- Shi, S.X.; Liu, X.S.; Zhang, X.Y.; Zhou, K.C. Comparison of Flow Behaviors of Near Beta Ti-55511 Alloy During Hot Compression Based on Sca and Bpann Models. Trans. Nonferrous Met. Soc. China 2021, 31, 1665–1679. [Google Scholar] [CrossRef]
- Nourani, M.; Milani, A.S.; Yannacopoulos, S. On the Effect of Different Material Constitutive Equations in Modeling Friction Stir Welding: A Review and Comparative Study on Aluminum 6061. Int. J. Adv. Eng. Technol. 2014, 7, 1–20. [Google Scholar]
- Koc, P.; Atok, B. Computer-Aided Identification of the Yield Curve of a Sheet Metal After Onset of Necking. Comput. Mater. Sci. 2004, 31, 155–168. [Google Scholar] [CrossRef]
- Ye, J.H.; Chen, M.H.; Wang, N.; Xie, L.S. Flow Stress Model of 2a12 Aluminum Alloy Based on Modified Voce Model. Trans. Mater. Heat Treat. 2019, 40, 170–176. [Google Scholar]
- Wei, G.; Peng, X.; Hadadzadeh, A.; Mahmoodkhani, Y.; Xie, W.; Yang, Y.; Wells, M.A. Constitutive Modeling of Mg-9Li-3Al-2Sr-2Y at Elevated Temperatures. Mech. Mater. 2015, 89, 241–253. [Google Scholar] [CrossRef]
- Jedrasiak, P.; Shercliff, H. Finite Element Analysis of Small-Scale Hot Compression Testing—Sciencedirect. J. Mater. Sci. Technol. 2021, 76, 174–188. [Google Scholar] [CrossRef]
- Zhang, J.S.; Xia, Y.F.; Quan, G.Z.; Wang, X.; Zhou, J. Thermal and Microstructural Softening Behaviors During Dynamic Recrystallization in 3Cr20Ni10W2 Alloy. J. Alloys Compd. 2018, 743, 464–478. [Google Scholar] [CrossRef]
- Padhi, P.C.; Mahapatra, S.S.; Yadav, S.N.; Tripathy, D.K. Multi-Objective Optimization of Wire Electrical Discharge Machining (Wedm) Process Parameters Using Weighted Sum Genetic Algorithm Approach. J. Adv. Manuf. Syst. 2016, 15, 85–100. [Google Scholar] [CrossRef]
- Long, S.; Xia, Y.-F.; Wang, P.; Zhou, Y.-T.; Gong-Ye, F.-J.; Zhou, J.; Zhang, J.-S.; Cui, M.-L. Constitutive Modelling, Dynamic Globularization Behavior and Processing Map for Ti-6Cr-5Mo-5V-4Al Alloy During Hot Deformation. J. Alloys Compd. 2019, 796, 65–76. [Google Scholar] [CrossRef]
- Wu, D.; Long, S.; Wang, S.; Li, S.S.; Zhou, Y.T. Constitutive Modelling with a Novel Two-Step Optimization for an Al-Zn-Mg-Cu Alloy and its Application in Fea. Mater. Res. Express 2021, 8, 116511. [Google Scholar] [CrossRef]


Disclaimer/Publisher’s Note: The statements, opinions and data contained in all publications are solely those of the individual author(s) and contributor(s) and not of MDPI and/or the editor(s). MDPI and/or the editor(s) disclaim responsibility for any injury to people or property resulting from any ideas, methods, instructions or products referred to in the content. |
© 2023 by the authors. Licensee MDPI, Basel, Switzerland. This article is an open access article distributed under the terms and conditions of the Creative Commons Attribution (CC BY) license (https://creativecommons.org/licenses/by/4.0/).