Article

Study on Friction Characteristics of AA7075 Aluminum Alloy under Pulse Current-Assisted Hot Stamping

1
Key Laboratory of Advanced Forging & Stamping Technology and Science, Ministry of Education of China, Yanshan University, Qinhuangdao 066004, China
2
Yancheng Institute of Technology, College of Mechanical Engineering, Yancheng 224051, China
*
Author to whom correspondence should be addressed.
Metals 2023, 13(5), 972; https://doi.org/10.3390/met13050972
Submission received: 10 April 2023 / Revised: 10 May 2023 / Accepted: 14 May 2023 / Published: 17 May 2023
(This article belongs to the Special Issue Aluminum Alloys and Aluminum-Based Matrix Composites)

Abstract

:
Friction during contact between metals can be very complex in pulse current-assisted forming. Based on stamping process characteristics, a reciprocating friction tester was designed to study the friction characteristics between AA7075 aluminum alloy and P20 steel under different current densities. Origin software was used to process the experimental data, and a current friction coefficient model was established for the pulse current densities. The results show that the friction coefficient of the aluminum alloy sheet decreased with the increase in the pulse current density (2–10 A/mm2). After that, the friction mechanism was determined by observing microscopic morphology and SEM: some oxide cracked on the friction surface when the current was large. Finally, finite element simulations with Abaqus software and a cylindrical case validated the constant and current friction coefficient models. The thickness distribution patterns of the fixed friction coefficient and the current coefficient model were compared with an actual cylindrical drawing part. The results indicate that the new current friction model had a better fit than the fixed one. The simulation results are consistent with the actual verification results. The maximum thinning was at the corner of the stamping die, which improved the simulation accuracy by 7.31%. This indicates the effectiveness of the pulse current friction model.

1. Introduction

With the development of the automotive industry, lightweight materials have gradually replaced traditional steel and have become one of the hot spots in the development direction of the automotive industry [1,2,3]. Among them, aluminum alloy has become the first choice to replace traditional steel because of its low density, high strength, and good processing formability. It has received attention for its use in lightweight automobiles [4]. Among the different types, 7075 aluminum alloy has the best intensity and is commonly used in aircraft manufacturing [5]. Although the traditional hot forming technology can avoid the problems of easy cracking, it has a small drawing limit ratio and there is considerable rebound of the aluminum alloy at room temperature [6]. Moreover, the heating time is long, and the heating efficiency is low, which reduces the quality of the sheet metal forming parts. It is therefore urgent to find a new forming technology to replace the traditional forming technology [7]. Electro-assisted forming (EAF) [8,9,10] improves metal forming performance by applying pulse current-assisted metal forming. Many studies have shown [11] that deformation resistance and spring back can be reduced under a pulse current, improving the metal-forming accuracy and quality. Hence, pulse current-assisted metal-forming technology has gradually become a research focus in recent years. Lv Z et al. [12] studied the electro-plastic effect of drawing high-strength steel; their results showed that introducing a pulse current can effectively improve the forming performance of high-strength steel and increase its deep drawing depth. The friction between sheet metal and stamping mold impacts the forming quality and simulation accuracy in current-assisted hot stamping technology. Therefore, studying the friction characteristics under different currents is essential to better apply current-assisted forming technology to the sheet metal-forming process.
In recent years, some researchers have established friction models from a macroscopic perspective to study the influence of process parameters on sheet forming. Nie Xin [13] and Tan Guang et al. [14] of Hunan University measured DP480 high-strength steel considering the influence of temperature on the friction coefficient and established a variable friction model, which showed that it could better describe the actual stamping situation. Wang Peng et al. of the Hunan University of Technology [15] considered the influence of different interface loads on the friction coefficient between aluminum alloy sheets and mold steel under boundary lubrication conditions through the pin friction testing machine. They established a variable friction model under different loads and through experimental verification and finite element simulation. They found that the error of the variable friction model was small and verified the effectiveness of the friction mode. Subsequently, Dou S et al. [16] established a mixed friction model considering the influence of the sliding velocity and boundary load on the friction coefficient under boundary lubrication conditions, and combined experimental verification with finite element simulation to verify the effectiveness of the hybrid friction model. X J Li et al. [17] used the anti-problem optimization method to explore the influence of friction behavior on forming quality. They tested hot stamping on 7075 aluminum alloy sheets with different lubricants and analyzed the effects of the force–displacement curve, surface morphology, and thickness distribution. The results showed that compared to the experimental results, the determined friction coefficient could accurately predict the force–displacement curve and thickness distribution of the formed parts under different lubrication conditions. Liu Yong [18], Xu Yupeng [19], and Li Jiahao [20] of the Wuhan University of Science and Technology conducted a detailed study on the high-efficiency stamping process of high-strength aluminum alloy, mainly including the high-temperature rheological behavior of sheets and the high-temperature friction and lubrication behavior of aluminum alloy and mold steel, and applied it to the simulation of aluminum alloy sheet hot stamping. They analyzed the rupture mechanism of aluminum alloy hot stamping forming and provided a basis and reference for the actual stamping.
In addition, other researchers have begun to explain friction behavior from a microscopic perspective, and friction models have been established based on this. C. Wang et al. [21] established a micromechanical friction model considering the influence of the temperature, contact pressure, volumetric strain, and relative sliding velocity on friction during the forming process, and verified the model by comparing the actual contact area and experimental results. The results showed that the model could be used for formability analysis and the prediction of optimal stamping parameters, providing theoretical guidance for actual stamping. However, C. Wang only established a cold stamping process friction model based on temperature-dependent micromechanics. Jenny Venem [22] established a multi-scale friction model considering local contact pressure, temperature, and strain. They then applied it to hot stamping. The results showed that the model could predict the friction of the actual stamping process well. Deng Liang et al. [23] proposed a finite element model of the friction process at the microscopic scale based on the high-temperature one-way friction experimental process. They analyzed the actual contact conditions under the microscopic mechanism. The results showed that undulating the contact surface caused the friction factor calculated using the finite element model of the friction process to change within the range of the set friction factor. J. Han [24] considered the changes in the tangential stiffness and friction coefficient caused by the difference in the stress distribution and established a modified stick–slip friction model. The experimental verification and finite element simulation showed that the model could describe the friction behavior of the contact parameters at different stages in the stick–slip process. Its simulation results agreed with the experimental data, which showed significant improvement in the prediction accuracy of the mechanical system’s performance. The authors of [25] investigated the friction and occlusion properties of 7075 aluminum alloy sheets at different temperatures and found that the formation of a compaction layer on the wear surface affected the friction behavior. They established a friction evolution model, which showed that at 25 °C and 150 °C, the dominant friction mechanism was furrow friction, while at temperatures above 300 °C, the dominant friction mechanism was sticking. Similarly, the authors of [26], in conjunction with the hot forming of 7075 aluminum alloys, established a friction mechanism at high temperatures, loads, and sliding speeds, which were used to explain the friction mechanism and showed that the wear rate gradually decreased as the load and sliding speed increased.
With the general study of variable friction models, some researchers have begun to study friction models related to current factors. ZH. C [27] used the pin–disc friction testing machine and Matlab software to establish a mixed friction model based on friction, sliding velocity, and average load. They verified the effectiveness of the friction model by comparing it with the predicted value of the friction model through experimental verification. Afterwards, the team led by ZH. C [28] conducted experiments to study the relationship between frictional force and multiple current factors, established a LuGre static model for frictional force on a bowstring, introduced dynamic parameters to develop a LuGre dynamic model, and identified the model parameters using the genetic algorithm combined with simulation. The results demonstrated the superiority of the dynamic model, which can provide a reference for predicting frictional force and studying frictional wear performance. On this basis, Ping Yu [29] of Liaoning Technical University considered the law of change of fluctuating contact force and current with friction, combined this with the Stribeck friction model, established a modified hybrid friction model of contact force current, and verified the effectiveness of the friction model through experimental measurement and model prediction. However, the application of the above models has mainly been in the field of high-speed bullet trains. Jx Bao et al. [30] established a multi-scale friction model considering the effect of the current density and size from a microscopic perspective through a current-assisted compression test. The results showed that the model could predict the friction coefficient well.
Many researchers have studied the friction characteristics in the hot forming process, but the friction characteristics under a pulse current are unclear, and there is relatively little research on related content. In this study, we used AA7075–T6 aluminum alloy as the research object. We studied the influence of a pulse current on the friction coefficient of materials under dry friction conditions and established a current friction model. Finally, through simulation and experimental verification, we verified the effectiveness of the new friction model by comparing it with the predicted values of the fixed friction coefficient.

2. Materials and Methods

2.1. Experimental Materials

The sheet used for this friction test was an AA7075–T6 aluminum alloy sheet with a thickness of 0.5 mm, manufactured by Alcoa and marketed by Suzhou Xiehe Metal Co., Ltd. (Suzhou, China). The chemical composition is shown in Table 1. First, the aluminum alloy sheet was cut into 900 mm × 30 mm × 0.5 mm using the wire-cutting technique, as shown in Figure 1a. In addition, this test used P20 die steel as the friction sub, whose chemical composition is shown in Table 2. The die steel was heat-treated to a hardness of 50 HRC, and the structure dimensions are shown in Figure 1b. The samples were then placed in an ethanol solution, which was used to remove the oil from the surface of the samples. Finally, the samples were ultrasonically cleaned for 15 min and then sealed for storage.
The microscopic structure of the sample surface of the aluminum strip is shown in Figure 2a. This alloy predominantly comprises Al, Mg, and Zn, along with minor Fe and Si constituents. Due to the limited solubility of most alloying elements in Al, the microstructure of the alloy is characterized by a complex distribution of different particle phases over the α-Al solid solution matrix. The primary particle phases present in the 7075 alloys are η-MgZn2, S-Al2CuMg, T-Al2Zn3Mg2, and T-Al2Zn3Mg2. The non-equilibrium MgZn2 phase is the primary strength-reinforcing phase. The complex phase particles are predominantly oriented along the tensile direction of the sample [31]. The EDS of this surface indicates that the main components of the original sample are Al, Mg, and Zn (Figure 2b).

2.2. Test Principle

The pulse current friction tester, as shown in Figure 3a, mainly consisted of a friction test platform, control platform, pulse power loading platform, and data acquisition platform. The device can perform friction tests under the action of different currents, and its test schematic is shown in Figure 3b. In order to direct the current supplied by the external power supply to the friction test, the tester needs to be modified. The conductive clamps made by the group were installed on both sides of the aluminum alloy sheet, and the current was passed to the conductive clamps, P20 mold steel, and the sheet in turn to complete the closed circuit, as shown in Figure 3b.
In addition, to ensure the safety of the test, an alumina ceramic insulation ring was installed on the drum, a nylon insulation pin was installed on the P20 mold steel, and an insulation spacer made of polyether ether ketone material was installed between the fixture and the plate material, thus insulating the conductive parts from the tester, as shown in Figure 3c.
The friction coefficient test platform included friction measurement components and vertical and horizontal actuators. The platform ensured insulation between the friction tester and the sheet material through the alumina ceramic ring, the epoxy resin sheet, and the nylon compression head. Using the fixtures to fix the two ends of the sheet, we connected to the two actuators and mounted the P20 die steel at the top surface of the sheet. The control platform comprised a stepping motor controller, driver, and motor power supply, which controlled the movement speed and direction of the two actuators and ensured the synchronous operation of vertical and horizontal directions. Two conductive clamps connected the pulse power platform to the sheet material. The pulse current was loaded through the conductive clamp, the roller, the material pressure head, and the sample material. It could quickly reach the temperature required for the friction test by adjusting the power supply parameters. The data acquisition system measured the force in the horizontal and vertical directions through the sensor installed in the two directions of the sheet and realized the automatic data acquisition with the help of LABVIEW programming. The formula of the friction coefficient was obtained using Coulomb’s law of friction during data acquisition:
μ = F 2 P
where, F is the difference between the horizontal and vertical sensor values, and P is the normal vertical load.

2.3. Test Arrangement and Test Procedure

The friction mechanism of aluminum alloys during pulsed current-assisted forming is complex, often accompanied by the coupled effects of electric and thermal fields and many influencing factors, such as the current density, temperature, normal load, sliding speed, etc. In this paper, we focus on the effect of a pulsed current on the friction characteristics of the contact interface between an aluminum alloy sheet and a P20 die steel. The specific test parameters are shown in Table 3.
In this study, the steps in conducting the pulsed current friction test were as follows. First, the position of the plating fixture was adjusted so that the aluminum alloy sheet could be fixed to the test machine. After fixing the plates, conductive grips were installed at each end of the machine to ensure that the pulse power supply was energized. The plates were then preheated for 10 min using the pulsed power supply. After the preheating was complete, the current parameters were adjusted, and the plates were continuously energized. The temperature of the plates was monitored in real time using an infrared thermographer. Finally, the remaining test parameters were set using the computer program, and the friction test began. After the friction test reached the predetermined effective stroke, the friction test was completed. All friction tests were repeated three times to ensure the accuracy of the data.

2.4. Material Characterization Methods

The frictional wear mechanism of the 7075 aluminum alloy was analyzed by post-testing the specimens under the action of a pulsed current. Firstly, we utilized the VK-X100 laser scanning microscope to analyze its three-dimensional morphology after conducting the friction test on the aluminum alloy sheet. Secondly, the wear surfaces of the plates were then analyzed using the JXA-840A scanning electron microscope (SEM) and the energy dispersive spectrum (EDS), and then the chemical composition was analyzed. Finally, the shape of the aluminum alloy ports perpendicular to the sliding direction of the aluminum alloy was also analyzed using SEM.

3. Results

3.1. Friction Coefficient at Different Current Densities

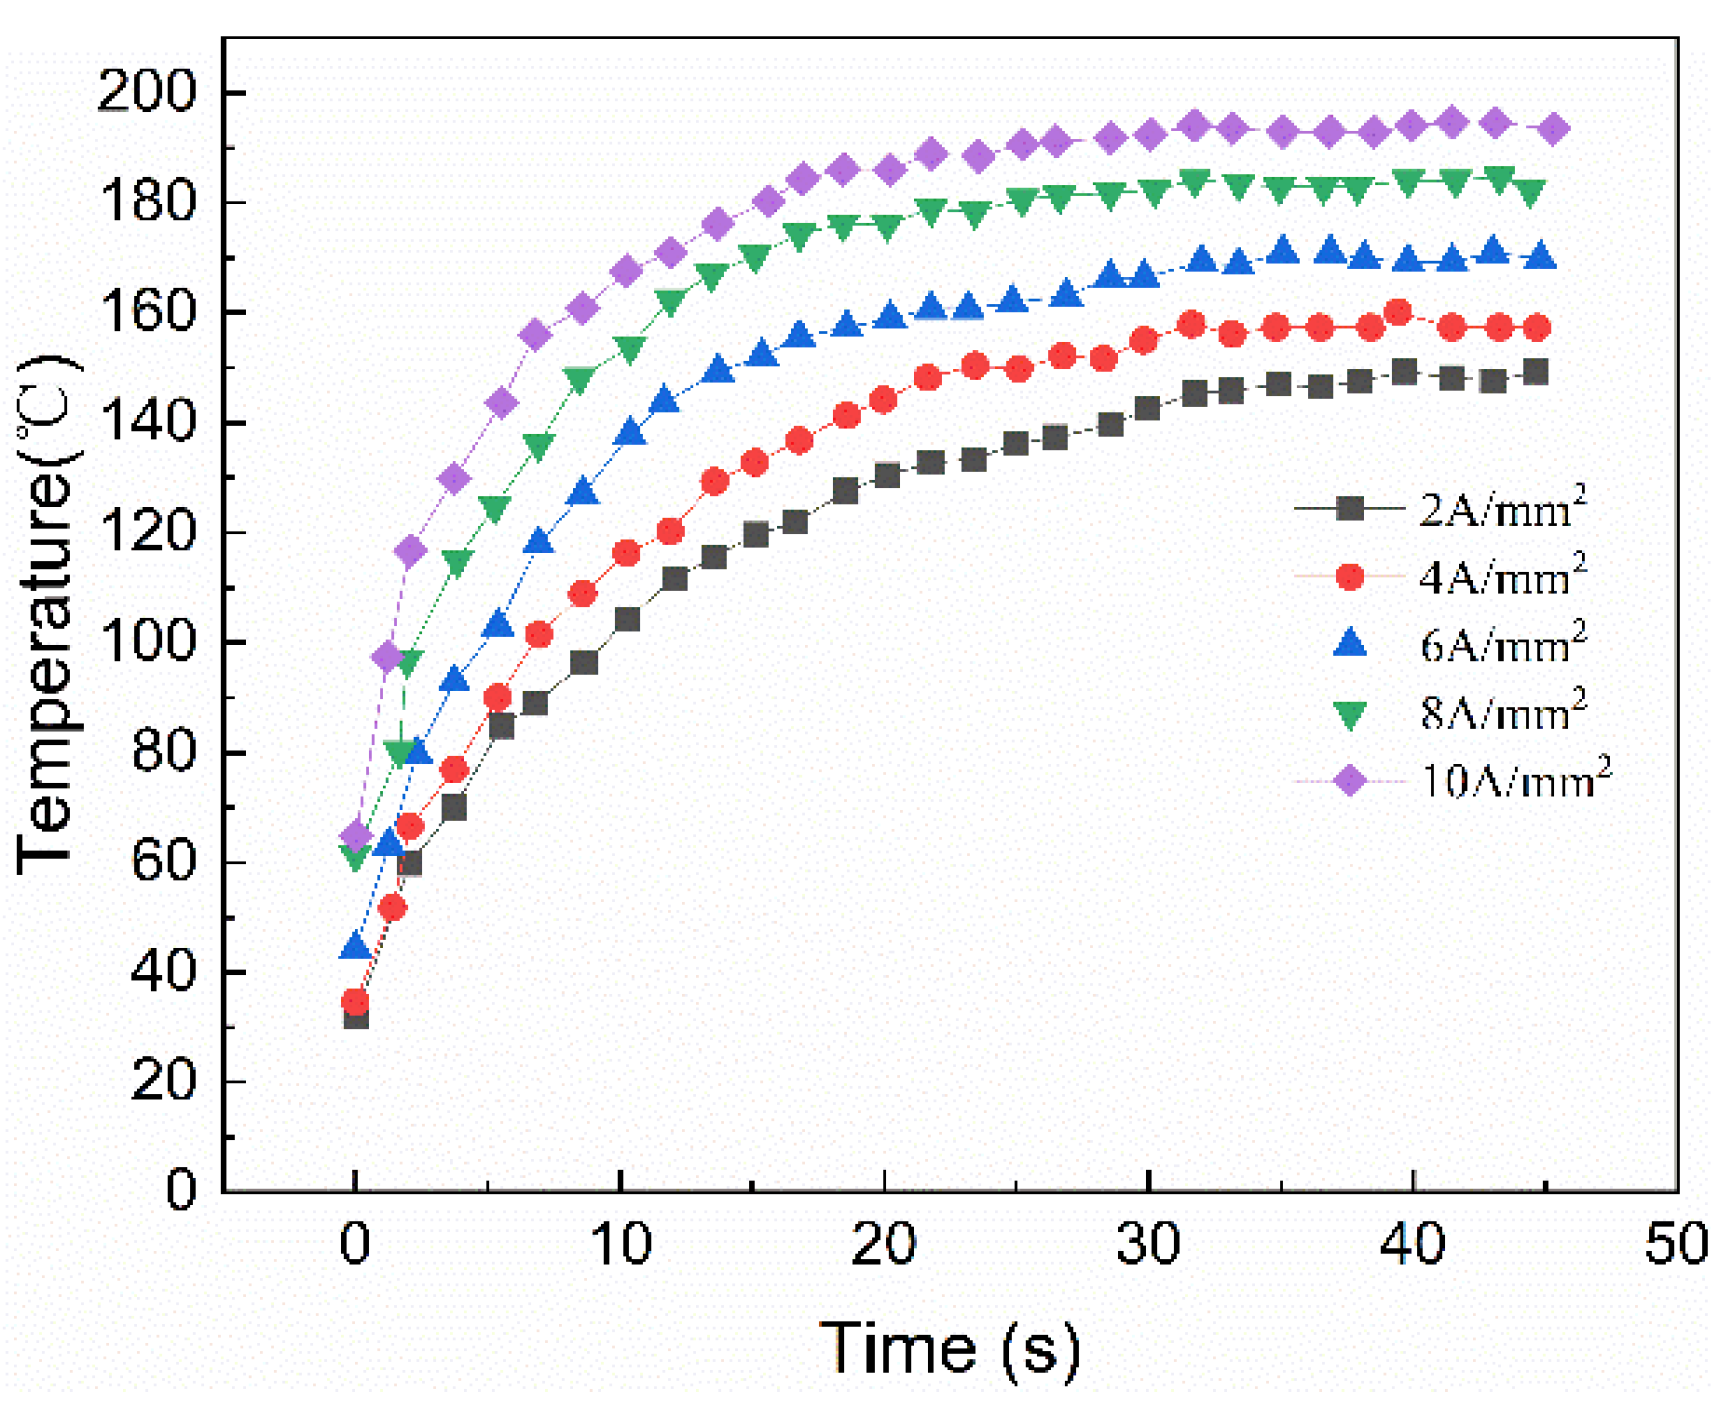
The aluminum alloy sheet produced a Joule heating effect when the pulse current was loaded, and the temperature of the sheet metal increased, which is significant in explaining the friction characteristics of metal sheet forming. The Optris infrared thermometer was used to measure the temperature in real time and the curve of the sheet metal temperature with the time under different current densities was obtained using Origin software, as shown in Figure 4. As seen in the Figure, the temperature curves under different current densities had a standard feature. The heating rate of the aluminum alloy sheet metal was fast until 20 s and tended to be stable with the continuous increase in time. The main reason is that the Joule thermal temperature under the pulse current increased with the influence of the air convection and thermal radiation coefficient on the sheet at the beginning of the test [32,33,34].
The current intensity values of the frictional tests were 30 A, 60 A, 90 A, 120 A, and 150 A, and the corresponding current densities were 2 A/mm2, 4 A/mm2, 6 A/mm2, 8 A/mm2, and 10 A/mm2, respectively. Under dry friction conditions, the friction coefficient curved with time at different current densities with a load of 8N and a speed of 4 mm/s (Figure 5a). In the graph, the coefficients of friction at different current densities have common characteristics: the coefficients of friction increased rapidly at first, then gradually decreased, and then finally plateaued. Moreover, the friction coefficient gradually decreased with the increase in the current density.
The effects of the current on the coefficients of friction are mainly manifested in the following aspects:
(1)
Current conduction in the material is limited to the conductive filaments. Due to the current’s contraction effect, it accumulates at the conductive filament, resulting in a rapid increase in temperature, which causes softening of the microprotrusions. This, in turn, reduces the biting depth and shear degree between the two contact surfaces, leading to less damage and significantly reduced roughness components at the contact interface.
(2)
The passage of current through the subsurface of the plate has a specific softening effect, which reduces plastic deformation. This softening effect is believed to enhance the migration of subsurface electrons, resulting in a decrease in the friction coefficient.
(3)
The increase in temperature caused by the current flow can lead to the rapid formation of an oxide film on the surface of the friction pair, which can act as a lubricant. As the current increases, the oxidation process accelerates, resulting in the formation of more lubricating oxide films on the contact surface of the aluminum alloy, which provides protection against wear. As a result, the friction coefficient tends to decrease with the increasing current, as the oxide film formed by oxidation serves as an effective lubricant [35,36].
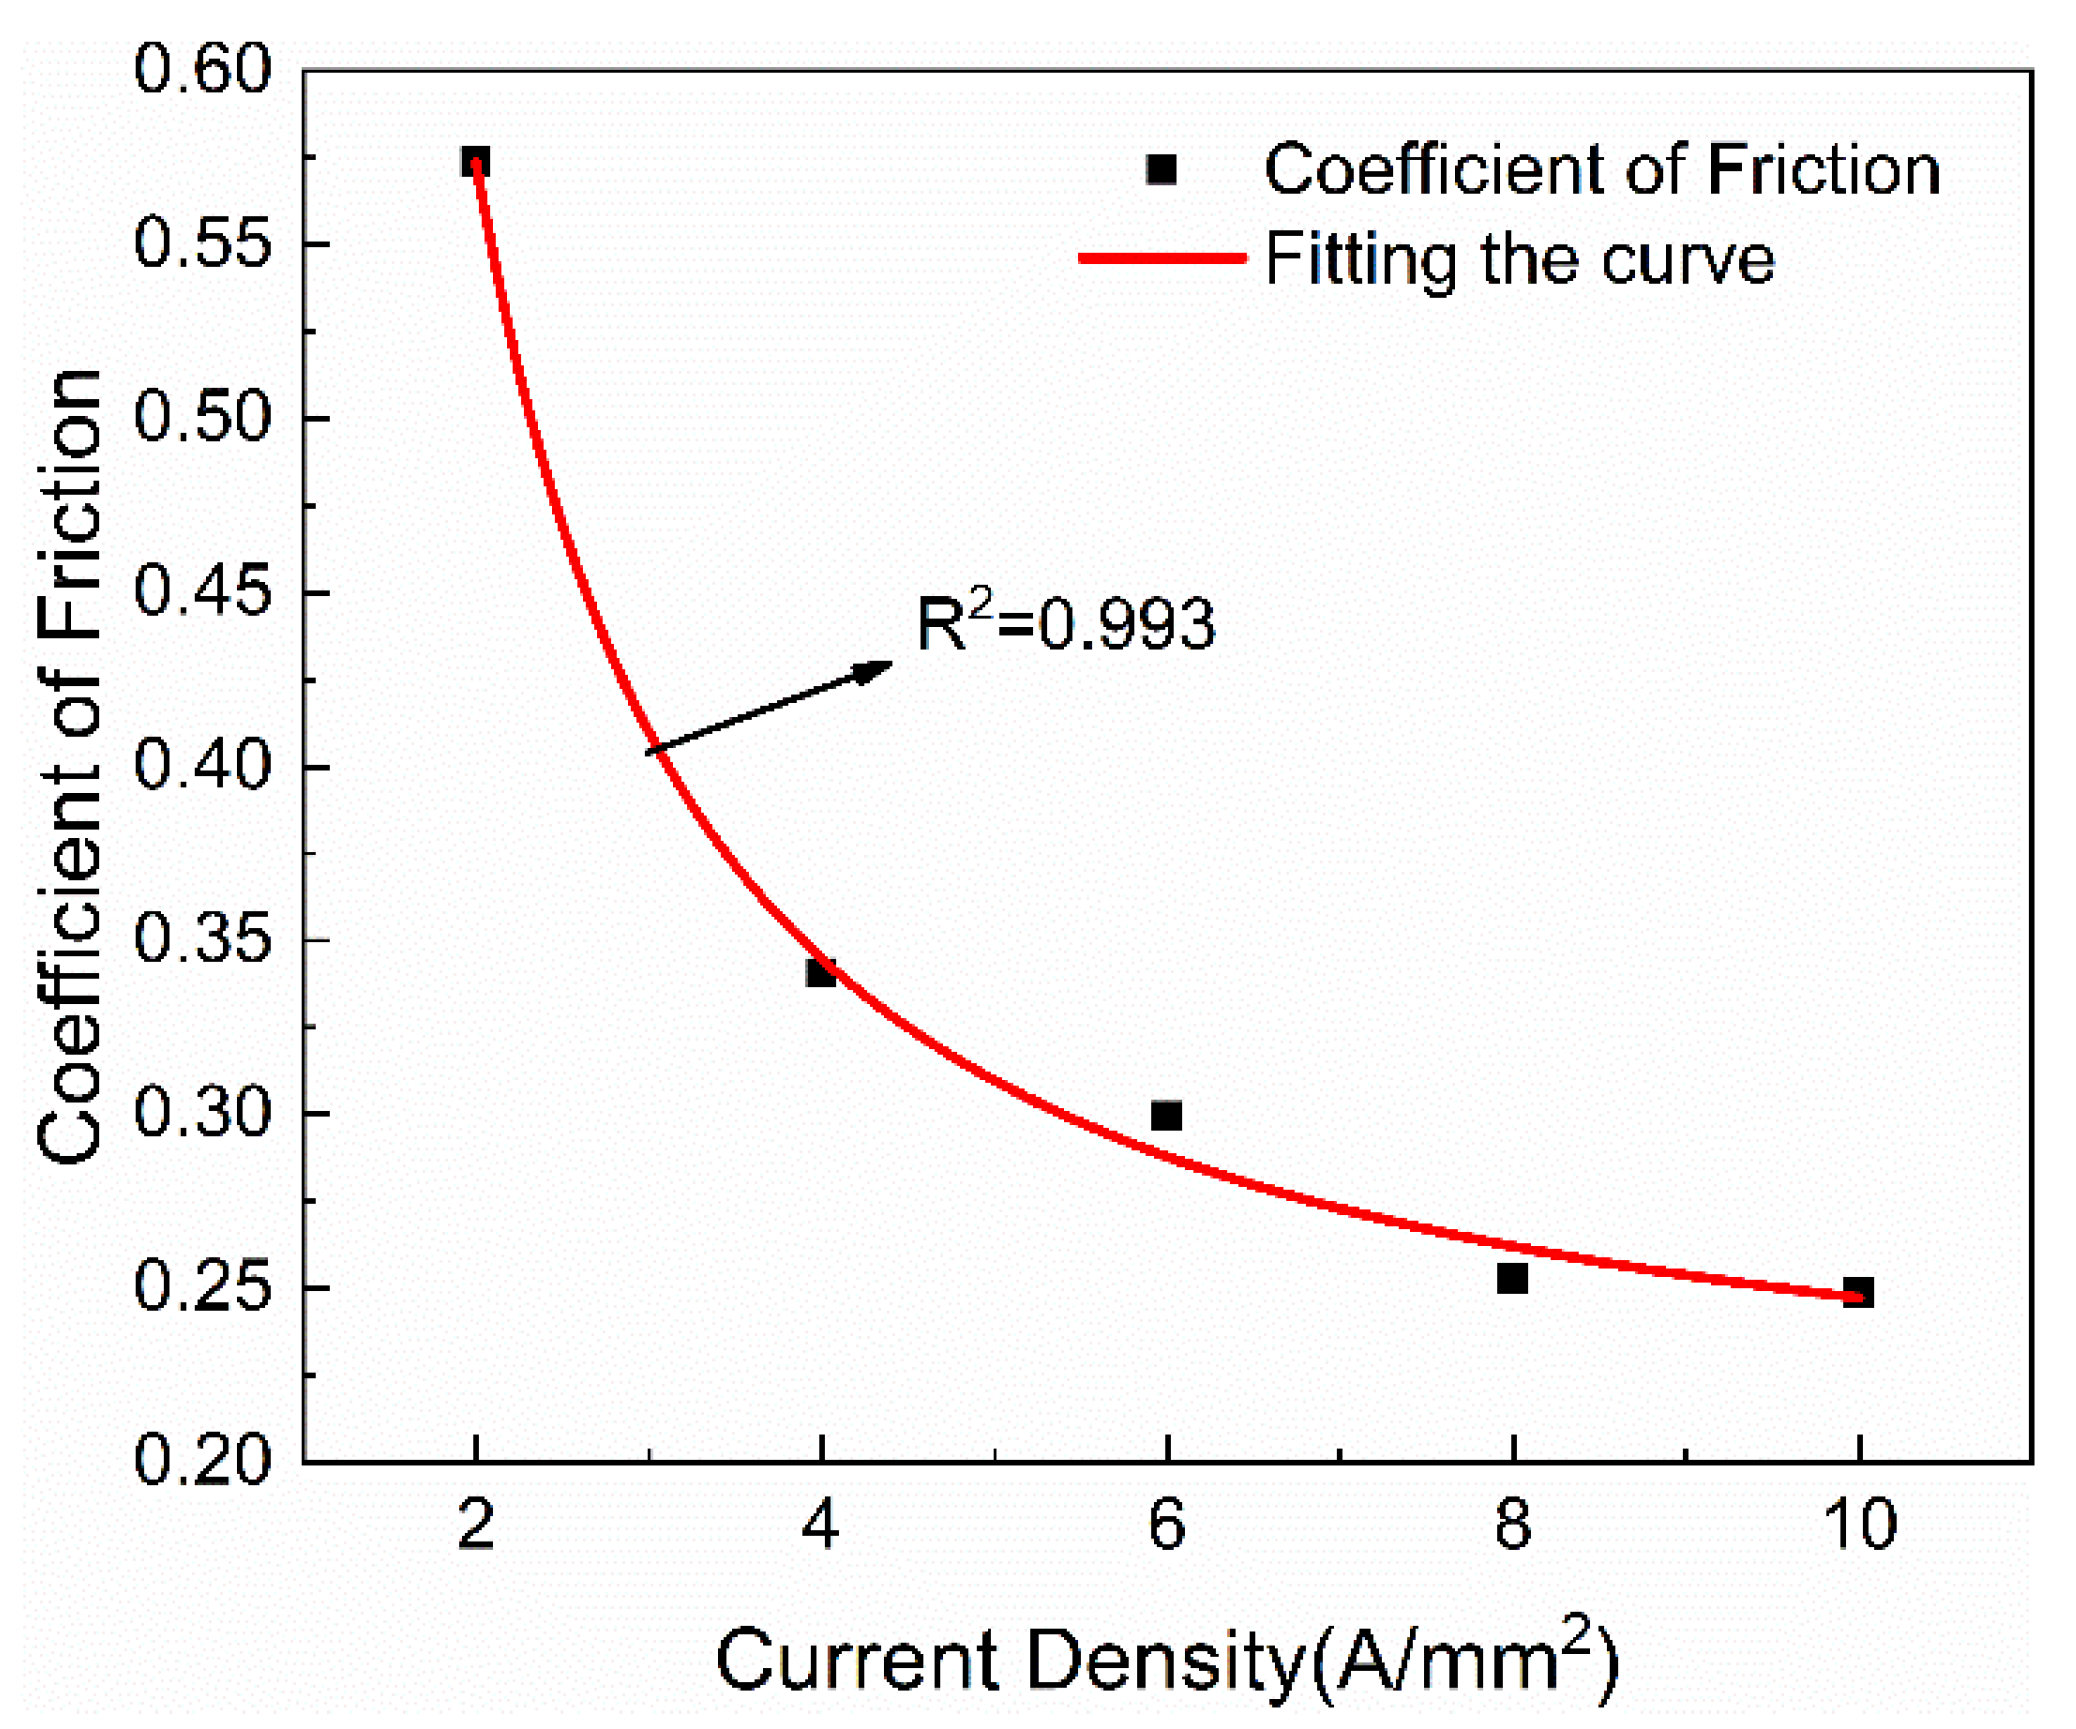
The average coefficients of friction with different current densities are shown in Figure 5b. The friction coefficients vary with different current densities as follows: ( μ 2 = 0.573 ) > ( μ 4 = 0.341 ) > ( μ 6 = 0.299 ) > ( μ 8 = 0.253 ) > ( μ 10 = 0.249 ) . The maximum friction coefficient was 0.573 when the current density was 2 A/mm2, and the minimum friction coefficient occurred at 10 A/mm2. Although the tests were carried out in the dry friction state, the average friction coefficients were lower than about 0.5, which was close to the friction coefficient in the boundary lubrication state. This phenomenon is normal, and the authors of [30] mention that proper current density can increase lubrication and thus reduce mechanical wear.

3.2. The Effect of Current Density on Surface Friction Mechanism

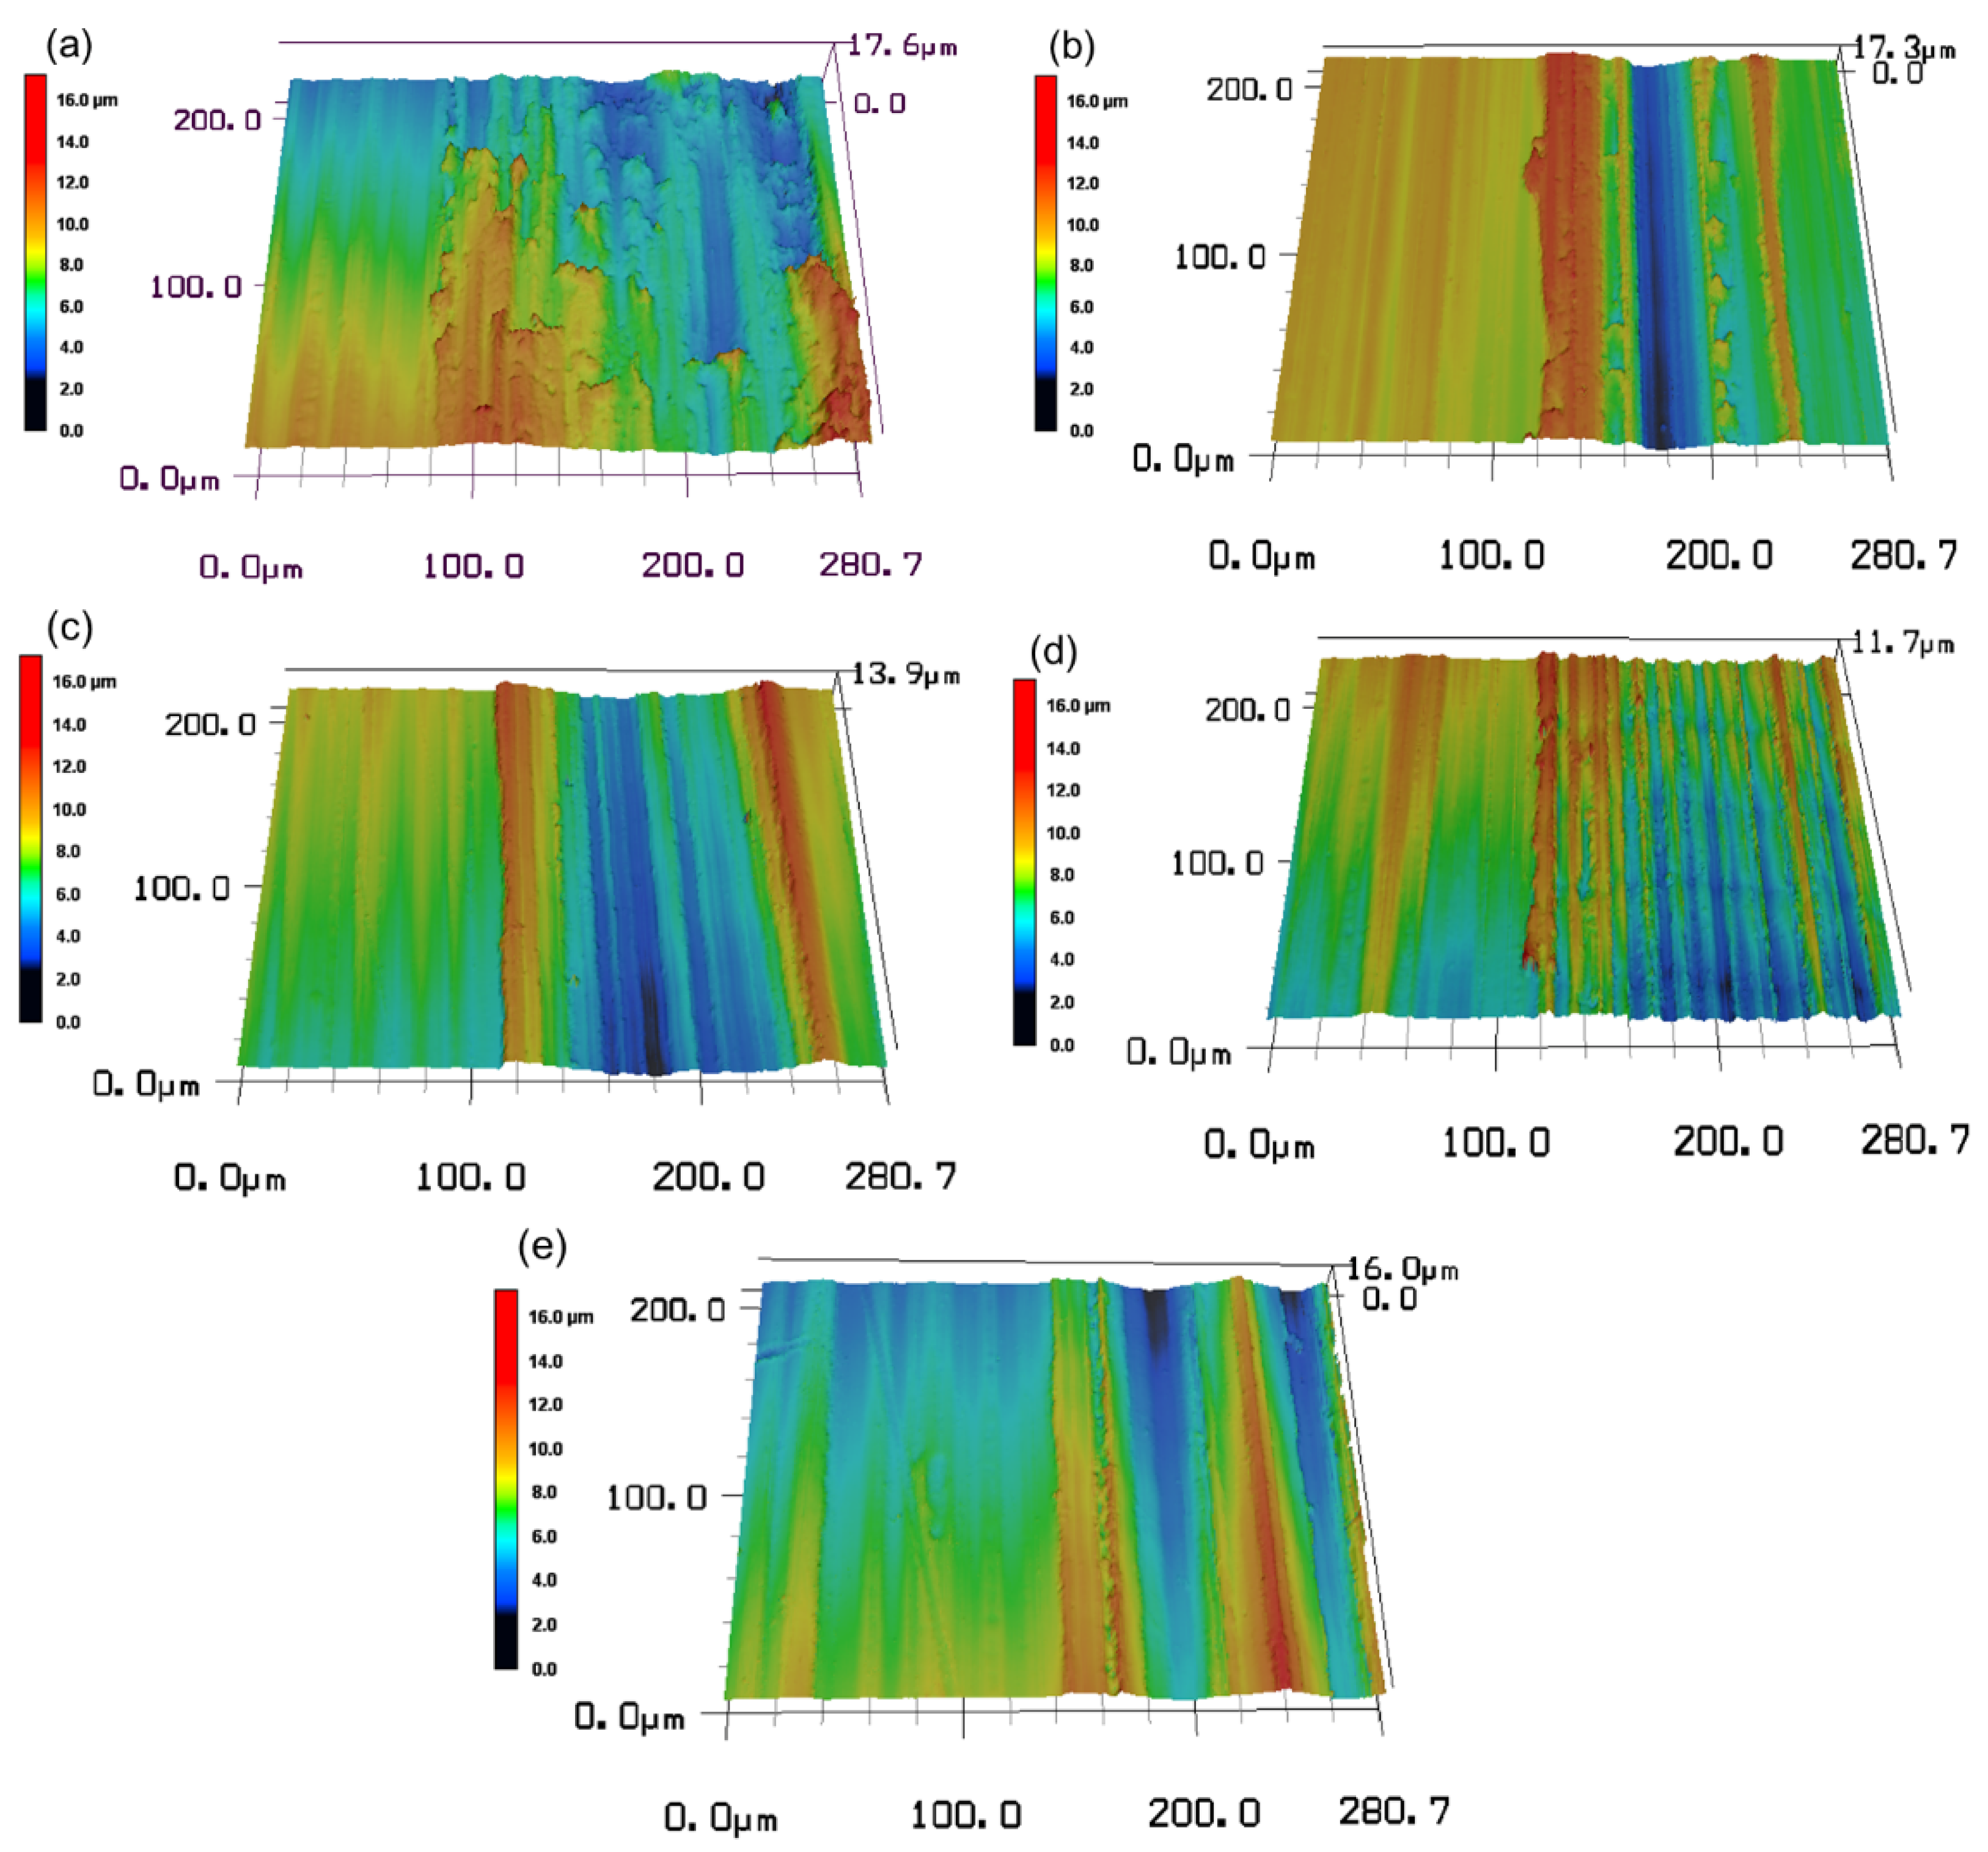
After the friction test, a VK-X100 laser microscope was used to observe the surface morphology of the AA7075 aluminum alloy at different currents, as shown in Figure 6. When the current density was 2 A/mm2, few scratches and peeling occurred on the aluminum alloy sheet surface (Figure 6a). A possible reason is the instantaneous heating effect of the pulse current, softening the metal. Under the dual impacts of Joule heat and frictional heat, the viscosity of the material increased, resulting in a higher friction coefficient value, and the primary friction mechanisms were viscous wear and furrow wear. When the current density increased to 4 A/mm2, the peeling traces on the sheet material disappeared, but it had more dents and deep scratches (Figure 6b). A possible reason is that the current density increased the continuous action of Joule heat, the metal surface oxide film reduced the friction coefficient, and the friction mechanism was furrow wear. When the current increased to 6 A/mm2, the number of dents decreased gradually, and the width became shallow (Figure 6c). A possible reason is the shrinkage effect of the current: the temperature of the pulse current at the conductive spot increased, resulting in the softening of the micro-convex body, thus reducing the friction coefficient, and the primary friction mechanism was furrow wear. As shown in Figure 6d, when the current reached 8 A/mm2, there were still multiple dents on the board, but the width and depth of the marks were reduced. The surface was relatively smooth, and the critical friction mechanism was furrow wear. When the current continued to rise to 10 A/mm2, there were only a few dents on the board, the friction marks became shallow, and the friction mechanism was furrow wear, as shown in Figure 6e.
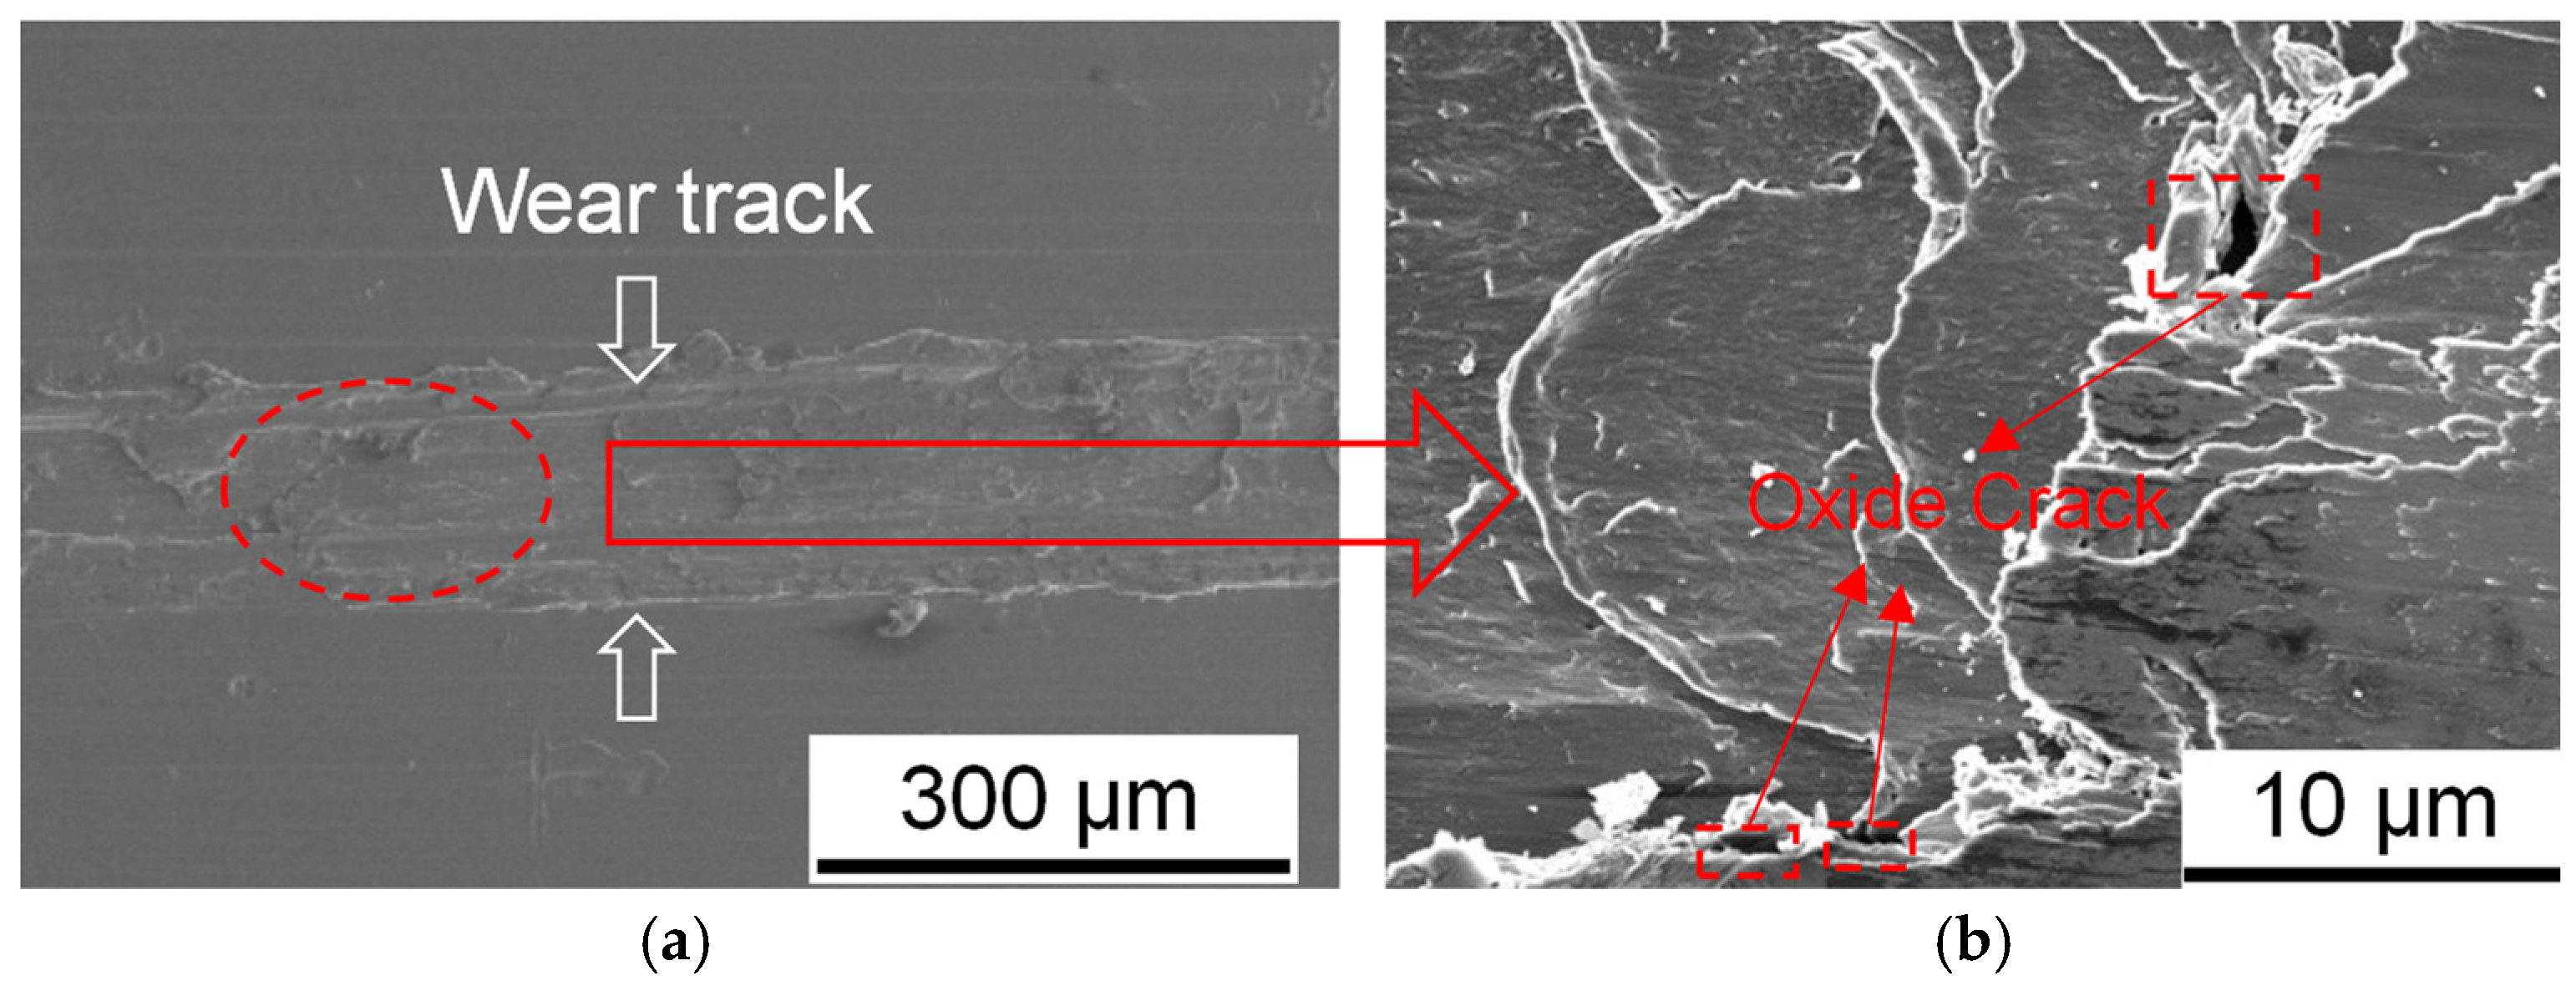
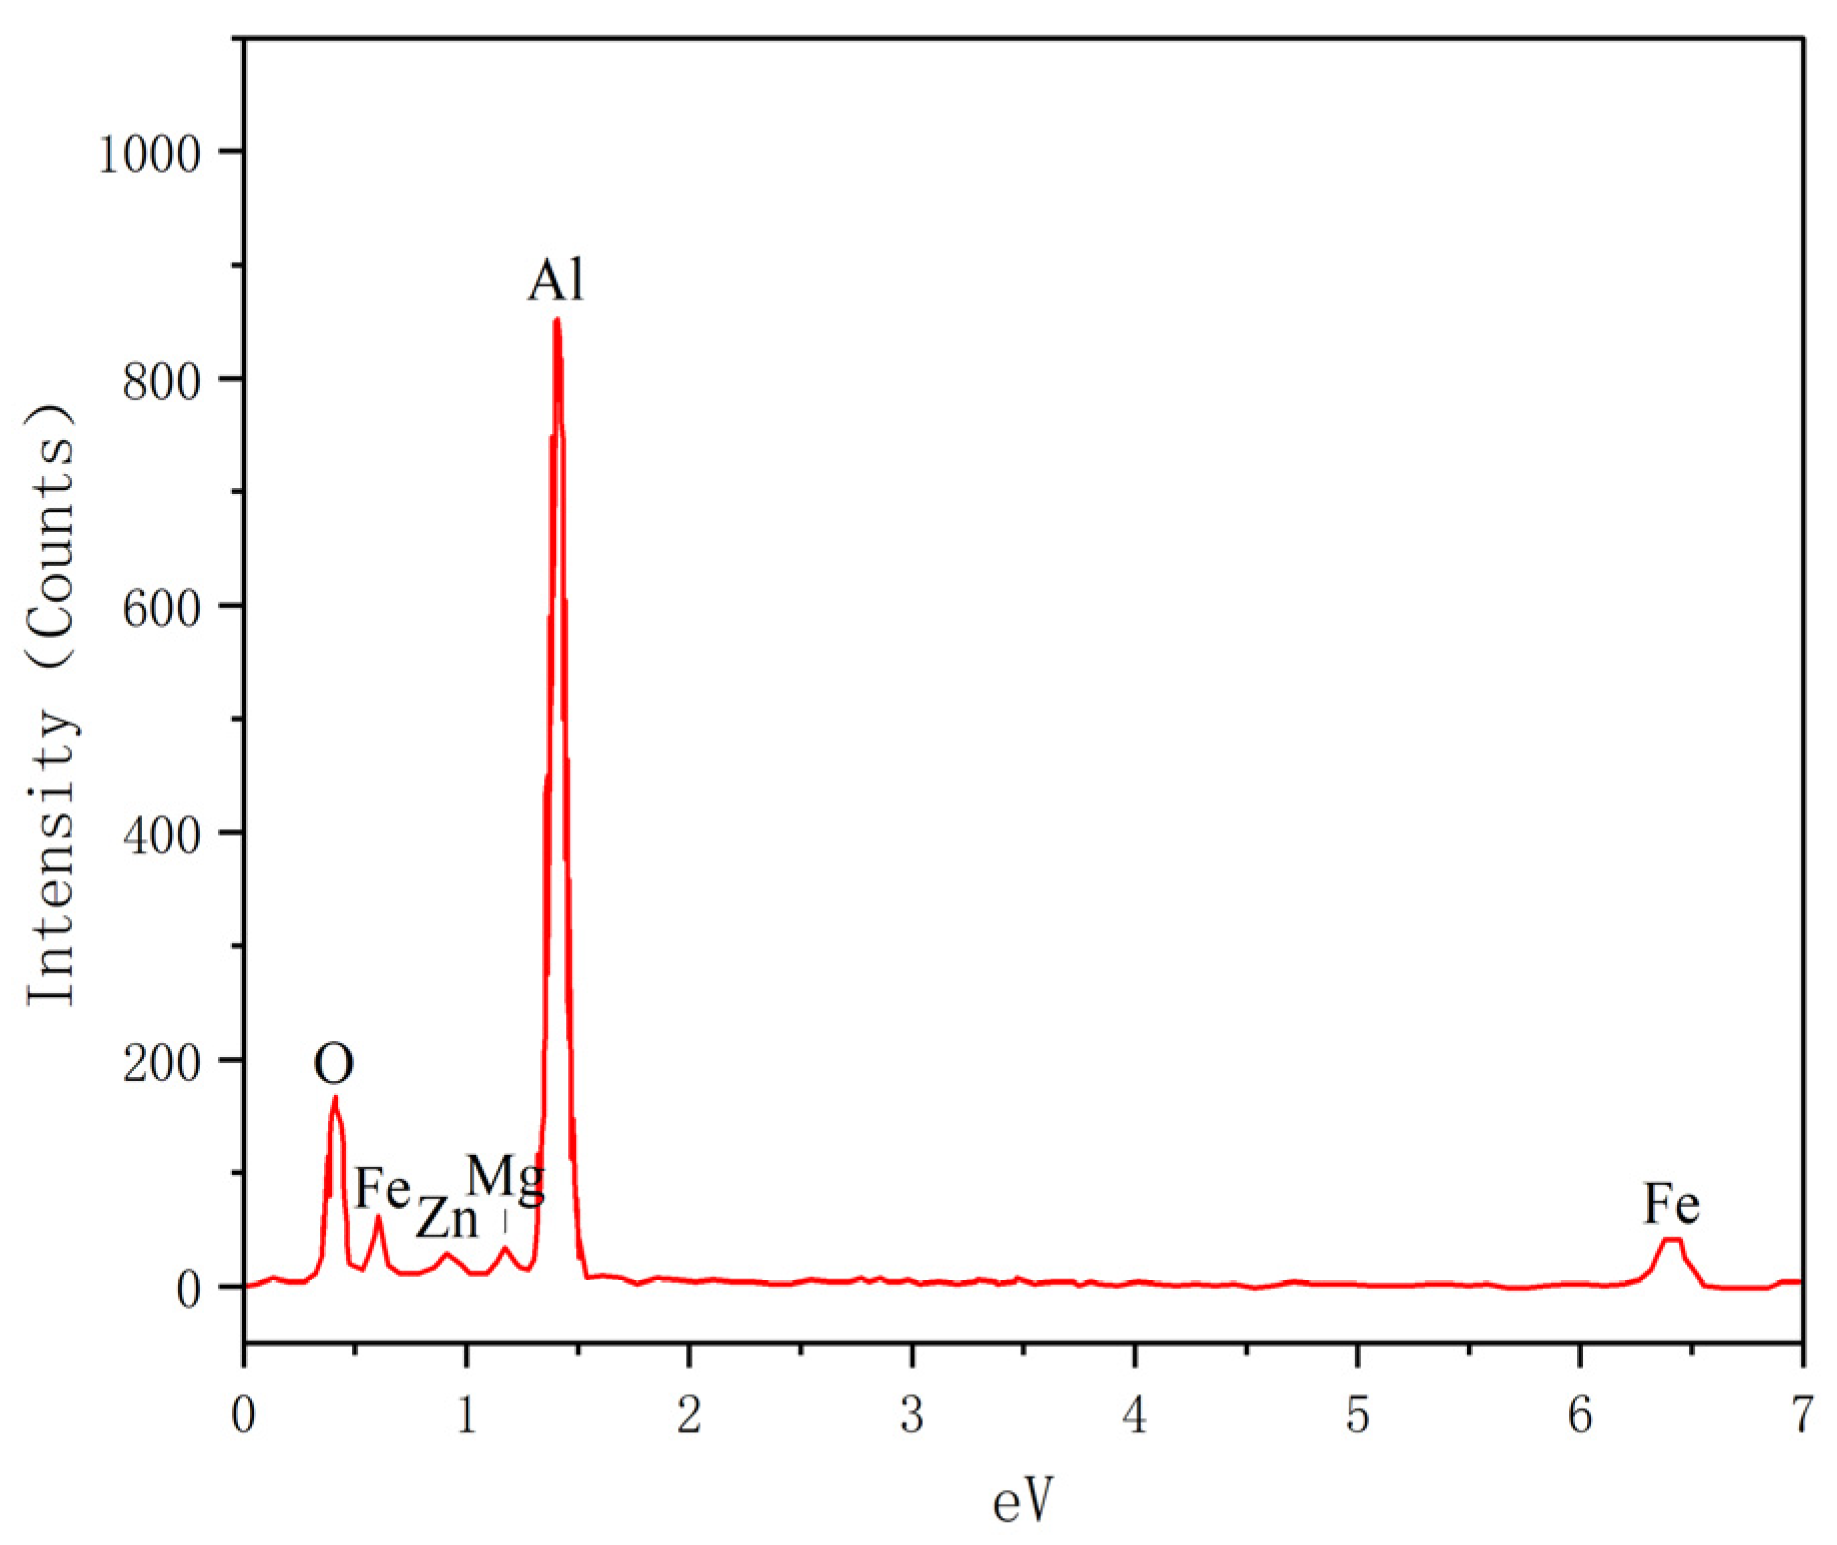
To further investigate the friction and wear mechanism under a pulsed current, the microscopic morphology of the surface of the aluminum alloy sheet was observed via a scanning electron microscopy (SEM) with a pulsed current density of 6 A·mm−2 as an example, and the results are shown in Figure 7. As shown in Figure 7a, wear marks parallel to the sliding direction were observed on the friction specimen, while the wear surface was relatively smooth with only shallow grooves present. In addition, some oxidation cracks were observed in the morphology beneath the wear surface, as shown in Figure 7b. The chemical composition of the wear surface of the sheet was further analyzed using EDS, and the results in Figure 8 show that it was mainly Al and O, with the mass fraction of O reaching 37.3% (i.e., 80% of the overall composition of the aluminum oxide). The generation of a continuous oxide film on the friction surface effectively avoided direct metal-to-metal contact between the friction pairs and reduced the occurrence of adhesive wear. This is mainly because when the pulsed current was passed into the metal during the process, the current easily produced an oxide layer on the aluminum alloy surface, and the current improved the oxidation properties of the sliding surface through surface polarity. The Joule heating effect of the pulsed current on the metal and the heat from the friction process also made the aluminum alloy surface more susceptible to oxidation, while the friction coefficient gradually decreased as a result.
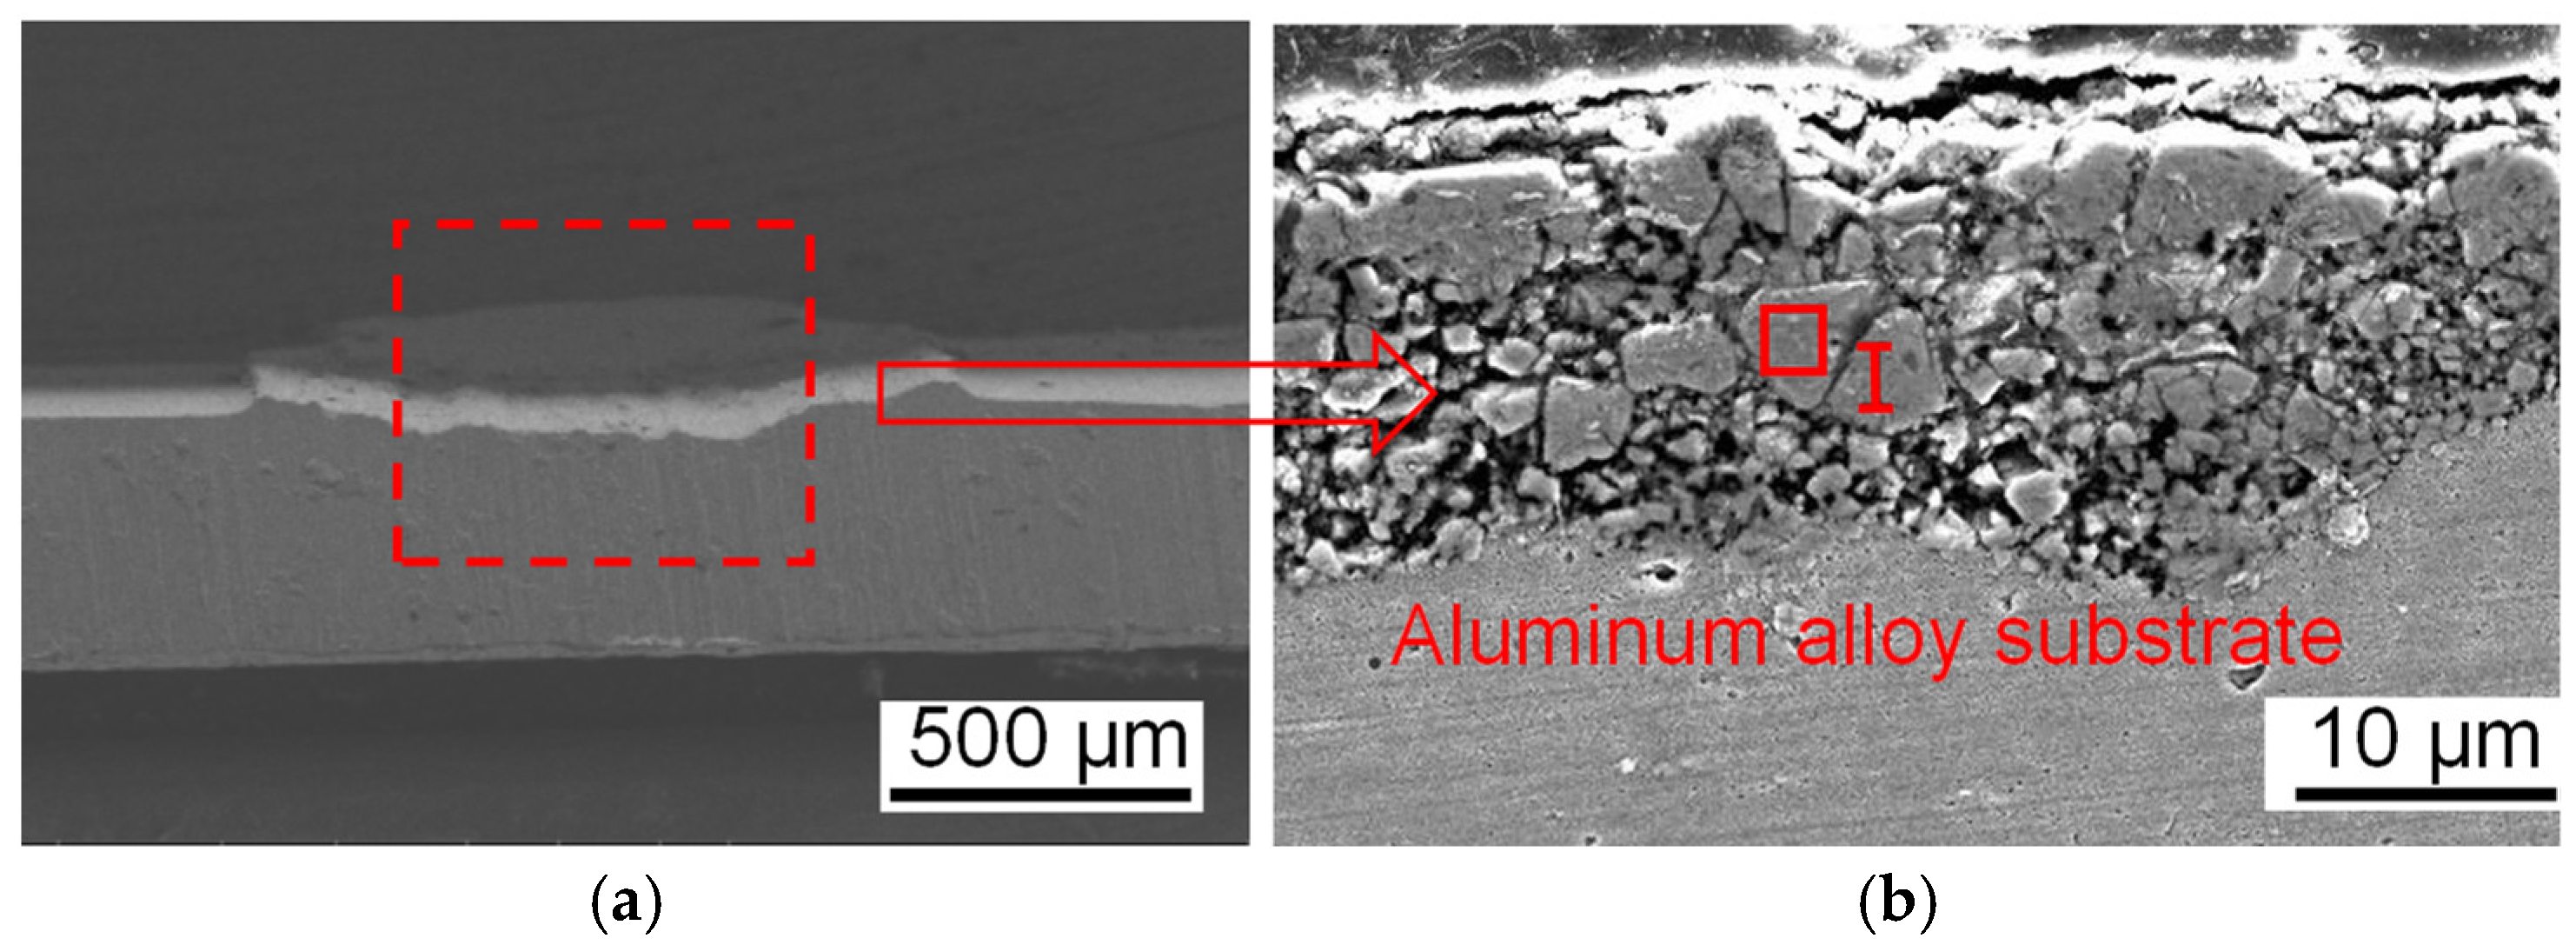
To investigate the frictional wear mechanism under pulsed current, the cross-sectional specimens of the aluminum alloy were observed using scanning electron microscopy (SEM) after the friction test, as depicted in Figure 9. A high-temperature softening effect occurs in aluminum alloy under the influence of the current, as seen from the microscopic state of the surface morphology of the cross-section after friction. The white layer that appears in the middle of the cross-sectional after friction, as shown in Figure 9a, is due to the frictional heat generated during the friction process and the Joule heat after the introduction of the current. This results in adhesive deformation on the upper surface of the aluminum alloy, leading to an increase in the frictional area and surface roughness of the sheet. The morphology of the intermediate white layer was further observed in Figure 9b, which revealed the presence of a mechanically mixed layer (MML) formed by the combination of the oxide generated during the wear process and the substrate under the action of the pressure of the two contact surfaces. The composition of the MML layer was analyzed using EDS, and the results in Table 4 showed that at the wear of 6 A·mm−2, the O content was 18.1%, the Al content was 67.8%, and the Fe content was 10.9%. The presence of Fe indicated the occurrence of material transfer on the wear surface of the plate, where the mold material was attached to the surface of the aluminum alloy sheet [37].

3.3. Establishment of Friction Coefficient Model Based on the Current Density

As can be seen in Figure 5b, when the current density was less than 6 A·mm−2, the average friction coefficient decreased with the increase in the current density. However, the trend of the friction coefficient decreasing with the increasing current density became stable when the current density was more than 6 A·mm−2. One reason is that before the current density increased to 6 A·mm−2, the Joule heat and frictional heat generated by instantaneous heating during the pulse current reduced the friction coefficient. The other reason is the low sliding speed: the micro-convex body between the surface of the plate and the surface of the P20 steel had enough time to produce plastic deformation, which increased the contact area and ultimately led to an increase in the friction coefficient of the plate. So, the friction coefficient decreased with the increasing current density and stabilized when the current density was above 6 A·mm−2. According to the above analysis and the law of curve change, the pattern of the evolution of the friction coefficient with the current density conforms to an inverse function. Therefore, the new friction coefficient expression is as follows:
μ = a J + b + c
where, μ is the coefficient of friction; J is the current density; and a, b, and c are constants. Then, the friction data were imported into the Origin software to fit the inverse function curve shown in Figure 10. The error between the fitted curve and the experimental data was small, and the fitting degree was 0.993, so the function accurately reflects the current friction coefficient with the current density. Using the Origin software fit, a = 0.50, b = −0.68, and c = 0.19 were obtained. Thus, the new friction model expression is as follows:
μ = 0.50 J 0.68 + 0.19
Five groups of different current densities (1 A/mm2, 3 A/mm2, 5 A/mm2, 7 A/mm2, and 9 A/mm2) were selected to verify the correctness of the new current friction model. Five sets of actual experimental measurements under different current densities and the predicted values of the new friction model are shown in Table 5. As can be seen, the total errors were less than 9%, the lowest error was 3.89%, and the maximum error was 8.13%. This indicates that the fitted current friction model can better reflect the law of the friction coefficient with different current densities in the metal forming, verifying the effectiveness of the current friction model.

4. Simulation and Experimental Validation

To improve the accuracy of the software simulation and verify the accuracy of the new friction model at different current densities, we adopted the sequential coupling model for simulation, used the same AA7075 aluminum alloy as the research object for the thermoelectric coupling simulation, and then imported the simulation temperature field results into the thermal stamping as a predefined field. Then, we intuitively and effectively analyzed the temperature, strain, and stress fields under the different process parameters to verify the effectiveness of the new current friction model.

4.1. Finite Element Analysis of Thermoelectric Coupling

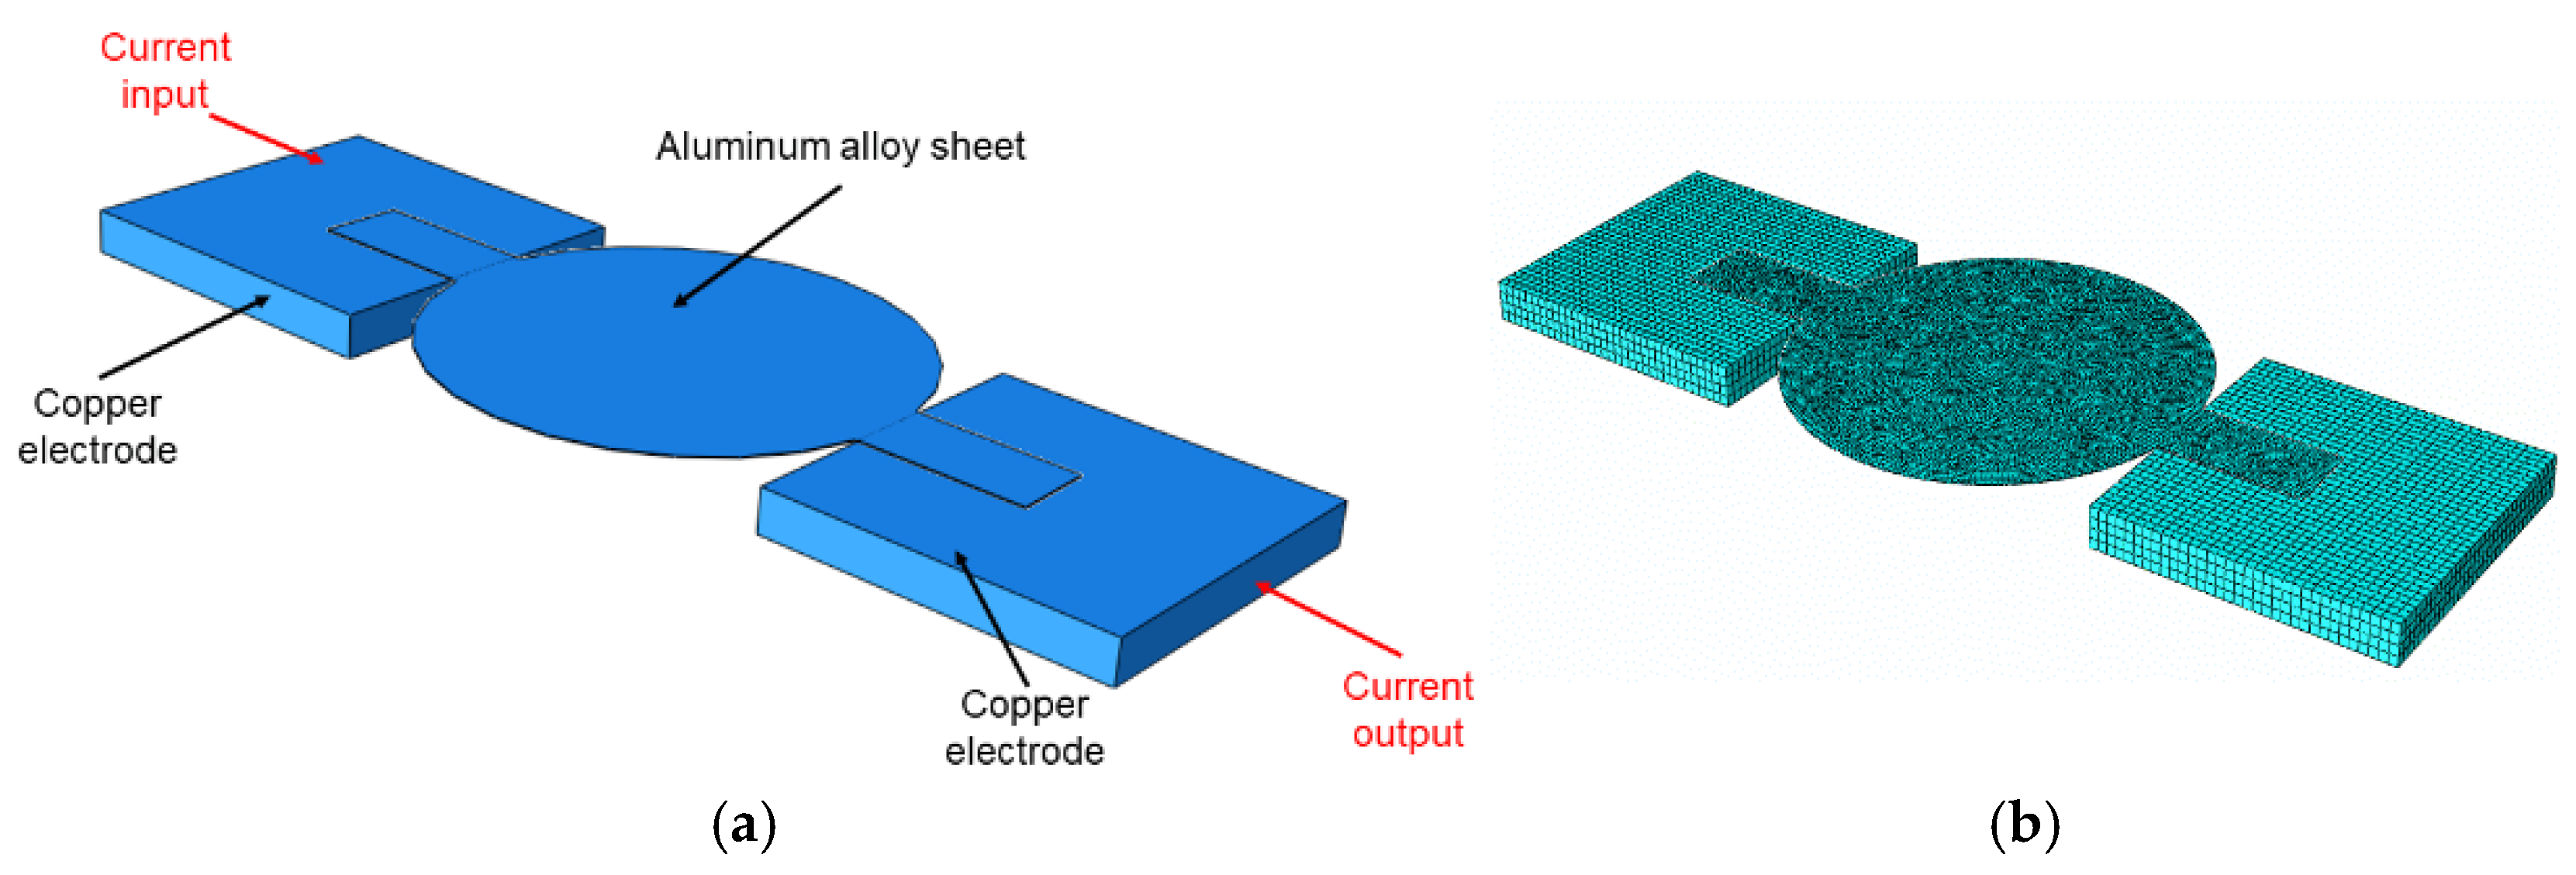
In the thermoelectric coupling simulation, the copper electrode and the AA7075 aluminum alloy sheet models improved the computational efficiency, as shown in Figure 10. The aluminum alloy sheet had a diameter of 165 mm and a thickness of 0.5 mm; to facilitate current loading, the ends on both sides had a length of 60 mm and a width of 30 mm. The size of the grid mesh was 1 mm, the unit size was 4 mm, and the grid number was 29,696. The size of the copper electrode was 120 mm × 120 mm × 60 mm, the unit size was 2.5 mm, and the grid number was 4396. Due to the thermoelectric coupling analysis involving the current field, temperature field, potential field, etc., the mesh type of the model was set as an 8-node linear hexahedral thermoelectric coupling element (DC3D8E).
In thermoelectric coupling, the pulse current will bring the Joule heating effect. Hence, copper electrodes and aluminum alloys use temperature-related parameters, citing the simulation-related data of [38], as shown in Table 6 and Table 7.
In the thermoelectric coupling simulation, the heat transfer coefficient between the sheet and the surrounding environment is cited in the literature [39], as shown in Table 8. In the temperature boundary, the entire model was set to a room temperature of 298.15 K through a predefined field. The current was loaded on the sheet metal through the node set of the copper electrode. A zero-potential boundary was set on the other side of the sheet. The contact between the aluminum alloy metal sheet and the copper electrode was set to normal hard contact and a penalty function: when the distance between the aluminum alloy sheet and the copper electrode is less than 0.1 mm, the contact thermal conductivity is 10 mW/m2·K.

4.2. Finite Element Analysis of Thermal Stamping Forming

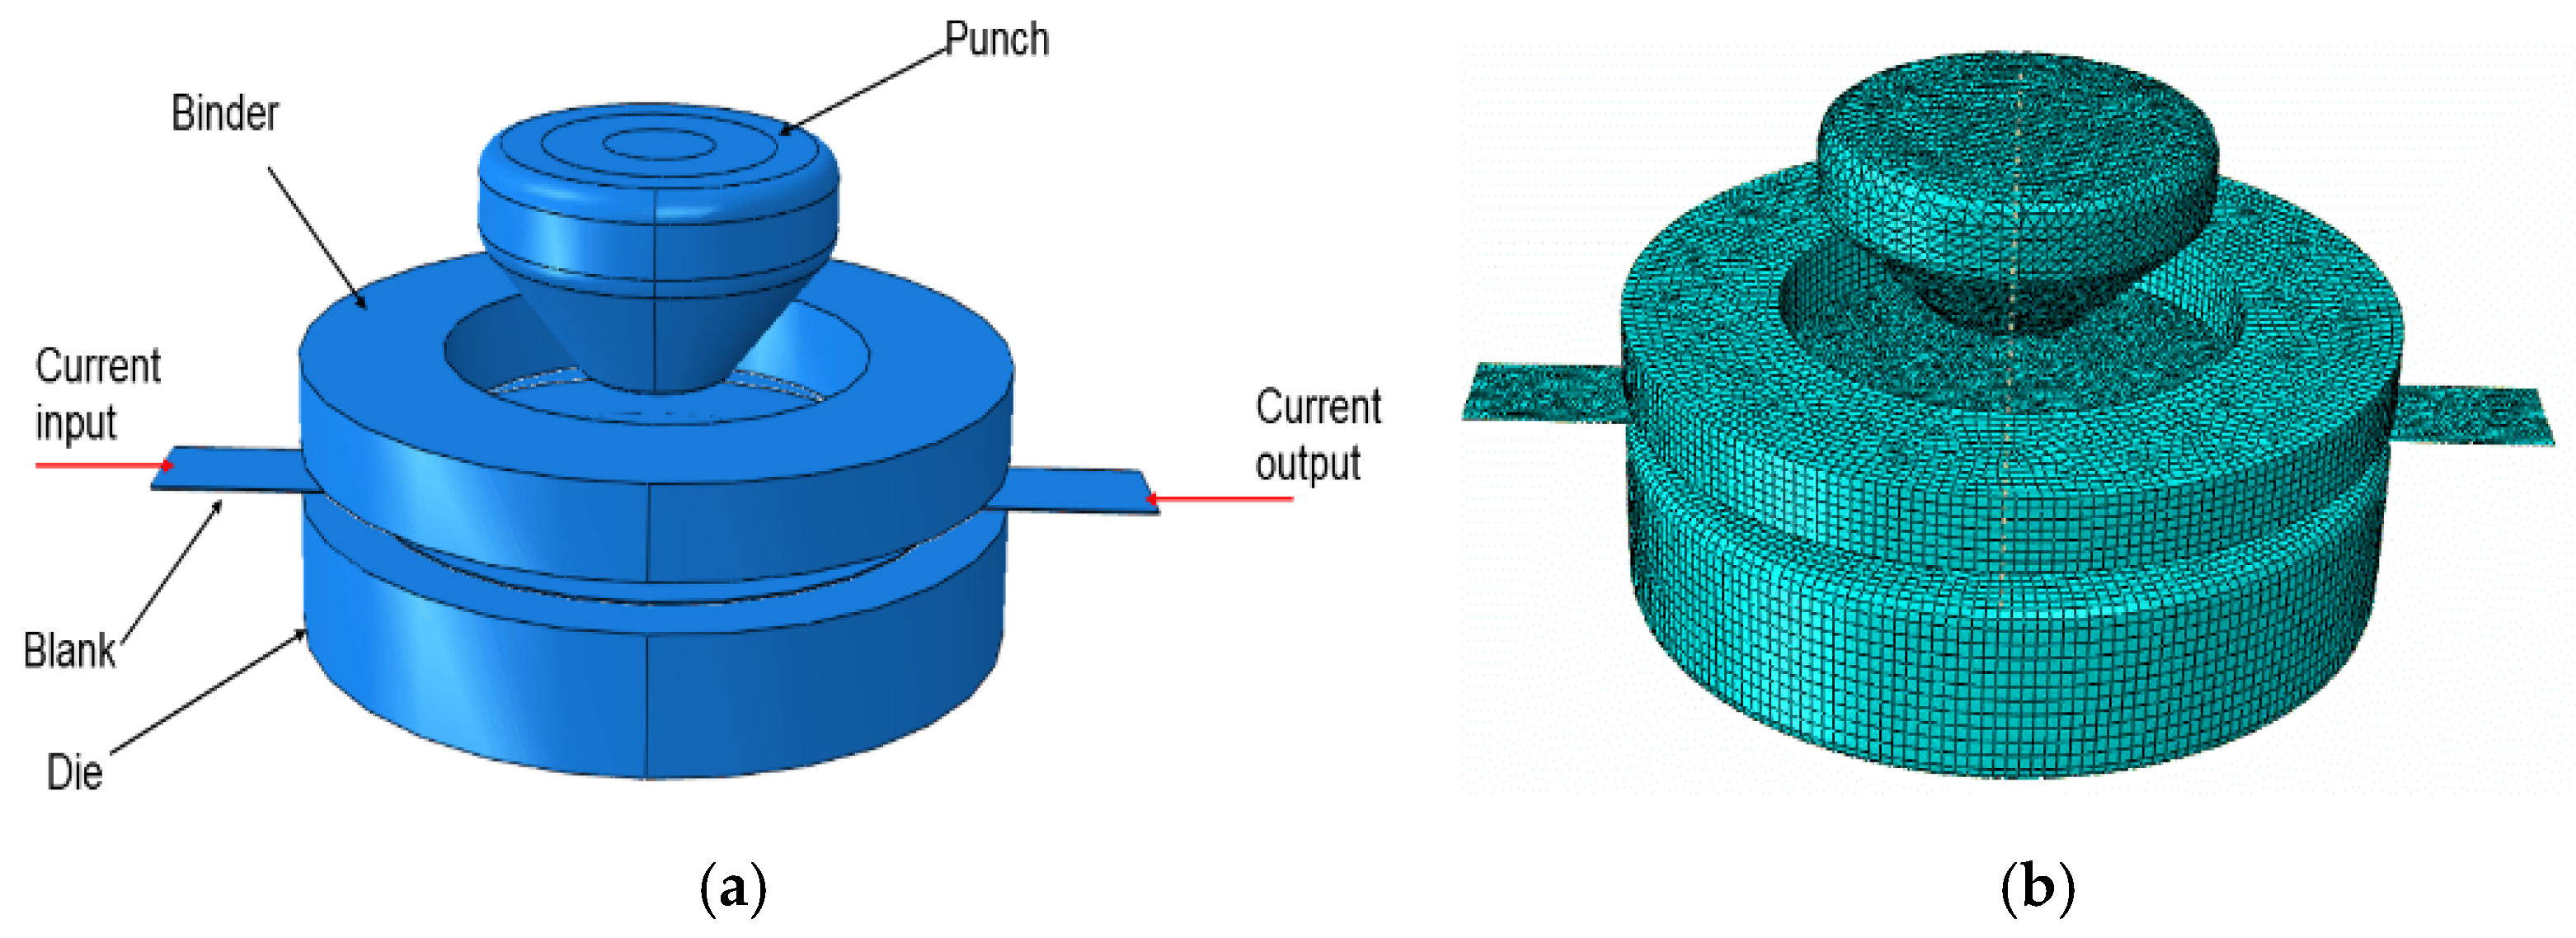
SolidWorks software was used to model the punch, die, and blank holder, and then the data were imported into ABAQUS after assembly, as shown in Figure 11a. The essential dimensions of the mold are shown in Table 9. The meshing type was the thermoelectric structure coupling unit (Q3D8R), the unit size was 2 mm, and the total number of grids was 11,132. The size of the sheet material was consistent with the thermoelectric coupling simulation, and the grid type was the thermoelectric structure coupling unit (Q3D8R). The analysis step units used thermoelectric structure coupled units, and the meshing assembly model is shown in Figure 12b.
The mold material was P20 stainless steel, with a density of 7.81 g/cm3, Young’s modulus of 205 GPa, and Poisson’s ratio of 0.275, and its thermal performance parameters are shown in Table 10. The sheet metal material was also an AA7075 aluminum alloy, and its material parameters were consistent with the parameters in the thermoelectric coupling simulation. The stress–strain curve data are cited [39]. In the temperature boundary, the temperature field results of the thermoelectric coupling simulation were imported as the initial conditions into the predefined fields of the thermoelectric-structure coupling. The current was loaded on the sheet metal through the node. The current direction is shown in Figure 11a. Zero-potential loading occurred on the other side of the sheet. The die was set as a fixed constraint, the vertical displacement of the punch was set to 35 mm, and the pressing force was set to 2.5 kN. When the distance between the sheet and the mold was less than or equal to 0.1 mm, the contact thermal conductivity was 10 W/m2·K. When the space was more than 0.1 mm, the value was 0.

4.3. Results Analysis and Example Verification

The sheet temperature field distribution at a current density of 10 A·mm−2 for 100 s is shown in Figure 13. In Figure 13, the highest temperature is about 450 K, and the lowest temperature in the middle of the sheet is 319 K. The high temperature is in the middle area, in which the distribution is relatively uniform, the temperature at both ends is low, and the change is not constant. The process considers the convection heat transfer coefficient of aluminum alloy sheet and air, the temperature rise of the joule thermal effect, and the contact between copper electrode and the left and right ends, which is why the temperature of aluminum alloy material was relatively high near the middle. The temperature change of the contact electrodes was small because the resistivity of the copper electrode was less than that of the aluminum alloy sheet.
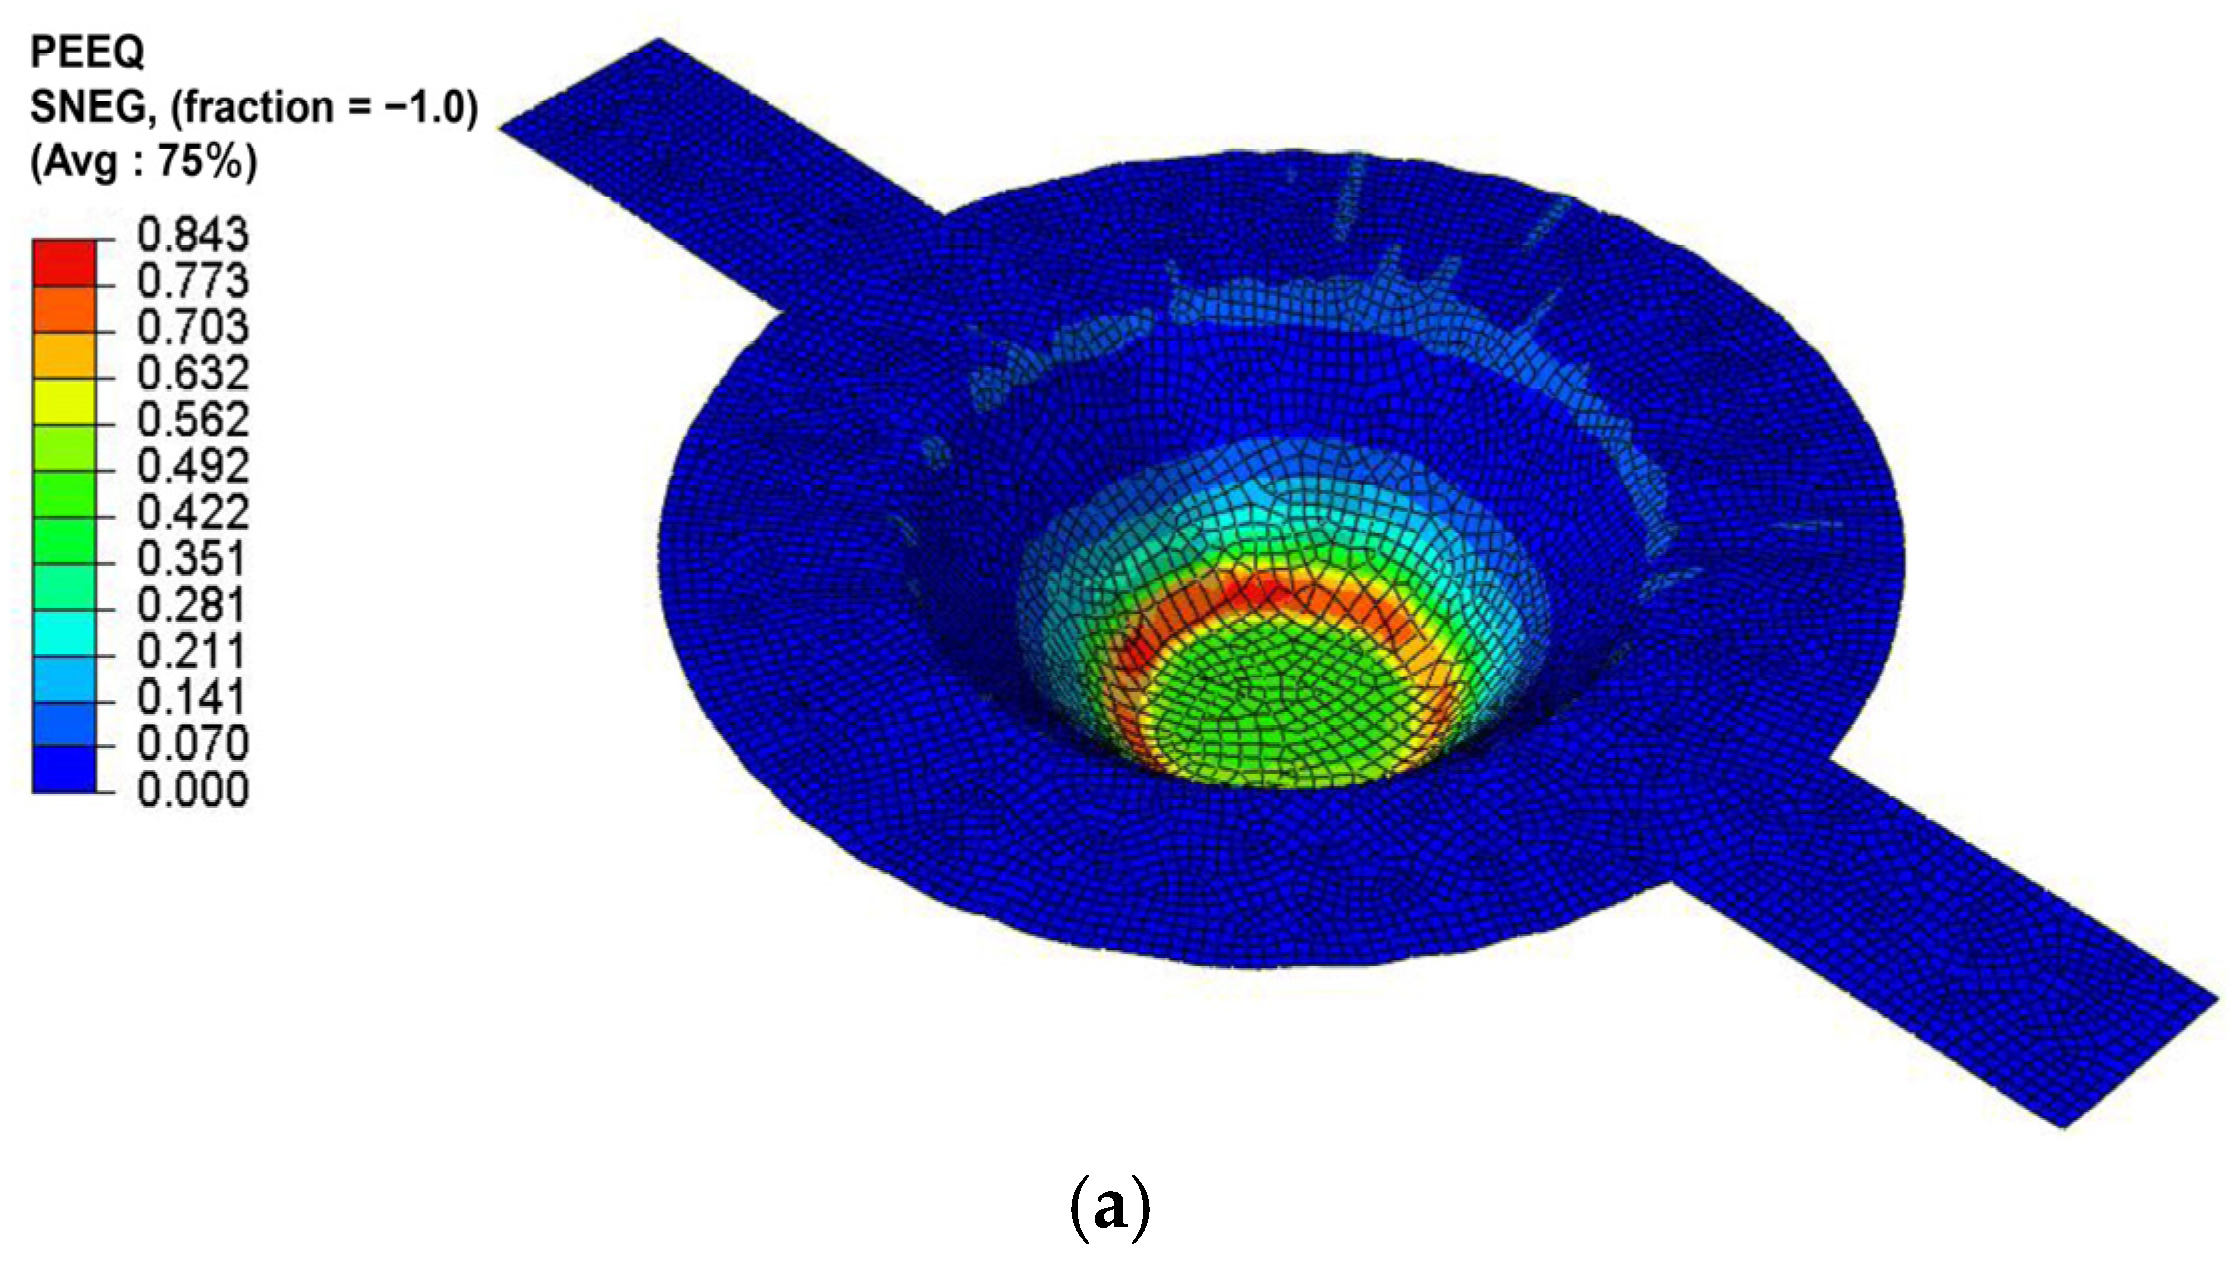
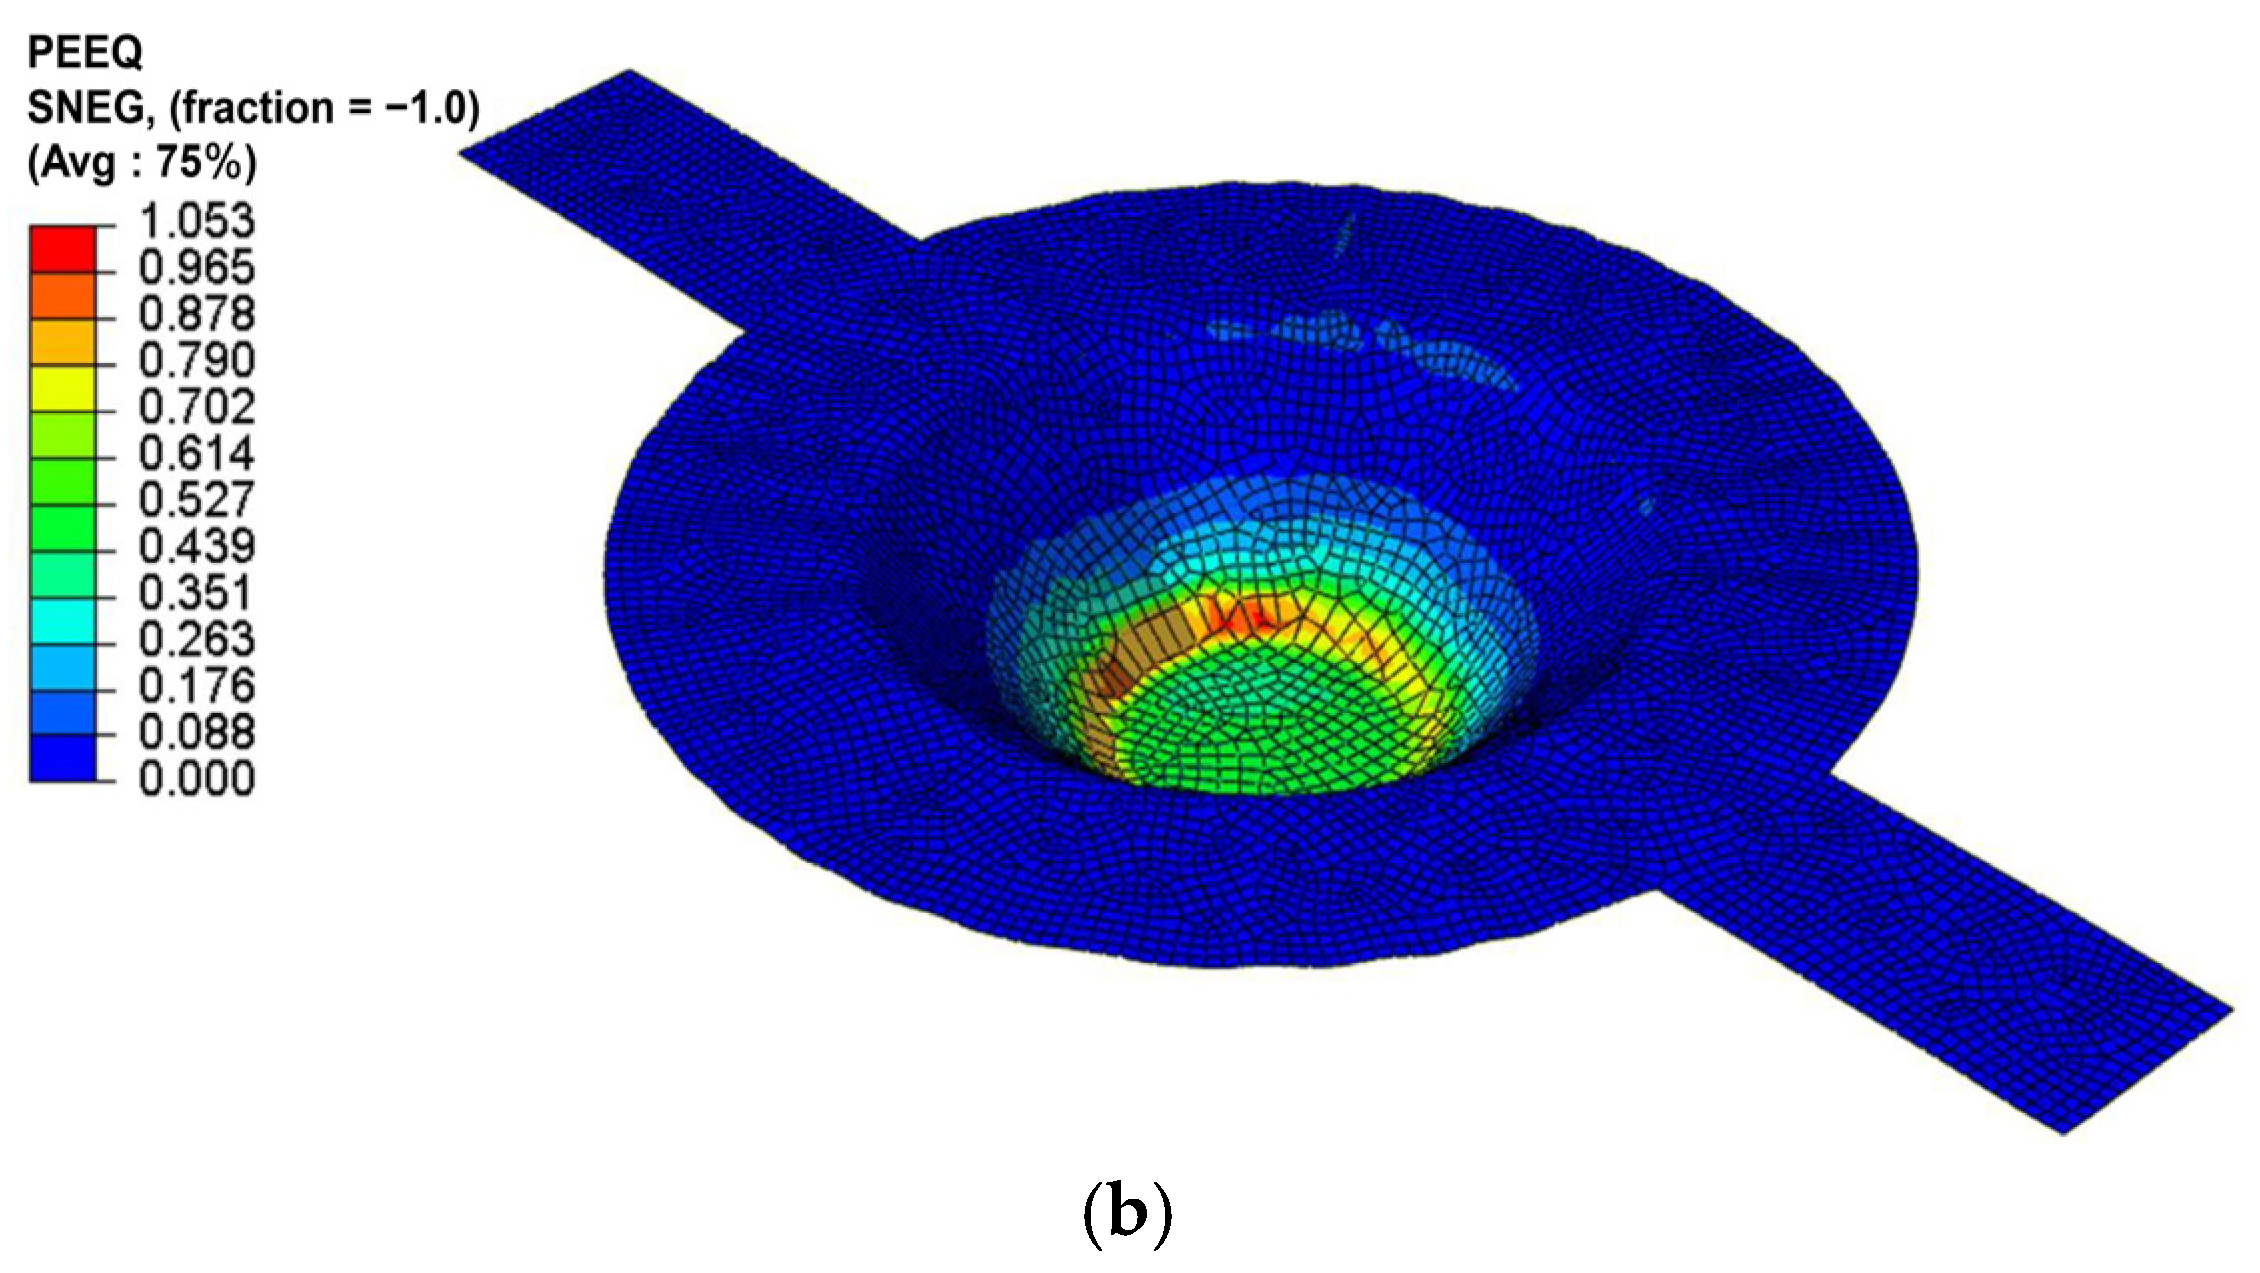
The electro-assisted thermal stamping simulation was carried out in two groups: one used a fixed friction value, μ = 0.1, and the other used the new current friction model. The new friction model was written in the Fortran language with a subroutine of “fri-coef” to submit jobs to the Job module. Figure 14a,b show the equivalent plastic strain after thermal stamping simulation under the different friction models. As can be seen in the graphs, the equivalent peak plastic strain at the fixed friction values was greater than the current friction coefficient model, and the maximum equivalent plastic strain was concentrated at the rounded corners of the punch. Because the sheet metal was subjected to the stretching effect at the bottom of the punch fillet during the deep drawing process, the sheet metal had high fluidity.
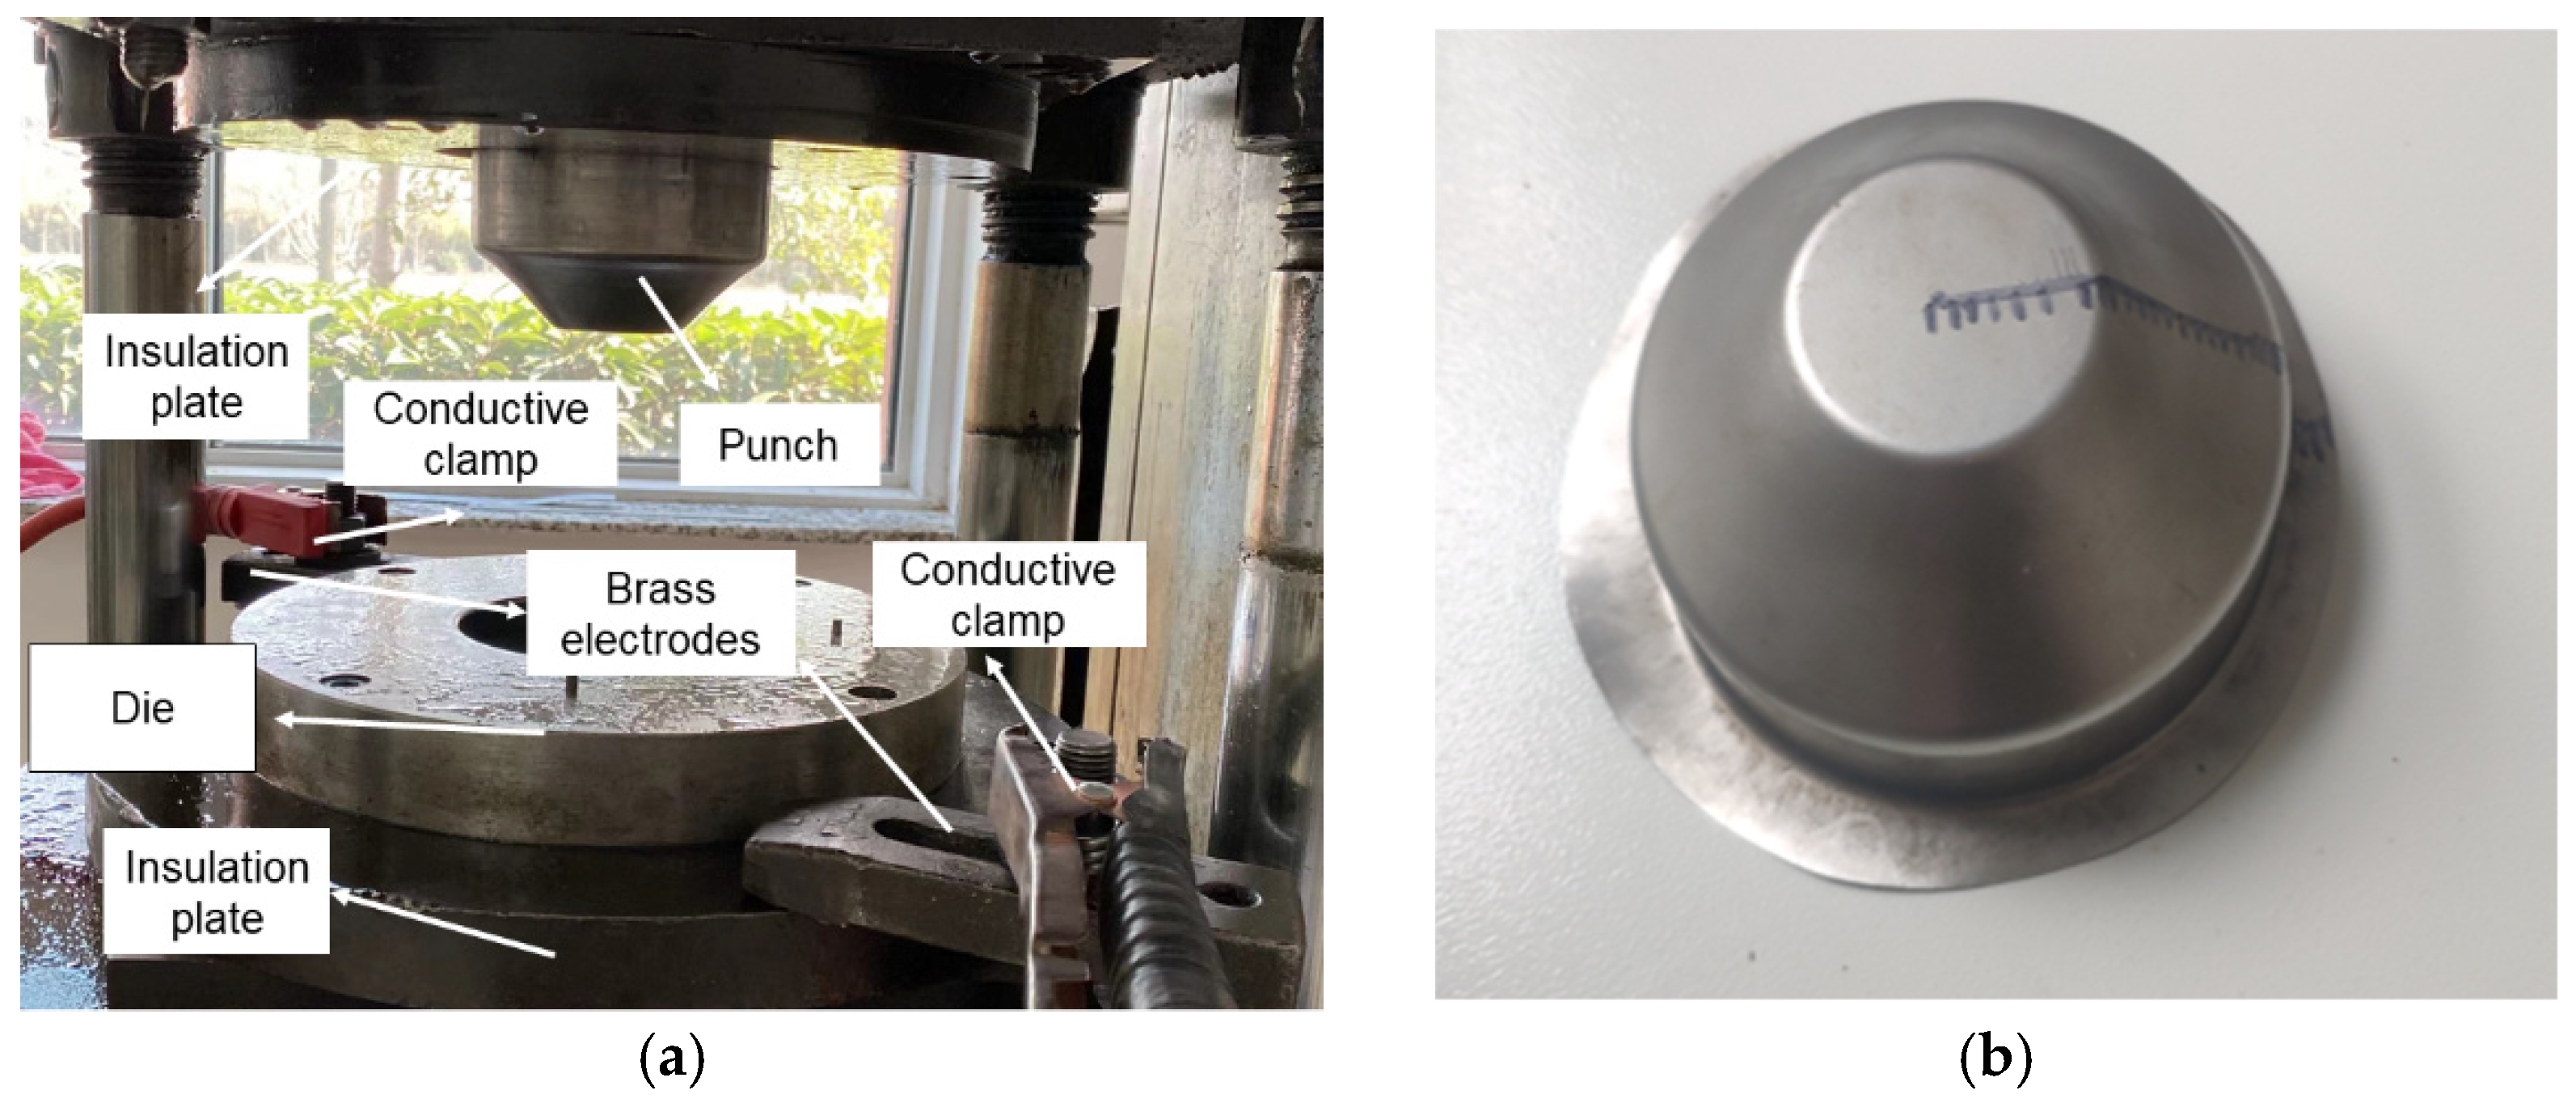
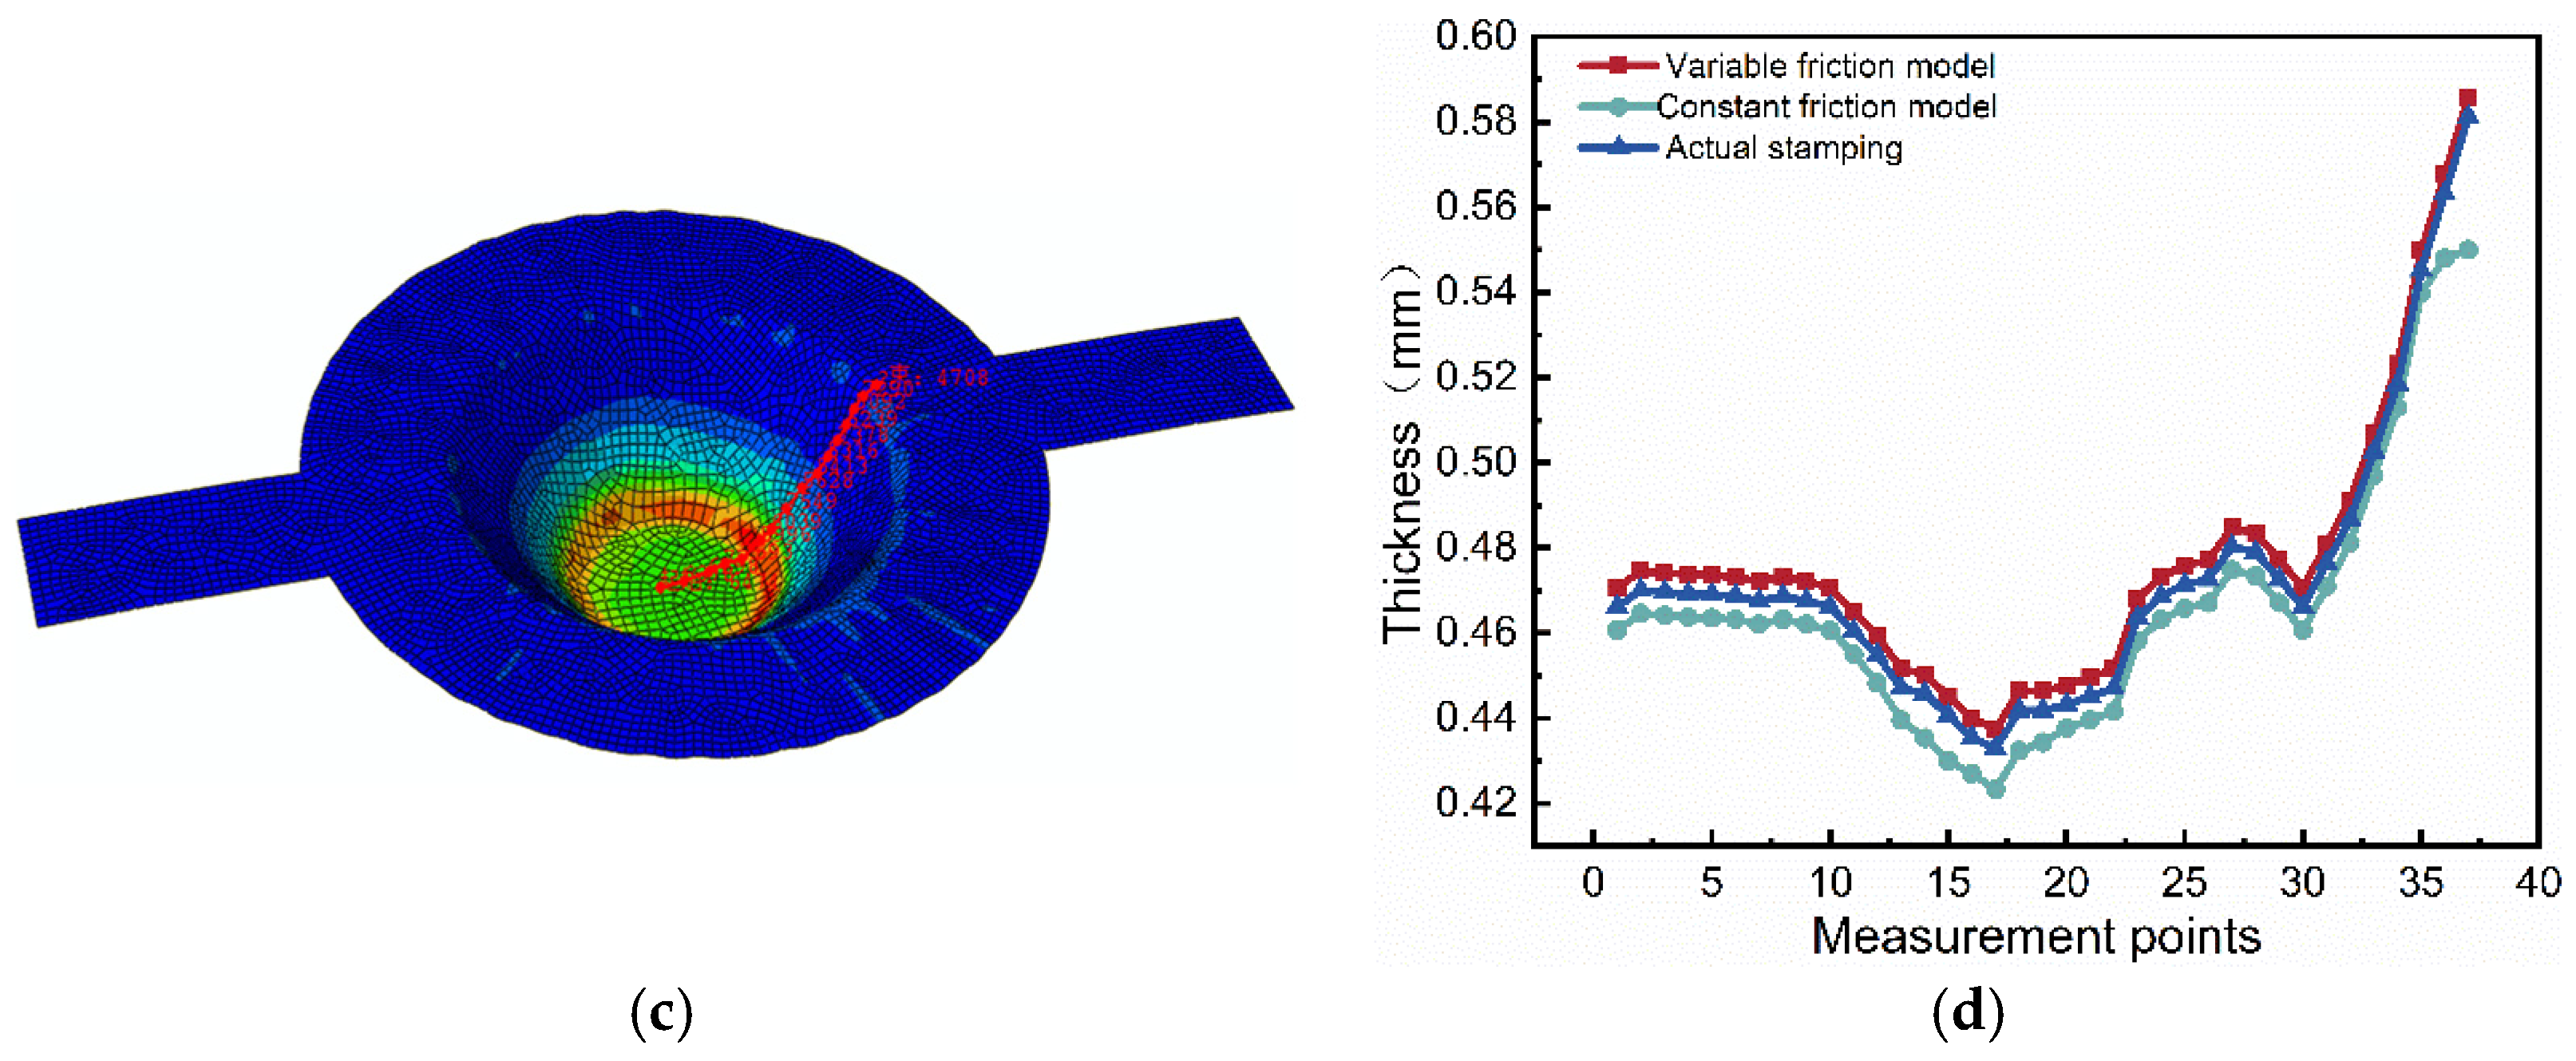
The sheet material was a cylindrical part with a radius of 165 mm and a thickness of 0.5 mm. The stamping speed was 20 mm/s, and the pressure edge force was consistent with the simulation, set to 2.5 kN. Figure 15a shows the actual electrical-assistance stamping platform, Figure 15b shows the stamped part, and Figure 15c shows the locations of the measurement points. The 3D model extracted the node coordinates through the path to observe the thickness rule, using the shell unit to study the thickness distribution and thinning rate. Origin software obtained the thickness distribution patterns (Figure 15d). Compared to the traditional fixed friction coefficient, the new current friction model was closer to the thickness rule of the actual stamping parts. The maximum thinning rate of the fixed friction coefficient was 12.5%, the current friction coefficient model was 15.3%, and the actual value was 14.3%. Compared to the actual value, the simulation error of the software decreased from 12.59% to 6.99%, and the simulation accuracy improved by 7.31%. The maximum thinning was also concentrated at the circular corner of the punch, consistent with the simulation results of the maximum equivalent plastic strain and within the allowable range of thinning. From the thickness distribution curves of the part, the current friction model was closer to the actual value. Therefore, the current friction model reflects the friction characteristics of sheet forming and provides a practical reference for current-assisted stamping simulation technology.

5. Conclusions

(1)
With a speed of 4 mm/s and under the conditions of dry friction, the friction coefficient between the AA7075 aluminum alloy sheet and the P20 die steel gradually decreased with the increase in the current density, and the decreasing trend gradually slowed down. According to the surface morphology, there were many scratches and a small amount of peeling on the AA7075–T6 aluminum alloy surface, and the primary friction mechanism was furrow wear and viscous wear.
(2)
In pulse current-assisted stamping forming, tears occurred on the friction surface, and oxides appeared when the current increased, mainly caused by the electric heating effect.
(3)
When the current density was 2–10 A·mm−2, based on the variable friction model established at the current density, the fitting degree was good, which can accurately describe the friction behavior of the AA7075 aluminum alloy and the P20 die steel.
(4)
In pulse current-assisted stamping forming, the maximum thinning of the aluminum alloy plates occurred at the rounded corners of the convex shape, and the maximum thinning rate of the variable friction coefficient was greater than that of the constant friction coefficient. The maximum equivalent plastic strain was also concentrated at the corner of the punch, corresponding to the thinning rate result. The thickness distribution of the variable friction coefficient model was more consistent with the actual stamping parts, which verifies the effectiveness of the current friction model.

Author Contributions

Conceptualization, J.X. and J.Z.; Methodology, J.X. and Y.G.; Software, S.D. and R.L.; Validation: J.X., J.Z. and Y.G.; Data collection, R.L. and J.X.; Data analysis, R.L. and S.D.; Writing—original draft preparation, R.L. and J.X.; Writing—review and editing, J.X. and J.Z.; Supervision, J.Z. and Y.G. All authors have read and agreed to the published version of the manuscript.

Funding

This research was funded by China’s National Natural Science Foundation [51505408].

Institutional Review Board Statement

Not applicable.

Informed Consent Statement

Not applicable.

Data Availability Statement

Not applicable.

Conflicts of Interest

The authors declare no conflict of interest.

References

  1. Li, G.; Liu, X. Overview of the research status of automotive lightweight technology. Mater. Sci. Technol. 2020, 28, 47–61. [Google Scholar] [CrossRef]
  2. Wang, S.; Wang, D.; Huang, Y.; Meng, Q.; Zhang, L.; Dong, X. Research status of aluminum alloy material application in the field of automotive lightweight. Alum. Process. 2022, 3–6. [Google Scholar]
  3. Ren, L.; Xu, Y. Application and development of metal Materials in automobile Lightweight. Times Automob. 2021, 352, 38–39. [Google Scholar]
  4. Liu, Y.; Geng, H.; Zhu, B.; Wang, Y.; Zhang, Y. Research progress of high efficiency hot stamping process of high strength aluminum alloy. Forg. Technol. 2020, 45, 1–12. [Google Scholar] [CrossRef]
  5. Guo, Y.; Xie, Y.; Wang, D.; Zhao, J.; Du, L. Constitutive Model and Process Analysis of 2124 Aluminum Alloy Hot Forming. Forg. Technol. 2022, 47, 213–219. [Google Scholar] [CrossRef]
  6. Xia, J.; Zhao, J.; Dou, S. Friction Characteristics Analysis of Symmetric Aluminum Alloy Parts in Warm Forming Process. Symmetry 2022, 14, 166. [Google Scholar] [CrossRef]
  7. Nie, D.; Lu, Z.; Zhang, K. Hot V-bending behavior of pre-deformed pure titanium sheet assisted by electrical heating. Int. J. Adv. Manuf. Technol. 2018, 94, 163–174. [Google Scholar] [CrossRef]
  8. Dong, H.-R.; Li, X.-Q.; Li, Y.; Wang, Y.-H.; Wang, H.-B.; Peng, X.-Y.; Li, D.-S. A review of electrically assisted heat treatment and forming of aluminum alloy sheet. Int. J. Adv. Manuf. Technol. 2022, 120, 7079–7099. [Google Scholar] [CrossRef]
  9. Tiwari, J.; Balaji, V.; Krishnaswamy, H.; Amirthalingam, M. Dislocation density based modelling of electrically assisted deformation process by finite element approach. Int. J. Mech. Sci. 2022, 227, 107433. [Google Scholar] [CrossRef]
  10. Xiao, A.; Huang, C.; Yan, Z.; Cui, X.; Wang, S. Improved forming capability of 7075 aluminum alloy using electrically assisted electromagnetic forming. Mater. Charact. 2022, 183, 111615. [Google Scholar] [CrossRef]
  11. Lv, Z.; Zhou, Y.; Zhan, L.; Zang, Z.; Zhou, B.; Qin, S. Electrically assisted deep drawing on high-strength steel sheet. Int. J. Adv. Manuf. Technol. 2021, 112, 763–773. [Google Scholar] [CrossRef]
  12. Nie, X.; Xiao, B.; Shen, D.; Guo, W. Thermodynamically coupled stamping studies considering the deformation heat and frictional thermal effects. China Mech. Eng. 2020, 31, 2005–2015. [Google Scholar] [CrossRef]
  13. Tan, G. Study on Cold Stamping Forming of High Strength Steel Based on Heat-Force Coupling and Variable Friction Coefficient; Hunan University: Changsha, China, 2017. [Google Scholar]
  14. Wang, P. Experimental Study and Finite Element Analysis of 5052 Aluminum Alloy Sheet Stamping Forming Friction Characteristics; Hunan University of Technology: Zhuzhou, China, 2018. [Google Scholar]
  15. Dou, S.; Xia, J. Analysis of Sheet Metal Forming (Stamping Process): A Study of the Variable Friction Coefficient on 5052 Aluminum Alloy. Metals 2019, 9, 853. [Google Scholar] [CrossRef]
  16. Li, X.; Yan, X.; Zhang, Z.; Ren, M.; Jia, H. Determination of Hot Stamping Friction Coefficient of 7075 Aluminum. Metals 2021, 11, 1111. [Google Scholar] [CrossRef]
  17. Liu, Y. Study on High Efficiency Hot Stamping Process and High Temperature Rheological and Friction Behavior of High Strength Aluminum Alloy Sheet; Huazhong University of Science and Technology: Wuhan, China, 2018. [Google Scholar]
  18. Xu, Y. Study on Hot Stamping Forming Friction and Lubrication Behavior of 7075 Aluminum Alloy Sheet Material; Huazhong University of Science and Technology: Wuhan, China, 2019. [Google Scholar]
  19. Li, J. Study on the Adhesive Friction and Wear Behavior of 7075 Aluminum Alloy during Hot Stamping; Huazhong University of Science and Technology: Wuhan, China, 2021. [Google Scholar]
  20. Wang, C.; Hazrati, J.; De Rooij, M.B.; Veldhuis, M.; Aha, B.; Georgiou, E.; Drees, D.; Van den Boogaard, A.H. Temperature dependent micromechanics-based friction model for cold stamping processes. J. Phys. Conf. Ser. 2018, 1063, 012136. [Google Scholar] [CrossRef]
  21. Venema, J.; Hazrati, J.; Atzema, E.; Matthews, D.; van den BOOGAARD, T. Multi-scale friction model for hot sheet metal forming. Friction 2022, 10, 316–334. [Google Scholar] [CrossRef]
  22. Deng, L. Finite element simulation of p-friction process of plate and die at mesoscopic scale. J. Plast. Eng. 2022, 29, 196–201. [Google Scholar] [CrossRef]
  23. Han, J.; Ding, J.; Wu, H.; Yan, S. Mechanism analysis and improved model for stick-slip friction behavior considering stress distribution variation of interface. Chin. Phys. B 2022, 31, 034601. [Google Scholar] [CrossRef]
  24. Lu, J.; Song, Y.; Hua, L.; Zhou, P.; Xie, G. Effect of temperature on friction and galling behavior of 7075 aluminum alloy sheet based on ball-on-plate sliding test. Tribol. Int. 2019, 140, 105872. [Google Scholar] [CrossRef]
  25. Lu, J.; Song, Y.; Zhou, P.; Lin, J.; Dean, T.A.; Liu, P. Process parameters effect on high-temperature friction and galling characteristics of AA7075 sheets. Mater. Manuf. Process. 2021, 36, 967–978. [Google Scholar] [CrossRef]
  26. Chen, Z.; Sun, G.; Shi, G.; Li, C. Study on characterization and model of friction of sliding electrical contact of pantograph-catenary system. In Proceedings of the IECON 2017—43rd Annual Conference of the IEEE Industrial Electronics Society, Beijing, China, 29 October–1 November 2017; IEEE: Piscataway, NJ, USA; pp. 2312–2317. [Google Scholar] [CrossRef]
  27. Chen, C.H.; Jia, L.; Shi, G.; Hui, L.; Tang, J. A dynamic friction model for bow network carrying flow under fluctuating load. J. Liaoning Univ. Eng. Technol. (Nat. Sci. Ed.) 2021, 40, 48–55. [Google Scholar] [CrossRef]
  28. Ping, Y. Study on Current-Carrying Friction Characteristics and Friction Force Modeling in Bow Net under Fluctuating Contact Force; Liaoning Engineering and Technical University: Fuxin, China, 2019. [Google Scholar]
  29. Bao, J.; Bai, J.; Lv, S.; Shan, D.; Guo, B.; Xu, J. Interactive effects of specimen size and current density on tribological behavior of electrically-assisted micro-forming in TC4 titanium alloy. Tribol. Int. 2020, 151, 106457. [Google Scholar] [CrossRef]
  30. Ge, L.; Wang, S.; Yang, Z. Wear behavior of 7075 aluminum alloy and its mechanism. Spec. Cast. Non-Ferr. Alloy. 2011, 31, 178–182+205. [Google Scholar] [CrossRef]
  31. Guo, F.; Chen, M.; Chen, Z.; Shi, G.; Hui, L. Study on friction characteristics and modeling of sliding electric contact. J. Electrotech. Technol. 2018, 33, 2982–2990. [Google Scholar] [CrossRef]
  32. Li, X.; Xu, Z.; Guo, P.; Peng, L.; Lai, X. Electroplasticity mechanism study based on dislocation behavior of Al6061 in tensile process. J. Alloy Compd. 2022, 910, 164890. [Google Scholar] [CrossRef]
  33. Liu, Y.; Wan, M.; Meng, B. Multiscale modeling of coupling mechanisms in electrically assisted deformation of ultrathin sheets: An example on a nickel-based superalloy. Int. J. Mach. Tools Manuf. 2021, 162, 103689. [Google Scholar] [CrossRef]
  34. Ugurchiev, U.K.; Novikova, N.N. Features of the Analytical Method to Determine the Temperature during Electroplastic Rolling. J. Mach. Manuf. Reliab. 2023, 51 (Suppl. S1), S79–S83. [Google Scholar] [CrossRef]
  35. Chen, Z.H.; Dang, W.; Shi, G.; Wang, X.L.; Liu, F.S. Modelling of friction in sliding electrical contacts under fluctuating loads. J. Electr. Eng. Technol. 2019, 34, 5126–5134. [Google Scholar] [CrossRef]
  36. Chen, Z.H.; Tang, J.; Shi, G.; Hui, L.C.; Jia, L.M. Analysis and modeling of frictional vibration of strong current sliding electrical contacts in bow networks. J. Electr. Eng. Technol. 2020, 35, 3869–3877. [Google Scholar] [CrossRef]
  37. Brown, L.; Xu, D.; Ravi-Chandar, K.; Satapathy, S. Coefficient of Friction Measurement in the Presence of High Current Density. IEEE Trans. Magn. 2007, 43, 334–337. [Google Scholar] [CrossRef]
  38. Lu, J. 7075 Basic Research of Key Technology of Hot Stamping of High Strength Aluminum Alloy; Wuhan University of Technology: Wuhan, China, 2021. [Google Scholar]
  39. Gu, R.; Liu, Q.; Chen, S.; Wang, W.; Wei, X. Study on High-Temperature Mechanical Properties and Forming Limit Diagram of 7075 Aluminum Alloy Sheet in Hot Stamping. J. Mater. Eng. Perform. 2019, 28, 7259–7272. [Google Scholar] [CrossRef]
Figure 1. Structural dimensions of aluminum alloy strip and P20 steel pin. (a) 7075 Aluminum alloy strip. (b) P20 steel pin diagram.
Metals 13 00972 g001
Figure 2. (a) A microscopic structure of the 7075 sample surface; (b) EDS surface analysis.
Metals 13 00972 g002
Figure 3. Testing machine. (a) Pulse current friction testing machine. (b) Schematic diagram of the friction testing machine. (c) Detailed parts of the friction test rig.
Metals 13 00972 g003
Figure 4. Curve of sheet metal temperature with time under different current densities.
Metals 13 00972 g004
Figure 5. (a) Friction coefficient curves with time at different current densities. (b) Average coefficient of friction in the stabilization phase.
Metals 13 00972 g005
Figure 6. Surface morphology of 7075 aluminum alloy sheet at different current densities. (a) 2 A·mm−2; (b) 4 A·mm−2; (c) 6 A·mm−2; (d) 8 A·mm−2; (e) 10 A·mm−2.
Metals 13 00972 g006
Figure 7. SEM diagram of the frictional profile of an aluminum alloy sheet at a current density of 6 A·mm−2 at different magnifications; (a) Surface profile perpendicular to the wear track (b) Oxide cracks under surface morphology.
Metals 13 00972 g007
Figure 8. EDS results of the surface of a sheet at a current density of 6 A/mm2.
Metals 13 00972 g008
Figure 9. SEM surface morphology of frictional wear cross-sections of aluminum alloys at different magnifications at a current density of 6 A/mm2; (a) Section shape of the aluminum alloy sheet after wear; (b) Mechanically mixed layer underwear morphology.
Metals 13 00972 g009
Figure 10. Friction fitting curves at different current densities.
Metals 13 00972 g010
Figure 11. Thermoelectric-coupled finite-element simulation model. (a) Thermoelectric coupling finite element simulation model. (b) Hot stamping finite element simulation model.
Metals 13 00972 g011
Figure 12. Finite element meshing diagram. (a) Thermoelectric coupling finite element meshing. (b) Current-assisted hot stamping finite element meshing.
Metals 13 00972 g012
Figure 13. Temperature field distribution of sheet material after thermoelectric coupling simulation.
Metals 13 00972 g013
Figure 14. The equivalent plastic strain after thermal stamping simulation under different friction models. (a) The fixed friction value of μ = 0.1. (b) The new current friction model.
Metals 13 00972 g014aMetals 13 00972 g014b
Figure 15. (a) Current-assisted stamping platform. (b) Actual stamped part. (c) Thickness measurement point. (d) The thickness distribution of different friction models.
Metals 13 00972 g015aMetals 13 00972 g015b
Table 1. Chemical composition of AA7075 aluminum alloy (mass fraction, %).
SiTiCuMnMgCrZnFeAl
0.060.041.560.022.360.195.690.15Bal.
Table 2. Chemical composition of P20 steel material (mass fraction, %).
CMnCrMoS
0.381.31.850.400.008
Table 3. Specific test parameters for the friction test of 7075 aluminum alloys.
Load
FN (N)
Sliding Speed
v (mm/s)
Current Density
J (A/mm2)
Stoke
L (mm)
Lubricant
842, 4, 6, 8, 10240Dry friction
Table 4. EDS results of worn cross-section of the 7075 alloy at 6 A/mm2 (wt.%).
OAlFe
18.1%67.8%10.9%
Table 5. Friction coefficient measurement values and friction model prediction values.
Current Density (A/mm2)13579
Friction coefficient measurement values0.8780.4120.3150.3190.277
Current friction model prediction values0.8400.4390.3390.2930.266
Error (%)4.256.577.398.133.89
Table 6. Thermal performance parameters of the copper electrode at different temperatures.
Temperature
(K)
Density (kg/m3)Specific Heat Capacity (J/kg·K)Thermal Conductivity (W/m·K)Electroconductibility (Ω−1/mm−1)
29889300.38540059,170
37388900.397395
47388500.40838834,130
57388000.419382
67387400.42737624,814
71386900.434370
Table 7. Thermal performance parameters of aluminum alloys at different temperatures data from [38].
Temperature
(K)
Density
(kg/m3)
Specific Heat
Capacity
(J/kg·K)
Thermal Conductivity (W/m·K)Thermal Expansion
(μm/m·k)
Electroconductibility
−1/mm−1)
29828100.85121.121.619,417
3730.90129.423.4
4730.95138.623.6
5730.97146.624.3
6731.00154.125.2
7131.08160.525.6
Table 8. Conduction heat transfer coefficient of aluminum alloy surface and air.
Temperature (K)373473573673773
Convection heat exchange coefficient (W/m2·K)1718192223
Table 9. Specific parameters of stamping die (unit length: mm).
Punch Profile Radius
(mm)
Bottom Round Angle Radius (mm)Die Profile Radius
(mm)
Pressure Rim
Diameter
(mm)
Die Profile Radius
(mm)
Die Profile
Radius
(mm)
204601201065
Table 10. Thermal properties of P20 steel.
Density
(g/cm3)
Yield Stress
(MPa)
Heat
Conductivity (W/m·K)
Thermal
Expansion (10−6 °C)
Specific Heat Capacity (J/kg·K)Electroconductivity
−1/mm−1)
7.8183631.512.84601370
Disclaimer/Publisher’s Note: The statements, opinions and data contained in all publications are solely those of the individual author(s) and contributor(s) and not of MDPI and/or the editor(s). MDPI and/or the editor(s) disclaim responsibility for any injury to people or property resulting from any ideas, methods, instructions or products referred to in the content.