Abstract
The development of free-cutting steel is inseparable from the development of environmentally friendly alloy elements and the control of inclusions shape. Alloying elements can affect the composition, morphology, size, and distribution of inclusion, which are the main factors affecting the machinability of free-cutting steel. This study selected sulfur free-cutting steel with different chemical compositions as the research object to examine the effects of bismuth and bismuth tellurium on sulfur-containing free-cutting steel through electrolytic corrosion experiments, metallographic microscopy, scanning electron microscopy, energy spectrum, and electron backscattering analyzer. The results showed that the microstructures of free-cutting-steel containing sulfur, free-cutting steel containing sulfur bismuth, and free-cutting steel containing sulfur bismuth tellurium are composed of ferrite, pearlite, and inclusions. The inclusions in sulfur-containing free-cutting steel are chain, cluster, and a few dotted MnS. The inclusions in sulfur-bismuth free-cutting steel are point and a few dotted MnS. After the addition of Te, the number of dotted inclusions is reduced, while the number of chain and cluster inclusions is increased. Most of the inclusions in bismuth-containing free-cutting steel are flake inclusions, and the class II MnS change into class III MnS, which is beneficial for improving the free-cutting property of steel and to reduce anisotropy. With the addition of Te, MnS of other shapes, such as heart, water drop, butterfly, etc. of a length–width ratio of less than 4 also appeared as MnS and MnTe complex inclusions, and the fusiform manganese sulfide accounted for most of the steel. Both Bi and Te had modification effects on MnS.
1. Introduction
Free-cutting steel can reduce processing costs, improve tool life, and reduce cutting force. It also has good economic benefits and contributes to rapid development by virtue of its excellent cutting performance in instruments, precision instruments, automobile daily necessities, and other industries in which it has been widely used. As such, its demand is rising year by year [1,2]. Its types have gradually increased to more than a dozen, among which the lead type of free-cutting steel is harmful to the environment. While ROHS, ELV, and WEEE directives all clearly specify the use of lead, lead causes harm to people’s health [3,4,5]. At present, the development trend of free-cutting steel is “de-leading” [6]. Some researchers use low-sulfur free-cutting steel instead of lead-free free-cutting steel [7]. As a new type of easy cutting steel element, Bi has a melting point of only 271.5 °C and a boiling point of 1564 °C. It has stable chemical properties and is similar to Pb in physical properties, but it is non-toxic and will not produce toxic steam. It has soft properties and a lower density than Pb to reduce segregation in steel. They have the same machinability, they are fine metal particle inclusions uniformly distributed around sulfide, and they are affordable [8,9]. Bi in steel can prevent MnS deformation during the forging process [10]. The addition of Te makes MnS inclusions more resistant to deformation and more spherical in the hot rolling process [11]. Adding Te can improve the cutting performance of steel. Te and S cannot synthesize compounds, but the molten state can be mutually soluble. Tellurium is a highly effective and anisotropic compound that can be added to steel alone, or it can be combined with S, Se, and other free-cutting elements to form complex inclusions in steel through the interaction of different elements [12]. Compound addition of appropriate amounts of different free-cutting elements is expected to multiply the free-cutting properties of steel [13].
At present, the trends of free-cutting steel are as follows: improving the standard number of free-cutting steel; improving the quality and accuracy of the original free-cutting steel, increasing the quantity of free-cutting steel; optimizing the control technique of inclusions; exploring new environmentally friendly free-cutting elements; and developing new environmentally friendly free-cutting steels according to the principle of “multi-element and small amount” through which multi-element composite free-cutting steel is developed [14,15]. By changing the chemical composition of free-cutting steel by adding one or more free-cutting elements, especially by controlling the quantity, shape, distribution, size, and appearance of inclusions, the machinability of free-cutting steel can be improved, which is of great significance to the research of free-cutting steel [16].
Steel mills such as Inland Steel of the United States, Aichi of Japan, and Posco of South Korea have developed environmentally friendly free-cutting steel that uses bismuth instead of lead. The inclusions in Japanese steel are mostly spindle-shaped and evenly distributed. [17]. The reserves of Bi in China hold the first place in the world, and Bi can be added to replace the Pb system’s free-cutting steel. Many Chinese steel mills, such as Xingcheng Special Steel, Shigang Steel, Yongsteel, Qingsteel, Hangang Steel, Guigang Steel, Shaosteel, and Angang Steel have conducted research on bismuth-containing free-cutting steel and have made many achievements. However, so far, low-sulfur bismuth-containing free-cutting steel has not been widely used for commercial purposes [18].
The machinability of free-cutting steel depends on the formation of sulfide inclusions in the steel. During processing, sulfide inclusions induce stress concentration and facilitate chip fracture. Non-metallic inclusions exist in steel in the form of second-phase particles, which have a great influence on the mechanical properties and machinability of steel [19]. Inclusions in steel are unavoidable and change the mechanical properties and machinability of steel. As a source of stress concentration, sulfide can reduce cutting force and form a protective layer in the tool [20,21].
Manganese sulfide as a stress concentration source, cut off from the metal connection, also plays the role of solid lubrication and wrapping hard points, so that the chip is easy to break, prolonging tool life and reducing cutting cost [22,23]. MnS also plays an active role in the nucleation and refinement of ferrite in grains, and the coating of harmful precipitates on the surface of MnS can improve the cutting performance and strength of steel [24]. The quality evaluation of inclusions includes the chemical composition, macroscopic and microscopic structure, characteristics, and shape of inclusions [25]. To study manganese sulfide inclusion, it is necessary to control the morphology, size, and distribution of manganese sulfide inclusion so as to avoid the production of a large inclusion, which will seriously harm the quality of steel. The best form of manganese sulfide is a small and evenly distributed spherical or fusiform inclusion. Manganese sulfide will affect the anisotropy of steel, so it is necessary to study its aspect ratio (length/width). Sims CE classified the two-dimensional morphology of manganese sulfide in steel into the following categories: class I includes spherical, fusiform, and diffuse distribution in steel formed by monotectic reaction and arbitrary distribution. The second type includes strip, rod, and fan, which are generally dispersed near grain boundaries and formed by eutectic reactions. The third group is distributed in a massive and irregular manner and is formed by pseudo-eutectic reactions [26,27]. Studies have shown that class I and class III MnS in an as-cast state are more conducive to improving cutting performance. Class II MnS have a greater impact on the anisotropy of steel and are not conducive to cutting, so the generation of class II MnS should be avoided [28]. When the MnS aspect ratio is less than three, it has better easy cutting performance; when the MnS aspect ratio is more than four, the anisotropy of the steel will also increase, and the chips will easily stick, reducing the surface machining quality [29].
In this paper, Y08 steel was used as the base steel, and the effect of chemical composition on the microstructure and inclusions of the bismuth-containing easy cutting steel was studied by adding the environmentally friendly elements bismuth and bismuth tellurium compound as the chemical composition of the bismuth-containing easy cutting steel. The inclusion was exposed through the corrosion of steel matrix. The inclusion with three-dimensional morphology can be observed under the scanning electron microscope. Compared with the common observation of two-dimensional inclusion, three-dimensional inclusion is more three-dimensional and more intuitive, which greatly helps the analysis of the morphology, distribution, and size of inclusion. The inclusions we expect to obtain are fusiform inclusions with the aspect ratio of 1 < length/width ≤ 3. The spherical and fusiform inclusions can not only improve the cutting performance of the material, but also weaken the influence on the mechanical properties of steel such as transverse impact properties. They are not easy to deform during heat treatment and reduce the anisotropy.
In this paper, the distribution, size, morphology, and composition of the inclusions were analyzed by metallographic microscope and scanning electron microscope combined with 3D saprography technology, and the effect of bismuth and bismuth tellurium complex on the inclusion of sulfur-containing free-cutting steel was studied.
2. Materials and Methods
2.1. Experimental Materials
Table 1 shows the main chemical compositions of three groups of free-cutting steels with the addition of free-cutting elements S, Bi, and Te, among which 1# contains S without Bi, 2# contains S and Bi, and 3# contains S, Bi, and Te. The first and second groups were compared without bismuth, and the second and third groups were compared by adding Te element to make multicomponent bismuth-containing free-cutting steel. The austenite grain growth behavior of the free-cutting steel after adding Te element was studied.

Table 1.
Chemical composition of 3 kinds of test steels (mass fraction, %).
2.2. Chemical Composition Design
Based on the composition and properties of GB/T8731-2008 steel, Y08 steel was selected as the master steel in this study, and the chemical composition was designed by referring to other papers. At the same time, considering the need to replace other machinable elements with bismuth, an environmentally friendly element, to improve its machinable properties without affecting other mechanical properties, three groups of steel were designed on this basis. The contents are shown in Table 2.

Table 2.
Chemical composition design table of 3 groups of steel numbers, %.
The first group: As the control group, according to the national standard Y08 and considering the improvement of steel’s free-cutting performance, the sulfur content was set at 0.3~0.35%. C can be a solid solution for strengthening and is an important element to improve strength, reduce carbon content (which will increase debris nodular), hinder tool wear, and improve the material’s easy cutting performance. As such, the design’s carbon content was 0.06~0.08%. P can be solidly soluble in ferrite to improve the machining surface finish; design P content was less than 0.015%.
The second group: On the basis of group 1, the contents of C, Si, Mn, and P remained unchanged, and Bi was added. Due to the addition of Bi element, the content of S element was reduced by 1/2 relative to the first group to create bismuth-containing sulfur.
The third group: On the basis of the second group, the contents of C, Si, Mn, P, and Bi were unchanged, and the content of sulfur was also increased after the addition of Te element. The design content was 0.25~0.35% to make the sulfur, bismuth, and tellurium ternary complex.
The carbon, silicon, manganese, phosphorus, and sulfur contents of the three groups of steels were the same. Steel 1# was designed according to the national standard Y08, and the sulfur content was controlled within 0.3~0.35%, so that the machinability of the steel could be improved under the condition of high sulfur and no bismuth. The microstructure and inclusion state of steel 1# designed in this composition were compared with those of the 2# and 3# steels containing other easily machinable steels. The effect of bismuth element on the microstructure and inclusions of free-cutting steel was studied by comparing 2# with 1#. The effect of bismuth–tellurium complex on the microstructure and inclusions of bismuth-containing easy cutting steel was studied by adding the bismuth–tellurium complex elements and selecting the appropriate sulfur content.
2.3. Metallographic Test
The three test steels needed to be ground, polished, and etched before being examined under a metallographic microscope. The test steel was machined into a size of 5 mm × 10 mm × 20 mm, and the 10 mm × 20 mm surface of the test steel was polished. The samples were polished successively on W28 sandpaper (320 mesh), W20 sandpaper (500 mesh), W14 sandpaper (600 mesh), and W10 sandpaper (800 mesh) until the surface scratches were all in the same direction. Then, the polishing machine was used to polish the samples. After polishing, the surface was cleaned with an aqueous ethanol immediately, any dirt was removed, and the surface was dried with a hair dryer. In order to observe the tissue inside the sample, the surface of the sample was wiped and etched with cotton dipped in 4% volume concentration of nitrate ethanol solution, the surface was rinsed with an aqueous ethanol, and then the tissue was observed with an ultra-depth-of-field microscope. An ultrasonic cleaning machine was used to clean the pattern and then it was dried with a hair dryer. The microscope used in this study was a VHX-5000 metallographic microscope.
2.4. 3D etching Technology
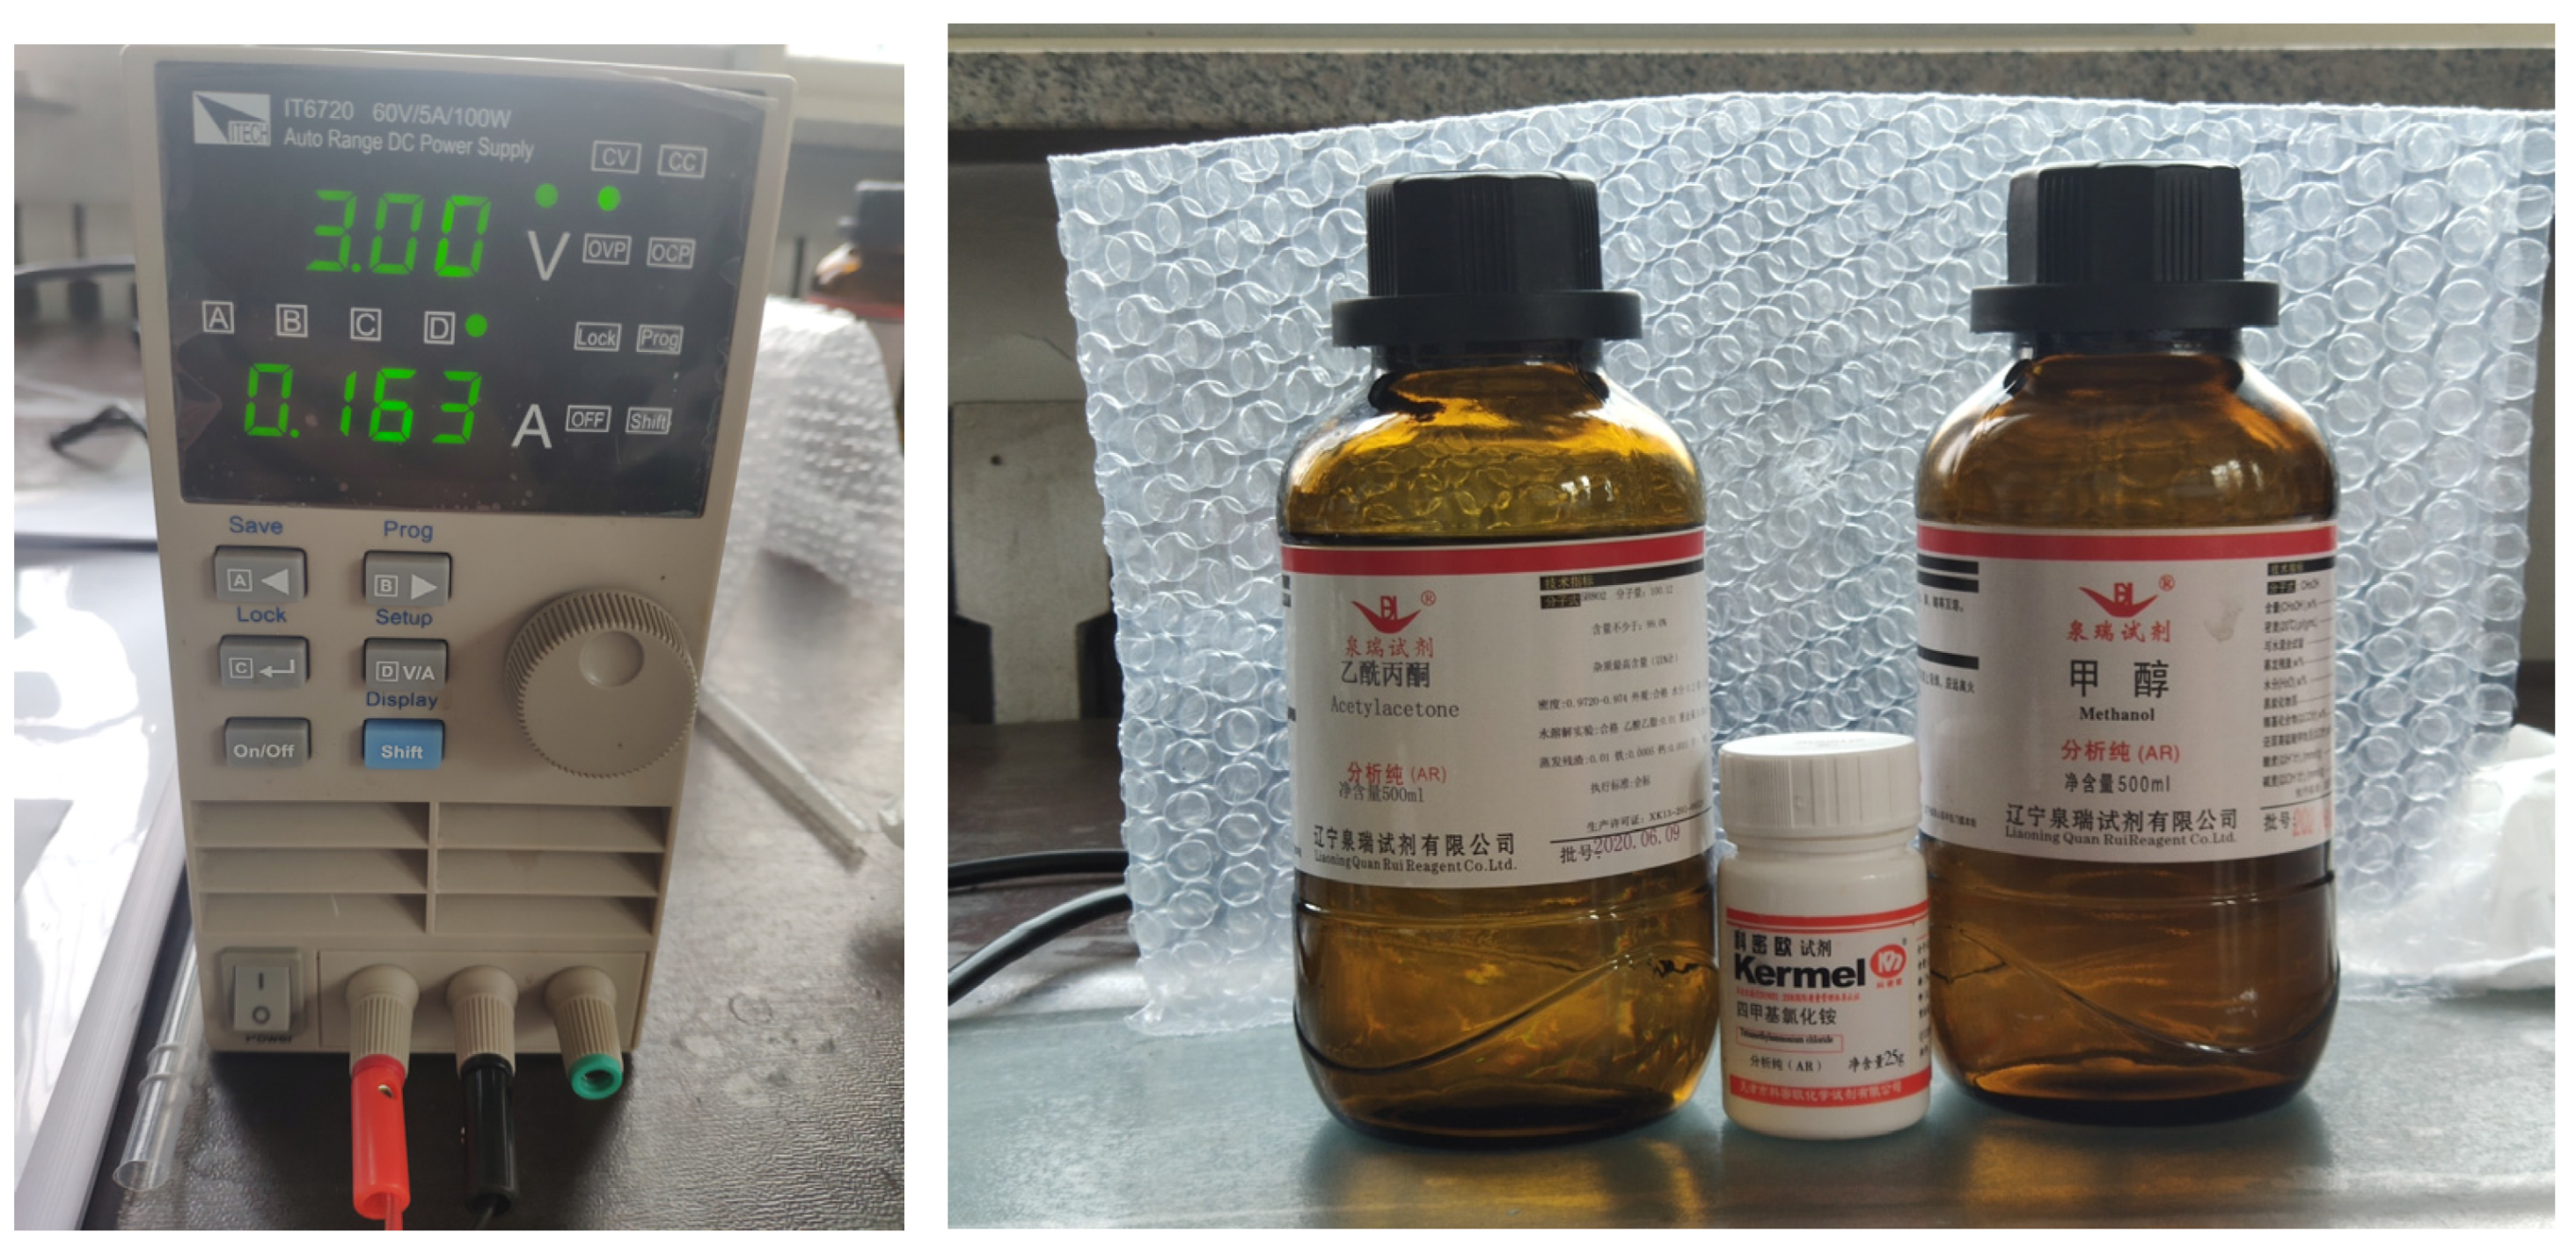
In order to better observe the morphology of inclusions, corrosion of steel matrix by electrolytic etching technology to retain inclusions was conducive to visually seeing the three-dimensional morphology of inclusions. Before electrolytic etching testing the steel, the experimental steel was processed into 5 × 10 × 20 mm. The experimental conditions were as follows: electrolyte (70% methanol, 20% acetyl acetone, and 10% tetramethylammonium chloride), current (0.449 A), electrolytic time (1 h), electrolytic temperature (−1~10 °C), and electrolytic pH (neutral or weakly acidic). Figure 1 shows the electrolytic power supply and electrolytic reagent (methanol, acetyl acetone, and tetramethylammonium chloride)
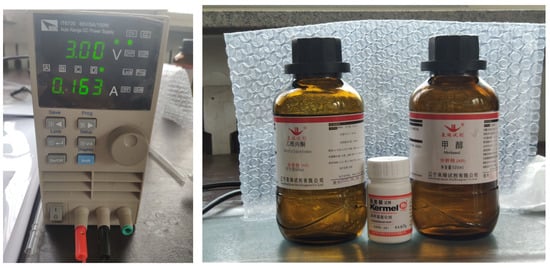
Figure 1.
Electrolytic power supply (IT6702) and electrolytic reagent.
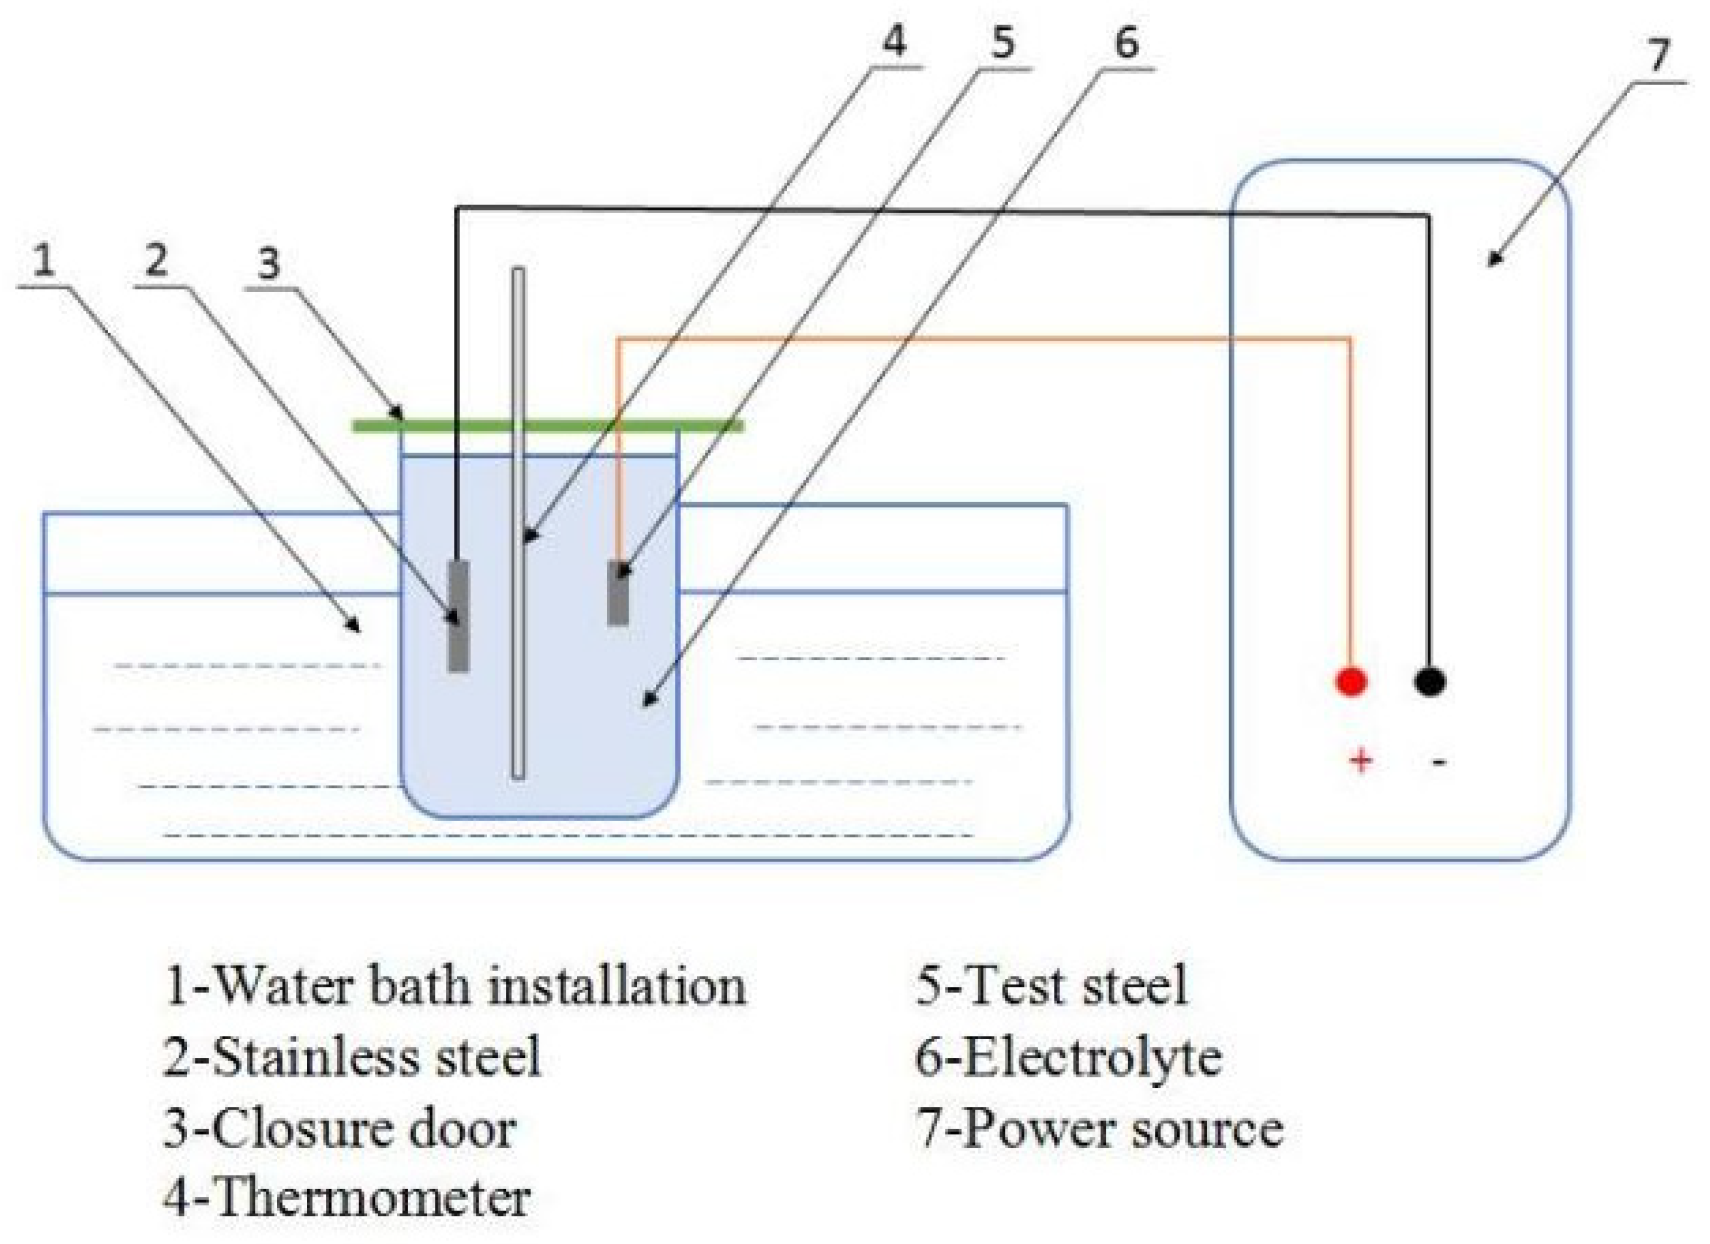
In these conditions, the electrolytic device, as shown in Figure 2, was used for the electrolytic experiment. Electrolytic test equipment included: (1) water bath device, (2) stainless steel, (3) protective cover, (4) thermometer, (5) test steel, (6) electrolyte, and (7) power supply. The cathode was connected with the stainless steel and the anode was connected with the experimental steel. Except for the electrolytic polishing surface, the remaining surface of the test steel was wrapped in paraffin wax to prevent other surfaces from being corroded. The polished electrolytic sample was wiped with alcohol and put it into the electrolytic device. Attention was paid to the electrolytic surface facing the stainless steel sheet. Then, the power supply was adjusted to the appropriate current size, and the time and temperature were well-controlled to conduct the experiment. After electrolytic corrosion of the test steel, it was necessary to clean it with anhydrous ethanol, and the morphology of inclusions in the three samples was observed by scanning electron microscopy.
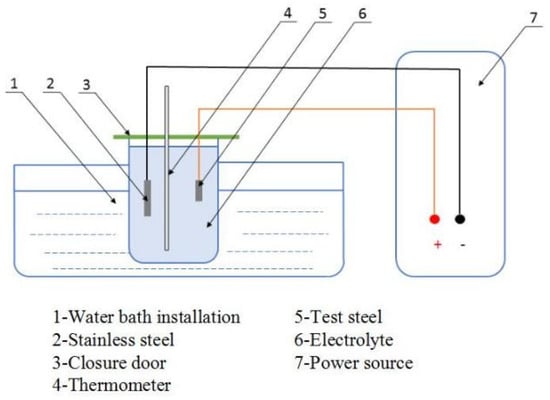
Figure 2.
Electrolysis plant.
3. Results and Discussion
3.1. Effect of Chemical Composition on Quantity and Distribution of Inclusions
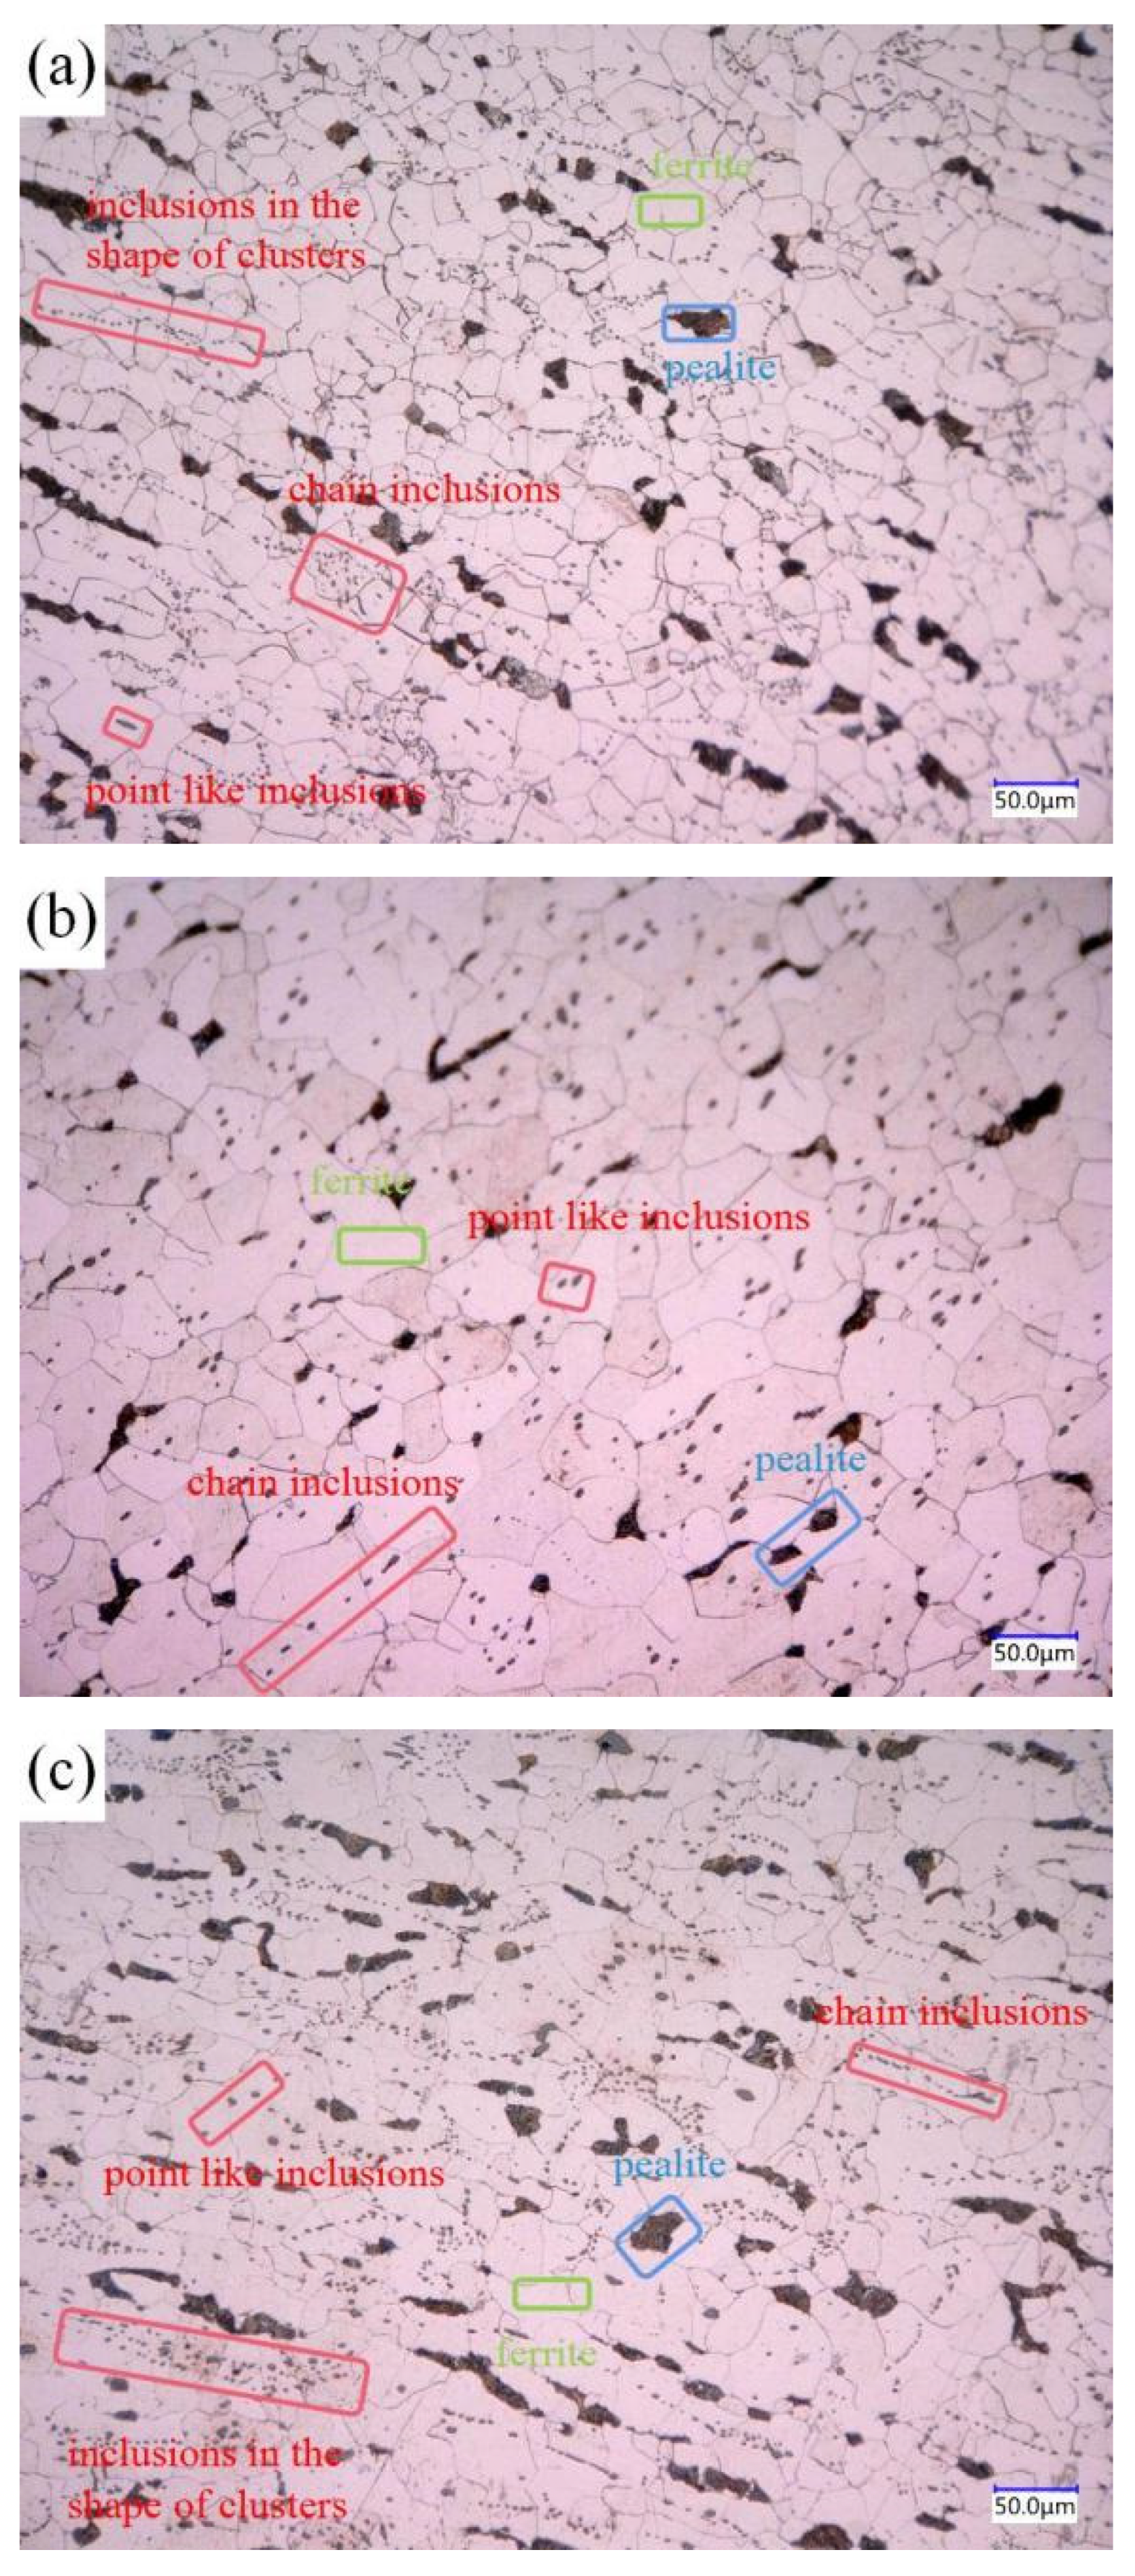
The three groups of steels after forging under metallographic microscope are shown in Figure 3, in which the inclusion is in the red frame, the ferrite is in the green frame, and the pearlite is in the blue frame. Figure 3a shows the microstructure of 1#, which is mainly composed of pearlite, ferrite, and inclusions. The pearlite is relatively large in size and distributed in chain shape, while the inclusions in steel are distributed in chain shape, cluster shape, less spot shape, and in large quantity. Figure 3b shows the microstructure of 2#, which is mainly composed of pearlite, ferrite, and inclusions. The pearlite is small in size, and the amount is the highest of the three groups of steels. The inclusions are dotted and less chained in the steel matrix. Figure 3c shows the microstructure of 3#, which is mainly composed of pearlite, ferrite, and inclusions. The inclusions are distributed in clusters, chains, and a few dots.
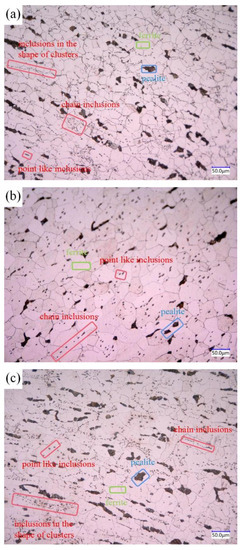
Figure 3.
Metallographic pictures of 3 groups of steel: (a) 1#; (b) 2#; (c) 3#.
As can be seen from Figure 3, the inclusions in sulfur-type free-cutting steel are mainly distributed in chain shape, the addition of Bi reduces the number of chain inclusions, the number of dot inclusions increases, and the distribution of inclusions is uniform. After the compound addition of Bi and Te, the number of cluster inclusions increases, among which the free-cutting steel (in which the environmental protection type of free-cutting element Bi is added alone) has the best distribution.
According to the carbon content of the three groups of steels, the low temperature microstructure is proeutectoid ferrite and pearlite. The ratio of ferrite to pearlite of the three groups of steels can be calculated by using the lever theorem, and the formula is as follows:
The proportion of ferrite and pearlite of 1# steel is 95.2% and 4.8% by calculation. The proportion of ferrite and pearlite of 2# steel is 97.2% and 2.8%, respectively. Finally, 3# steel has 92.5% ferrite and 7.5% pearlite. Again, green and blue are indeed proeutectoid ferrites and pearlite, according to the proportions of colors in the figure.
3.2. Observation and Analysis of Inclusions by Scanning Electron Microscopy
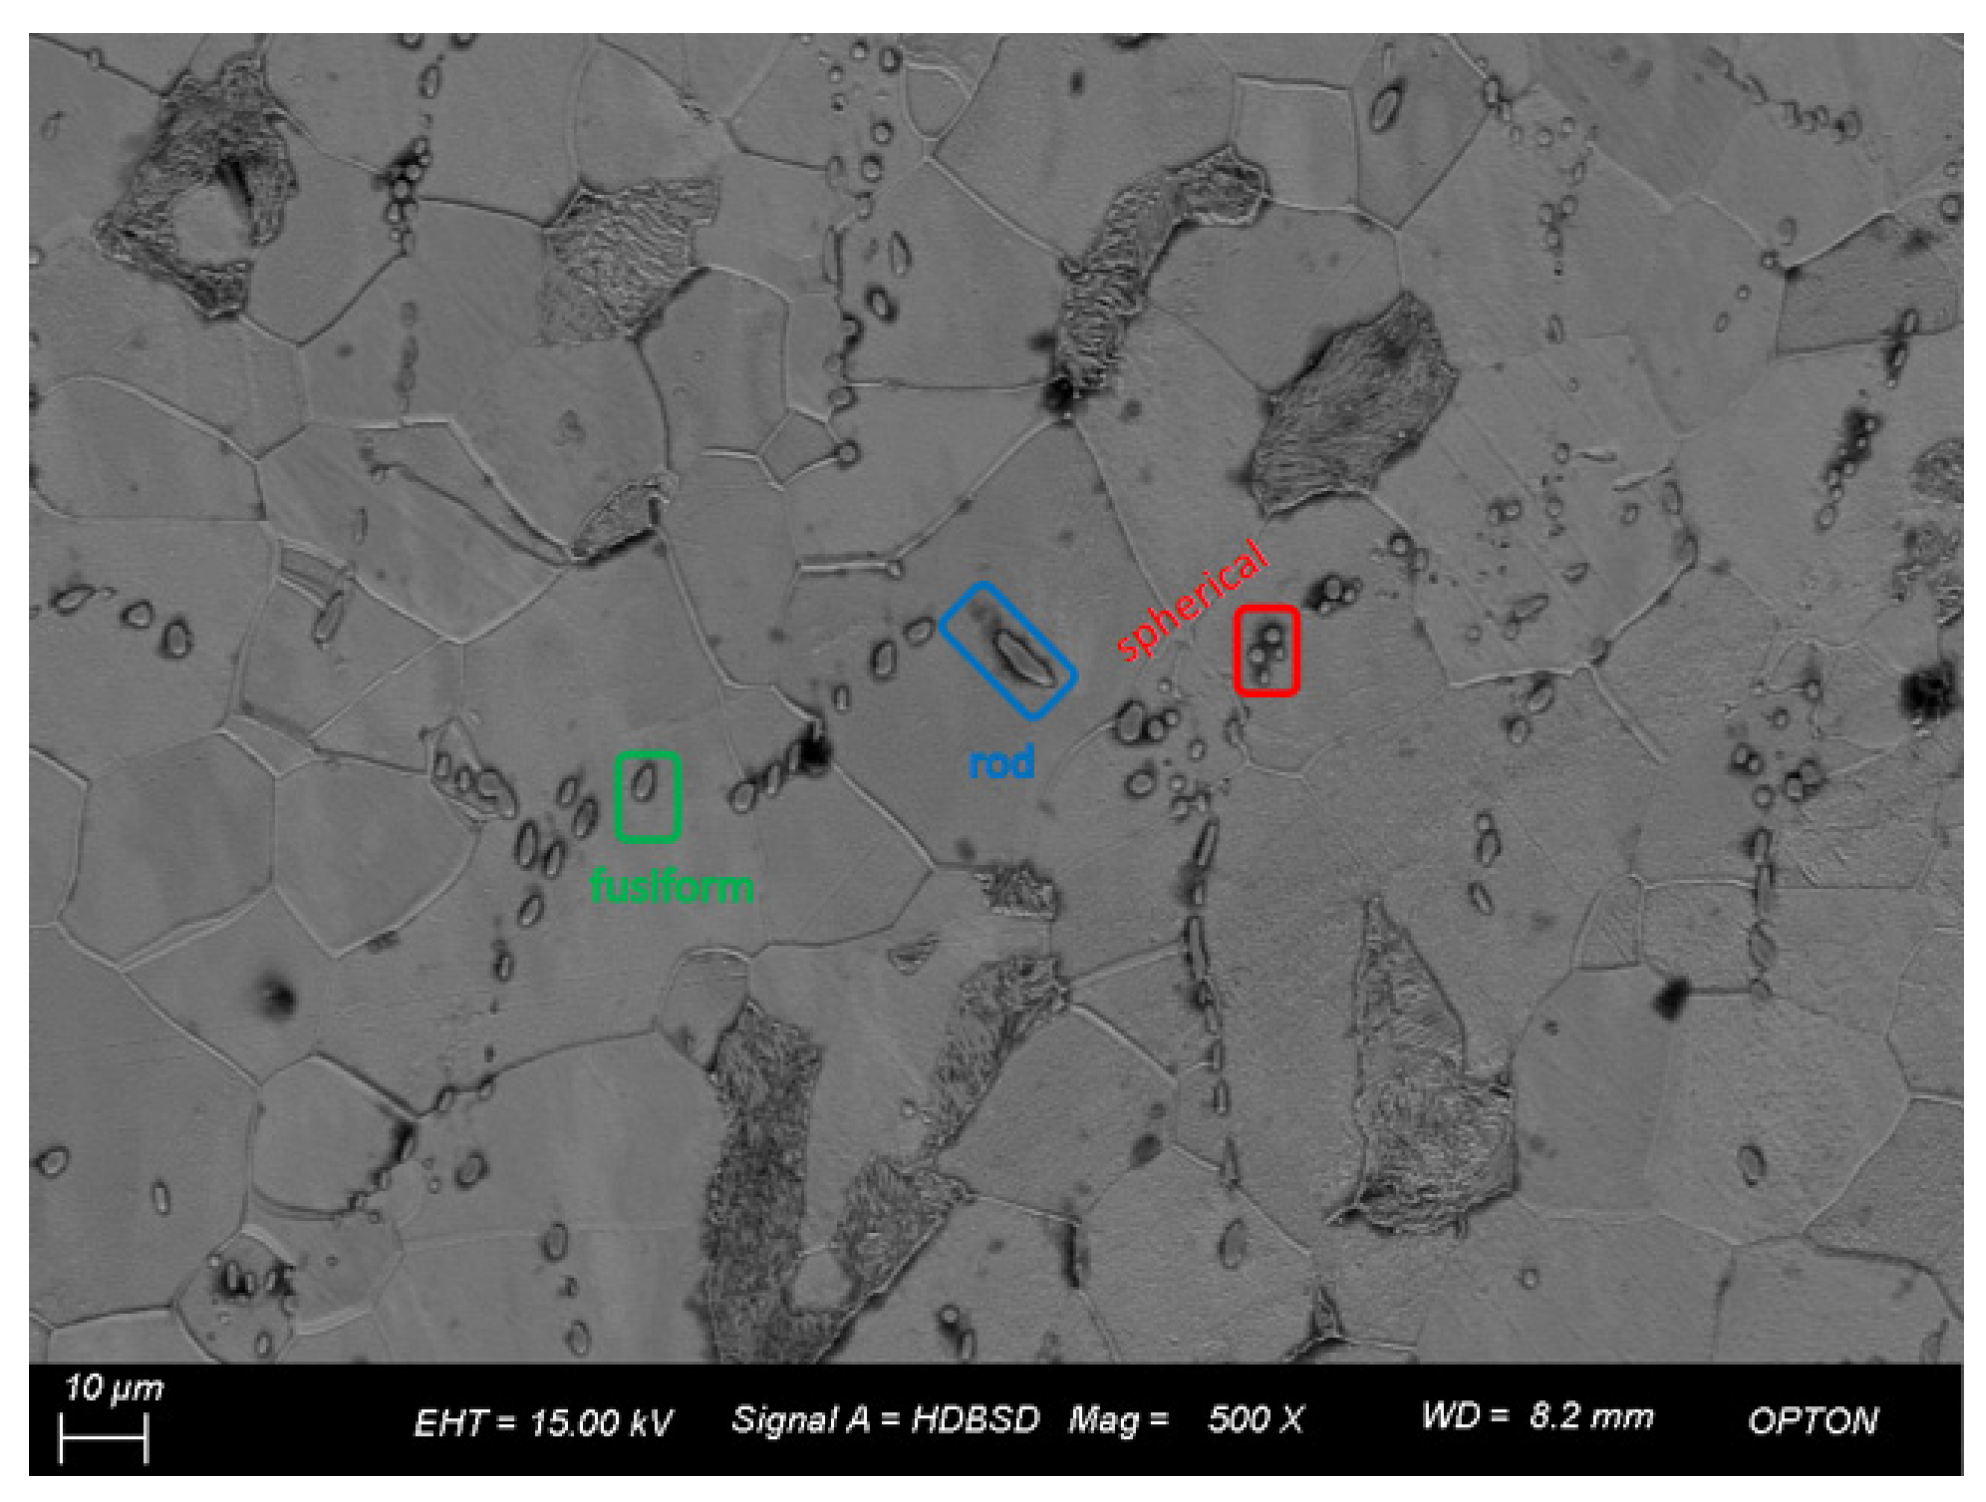
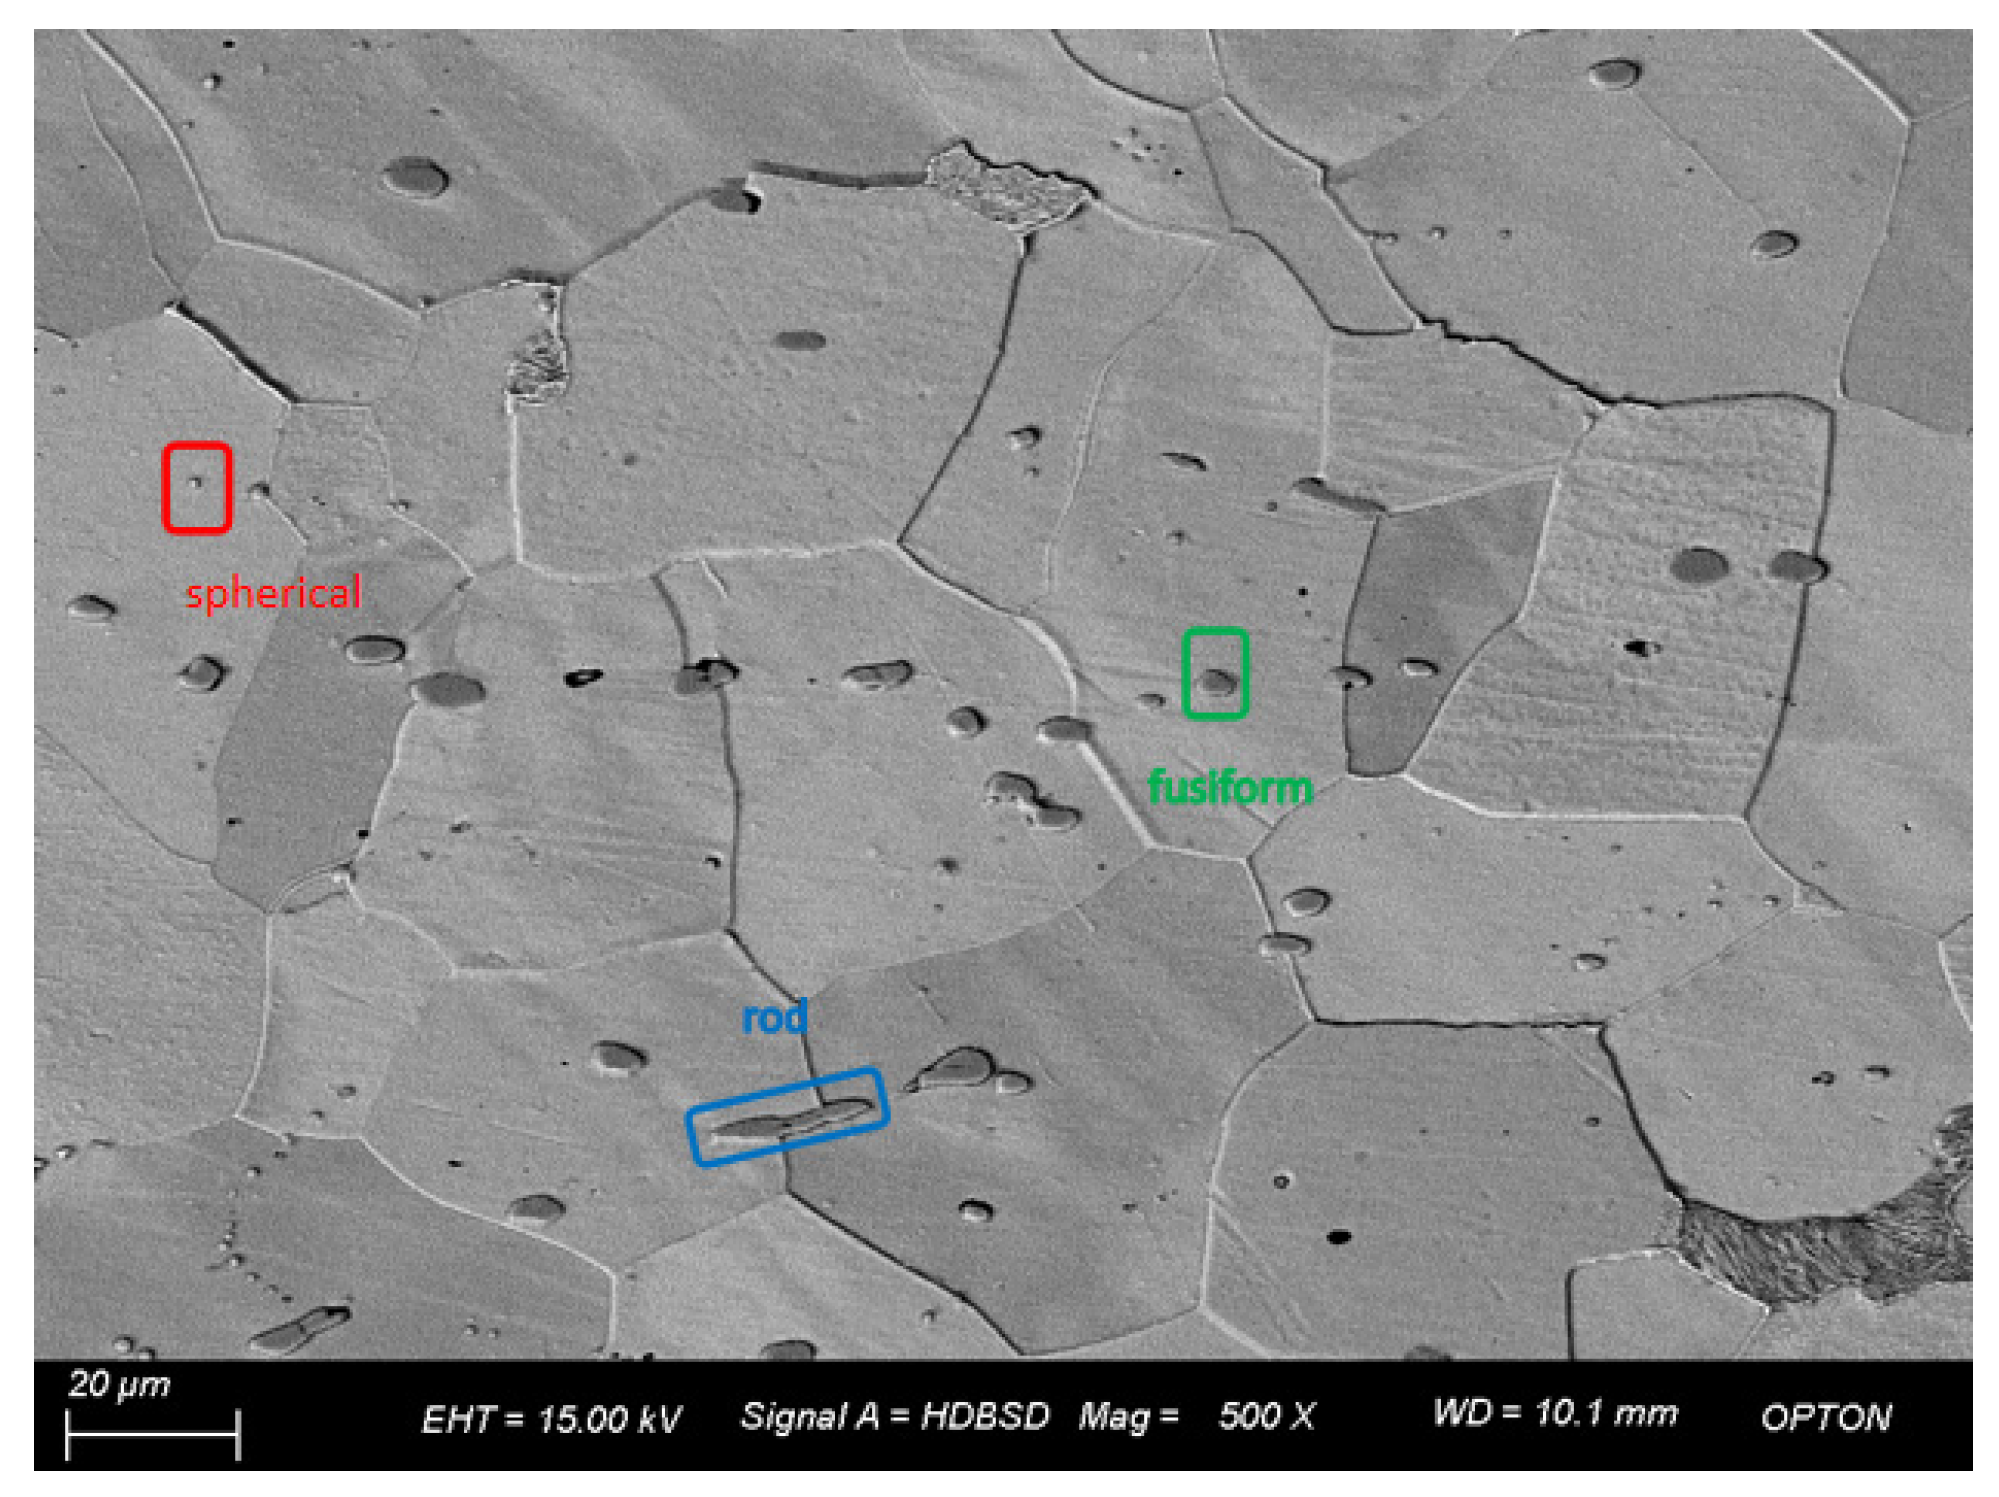
Three groups of forged steel were observed by scanning electron microscopy. Among them, Figure 4 is the SEM image of 1# under the field of view of 500 times. It is found that the inclusions are spherical, fusiform, and individual rod-like, and the inclusions are distributed in chain shape. Statistical analysis of inclusions in the image shows that the total number of inclusions is 186, the maximum size is 8.63 μm, the minimum size is 0.81 μm, and the average size is 2.60 μm, among which the number of inclusions is the largest between 1.8~2.7 μm, and the proportion is close to 40% of the total sample value.
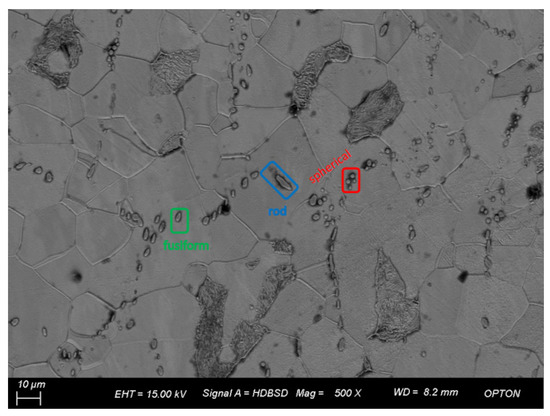
Figure 4.
Morphology and quantity distribution of No. 1 steel inclusions.
Figure 5 shows the SEM image of 2# under a field of view of 500 times. It is found that the inclusions are spherical, fusiform, and rod-shaped, among which the shapes are spherical and fusiform, accounting for nearly 40% of the total sample amount. Statistical analysis of inclusions in the image shows that the number of inclusions is 59, the maximum size is 18.84 μm, the minimum size is 0.76 μm, the average grain size is 4.43 μm, and the size is less than 1.9 μm.
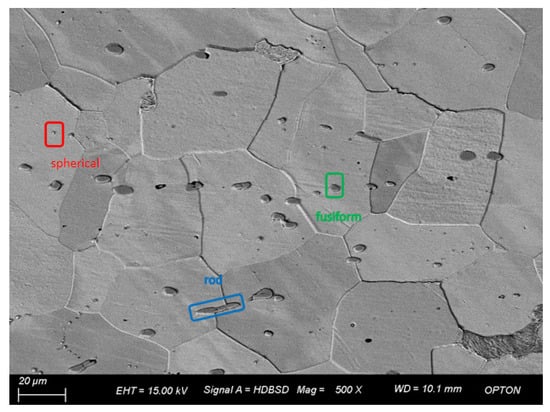
Figure 5.
Morphology and quantity distribution of No. 2 steel inclusions.
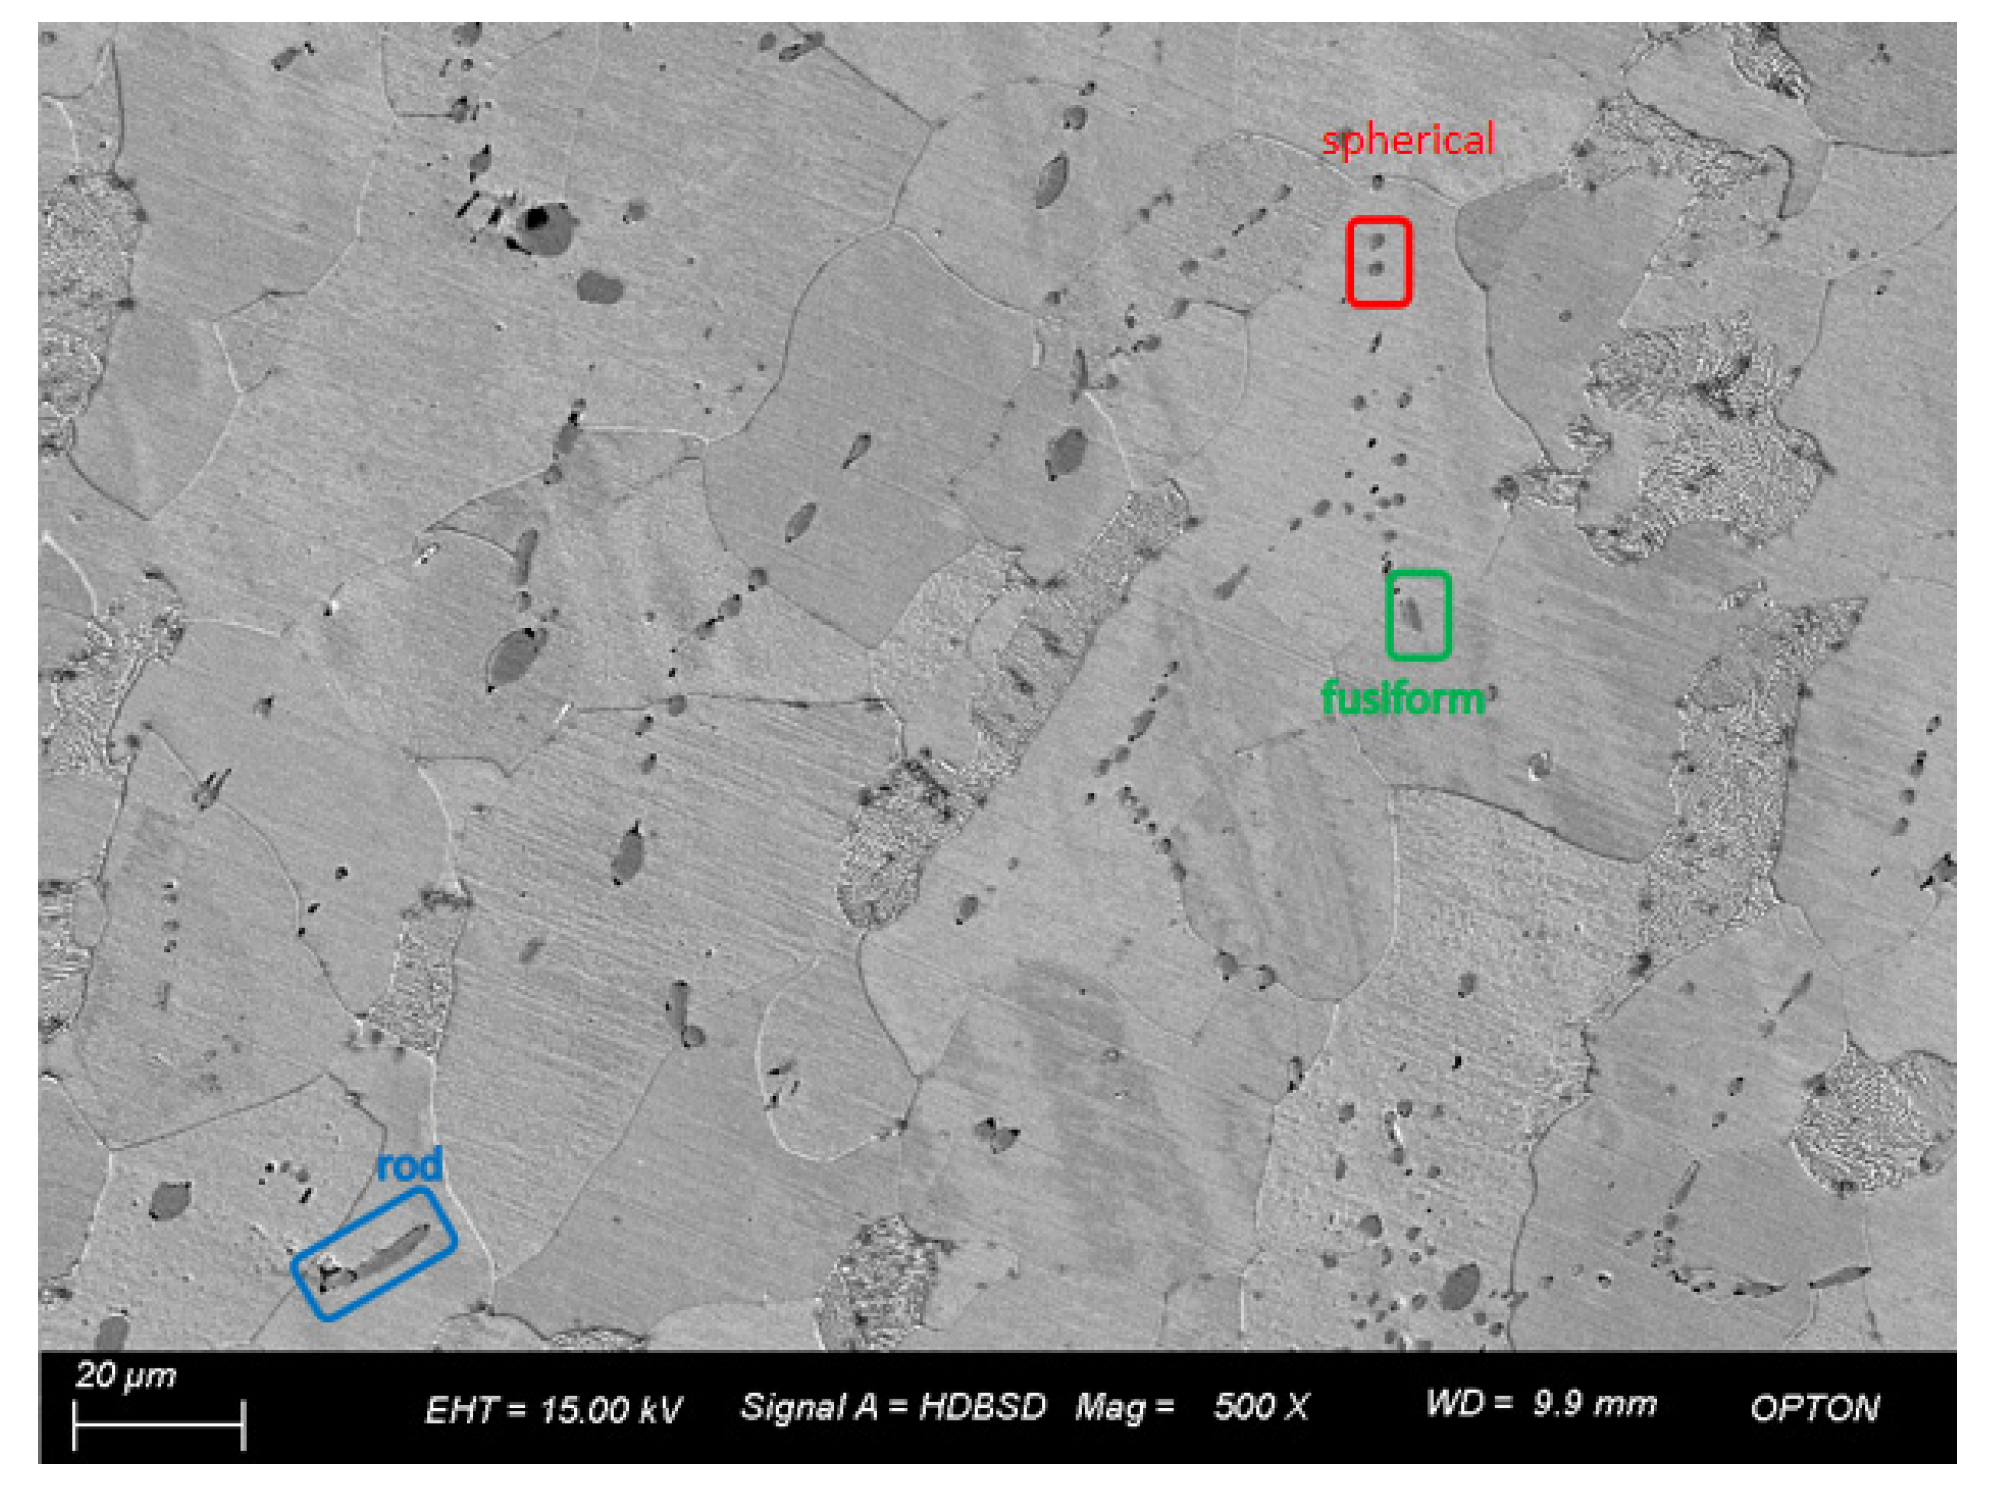
Figure 6 is the SEM image of 3# under a field of view of 500 times. Through observation of the microscopic structure and inclusions of 3#, it is found that the inclusions have various shapes, mainly spherical, spindle, and rod-shaped, among which the large inclusions have a small number and are generally rod-shaped, while the inclusions are distributed in chain shape. The statistical analysis of inclusions in the image shows that the number of inclusions is 147, the maximum size is 13.56 μm, the minimum size is 0.63 μm, and the average grain size is 2.48 μm. When the size is between 1.4 and 2.8 μm, the number of samples is the maximum, which is close to 50% of the total sample size.
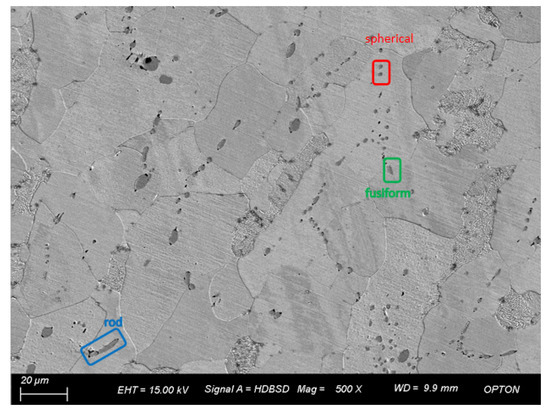
Figure 6.
Morphology and quantity distribution of No. 3 steel inclusions.
3.3. Influence of Chemical Composition on the Morphology, Size, and Shape of Inclusions
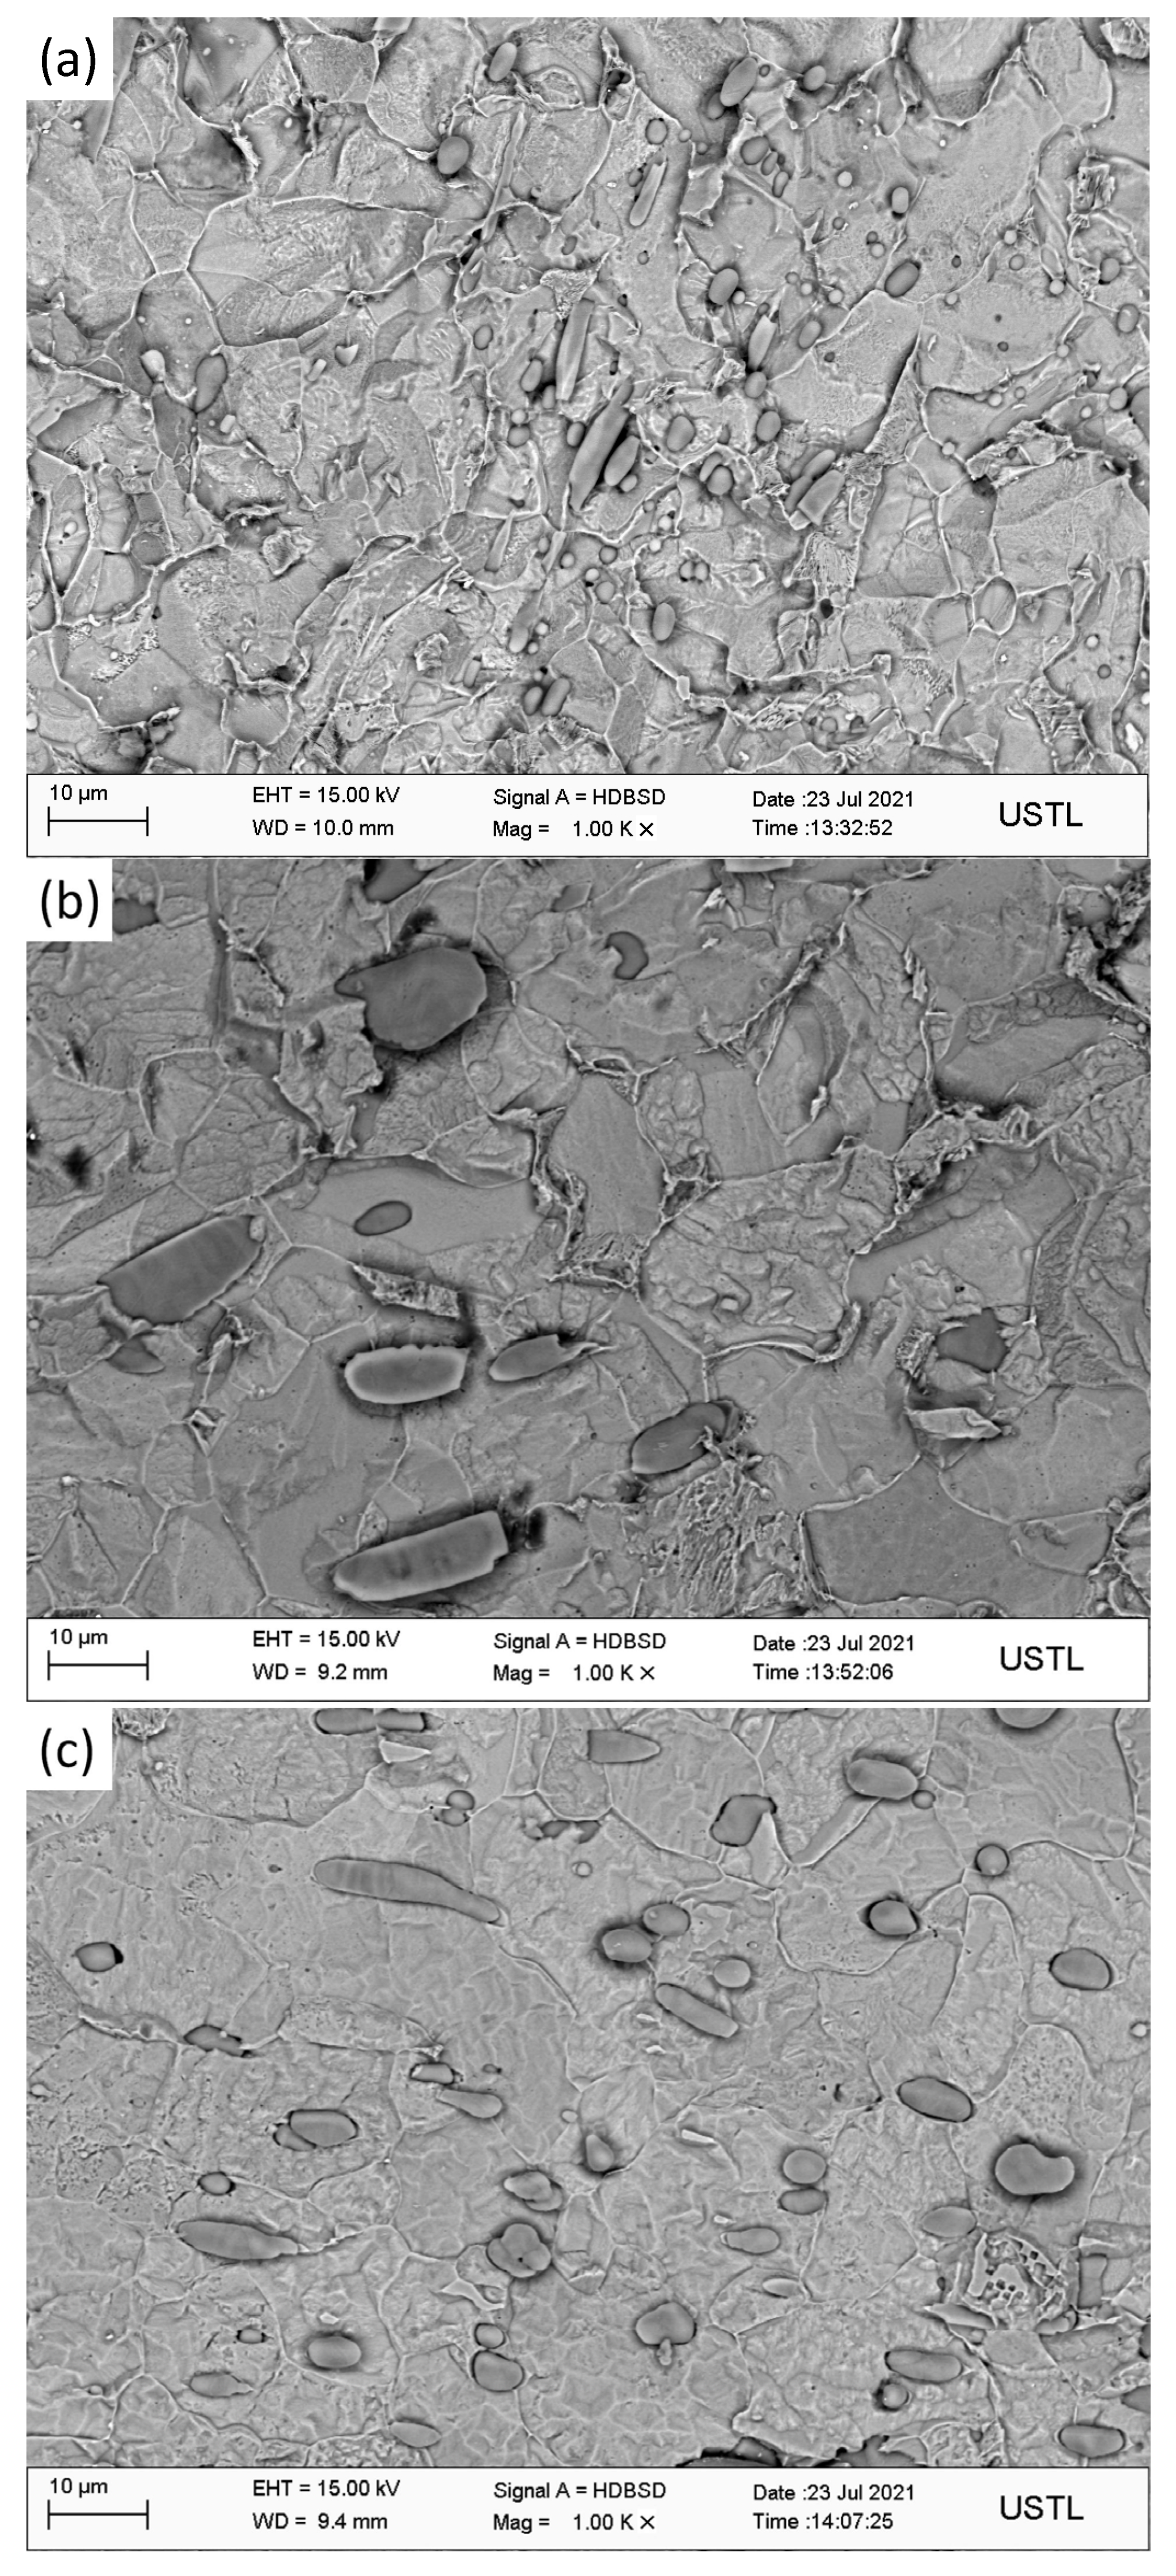
Figure 7 shows the EBSD diagram of the three groups of steel after electrolysis. As shown in Figure 7a, 1# includes type I and type II inclusions. Spherical inclusions with a size of about 2 μm, fusiform inclusions with a size of 3–8 μm, and rod–rod inclusions with a size of 8–14 μm primarily exist in the steel matrix and their distribution is uneven; the length/width of spherical inclusions is close to 1. The length/width of fusiform inclusions is between 1.5 and 2.1, and that of rod–rod inclusions is above 3.7. The size of the largest rod–rod inclusions is 14.6 μm and length/width is 4.98. As can be seen in Figure 7b, 2# includes type I and type III inclusions, mainly composed of irregular flake and inclusions over 10 μm, a small number of 2 μm spherical inclusions and about 4 μm fusiform inclusions, and large flake inclusions with length/width ranges from 2.1 to 2.9; the longest inclusions are 17.7 μm long and length/width is 2.2. Although the size of the flake inclusion is large, its width is also large, so the ratio of aspect to width is relatively low. As shown in Figure 7c, 3# includes type I, type II, and type III inclusions of different shapes, including fusiform, spherical, heart-shaped, droplet, butterfly, and irregular, short rod-shaped inclusions. The length of rod-shaped inclusions with the largest individual size reaches 19.66 μm and length/width is 5.1, while the length of other rod-shaped inclusions is 9–13 μm and length/width is about 3.7.
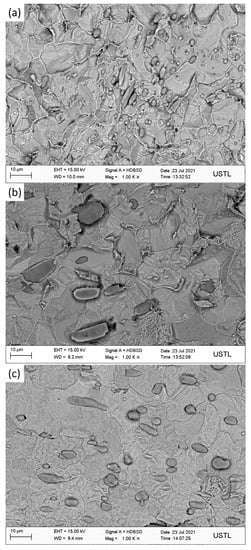
Figure 7.
Morphologies observation of inclusions in three groups of steels after corrosion: (a) 1#; (b) 2#; (c) 3#.
The inclusions of sulfur-type steel are spherical, fusiform, and a few rod-like, with a size of 2~14.6 μm. After the addition of Bi, the total number of inclusions is reduced, and the flake inclusions are increased, with a size of 2~17.7 μm. After the addition of Bi and Te, the number of inclusions is less in 1# than 2#, the number of rod-like inclusions is less, and the morphology of inclusions is changed. Inclusions of other shapes appeared, ranging in size from 2 to 19.66 μm. The number of inclusions in 2# steel is the least among the three groups. The addition of Bi alone and Bi and Te compound can improve the shape of inclusions and reduce the aspect ratio of inclusions. However, some inclusions still have large sizes.
3.4. Influence of Chemical Composition on the Morphology, Size, and Shape of Inclusions
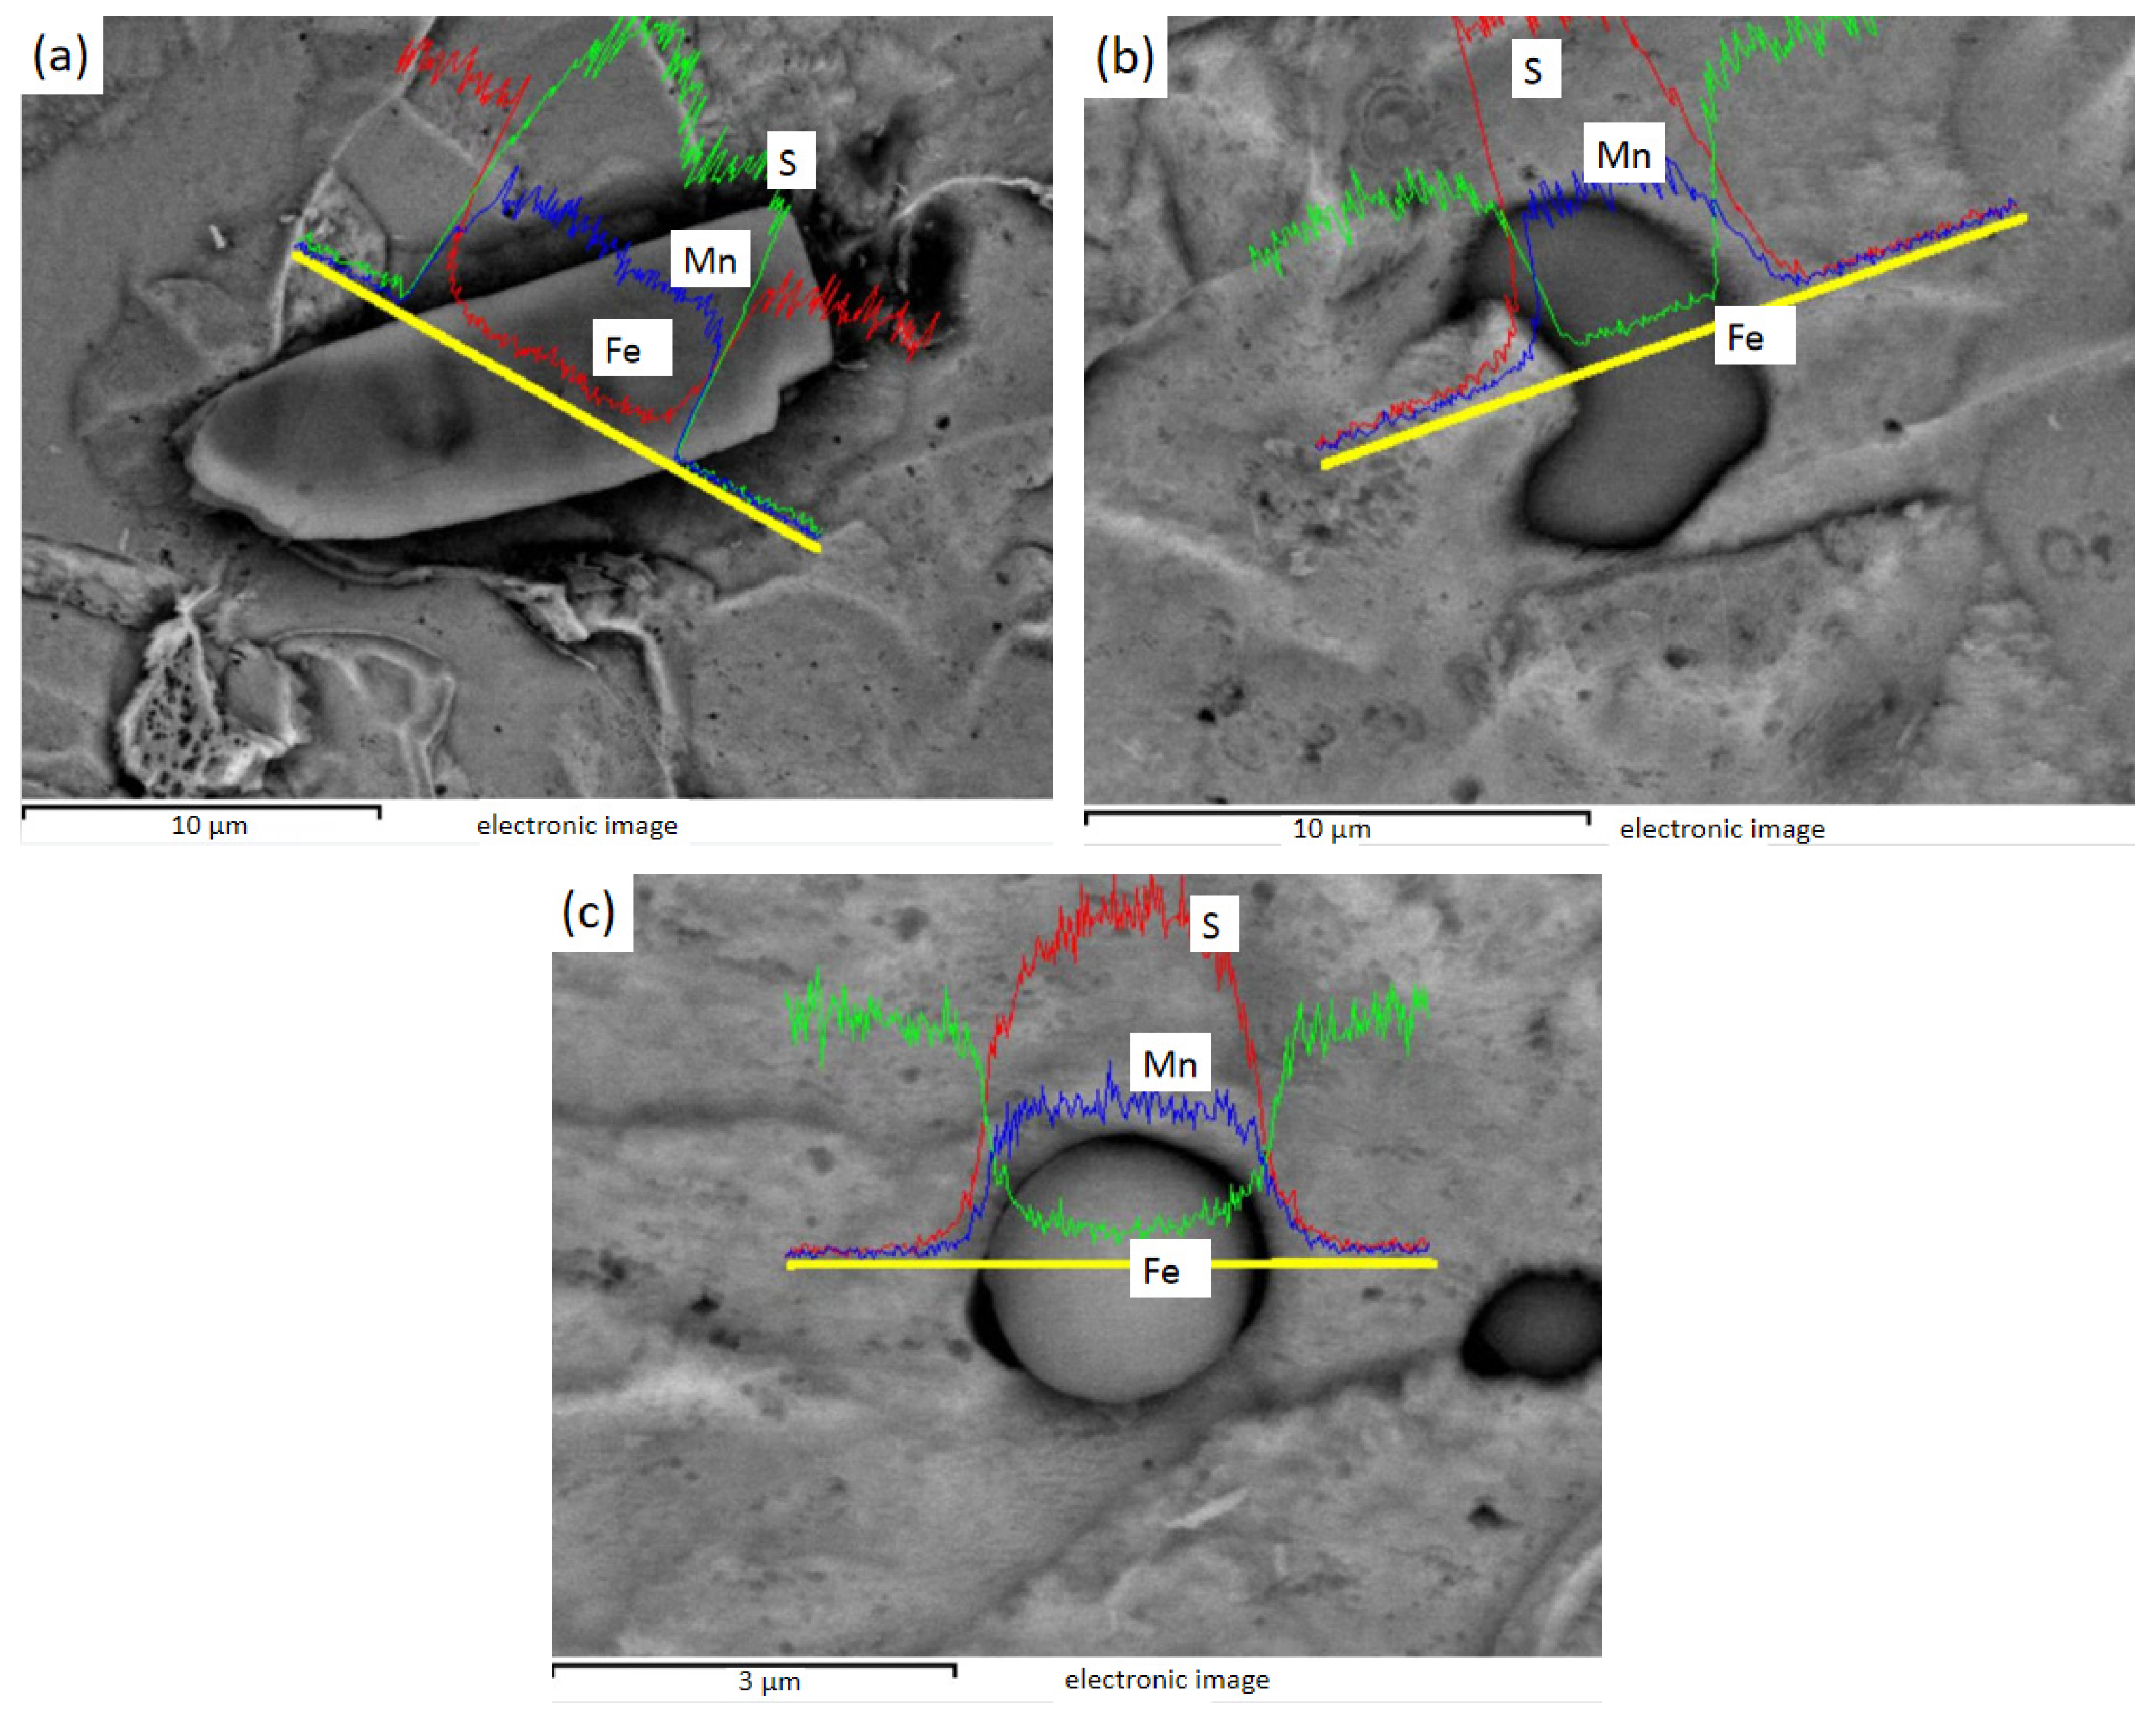
Figure 8 shows the EDS line sweep of 1# after electrolysis, and Figure 8a shows the spindle-shaped and rod-shaped inclusions, which can be judged as MnS by energy spectrum analysis. Figure 8b shows the fusiform and spherical inclusions of line sweep, which are also MnS, as found by energy spectrum analysis.
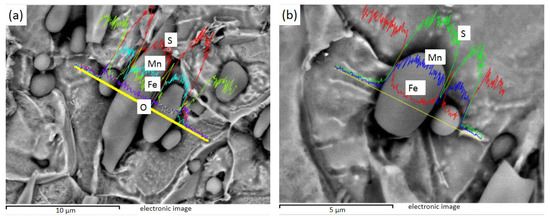
Figure 8.
1# Spherical, fusiform, and rod-bar MnS inclusions: (a) spherical, fusiform, and rod-bar MnS; (b) spherical and fusiform MnS.
Figure 9 shows the EDS line sweep of 2# after electrolysis, and Figure 9a shows the plat-like inclusion, which can be judged as MnS by energy spectrum analysis. Figure 9b is a crescent-shaped MnS inclusion, and Figure 9c is a spherical MnS inclusion.
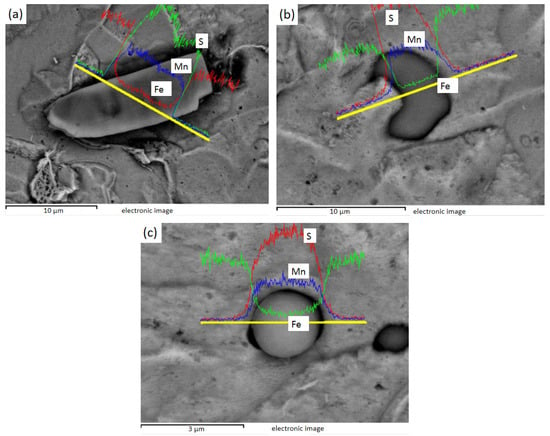
Figure 9.
2# Plate, crescent, and globular MnS inclusions: (a) plate MnS; (b) crescent MnS; (c) globular MnS.
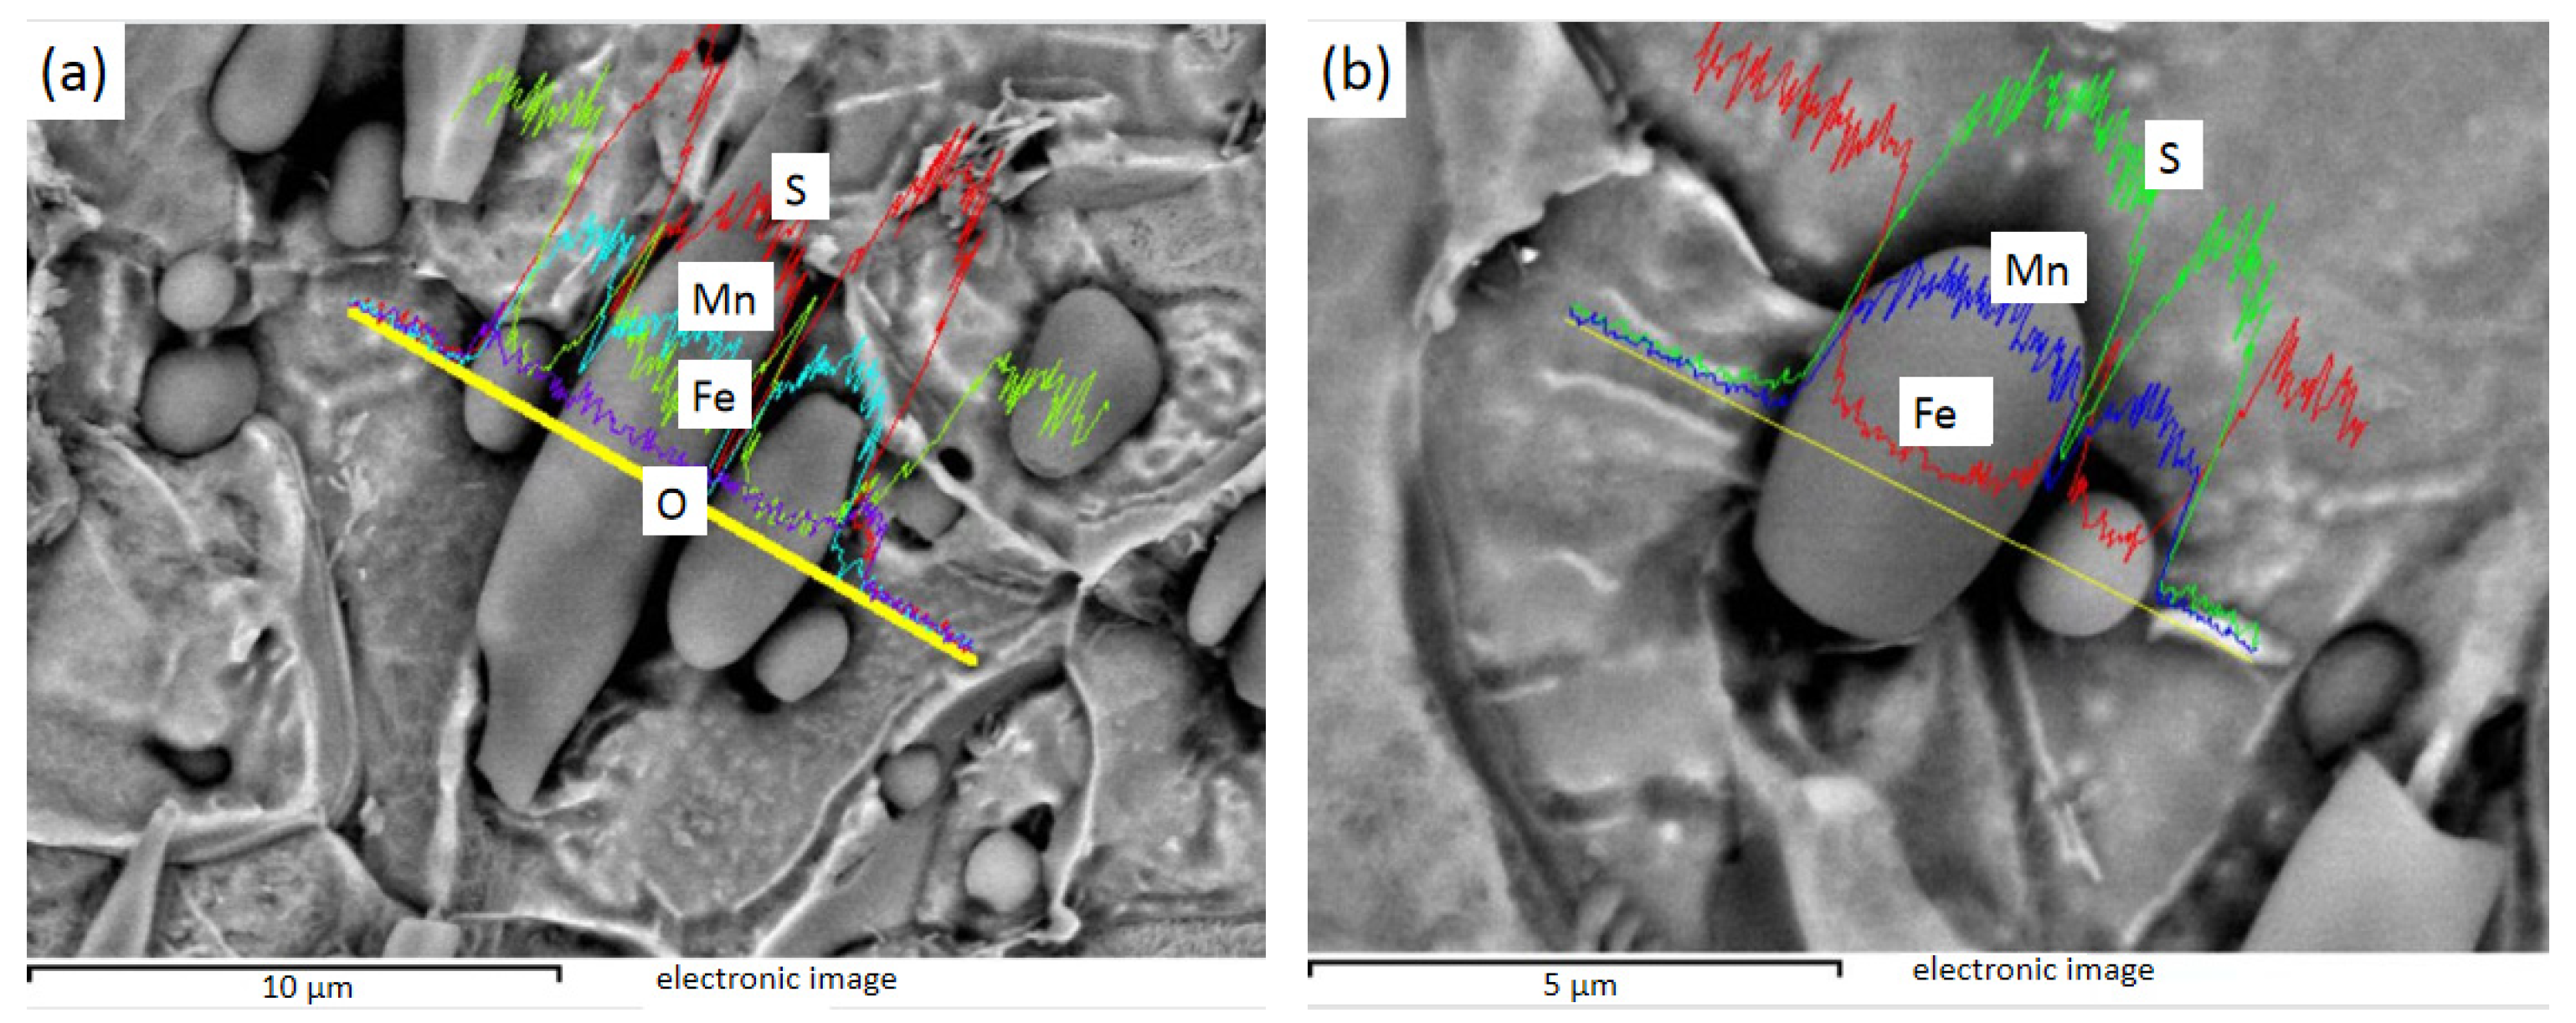
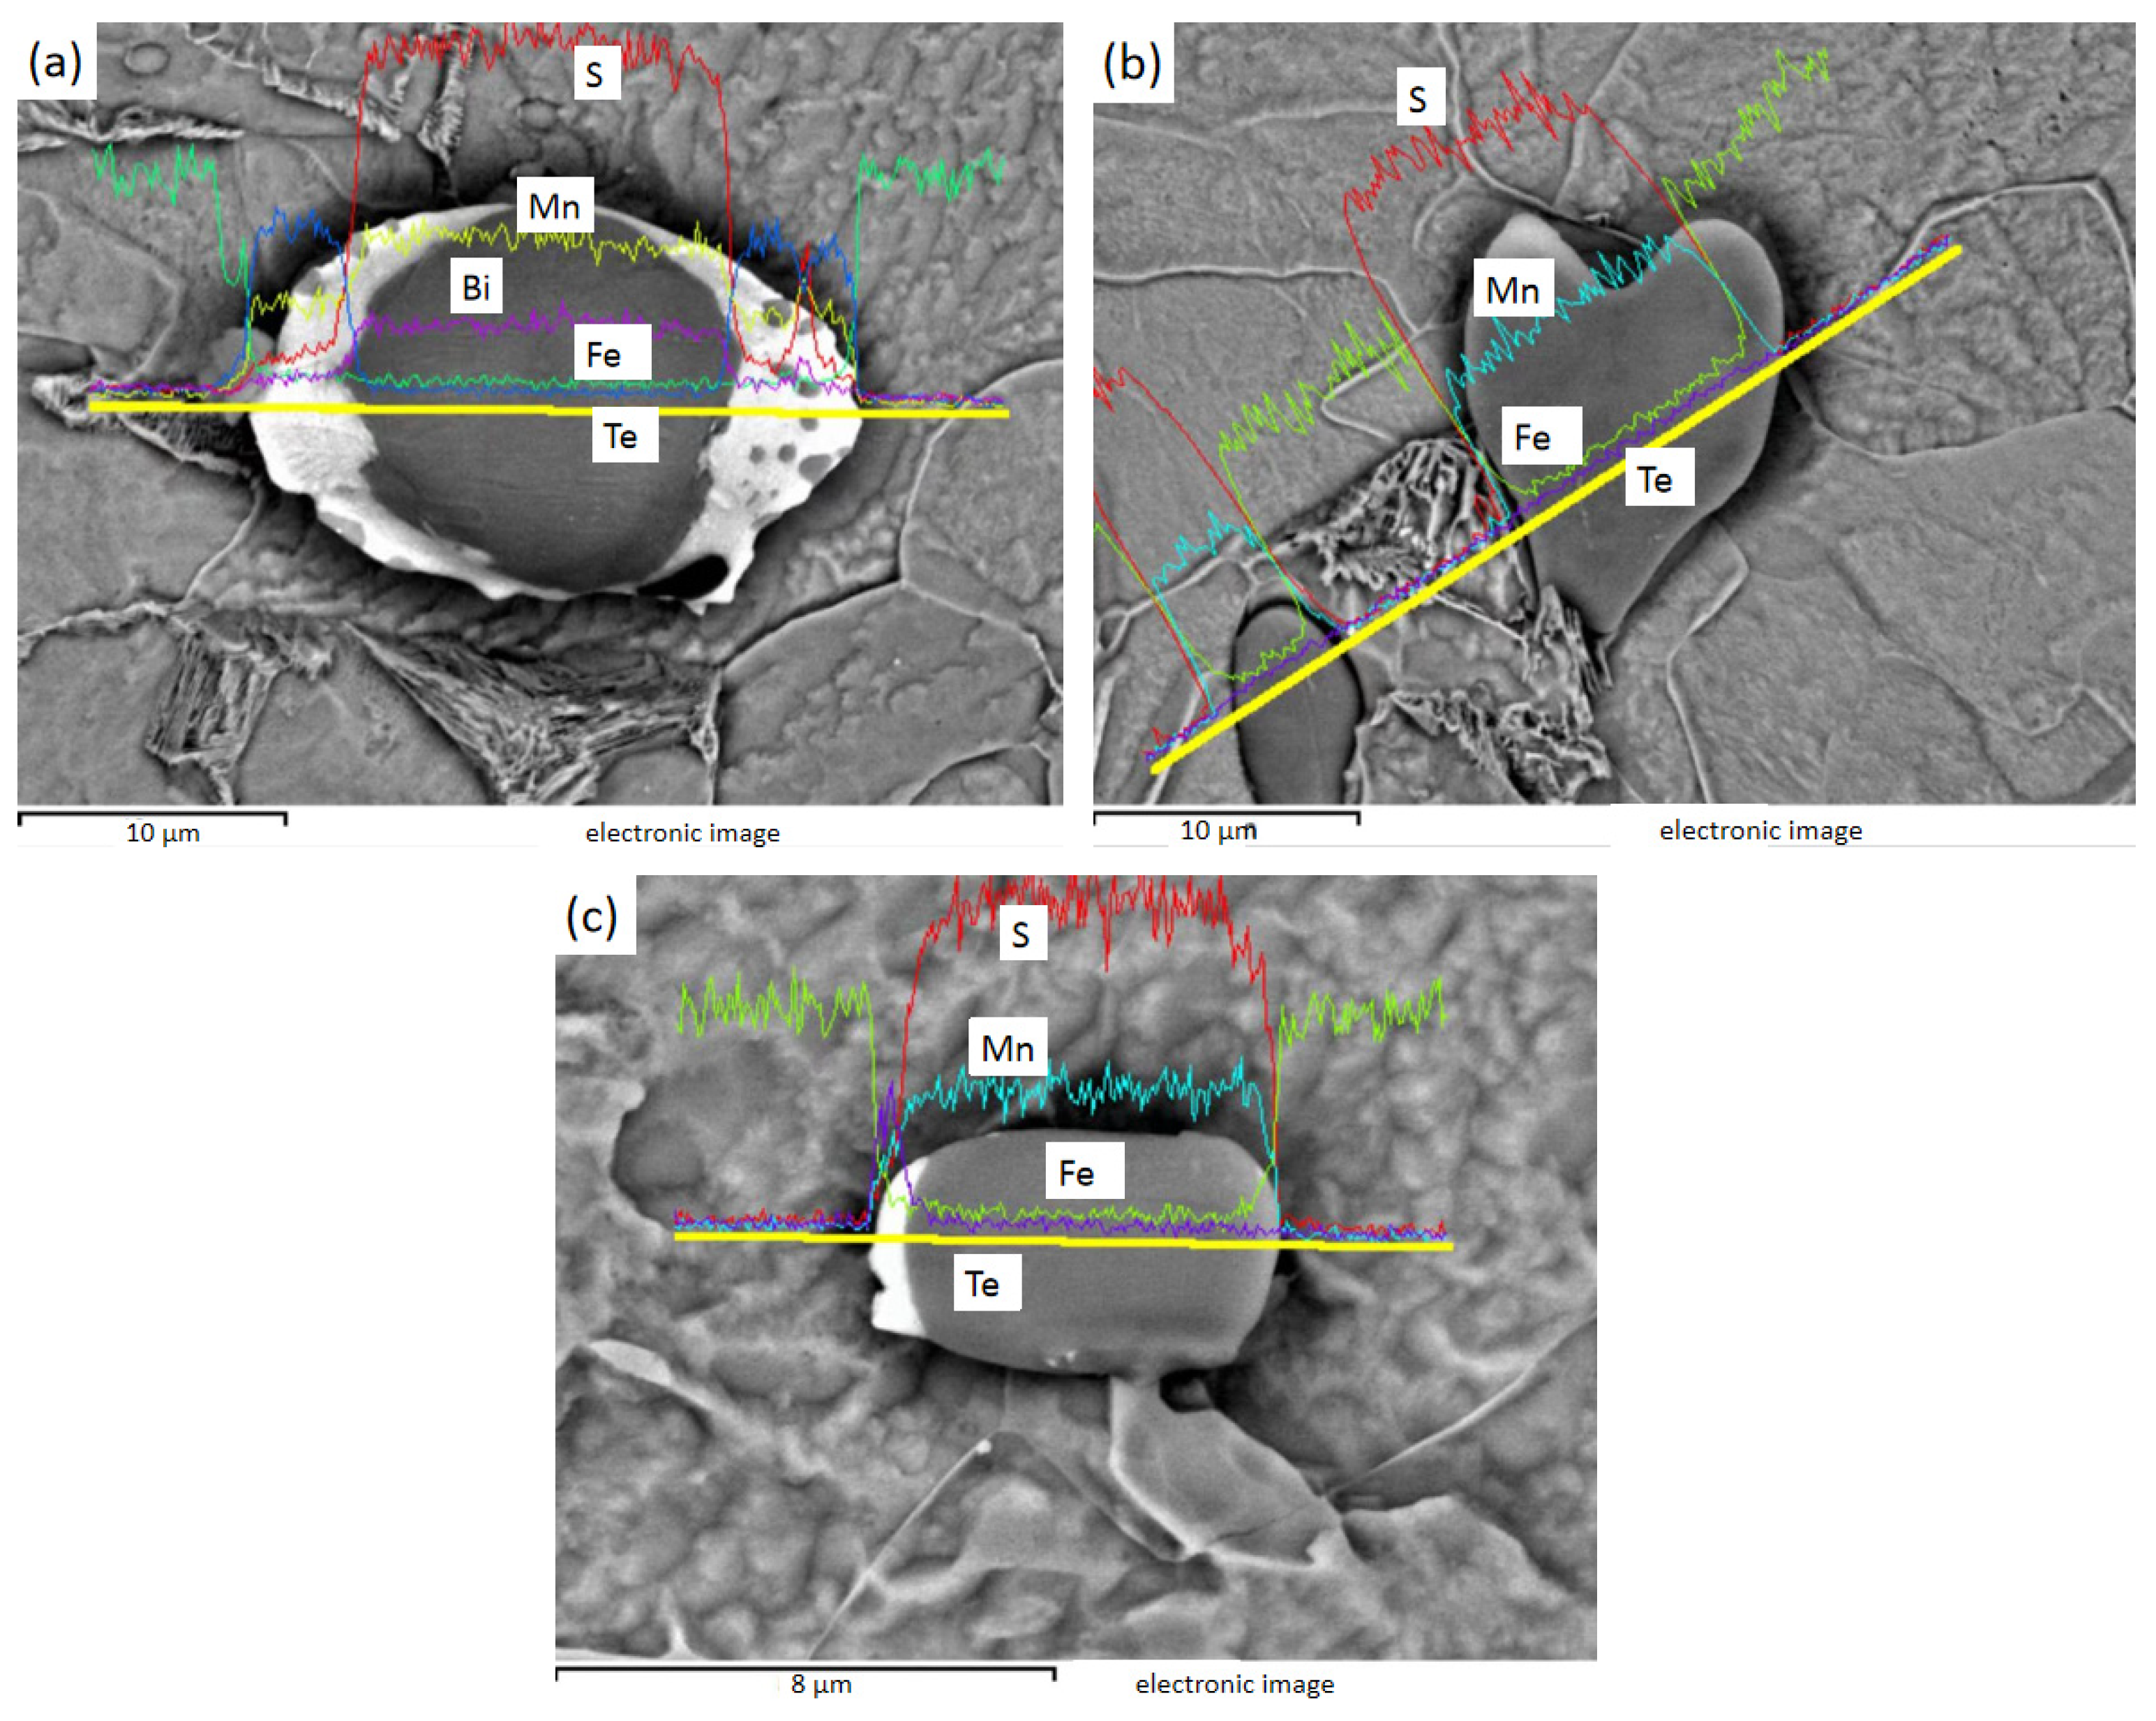
Figure 10 shows the EDS line sweep of 3# after electrolysis. Figure 10a shows the MnS inside the Te package, and Bi is distributed in the MnS. Figure 10b shows the heart-shaped MnS, and Figure 10c shows the MnS with unilateral Te. It can be found that Te exists in steel mainly wrapped in one or both sides of MnS inclusions, while Bi can exist inside MnS.
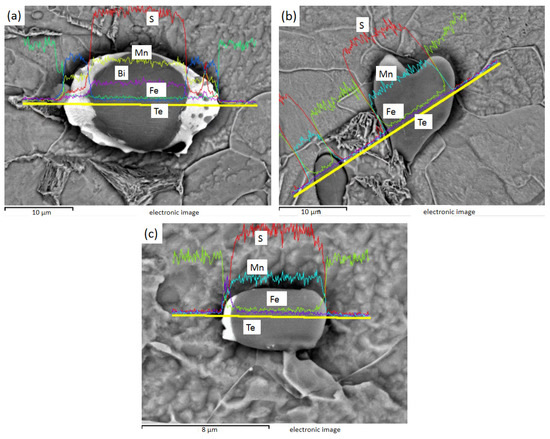
Figure 10.
3# MnS inclusions of heart shape and with Te on either side or one side: (a) fusiform MnS containing Te on both sides and Bi in the middle; (b) heart-shaped MnS; (c) MnS with Te on one side.
The inclusions in sulfur-containing free-cutting steel are MnS, the inclusions in sulfur-containing bismuth free-cutting steel are MnS, Mn (Te, S), and Mn (Te, S), and Bi composite inclusions are found in sulfur-containing bismuth tellurium free-cutting steel. After Bi element was added, the size of inclusions tended to increase, the total number of inclusions decreased, the rod-bar inclusions decreased, and the aspect ratio of inclusions decreased obviously. The addition of Bi and Te changed the composition and morphology of the inclusions, and the shape of the inclusions was more diverse. Bi and Te have obvious improvement effects on inclusions, as both can reduce the number of inclusions and reduce the rod-like inclusions with large aspect ratio.
4. Conclusions
In order to study the influence of Bi element and Bi and Te composite on the inclusions in free-cutting steel, the element design was carried out and the number, distribution, composition, size, and 3D morphology of inclusions were observed. The following conclusions were drawn:
- From the perspective of organization, the microstructure of free-cutting steel is mainly composed of ferrite, pearlite, and inclusions. The highest ferrite content is 97.2% and the lowest pearlite content is in the bismuth-containing free-cutting steel with the mass fraction of 0.088% sulfur and 0.004% Bi. The content of ferrite in bismuth-containing free-cutting steel with 0.131% sulfur, 0.011% Bi, and 0.025% Te is the lowest (92.5%) and the highest pearlite is 7.5%.
- In terms of quantity and distribution, the inclusion quantity of bismuth-containing free-cutting steel with sulfur content of 0.088% and Bi content of 0.004% is the least, and the inclusion quantity of sulfur-containing free-cutting steel with sulfur content of 0.173% is the most. The inclusions in the three groups of free-cutting steels are dotted, chained, and clustered. After the addition of Bi and Te, the distribution of cluster inclusions increases, while after the addition of Bi, the point inclusions increase and are evenly distributed, which is the optimal distribution pattern of free-cutting steel.
- From the perspective of morphology and size, the inclusions of 0.173% sulfur-containing free-cutting steel are spherical, fusiform, and rod-like, with sizes ranging from 2 to 14.6 μm. Some rod-like inclusions have an aspect ratio of 3.7, which will affect the anisotropy of the steel. The inclusion morphology of bismuth-containing free-cutting steel with sulfur content of 0.088% and Bi content of 0.004% is mainly flake inclusion. The overall size is larger, ranging from 13 to 17.7 μm, and the aspect ratio is 2.1 to 2.9, which is also an ideal class III inclusion. The inclusions of bismuth-containing tellurium in free-cutting steels with 0.131% sulfur, 0.011% Bi, and 0.025% Te have different shapes and sizes ranging from 2 to 19.66 μm, but the second type of rod-like inclusions still exist. After adding Bi, the inclusions tend to transform to type III and the size of inclusions increases. After adding Bi and Te, the morphology of inclusions changed irregularly, and the morphology was different.
- In terms of composition, the inclusions of sulfur-containing free-cutting steel and bismuth-containing free-cutting steel are MnS and (Mn, Fe) S, with spherical, fusiform, and rod-like shapes. The inclusions of MnS, Mn (Te, S), and Mn (Te, S) mixed with Bi in sulfur-containing bismuth tellurium steel are three kinds of inclusions, and where Te is distributed at the tip of MnS, Bi may exist in MnS.
Author Contributions
Writing—original draft preparation, X.W.; conceptualization, H.Z., J.W. and Z.J.; investigation, R.Z.; writing—review and editing, Y.Z.; methodology, J.L.; supervision, F.L. All authors have read and agreed to the published version of the manuscript.
Funding
This research was funded by the National Natural Science Foundation of China (NSFC, No. 52274338) and the Education Department Foundation of Liaoning Province (Grant No. LJKZ0303).
Data Availability Statement
Not applicable.
Conflicts of Interest
The authors declare no conflict of interest.
References
- Croccolo, D.; De Agostinis, M.; Fini, S.; Olmi, G.; Robusto, F. Coating effect on the fatigue strength of a free cutting steel. J. Mech. Eng. Sci. 2019, 233, 095440621983644. [Google Scholar] [CrossRef]
- Martinez Krahmer, D.; Urbicain, G.; Sánchez Egea, A.J. Dry machinability analyses between free cutting, resulfurized, and carbon steels. Mater. Manuf. Process. 2020, 35, 460–468. [Google Scholar] [CrossRef]
- EU-Directive. Restriction of the Use of Certain Hazardous Substances in Electrical and Electronic Equipment (RoHS); European Union: Brussels, Belgium, 2003. [Google Scholar]
- European Union. Directive 2012/19/EU of the European Parliament and of the Council of 4 July 2012 on waste electrical and electronic equipment (WEEE). Off. J. Eur. Union L 2012, 197, 38–71. [Google Scholar]
- Wang, Y.; Bao, Y. Control of inclusions in BN type free-cutting steel and its influence on cutting performance. J. Iron Steel Res. Int. 2017, 29, 382–390. (In Chinese) [Google Scholar]
- Zhuang, L.; Di, W. Effect of Free-cutting Additives on Machining Characteristics of Austenitic Stainless Steels. J. Mater. Sci. Technol. 2010, 6, 839–844. [Google Scholar]
- Lin, S.G.; Yang, H.H.; Su, Y.H.; Chang, K.L.; Yang, C.H.; Lin, S.K. CALPHAD-assisted morphology control of manganese sulfide inclusions in free-cutting steels. J. Alloys Compd. 2019, 779, 844–855. [Google Scholar] [CrossRef]
- Imanami, Y.; Tomita, K.; Nishimura, K. Factors Affecting Surface Roughness of Low Carbon Resulfurized Free Cutting Steel; JFE Technical Report. 23; JFE Steel Corporation: Tokyo, Japan, 2018. [Google Scholar]
- Hu, S.; Li, Z.; Fan, T.; Fu, J. Effect of Bismuth on Sulfide in High Sulfur Free-cutting Steel. IOP Conf. Ser. Mater. Sci. Eng. 2019, 611, 012017. [Google Scholar] [CrossRef]
- Lin, T.C.; Zhu, R.; Wang, C.J.; Li, M.G. Effect of Trace Bi on Inclusion Morphology in Free-Cutting Steel. Iron Steel 2013, 48, 77–80. [Google Scholar]
- Sathyamurthy, P.; Vetrivelmurugan, R.; Sooryaprakash, J. Improving the machinability of leaded free cutting steel through process optimization. IOP Conf. Ser. Mater. Sci. Eng. 2018, 314, 012019. [Google Scholar] [CrossRef]
- Wang, Z.; Shao, Z.; Li, Z.; Zhang, H.; Wang, J.; Zhang, H.; Yuan, J. Making of Free Cutting Austenitic Stainless Steels with Additions of Sulfur, Rare Earth and Bismuth. In Proceedings of the International Conference on Advanced Design & Manufacturing Engineering, Shenzhen, China, 19–20 September 2015. [Google Scholar]
- Sun, K. Experimental study on Calcium-sulfur composite free-cutting steel. Spec. Steel 1983, 1, 71–81. (In Chinese) [Google Scholar]
- Chen, L.; Tu, S.; Chen, W.; Li, L.; Lu, Q.; Wang, Q. Low carbon high sulfur tin antimony composite free cutting steel. J. Univ. Sci. Technol. Beijing 2009, 31, 4. (In Chinese) [Google Scholar]
- Gao, P. Research and Development of Free-Cutting Stainless Steel for New Ballpoint Pen Head. Master’s Thesis, Jiangsu University, Zhenjiang, China, 2009. (In Chinese). [Google Scholar]
- Yuan, L.; Zheng, L.G.; Hu, X.Q.; Zhang, Y.T. Effect of Rare Earth Ce on Machinability, Strength and Toughness of 42CrMo Cut Steel. J. Shenyang Ligong Univ. 2022, 41, 76–80. (In Chinese) [Google Scholar]
- Zhang, P.; Zeng, Z.; Fan, T.; Shen, P.; Fu, J. Deep Analysis of Free-cutting Phase and Its Distribution in Japanese SF20T Pen Tip Steel. IOP Conf. Ser. Mater. Sci. Eng. 2019, 611, 012019. [Google Scholar] [CrossRef]
- Liu, H.T.; Chen, W.Q. Hot ductility of eco-friendly low carbon resulphurised free cutting steel with bismuth. Ironmak. Steelmak. 2014, 41, 19–25. [Google Scholar] [CrossRef]
- Zhang, Q.; Min, Y.; Xu, H.; Liu, C. Formation and Evolution of Inclusions in Si-killed Resulfurized Free-cutting Steel. ISIJ Int. 2018, 58, 1250–1256. [Google Scholar] [CrossRef]
- Ryabov, A.V. Medium-Carbon Free-Cutting Steel. Mater. Sci. Forum 2019, 946, 47–52. [Google Scholar] [CrossRef]
- Yan, J.; Li, T.; Shang, Z.; Guo, H. Three-dimensional characterization of MnS inclusions in steel during rolling process. Mater. Charact. 2019, 158, 109944. [Google Scholar] [CrossRef]
- Zhang, Q. Formation and evolution behavior of inclusions in Al-killed resulfurized free-cutting steel with magnesium treatment. J. Iron Steel Res. Int. 2020, 27, 12. [Google Scholar] [CrossRef]
- Hashimura, M.; Mizuno, A.; Miyanishi, K. Effect of MnS distribution on machinability in low-carbon free-cutting steel. Iron Steel Technol. 2009, 6, 45–51. [Google Scholar]
- Shao, X.; Wang, X.; Jiang, M.; Wang, W.; Huang, F. Effect of Heat Treatment Conditions on Shape Control of Large-sized Elongated MnS Inclusions in Resulfurized Free-cutting Steels. ISIJ Int. 2011, 51, 1995–2001. [Google Scholar] [CrossRef]
- Li, H.; Gao, H. Morphology of manganese sulfide in steel and its effect on steel properties. CFHI Technol. 2004, 4, 3. (In Chinese) [Google Scholar]
- Qiu, B.; Sui, H.; Che, D.; Sun, M.; Li, J.; Wang, L. Effects of oxygen content and forging ratio on sulfide morphology and machinability in free-cutting stainless steel. J. Iron Steel Res. Int. 2021, 33, 418–425. (In Chinese) [Google Scholar]
- Zhu, Q.; Li, J.; Deng, X.; Tian, Q.; Zeng, Z.; Fu, J. Analysis of inclusions in Magnesium series easy cutting steel. Iron Steel Vanadium Titan. 2021, 42, 179–187, 192. (In Chinese) [Google Scholar]
- Lu, J.; Cheng, G.; Qiu, W.; Long, H.; Liu, C. Effect of Zr addition on morphology characteristics of MnS inclusions in Medium carbon and high sulfur free-cutting steel. J. Iron Steel Res. Int. 2022, 34, 963–972. (In Chinese) [Google Scholar]
- Wang, Y. Effect of forging process on mechanical properties and manganese sulfide in easy cutting steel. Forg. Stamp. Technol. 2021, 46, 12–18. (In Chinese) [Google Scholar]
Disclaimer/Publisher’s Note: The statements, opinions and data contained in all publications are solely those of the individual author(s) and contributor(s) and not of MDPI and/or the editor(s). MDPI and/or the editor(s) disclaim responsibility for any injury to people or property resulting from any ideas, methods, instructions or products referred to in the content. |
© 2023 by the authors. Licensee MDPI, Basel, Switzerland. This article is an open access article distributed under the terms and conditions of the Creative Commons Attribution (CC BY) license (https://creativecommons.org/licenses/by/4.0/).

