Review

Prediction of Fatigue Crack Initiation under Variable Amplitude Loading: Literature Review

Faculty of Science and Technology, University of Stavanger, N-4036 Stavanger, Norway
*
Author to whom correspondence should be addressed.
Metals 2023, 13(3), 487; https://doi.org/10.3390/met13030487
Submission received: 26 January 2023 / Revised: 17 February 2023 / Accepted: 23 February 2023 / Published: 27 February 2023

Abstract

:
Metallic materials are widely employed in engineering constructions, and one of the most common failure mechanisms in metals is fatigue failure. Even though metal fatigue has been studied for almost 160 years, many problems remain unsolved. Fatigue in metal occurs when the metallic material is subjected to varying loads, resulting in failure due to damage accumulation. The fatigue process consists of a buildup of damage that leads to crack initiation, followed by a period of crack growth until the critical flaw size is reached. The sum of a start phase and a propagation phase represents the total life. To better understand the fatigue phenomenon at its different stages and predict the fatigue life, various types of prediction models have been developed and reported in the literature. This paper reviewed the different models that include microstructure scale parameters that can be used to predict how fatigue cracks start under variable amplitude loading, including the Modified Tanaka-Mura Model, Acoustic Second Harmonic Generation, and the Probability of Crack Initiation on Defects. For perfect life prediction under variable amplitude loading, a stress-based approach, a strain-based approach, and a continuum damage mechanics approach are reviewed. The purpose of this paper is to get overview of the current state of approaches to the life prediction of fatigue crack initiation with variable amplitude. Finally, gaps in knowledge about the prediction of fatigue crack initiation under variable loading at high temperatures are pointed out.

1. Introduction

Metals are the most used materials in engineering constructions, but fatigue failure is a major concern when working with metals. Despite almost 160 years of research, many questions about metal fatigue still have not been answered. Material property, structure, loading, and environment are the four main parameters that influence the fatigue life of metal structures [1]. Fatigue is the progressive failure of a material caused by the initiation of flaw growth under cyclically varying stress. Over the years, fatigue has been blamed for most in-service failures in aerospace engineering (airframe structures), civil engineering (offshore platforms, buildings, bridges) and mechanical engineering (machine components, boilers, propellers, rotors, shafts, and turbines). This can occur because of pure mechanical loads, corrosive conditions (corrosion fatigue), or excessive temperatures (creep-fatigue). The fatigue failure process can be decomposed into the following separate, interdependent, and interactive phenomena: (i) cyclic plastic deformation prior to crack initiation, (ii) initiation of one or more microscopic cracks, (iii) growth and eventual coalescence of the microscopic cracks to form one or more macroscopic cracks, (iv) growth or propagation of both the microscopic and macroscopic cracks, and (v) catastrophic failure. The relative significance of the initiation and propagation stages varies with the stress amplitude, component shape, material, temperature, previous loading, and environment. Although fatigue is the most common fracture mode in metallic materials, accounting for more than 80% of all structural material in-service failures, it is the least known and studied type of fracture from a mechanical standpoint [1,2,3]. A fracture is started and propagated by the available cyclic stresses in the fatigue failure. Cyclic stresses can cause microcracks. Microscopic faults can develop and combine into macrocracks, and the macrocrack then fractures. As the microscopic crack occurs before standard nondestructive crack detection equipment can detect it, there are varying definitions of when the fatigue crack initiation phase finishes and the crack propagation phase begins [4,5].
As previously stated, fatigue damage in steel throughout the 19th century was linked to a strange crystallization of a fibrous structure. It had not yet been physically defined. In the earlier part of the 20th century, it was believed that cyclic slip was necessary for microcrack initiation. Cracks, even microcracks, indicate material decohesion and should thus be considered damage. However, can cyclic slip also cause damage? What about cyclic strain hardening in slip bands? In the study reported in [6], it was hypothesized that fatigue fracture initiation occurs when the limit of local strain hardening is exceeded. Orowan in [7] proposed that the limited depletion of ductility causes a localized increase in stress, which eventually leads to cracking. In [8], the authors used this principle in a model to derive an equation for fatigue fracture development. Most research concur that fatigue cracks began at or around singularities or just beneath the surfaces of metals. This may include inclusions, embrittled grain boundaries, sharp scratches, pits, and slide bands [9]. Estimating fatigue damage in engineering materials subjected to variable amplitude (VA) in multiaxial fatigue loading is a problem as complex as it is important to solve because, in situations of practical interest, mechanical components experience random stress or strain states at their critical locations. Considering the significance of this structural integrity issue, numerous attempts have been made since the beginning of the 1980s to formalize methodologies for evaluating fatigue damage under such conditions. Specifically, a review of the state-of-the-art reveals that this intractable problem has been tackled by focusing on the following three aspects: (i) material fracture behavior, (ii) cycle counting, and (iii) fatigue strength estimation [10,11]. This is especially true for welded structures, where some researchers claim. that crack-like defects always exist, causing fatigue to be a problem solely of crack propagation. According to other researchers, the crack initiation phase is an important and finite part of the fatigue life. The occurrence of crack initiation in cyclically deformed metals has been supported by a considerable body of data that has been recorded and presented over the years [11,12,13,14]. Despite significant improvements in recent decades, life prediction and reliability evaluation remain difficult problems. The work reported in [15] provides a full overview of early advances. In comparison to fatigue under constant amplitude loading, fatigue modeling under variable amplitude loading is more complex, both deterministically and probabilistically. First, an accurate deterministic damage accumulation rule is necessary, as the commonly used linear Palmgren-Miner’s rule may not be adequate to represent the physics. The number of loading cycles used in both constant and variable loading conditions increases fatigue damage. However, the features of damage accumulation vary depending on the loading. Bridges, for example, are used by vehicles, buses, and trucks of varying weights, putting the structure under varying degrees of stress. As a result, a strategy for predicting fatigue life with varying amplitude loading is required [16]. Researchers have been attempting to identify the optimal rule to characterize fatigue damage accumulation behavior for over eighty years [4,14].
The distinction between fracture initiation and crack propagation during fatigue loading is crucial for designing structures, components, and materials for increased fatigue resistance. Once a fatigue crack is begun, the subcritical crack widens to a particular length, the stress intensity factor at the crack tip reaches a critical value, and the fracture or failure becomes unstable. For a period of years, research on the practical significance of fatigue response, features, and eventual failure was focused on evaluating various materials [2]. Most researchers have found that fatigue cracks began at or near singularities on or near the surfaces of metals.
The inclusions, embrittled grain boundaries, sharp scratches, pits, and slip bands are all examples of singularities. On the other hand, subsurface nucleation has been seen in metals with strongly adherent surface oxide, which delays crack initiation at the external surface. In many cases, “singularities” (i.e., voids and regions of high internal stress) within the metal were shown to be the origin of cracks that started beneath the surface. A large body of data, both empirical and theoretical, has accumulated over the years in favor of the existence of initiation in cyclically deformed metals [11,13,14,15,16,17]. Fatigue crack difficulties are experienced in several constructions and industrial applications because of numerous factors, such as manufacturing method, material type, climatic conditions, or different load types impacting the structure. Fatigue fractures, one of the primary causes of structural deterioration, have a significant role in the design and performance of engineered materials. Existing fractures in a structure can sometimes remain within the structure until they reach a safe size, while other times they might cause catastrophic damage with a rapid fracture and, in extreme situations, death [18]. In order to prevent such unfavorable circumstances, it is necessary to calculate and determine the fracture parameters in a precise and accurate manner in order to establish how long the structure can continue to function safely with the existing cracks, or the safe life of the structures with cracks. The purpose of this paper is to review the current state of fatigue crack initiation life prediction approaches with variable amplitude. The different models that include microstructure scale parameters that can be used to predict how fatigue cracks start under variable amplitude loading, including the Modified Tanaka-Mura Model, Acoustic Second Harmonic Generation, and the Probability of Crack Initiation on Defects. For perfect life prediction under variable amplitude loading, a stress-based approach, a strain-based approach, and a continuum damage mechanics approach are reviewed.

2. Methods

To achieve the aim of this literature review, the main scientific databases have been explored. The English language was selected as the main source of reviews, to identify the potentially relevant documents, as the following bibliography database were searched. Google Scholar, CrossRef, J-Gate Ulrich’s, Ebsco, Index Copernicus, WorldCat, Stanford Libraries, Directory of Research Journals Indexing, RePEc, Hein Online, Econpapers, Ideas, Journal Factor, Scipio, J-Gate, Scientific Indexing Services, Elektronische Zeitschriftenbibliothek, Baztool, Bielefield Acedamic Search Engine, DOAJ Directory of Open Accsess Journal, eLibrary. ru, FreeFullPdf, INGENTA, etc. and “crack initiation, models of fatigue crack initiation, life prediction, metal fatigue, and variable amplitude loading” were the search words used.

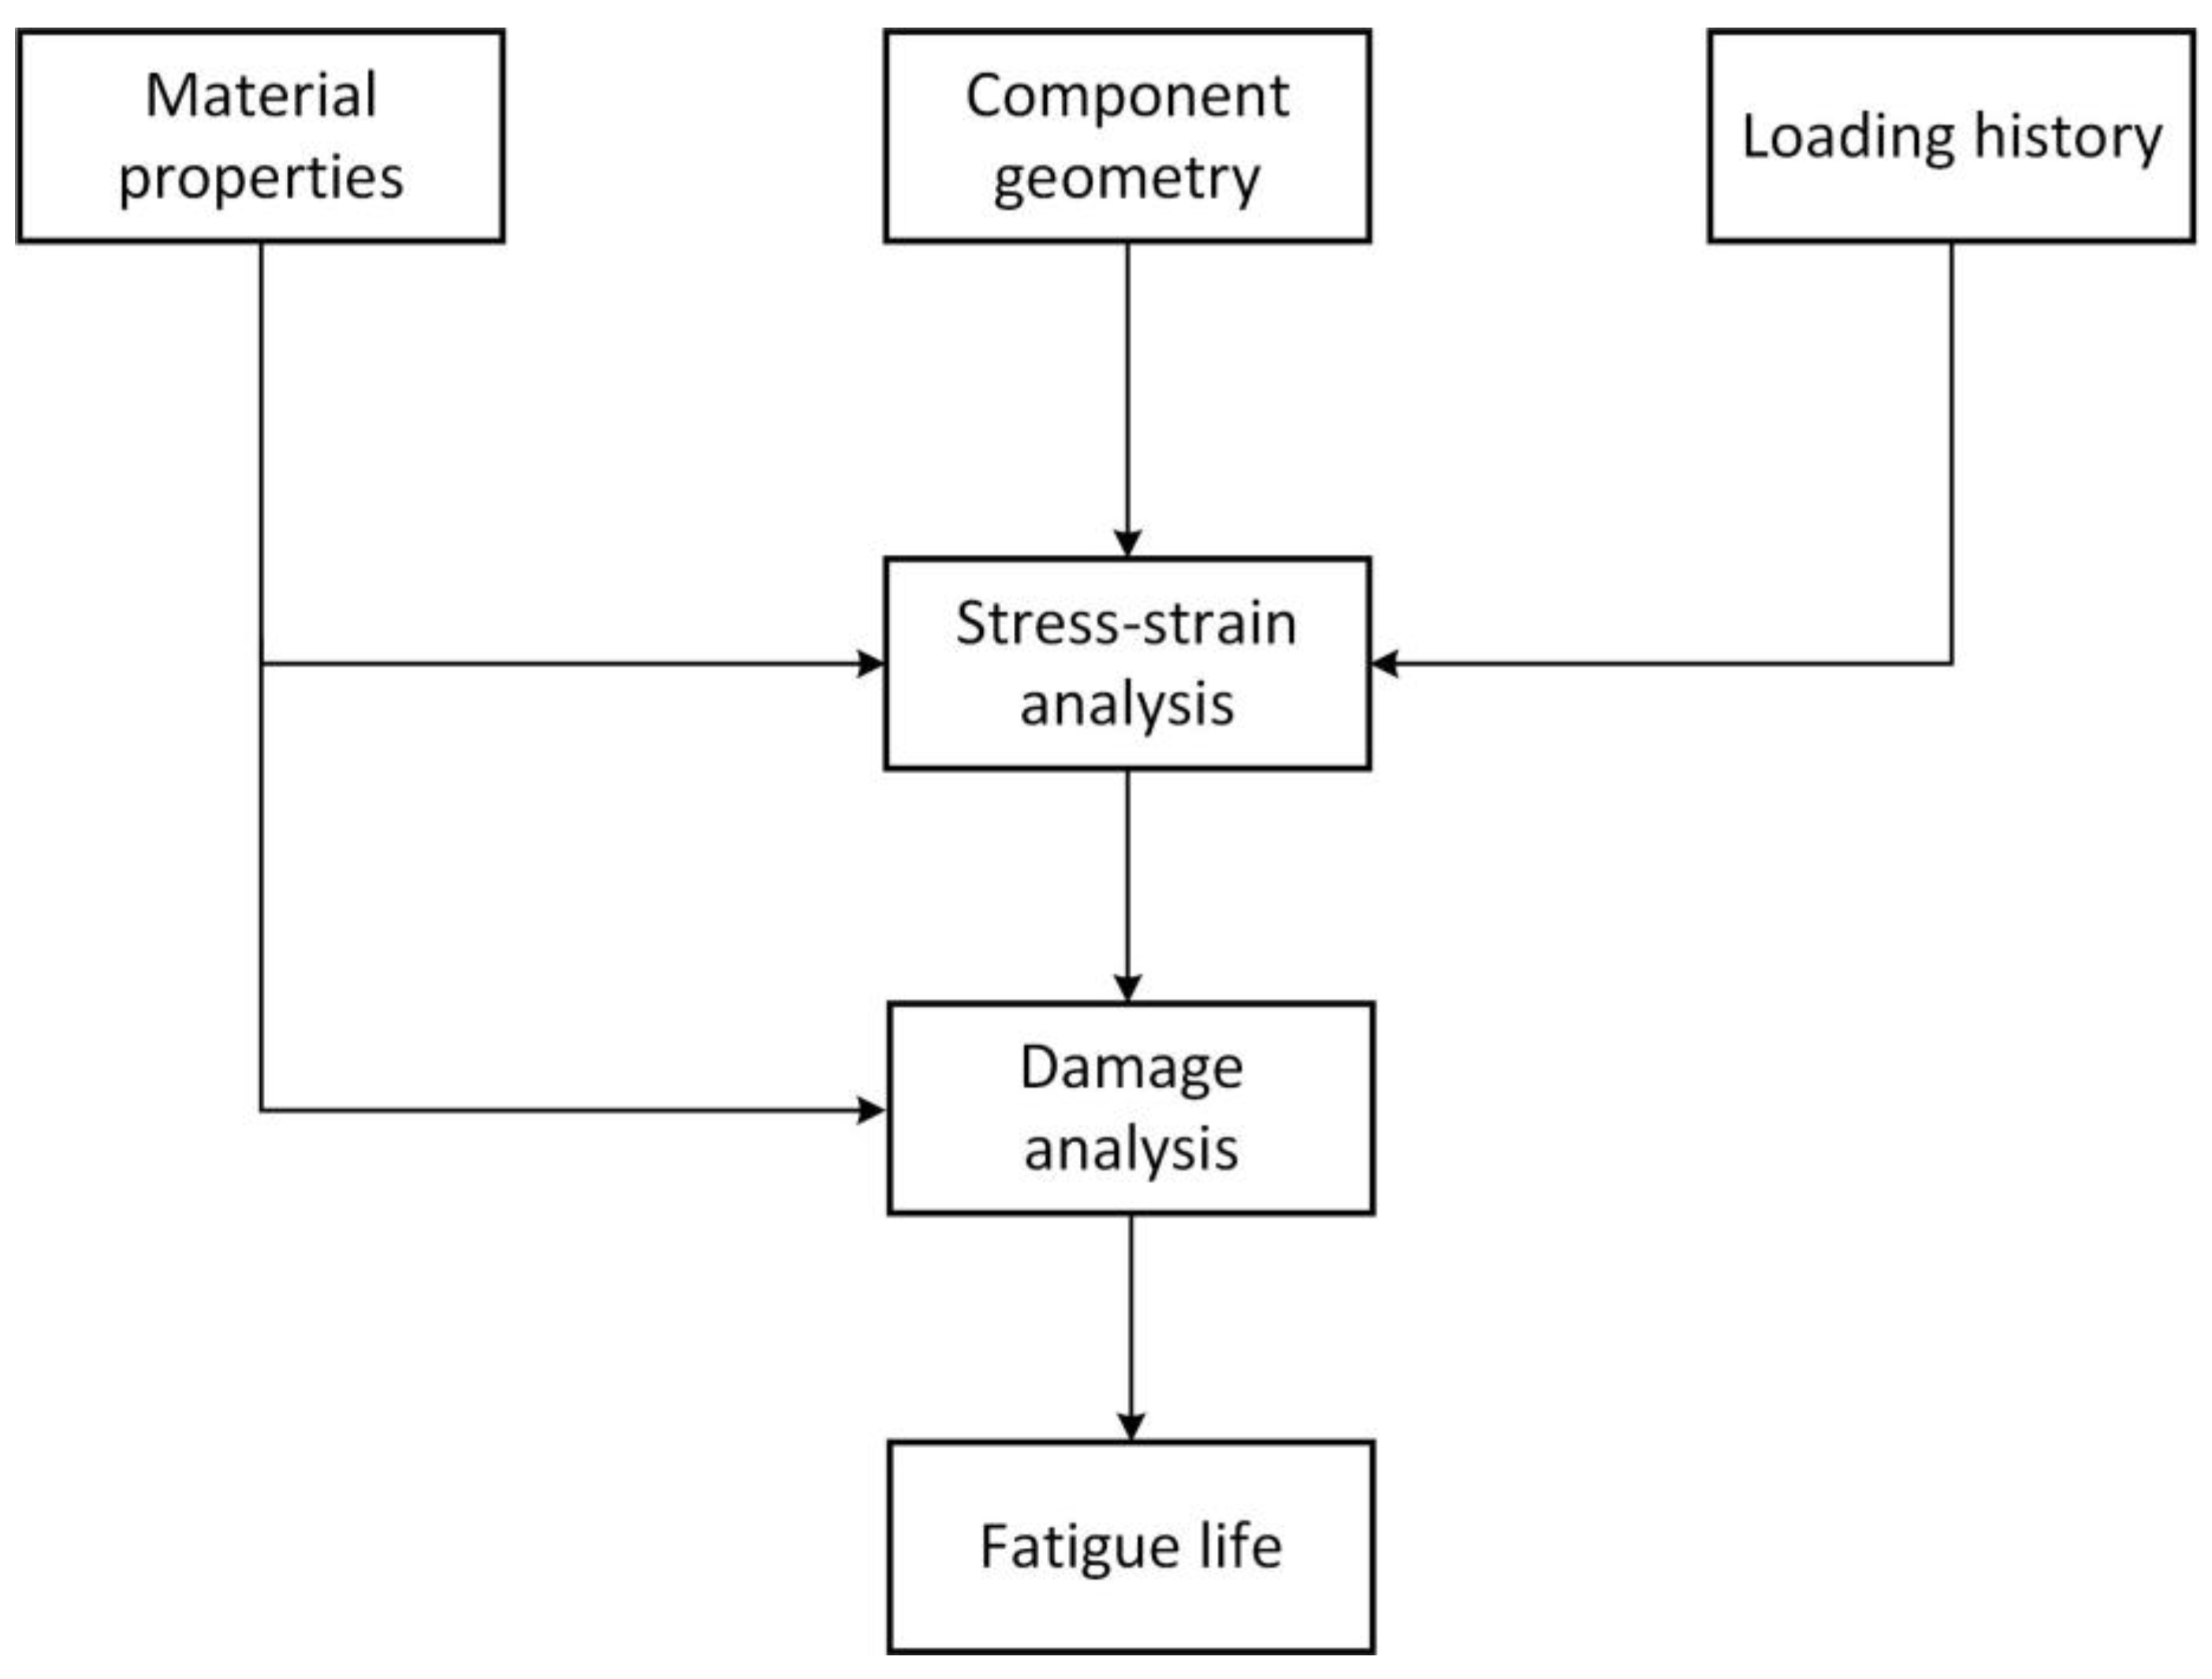
3. Overview of Crack Initiation Approach

The crack initiation method uses two steps to turn the load history, component geometry, and material input into a prediction of the life of the component. As shown in Figure 1, these steps must be done one after the other [19]:
  • First, estimates are made of the stresses and strains at the critical site.
  • Second, local stresses and strains are used to compute damage, which is summed up algebraically over time until a critical damage total (failure threshold) is met.
  • Third, predicted life is the time in history when the failure criteria were met.
Some ways to use the crack initiation method involve figuring out damage indirectly from loads or stresses far away, which are then scaled to account for the notch. Sometimes, these methods are called nominal methods (stress calculated on the basis of a specimen’s net cross section without accounting for the effect of geometric discontinuities such as holes, grooves, fillets, and so on). They use nominal stresses and strains to figure out damage in a roundabout way [19]. Other methods use the “crack initiation” approach by figuring out the stresses and strains at the notch. This lets the damage be directly measured in terms of the stresses and strains in the area. When local stresses and strains are used, these methods are often called local methods or critical location methods. Smith [20] realized for the first time in 1961 that it was important to take into account local inelastic action and residual stresses. Morrow, et al. [21] and Crews and Hardrath [22] went on to explain this idea of local stress and strain in more detail.

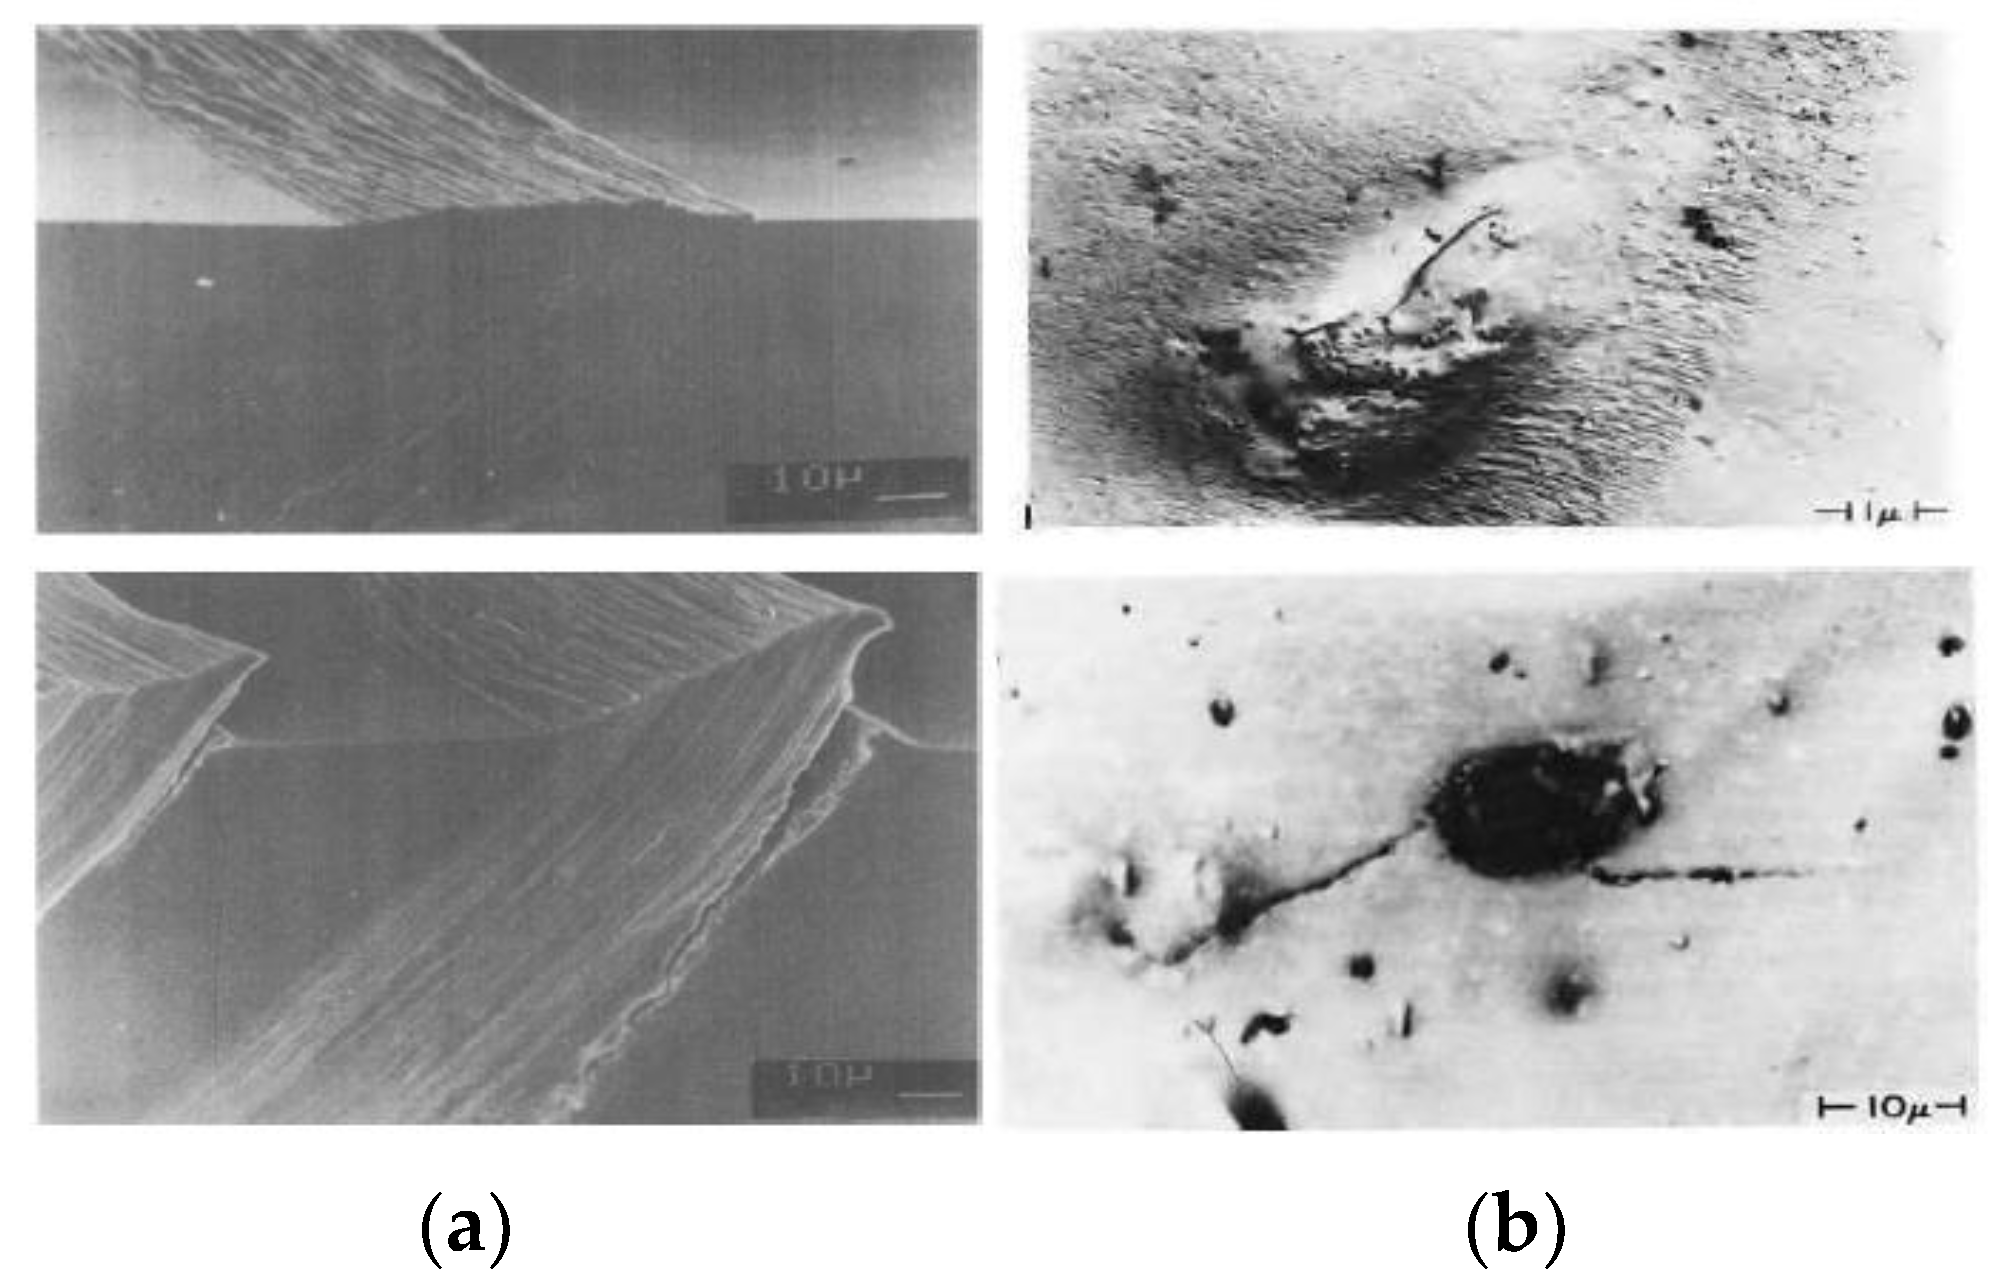
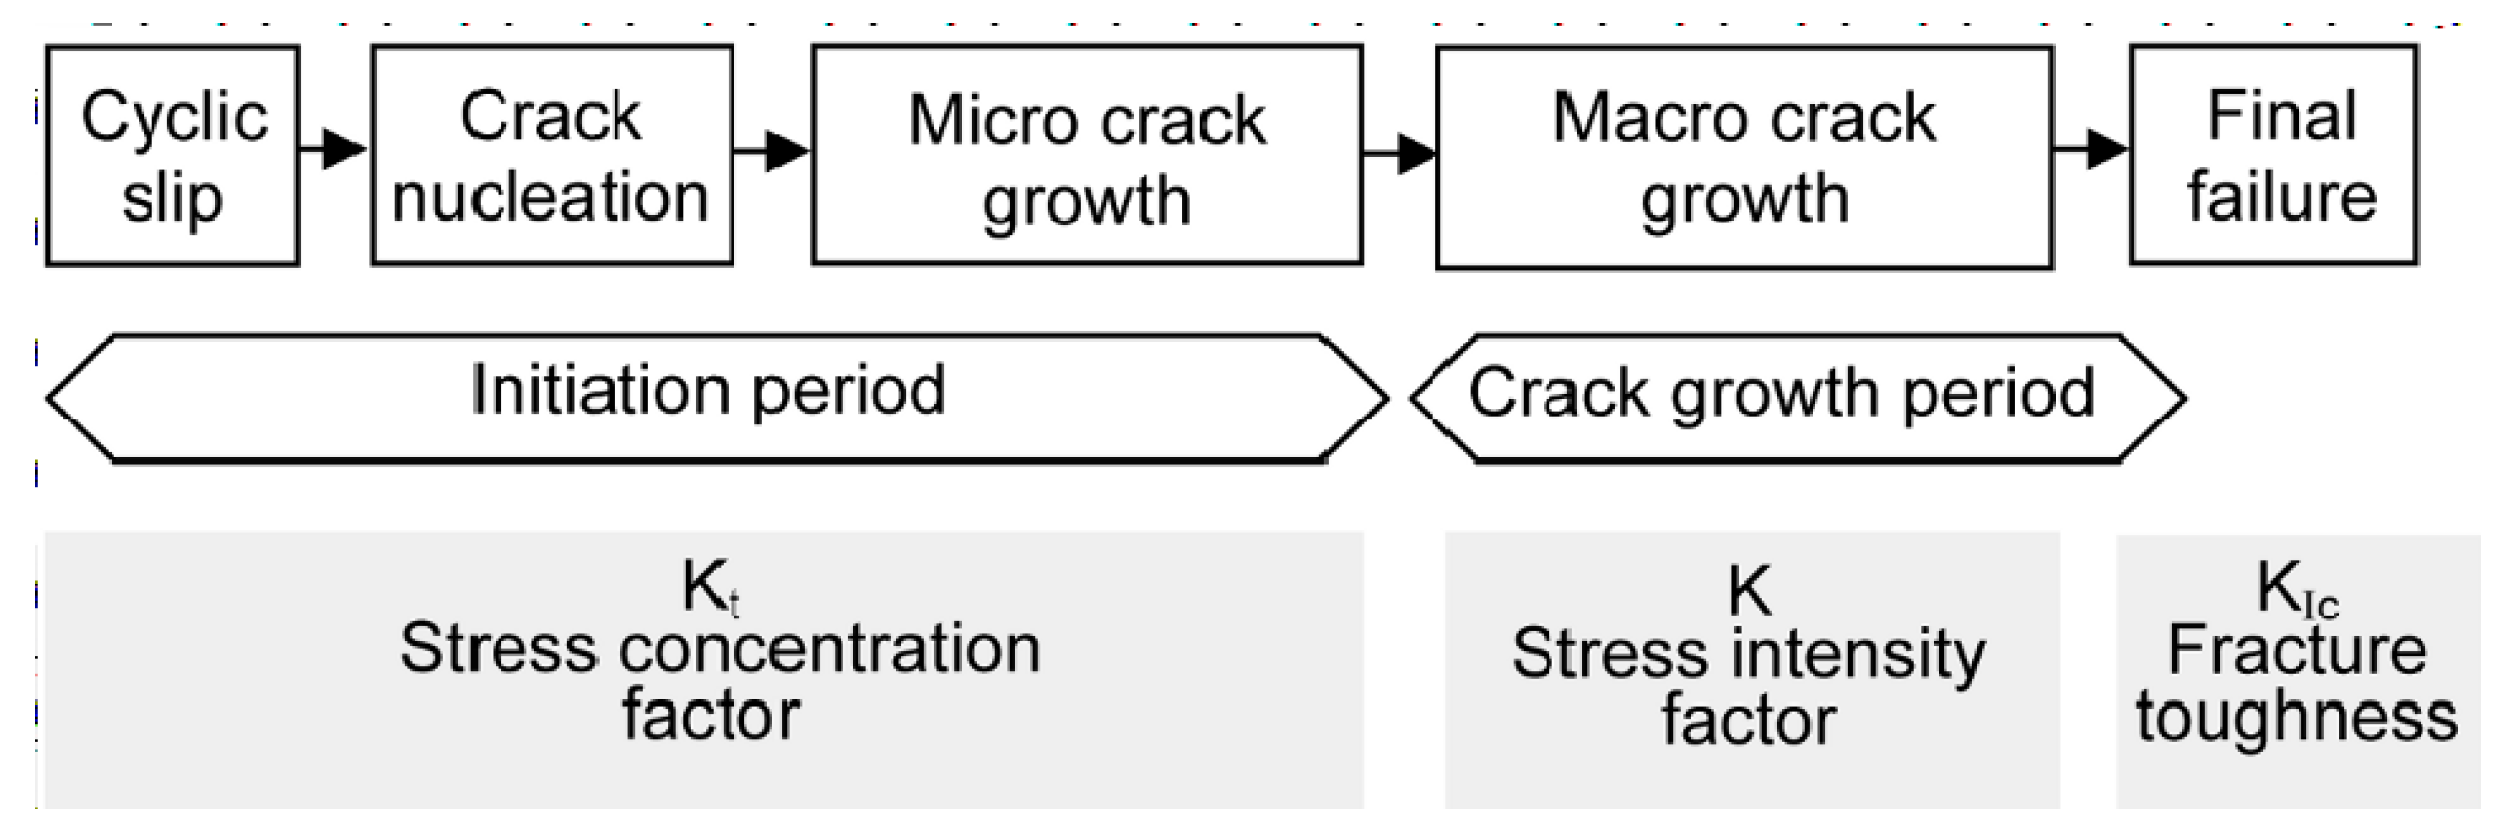
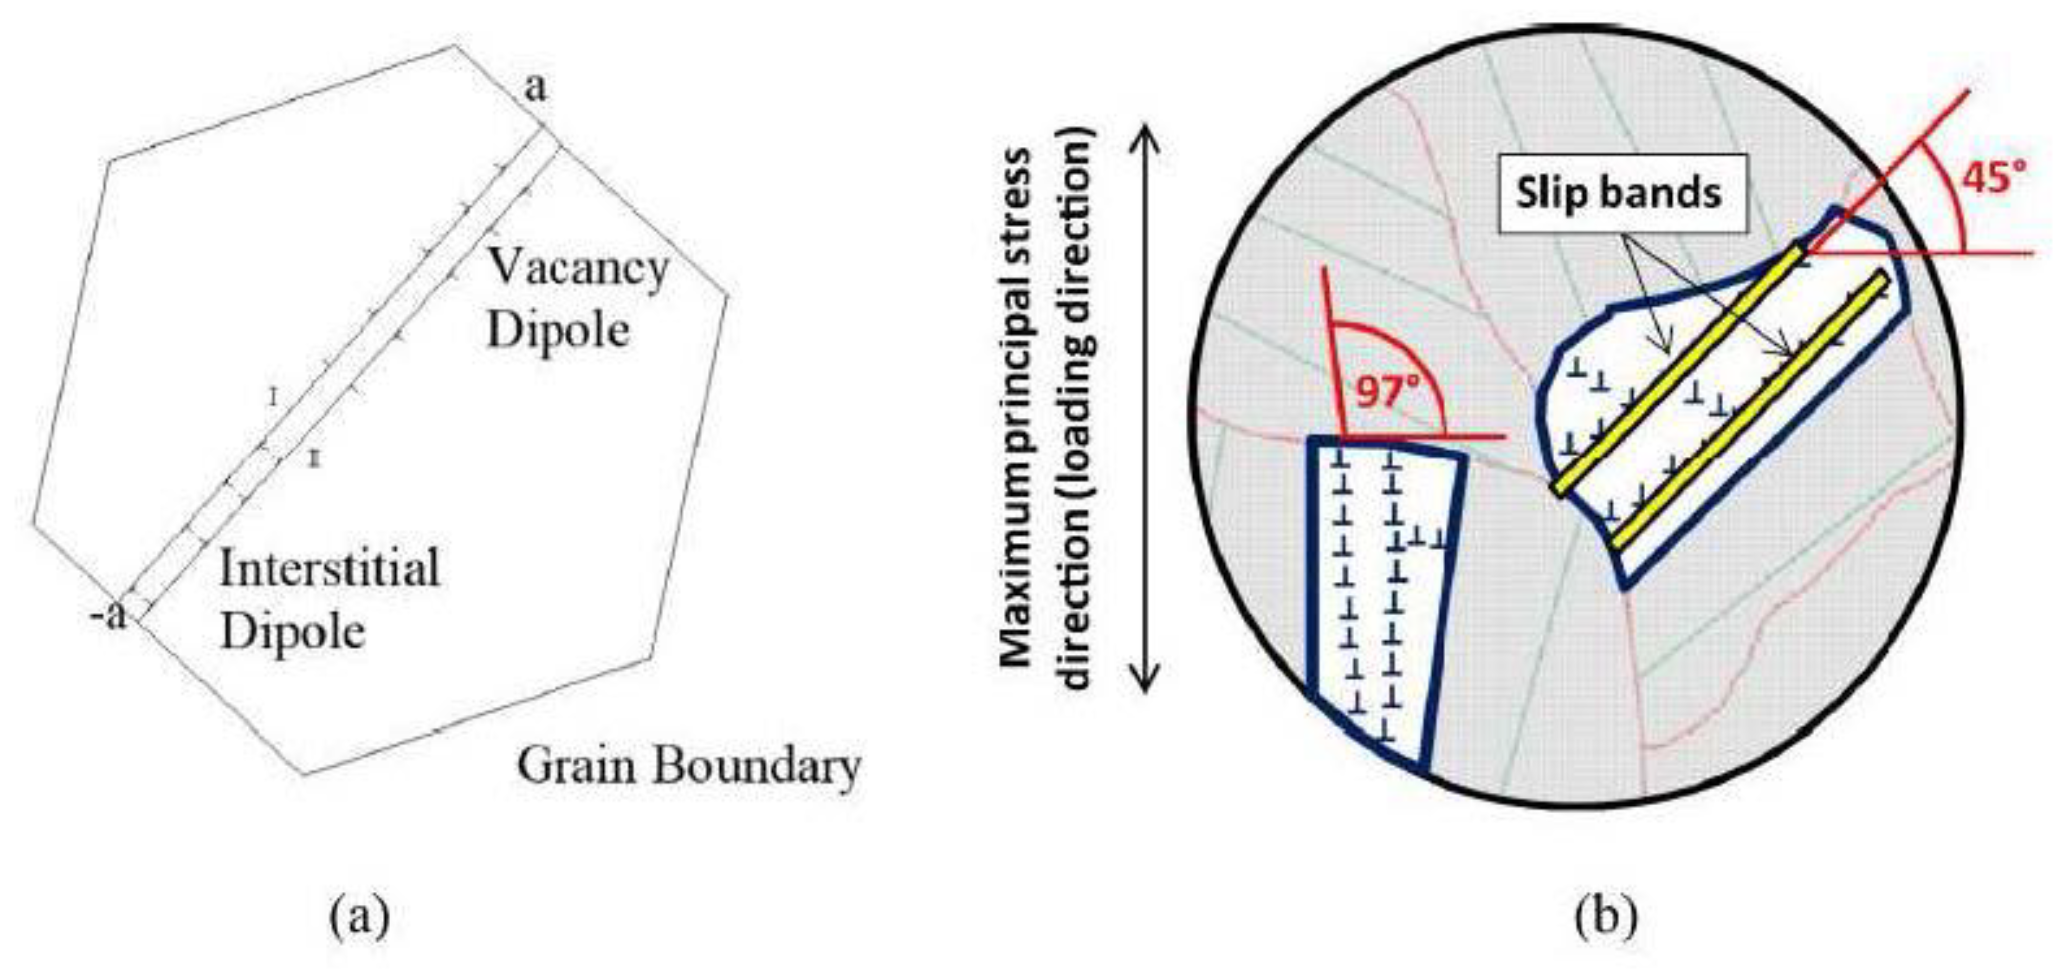
4. Physics of Crack Initiation

The distinguishing properties of fatigue crack initiation are inextricably linked to the scale at which it is observed. A mechanical engineer, for example, would associate the resolution of fracture detection with the threshold for crack nucleation, whereas a materials scientist might regard the nucleation of faults along persistent slip bands as the first step of fatigue failure. Among the many differences in opinion that can be found across this spectrum are failure mechanisms associated with the initiation of microscopic flaws at grain boundaries, twin boundaries, inclusions, microstructural and compositional inhomogeneities, and microscopic and macroscopic stress concentrations.
The fundamental difference between the fatigue design theories being employed in industry is how they address fatigue crack initiation. One of the most essential research goals is to develop a quantitative framework for understanding the mechanisms underlying fracture initiation [12]. The atomic-scale deformation process inside the material is essential to comprehending fracture onset during low cycle fatigue in metals (dislocation level). Metals undergo plastic deformation through dislocation motion, which occurs via the slip or twinning of crystalline lattices. Slip is the principal mechanism of fatigue in most polycrystalline alloys. Plastic deformation manifests as strain localization leads to fracture development as slip accumulates during cyclic loading. This process is determined by the material’s specific microstructure and strengthening mechanisms [23,24].
To characterize fatigue at the dislocation level in a generic engineering alloy, the following slip sequence is proposed. (i) dislocations are created during processing or nucleate at grain boundaries, (ii) dislocations start gliding on a slip system in preferentially oriented grains once they reach the critical resolve shear stress on that slip system, and (iii) dislocations continue to slip until they run into an elastic field created by a solute particle, another dislocation, a grain boundary, or a precipitate. When the load is increased, additional dislocations form or the blocked ones find a way around the obstruction by climbing, jogging, bending, crossing, shearing, or looping [23,24,25,26]. Slip bands cause the production of microcracks in many metals due to the intrusion-extrusion mechanism. Indeed, the environment reacts with the fresh surfaces of the slip bands on the surface (extrusion) and prevents them from moving back and forth, causing metal damage [3].
As the accuracy of research results are significantly affected by the scale of the crack, research methods are devised by focusing on either microcracks that are very small to be seen by our naked eyes, and macro cracks that are large enough for the naked eye. For instance, Wood [27] proposed that the microcracks at the free surface are formed as a simple geometric result of back-and-forth movements within broad slip bands. Based on elementary mechanical movement of the atoms, Cottrell and Hull [28] suggested a formation model of intrusions and extrusions at the free surface. This concept contains two slip bands that cross one other and cause incursions and extrusions to occur during tension and compression cycles. Cross slip promotes the production of extrusions. Despite this, no intrusion or extrusion occurs; fissures form as a result of surface imperfections induced by slip bands. Within these bands, microcracks occur, which are referred to as “persistent”. Slip bands are not the only places where cracks form. Within some precipitation-strengthened alloys, narrow and internal slip bands appear concurrently with precipitate dissolution. Furthermore, even when deformation bands occur, cracks can originate at grain boundaries [29]. The dislocation mechanics involved in the creation of slip bands have a significant impact on the material’s fatigue response. The dislocation reaction cycles leading to failure are sensitive to temperature, stacking fault energy, slip type, and applied strain amplitude [30,31,32,33,34]. The shape of the inclusions, as well as their number, size, type, and distribution in relation to the direction of loading, all have a role in crack development. The cohesion of the matrix-inclusion border is another critical factor. Slip bands, grain boundaries, carbides, inclusion/precipitate cracking, and pore development are all areas where fatigue fractures can begin in nickel-base superalloys [35,36,37,38,39,40].
Outside of the slip bands, cracks can also start. Some alloys that have been strengthened by precipitation break down the precipitates and form narrow, internal slip bands. Even if there isn’t much deformation, cracks can still start at the edges of the grains. Most cracks start in places where there are inclusions. This is because the inclusions increase the amount of stress or because the particles themselves can break [29,41]. The cyclic slide causes the formation and progression of fatigue cracks. The term “plastic deformation” in this context refers to ”displacement activities” that occur in cyclic patterns. The yield stress is the tension that cannot cause exhaustion. Due to the low stress, just a few grains in the material experience plastic deformation. Because of the lower slip limitation, this microplasticity appears most frequently in grains near the material’s surface. The surrounding substance is only present on one side of a material’s free surface. Because surface grains are less constrained by the grains around them, plastic deformation can occur at a lower stress level than subsurface grains [42].
Grain boundaries are other preferred locations for the start of fatigue cracks. Kim and Laird [42,43] investigated the formation of fatigue cracks in high angle grain boundaries in copper polycrystals. They deduced from interferometric measurements that cyclic loading causes steps at grain borders, and the stress concentration created at this step is the source of grain boundary fatigue fracture start. Figueroa and Laird [44] studied cycled polycrystalline copper with a large grain size (400 μm) and used a plastic copy to observe surface evolution in constant amplitude loading, low-high testing, and high-low tests. They concluded that fracture initiation is directly connected to the localization of plastic deformation. The degree of slip activity in neighbor grains was directly connected to the intergranular fracture initiation in the high amplitude zone. The propagating cracks in the low amplitude region were initiated by the persistent slip bands (PSBs) via the impingement process. The effect of grain size on the kind of fatigue crack formation in polycrystalline copper was examined by Liang and Laird [45]. They discovered that in coarse-grained material, intergranular initiation is favored, whereas in fine-grained material, fatigue cracks are typically initiated intragranular from persistent slip markings (PSMs). The mechanism of the fatigue crack initiation at grain boundaries was suggested by Tanaka and Mura [46,47]. The grain boundary crack could be initiated by the stacked pileups of vacancy dipoles oriented normal to the grain boundary, creating high local stress. A similar approach was adopted by Mughrabi et al. [47,48]. They took advantage of the model of PSBs from [49] and proposed that static extrusions in the grain produce super dislocations in PSB/matrix interface and these pile-up against the grain boundary. The resulting stress can cause the initiation of brittle-type PSB-GB cracks. Christ et al. [49,50] proposed an expression for the critical stress that can induce the grain boundary cracking due to pile-up of the interface dislocations related to the saturated concentration of static vacancies in the PSBs. The idea of dislocation pileups and brittle fracture appearance of incipient cracks due to high local stress was followed in a number of theoretical and experimental papers [50,51,52]. Figure 2 illustrates the formation of slip bands under cyclic stress, which leads to fracture initiation. Inclusions are usually the sites where crack initiation occurs, due to the stress concentrations they bring or the cleavages occurring within these particles.
A recent study of the effect of extrusions and intrusions in neighboring grains on the appearance of the high-angle grain boundary (HAGB) crack in fatigued Sanicro 25 austenitic steel found that high-angle extrusions and intrusions cause damage to the grain boundary. The authors showed that when extrusions and intrusions happen at the same time, they weaken the bonds between grains. The HAGB crack happens when local breaks connect with each other. Since cyclic slip cannot cross the grain boundary, a new mechanism for grain boundary cracking has been proposed that is based on the interaction of PSMs (extrusions and intrusions) that form at the grain boundary [53]. It is now widely accepted that dislocations play an important role in the initiation and propagation of crack in metallic materials. Crack can easily originate at the thin persistent slip bands (PSBs) that form soon before crack initiation.
Experts claim that the initiation of fatigue cracks commonly occurs at or around singularities on or near the surface of metals. Inclusions, embrittled grain boundaries, sharp scratches, pits, or slide bands are examples of these defects. However, subsurface nucleation has been observed in metals with strongly adhering surface oxides, which delay fracture initiation at the outer surface. The study reported in [28,54] proposed a formation model of intrusions and extrusions at the free surface, based on elementary mechanical movement of the atoms. In order for a fatigue crack to start, the self-strain energy of dislocation dipoles in the damaged region of the material must reach a threshold value.
Based on the applied stress, the size of the inclusion, the geometry of the slip band, and the shear moduli of the inclusion and matrix, precise calculations are established for the crack initiation criteria. The present theoretical conclusions correlate well with the available experimental data for all cases where a fatigue crack initiated at an inclusion. To summarize, many investigators mentioned how early in the fatigue cycle they could observe microcracks. Since then, it has become clear that the fatigue life under cyclic loading was divided into two phases: (1) the crack initiation life and (2) the crack growth period until failure. Crack nucleation, micro crack growth, macro crack growth, and finally final failure follow cyclic slip as illustrated in a block diagram in Figure 3 [55,56].

Microstructural Mechanisms of Fatigue Crack Initiation

The initiation of fatigue cracks is one of the most crucial phases in fatigue fracture processes. A vast number of metallographic observations have been made in order to understand the micro mechanisms that cause crack initiation. The location of crack initiation differs based on the microstructures of the material and the types of applied stresses. Under low strain cycling, the slip band is the preferred site of crack initiation for pure, single-phase metals and some polyphase metals. The cyclic strain is centered along the slip band, and it is accompanied by extrusion or intrusion. When the crack length is short, factors related to the microstructure are very important, but when the crack length is about the same as a couple of grains, stress becomes the most important factor. This causes the crack to move from crystallographic stage I to Mode I [46,57,58,59].
The place where cracks start depends on many things, such as the microstructure and the type of stress that is acting on the material. For high temperature low cycle fatigue (HTLCF) of hierarchical microstructures, the problem is especially hard because the microstructure changes and damage builds up at the same time because of the temperature [60]. In the cooling systems of nuclear power plants, the plastic strain range caused by thermal fatigue matches a high-cycle fatigue (HCF) regime, which is characterized by a large spread in the number of cycles to failure. Two different ways (i) Mura’s fatigue crack initiation criterion and (ii) Déprés’s fatigue crack initiation criterion for cracks to start are used to study this scatter [61]. The thermally activated mode and the athermal mode are the two different ways fatigue crack initiation occurs in a BCC ferrite grain. The boundary between these two regimes is very sensitive to changes in temperature and strain rate. Under normal low-frequency tension-compression loading, the strain rate for high-cycle fatigue of DP600 steel is much lower than the transition strain rate over the entire stress amplitude range. Therefore, it is predicted that the deformation will take place in the athermal region, where slip bands in ferrite grains will be formed, causing a local stress and strain concentration that would initiate trans-granular cracks and, eventually, surface failure [62].
Deformation at different length scales, as well as its interplay with deformation near heterogeneous interfaces like grain boundaries, is typically crucial to the performance of engineered alloys. Features at the micrometer length scale are often crucial, such as for microstructurally sensitive processes involved in fracture nucleation. This degree of detail is required to anticipate component performance [62]. Figure 4 shows the characteristic by using of scanning electron microscopy (SEM) micrographs of the area, and the results of the high-angular resolution electron backscatter diffraction technique (HR-EBSD) study show that changes in surface topography are microstructurally sensitive due to the evolution of surface slip and shear along the twin boundaries (revealing a stepped morphology with a frequency related to the twin structure), and that these features are observed after only two cycles. After 20 cycles, the inclusion developed a tiny crack that propagated deeper into the matrix. Greater than eight-grain splits shape-formed after 5200 iterations [63].
Study reported in [64] showed a typical series of cyclic deformation events in ductile metals and alloys. In cyclic saturation, a distinct dislocation structure has formed in the bulk, and a pattern of slip traces or PSBs of highly localized slip is seen at the surface. The most thoroughly researched instance of fatigue damage. Nonetheless, this is not the most common kind of fatigue degradation in commercial materials, where appropriate alloying procedures effectively limit chronic slide.

5. Prediction of Fatigue Crack Initiation

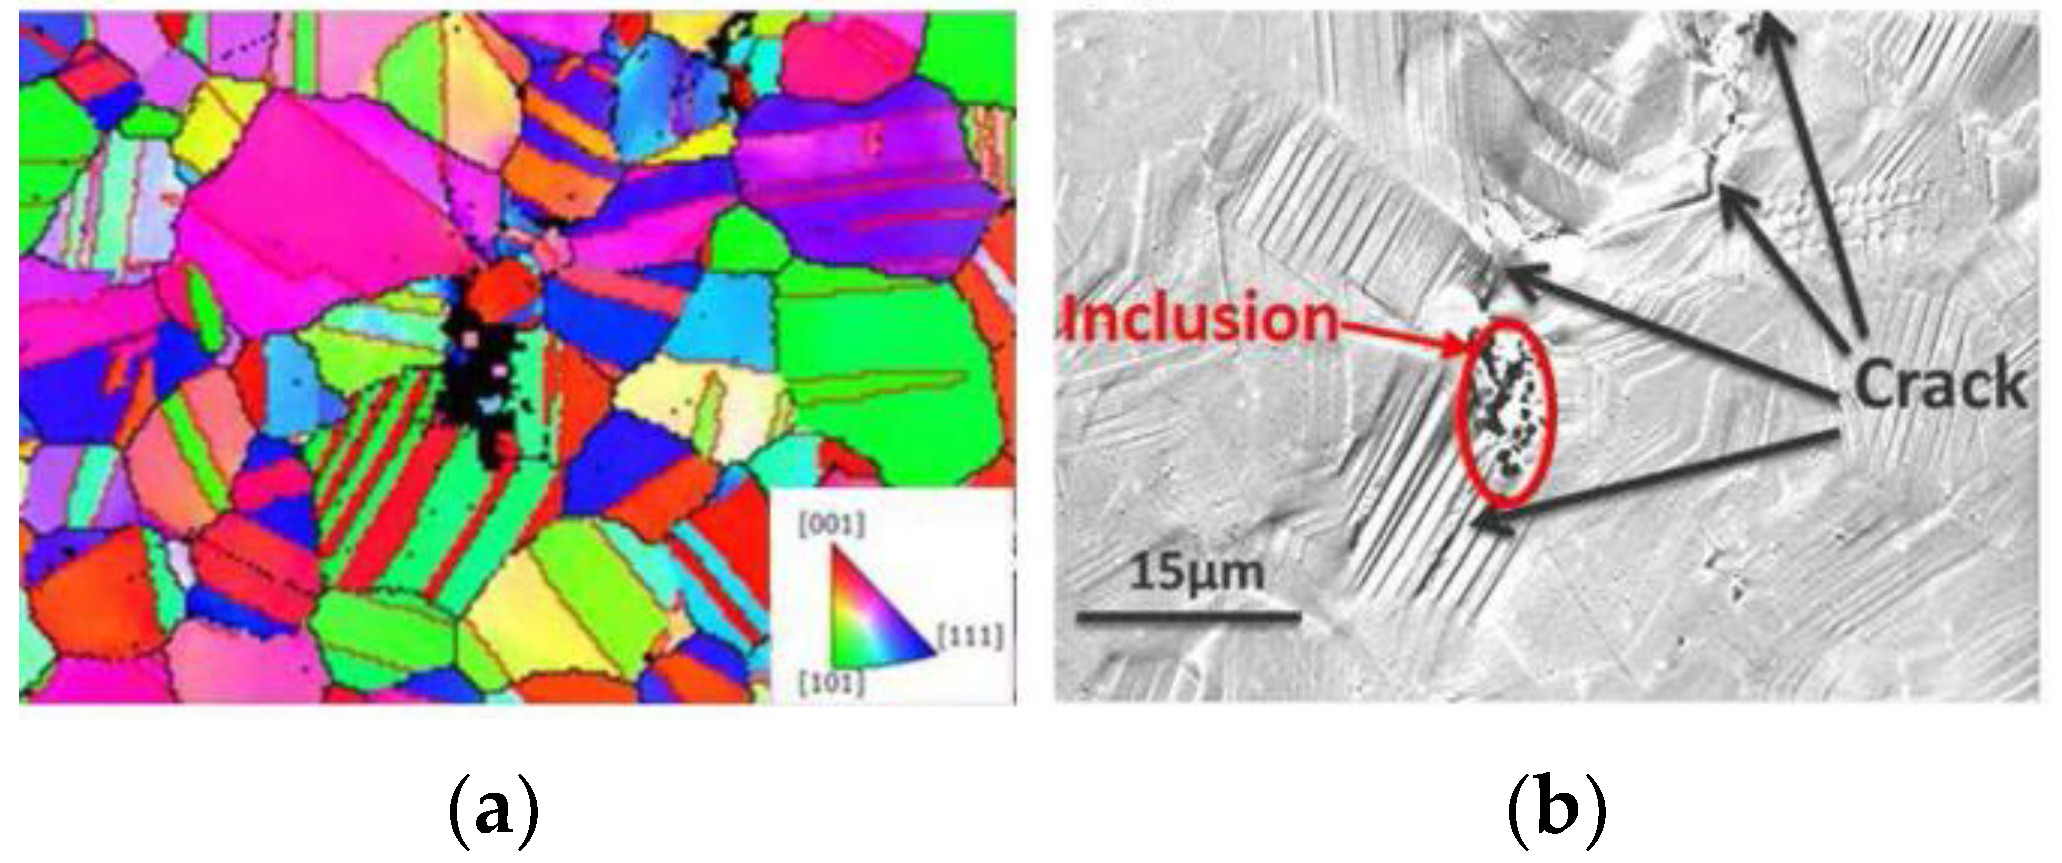
5.1. Modified Tanaka Mura Model

Tanaka and Mura [46] presented a micromechanical fatigue nucleation model in which dislocations build up irreversibly on the slip band of grains. This leads to an energy-based crack initiation criterion. The most difficult thing to do here is to change the Tanaka-Mura model so that it can be used to study the cyclic softening of 9Cr steels [65]. Tanaka-energy-based Mura’s approach is better for this type of cyclically induced microstructure and dislocation evolution than stress-based approaches, which are more commonly used. Figure 5a shows the dislocation motion in a grain of size 2a that is well-aligned, while Figure 5b shows the assumed mechanistic basis for fatigue persistent slip bands that correspond to packet size in the P91 microstructure. Mura’s fatigue crack initiation criterion depends on a balance of energy [65]. When the energy stored in a grain is big enough to make new surfaces, cracks appear. The length of a crack that has started is thought to be about the size of a grain (50 μm). Surface grains with a certain crystalline orientation, or the highest Schmid’s factor, are where cracks start. i.e., exhibiting the highest Schmids factor given as f = τp/σ, where τp is the resolved shear stress on the favorable slip system and σ is the macroscopic stress. The predicted number of cycles to fatigue crack initiation Ni on the slip system that is activated above to and subjected to a resolved shear stress [60,66,67].
N i = C μ γ s ϕ p 2 ( 1 v ) 2 1 ( max ( | τ i | ) τ o ) 2 = A 1 ( τ p τ o ) 2
where μ is the shear modulus, ν is the Poisson ratio, γs is the free surface energy, ϕ is the grain diameter and p is an irreversibility factor.
Tanaka and Mura [46] examined the dislocation’s energy balance structure along persistent slip bands (PSB) for crack initiation prediction. A closed-form solution was developed for the number of cycles to fatigue crack imitation (FCI) in a PSB, which was represented in Coffin-Manson form and demonstrated an inverse grain size effect. Chan [68] extended the Tanaka and Mura model to account for the start of cracks along slip bands and inclusions. and notches, then expanded this to incorporate crack size and same microstructural characteristics. Wu [69] revisited the Tanaka Mura experiment model and a new fatigue crack based on the true strain definition expression of nucleation life was obtained and confirmed against limited experimental evidence on a few of materials. According to the Tanaka-Mura model, after N cycles, if the stored strain energy due to dislocation accumulation equals a critical value of surface energy, the layers of dislocation dipoles change into a free surface, i.e., a micro-crack. The number of cycles when the following energy requirement is satisfied defines the life to crack initiation Ni is given by Equation (2) [60]:
Δ τ = Δ σ M , Δ γ = Δ ε p l M , Δ U = Δ ( Δ τ 2 k f ) 2 , U 2 d p w s
where ∆τ is the shear stress range, ∆σ is the stress range (σmax − σmin), ∆γ is the plastic shear strain range, ∆εpl is the plastic strain range (∆εpl = ∆εplmax − ∆εplmin) and M is a Taylor orientation factor, U is the stored strain energy, dp is the packet size, kf is frictional shear stress and ws is the specific fracture energy per unit area. The key adaptation to the Tanaka-Mura equations here is the use of a combined shear stress-strain ∆U expression within a cumulative computation of U to capture the cyclically evolving response, due to microstructure evolution effects (e.g., lath coarsening, dislocation annihilation) [60]. In a second paper [69], the same authors modeled how fatigue cracks start. They divided cracks into three types based on where they started:
(i)
cracks start from inclusions (type A),
(ii)
inclusions crack when slip bands hit them (type B), and
(iii)
a slip band crack starts from an inclusion that hasn’t cracked (type C).
Type A crack initiation due to a fully deboned inclusion was analyzed in the same way as void initiation (notch). Type B cracks are initiated at the matrix-particle interface when slip bands impinge on the particles, but only the particles whose size is lower than the slip band width. When the self-strain energy of the dislocation dipoles reaches a critical threshold, the fatigue crack forms. The collection of dislocation dipoles during fracture initiation along a slip band is given by Equation (3).
( Δ τ 2 K ) 1 / 2 = [ 8 μ W s π d ] 1 / 2
where Ws is the specific fracture energy per unit area along the slip band, K is the friction stress of dislocation, μ is the shear modulus, ∆τ is the shear stress range, and d is the grain size. They considered the dislocation pile-up problem for type C under the stress distribution in a homogeneous, infinite plane as a rough approximation. It was reported that high-strength steels have mechanisms of type A, while high-strength aluminum alloys have mechanisms of types B and C. Tanaka and Mura [46] developed quantitative links between the parameters of matrices and inclusions, as well as the size of inclusions, and the decrease in fatigue strength at a given crack initiation life and the decrease in crack initiation life at a given constant range of the applied stress.
Mura and Nakasone [70] built on Dang-work Van’s to calculate the Gibbs free energy change for fatigue crack nucleation from stacked dislocation dipoles. Chan [68] proposed an extension of this theory based on the idea that only a small number of the dislocations in the slip band cause the crack to start. Taking into account the minimum strain energy accumulation within slip bands, Venkataraman et al. [71,72] generalized the dislocation dipole model and made a stress-initiation life relation that predicted a grain-size dependence, which is given by Equation (4) and was different from the Tanaka and Mura theory.
( Δ τ 2 k ) i α = 0.37 ( μ d e h ) ( γ s μ d ) 1 / 2
where γs is the surface energy term and e is the slip irreversibility factor, this highlighted the need to incorporate key parameters like crack and microstructural size, to get more accurate microstructure-based fatigue crack initiation models. Chan and colleagues developed and validated additional microstructure-based fatigue crack growth models.
Recent work by Harvey et al. [73] proposes that load cycling may lead to the beginning of fatigue cracks through the deepening of slip steps into a fatigue crack. By utilizing atomic-force microscopy, slip-height displacements on the order of nanometers were measured. The cumulative slip-height displacement was supposed to surpass a threshold crack-opening displacement when fatigue-crack initiation occurred. This technique states that the large-crack fatigue-crack-growth threshold (∆Kth) determines the number of cycles to fatigue crack initiation and given by Equation (5).
N i = Δ K t h 2 4 σ y s E f Δ ε p h s
where E is the young modulus, σys is the yield stress, ∆εp is the plastic-strain range, f is the fraction of plastic strain range that produces the surface displacement, and hs is the slip spacing.
However, the review found that few of the currently available fatigue crack initiation models take microstructural-size considerations into account. None of the current models for how fatigue cracks start take into account what happens when temperatures are high. As a result, none of the crack-initiation models can forecast the size of a fatigue crack at the time of initiation, in addition to the effects of high temperature. There is no difference between the crack-initiation and crack-growth processes in models based on the random irreversible slip process [68,73,74], there is no much difference between how cracks start and how they grow, since both involve the surface-slip steps getting deeper. In these models, fatigue cracks start out small and get longer as more fatigue loads are put on the material. Crack-detection methods are getting better, and they can now find cracks as small as 100 μm or less. Cracks in this range are hard to find, and it may not be possible or practical to measure them. However, atomic-force microscopy makes it possible to measure cracks in this range. Most structural alloys don’t know what size the crack will be when it starts, and no way has been found to predict when it will start. So, there is a need for both a quantitative definition of how a crack starts and a method that can predict how many cycles it will take for a crack of a certain size to start [73].

5.2. Acoustic Second Harmonic Generation

Using the Monte Carlo approach and an appropriate damage evolution equation, we can determine the likelihood of a macrocrack forming during fatigue. In fact, when a single-frequency wave is transmitted through the specimen, the nonlinearity of the material causes distortion, which in turn produces higher-level harmonics whose amplitudes grow in proportion to the nonlinearity [73]. This means that the accumulated damage and the nonlinearity of the material may be described by the ratio A2/A1, where A2 is the amplitude of the second harmonic and A1 is the amplitude of the fundamental. Damage progression should result in a rise in the ratio. This characterization of A2/A1 acoustic nonlinearity is distinct from the one provided by [75,76]. A1 (fr) is the amplitude measured when a signal is transmitted at frequency fr, and A2 (fr/2) is the amplitude recorded when the signal is received at frequency fr/2. This technique’s improved precision can be attributed to the simultaneous monitoring of both signals. It can be seen in Figure 6 that the ratio of A2 (fr/2) to A1 (fr) rises nearly monotonically, with a clear peak at the location where the macrocrack first appears. This finding provides support for the idea that monitoring the ratio A2/A1 during fatigue tests can provide information about the level of damage present in a specimen.
Damage condition in a sample at a given fatigue cycle is denoted by the scalar function D(N), as demonstrated by Kulkarni et al. [77] using the model of Ogi et al. [75]. There is no damage when D = 0, and the first macrocrack appears at D = 1. Equation (6) describes the development of damage as a function of the cycle count:
d D d N = 1 N c ( Δ σ / 2 r c ( σ ) Δ σ / 2 ) 1 ( 1 D ) n
When ∆σ/2 is higher than the endurance limit rc( σ ¯ ), otherwise the rate dD/dN equals zero.

5.3. Probability of Crack Initiation on Defects

The probability Px of a fatigue life of less than x cycles was calculated by Melander and Larsson [78] using the Poisson statistics. It is possible to write Px without including the possibility of fatigue fracture nucleation at inclusions by using the formula which is given by Equation (7).
P x = 1 e ( λ x )
where λx is the number of inclusions per unit volume. Therefore, Equation (7) shows the probability to find at least one inclusion in a unity volume that would lead to fatigue life not higher than x cycles. Similar methods were used by de Bussac and Lautridou [79] to determine the probability of fatigue failure, P given a defect of size D in a volume near the surface, the authors assumed that the probability of fatigue crack initiation was the same as when meeting a discontinuity of the same dimension which is expressed by using Equation (8).
P = 1 e ( N v D )
For some defect density Nv, where D is the defect’s diameter in microns. An identical crack initiation power is assumed for flaws of varying sizes [78,79] as was the case in the model established by Melander and Larsson [78]. To account for the fact that fatigue fracture initiation can occur both at the surface and within a material. Bussac [80] defined the likelihood of finding discontinuities of a particular size at the surface or subsurface. Given a number of load cycles N0, the probability of survival P is obtained by multiplying the probabilities of surface and subsurface failures as stated in Equation (9)
P = [ 1 p s ( D s ) ] [ 1 p v ( D v ) ]
where Ds and Dv are the diameters of the discontinuities in surface and subsurface leading to No load life. ps(Ds) and pv(Dv) are the probabilities of finding a defect larger than Ds and Dv at surface and subsurface, respectively. It must be stressed that this model does not rely on the type of discontinuity but only on its size [80]. Manonukul and Dunne [81] investigated the start of fatigue cracks in polycrystalline metals, taking into account the peculiarities of HCF and LCF. The proposed method for predicting the onset of fatigue crack is based on the critical accumulated slip feature of a material; the key assumption is that when the microstructure reaches the critical slip, crack initiation should have occurred. Crystal plasticity was used to simulate a typical region (about 60 grains) of the nickel-based alloy C263 in a finite-element model created by the authors and only two material properties were taken into account: (i) the shape of the grains and (ii) the way the crystals are arranged. Makkonen [82,83] conducted extensive research on the influence of initial specimen circumstances on fatigue life, focusing on the effects of specimen size and notch size in the case of steel as the testing material. Probability of fracture initiation and propagation from an inclusion depends on its size and form as well as the size of the specimen, since it is more likely to discover a large inclusion in a large component than in a small specimen.

6. Methods of Life Prediction Crack Initiation under Variable Amplitude Loading

Constant-amplitude (CA) fatigue loading is cyclic loading with constant amplitude and constant mean load. Nevertheless, it was well recognized that certain structures in service, such as those in airplanes and pressurized vessel reactors, are subjected to variable amplitude (VA) loading, which can have a quite complex load-time history. The fatigue behavior of metallic materials under variable amplitude loading has been the subject of numerous publications over the past few decades [84,85,86,87,88]. Several of them focus on the modeling of representative load histories of specified random loading procedures. Others examined the influence of overloads and their distribution throughout the crack propagation life’s load history. In addition, numerous studies propose numerical or analytical methods to simulate the propagation of cracks under this sort of loading [89]. All of these proposed damage accumulation criteria, however, are intentional in nature. Consequently, fatigue behavior under variable amplitude loading remains an unanswered question, and the prediction of fatigue life under variable amplitude loading is significantly more complex than under constant amplitude loading.
In an initially defect-free component, the crack start period can account for a large amount of its entire fatigue life. The initiation phase is widely thought to consist of the nucleation and formation of short cracks; however, the crack length threshold at which initiation occurs is not well defined. Furthermore, present approaches for anticipating fatigue damage progression typically require an existing fault (e.g., Paris law [90]) and may be difficult to apply during the start phase. The total fatigue life, NT, of an initially defect-free structure can be written as the sum which is stated by Equation (10) [88].
N T = N i + N p
where Ni is the time it takes for the crack to start, and NP is the time it takes for the crack to propagate, which includes both the stable and fast stages of crack growth.
In many loading situations, like high-cycle fatigue, the time it takes for a crack to start is the most important factor in figuring out how long a structure will last. In a new material, the initiation phase of fatigue life is often thought to be the growth of short cracks up to the size ath, which is the length where short cracks change into long cracks. Usually, the crack initiation stage is associated with an arbitrary specified crack length. The crack length ranging from grain diameter to about 50–100 μm is used, depending on the material and physical scale of interest [91,92].
Mechanical components fatigue under service loading is a stochastic process. Despite significant improvement in recent decades, life prediction and reliability evaluation remain difficult problems. Study reported by Yao et al. [15] provides a full overview of early advances. In comparison to fatigue under constant amplitude loading, fatigue modeling under variable amplitude loading becomes more complex, both deterministically and probabilistically. Because the commonly used linear Palmgren-Miner’s rule may not be sufficient to represent the physics an exact deterministic damage accumulation rule is necessary first. Second, an adequate uncertainty modeling technique is necessary to account for stochasticity in both material properties and external loadings, with the input variables’ randomness and covariance structures appropriately represented [16,93]. If a component is subjected to a cyclic load with constant amplitude and mean value over all cycles, the fatigue fracture start life of the component can be simply predicted using an S-N curve, as illustrated in Figure 7. In practice, however, this is uncommon. There is usually some variance in both the amplitude and the mean value.
Fatigue damage increases with the number of loading cycles applied in both constant and changing loading. However, the features of damage accumulation vary depending on the loading. For example, bridges are used by vehicles, buses, and lorries, each with a different weight, subjecting the structure to varying degrees of stress. As a result, a strategy for forecasting fatigue life under varied amplitude loading is required. Researchers have been attempting to identify the optimal rule to characterize the fatigue damage accumulation behavior for over eighty years. The linear damage accumulation rule (LDR), also known as Palmgren-Miner’s rule, is arguably the most often utilized fatigue damage accumulation rule. Miner [94] defined the accumulation of fatigue damage under varying loadings. Assume that a component is subjected to a variety of loading blocks i, each of which has ni cycles of stress amplitude σi(ni = 1 is allowed). A SN curve reveals that the constant amplitude fatigue life at stress range is ∆σi = 2σi. The Swedish engineer Palmgren proposed in 1924 that fatigue life may be predicted based on the condition as stated by Equation (11) [94].
D = i = 1 k n i N i
where D is the fatigue damage of the material, ni is the number of applied loading cycles corresponding to the ith, load level, Ni is the number of cycles to failure at the ith load level, from constant amplitude experiments. when the sum of the cycle ratios ni/Ni reaches unity when the sum of the cycle ratios ni/Ni reaches unity. This criterion was also proposed by the American Miner in 1945 [94] and is currently known as the Palmgren-Miner’s rule, or the linear damage hypothesis (see Figure 7). In the method by Yang and Fatemi [95], some are based on mapping the damage below the S-N curve, while others involve mathematical expressions with limited physical and conceptual explanation. The models based on physical measurement of fatigue damage have not been shown to be superior or simpler to implement than the others. The majority of models include one or more experimental fitting parameters, which may or may not be material properties dependent [95].
The double linear damage rule, first suggested by Manson, is an intriguing alternative to the Palmgren-Miner’s rule [96]. Even for small test specimens, he argued that the crack initiation and crack propagation phases may be treated individually using a linear damage rule. This simplifies the algorithm while retaining the load sequence effect. Manson, Freche, and Ensign [96] conducted a comprehensive program of two-stress level fatigue tests, observing that the double linear damage rule accurately predicted fatigue life. The fatigue limit is a value of the stress amplitude that acts as a limit. Stress levels below this level don’t cause failure, while stress levels above the fatigue limit cause cracks to start and the crack propagate until it is broken. By comparing the fatigue limits of a structure to the fatigue limits of simple, unnotched specimens, one could use logic to predict the fatigue limit. However, one must be aware of the notch effect, size effect, surface effect, and other problems caused by environmental influences.
  • Stress-based approach (SN curve approach)
The stress-based technique was the first, and it is still the most often used method for predicting fatigue life. Th fatigue life (number of cycles N) is related to the applied stress range (∆σ or S) or the stress amplitude (σa). In general, a plot of a metal’s fatigue life vs. real stress amplitude yields a Basquin curve, which is given by Equation (12) [97].
Δ S 2 = σ f ( 2 N f ) b
where f = intercept at 1 reversal (if the fatigue data were obtained from a strain-controlled test, this would be the fatigue strength coefficient), 2Nf = reversal to failure, b = slope of S = 2Nf (if the stress life data was notched obtained from a strain-controlled test, this would be fatigue strength exponent). There are two forms of stress concentration in a component or structure. The first is due to a change in structural geometry or a discontinuity, while the second is related to welding. Stress-based techniques are further classified as nominal stress approaches, hot-spot stress approaches, and notch stress approaches, depending on how the stress concentration impact is accounted for. Currently, the hotspot stress technique seems to be the most popular among ship classification groups [1,96,98].
B.
Strain based approach for variable amplitude loading
The crucial point in most practical situations of fatigue design will be a notch in which plastic stresses are applied by surrounding elastic material. As a result, the situation will be strain-controlled, with a total strain range made up of an elastic and a plastic component. Manson and Hirschberg [19,99,100] proposed that a metal’s resistance to total-strain cycling can be considered as a superposition of its elastic and plastic strain resistance which is given by Equation (13).
Δ ε T 2 = ( σ f 2 ) ( 2 N f ) b + ε f ( 2 N f ) c
The Manson-Coffin relationship is given by Equation (13) has a significant curve fit ability for general low-cycle and high-cycle fatigue, but it requires five material parameters to be determined. Manson [101] has further reduced the equation with his approach to universal slopes which is given by Equation (14).
Δ ε = 3.5 S u E ( N ) 0.1 ε + ε f 0.6 ( N ) 0.6
where Su, E, and εf are all obtained from a monotonic tensile test. He assumed that the two exponents are fixed for all materials, and that only Su, E, and εf control the fatigue behavior. Muralidharan and Manson [102] later changed the above equation and proposed Equation (15).
Δ ε = 0.0266 D 0.115 [ S u E ] 0.53 N f 0.56 + 1.17 [ S u E ] 0.832 N f 0.09
where Su is the ultimate strength of the material, D is the ductility of the metal, E is the modulus of elasticity, and Nf is the fatigue life. A good correlation between the fatigue life predicted by this equation and the fatigue test data has been found [102]. Fatigue damage is then calculated for each cycle in the loading history and summed using Miner’s rule.
C.
Continuum damage mechanics approaches
Fatigue damage rises with the number of loading cycles performed in both constant and variable loading. However, the features of damage buildup vary depending on the loading. Researchers have been attempting to identify the optimal rule to characterize the fatigue damage buildup behavior for over eighty years [15,91]. Continuum damage mechanics (CDM) is a subfield of engineering mechanics that investigates the mechanical behavior of deteriorating materials on a continuum scale. Kachanov [103] highlighted this topic’s general ideas and fundamental elements. Chaboche and Lesne [104] were the first to use CDM to forecast fatigue life. They hypothesized that for the one-dimensional example, fatigue damage development per cycle may be generalized as a function of load situation and damage state. By evaluating changes in tensile load-carrying capacity and using the effective stress idea, they developed a nonlinear damage development equation as stated in Equation (16):
D = 1 [ 1 r 1 / ( 1 α ) ] 1 / ( 1 + β )
where α is a function of the stress state, r is the damage state, and β is a material constant. The models of this damage development is very nonlinear, and it may account for the mean stress effect. As a result, it is known as a nonlinear continuous damage (NLCD) model. Chaboche and Lesne [104] explain the key characteristics, benefits, and shortcomings of the NLCD model. Many different types of fatigue damage equations have been devised based on the CDM principle, as stated by Fatemi and Yang [16]. In both forms and nature, all of this CDM-based techniques are quite similar to the Chaboche and Lesne NLCD model. The key distinctions are in the number and the properties of the model’s parameters, the need for more trials, and their applicability.
Damage evolution is thought to be a process of degradation that can’t be stopped. During the process of damage building up, energy will be released and a new fracture surface will be made. Based on the analysis above, the following formula is used to describe the progression of fatigue damage [105]:
d D = ( 1 D ) p [ σ max σ M ( σ ) ( 1 D ) ] β d N
where σmax is the maximum cycle stress; σ ¯ is the average cycle stress; β and M are the material constants. Based on the damage theory and the closed-form solution, the damage evolution equation not only takes into account the loading conditions and material properties, but it also looks the shape of the notch specimen. Generally, the methodologies that may be used in fatigue crack initiation assessments are divided into two broad categories [12,105]:
  • Defect-tolerant techniques and
  • Total-life approaches.
The doctrine for one of the defect-tolerant methods is to depend on the resistance to crack development in naturally cracked materials with tiny fractures in the surface. However, there are some drawbacks to these approaches.
  • It is difficult to establish material parameters and crack growth data for mechanically small cracks through tests.
  • The results are sensitive to the initial crack and defect sizes chosen; and.
  • It has been difficult to establish approaches that are applicable for engineering calculations.
These drawbacks are particularly valid for elastic-plastic conditions. Total-life techniques are designed to evaluate fatigue fracture initiation resistance based on ostensibly defect-free materials and components. These methodologies, which are separated into stress- and strain-based approaches, try to analyze the overall fatigue life to failure (initiation). In general, Table 1 summarizes, analysis types with advantages and limitations of all of the methods, along with their benefits and drawbacks.

7. Experimental Methods for Prediction Fatigue Crack Initiation

Estimating fatigue damage in engineering materials subjected to multiaxial fatigue loading is a problem that is as complex as it is important to solve because, in practical situations, mechanical components experience stress and strain states that are not only multiaxial, but also vary randomly. And various experiments are carried out using various methods, among them Fang, et al. [106] compared the two different approaches to fatigue crack initiation simulation on ferrite pearlite steel. According to the experimental results, almost all cracks initiated before 3000 cycles, which is approximately 15% of the whole life and is called stage I; the rest of the fatigue life is not discussed in this work. According to the work of Cheong, et al. [106] that was replicated, fatigue cracking became apparent after 5 × 10⁵ cycles, at which point the test was discontinued. The creation of slip lines and bands, as well as the early commencement and growth of cracks, can be seen very clearly in the digital image correlation (DIC) optical images stated in reference [107], which shows the same location under low and high magnifications. These fractures are typical of Stage I fatigue cracking, with their initiation occurring at grain boundaries, triple junctions, and slip bands [12]. It was noted quite frequently that crack growth occurred along slip bands, which served to highlight the crystallographic structure of the bands. It was also found that crack propagation was confined to within grain borders and that it stopped once an opposite grain boundary was reached. Materials science and engineering’s main goal is to help people understand how flaws and microstructure affect performance. Cheong, et al. [107] focused on the strength and failure of building materials, where grains play a key role. Crystal plasticity describes how grains change shape, and it can be defined both experimentally and numerically.
To solve many important industrial problems, like how fatigue cracks start, needed to know how the microstructure of engineering alloys changes over time [23,106,108]. In engineering structures, cracks initiated and grow as a result of fatigue. For instance figuring out how long a military gas turbine will last take into account both how cracks initiate and how far they propagate. Usually, a gas turbine part that works in a high temperature environment is made to have: (1) a minimum LCF crack-initiation life longer than the total specified service life, and (2) assume a crack propagation life, based on a first examination, that is equal to twice the number of service cycles. Cowles [68] says that the current systems for predicting life expectancy are expensive to set up and keep up because they need large experimental databases. Current life-prediction systems could be made better with better crack-initiation-life models, a probabilistic way to deal with the fact that crack-initiation-life can vary, and a better ability to analyze local notches. One problem with the crack-initiation-life models we have know is that they can’t tell us how big the crack will be when it starts. So, when figuring out how long a crack will grow, you have to make an assumption about how big it was at first [68]. The study reported in [109] proposes a probabilistic-based technique for damage evaluation of ductile cast irons (DCIs). Acoustic emission (AEs) experiments were conducted on pearlitic DCIs exposed to both monotonic and fatigue tensile loads. The information entropy of the AEs data is associated with damage progression and the onset of the first failure. Table 2 shows how different experiments were done and what they found.

8. Effects of Temperature on Crack Initiation

Temperature, according to various researchers, has a significant impact on how fatigue cracks initiate and propagate in ferrite-pearlite steel. Zhu, et al. [113] found that the primary slip system was the dominant mode of deformation for railway wheel steel at low temperatures. This system also showed that the rate of crack formation in railroad wheels goes up dramatically when the temperature drops below a certain threshold. Zhang, et al. [114] discovered that as temperature decreased, the fatigue life of Q420 high-strength steel increased significantly. This may have something to do with the yield strength or tensile strength. Liao and his colleagues [115] found that the rate at which fatigue cracks spread in the weld metal of Q345qD bridge steel depends on both the low temperature and the stress ratio.
Based on these results, it seems likely that the fatigue life would be shorter when the temperature went up. Also, the fatigue ductile-brittle transition (DBT) was shown to be a significant event similar to the ductile-to-brittle fracture transition. However, the fatigue crack growth rate below and beyond the fatigue DBT was very different. Walters et al. [116] showed that as temperature went down, the rate of fatigue crack growth slowed until the fatigue DBT, after which it sped up. Moody et al. [117] found that as the temperature dropped below the DBT threshold, the rate of fatigue crack initiation dramatically. Microstructure, in addition to the type of stress, controls the location of fracture start. Due to the simultaneous occurrence of temperature-induced microstructure growth and fatigue damage buildup, HTLCF of hierarchical microstructures presents a particularly challenging condition [60].
The main impact of micro-defects on crack nucleation at high temperature (HT) was lessened because there were no fine grain clusters at the crack initiation region. Instead, fatigue cracks that started from large granules were preferred. In light of this, the mechanism of crack formation in the very high cyclic fatigue (VHCF) environment was greatly influenced by the increased temperature. The HT initially significantly reduced the impact of tiny defects on crack initiation. As was already mentioned, the microdefects caused stress concentration and served as a precursor to weariness. The crack propagation threshold resulting from these flaws is determined by the stress intensity factor, which characterizes the stress condition close to the tip of a crack or notch [118]. According to reports, as the temperature rises, the stress intensity factor threshold for fatigue fractures also rises as well [119,120,121].
Pre-cracks need more force to progress the crack tip because of the increase in elasticity at HT. Grain boundaries restrict dislocation motion, which makes coarse grains more susceptible to plasticity in the form of slip bands. The critical resolved shear stress (CRSS) actually depends on temperature [117,122,123,124]. The shear slip resistance of the grains decreases as the temperature rises, which further encourages the dislocation motion in coarse grains at HT. Crushed granules accumulate irreversible plasticity far more quickly than fine grains do under cyclic deformation [125]. The goal of study reported [125] was to conduct a thorough examination into the VHCF behavior of the super austenitic stainless steel 654SMO (UNS S32654). The crack start locations of this material were examined using a combination of scanning electron microscopy (SEM) and the focused ion beam (FIB) method. Experimentation is being conducted. The experimental results of crack initiation processes in an austenitic stainless steel (654SMO) in a very high cycle fatigue regime were examined at ambient temperature and 300 °C.
They concluded that: At both room temperature and 300 °C high temperature (HT), the VHCF SN curve of 654SMO showed a gradual decrease. The fatigue strength kept going down as the number of cyclic loads went up. Fine-grain clusters with micropores started to crack from wear and tear when they were at room temperature. Figure 8 shows the ways that fatigue cracks can start in 654SMO. At room temperature, the micro flaws in the fine grain cluster had the most effect on the strength of the VHCF.
Fatigue cracks started right where these tiny holes were and grew into thin strips and small pieces at the fracture surface. So, one way to improve resistance to fatigue cracking could be to reduce or get rid of micro flaws when the material is being made. At HT, the plasticity had a big effect on when the crack started, which meant that coarse grains were more likely to break. In this case, reducing the size of the grains can help improve the strength of VHCF.
Similarly, the study reported in [126] was to investigate the low-cycle fatigue (LCF) and EAC behavior of 316Ti SS in high temperature water. All of the tests were done in a simulation of a boiling water reactor (BWR), whose normal operating temperature is 288 °C. After studying the LCF crack initiation behaviors of 316Ti stainless steel in 561K water, they came to this conclusion. There were three types of Ti-bearing precipitates found in the current 316Ti austenitic stainless steel: isolated TiN or duplex (Al, Mg)O/TiN, Mo-rich (Ti, Mo)C, and Ti (N, C). Temperature was discovered to have a significant influence on fatigue fracture propagation in ferrite-pearlite steel. Zhang et al. [114] observed that the fatigue life for Q420 high-strength steel increased with decreasing temperature, which may be related to yield or tensile strength to some extent. According to Liao et al. [115], both low temperature and stress ratio influence the fatigue fracture propagation rate of Q345QD bridge steel. Based on these findings, fatigue life may be reduced in general as temperature rises. Furthermore, the fatigue ductile-brittle transition (DBT) was demonstrated to be an essential phenomenon, analogous to the ductile-to-brittle fracture transition, with the fatigue crack growth rate being quite different below and above the fatigue DBT. Figure 9 depicts the crack evolution, and the corresponding testing parameters, such as such as Tmin, Tmax, NHCF, are 100 °C, 450 °C and 5 × 10³, respectively. The sample surface is severely oxidized as shown in Figure 9a,c,e as a result of long-term exposure to a high-temperature, oxygen-containing environment. Image processing software is used to extract the profile of a surface microcrack for quantitative analysis, as shown in Figure 9b,d,f. Under the thermal loading provided by pulsed laser, although the equivalent stress is below the yield limit of cast iron, the slip band will occur in the local surface, especially within the laser spot, which is attributed to the inevitable inhomogeneity of the structure or properties [126,127].
Modeling the initiation and propagation of multiple cracks using the finite element method frequently results in severe convergence difficulties due to the contact and stress field singularities caused by the crack tips; thus, the fatigue indicator parameter (FIP) was proposed to circumvent these difficulties. Mcdowell et al. [107] have demonstrated that FIPs are related to grain scale fatigue crack formation and microstructurally small fatigue crack growth and can be used as surrogate measures of the driving force for fatigue crack initiation [128], which means FIPs can predict the fatigue crack initiation position and life. Numerous FIPs have been suggested and utilized in crystal plasticity finite element method (CPFEM) modeling; for example, Dunne et al. [129] accurately predicted persistent slip bands using the accumulated plastic strain as the FIP. Hallberg et al. [130] used a series of simulations to investigate the effect of surface roughness and microstructure heterogeneity on fatigue fracture initiation, as well as two additional modified FIPs to depict the crack initiation position. Each constitutive model should relate to one or more FIPs. Based on earlier research, the study adopts two FIPs to compute crack initiation life and crack density and develops a third, modified FIP.
In the past decade, the crystal plasticity finite element method (CPFEM) has become an effective technique for investigating mesoscale material deformation. Taylor et al. [131,132,133] completed the preliminary examination of the crystal plastic deformation mechanism, while Hill et al. [134,135] provided the mathematical description. Huang [136] claimed that plastic deformation is induced solely by crystallographic dislocation slip, thereby excluding other kinds of plastic deformation. Li et al. [137,138] introduced a new constitutive model for modeling the uniaxial ratcheting of polycrystalline extruded magnesium (Mg) alloys, taking twinning and detwinning mechanisms into account. Since the introduction of the linear damage rule, a huge number of fatigue life prediction models have been proposed. Study reported in [89] introduced the finite element code 2D remeshing procedure in DEFORM combined with the deletion-and-replacement method with the maximum circumferential stress criterion that is used to predict the direction of crack advancement and update the explicit geometric description of evolving cracks. Process factors such as the clearance between the punch and die have an effect on sheared and fractured surface size and form, and it is possible to forecast a variety of elements that impact shearing quality. The extended finite element method (XFEM) is the most prominent computational technique for studying crack issues. The XFEM is capable of introducing arbitrary discontinuities into finite elements and may be used to examine various crack development issues in engineering materials and constructions. Bergara, et al. [139] in their studies simulated and validated a fatigue propagation test of a semielliptical fracture on the side of a rectangular beam exposed to four-point bending. The XFEM in their work was used to calculate SIFs and simulate fracture development using innovative interpolation algorithms. Optical microscopy and growing crack surface heat tinting controlled crack growth in experimental tests utilizing an Instron 8874 biaxial testing equipment. But to take into account environmental effects like high temperature as well as all the different amplitudes during cyclic applications of loading, other parameters related to material properties, requires attention and focus.

9. Conclusions and Outlook

Researchers have been interested in fatigue for a long time. Understanding how fatigue has changed over time is important so that scientists and researchers today can build on this basic knowledge. Material property, structure, loading, and environment are the four categories that contain all the aspects that determine the fatigue life of metal structures. This paper reviews metal fatigue, with an emphasis on the most recent advancements in fatigue life prediction techniques of variable amplitude loading history, and the following conclusions are made:
  • The fatigue crack initiation areas and external factors, particularly those related to structure geometry, manufacturing processes, and interactions between components when they form a whole mechanical system
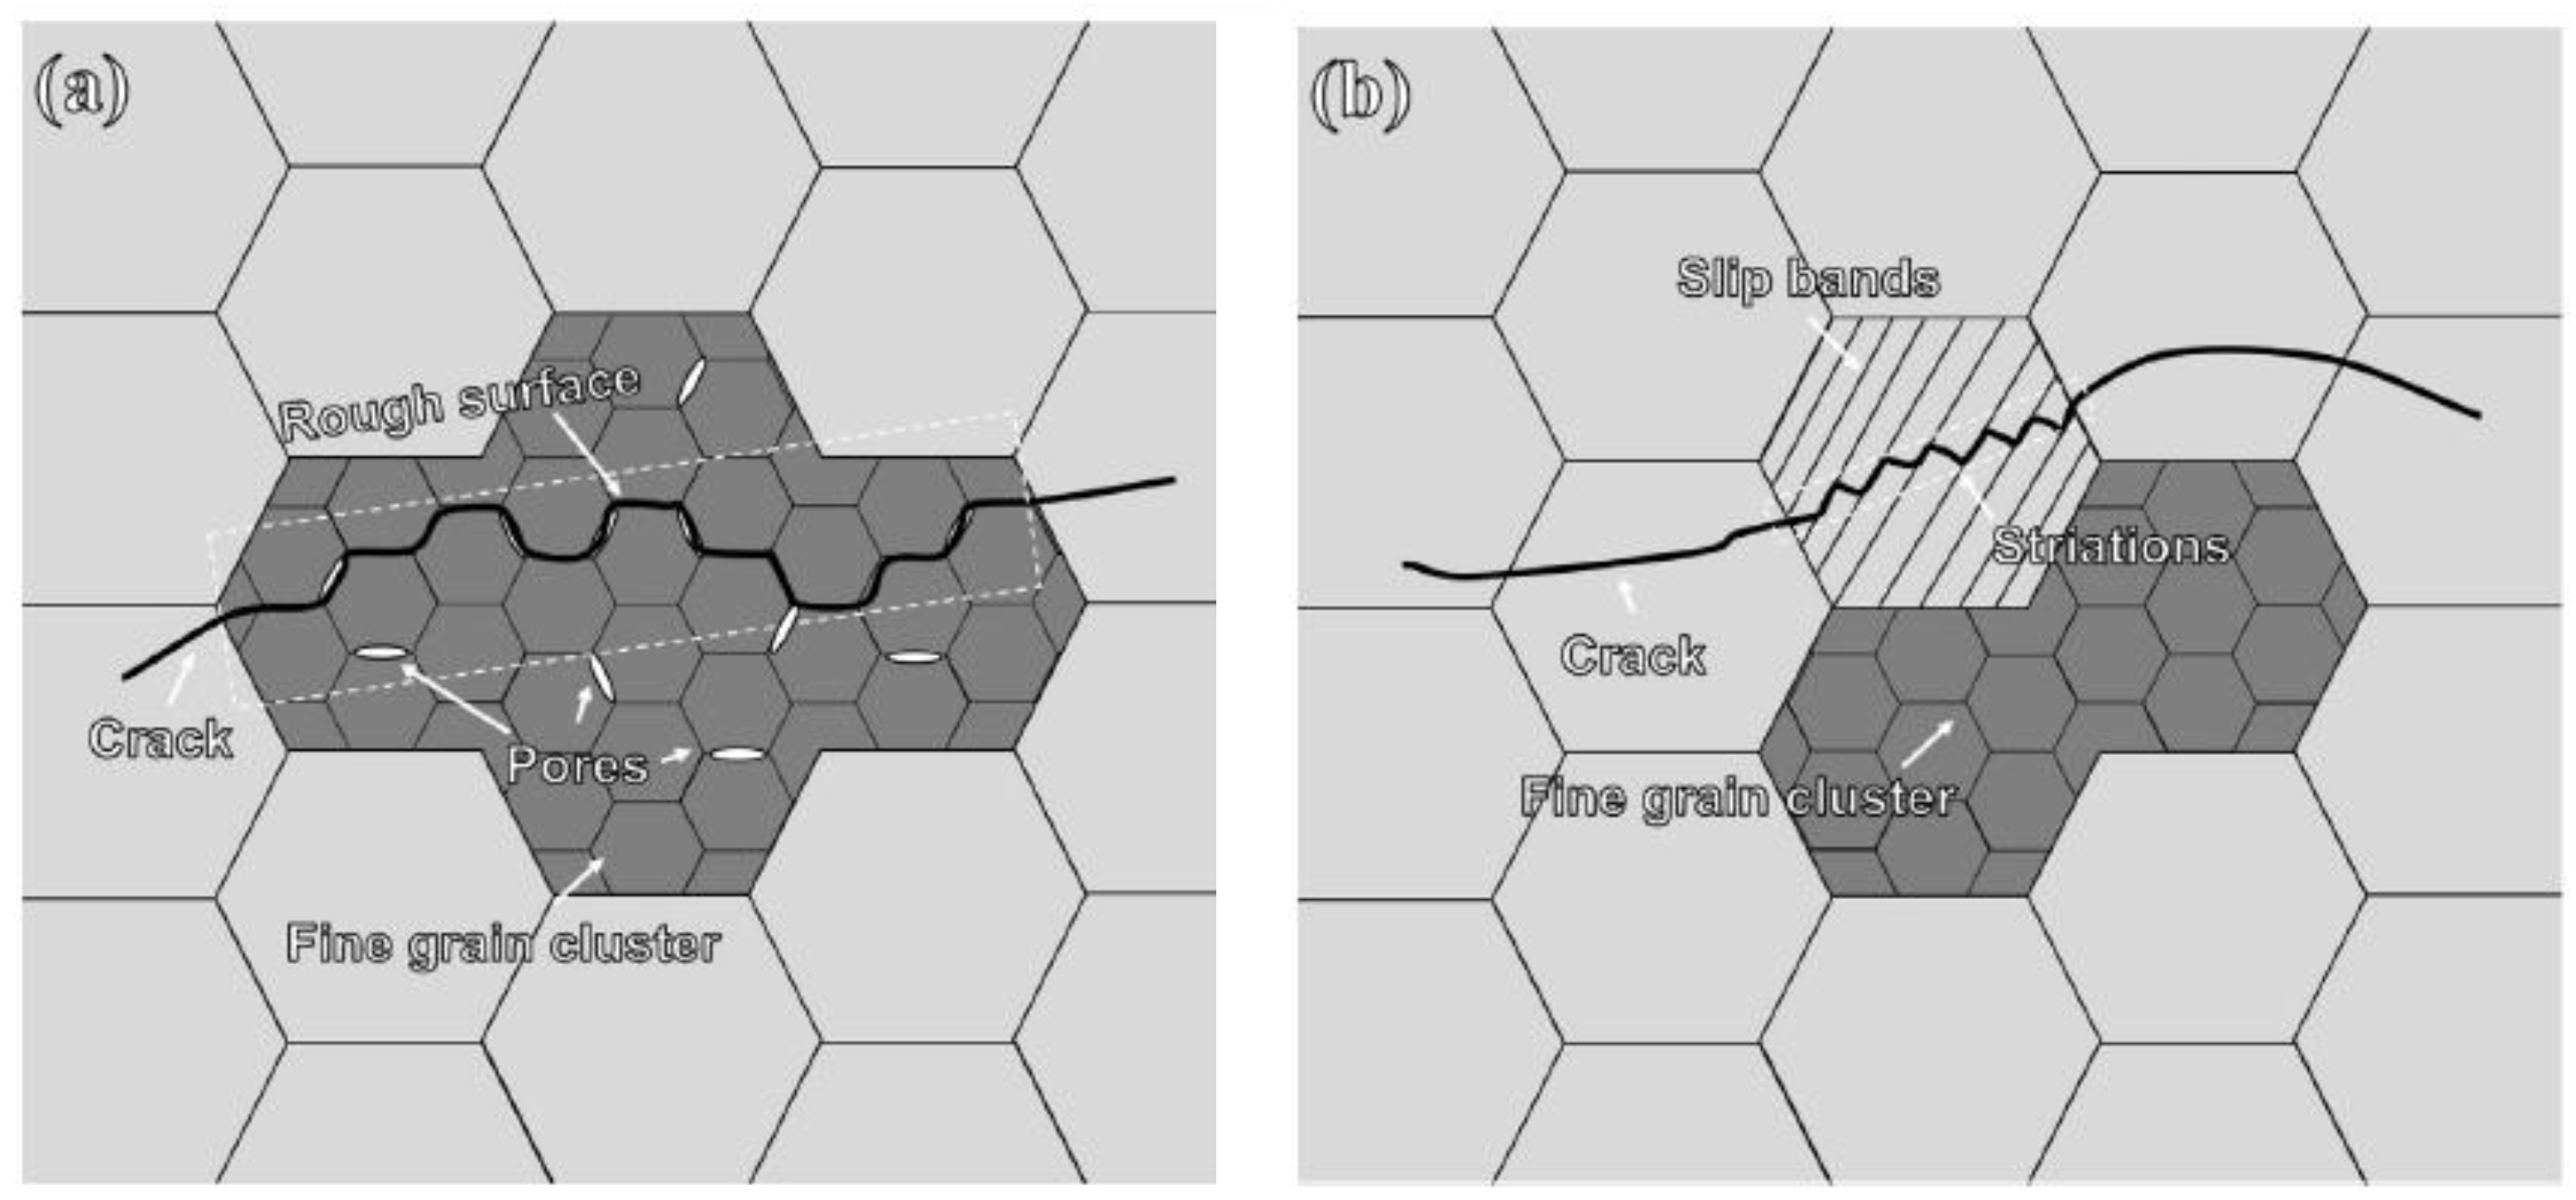
  • At room temperature, the fatigue cracks formed from the micropores within the fine-grain clusters because the micropores acted as a pre-crack, shortening the crack initiation process.
  • Different models for predicting fatigue crack initiation under that include microstructure scale parameters that can be used to predict how fatigue cracks will start under variable amplitude loading have been reviewed. Each model’s scope of applicability varies from case to case and depends on the individual application and the reliability aspects that need to be taken into account.
  • A modified version of the energy-based Tanaka-Mura equation for cyclically softening metal was developed and successfully used to predict the influence of strain-range on high temperature low cycle fatigue crack start in cyclically softening steel at various temperatures.
  • Material and structure fatigue under variable amplitude Multiaxial loading is still a complicated domain with many factors interacting (loading, mechanical behaviour of the material, geometry of the structure, surface roughness, residual stresses, temperature, environment, and so on).
Finally, it must be pointed out that the introduction of the linear damage rule, a huge number of fatigue life prediction models have been reviewed. But to take into account the effects of high temperature and all the different amplitude loading during cyclic applications of loading, as well as other parameters in a harsh operating environment, requires attention and focus.

Author Contributions

Conceptualization, Y.A.K.; methodology, Y.A.K.; software, Y.A.K.; validation, H.G.L.; formal analysis, Y.A.K.; investigation, Y.A.K.; resources, H.G.L.; data curation, Y.A.K.; writing—original draft preparation, Y.A.K.; writing—review and editing, Y.A.K. and H.G.L.; visualization, Y.A.K. and H.G.L.; supervision, H.G.L.; project administration, H.G.L.; funding acquisition, H.G.L. All authors have read and agreed to the published version of the manuscript.

Funding

This research was supported by the INDMET project, grant number 62862, funded by the NORHED II program.

Institutional Review Board Statement

Not applicable.

Informed Consent Statement

Not applicable.

Data Availability Statement

Not applicable.

Conflicts of Interest

The authors declare no conflict of interest.

References

  1. Cui, W. A state-of-the-art review on fatigue life prediction methods for metal structures. J. Mar. Sci. Technol. 2002, 7, 43–56. [Google Scholar] [CrossRef]
  2. Pande, C.S. Fundamentals of Fatigue Crack Initiation and Propagation: Some Thoughts; Srivatsan, T.S., Imam, M.A., Srinivasan, R., Eds.; Springer International Publishing: Cham, Switzerland, 2016; pp. 3–15. [Google Scholar] [CrossRef]
  3. Bathias, C.; Pineau, A. Fatigue of Materials and Structures: Application to Design and Damage; John Wiley & Sons: Hoboken, NJ, USA, 2013. [Google Scholar]
  4. Zhu, M.; Liu, X.; Lai, J.; Luo, J. Fatigue life of a pressure vessel based on residual strength and crack size. Trans. Can. Soc. Mech. Eng. 2022, 46, 391–399. [Google Scholar] [CrossRef]
  5. Benedetti, M.; du Plessis, A.; Ritchie, R.; Dallago, M.; Razavi, S.; Berto, F. Architected cellular materials: A review on their mechanical properties towards fatigue-tolerant design and fabrication. Mater. Sci. Eng. R Rep. 2021, 144, 100606. [Google Scholar] [CrossRef]
  6. Schijve, J. Fatigue of structures and materials in the 20th century and the state of the art. Int. J. Fatigue 2003, 25, 679–702. [Google Scholar] [CrossRef]
  7. Zhang, Q.; Zhu, Y.; Gao, X.; Wu, Y.; Hutchinson, C. Training high-strength aluminum alloys to withstand fatigue. Nat. Commun. 2020, 11, 5198. [Google Scholar] [CrossRef]
  8. Krupp, U. Fatigue Crack Propagation in Metals and Alloys: Microstructural Aspects and Modelling Concepts; John Wiley & Sons: Hoboken, NJ, USA, 2007. [Google Scholar]
  9. Lin, P.-H.; Tobushi, H.; Hashimoto, T.; Shimeno, Y.; Takata, K. Fatigue Properties of TiNi Shape Memory Alloy. J. Soc. Mater. Sci. Jpn. 2001, 50, 103–110. [Google Scholar] [CrossRef]
  10. Susmel, L.; Tovo, R. Estimating fatigue damage under variable amplitude multiaxial fatigue loading. Fatigue Fract. Eng. Mater. Struct. 2011, 34, 1053–1077. [Google Scholar] [CrossRef]
  11. Cui, W.; Wang, F.; Huang, X. A unified fatigue life prediction method for marine structures. Mar. Struct. 2011, 24, 153–181. [Google Scholar] [CrossRef]
  12. Suresh, S. Fatigue of Materials; Cambridge university press: Cambridge, UK, 1998. [Google Scholar]
  13. Lassen, T.; Recho, N. Proposal for a more accurate physically based S–N curve for welded steel joints. Int. J. Fatigue 2009, 31, 70–78. [Google Scholar] [CrossRef]
  14. Deepthi, T.V.; Reddy, C.S.; Satyadevi, A. Recent trends in elastic-plastic analysis using elastic solutions. Mater. Today Proc. 2015, 2, 2188–2197. [Google Scholar] [CrossRef]
  15. Yao, J.; Kozin, F.; Wen, Y.K.; Yang, J.N.; Schueller, G.; Ditlevsen, O. Stochastic fatigue, fracture and damage analysis. Struct. Saf. 1986, 3, 231–267. [Google Scholar] [CrossRef]
  16. Fatemi, A.; Yang, L. Cumulative fatigue damage and life prediction theories: A survey of the state of the art for homogeneous materials. Int. J. Fatigue 1998, 20, 9–34. [Google Scholar] [CrossRef]
  17. Wood, W. Recent Observations on Fatigue Failure in Metals; ASTM International: West Conshohocken, PA, USA, 1959. [Google Scholar]
  18. Demir, O. Prediction of crack initiation angle in brittle structures containing inclined cracks. Mech. Solids 2021, 56, 1066–1075. [Google Scholar] [CrossRef]
  19. Morrow, J. Fatigue design handbook. Adv. Eng. 1968, 4, 21–29. [Google Scholar]
  20. Smith, C. Small specimen data for predicting life of full-scale structures. In Symposium on Fatigue Tests of Aircraft Structures: Low-Cycle, Full-Scale, and Helicopters; ASTM International: West Conshohocken, PA, USA, 1963. [Google Scholar]
  21. Morrow, J.; Martin, J.; Dowling, N.E. Local Stress-Strain Approach to Cumulative Fatigue Damage Analysis. Department of Theoretical and Applied Mechanics, College of Engineering, University of Illinois in Urbana: Urbana, IL, USA, 1974. [Google Scholar]
  22. Crews, J.; Hardrath, H. A study of cyclic plastic stresses at a notch root. Exp. Mech. 1966, 6, 313–320. [Google Scholar] [CrossRef] [Green Version]
  23. Sangid, M.D. The physics of fatigue crack initiation. Int. J. Fatigue 2013, 57, 58–72. [Google Scholar] [CrossRef]
  24. Srivatsan, S.; Sudarshan, T. Mechanisms of fatigue crack initiation in metals: Role of aqueous environments. J. Mater. Sci. 1988, 23, 1521–1533. [Google Scholar] [CrossRef]
  25. Sinclair, G.; Dolan, T.J. Influence of Grain Size on Work Hardening and Fatigue Characteristics of Alpha Brass. ASM Trans. Q 1952, 44, 929–948. [Google Scholar]
  26. Thompson, A.W. The comparison of yield and fatigue strength dependence on grain size. Scr. Metall. 1971, 5, 859–863. [Google Scholar] [CrossRef]
  27. Wood, W. Formation of fatigue cracks. Philos. Mag. 1958, 3, 692–699. [Google Scholar] [CrossRef]
  28. Cottrell, A.H.; Hull, D. Extrusion and intrusion by cyclic slip in copper. Proc. R. Soc. Lond. Ser. A Math. Phys. Sci. 1957, 242, 211–213. [Google Scholar]
  29. Broom, T.; Summerton, J. The fatigue of zinc single crystals. Philos. Mag. 1963, 8, 1847–1862. [Google Scholar] [CrossRef]
  30. Basinski, Z.; Basinski, S. Fundamental aspects of low amplitude cyclic deformation in face-centred cubic crystals. Prog. Mater. Sci. 1992, 36, 89–148. [Google Scholar] [CrossRef]
  31. Seeger, A.; Diehl, J.; Mader, S.; Rebstock, H. Work-hardening and work-softening of face-centred cubic metal crystals. Philos. Mag. 1957, 2, 323–350. [Google Scholar] [CrossRef]
  32. Friedel, J.; Feltham, P. A discussion on work-hardening and fatigue in metals. Proc. R. Soc. Lond. Ser. A Math. Phys. Sci. 1957, 242, 145. [Google Scholar]
  33. Basinski, Z.; Korbel, A.; Basinski, S. The temperature dependence of the saturation stress and dislocation substructure in fatigued copper single crystals. Acta Metall. 1980, 28, 191–207. [Google Scholar] [CrossRef]
  34. Christ, H.J.; Mughrabi, H. Cyclic stress-strain response and microstructure under variable amplitude loading. Fatigue Fract. Eng. Mater. Struct. 1996, 19, 335–348. [Google Scholar] [CrossRef]
  35. Lerch, B.A.; Jayaraman, N.; Antolovich, S.D. A study of fatigue damage mechanisms in Waspaloy from 25 to 800 C. Mater. Sci. Eng. 1984, 66, 151–166. [Google Scholar] [CrossRef]
  36. Healy, J.; Grabowski, L.; Beevers, C. Short-fatigue-crack growth in a nickel-base superalloy at room and elevated temperature. Int. J. Fatigue 1991, 13, 133–138. [Google Scholar] [CrossRef]
  37. Yates, J.; Zhang, W.; Miller, K. The initiation and propagation behaviour of short fatigue cracks in Waspaloy subjected to bending. Fatigue Fract. Eng. Mater. Struct. 1993, 16, 351–362. [Google Scholar] [CrossRef]
  38. Smith, R.; Liu, Y.; Grabowski, L. Short fatigue crack growth behaviour in Waspaloy at room and elevated temperatures. Fatigue Fract. Eng. Mater. Struct. 1996, 19, 1505–1514. [Google Scholar] [CrossRef]
  39. Toh, S.F.; Rainforth, W. Fatigue of a nickel base superalloy with bimodal grain size. Mater. Sci. Technol. 1996, 12, 1007–1014. [Google Scholar] [CrossRef]
  40. Pang, H.; Reed, P. Fatigue crack initiation and short crack growth in nickel-base turbine disc alloysthe effects of microstructure and operating parameters. Int. J. Fatigue 2003, 25, 1089–1099. [Google Scholar] [CrossRef]
  41. Barsom, J.; McNicol, R. Effect of Stress Concentration on Fatigue-Crack Initiation in HY-130 Steel; ASTM International: West Conshohocken, PA, USA, 1974. [Google Scholar]
  42. Nesterenko, B.; Nesterenko, G.I.; Basov, V.N. Fracture behaviour of skin materials of civil airplane structures. In ICAF 2009, Bridging the Gap between Theory and Operational Practice; Springer: Berlin/Heidelberg, Germany, 2009; pp. 661–683. [Google Scholar]
  43. Kim, W.H.; Laird, C. Crack nucleation and stage I propagation in high strain fatigue II. Mechanism. Acta Metall. 1978, 26, 789–799. [Google Scholar] [CrossRef]
  44. Figueroa, J.; Laird, C. Crack initiation mechanisms in copper polycrystals cycled under constant strain amplitudes and in step tests. Mater. Sci. Eng. 1983, 60, 45–58. [Google Scholar] [CrossRef]
  45. Liang, F.L.; Laird, C. Control of intergranular fatigue cracking by slip homogeneity in copper I: Effect of grain size. Mater. Sci. Eng. A 1989, 117, 95–102. [Google Scholar] [CrossRef]
  46. Tanaka, K.; Mura, T. A dislocation model for fatigue crack initiation. J. Appl. Mech. Mar. 1981, 48, 97–103. [Google Scholar] [CrossRef]
  47. Mughrabi, H. A model of high-cycle fatigue-crack initiation at grain boundaries by persistent slip bands. In Defects, Fracture and Fatigue; Springer: Berlin/Heidelberg, Germany, 1983; pp. 139–146. [Google Scholar]
  48. Mughrabi, H.; Wang, R.; Differt, K.; Essmann, U. Fatigue crack initiation by cyclic slip irreversibilities in high-cycle fatigue. In Fatigue Mechanisms: Advances in Quantitative Measurement of Physical Damage: A Conference; ASTM International: West Conshohocken, PA, USA, 1983; Volume 811, p. 1. [Google Scholar]
  49. Christ, H.J. On the orientation of cyclic-slip-induced intergranular fatigue cracks in face-centered cubic metals. Mater. Sci. Eng. A 1989, 117, L25–L29. [Google Scholar] [CrossRef]
  50. Liu, W.; Bayerlein, M.; Mughrabi, H.; Day, A.; Quested, P. Crystallographic features of intergranular crack initiation in fatigued copper polycrystals. Acta Metall. Mater. 1992, 40, 1763–1771. [Google Scholar] [CrossRef]
  51. Burmeister, H.J.; Richter, R. Investigations on the origin of grain boundary cracks in fatigued fcc metals. Acta Mater. 1997, 45, 709–714. [Google Scholar] [CrossRef]
  52. Zhang, Z.; Wang, Z. Dependence of intergranular fatigue cracking on the interactions of persistent slip bands with grain boundaries. Acta Mater. 2003, 51, 347–364. [Google Scholar] [CrossRef]
  53. Mazánová, V.; Heczko, M.; Polák, J. On the mechanism of fatigue crack initiation in high-angle grain boundaries. Int. J. Fatigue 2022, 158, 106721. [Google Scholar] [CrossRef]
  54. Li, W.B.; Umezawa, O. A review of subsurface crack initiation models in high-cycle fatigue for titanium alloys. Key Eng. Mater. 2017, 741, 76–81. [Google Scholar] [CrossRef]
  55. Santecchia, E.; Hamouda, A.; Musharavati, F.; Zalnezhad, E.; Cabibbo, M.; El Mehtedi, M.; Spigarelli, S. A review on fatigue life prediction methods for metals. Adv. Mater. Sci. Eng. 2016, 2016, 9573524. [Google Scholar] [CrossRef] [Green Version]
  56. Zhao, Z.; Zhang, F.; Dong, C.; Yang, X.; Chen, B. Initiation and early-stage growth of internal fatigue cracking under very-high-cycle fatigue regime at high temperature. Metall. Mater. Trans. A 2020, 51, 1575–1592. [Google Scholar] [CrossRef]
  57. Grosskreutz, J. The mechanisms of metal fatigue (I). Phys. Status Solidi B 1971, 47, 11–31. [Google Scholar] [CrossRef]
  58. Laird, C. Mechanisms of fatigue crack nucleation. Corros Fatigue NACE-2 1972, 88–117. [Google Scholar]
  59. Zhao, Z.; Liang, Z.; Li, Q.; Zhang, F.; Chen, B. Crack initiation and propagation behavior under high-temperature very-high cycle fatigue: Directionally solidified columnar-grained vs. single-crystal superalloys. Mater. Sci. Eng. A 2022, 836, 142711. [Google Scholar] [CrossRef]
  60. Zhou, J.; Barrett, R.A.; Leen, S.B. A physically-based method for predicting high temperature fatigue crack initiation in P91 welded steel. Int. J. Fatigue 2021, 153, 106480. [Google Scholar] [CrossRef]
  61. Osterstock, S.; Robertson, C.F.; Sauzay, M.; Degallaix, S.; Aubin, V. Prediction of the scatter of crack initiation under high cycle fatigue. In Key engineering materials; Trans Tech Publications Ltd.: Zurich, Switzerland, 2007; Volume 345, pp. 363–366. [Google Scholar]
  62. Lee, H.W.; Basaran, C. Predicting high cycle fatigue life with unified mechanics theory. Mech. Mater. 2022, 164, 104116. [Google Scholar] [CrossRef]
  63. Jiang, J.; Dunne, F.P.; Britton, T.B. Toward predictive understanding of fatigue crack nucleation in Ni-based superalloys. Jom 2017, 69, 863–871. [Google Scholar] [CrossRef] [PubMed] [Green Version]
  64. Mughrabi, H. Microstructural mechanisms of cyclic deformation, fatigue crack initiation and early crack growth. Philos. Trans. R. Soc. A Math. Phys. Eng. Sci. 2015, 373, 20140132. [Google Scholar] [CrossRef] [PubMed] [Green Version]
  65. Giroux, P.F. Experimental Study and Simulation of Cyclic Softening of Tempered Martensite Ferritic Steels. PhD Thesis, École Nationale Supéri des Mines de Paris, Paris, France, 2011. [Google Scholar]
  66. Mura, T. A theory of fatigue crack initiation. Mater. Sci. Eng. A 1994, 176, 61–70. [Google Scholar] [CrossRef]
  67. Sauzay, M.; Blondel, P. Can polycrystalline microstructure account for the scatter in the number of cycles to initiation of a high-cycle fatigue crack? Eng. Mech. 2004, 11, 377–381. [Google Scholar]
  68. Chan, K.S. A microstructure-based fatigue-crack-initiation model. Metall. Mater. Trans. A 2003, 34, 43–58. [Google Scholar] [CrossRef]
  69. Wu, X. On Tanaka-Mura’s fatigue crack nucleation model and validation. Fatigue Fract. Eng. Mater. Struct. 2018, 41, 894–8993. [Google Scholar] [CrossRef] [Green Version]
  70. Tanaka, K.; Mura, T. A theory of fatigue crack initiation at inclusions. Metall. Trans. A 1982, 13, 117–123. [Google Scholar] [CrossRef]
  71. Venkataraman, G.; Chung, Y.W.; Nakasone, Y.; Mura, T. Free energy formulation of fatigue crack initiation along persistent slip bands: Calculation of S N curves and crack depths. Acta Metall. Mater. 1990, 38, 31–40. [Google Scholar] [CrossRef]
  72. Venkataraman, G.; Chung, Y.W.; Mura, T. Application of minimum energy formalism in a multiple slip band model for fatigue II. Crack nucleation and derivation of a generalised Coffin-Manson law. Acta Metall. Mater. 1991, 39, 2631–2638. [Google Scholar] [CrossRef]
  73. Harvey, S.; Marsh, P.; Gerberich, W. Atomic force microscopy and modeling of fatigue crack initiation in metals. Acta Metall. Mater. 1994, 42, 3493–3502. [Google Scholar] [CrossRef]
  74. Marchand, N.; Baïlon, J.P.; Dickson, J. Near-threshold fatigue crack growth in copper and alpha-brass: Grain-size and environmental effects. Metall. Trans. A 1988, 19, 2575–2587. [Google Scholar] [CrossRef]
  75. Ogi, H.; Hirao, M.; Aoki, S. Noncontact monitoring of surface-wave nonlinearity for predicting the remaining life of fatigued steels. J. Appl. Phys. 2001, 90, 438–442. [Google Scholar] [CrossRef]
  76. Morris, W.; Buck, O.; Inman, R. Acoustic harmonic generation due to fatigue damage in high-strength aluminum. J. Appl. Phys. 1979, 50, 6737–6741. [Google Scholar] [CrossRef]
  77. Kulkarni, S.S.; Sun, L.; Moran, B.; Krishnaswamy, S.; Achenbach, J. A probabilistic method to predict fatigue crack initiation. Int. J. Fract. 2006, 137, 9–17. [Google Scholar] [CrossRef]
  78. Melander, A.; Larsson, M. The effect of stress amplitude on the cause of fatigue crack initiation in a spring steel. Int. J. Fatigue 1993, 15, 119–131. [Google Scholar] [CrossRef]
  79. De Bussac, A.; Lautridou, J. A probabilistic model for prediction of LCF surface crack initiation in PM alloys. Fatigue Fract. Eng. Mater. Struct. 1993, 16, 861–874. [Google Scholar] [CrossRef]
  80. De Bussac, A. Prediction of the competition between surface and internal fatigue crack initiation in PM alloys. Fatigue Fract. Eng. Mater. Struct. 1994, 17, 1319–1325. [Google Scholar] [CrossRef]
  81. Dunne, F. Fatigue crack nucleation: Mechanistic modelling across the length scales. Curr. Opin. Solid State Mater. Sci. 2014, 18, 170–179. [Google Scholar] [CrossRef] [Green Version]
  82. Makkonen, M. Statistical size effect in the fatigue limit of steel. Int. J. Fatigue 2001, 23, 395–402. [Google Scholar] [CrossRef]
  83. Makkonen, M. Notch size effects in the fatigue limit of steel. Int. J. Fatigue 2003, 25, 17–26. [Google Scholar] [CrossRef]
  84. Kelestemur, M.H.; Chaki, T. The effect of overload on the fatigue crack growth behaviour of 304 stainless steel in hydrogen. Fatigue Fract. Eng. Mater. Struct. 2001, 24, 15–22. [Google Scholar] [CrossRef]
  85. Wei, L.; De los Rios, E.; James, M. Experimental study and modelling of short fatigue crack growth in aluminium alloy Al7010-T7451 under random loading. Int. J. Fatigue 2002, 24, 963–975. [Google Scholar] [CrossRef]
  86. Moreno, B.; Zapatero, J.; Dominguez, J. An experimental analysis of fatigue crack growth under random loading. Int. J. Fatigue 2003, 25, 597–608. [Google Scholar] [CrossRef]
  87. Ahmadi, A.; Zenner, H. Lifetime simulation under multiaxial random loading with regard to the microcrack growth. Int. J. Fatigue 2006, 28, 954–962. [Google Scholar] [CrossRef]
  88. Kim, S.T.; Tadjiev, D.; Yang, H.T. Fatigue life prediction under random loading conditions in 7475-T7351 aluminum alloy using the RMS model. Int. J. Damage Mech. 2006, 15, 89–102. [Google Scholar] [CrossRef] [Green Version]
  89. Yu, S.; Xie, X.; Zhang, J.; Zhao, Z. Ductile fracture modeling of initiation and propagation in sheet-metal blanking processes. J. Mater. Process. Technol. 2007, 187, 169–172. [Google Scholar] [CrossRef]
  90. Paris, P.; Erdogan, F. A critical analysis of crack propagation laws. J. Basic Eng. Dec. 1963, 85, 528–534. [Google Scholar] [CrossRef]
  91. Rege, K.; Pavlou, D.G. A one-parameter nonlinear fatigue damage accumulation model. Int. J. Fatigue 2017, 98, 234–246. [Google Scholar] [CrossRef]
  92. Liu, Y.; Mahadevan, S. Stochastic fatigue damage modeling under variable amplitude loading. Int. J. Fatigue 2007, 29, 1149–1161. [Google Scholar] [CrossRef]
  93. Marco, S.; Starkey, W. A concept of fatigue damage. Trans. Am. Soc. Mech. Eng. 1954, 76, 627–632. [Google Scholar] [CrossRef]
  94. Miner, M.A. Cumulative damage in fatigue. J. Appl. Mech. Sep. 1945, 12, A159–A164. [Google Scholar] [CrossRef]
  95. Yang, L.; Fatemi, A. Cumulative fatigue damage mechanisms and quantifying parameters: A literature review. J. Test. Eval. 1998, 26, 89–100. [Google Scholar]
  96. Manson, S.; Freche, J.C.; Ensign, C.R. Application of a Double Linear Damage Rule to Cumulative Fatigue; National Aeronautics and Space Administration: Washington, DC, USA, 1976; Volume 3839. [Google Scholar]
  97. Manson, S. Interfaces between fatigue, creep, and fracture. Int. J. Fract. Mech. 1966, 2, 327. [Google Scholar] [CrossRef] [Green Version]
  98. Basquin, O. The exponential law of endurance tests. Proc. Am. Soc. Test Mater. 1990, 10, 625–630. [Google Scholar]
  99. Berge, S. Proceedings of the 13th International Ship and Offshore Structures Congress; Pergamon Press: Oxford, UK, 1997; Volume 1. [Google Scholar]
  100. Wu, Y.S.; Zhou, G.J.; Cui, W.C. Practical Design of Ships and Other Floating Structures: Eighth International Symposium-PRADS 2001 (2 Volume set); Elsevier: Amsterdam, The Netherlands, 2001; Volume 1. [Google Scholar]
  101. Manson, S.S. Fatigue behaviour in strain cycling in the low-and intermediate-cycle range. In Proceedings of the 10th Sagamore Army Materials Research Conference, Dagamore, NY, USA, 13–16 August 1963. [Google Scholar]
  102. Coffin, L.F.; Tavernelli, J. The cyclic straining and fatigue of metals. Trans Met. Ing. Soc. AIME 1959, 215, 794–806. [Google Scholar]
  103. Kachanov, L. Introduction to Continuum Damage Mechanics; Springer Science & Business Media: Berlin/Heidelberg, Germany, 1986; Volume 10. [Google Scholar]
  104. Chaboche, J.; Lesne, P. A non-linear continuous fatigue damage model. Fatigue Fract. Eng. Mater. Struct. 1988, 11, 1–17. [Google Scholar] [CrossRef]
  105. Bannantine, J.; Comer, J.; Handrock, J. Fundamentals of Metal Fatigue Analysis. In Research Supported by the University of Illinois; Prentice Hall: Englewood Cliffs, NJ, USA, 1990; p. 286. [Google Scholar]
  106. Fang, Z.; Wang, L.; Wang, Z.; He, Y. A Comparison of Two Methods Modeling High-Temperature Fatigue Crack Initiation in Ferrite–Pearlite Steel. Crystals 2022, 12, 718. [Google Scholar] [CrossRef]
  107. Cheong, K.S.; Smillie, M.J.; Knowles, D.M. Predicting fatigue crack initiation through image-based micromechanical modeling. Acta Mater. 2007, 55, 1757–1768. [Google Scholar] [CrossRef]
  108. McDowell, D.; Dunne, F. Microstructure-sensitive computational modeling of fatigue crack formation. Int. J. Fatigue 2010, 32, 1521–1542. [Google Scholar] [CrossRef]
  109. D’Angela, D.; Ercolino, M.; Bellini, C.; Di Cocco, V.; Iacoviello, F. Failure criteria for real-time assessment of ductile cast irons subjected to various loading conditions. Smart Mater. Struct. 2020, 30, 017001. [Google Scholar] [CrossRef]
  110. He, C.; Kitamura, K.; Yang, K.; Liu, Y.J.; Wang, Q.Y.; Chen, Q. Very high cycle fatigue crack initiation mechanism in nugget zone of AA 7075 friction stir welded joint. Adv. Mater. Sci. Eng. 2017, 2017, 7189369. [Google Scholar] [CrossRef] [Green Version]
  111. Grabulov, A.; Petrov, R.; Zandbergen, H. EBSD investigation of the crack initiation and TEM/FIB analyses of the microstructural changes around the cracks formed under Rolling Contact Fatigue (RCF). Int. J. Fatigue 2010, 32, 576–583. [Google Scholar] [CrossRef]
  112. Liu, J.; Wei, Y.; Yan, C.; Lang, S. Method for predicting crack initiation life of notched specimen based on damage mechanics. J. Shanghai Jiaotong Univ. Sci. 2018, 23, 286–290. [Google Scholar] [CrossRef]
  113. Zhu, Z.; Li, G.; Dai, G.; Zhao, J.; Xu, L.; Zhang, Q. Mechanisms and new parameter attribute reduction of high-speed railway wheel rim steel subjected to low temperature fatigue. Mater. Sci. Eng. A 2016, 673, 476–491. [Google Scholar] [CrossRef]
  114. Zhang, D.; Li, Z.; Wu, H.; Huang, F. Experimental study on fatigue behavior of Q420 high-strength steel at low temperatures. J. Constr. Steel Res. 2018, 145, 116–127. [Google Scholar] [CrossRef]
  115. Liao, X.; Wang, Y.; Qian, X.; Shi, Y. Fatigue crack propagation for Q345qD bridge steel and its butt welds at low temperatures. Fatigue Fract. Eng. Mater. Struct. 2018, 41, 675–687. [Google Scholar] [CrossRef]
  116. Walters, C.L.; Alvaro, A.; Maljaars, J. The effect of low temperatures on the fatigue crack growth of S460 structural steel. Int. J. Fatigue 2016, 82, 110–1186. [Google Scholar] [CrossRef]
  117. Moody, N.; Gerberich, W. Fatigue crack propagation in iron and two iron binary alloys at low temperatures. Mater. Sci. Eng. 1979, 41, 271–280. [Google Scholar] [CrossRef]
  118. Rice, J.R. Some remarks on elastic crack-tip stress fields. Int. J. Solids Struct. 1972, 8, 751–758. [Google Scholar] [CrossRef] [Green Version]
  119. Choe, H.; Chen, D.; Schneibel, J.; Ritchie, R. Ambient to high temperature fracture toughness and fatigue-crack propagation behavior in a Mo–12Si–8.5 B (at.%) intermetallic. Intermetallics 2001, 9, 319–329. [Google Scholar] [CrossRef]
  120. Thurston, K.V.; Gludovatz, B.; Hohenwarter, A.; Laplanche, G.; George, E.P.; Ritchie, R.O. Effect of temperature on the fatigue-crack growth behavior of the high-entropy alloy CrMnFeCoNi. Intermetallics 2017, 88, 65–72. [Google Scholar] [CrossRef]
  121. Kim, Y.W.; Oh, D.J.; Lee, J.M.; Noh, B.J.; Sung, H.J.; Ando, R.; Matsumoto, T.; Kim, M.H. An experimental study for fatigue performance of 7% nickel steels for type b liquefied natural gas carriers. J. Offshore Mech. Arct. Eng. 2016, 138, 031401. [Google Scholar] [CrossRef]
  122. Hu, G.; Cai, X.; Rong, Y. Fundamentals of Materials Science; Shanghai Jiao Tong University Press: Shanghai, China, 2010. [Google Scholar]
  123. Kolbe, M. The high temperature decrease of the critical resolved shear stress in nickel-base superalloys. Mater. Sci. Eng. A 2001, 319, 383–387. [Google Scholar] [CrossRef]
  124. Vennemann, A.; Langmaack, E.; Nembach, E. On the temperature dependence of the critical resolved shear stress of the g -strengthened superalloy NIMONIC PE16. Scr. Mater. 2002, 46, 723–728. [Google Scholar] [CrossRef]
  125. Li, X.; Zhang, R.; Wang, X.; Liu, Y.; Wang, C.; Zhang, H.; Li, L.; He, C.; Wang, Q. Effect of high temperature on crack initiation of super austenitic stainless steel 654SMO in very high cycle fatigue. Mater. Des. 2020, 193, 108750. [Google Scholar] [CrossRef]
  126. Xu, S.; Wu, X.; Han, E.; Ke, W.; Katada, Y. Crack initiation mechanisms for low cycle fatigue of type 316Ti stainless steel in high temperature water. Mater. Sci. Eng. 2008, 490, 16–25. [Google Scholar] [CrossRef]
  127. Pan, S.; Chen, R. Fatigue crack and evolution prediction of compacted graphite iron under thermal loading with variable amplitude. Eng. Fail. Anal. 2019, 102, 284–292. [Google Scholar] [CrossRef]
  128. Gu, T.; Stopka, K.S.; Xu, C.; McDowell, D.L. Prediction of maximum fatigue indicator parameters for duplex Ti–6Al–4V using extreme value theory. Acta Mater. 2020, 188, 504–516. [Google Scholar] [CrossRef]
  129. Dunne, F.; Wilkinson, A.; Allen, R. Experimental and computational studies of low cycle fatigue crack nucleation in a polycrystal. Int. J. Plast. 2007, 23, 273–295. [Google Scholar] [CrossRef]
  130. Hallberg, H.; Ås, S.K.; Skallerud, B. Crystal plasticity modeling of microstructure influence on fatigue crack initiation in extruded Al6082-T6 with surface irregularities. Int. J. Fatigue 2018, 111, 16–32. [Google Scholar] [CrossRef] [Green Version]
  131. Taylor, G.I.; Elam, C. The plastic extension and fracture of aluminium crystals. Proc. R. Soc. Lond. Ser. 1925, 108, 28–51. [Google Scholar]
  132. Taylor, G.I. The mechanism of plastic deformation of crystals. Part I. Theoretical. Proc. R. Soc. Lond. Ser. A 1934, 145, 362–387. [Google Scholar]
  133. Taylor, G.I.; Elam, C.F. Bakerian lecture: The distortion of an aluminium crystal during a tensile test. Proc. R. Soc. Lond. Ser. A 1923, 102, 643–667. [Google Scholar]
  134. Hill, R. Generalized constitutive relations for incremental deformation of metal crystals by multislip. J. Mech. Phys. Solids 1966, 14, 95–102. [Google Scholar] [CrossRef]
  135. Hill, R.; Rice, J. Constitutive analysis of elastic-plastic crystals at arbitrary strain. J. Mech. Phys. Solids 1972, 20, 401–413. [Google Scholar] [CrossRef]
  136. Huang, Y. A User-Material Subroutine Incroporating Single Crystal Plasticity in the ABAQUS Finite Element Program; Harvard University: Cambridge, UK, 1991. [Google Scholar]
  137. Li, H.; Kang, G.; Yu, C. Modeling uniaxial ratchetting of magnesium alloys by a new crystal plasticity considering dislocation slipping, twinning and detwinning mechanisms. Int. J. Mech. Sci. 2020, 179, 105660. [Google Scholar] [CrossRef]
  138. Li, Z.; Wang, Q.; Luo, A.A.; Fu, P.; Peng, L.; Wang, Y.; Wu, G. High cycle fatigue of cast Mg-3Nd-0.2 Zn magnesium alloys. Metall. Mater. Trans. A 2013, 44, 5202–52151. [Google Scholar] [CrossRef] [Green Version]
  139. Bergara, A.; Dorado, J.I.; Martin-Meizoso, A.; Martinez-Esnaola, J.M. Fatigue crack propagation in complex stress fields: Experiments and numerical simulations using the Extended Finite Element Method (XFEM). Int. J. Fatigue 2017, 103, 112–121. [Google Scholar] [CrossRef]
Figure 1. Information path in a crack initiation life prediction.
Metals 13 00487 g001
Figure 2. (a) Formation of slip bands on the surface of a crystal due to fatigue (54.5 kilocycles). Strain builds up and causes a fracture to form where the slip band meets the matrix (72 kilocycles). (b) Slip bands close to an inclusion in an aluminum alloy of type 2024-T4 initiation of a surface fatigue crack in an aluminum alloy after 5% of its total lifetime. Reprinted from [30], Copyright 2013, with permission from Elsevier, license number 5474671232923.
Metals 13 00487 g002
Figure 3. Information path in a crack initiation life prediction. (Reprinted from [55], Copyright 2023, with the permission of Elsevier Publishing, license Number 5495250660349).
Metals 13 00487 g003
Figure 4. (a) An EBSD crystal orientation map of the ROI with respect to the major deformation axis. (b) A SEM image showing the inclusion and fatigue cracks near it. (Reprinted from [63], Copyright 2001, with the permission of AIP Publishing, license Number 548301366743).
Metals 13 00487 g004
Figure 5. (a) Dislocation motion in a grain, adapted from Tanaka and Mura (b) illustration of fatigue persistent slip bands assumed to correspond to packet size in hierarchical microstructure of P91 steels [67] (An open-access article (Elsevier) distributed under the terms of the Creative Commons CC-BY license).
Metals 13 00487 g005
Figure 6. Typical evolution of the ration A2 (fr/2)/A1 (fr) for 0.25 mass % C steel, Nf = 56,000. (Reprinted from [75] Copyright 2001, with the permission of AIP Publishing, license Number 5461840403266).
Metals 13 00487 g006
Figure 7. Linear and nonlinear fatigue damage accumulation. (Reprinted from [91], Copyright 2023, with the permission of Elsevier Publishing, license Number 5483821438340).
Metals 13 00487 g007
Figure 8. Schematic illustration of fatigue crack initiation mechanisms (a) at room temperature and (b) at high temperature for 654SMO. (Reprinted from [125], Copyright 2020, with the permission of Elsevier Publishing, license Number 5483811042186.
Metals 13 00487 g008
Figure 9. Surface microcracks and the corresponding extracted profile (as Tmin = 100 °C, Tmax = 450 °C, and NHCF are 5 × 10³). (a,b) after 1 cycle; (c,d) after 10 cycles; (e,f) after 40 cycles. (Reprinted from [127], Copyright 2019, with permission from Elsevier, license number 5461840403266).
Metals 13 00487 g009
Table 1. Summary of methods of crack initiation life prediction under variable amplitude loading.
Analysis TypeAdvantagesLimitations
Stress based life analysis
  • Can be used for initial design.
  • Changes in material and geometry can be evaluated.
  • It does not account for notch root plasticity, that is cause of fatigue.
  • Mean stress effect cannot be handled well.
  • Requires empirical Kt for good results.
Strain based analysis [19,105]
  • Account for notch root plasticity.
  • Correctly account for mean stress effects if a sequential analysis is performed.
  • Results in more accurate life estimates for ductile metals.
  • Requires empirical Kt or Kf factors for best results.
  • Not necessarily applicable to long life situations where surface finish and other processing variables have a large effect.
Continuum damage mechanics approaches [65,93]
  • It is an actual test of the component or structure of interest.
  • Manufacturing effects and local Stress concentration effects are automatically included.
  • Stress analysis is not required.
  • The method cannot be used in the early stages of design before the first prototype is built.
  • A new set of set of test must be conducted whenever material or geometry changes are made.
  • Mean stress cannot be included.
Table 2. Different experimental methods crack initiation along with their findings.
MethodologyFindingsRefrences
Image-based micro-mechanical modelingFatigue cracks are more likely to start in grains that are poorly aligned with the loading direction.[107]
Ultrasonic fatigue testing system (20 kHz)The fatigue cracks started at the base of the friction stir weld, where the welding flaws were.[110]
Transmission Electron Microscopy (TEM), Electron Backscattered Diffraction (EBSD), and Focused Ion Beam are examples of state-of-the-artelectron imaging techniques (FIB).EBSD measurements showed a high level of local grain misorientation at the interface of Al2O3 and steel matrix. This suggests that microcracks could start there.[111]
Measurement of elastic distortion using the high-angular resolution electron backscatter diffraction method (HR-EBSD)After 20 cycles, the inclusion developed a tiny crack that propagated deeper into the matrix[63]
The fracture initiation life of notched specimens under tension-compression loading is estimated using a model based on damage mechanics theoryBased on the damage theory and the closed-form solution, the damage evolution equation accounts for not only the loading circumstances and material quality, but also the geometric parameters of the notch specimen[112]
Disclaimer/Publisher’s Note: The statements, opinions and data contained in all publications are solely those of the individual author(s) and contributor(s) and not of MDPI and/or the editor(s). MDPI and/or the editor(s) disclaim responsibility for any injury to people or property resulting from any ideas, methods, instructions or products referred to in the content.

