Article

Modal Analysis of Ultrasonic Spot Welding for Lightweight Metals Joining

1
Oak Ridge National Laboratory, Materials Science and Technology Division, Oak Ridge, TN 37831, USA
2
School of Mechanical and Electrical Engineering, Soochow University, Suzhou 215131, China
3
Oak Ridge National Laboratory, Energy and Transportation Science Division, Oak Ridge, TN 37831, USA
*
Authors to whom correspondence should be addressed.
Metals 2023, 13(10), 1735; https://doi.org/10.3390/met13101735
Submission received: 29 August 2023 / Revised: 28 September 2023 / Accepted: 9 October 2023 / Published: 13 October 2023
(This article belongs to the Special Issue Feature Papers in Welding & Joining)

Abstract

:
Ultrasonic spot welding (USW) represents one of the unique solid-state joining methods for lightweight materials such as magnesium alloy and aluminum alloy. However, the sonotrode vibration may have a detrimental impact on the sheet material and the existing welds, depending on the component geometry and vibration frequency. In this study, a modal analysis tool based on steady-state dynamics was developed for ultrasonic spot welding which features a cyclic load applied to the sheets during the joining process. Through predicting relative motion and shear stress at the faying surfaces, coupon geometry and weld spacing are identified as two major factors that affect the welding reliability and joint quality in USW. The model was validated via welding experiments on aluminum alloy and magnesium alloy and relevant characterization of temperature distribution, joint strength as well as fracture location.

1. Introduction

Ultrasonic spot welding (USW), as a solid-state joining method, can be used to join a variety of alloys, metals and plastics without filler material or excessive heat [1,2,3,4]. With the global trend of vehicle lightweighting, high-strength aluminum (Al) alloy, magnesium (Mg) alloy and carbon fiber composites are increasingly used in the aerospace and automotive industries [5]. Compared with resistance spot welding, ultrasonic welding not only has less constraint in material type selection and combination but also enables a joint to be formed at a much lower temperature, hence resulting in better energy efficiency. Nevertheless, the dynamics involved in USW may cause bond failure and sheet material damage in multiple spot welds, deteriorating the strength and reliability of the welding joint. A fundamental understanding of global dynamics and constraint effect is critical to the wide adoption of USW in manufacturing sectors.
Experimental trial–error procedure can be employed to identify the optimum process condition for a small coupon cost-effectively and efficiently. However, it is very challenging and costly to carry out such experimental design and repeated tests for a large component with multiple spot welds. On the other hand, the process simulation of ultrasonic welding at the vibration-cycle level [6,7] can be extremely time-consuming due to highly nonlinear material behavior and coupled multi-physics, and, usually, a 2D model [8] has to be used for qualitative study. As a result, the state-of-the-art 3D finite element simulations are mostly limited to a short event (e.g., 0.1–0.5 s) of USW analysis. Recent studies [9,10,11] for Mg–Mg and Mg–Steel ultrasonic welding revealed that a longer welding time (0.5–2.5 s) are needed to form a strong bond. Thus, direct thermomechanical modeling of temperature and deformation during the joining of actual components consisting of multiple welds is unrealistic within the available computational framework.
The modal analysis approach can be used to determine the vibration mode and natural frequencies of a structure within a short computational time. To date, most modal/dynamic analyses [12,13,14] were focused on tool design in order to achieve the resonance response and desired vibration mode at the sonotrode tip under a given oscillatory frequency. Daniels [15] examined the relationship between the bond area and the length of metal strips for the USW of aluminum and copper. The sharp decrease in weld bond area was attributed to energy dissipation in the strips due to mechanical resonances at certain lengths. De Vries [16] studied the coupon length effect on joining performance in Al alloy USW. An analytical formulation of vibration force is derived for the longitudinal vibration. Jagota and Dawson [17] investigated the lateral vibrations in thin-wall thermoplastic ultrasonic joining through experiments and natural frequency studies. They found that the weld quality is inversely affected by the amplitude of lateral vibration at the interface. Kang [18] proposed a one-dimensional continuous vibration model for the battery tab during ultrasonic welding. They found that axial normal stresses resulting from longitudinal and flexural vibrations could cause cracks near the weld zone. Despite the above experimental and analytical work on dynamics, an engineering tool to proactively design the weld geometry and process condition for welding quality control is yet to be developed.
In the present study, a prediction model for modal vibration of thin sheets was developed based on harmonic excitation at applied frequency during ultrasonic welding. Numerical and experimental studies on the ultrasonic welding of lightweight materials including magnesium alloy and aluminum alloy sheets were conducted to understand the interfacial relative motion and stress concentration phenomenon at various weld configurations, with correlation to the crack occurrence and bond failure. The effect of coupon geometry and weld spacing on joining performance at single/multiple spot level was investigated. An infrared camera was used to monitor the temperature of the coupon during USW for model validation. Then, the weld spacing was investigated to clarify its effect on the magnitude of relative motion and the resultant shear force applied on the exiting welds. The modal analysis results were also validated by experimental data in the literature as well as fully coupled thermomechanical finite element analysis.

2. Numerical Model

A steady-state dynamics model was developed to predict the structural response of the thin sheet coupon under ultrasonics vibration. The basic concept, finite element formulation, analysis procedure and model setup are introduced. Meanwhile, the fully 3D coupled model developed in an earlier work [11] was employed to validate the simulation results of the proposed modal analysis tool. The relative motion at the faying surfaces was then predicted and compared between the two models to elucidate the difference in interfacial relative motion and heat generation rate for various USW cases.
Figure 1 shows the geometry and finite element model for the ultrasonic welding of AA6061-T6 aluminum alloy, which is referred to in the experimental work by Veries [16]. The clamping load was 1600 N, and welding time was 0.2 s. The sonotrodue vibrated in the longitudinal direction (along coupon length). The bottom Al sheet had a fixed geometry in different welding cases. The extension length L of the top Al sheet was varied to study the influence of ultrasonic vibration on relative motion at the faying surfaces, heat generation and joint strength. For this fundamental example, modal analysis as well as a thermo-mechanical analysis will be ultilized to explain the experimental observation and scientific findings.

2.1. Steady-State Dynamics under Given Frequency

The steady-state dynamic analysis procedure [19] was used to obtain the modal vibration response of a workpiece under continuous harmonic excitation from a sonotrode tip. It is assumed that the vibration cycles have the same amplitude throughout the welding process and the mechanical response of all materials is elastic to facilitate the numerical analysis. The matrix form of the structure’s dynamic response can be written as
K N M Ω 2 M N M u M = P N
P N = S t N N · t d S
where KNM is one term of stiffness matrix considering initial stresses and deformation as expressed by Equation (3). Ω is the the vibration frequency, B is the strain matrix, u denotes the nodal displacement, Del is the elasticity matrix, σ0 is the stress tensor under base state, MNM is the corresponding term of mass matrix, ρ is the material density, N is the array of shape function of the finite element and t is the surface traction force vector.
K N M = V B N u M : σ 0 + B N : D e l : B M d V
M N M = V ρ N N · N M d V
In actual ultrasonic joining, the vibration amplitude of the sonotrode is closely related to welding power and sonotrode force in vibration direction. Here, the shear force is assumed to be propotional to sonotrode speed, which is analogous to the damping force. The vibration of the sonotrode u(t) is given by Equation (5), and the velocity can be obtained from the time derivative of displacement as written in Equation (6):
u t = u 0 sin 2 π f t
v t = v 0 cos 2 π f t
Here, u0 is the averaged vibration magnitude, f is the vibration frequency and t is the welding time. Therefore, the sonotrode force can be defined as the function of peak force F0, vibration frequency f and welding time t. Welding power can also be calculated through the integration of sonotrode force and velocity as shown in Equations (7) and (8).
F t = F 0 cos 2 π f t
Q = 0 t F v d t / t = F 0 · v 0   π f
In the literature [16], it is shown that sonotrode force and vibration amplitude reaches a stable state in USW after a dramatic ramp-up at the beginning. The force is influenced by material softening due to temperature rise, indentation depth, clamping load and vibration mode in different coupon dimensions. In this study, the sonotrode force is cut off at the clamping load through assuming the maximum friction coefficient reaches 1.0. Such estimation is reasonable for the early ultrasonic welding stage when the sonotrode tip remains at a relatively shallow indentation depth. Three-dimensional hexahedron elements with a bilinear shape function are used in the finite element model. Due to the assumption of elasticity, only Young’s modulus and material density at room temperature are needed for modal analysis. The detailed values can be found in Table 1. In this study, a constant friction coefficient of 0.6 was adopted in the simulation based on the experimental results of Veries’s work. The contact and friction were defined for sonotrode tip/top sheet, top sheet/bottom sheet and bottom sheet/anvil interfaces. The two faying surfaces were allowed to slide against each other and separate after contact.

2.2. Simulation by Coupled Thermo-Mechanical Analysis

The modeling results from modal analysis were also validated using a 3D transient thermomechanical finite element model [11]. The major challenge in such a detailed simulation is the computational cost due to coupled motion–thermal–mechanical analysis and enormous vibration cycles. Nevertheless, the thermal history, temperature distribution, plastic strain, residual stress and distortion can be modeled in that simulation framework, which provides insights into joining mechanism and process optimization. In the present study, we employed the 3D transient simulation model to predict the relative motion as well as peak temperature at the early stage of USW for different interfaces.
The transient simulation model basically shares the same model as modal analysis except for the differences in boundary condition and analysis procedure. The sonotrode vibration is predefined as the reciprocating motion following a sinusoidal displacement-time curve. According to the high-speed digital image correlation (DIC) measurement results in previous publications [9,10], the vibration amplitude of a sonotrode slightly changes during the USW process. Here, the objective of this study is to evaluate the heat generation and relative motion at the faying interface for different geometries of the workpiece. Therefore, the amplitude of the sonotrode vibration is assumed to be constant, and the bottom sheet is fixed at the anvil side to constrain the specimen. Heat generation consists of two parts: one is related to the frictional heat produced by the materials sliding at the interface, and the other is the plastic dissipation when the material undergoes severe plastic deformation [20] and a high strain rate as shown in Figure 2. The free body diagram is utilized to explain the heat generation and thermal contact behavior at the interface. The heat generation due to frictional work is equally distributed onto the two sides of surface, and the gap heat conductance takes a value between 5000–30,000 W/m2/K, which linearly changes with pressure within range of 0.1–10 MPa [21,22,23], while the heat transfer coefficient was defined as 30 W/m2/K [24] for all surfaces that are exposed to the environment.
The control equation for thermal conduction during USW can be written as Equation (9):
ρ c T t k T q V = 0
where ρ is the material density, c is the specific heat and k is the heat conductivity. The temperature-dependent material properties of AA6061-T6, used in thermo-mechanical analysis, are listed in Table 1. The material density is considered as a constant 2700 kg/m3. The volumetric heat source qv denotes the heat generation rate during plastic dissipation, which can be calculated through the integration of plastic work at each material point using Equation (10):
q V = η σ : ε ˙ p
where η is the fraction of plastic work converted into heat, σ is the stress tensor and ε ˙ p is the plastic strain rate.
During integration of Equation (9), a heat source term on the sliding surface will appear as a boundary condition. Here, the heat flux qf is the heat generated through frictional work at the interface, and it can be written as Equation (11). It is assumed that 100% of friction work is converted into heat.
q f = f P v
where f = f(T, P) is the friction coefficient of the interface which can be dependent on temperature (T) and pressure (P). v is the slipping rate at the interface between the two contacting surfaces. A user subroutine VFRIC can be defined to dynamically update the friction coefficient as a function of temperature and pressure [9]. To save computational cost, the geometric details of the sonotrode tip and indentation process on the top surface were not considered. Instead, an increased friction coefficient that is 0.5 times larger than that used for the Al/Al faying interface was used to mimic the effect of sonotrode teeth engaging on the shear force at the sonotrode tip/top sheet interface. Displacement control was used in the thermo-mechanical model, and vibration cycles with an amplitude of 16 μm were applied on the sonotrode. The interactions between weld sheets including the contact in normal direction and friction force in plane were taken into account.

2.3. Connection of Simulation Approaches and Experiments

The input data and output results of the two analyses using the proposed modal analysis tool and thermomechanical model, as well as those from the physical experiment, are depicted in Figure 3. Due to the assumption of elastic strain and a steady state in modal analysis, only the relative motion at the joint interface can be compared with the thermo-mechanical model, which is validated using measured temperature and deformation [9]. Meanwhile, the high-stress region predicted via modal analysis may result in extensive plastic dissipation that transforms into heat which can be captured using IR imaging. The joint strength and fracture can also be indicators of joining performance corresponding to vibration mode and high stress.

3. Results and Discussion

3.1. Al Alloy USW Vibration and Joint Strength

In order to validate the proposed simulation method, the experimental Al-Al USW cases by de Vries were numerically studied using both modal analysis and thermo-mechanical analysis. The effect of coupon length on relative motion and joint quality was investigated using the USW model as shown in Figure 1. Such a welding condition represents an approximate one-dimensional (1D) problem that can be solved analytically and used to facilitate the understanding and comparison with numerical modeling. It is noted that sonotrode vibration direction is along the longitudinal direction to trigger the resonance vibration at a specific coupon geometry and processing condition. The top sheet was welded without any restraint such that the left end could move freely. The extension length L from sonotrode position to the short edge was defined as a variable influencing the vibration and joint quality. The wavelength λ of ultrasonics propagation in the Al material can be calculated using formula λ = 1 f E ρ as 252 mm. The results in Figure 4 reassembles the stress wave shape of the material under ultrasonics vibration and stress propagation, with the differences in the node and anti-node positions. For L = ¼ λ and L = ¾ λ, the sonotrode tip has only a few microns of vibration amplitude, appearing to be the node position. Taking the case of L = ¼ λ as an example (red curve), the start point of the horizontal axis, which is the center of sonotrode tip, corresponds to a vibration amplitude of less than 5 μm, and the relative motion at the faying interface is expected to be even smaller. On the other hand, the vibration amplitude of the sonotrode is more than 20 μm when L = 1/2 λ or L = λ. For the case with L = λ (green curve), the sonotrode vibration amplitude is nearly 25 μm under the given ultrasonic power, which is favorable for frictional heat generation at the joint interface.
The relationship between Al–Al interfacial relative motion and the extension length is shown in Figure 5. It is clear that the relative motion between the faying surfaces of the top Al sheet and bottom Al sheet is very low at critical lengths (L = λ/4, 3λ/4, …). The clamped location near the sonotrode appeared to be a node position where the top sheet hardly vibrates against the bottom sheet. In such a case, ultrasonic welding is similar to the scenario of welding on a single sheet, with most of the heat generated on the top sheet surface. Therefore, a severe plastic deformation will be produced on the top sheet, resulting in a weak bond at joint interface as shown by De Vries’s experiment (see Figure 5). The variation in the joint strength of Al ultrasonic welding with respect to extension length L has a good correlation with computed interfacial vibration. A larger interfacial vibration or relative motion is generally needed to clean oxides at the faying surfaces and to achieve higher temperature for diffusion bonding [25]. In actual welding, the node position or node line of the sheet should be avoided to facilitate a sound bond.
Through the 3D transient thermo-mechanical finite element analysis, the temperature field at an actual welding time of 0.2 s in case L = 63 mm (1/4 λ) and L = 126 mm (1/2 λ) is shown in Figure 6. For USW at node position (L = 1/4 λ), the frictional heating is concentrated on the sonotrode/workpiece interface, resulting in a peak temperature about 400 °C outside the sonotrode area. The IR-measured temperature in Vries’s work showed a peak value of 314 °C. Welding for a longer time at such a high temperature will greatly soften the yield strength of the Al alloy and cause severe damage to the top sheet or even join the sonotrode to the sheet. Figure 7 reveals that the top sheet (L = 1/4 λ) is hardly driven to vibrate against the bottom sheet, with average relative motion less than 2 μm. Thus, shear deformation and interfacial sliding are quite limited in order to break the oxides on the interface and generate enough heat to facilitate a bond.
On the other hand, if the top sheet has an extension length of L = 1/2 λ, the relative motion at the joining interface fluctuates between 10 μm and 16 μm, which means ultrasonic energy has been effectively delivered to the faying surfaces. For the 0.2 s USW by de Vries, the measured highest temperature in this weld at the anti-node position is 200 °C, corresponding well with the simulation results for the top surface, which is about 188 °C. From the 3D thermomechanical model, the interfacial temperature reached 350 °C, which can promote diffusion bonding to form a good weld. In actual welding, the welding time and clamping load can be determined using the model to avoid sonotrode welding and extrusion.
For a quantitative validation of the developed modal analysis tool, the peak temperature on the top Al sheet as well as the interfacial relative motion are plotted in a bar chart as shown in Figure 8. For the two typical cases with the sonotrode applied at the node and anti-node position, the modal analysis and thermomechanical analysis show a qualitative agreement on the predicted interfacial vibration. The difference (27%) in the absolute value is due to the assumed elastic material property in modal analysis but temperature-dependent elastic–plastic material model in thermomechanical analysis. The major advantage of modal analysis is the short computational time, which was less than 2 min, whereas the 3D thermomechanical model took about 12 h for the 0.2 s USW process simulation.

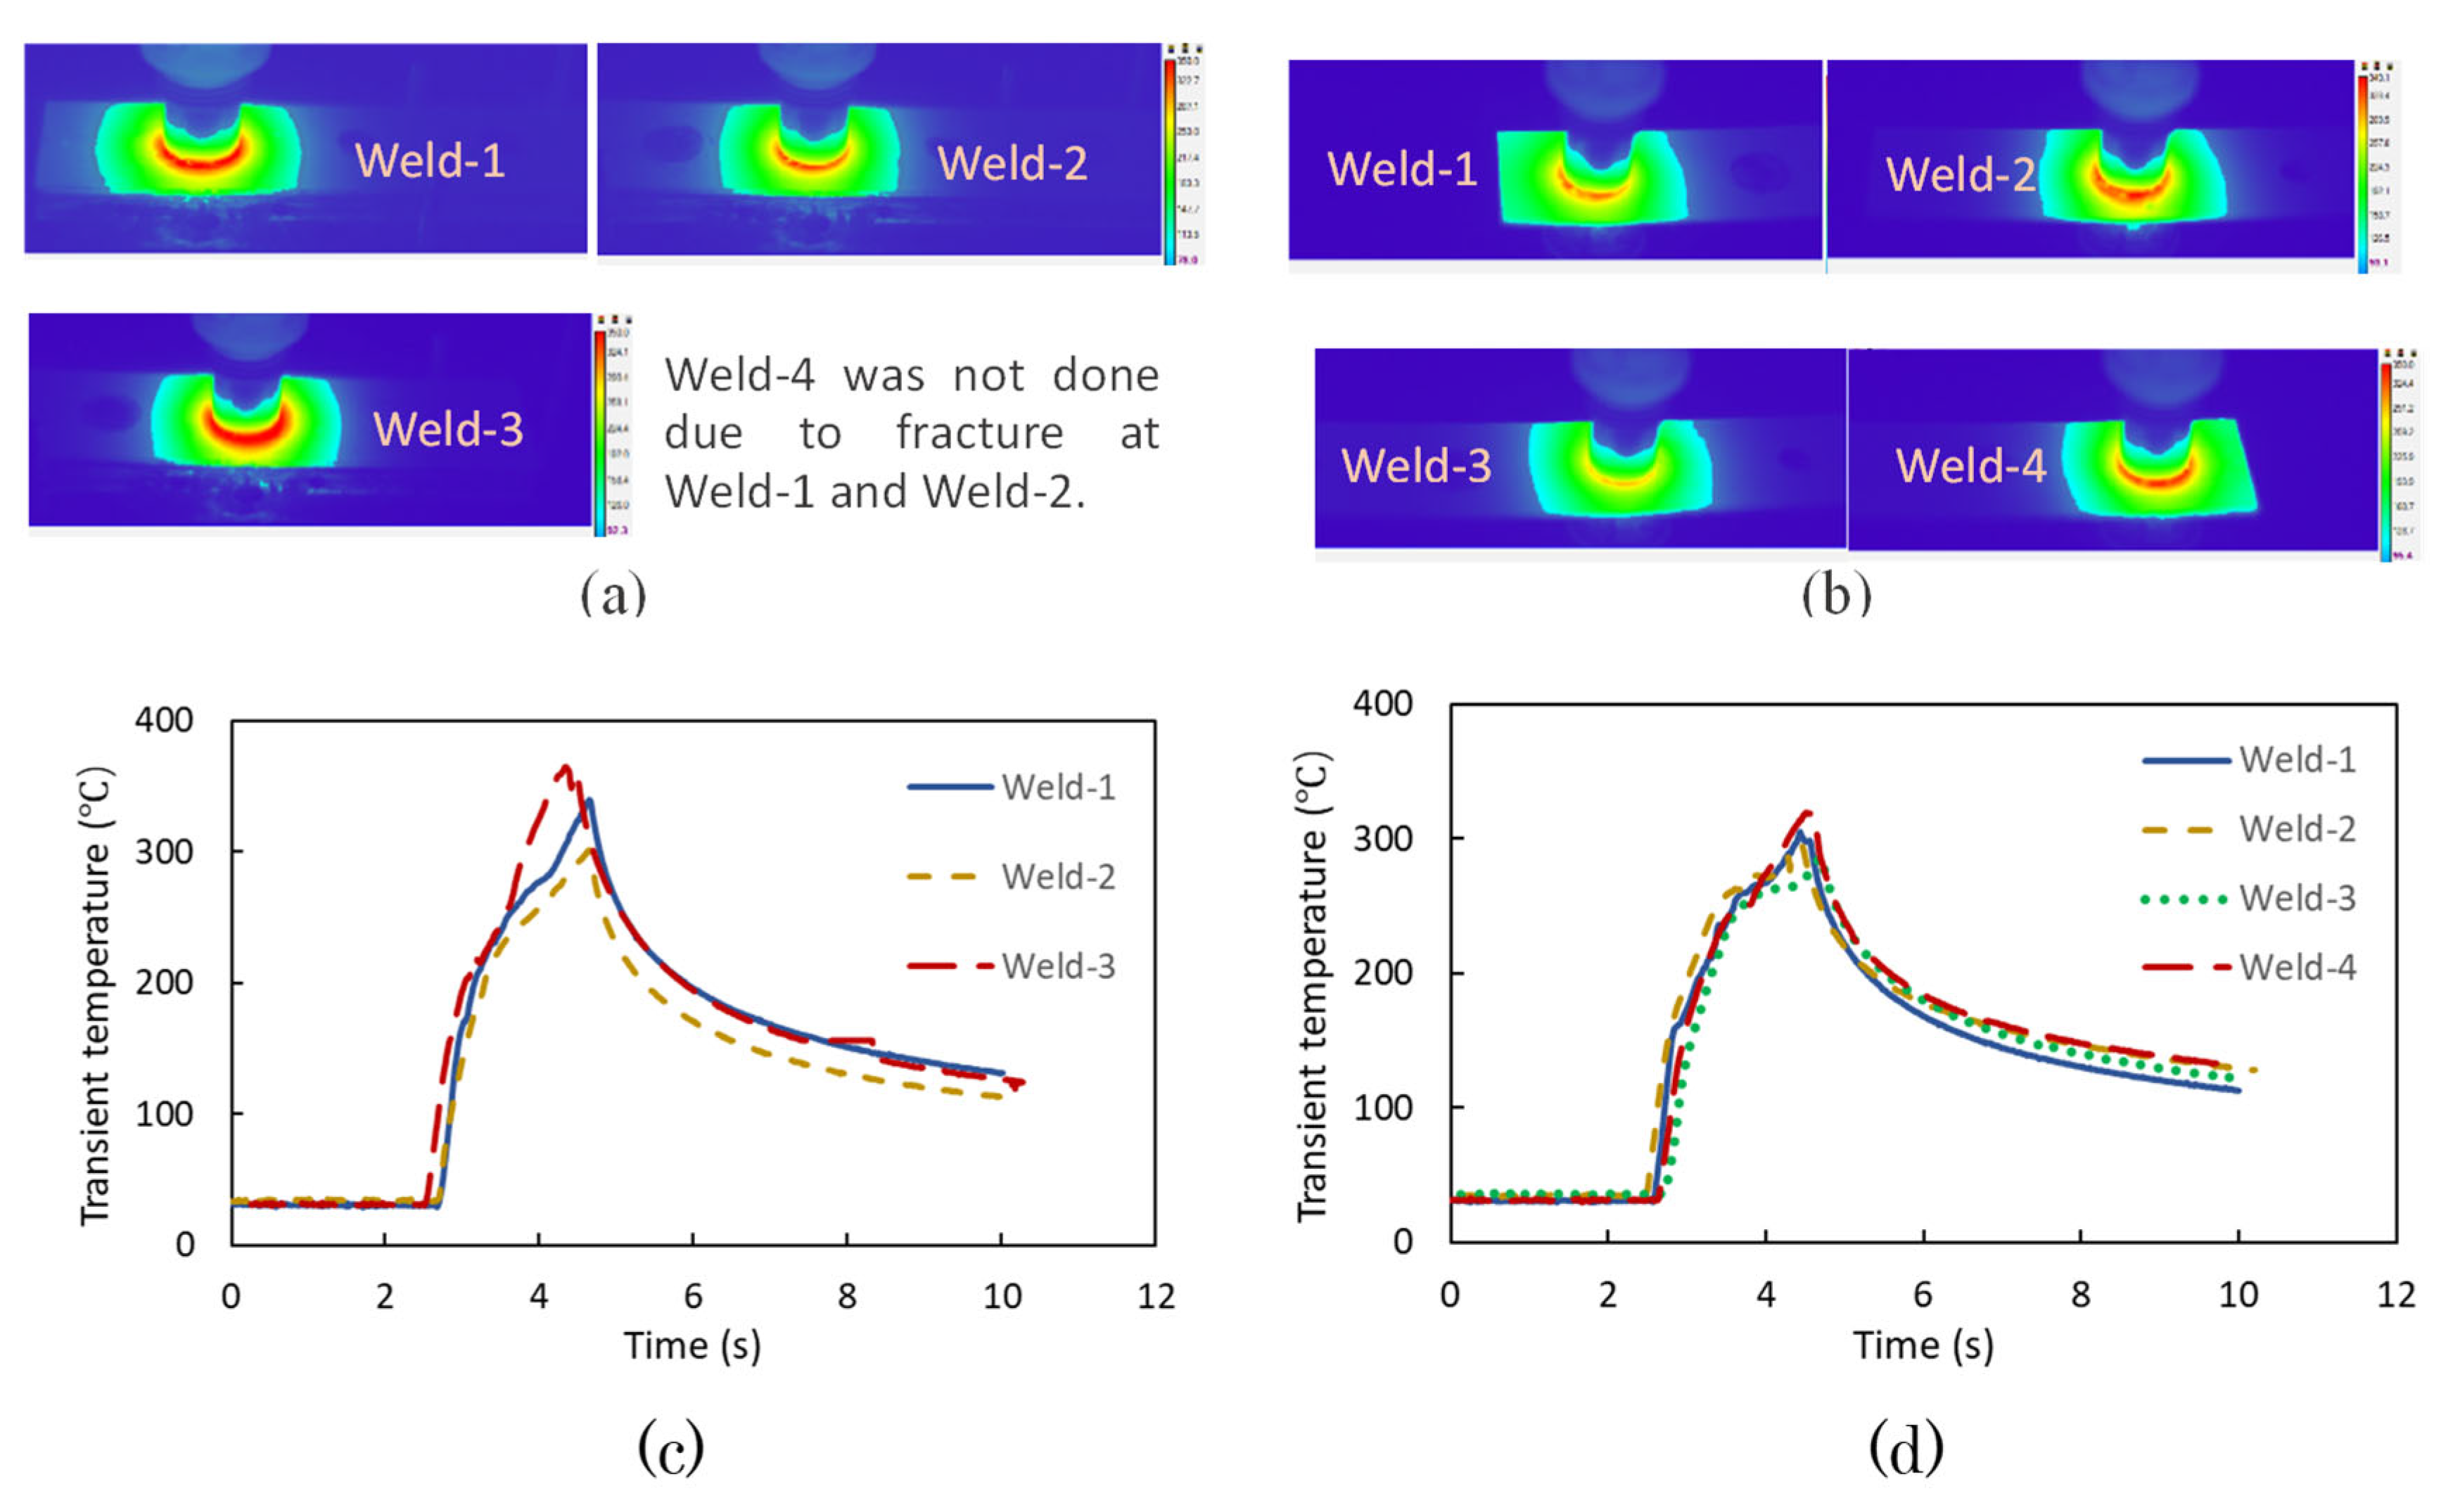
3.2. Hot Spot Phenomenon in Lightweight Material USW

Due to wave propagation and superposition, stress may concentrate at certain area of the weld component, showing as a “hot spot”. Such an area may result in a higher temperature increase than the periphery region due to strain energy dissipation. The occurrence of hot spots in the ultrasonic welding of a single joint is investigated using a numerical model and physical experiment.
An ultrasonic welding machine by Sonobond® with a fixed vibrational frequency of 20 kHz was employed in the present study. The welding machine has a maximum power of 3500 W and clamping pressure of 100 psi. The sonotrode tip has a round shape with a diameter of about 10 mm, and it was preset in the holder with the teeth on the contact surface parallel to the long edge of sheets, since the vibration direction is perpendicular to the long edge. The nominal clamp pressure of the USW machine was preset as 0.414 MPa (60 psi), and the actual load as calibrated was about 1300 N. The anvil has a cylinder shape (diameter D = 16mm) with many tiny sharp teeth on the top surface. Two AZ31 thin sheets in the same dimension (25.4 × 101.6 × 1.0 mm) were stacked up with the long edge aligned and overlapped at a distance of 35–45 mm. The surface of the two magnesium sheets was ground using SiC abrasive paper with a grit size of 80 to remove original painting and oxides. The top surface of the upper Mg sheet was sprayed with high-emissivity painting to facilitate the infrared (IR) measurement. The welding location had the same distance to the two long edges of the top sheet. The Mg sheets were welded under a welding power of 2000 W and processing time of 2.5 s with the ultrasonic welding machine and sonotrode. IR imaging was employed to record the overall surface temperature evolution during USW.
The temperature of the test coupon at 1.0 s is shown in Figure 9, with grayscale to highlight the temperature increase of the coupon. In addition, the cut-off temperature was set as 160 °C for comparison. The maximum temperature rise at the hot spot area can be as high as 50 °C. Through offsetting the top sheet −5 mm or +5 mm, the hot spot can be avoided. The numerical model has reproduced well the stress concentration on the edge, with maximum stress over 200 MPa far exceeding the yield strength of AZ31, which is about 160 MPa.
A similar phenomenon is observed in Al alloy USW, as shown in Figure 10. At an overlap distance of about 40 mm, hot spots appeared on the two edges of the top Al sheet, corresponding well with those in the Mg–Mg weld scenario. This is because the two materials have very similar acoustic speed at room temperature, and the geometric dimension of the sheets as well as the sonotrode vibration direction are the same. More interestingly, a visible crack was observed in the hot spot region of one specimen, probably due to low-cycle fatigue from ultrasonic vibrations. In addition to changing overlap area of the two sheets, the joining location, vibration direction and thickness of metal sheets can be investigated with the developed modal analysis tool to avoid such hot spot and crack consequences. Compared with the 3D thermal-mechanical FEA, the modal analysis is much more efficient since each case is analyzed within several minutes.
The hot spot phenomenon which occurred in the USW of a Mg alloy sheet and an Al alloy sheet is summarized in Table 2. It is clear that the overlap length or extension length of the top sheet has a decisive role in triggering the hot spots. In this case, an analytical solution is hard to find for the transverse vibration due to the 2D feature of the problem. With the modal analysis tool, the welding condition can be pre-screened in order to avoid the critical length configuration. To compare the modeling results and experimental measurement quantitatively, the distances of hot spots relative to the sonotrode center are listed in Table 3 for both Mg and Al sheets USW. The measured distances according to IR imaging are about 30–32 mm and those obtained through model prediction are 28–33 mm, showing good agreement between the two approaches. The high stresses induced by ultrasonic vibration are mainly due to the bending deformation in the transverse direction (or sonotrode vibration direction), which is probably close to the anti-node position of the sheets.
The clamping fixture can be used to mitigate the hot spots induced by ultrasonics, as shown in Figure 11. The fixtures were represented by solid elements in the model, and a fixed boundary condition was applied on the outer surface, while a contact condition was applied on the inner surface. A static analysis of pressure loading was carried out first, followed by the harmonic excitation modal analysis. The numerical results of modal analysis predict much lower principal stress (max. 20 MPa) in the top sheets under two symmetric fixtures. This is because the frictional force is exerted on the free ends of the sheets to limit vibration. The bending deformation in the vibration direction is greatly reduced; hence, the in-plane stress is also controlled to a much lower level. Such a prediction successfully explains the observation in the experiment, which achieved crack-free specimens. This kind of close fixture is necessary in multiple spot welds to protect both the base material and existing welds. Recent work by Becker and Balle [25] is a good example to make use of fixtures to weld two spots on the same coupon.

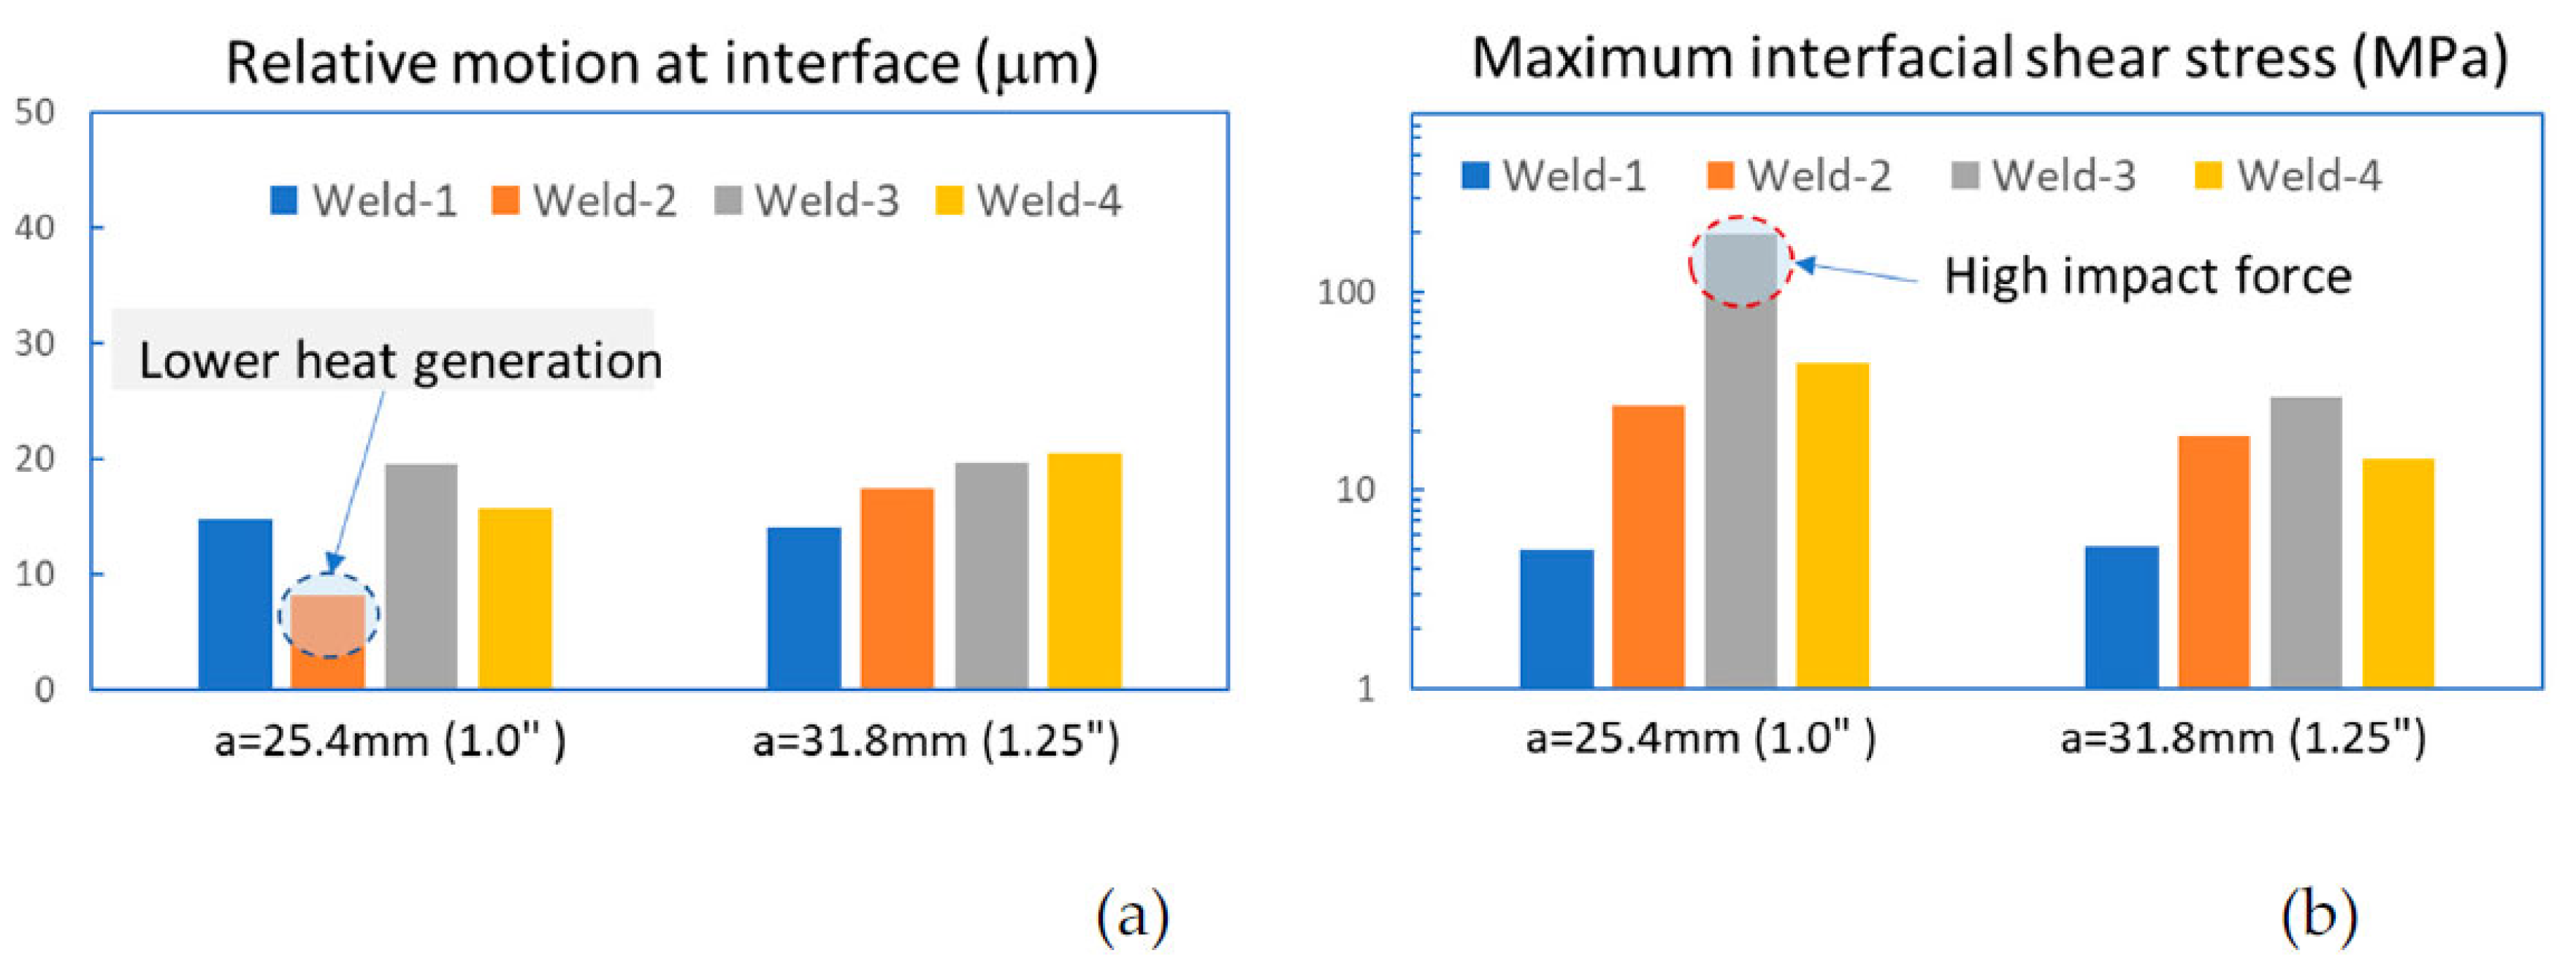
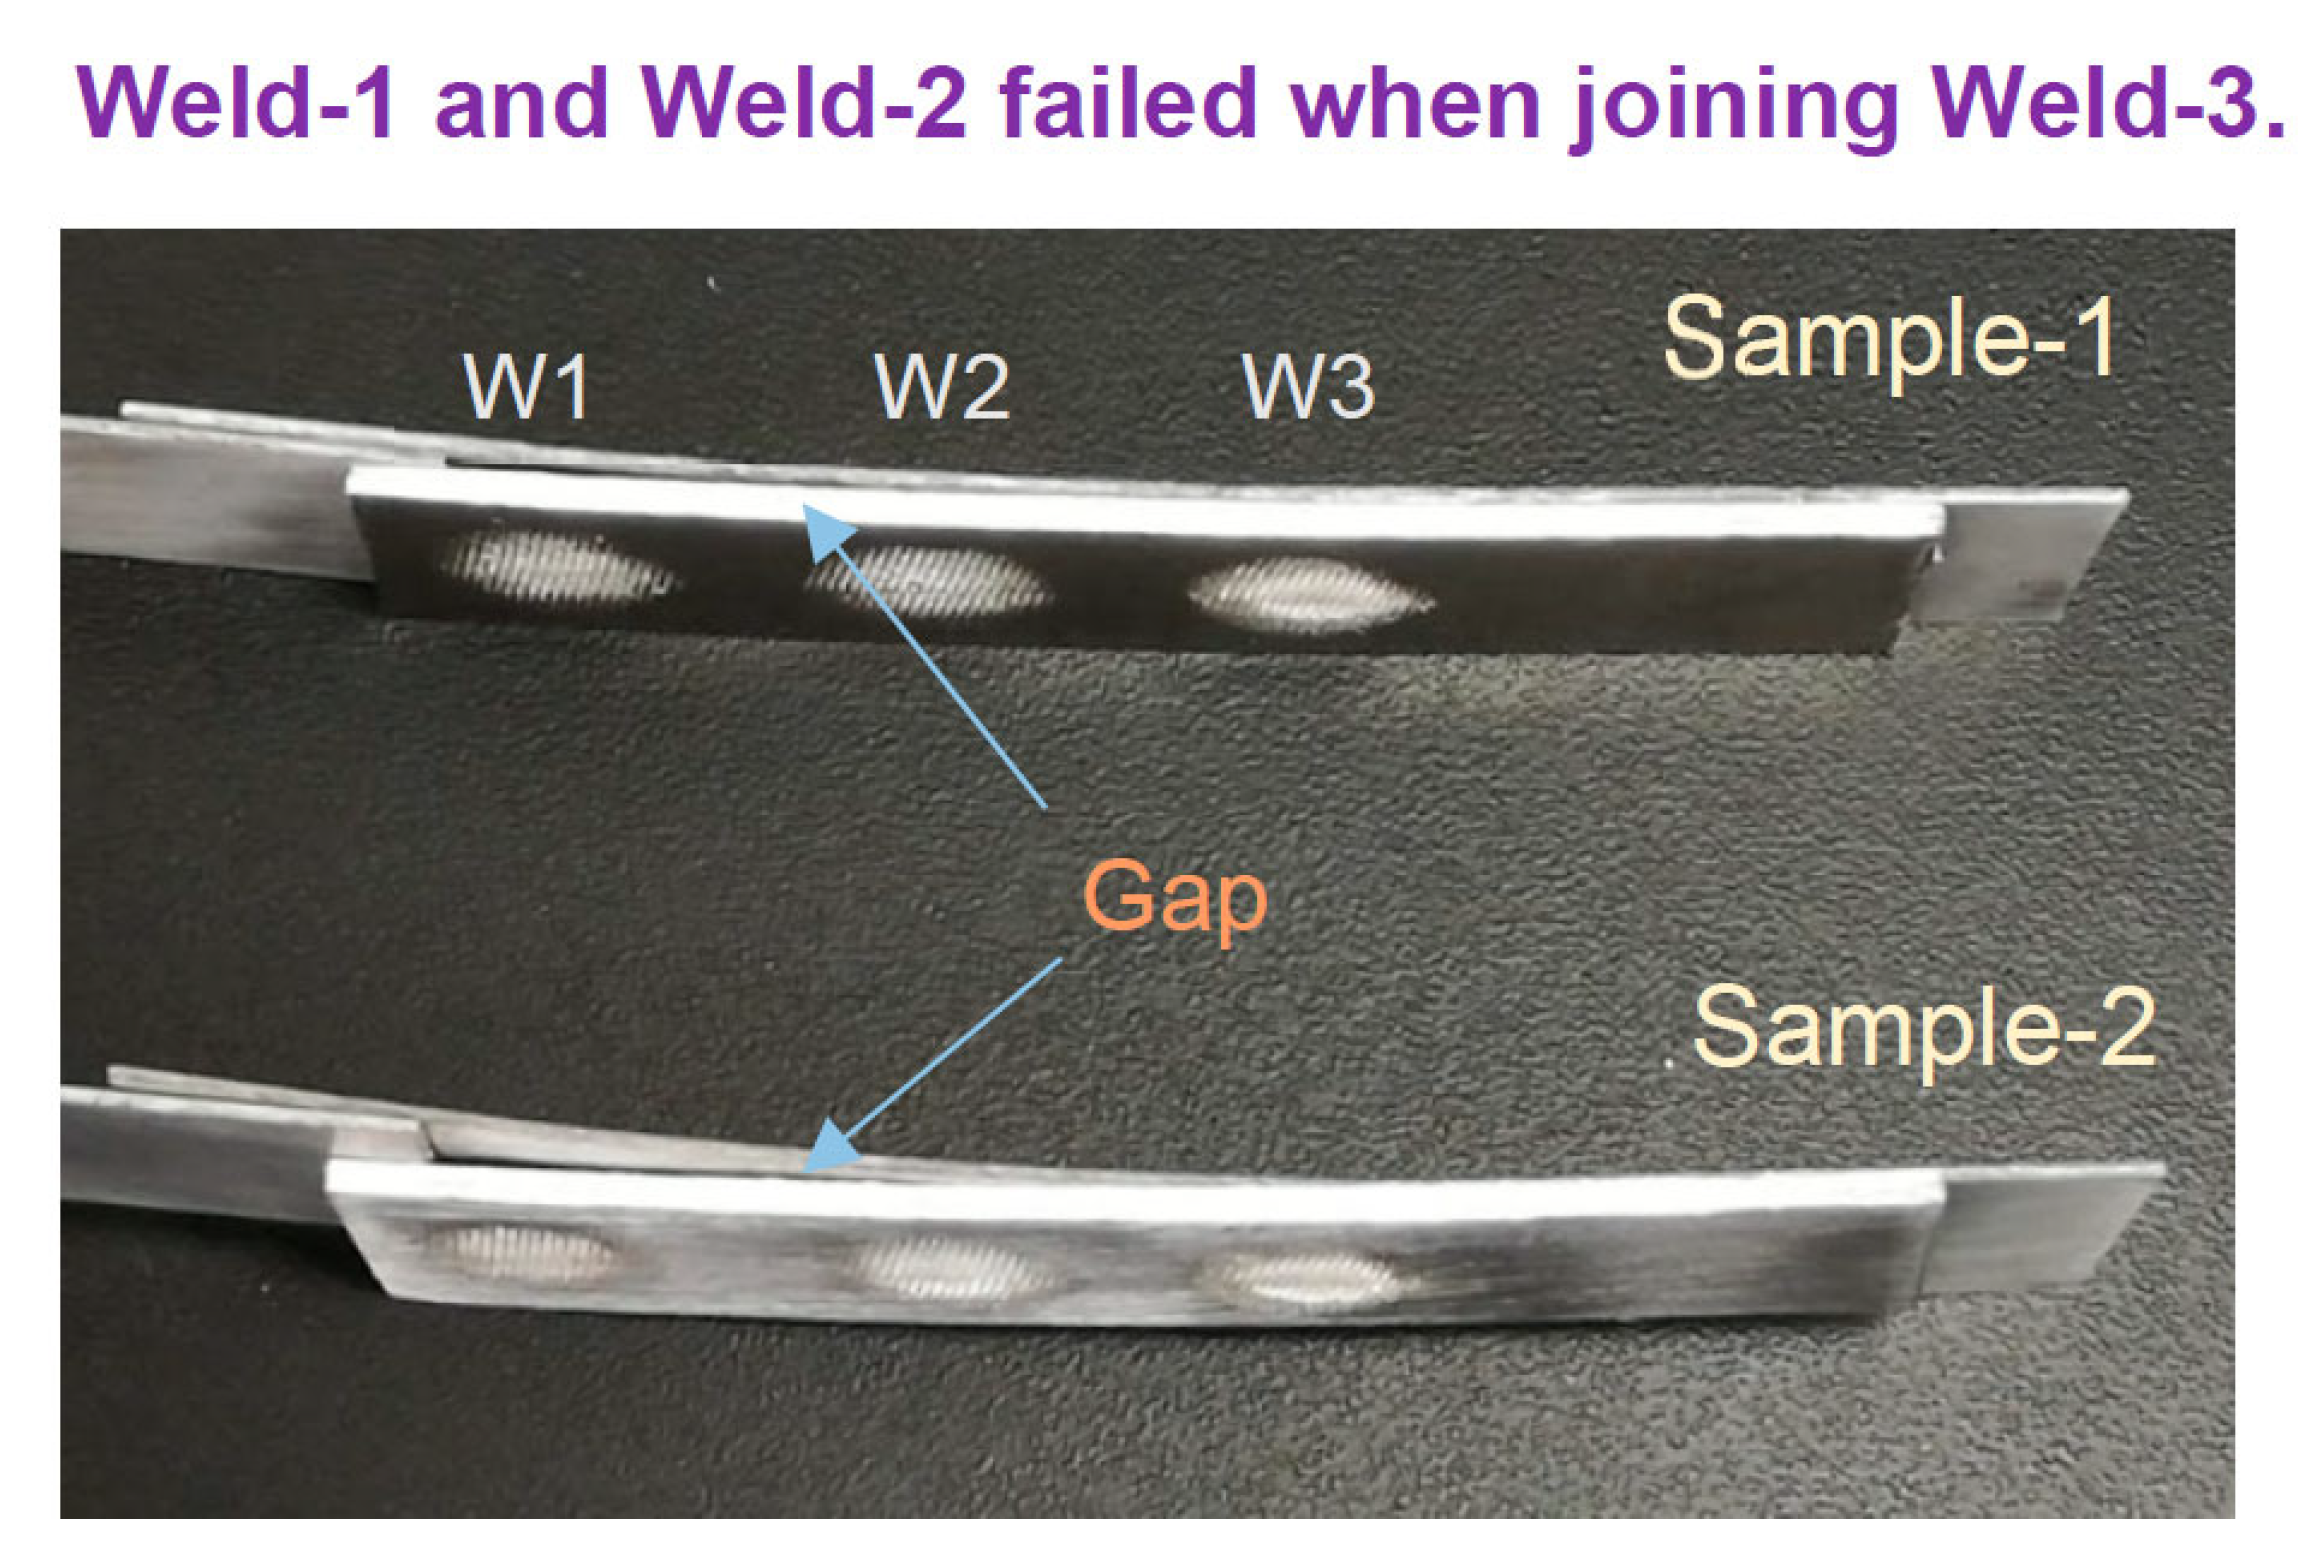
3.3. Mg Alloy Multi-Spot Welding

The multi-spot joining of Mg to Mg, as shown in Figure 12a, was analyzed by means of modal analysis. The effect of weld spacing on ultrasonic joining performance was investigated. The length of the top sheet is 127 mm (5″), which is half the wavelength of Mg material. Two cases with different weld spacing were numerically studied with the developed modal analysis tool. The first case has even spacing with a = 25.4 mm (1″) among the four weld spots. The second case has even spacing with a = 31.8 mm (1.25″) among the four weld spots. Each model starts from a bond-free condition, and a tie constraint will be added between the faying surfaces if the location has been ultrasonically joined. The relative motion at the current joining interface and shear stresses at the previously joined interface will be used as two indicators for USW performance evaluation.
For the case of spacing equal to 25.4 mm, the contour of the vibration amplitude when joining at locations Weld-2 and Weld-3 is plotted in Figure 12b. The relative motion between faying surfaces at Weld-2 is apparently smaller than that at joining location Weld-3. Furthermore, the interfacial shear stress during ultrasonic welding is predicted for each joint location as shown in Figure 12c. When USW is performed at location Weld-3, the peak stress induced during previous welds is much higher than the lap-shear strength of a USW joint, which is typically below 60 MPa [10,25]. Thus, bond failure can occur, especially when the existing welds are not strong.
Figure 13 is a bar chart that summarizes the relative motion at the current weld interface as well as the peak shear stress recorded in adjacent welds when joining a spot weld. From the modeling results in Figure 13a, the case with weld spacing equal to 25.4 mm shows a large variation in relative motion, while the four spot welds in the case with a = 31.8 mm all have a similar level of interfacial motion. From the stress analysis results in Figure 13b, the welding design with weld spacing equal to 25.4 mm is more likely to generate a detrimental stress wave during spot welding at location Weld-3. If the interfacial stress induced by ultrasonics is up to 100–200 MPa, the spot welds basically cannot survive under such high impact force. On the other hand, the design with weld spacing equal to 31.8 mm has a maximum shear stress below 50 MPa in all four welds.
Figure 14 shows the temperature distribution as captured using an IR camera when the pre-setting ultrasonic welding time is about to expire in the two cases of Mg sheet joining with different spacing. The measured peak temperature in the first case with a spacing of 25.4 mm reached about 350 °C in weld spots 1 and 3, whereas that in welding spot 2 was slightly below 300 °C. Such an observation is consistent with the modal analysis prediction of relative motion. On the other hand, the case with weld spacing 31.8 mm exhibits relatively uniform peak temperatures among the four locations, which are also indicated by the numerical results in Figure 13a. The temperature history profiles for the location 6 mm away from the edge are put together in Figure 14c,d. It should be noted that the start time for temperature increase is adjusted to align with the first weld spot in order to facilitate the comparison of the peak temperatures. The temperature in Weld-3 of the 25.4 mm case differs from other profiles in terms of heating rate change and higher peak temperature, which is probably due to the variation in structural constraint during welding.
Figure 15 is the side view of the welded samples with spacing of 25.4 mm, showing the debonding phenomenon at Weld-1 and Weld-2. The gap was enlarged through inserting a 1 mm thick sheet material between the top and bottom Mg sheets. Such fracture behavior at the joint interface is the result of a weak bond due to small relative motion and high impact force induced by ultrasonic vibration, which is consistent with modal analysis. On the other hand, ultrasonic welding with a spacing of 31.8 mm yielded coupons without failure of the weld spots. This is evidenced by the predicted relatively uniform interfacial vibration and low shear stresses at the four weld locations. In future studies, clamping/fixture should be modeled with appropriate contact modeling to isolate the vibration dynamics in the joining area. Large-field high-frequency imaging is necessary to visualize the vibration mode and amplitude. Fixture design guided by computational models will play a key role in advancing ultrasonic spot welding for various metals and alloys. Meanwhile, the optimization of welding energy [20,25] and inclusion of the interlayer [3] can also be applied to improve the joint strength to enable multi-spot welding, especially for dissimilar materials.

4. Concluding Remarks

A finite element modal analysis method has been developed for investigating structural responses in the ultrasonic welding process. The model considers essential features such as clamping load, sheet interaction and friction force. Relative motion at the faying surfaces of the materials to be joined are predicted under given sonotrode force. The following conclusions can be drawn based on modeling results and experimental observations:
(1)
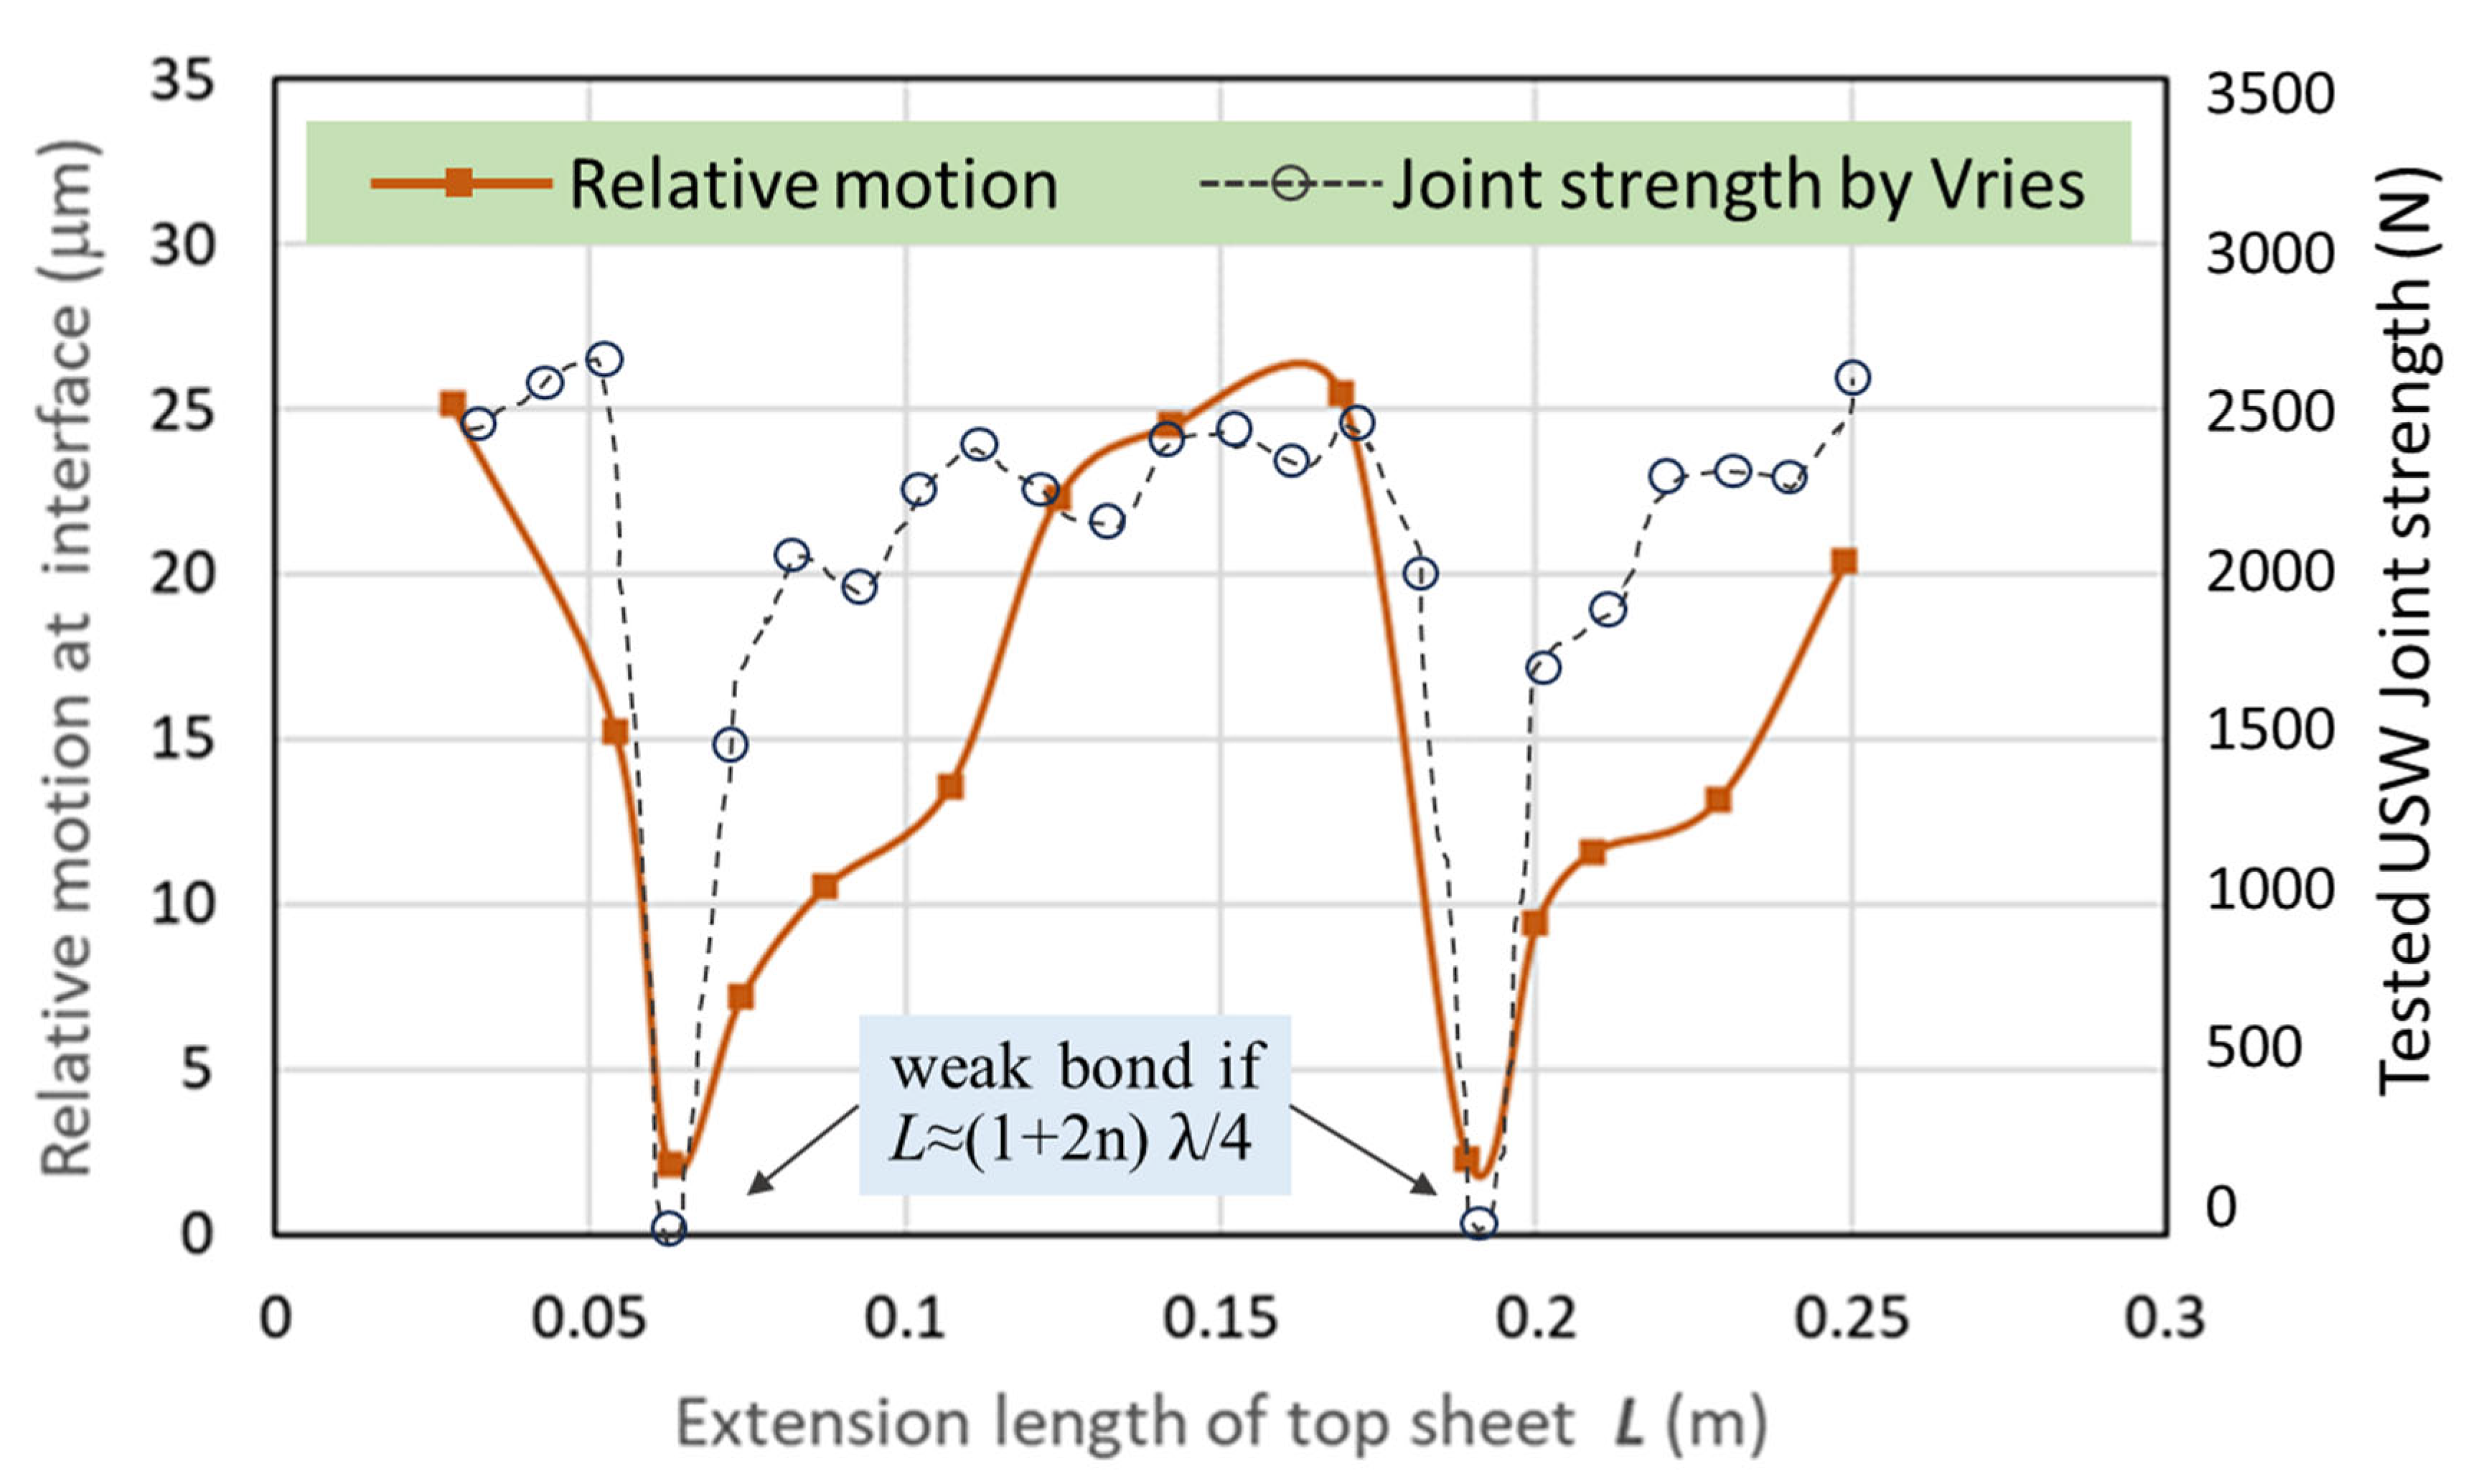
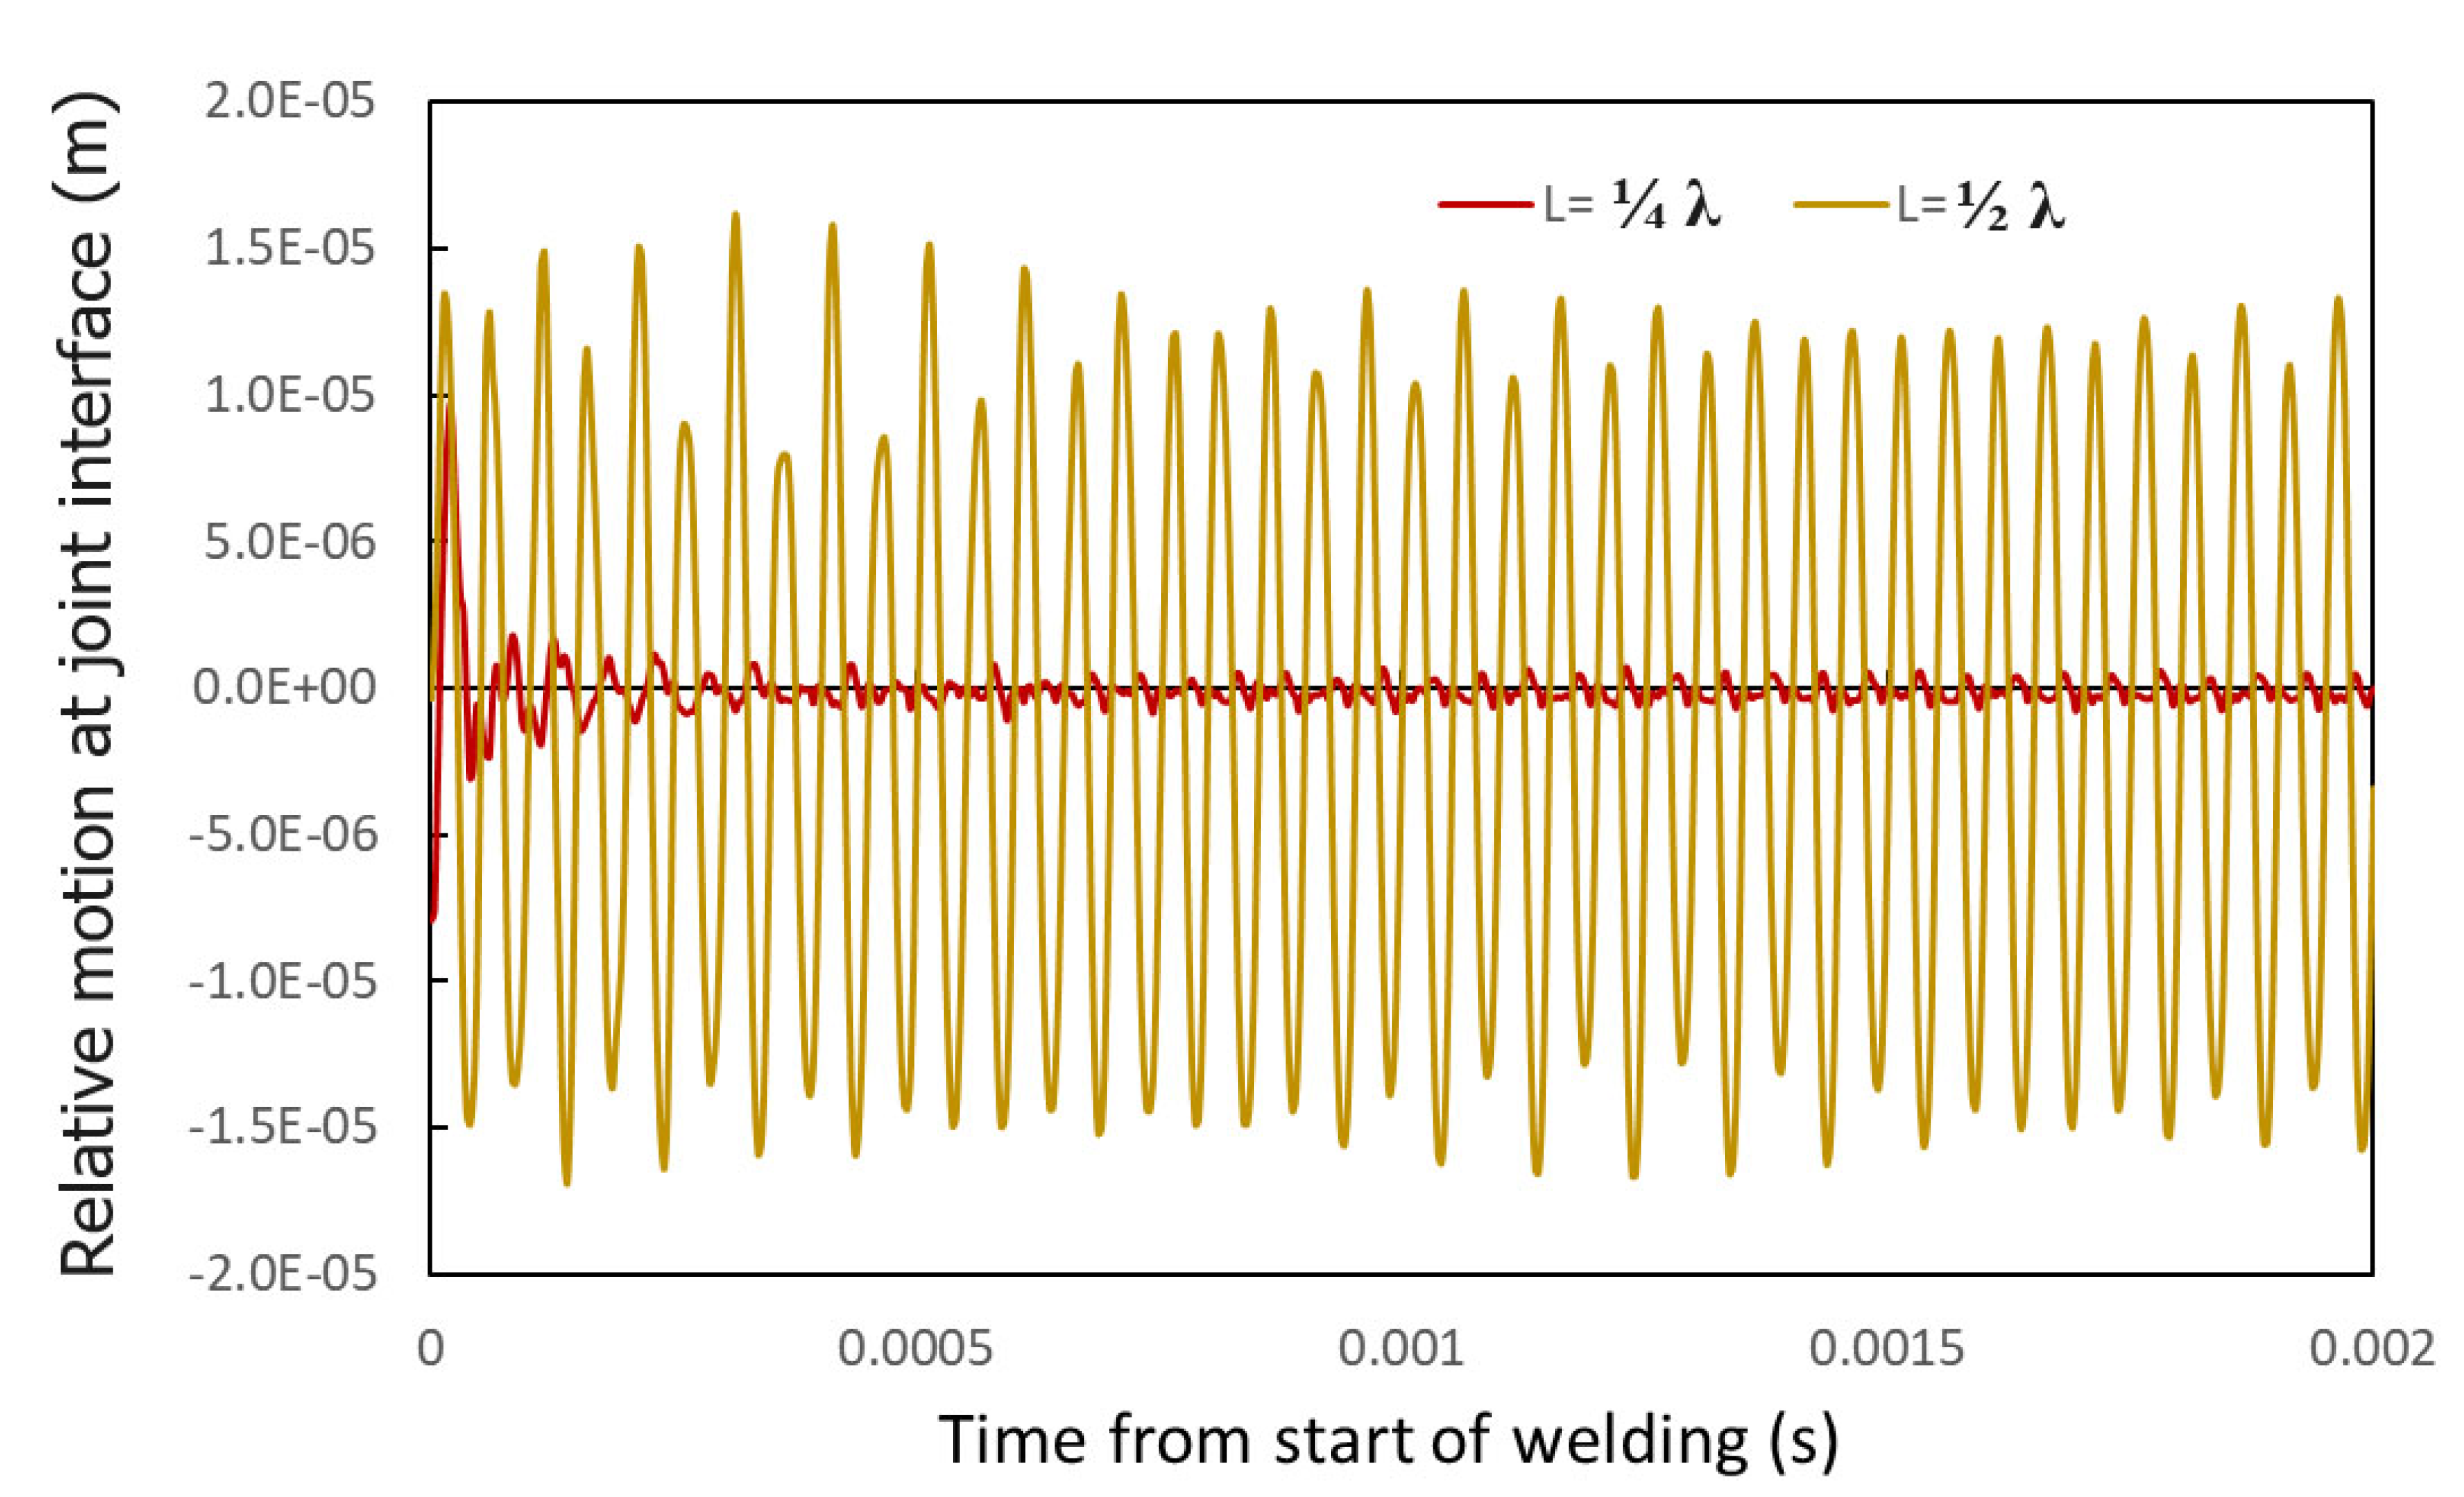
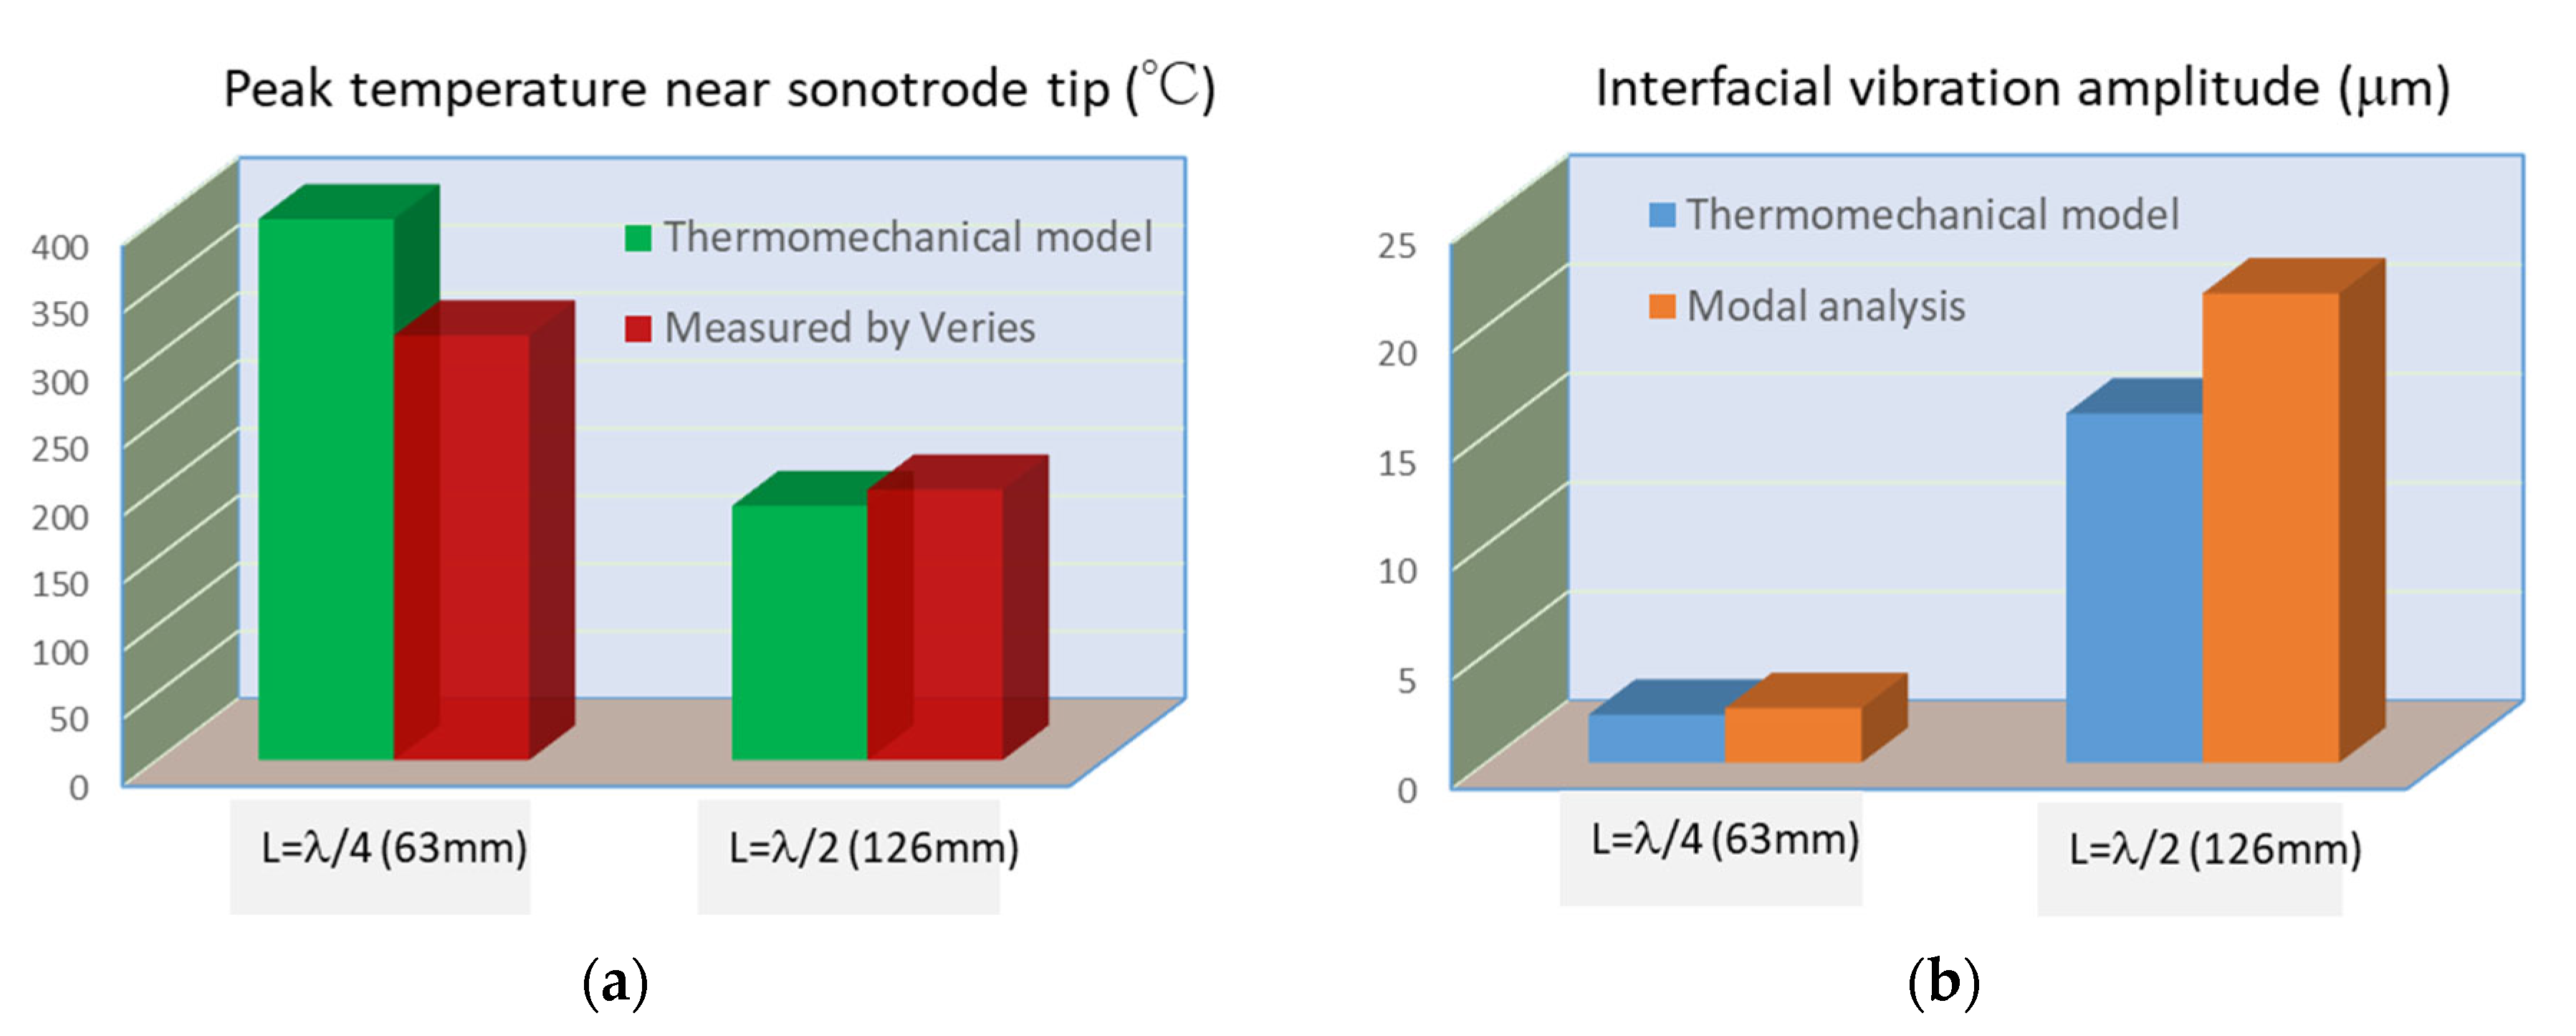
The vibration predicted from the modal analysis has good correlation with the 3D transient thermomechanical analysis. When the sonotrode is applied near the node position of the global vibration mode, much lower relative motion and heat generation are predicted. On the other hand, a large amount of heat generation and relative motion are produced for the coupon with an extension length of anti-node vibration.
(2)
Compared with coupled thermomechanical analysis, modal analysis offers a far more efficient path to evaluate the joining capability and efficiency under the assumption of elasticity and steady-state response. Only a few minutes were needed for modal analysis to complete a prediction.
(3)
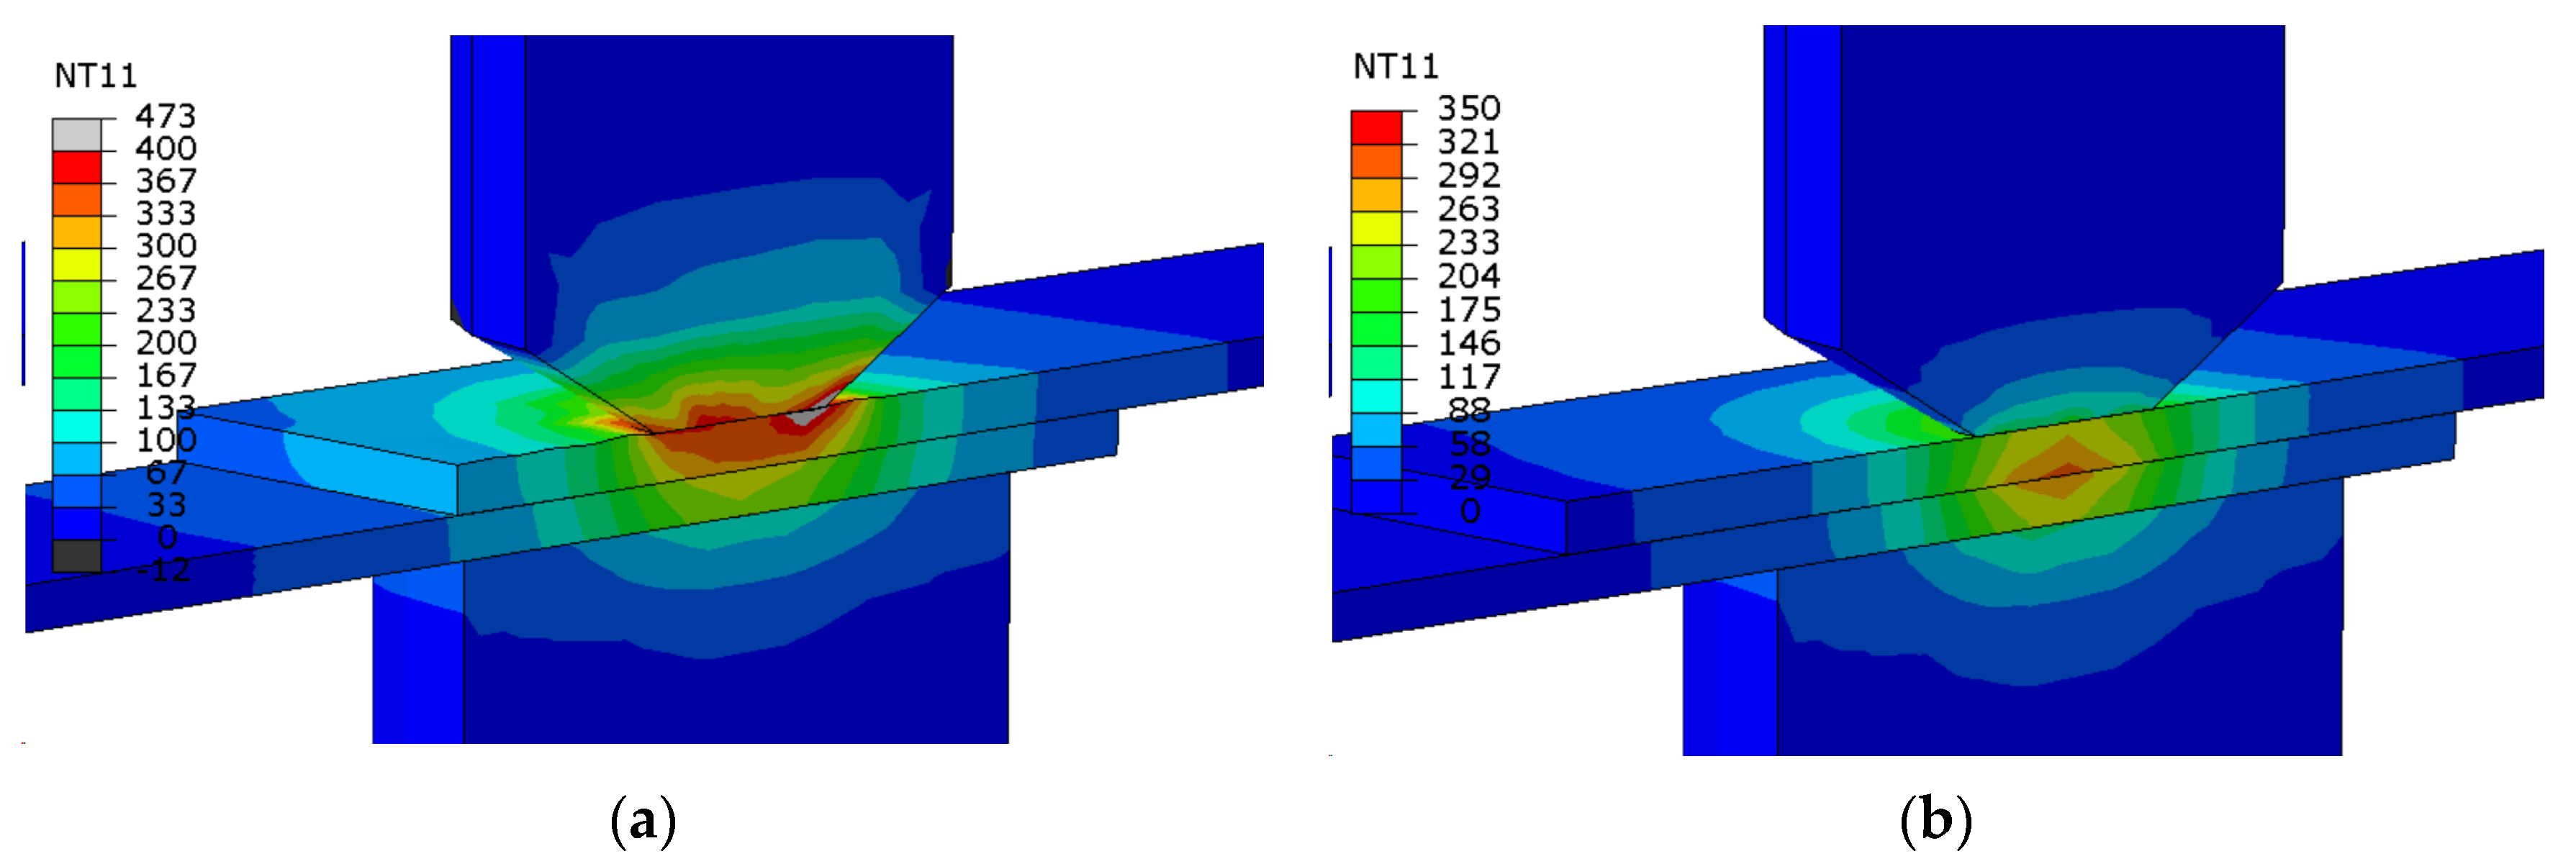
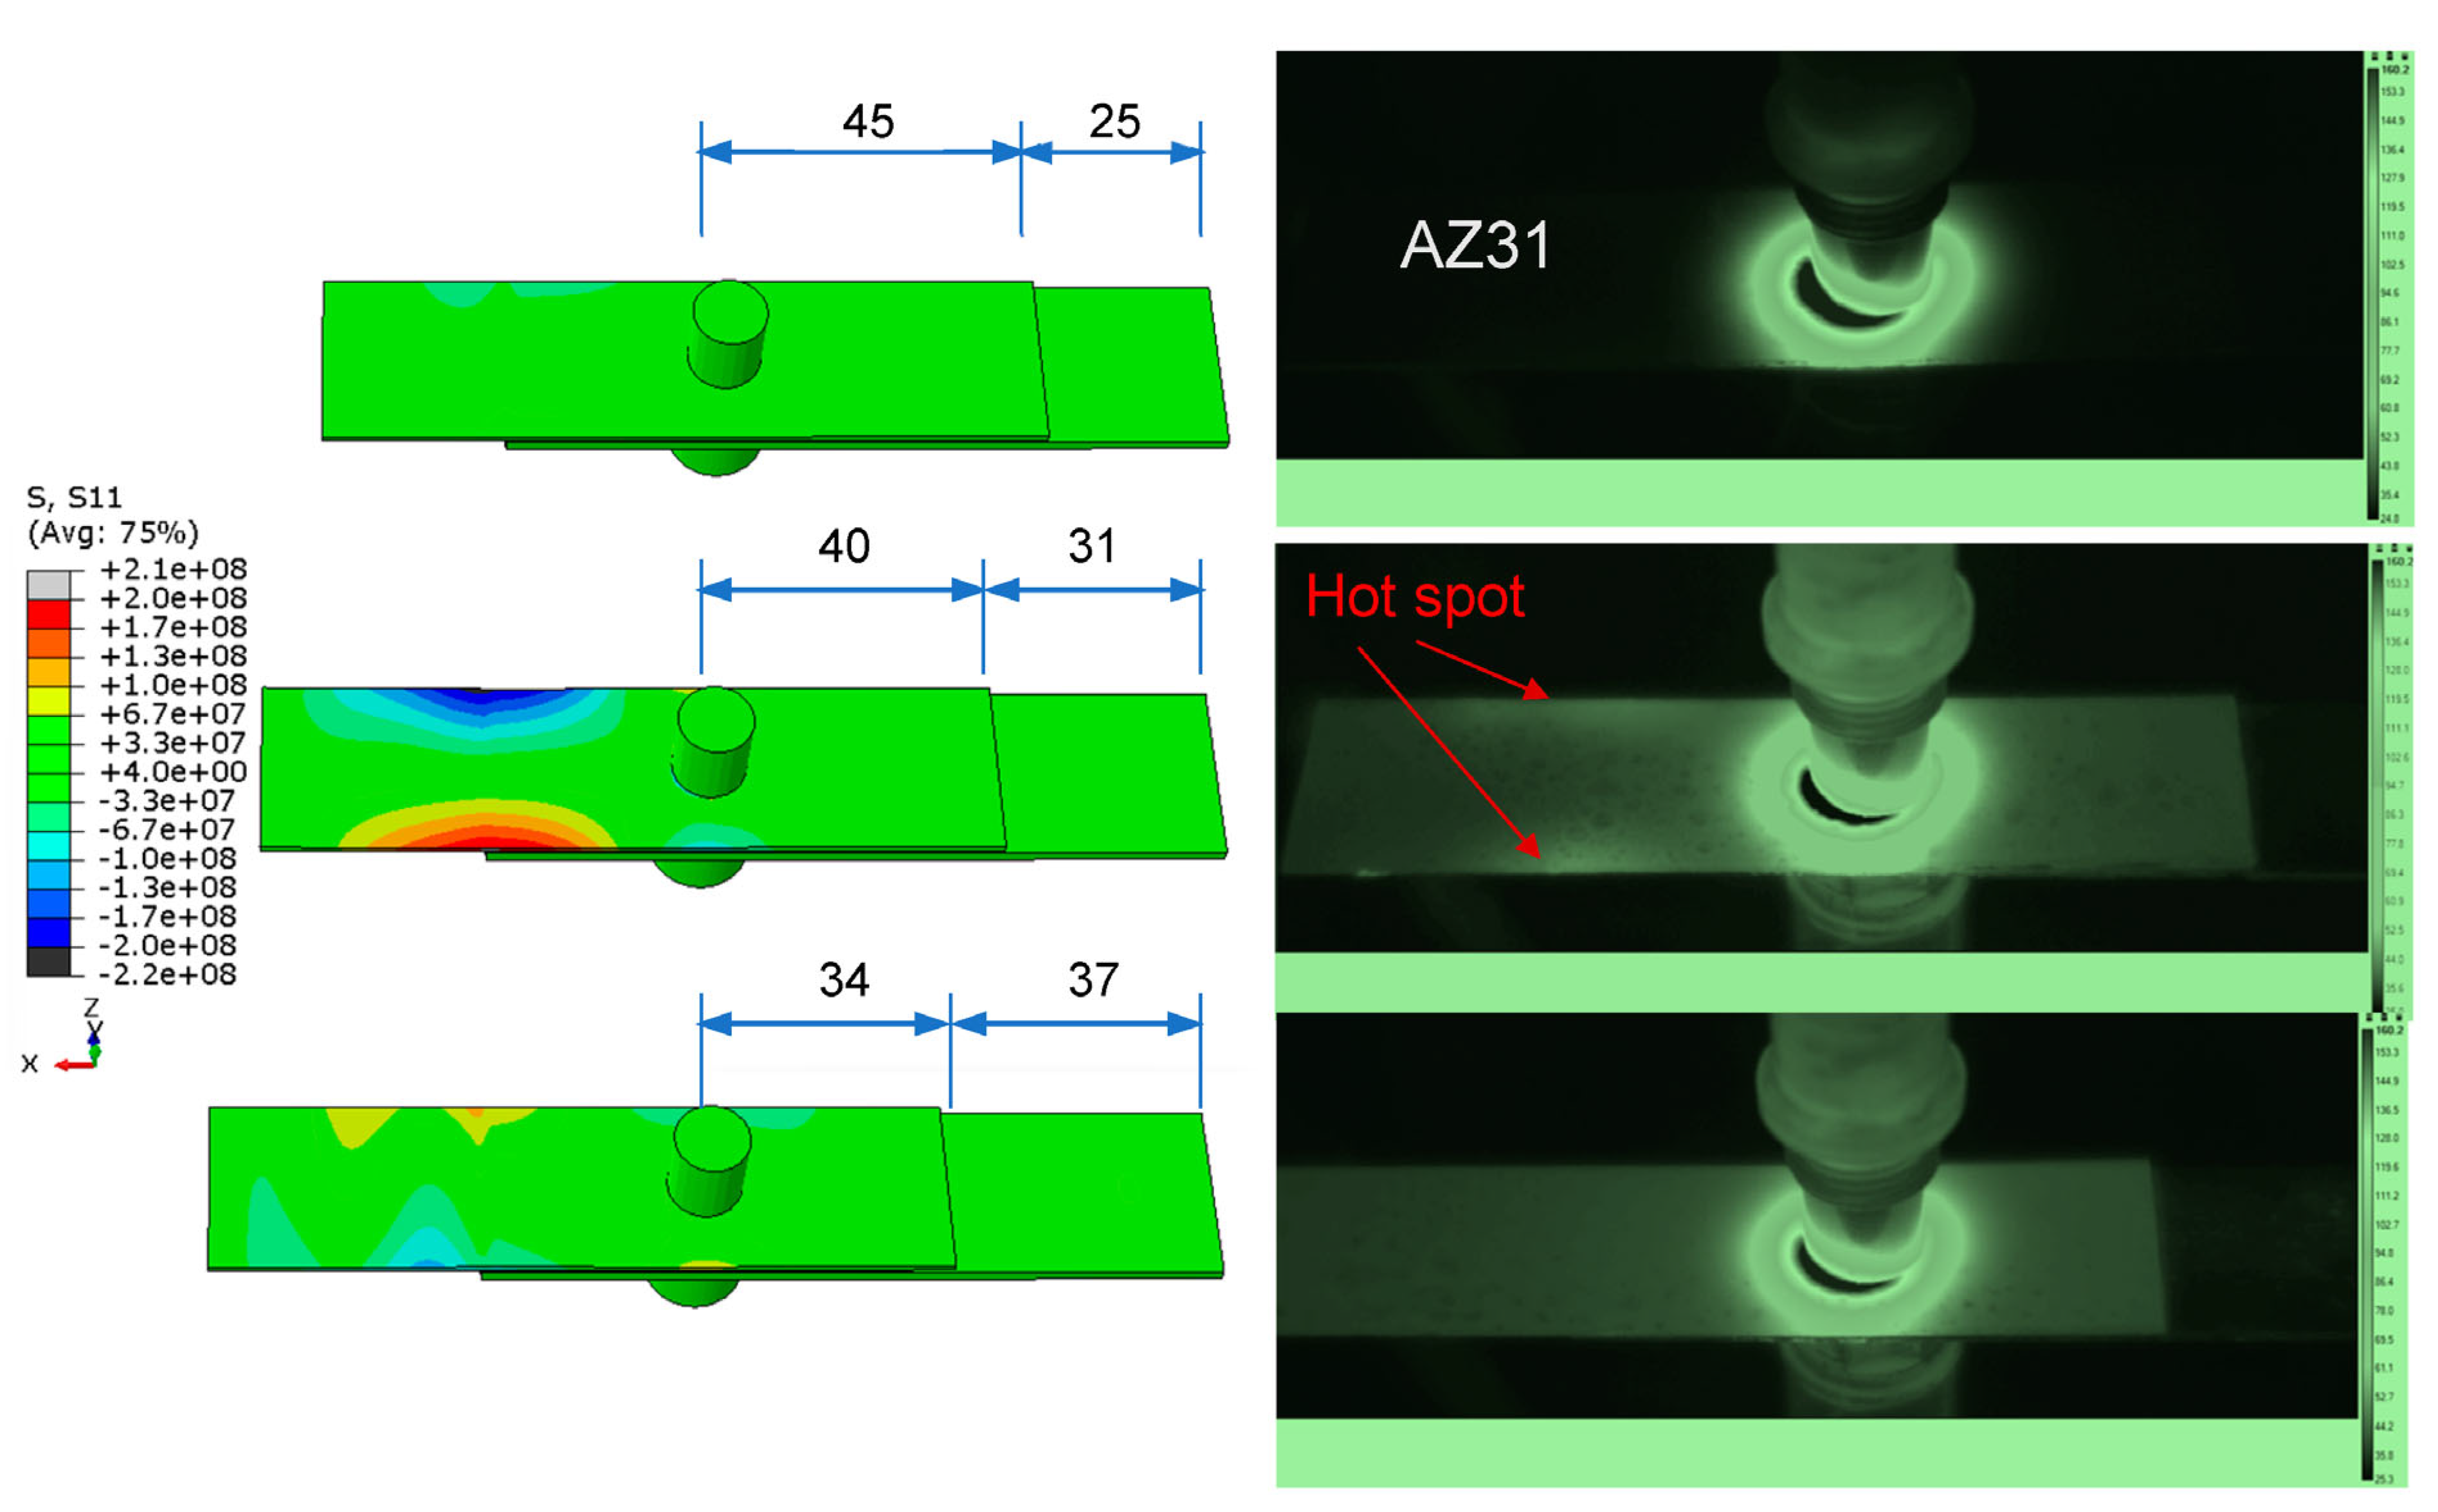
The developed modal analysis tool also provides detailed information about structural stress concentration during ultrasonic welding. Hot spots have been observed in the USW of Mg alloy and Al alloy at the condition predicted using the numerical model, which can be related to crack occurrence in lightweight metal joining.
(4)
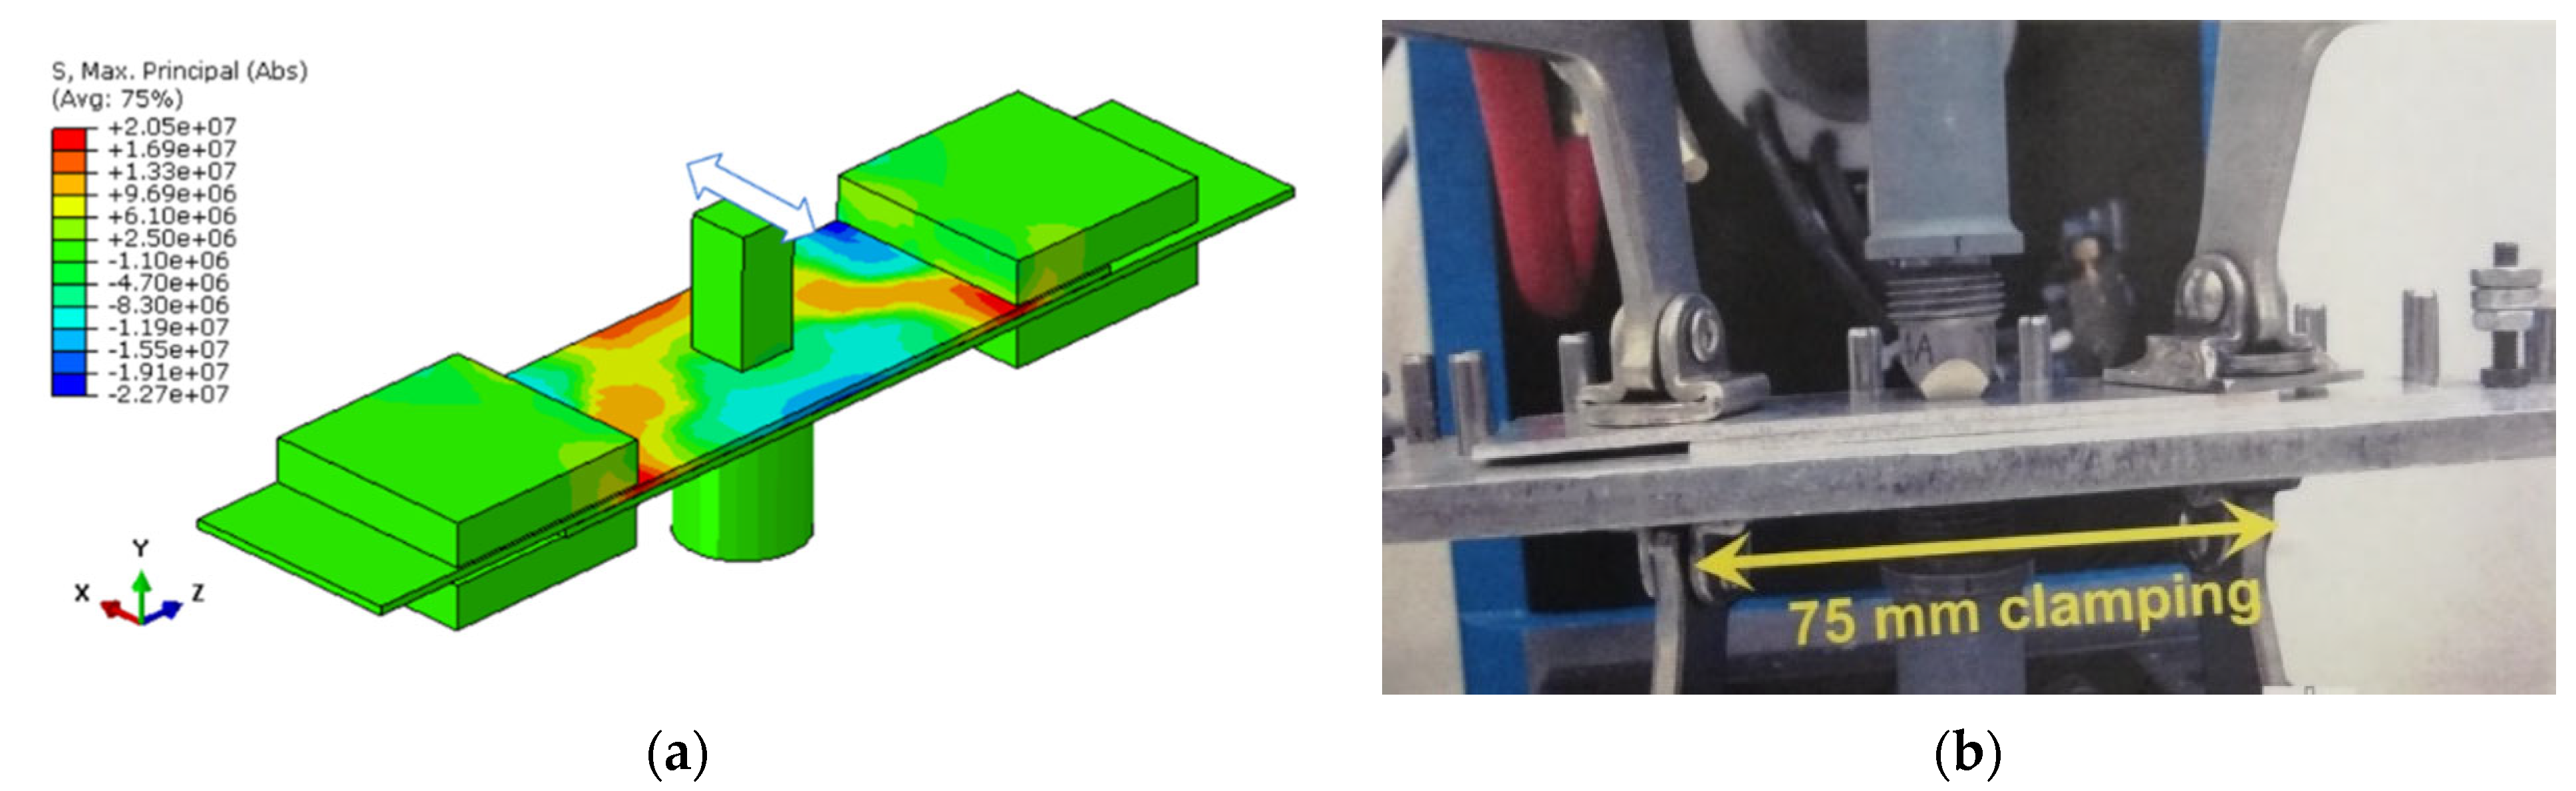
With the aid of modal analysis, hot spots can be pre-screened, and the welding condition can be optimized by means of changing overlap length or applying clamping fixtures.
(5)
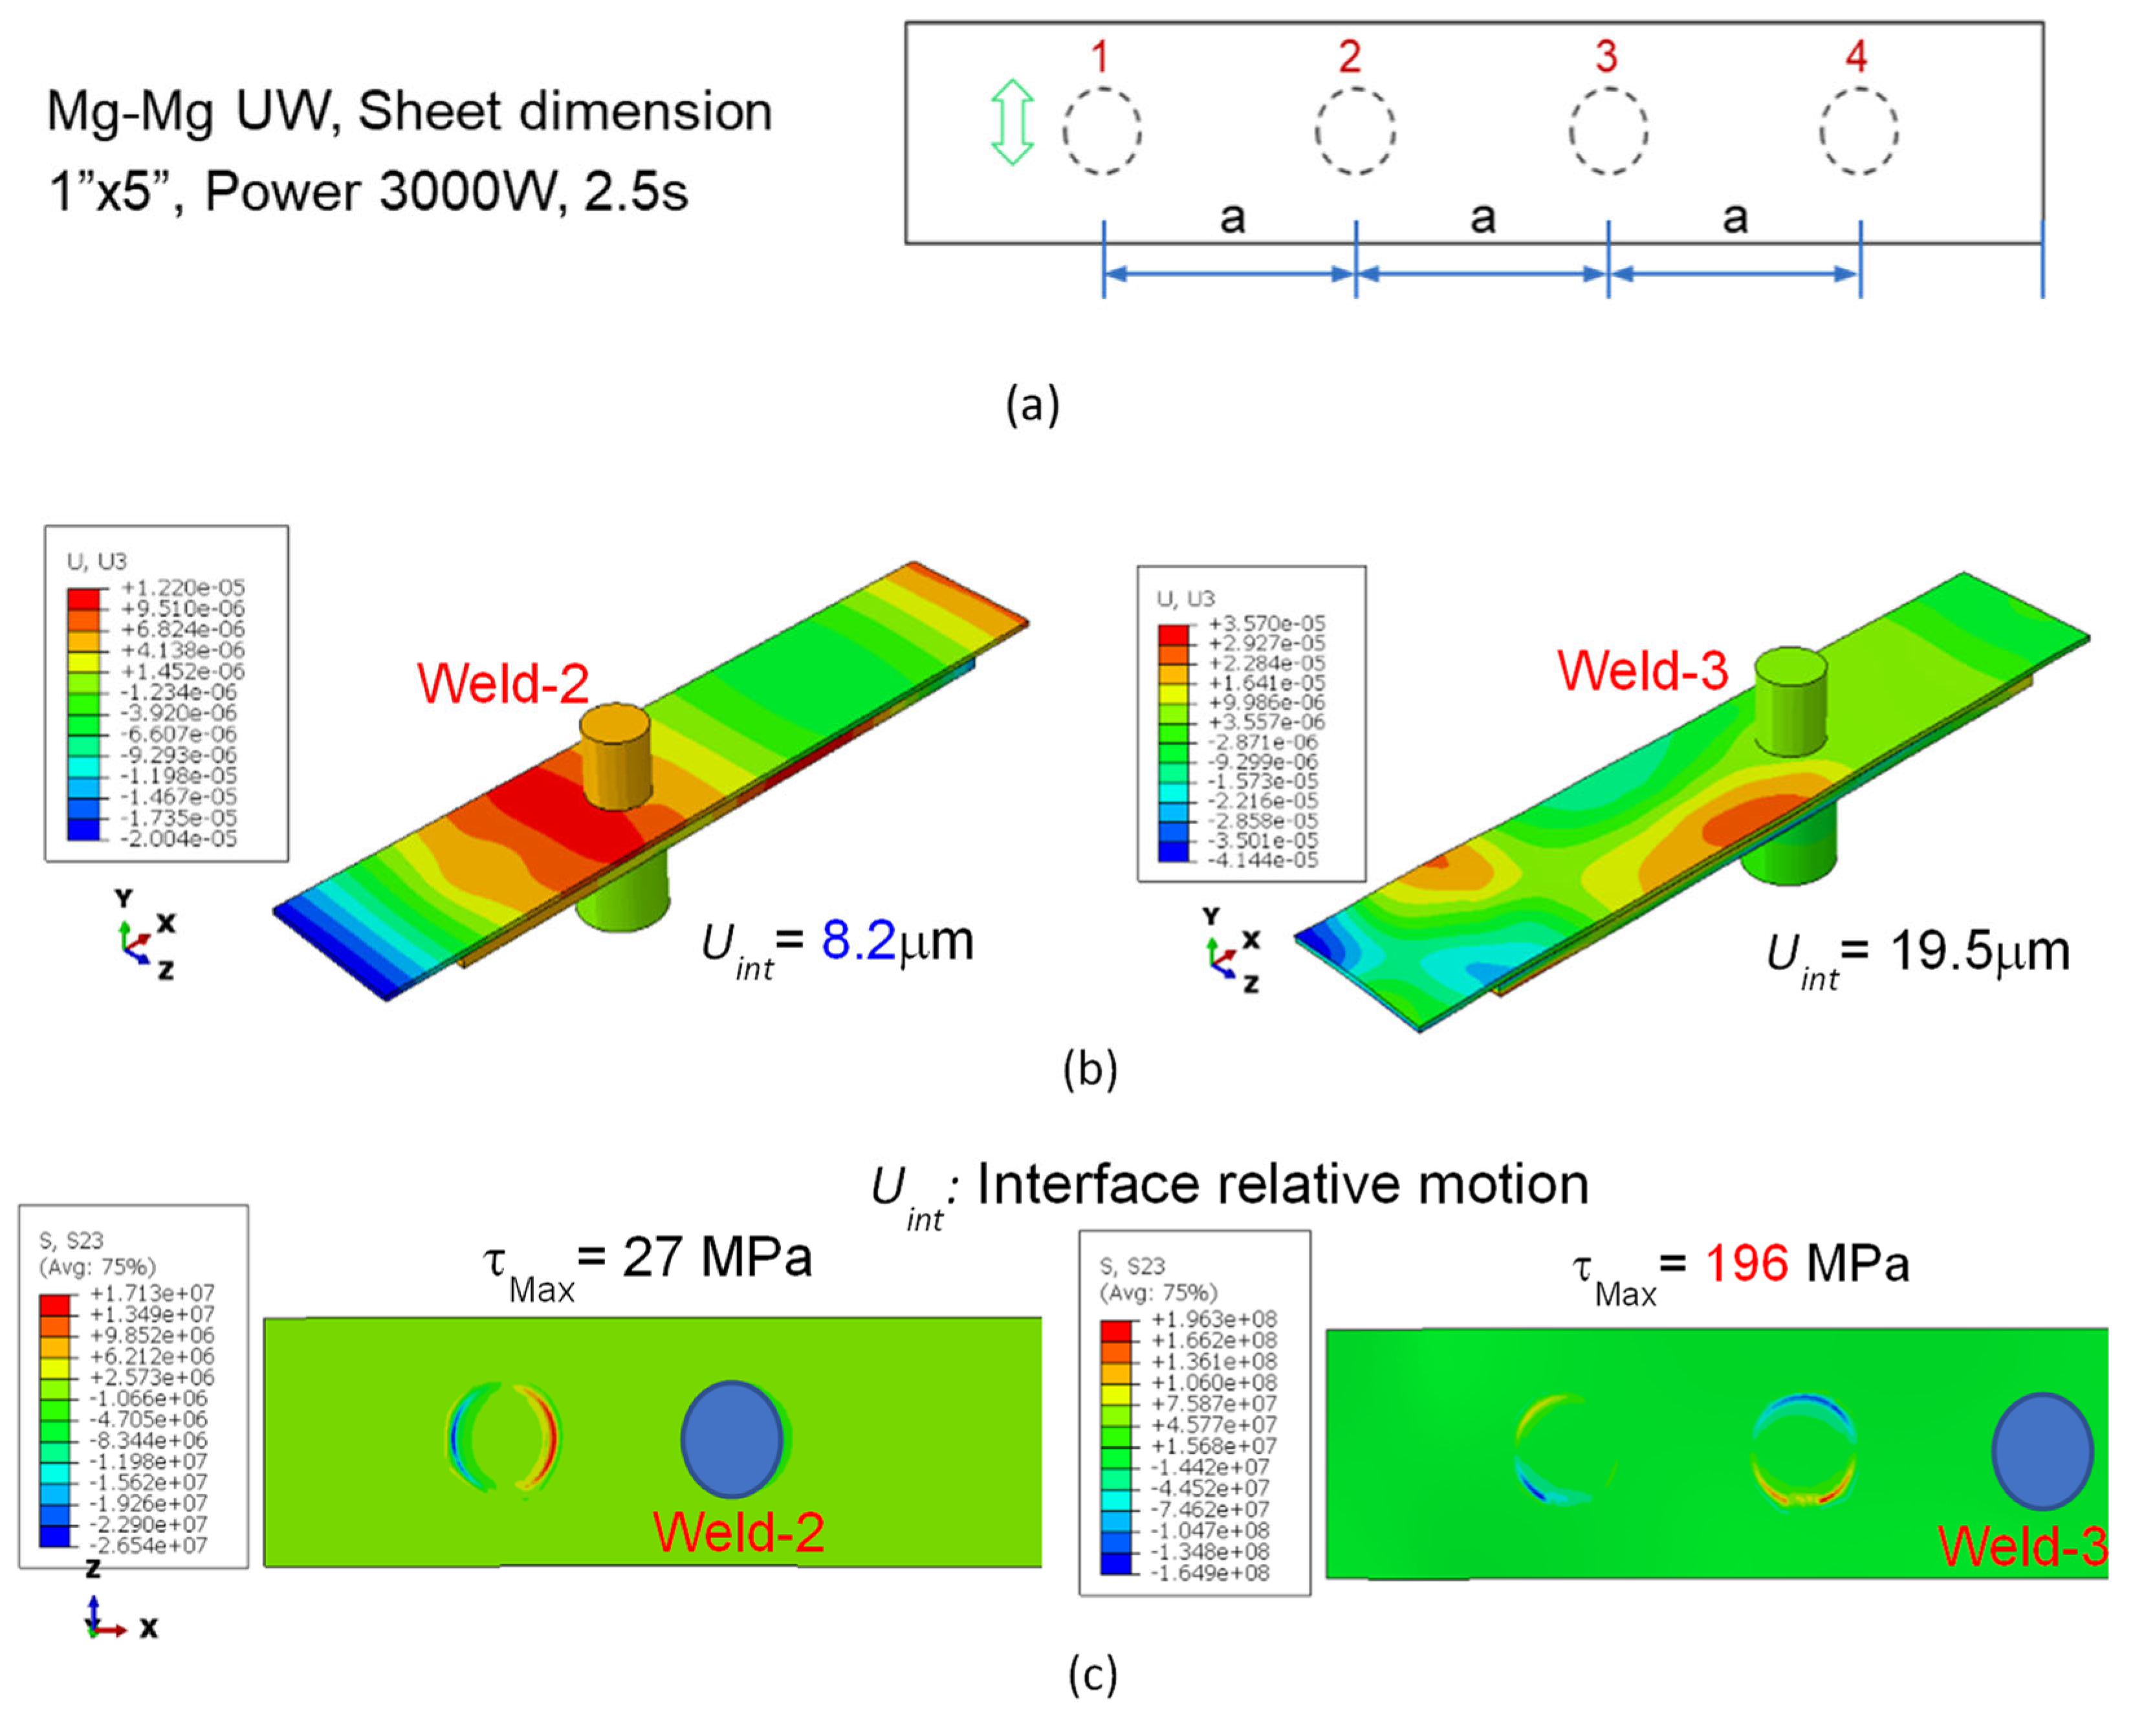
Multi-spot welding of Mg-alloy thin sheets was simulated via modal analysis, which successfully revealed high shear stress in the sheet with shorter weld spacing as validated by the fracture behavior in the existing bond. Weld spacing can be optimized to avoid high impact force to achieve multiple joints on the same work piece.

Author Contributions

Conceptualization, H.H. and Z.F.; methodology, H.H. and J.C.; investigation, H.H., J.C., Z.F. and X.S.; writing—original draft preparation, H.H., J.C. and X.S.; writing—review and editing H.H., J.C., Z.F. and X.S. All authors have read and agreed to the published version of the manuscript.

Funding

This research was funded by the US Department of Energy, Office of Energy Efficiency and Renewable Energy, Vehicle Technologies Office, under a prime contract DE-AC05-00OR22725.

Data Availability Statement

Research data is available based on individual request.

Conflicts of Interest

The authors declare no conflict of interest.

Notice of Copyright

This manuscript has been authored by UT-Battelle, LLC, under contract DE-AC05-00OR22725 with the US Department of Energy (DOE). The US government retains and the publisher, by accepting the article for publication, acknowledges that the US government retains a nonexclusive, paid-up, irrevocable, worldwide license to publish or reproduce the published form of this manuscript, or allow others to do so, for US government purposes. DOE will provide public access to these results of federally sponsored research in accordance with the DOE Public Access Plan (http://energy.gov/downloads/doe-public-access-plan, accessed on 8 October 2023).

References

  1. Matsuoka, S.-I.; Imai, H. Direct welding of different metals used ultrasonic vibration. J. Mater. Process. Technol. 2009, 209, 954–960. [Google Scholar] [CrossRef]
  2. Rubino, F.; Parmar, H.; Esperto, V.; Carlone, P. Ultrasonic welding of magnesium alloys: A review. Mater. Manuf. Process. 2020, 35, 1051–1068. [Google Scholar] [CrossRef]
  3. Zhang, W.; Ao, S.; Oliveira, J.P.; Li, C.; Zeng, Z.; Wang, A.; Luo, Z. On the metallurgical joining mechanism during ultrasonic spot welding of NiTi using a Cu interlayer. Scr. Mater. 2020, 178, 414–417. [Google Scholar] [CrossRef]
  4. De Leon, M.; Shin, H.-S. Weldability assessment of Mg alloy (AZ31B) sheets by an ultrasonic spot welding method. J. Am. Acad. Dermatol. 2017, 243, 1–8. [Google Scholar] [CrossRef]
  5. Kleinbaum, S.; Jiang, C.; Logan, S. Enabling sustainable transportation through joining of dissimilar lightweight materials. MRS Bull. 2019, 44, 608–612. [Google Scholar] [CrossRef]
  6. Siddiq, A.; Ghassemieh, E. Thermomechanical analyses of ultrasonic welding process using thermal and acoustic sof-tening effects. Mech. Mater. 2008, 40, 982–1000. [Google Scholar] [CrossRef]
  7. Zhang, C.; Li, L. A coupled thermal-mechanical analysis of ultrasonic bonding mechanism. Met. Mater. Trans. B 2009, 40, 196–207. [Google Scholar] [CrossRef]
  8. Koyanagi, J.; Takamura, M.; Wakayama, K.; Uehara, K.; Takeda, S. Numerical simulation of ultrasonic welding for CFRP using energy director. Adv. Compos. Mater. 2022, 31, 428–441. [Google Scholar] [CrossRef]
  9. Huang, H.; Chen, J.; Lim, Y.C.; Hu, X.; Cheng, J.; Feng, Z.; Sun, X. Heat generation and deformation in ultrasonic welding of magnesium alloy AZ31. J. Am. Acad. Dermatol. 2019, 272, 125–136. [Google Scholar] [CrossRef]
  10. Chen, J.; Lim, Y.C.; Leonard, D.; Huang, H.; Feng, Z.; Sun, X. In situ and post-mortem characterizations of ultrasonic spot welded AZ31B and coated dual phase 590 steel joints. Metals 2020, 10, 899. [Google Scholar] [CrossRef]
  11. Huang, H.; Chen, J.; Cheng, J.; Lim, Y.C.; Hu, X.; Feng, Z.; Sun, X. Surface engineering to enhance heat generation and joint strength in dissimilar materials AZ31 and DP590 ultrasonic welding. Int. J. Adv. Manuf. Technol. 2020, 111, 3095–3109. [Google Scholar] [CrossRef]
  12. Seo, Y.-S.; Park, K. Direct patterning of micro-features on a polymer substrate using ultrasonic vibration. Microsyst. Technol. 2012, 18, 2053–2061. [Google Scholar] [CrossRef]
  13. Abdullah, A.; Pak, A. Correct prediction of the vibration behavior of a high power ultrasonic transducer by fem simulation. Int. J. Adv. Manuf. Technol. 2007, 39, 21–28. [Google Scholar] [CrossRef]
  14. Cardoni, A.; Lucas, M. Enhanced vibration performance of ultrasonic block horns. Ultrasonics 2002, 40, 365–369. [Google Scholar] [CrossRef] [PubMed]
  15. Daniels, H.P.C. Ultrasonic welding. Ultrasonics 1965, 3, 190–196. [Google Scholar] [CrossRef]
  16. De Vries, E. Mechanics and Mechanisms of Ultrasonic Metal Welding. Ph.D. Thesis, The Ohio State University, Columbus, OH, USA, 2004. [Google Scholar]
  17. Jagota, A.; Dawson, P.R. The influence of lateral wall vibrations on the ultrasonic welding of thin-walled parts. J. Eng. Ind. 1987, 109, 140–147. [Google Scholar] [CrossRef]
  18. Kang, B.; Cai, W.; Tan, C.-A. Dynamic stress analysis of battery tabs under ultrasonic welding. J. Manuf. Sci. Eng. 2014, 136, 041011. [Google Scholar] [CrossRef]
  19. ABAQUS. Abaqus Theory Manual, SIMULIA. Available online: http://130.149.89.49:2080/v6.14/books/stm/default.htm (accessed on 8 October 2023).
  20. Zhao, Y.Y.; Li, D.; Zhang, Y.S. Effect of welding energy on interface zone of Al–Cu ultrasonic welded joint. Sci. Technol. Weld. Join. 2013, 18, 354–360. [Google Scholar] [CrossRef]
  21. Yovanovich, M.M. Four decades of research on thermal contact, gap, and joint resistance in microelectronics. IEEE Trans. Compon. Packag. Technol. 2005, 28, 182–206. [Google Scholar] [CrossRef]
  22. Misra, P.; Nagaraju, J. Thermal gap conductance at low contact pressures (<1 MPa): Effect of gold plating and plating thickness. Int. J. Heat Mass Transf. 2010, 53, 5373–5379. [Google Scholar]
  23. Ueda, Y.; Murakawa, H.; Ma, N. Welding Deformation and Residual Stress Prevention; Elsevier Ltd.: Oxford, UK, 2012. [Google Scholar]
  24. Patel, V.K.; Bhole, S.D.; Chen, D.L. Microstructure and mechanical properties of dissimilar welded Mg–Al joints by ultrasonic spot welding technique. Sci. Technol. Weld. Join. 2012, 17, 202–206. [Google Scholar] [CrossRef]
  25. Becker, M.; Balle, F. Multi-Spot Ultrasonic Welding of Aluminum to Steel Sheets: Process and Fracture Analysis. Metals 2021, 11, 779. [Google Scholar] [CrossRef]
Figure 1. Finite element model and weld coupon dimensions.
Metals 13 01735 g001
Figure 2. Illustration of part motion, heat generation and gap conductance in ultrasonic welding.
Metals 13 01735 g002
Figure 3. Input and output of numerical models and experiment as well as validation dataset.
Metals 13 01735 g003
Figure 4. Vibration amplitude of material along the coupon length.
Metals 13 01735 g004
Figure 5. Dependence of interfacial relative motion (current simulation) and experimental weld strength [16] on extension length.
Metals 13 01735 g005
Figure 6. Temperature field predicted through coupled thermomechanical analysis. (a) L = 63 mm. (b) L = 126 mm.
Metals 13 01735 g006
Figure 7. Top sheet vibration relative to bottom sheet predicted via thermomechanical analysis.
Metals 13 01735 g007
Figure 8. Comparison of modeling and experiment results: (a) peak temperature on top Al sheet and (b) relative motion at the mating interface.
Metals 13 01735 g008
Figure 9. Predicted stress distribution under harmonic excitation and IR imaging of temperature rise in 1.0 mm AZ31 USW.
Metals 13 01735 g009
Figure 10. Modeling and experiment of AA5754 sheet USW: (a) coupon dimension and welding configuration; (b) transient stress distribution predicted using model; (c) IR image during USW in grayscale.
Metals 13 01735 g010
Figure 11. Mitigation of hot spots through applying fixtures on the two ends of top sheet: (a) stress prediction via modal analysis; (b) experiment validation of AA5754 USW.
Metals 13 01735 g011
Figure 12. Computational vibration mode and shear stress distribution for even-spacing (a = 25.4 mm) ultrasonic spot welding: (a) configuration of weld spots; (b) vibration amplitude of the sheets and interfacial motion; (c) shear stress distribution induced by ultrasonics.
Metals 13 01735 g012
Figure 13. Relative motion and maximum shear stress at the faying interface, predicted via the modal analysis: (a) Relative motion (b) Interfacial shear stress.
Metals 13 01735 g013
Figure 14. Temperature field and history measured via IR camera: (a) IR image in welding with spacing 25.4 mm; (b) IR image in welding with spacing a = 31.8 mm; (c) welding temperature in case a = 25.4 mm; (d) welding temperature in case a = 31.8 mm.
Metals 13 01735 g014
Figure 15. Failure of existing welds due to ultrasonic vibration in multi-spot AZ31 ultrasonic welding.
Metals 13 01735 g015
Table 1. AA6061 material properties used for transient thermo-mechanical simulation.
Temperature (°C)25205315370
Young’s modulus (GPa)68594738
Yield strength (MPa)2751303421
Heat conductance (W/m/°C)167193206217
Heat capacity (J/kg/°C)896103010781104
Table 2. The occurrence of hot spots in lightweight metal USW.
MaterialAZ31 Mg AlloyAA5754
Overlap length35404540
Model predictionNoYesNoYes
Experiment resultNoYesNoYes
Table 3. The distance from the center of each hot spot to the sonotrode.
MaterialAZ31 Mg AlloyAA5754
Hot spot LocationLeftRightLeftRight
Model prediction32.931.027.931.1
Experiment result31.331.830.931.5
Disclaimer/Publisher’s Note: The statements, opinions and data contained in all publications are solely those of the individual author(s) and contributor(s) and not of MDPI and/or the editor(s). MDPI and/or the editor(s) disclaim responsibility for any injury to people or property resulting from any ideas, methods, instructions or products referred to in the content.

