Article

Life Cycle Assessment of Cold Spray Additive Manufacturing and Conventional Machining of Aluminum Alloy Flange

by
Dileep Kumar
1,2,
Suresh Palanisamy
2,*,
Kannoorpatti Krishnan
3 and
Md Morshed Alam
2,*
1
Department of Civil and Construction Engineering, School of Engineering, Swinburne University of Technology, Hawthorn 3122, Australia
2
Department of Mechanical Engineering & Product Design Engineering, School of Engineering, Swinburne University of Technology, Hawthorn 3122, Australia
3
Advanced Manufacturing/Engineering, Vice Chancellor and President, Research & Innovation, Charles Darwin University, Darwin 0815, Australia
*
Authors to whom correspondence should be addressed.
Metals 2023, 13(10), 1684; https://doi.org/10.3390/met13101684
Submission received: 29 August 2023 / Revised: 27 September 2023 / Accepted: 29 September 2023 / Published: 1 October 2023

Abstract

:
Cold spray additive manufacturing (CSAM) is generally used to repair worn components and build complex on-demand parts by depositing metal powder layer-wise using compressed air. Previous studies on CSAM were focused on printing parameters, materials properties, and printed part mechanical performance. However, the energy consumption and environmental impacts of CSAM processes have not yet been investigated, which are essential factors for sustainable manufacturing. This study aims to investigate the carbon footprint of the CSAM process and compare it with conventional machining processes and other additive manufacturing. The life cycle assessment methodology was followed to calculate the carbon footprint of a pipe flange, considering rod or tube as a feedstock. Results revealed that the machined flange from the tube had the lowest CO2-eq emissions of 31 kg CO2-eq due to low rough machining energy consumption and scrap production, compared to the machined flange from a rod and a printed flange from powder. Moreover, the life cycle carbon emissions increased by 8% and 19% in case of the printed and machined flanges, with uncertainties of 4% and 9%, respectively, when changing feedstock CO2 emissions. From a regional perspective, the CSAM process was responsible for the lowest CO2-eq emissions in Tasmania and South Australia.

1. Introduction

The increasing rate and impact of climate change has elevated concern in both the public and private stakeholders to reduce CO2 emissions by harnessing renewable energy resources and ensuring energy conservation in various sectors (energy generation, distribution, and consumption) [1]. Globally, the manufacturing sector is responsible for 15% and 35–40% of primary energy consumptions and material production, respectively. Thus, it contributes around 37% of total CO2-eq emissions in the world [2]. According to the IEA (2014) report, energy use in the manufacturing sector is expected to increase by 70% by 2035 [3]. In the meantime, material demand will be increased by factors of 2.6–3.5, 1.8–2.4, 1.8–2.2, and 1.4–1.7 for aluminum, paper, steel, and cement, respectively [4]. Energy and materials consumption in manufacturing processes has been reduced by adopting new manufacturing technology and energy conservation measures, recycling materials waste, and repairing worn or broken components instead of producing new components [5].
The traditional manufacturing processes are energy-intensive, with high material wastes due to melting and machining metals into desirable shapes. These processes have adverse environmental impacts due to the consumption of low-grade fossil fuels [6]. Several energy conservation measures, such as upgrading control systems, introducing induction furnaces, and switching to clean fuels, were adopted to reduce energy consumption and CO2 emissions in the metal casting industry. However, systemic optimization has not only reduced the energy consumption in rough and surface finishing, but also minimized the scraping. Servomotors have replaced traditional mechanical control systems within the forging and rolling industry, resulting in dynamic operations with minimum energy consumption. However, through the application of energy and resources conservation approaches, these processes are still consuming significant amounts of energy due to high mechanical pressures, repeated heating, and massive material waste. Therefore, an alternative manufacturing technology is required to reduce energy consumption, materials waste, and CO2-eq emissions in the manufacturing sector [7,8].
Additive manufacturing (AM) is a direct layer-wise technique to manufacture metal and non-metal components, coalescing powder and joining wires in the absence of tools and dies. AM prints complex and sophisticated components that are difficult to machine and forge in conventional manufacturing processes without changing their design parameters and operating conditions. AM is an economic, time-effective, resource-efficient and on-demand rapid prototyping technology, which is capable of producing multifunctional and multiple shape components [9,10] on-demand, reducing production capacity, over-production, inventory, and parts delivery [11]. It develops a new service-based business model for producing on-demand parts for aerospace, automotive, electronics, healthcare, agriculture, and defense under direct digital manufacturing that combines equipment, computers, and software [12,13]. However, AM parts have some drawbacks such as their limited production due to layer-wise printing [14]. The additively printed part size is limited to the size of printer, and it has poor strength and a rough surface; this requires additional heat treatment and machining because the layer-wise deposition process creates anisotropic defects and looseness between the layers and particles [15,16]. Mainly, AM technologies are energy-intensive due to the high-pressure, thermal and beam spray used to join two layers together to print a desired component. Consequently, they have adverse environmental impacts [17].
Several studies were conducted to compare the environmental impacts of AM and TM processes, in order to investigate the environmentally sustainable metal and non-metal components for different applications. For instance, Kellen et al. [18] conducted a comprehensive literature review to analyze the environmental impacts of various AM technologies, considering material production, printing, use, and disposal. The life cycle assessment (LCA) revealed that printing parts using recycled materials and repairing worn components exhibited the lowest environmental impacts. Peng et al. [19] found that the laser-cladded impeller was responsible for the lowest CO2 emissions (252 kg CO2-eq) when compared to repaired 8975 kg CO2-eq, and machined a 713.2 kg CO2-eq impeller, without considering recycled materials. Ingarao et al. [20] found that a printing process had lower CO2 emissions than machining and forming processes in the case of producing complex geometry parts at low solid-to-cavity ratios, and vice versa [21]. Yang et al. [22] found that selective laser melting (SLM) produced lower CO2 emissions than machining process, resulting in more than 30% scrap. Similarly, Torres-Carrillo et al. [23] determined that the printed blade with SLM emitted 7.02 tons CO2, which was lower than a machined blade (7.32 tone CO2-eq). Wippermann et al. [24] found that hybrid manufacturing processes were more energy- and resource-efficient than machining and SLM, resulting in better environmental performance. Zhang et al. [25] discovered that the hybrid deposition and micro rolling (HDMR) process reduced forging process energy consumption by 33% in fabricating Ti-6Al-4V components by substituting metal compression.
Repairing and remanufacturing are economical and time-effective processes to extend the service life of components, and reducing life cycle environmental impacts. Additively repaired components have shown better mechanical and thermal performance than conventionally welded parts due to the absence of surface corrosion and cracking associated with oxidation and thermal expansion [26,27]. For instance, Priarone et al. [28] observed that repairing internal combustion engine cylinder heads with wire arc additive manufacturing (WAAM) consumed 50% less energy than conventional milling (186 MJ/part). Another parametric study found that the wire feed rate and travel speed were mainly responsible for high deposition efficiency and life cycle CO2 emissions [29]. WAAM creates metallurgical defects due to the remelting of substrates, resulting in low mechanical strength. Consequently, Petrat et al. [30] used direct metal deposition (DMD) to avoid metallurgical defects in repairing turbine blades, because it repairs parts without exceeding their metallurgical limits. Saboori et al. [26] compared a DMD process with a cold spray additive manufacturing (CSAM) process. They found that the DMD process consumed more energy than CSAM and printed parts with high surface roughness due to the high reflectivity and thermal conductivity of aluminum alloy and copper alloy [31,32]. Moreover, powder melting and vaporization consume more power than forced coalescence of powder in CSAM, without surface radiation losses [33]. Aluminum alloy [16,34], copper [34], and Ti6Al4V alloy [35] based components were printed by various researchers to study their mechanical properties, surface morphologies, and heat treatment effects. They observed that the printed parts in CSAM have comparable mechanical properties and surface finishes to selective laser melting (SLM) and DMD processes. They found that the interface adhesion shear strength was inversely proportional to the surface topology of the component. Therefore, the hard powder was heated before printing a part, in order to achieve the required mechanical strength. Recently, Parashar and Vasudev [36] conducted a comprehensive review study that considered process parameters, powder characteristics, and printed parts properties in a CSAM process, in order to identify potential benefits and challenges. They found that the CSAM process did not produce any dangerous emissions and harmful fumes during the printing process for repairing, restoration, and manufacturing different components. However, the energy consumption in CSAM processes and their adverse environmental impacts have not thus far been studied from a life cycle perspective, to the best of our knowledge. Moreover, comparing CSAM processes in terms of CO2 emissions with traditional manufacturing has not been reported in previous studies, which is critical for further applications of this technology in the metal manufacturing industry.
This study aims to calculate the energy consumption and CO2-eq emissions of CSAM using a life cycle assessment, and comparing it with conventional machining. The objectives of present study were the following:
  • To conduct a life cycle assessment (LCA) of a CSAM process to print an aluminum alloy flange, considering cradle-to-gate boundary conditions, and considering aluminum alloy because of its low density, good balance between strength and ductility, high resistance to corrosion, recyclability, and compatibility with CSAM to manufacture agricultural components [16].
  • To determine the impact of different feedstock materials on the LCA of CSAM and conventional machining (CM) processes.
  • To investigate the impacts of scrap and powder recycling, transportation, and regional emissions factors on the environmental performance of CSAM and CM processes.
The methodologies adapted to achieve the objectives of the present study are described in detail in Section 2.

2. Materials and Methods
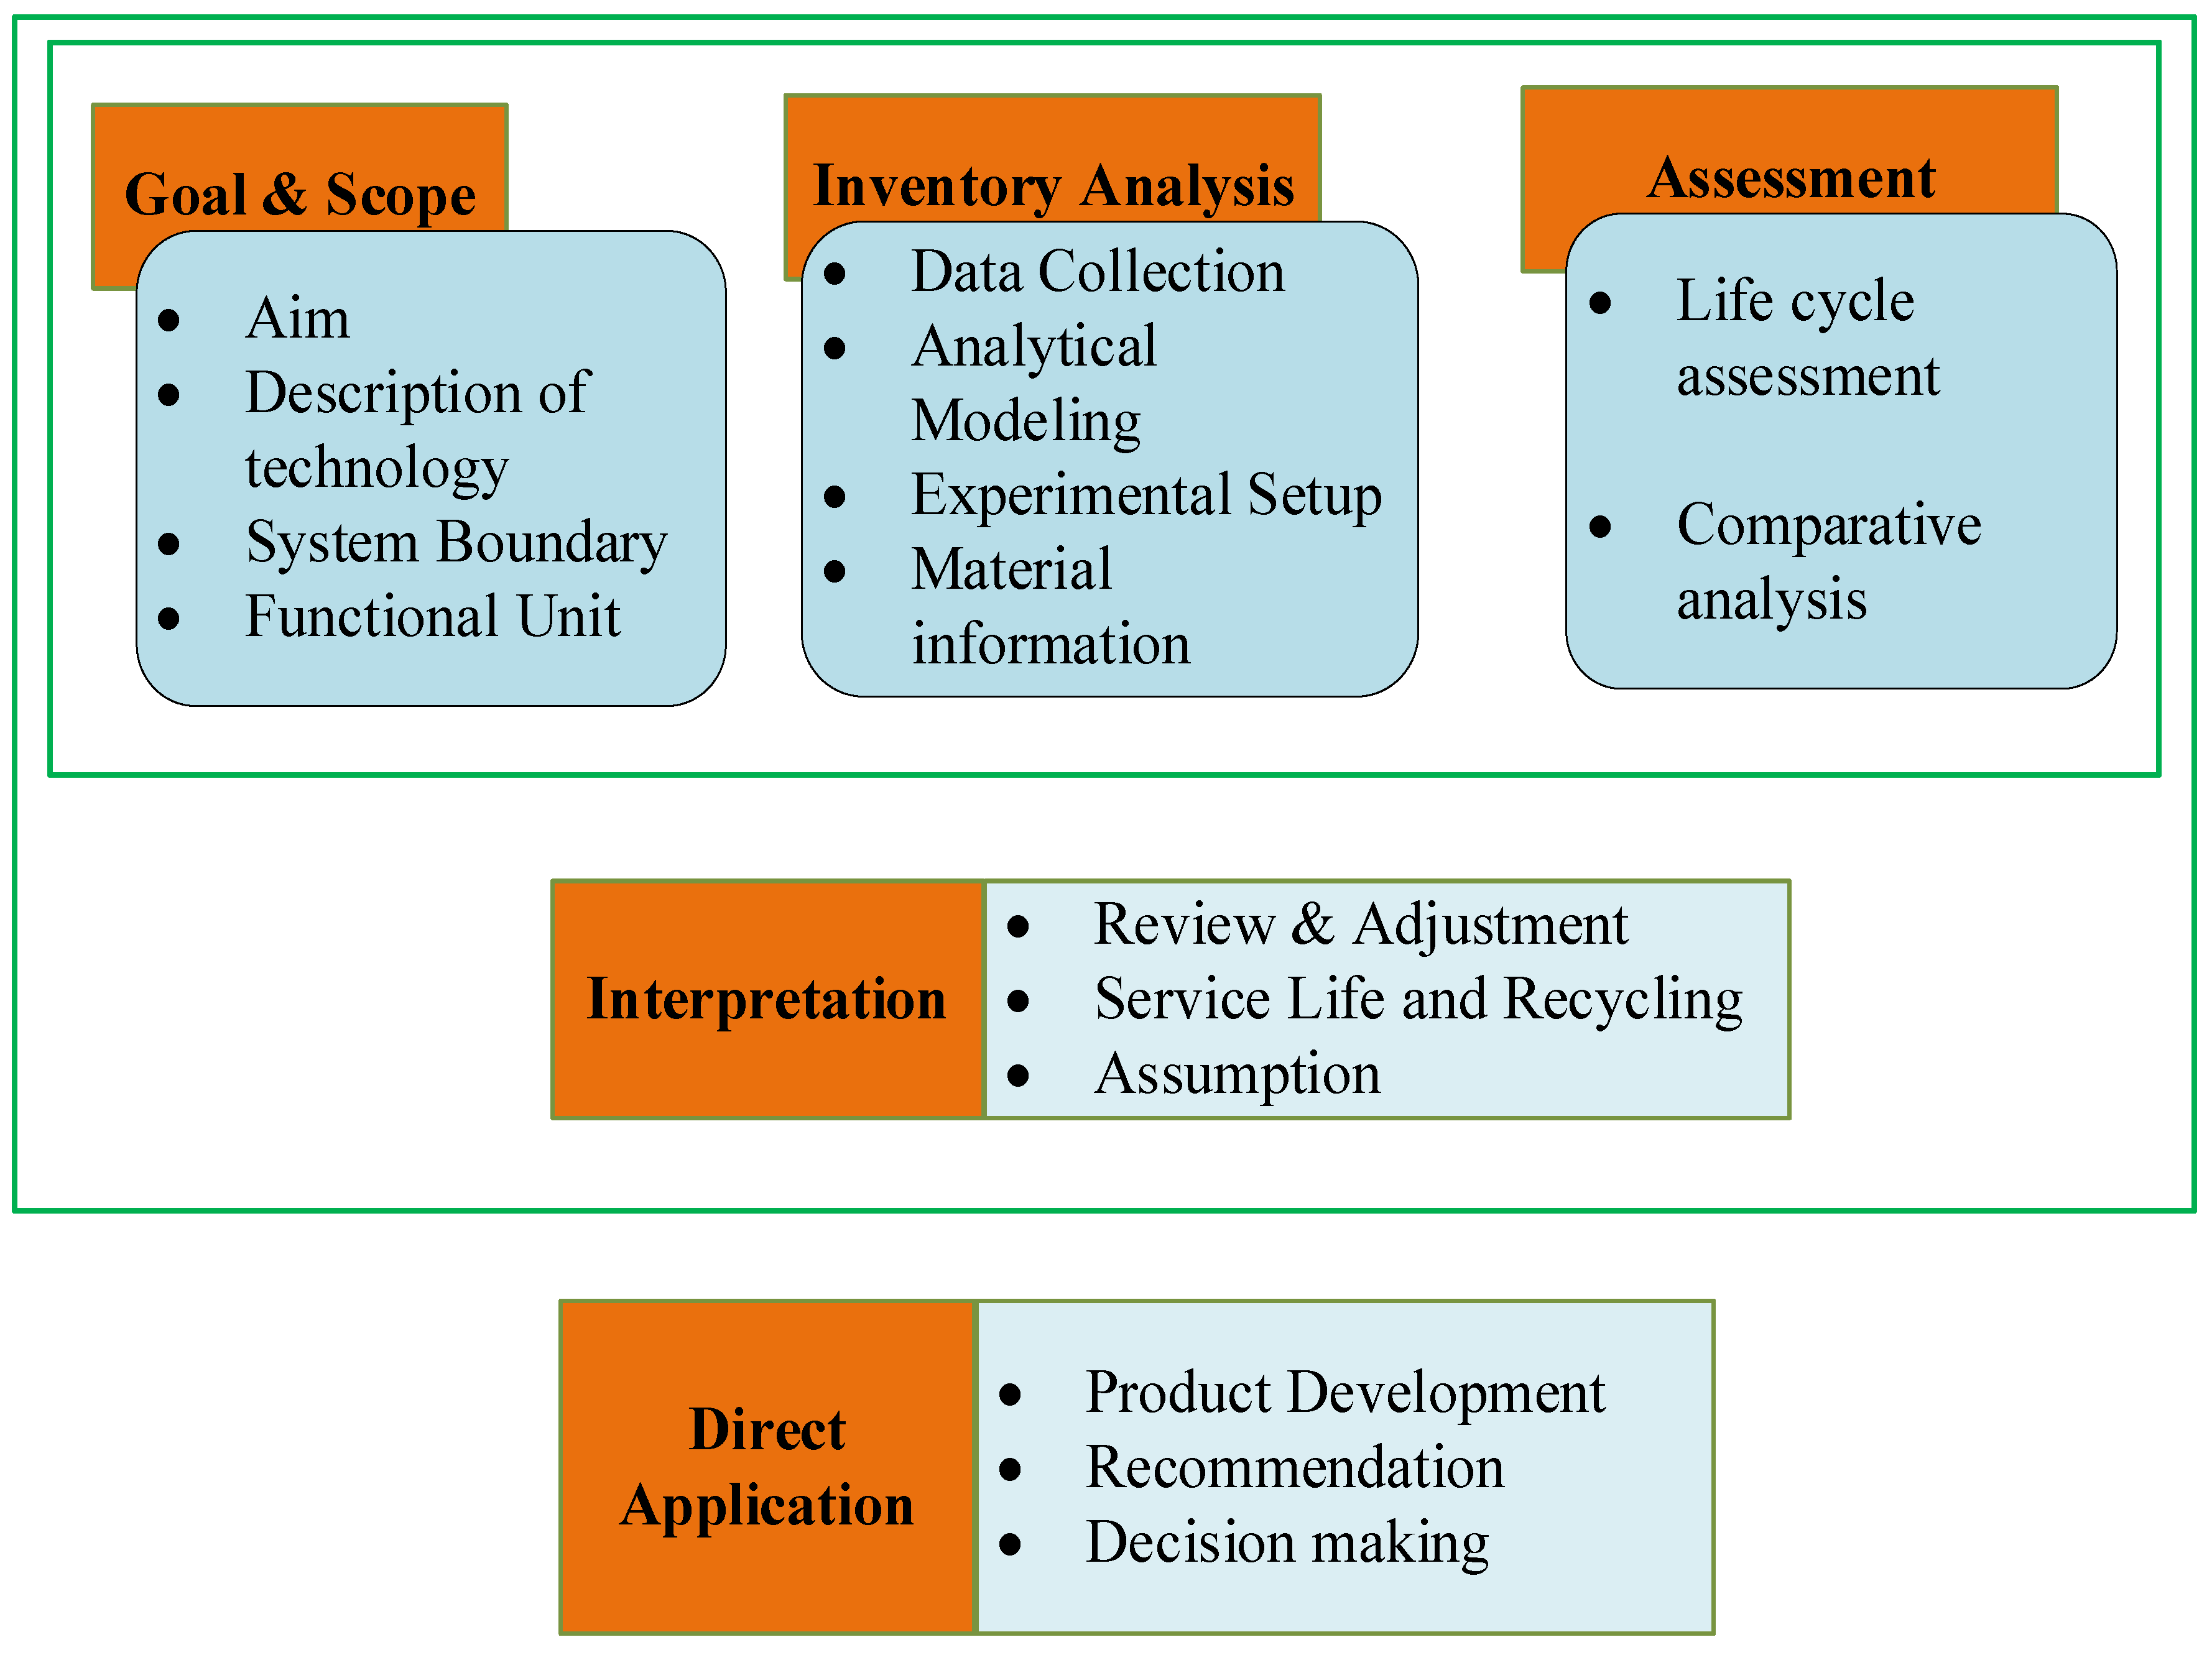
The life cycle assessment (LCA) is a process-based methodology for evaluating the life cycle energy use and environmental impacts of commercial products, processes, and services in accordance with ISO 14040 [37]. The LCA methodology includes three consecutive steps, (i) goal and scope, (ii) inventory analysis, and (iii) impact assessment, and their interpretation is used for proposing environmentally sustainable recommendations for the developed product, as shown in Figure 1. The details of each stage are presented in the following sections.

2.1. Goal and Scope

This study aimed to improve the decision making in metal parts manufacturing by evaluating the life cycle energy consumption and CO2-eq emissions of CSAM and CM processes using two different feedstocks (standard solid bar and hypothesized tube [20]).

2.1.1. Life Cycle Phase

The scope used for the LCA was cradle-to-gate, producing the ingot from raw materials to complete manufacturing of the part. The left side of Figure 2 shows the CM process considering the rod and bar, and right side shows the CSAM process.

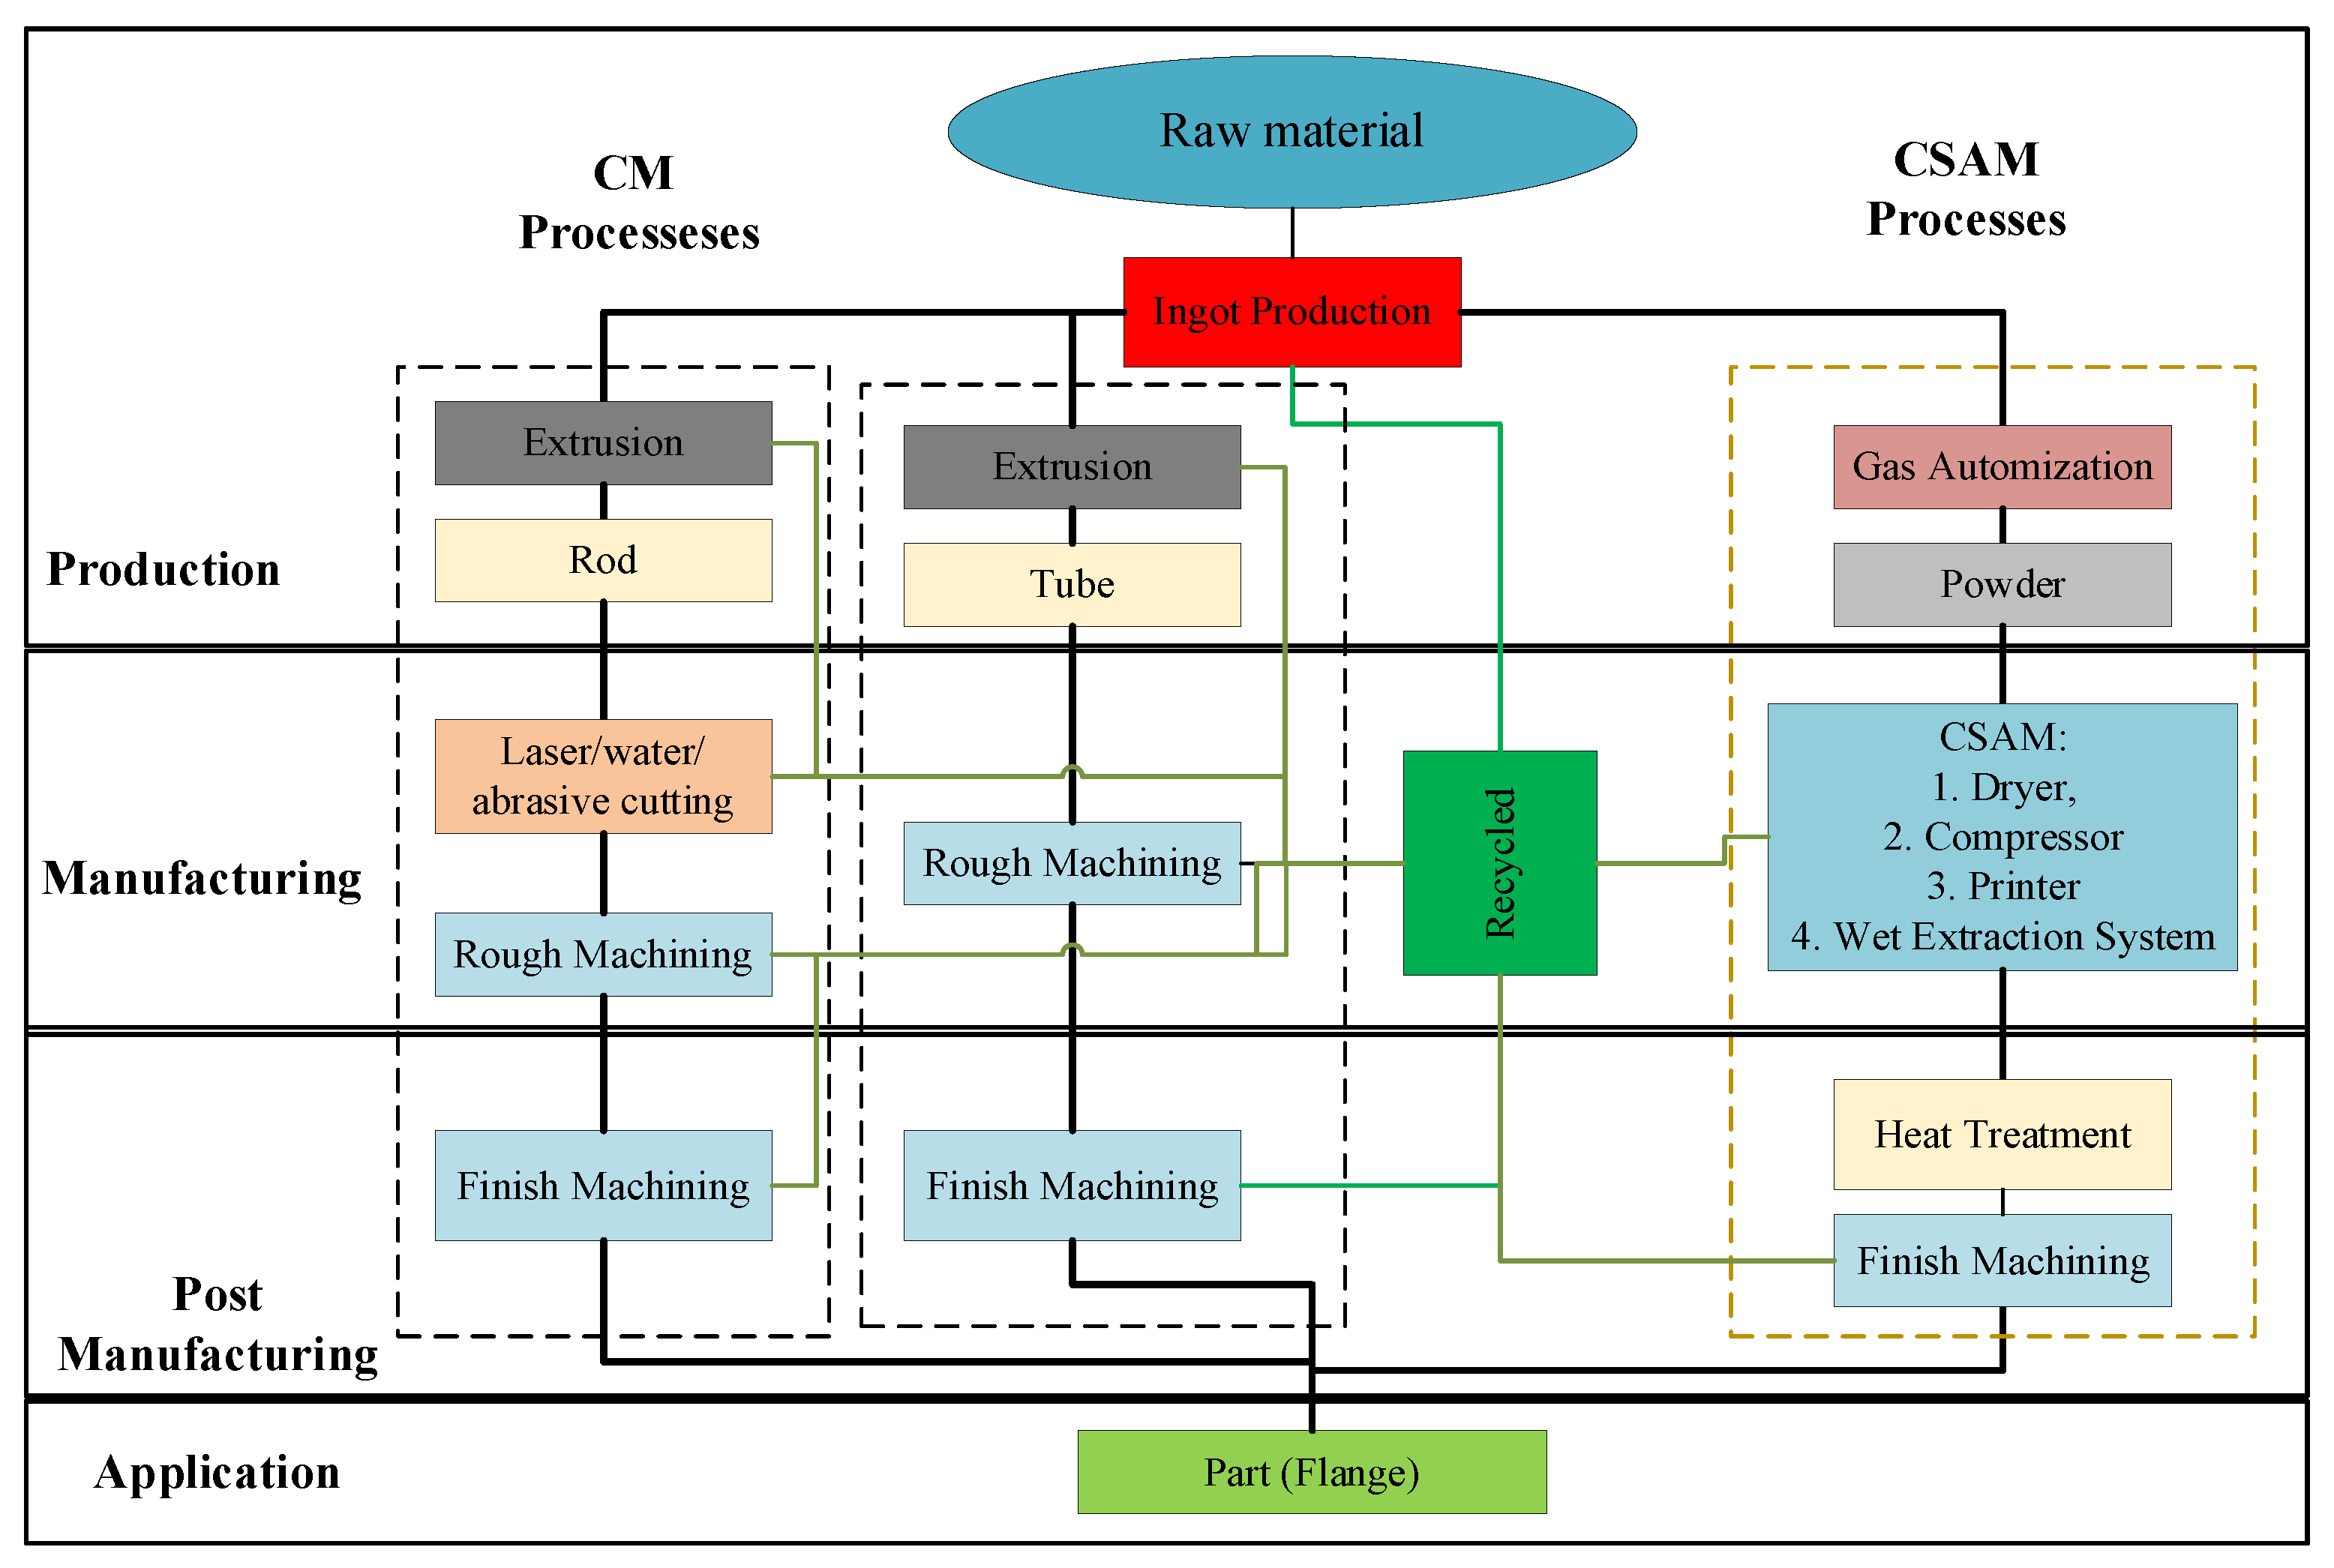
2.1.2. Process Flow and System Boundary

Aluminum was produced from bauxite ore through ore processing and by electrolytic extraction. This study assumed that the same primary production of aluminum alloy was used for CM and CSAM. The computerized numerical control (CNC) machine was considered traditional manufacturing, which included the machining of a standard size bar and hypothetical tube to fabricate a flange, as seen in Figure 3. The bar was bored and cut into the required dimensions of the flange using an abrasive water jet machine, and was further rough machined using the CNC machine to shape the part. However, the CNC machine was only used to rough machine the tube with a dimensional tolerance of 1 mm [20]. In both cases, the finish machining process shaped the flange to the required dimensional accuracy and surface quality, with a dimensional tolerance of 0.5 mm [20]. This standard solid bar was also considered in a previous study related to aluminum alloy [20]. The extrusion and machining processes produced 5% and 15% permanent materials waste in the conventional machining process, respectively [20]. Therefore, this study considered 20% to be the permanent waste of materials for recycling.
In the CSAM approach, the gas atomization process produced feedstock powder, which was dried in a dryer before depositing on the substrate to form a shape. This study considered LightSPEE3D metal printing technology, which is a low-pressure metal printing technology [38]. It comprised a compressor, the LightSPEE3D printer (SPEE3D, Melbourne, Australia), and an extraction system. These consumed electric power to print and repair the required geometric parts and components, respectively. The air compressor pressurized air and stored it in a tank with a 10% duty cycle. The stored air was mixed with powder in a feeder, and it was heated before deposition. The heated feed was flown through a convergent–divergent nozzle to increase the powder velocity above its critical velocity for plastic deformation onto a substrate to make it coalesce with the pre-deposited layer. The extraction system was used to collect the scattered powder for recycling, and to prevent adverse environmental impacts of the metal particles. The servomotors controlled and operated the system equipment, such as the rotary mixer, robot arm, and water circulation pump. These consumed electric power to assist the SPEE3D machine to print a flange. The printed flange was semi-finished due to geometric losses of the printing process, and it had residual stresses due to plastic deformation [36]. The heat treatment and finish machining processes were adapted to reduce residual stresses and remove surface unevenness, increasing the mechanical properties and practicality of the flange, respectively [15,16].

2.1.3. Process Flow and System Boundary

The functional unit is the production of an aluminum alloy flange from extracted resources, as seen in Figure 5. The part has a simple geometry, thus eliminating the adverse effects of part complexity for mass and energy conservation. The part’s geometric parameters are tabulated in Table 1. The primary energy consumption and environmental impacts per single part production were considered as the basis for the comparison between CSAM and CM.

2.2. Life Cycle Inventory Analysis

This section provides details regarding the material and energy inputs and outputs throughout each life cycle stage of the CSAM technology and conventional machining processes. The material inventory is discussed in Section 2.2.1, considering the primary and secondary production of the aluminum alloy.

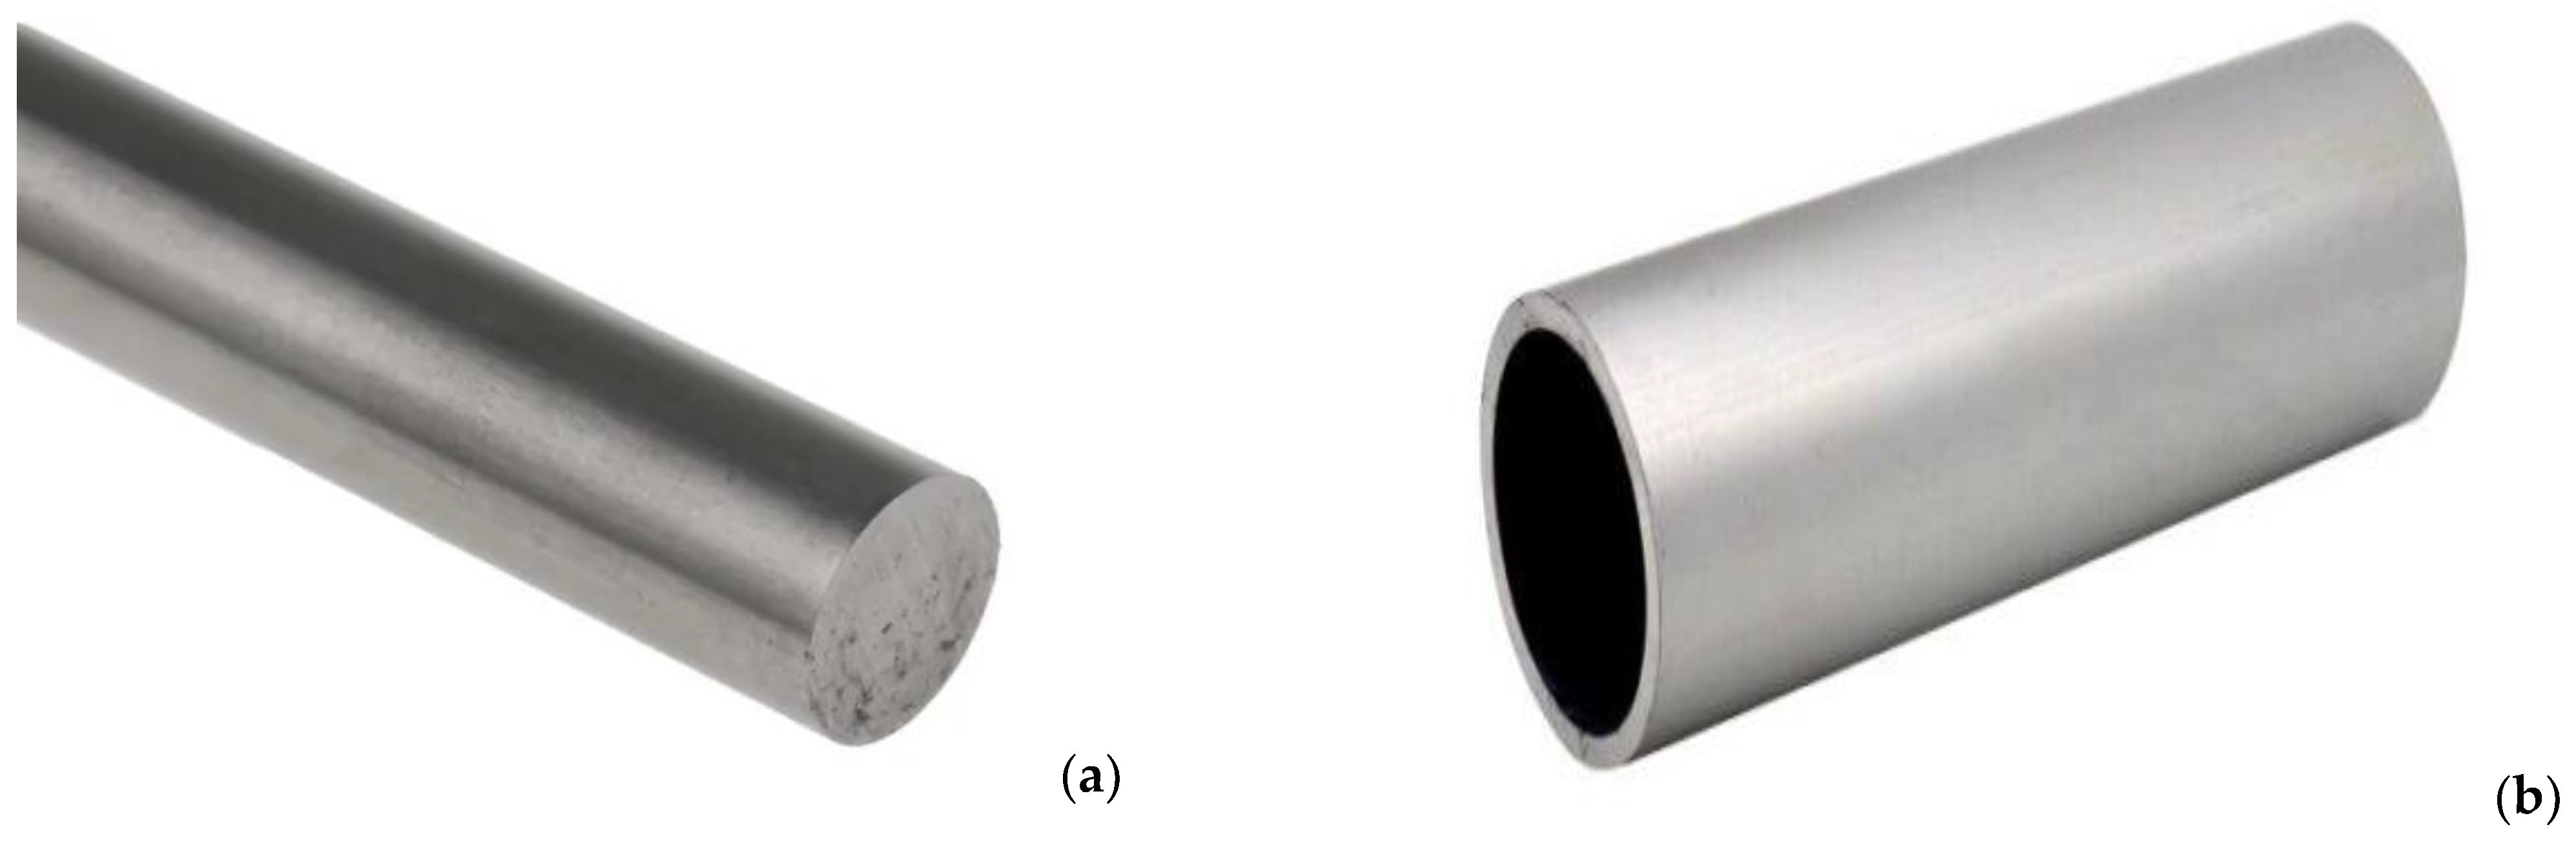
2.2.1. Feedstock Material Production

The ecological properties of a material depend on the adopted manufacturing processes for it. They are a measure of the energy consumption and CO2-eq emissions to convert the raw or recycled material into ingot production. The associated energy consumption and CO2-eq emissions are termed the embodied energy and the embodied carbon, respectively. The embodied energy and embodied carbon of aluminum alloy (Al6061) are tabulated in Table 2. Moreover, the aluminum alloy ingot was remelted to produce the round bar and tube and the powder through the extrusion and gas atomization process, respectively. The extrusion process consumed a specific energy (SECE) of 6.86 MJ/kg [39] and emitted CO2-eq at approximately 4.16 kg CO2-eq/kg [40] to produce the bar and tube, with a permanent material loss of 5% [41]. The gas atomization (SECGA) accounted for 8.1 MJ/kg in case of the natural gas-fired furnace [42]. This study considered a standard aluminum alloy bar and a hypothetical tube with acceptable dimensional tolerance, as stated in [43]. Figure 3 shows the material flow for the selected manufacturing technologies for printing and machining the bar. The embodied energy and embodied carbon values for the cutting tool and cutting fluid were obtained from available literature [44].
This study considered the substation method to calculate the environmental impacts of production and supply of the material in regards to recycling, according to Hammond and Jones [45]. For instance, the feedstock material of flange ( m C M   a n d   m C S A M ) was calculated using Equations (1) and (2) for CM and CSAM, respectively. Their respective embodied energies ( E C M   a n d   E C S A M ) were calculated using Equations (3) and (4).
m C M = m p a r t η e x t η C M
m C S A M = m p a r t η g a
E C M = m C M · E E i n g o t
E C S A M = m C S A M · E E i n g o t
where ηext and ηga are resource efficiencies of the extrusion process and gas atomization, respectively, i.e., 95%; ηCM is the resource efficiency of CM, which is a fraction of the volume of the part to the volume of the bar; ηCSAM is the powder deposition efficiency, which is the ratio of mass of the part to powder (78%) [46]. The energy consumed to produce the bar and powder are denoted as ECM and ECSAM, respectively, and their respective raw material energy consumption is denoted by EEingot. The energy consumption of the production process was also calculated using Equation (5) [20] in the case of recycling the scrap (rs).
E C M , r = m C M · E E i n g o t r s η C M E E r e c y c l e d
According to a U.S. aluminum manufacturing report, the extrusion process consumes 6.86 MJ/kg to produce a rod with maximum carbon emissions of 4.16 kg CO2-eq/kg [39,40]. The aluminum alloy was gas automized to produce powder with an SEC of 8.10 MJ/kg based on its vaporization energy [42]. The energies used in pre-manufacturing of the rod, tube, and powder for the CM and CSAM processes were calculated with Equations (6) and (7), respectively.
E P M , C M = E C M + m b a r ·   S E C E
E P M , C S A M = E C S A M + m p ·   S E C G A
Table 2. Ecological properties of different aluminum alloy ingots [14,41,44,47,48].
DescriptionNotationUnitQuantity
Ingot production E E i n g o t MJ/kg150–270
E C i n g o t kg CO2-eq/kg12.7–15.1
Recycled aluminum alloy E E r e c y c l e d MJ/kg34.3
E C r e c y c l e d kg CO2-eq/kg2.7
Recycling ratio (extrusion) r e x t %95
Recycling ratio (scrap) r s %80–85
Cutting tool E E C T MJ/edge1.38
E C C T kg CO2-eq/kg0.11
Cutting fluid E E C F MJ/kg1.37
E C C F kg CO2-eq/kg0.11
Consumption rate of cutting fluid m ˙ C F kg/h0.48

2.2.2. Conventional Machining

The inventory of CM includes all significant factors, such as scrap recycling, tooling, and cutting fluid, and assumes a standard size bar and hypothetical tube with acceptable dimensional tolerances, as seen in Figure 4. Abrasive water jet cutting was selected for cutting and boring the rod due to its smaller specific energy consumption with minimum metal oxidation and cutting material waste. Abrasive water jet cutting is advantageous over laser cutting and CNC milling due to the high reflective losses in laser cutting and the high energy consumption of boring [49]. Jankovic et al. [50] calculated an SEC of 36.09 MJ/cm3 for cutting a 40-millimeter-thick aluminum alloy sheet using an abrasive water jet cutting machine. This study considered the same specific energy consumption (SEC) value for its abrasive water jet cutting process, which is a measure of operational energy use to manufacture a part or component. The CNC machine was used to fabricate the flange from the tube, with a rough machining tolerance of 1 mm. Moreover, the same finish machining process was adopted for the rod and tube-based flange, with the CNC machine having an allowance of 0.5 mm [20].
The rough and finish machining process was achieved by means of a tungsten carbide tool to fabricate the flange [20]. Kara and Li validated the developed empirical model for the SEC of different CNC machines, with actual power consumption in the turning process, which is a function of the material removal rate (MMR), as provided in Table 3 [49]. The MRR was calculated using the machining parameters as tabulated in Table 4. The calculated SEC for the turning process was slightly different from the experimentally measured value because the energy consumption depends on the machine tool architecture, equipment, and size [51]. The energy consumption in the rough and finish machining was calculated by multiplying the average SEC with the volume of material removed during the rough and finish machining processes.
E M = S E C R M · V R M + S E C F M · V F M
where, EM denotes energy use in the machining process, SECRM and SECFM represent the SEC in the rough and finish machining, respectively, and VRM and VFM show the volume of the rough and finish machining, respectively.

2.2.3. Cold Spray Additive Manufacturing

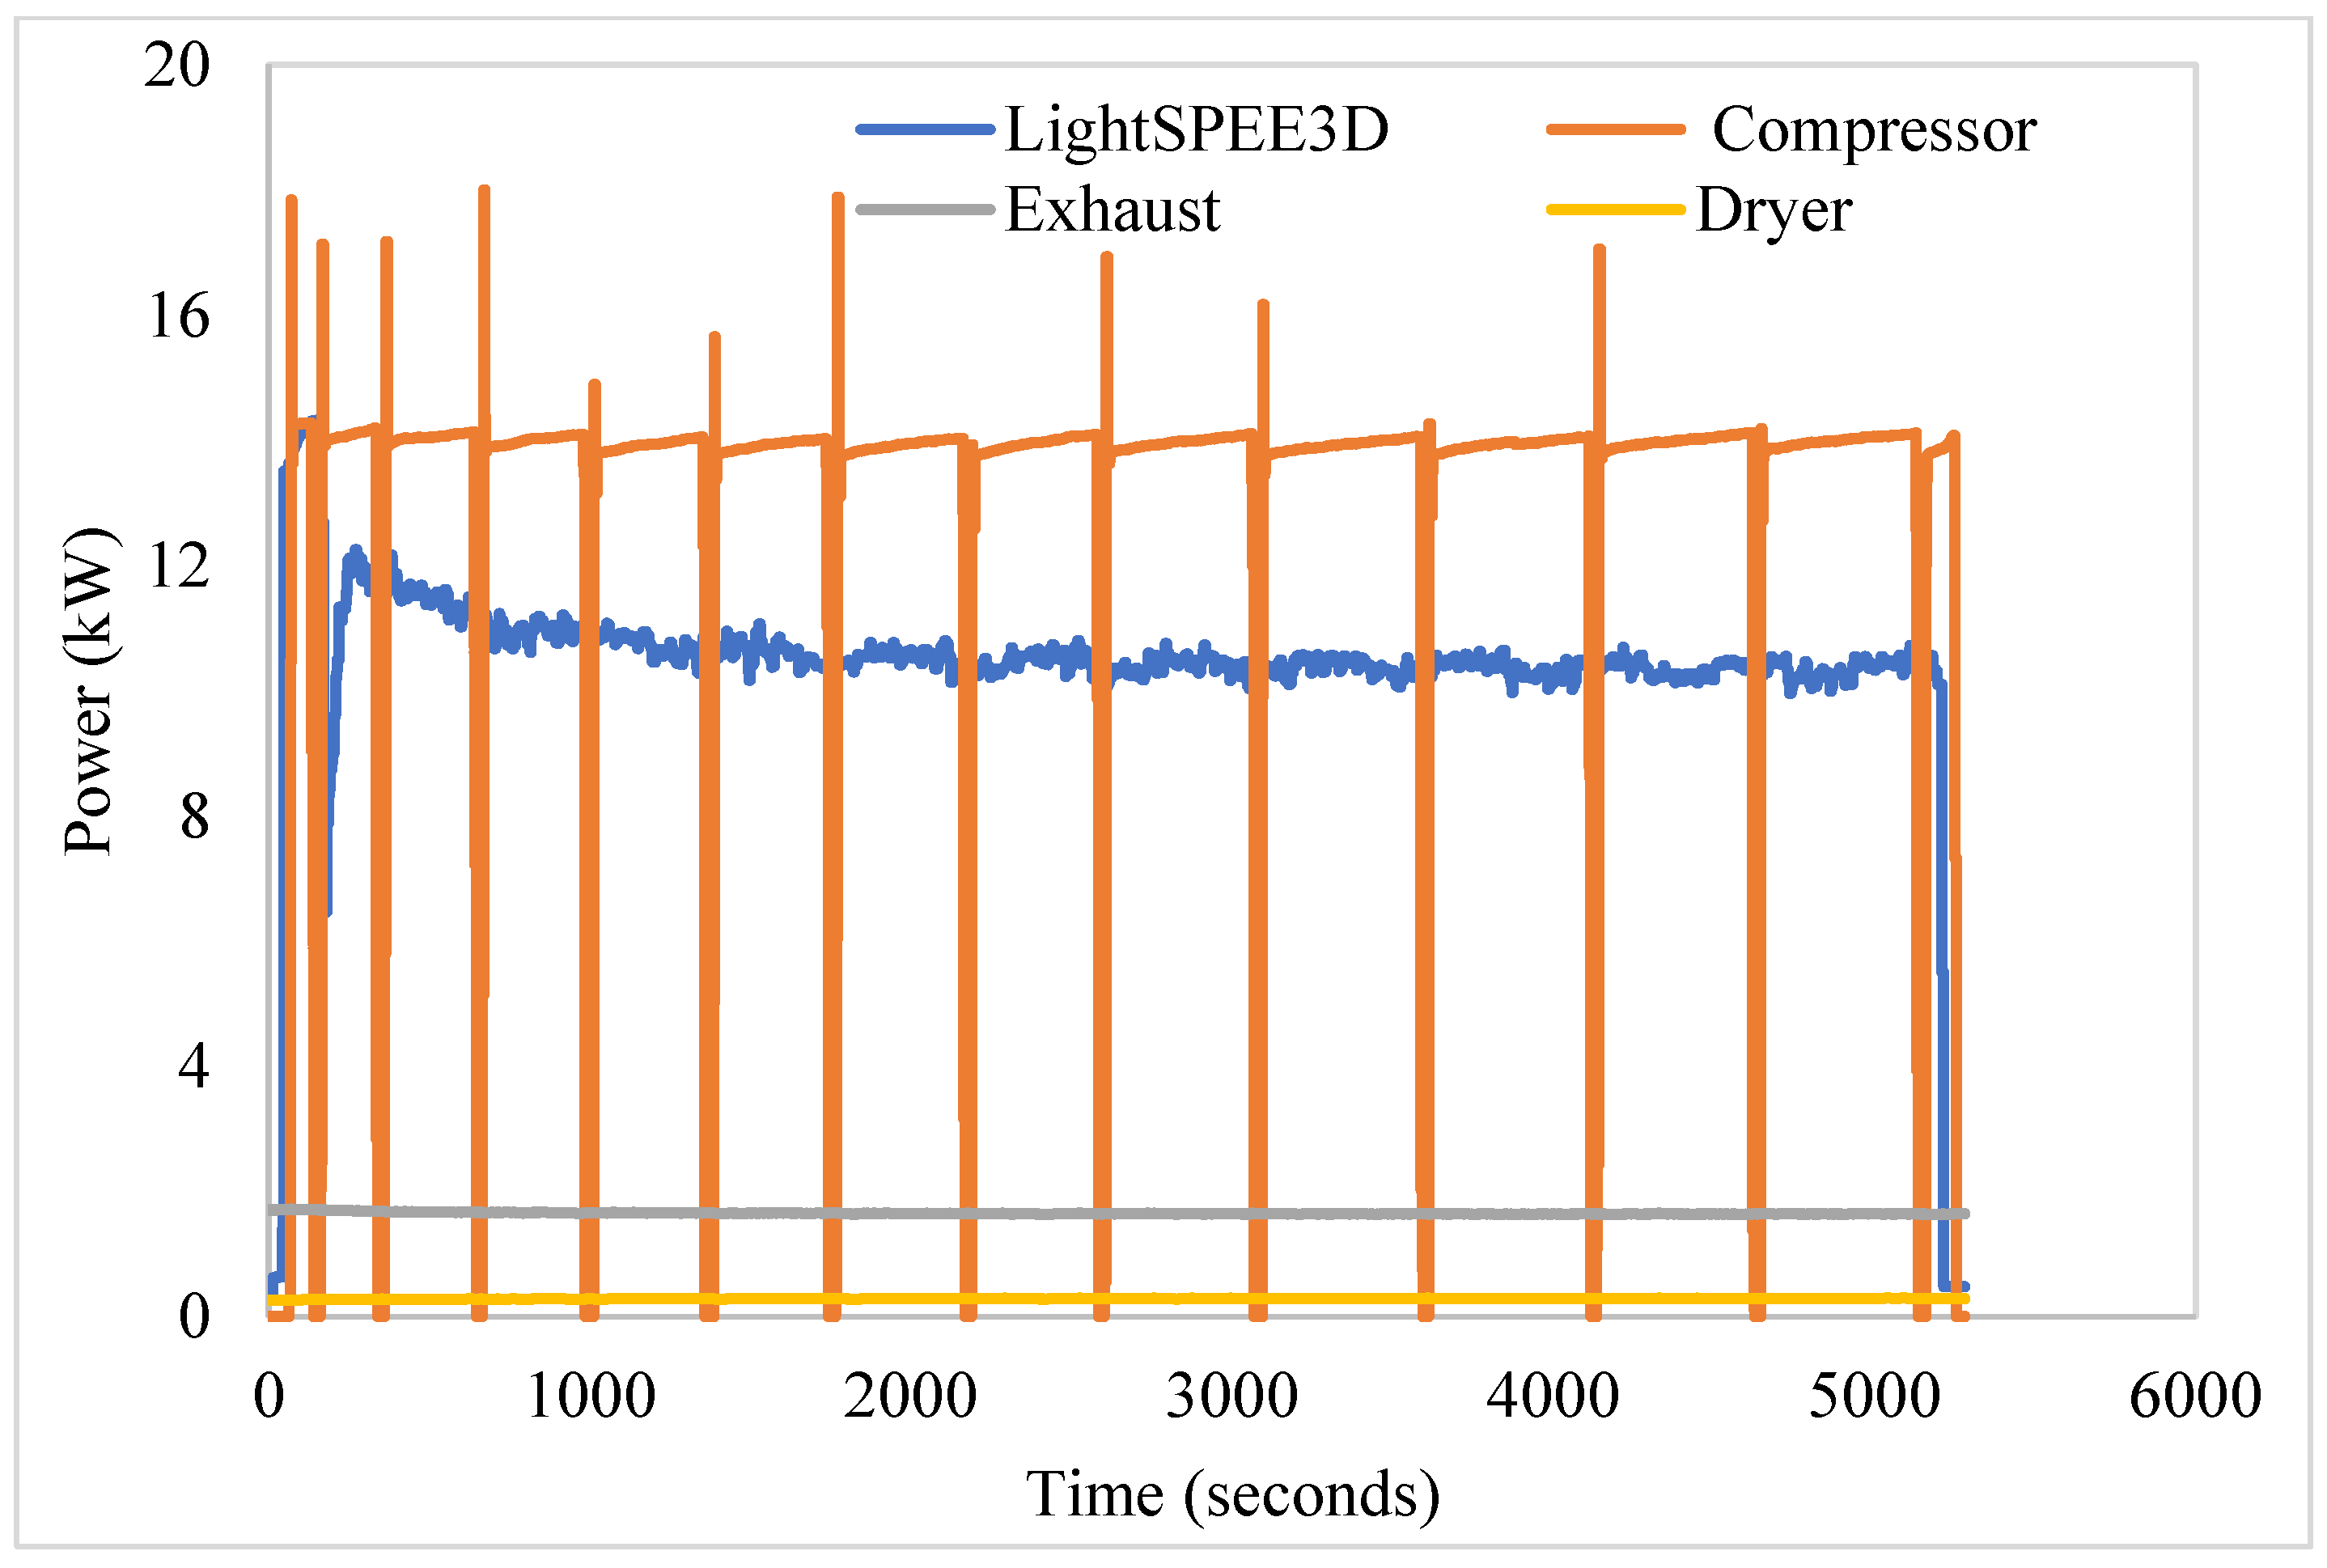
Description of Experimental Setup

This study measured the actual power consumption of the CSAM process equipment, including the compressor, the LightSPEE3D machine, the extraction system, the dryer, and the heat treatment oven, using the Acti 9 SmartLink systems by Schneider Electric (Sydney, Australia), as shown in Figure 4 [52]. This system was used to monitor and measure the electrical distribution boards via the Modulus TCP/IP communication network by collecting real-time data from the electrical distribution board. This system consists of an Acti 9 SmartLink SI device, Power Tag energy sensors, and pre-wired cables (Schneider Electric, Sydney, Australia). The Power Tag energy sensor is a wireless device that is mounted upstream or downstream of the ACTi 9 circuit breaker, and is connected to the Acti 9 SmartLink SI device (Schneider Electric, Sydney, Australia) through wireless communication. The circuit breaker auxiliary measures energy, power, and alarm during voltage loss.
Based on the CSAM operating procedure, the electric power consumption was divided into three operational modes: warm-up until 10 min, build-up for 68 min, and cool-down period of 10 min for the cleaning and idle modes. During the build-up and cool-down periods, the extraction system is active in powder dispersion in the atmosphere. The air compressor operates with a duty cycle of 90%. The heat treatment furnace takes 30 min during the warm period, and it takes 12 h to anneal the flange at a duty cycle of 10% below the recrystallization temperature for aluminum alloy. The specifications of the different equipment and the average electric power measurements are tabulated in Table 5. The power consumption of the CSAM process is shown in Figure 5. The air compressor and LightSPEE3D machine consumed 45 MJ/kg and 36 MJ/kg, respectively, to print the flange, with average power consumption values of 10 kW and 12 kW, respectively. The extraction system consumed half of the energy consumed by the electric oven to anneal the flange (4.77 MJ/kg). Moreover, this study considered the SEC for finish machining with a maximum tolerance of 1 mm for the semi-finished part in the CSAM process [20]. The CO2-eq emissions were calculated by multiplying the energy consumption in CSAM with the electricity emissions factors of different Australian regions, according to national CO2-eq account factors [53].

Analytical Model for CSAM Process

This section develops a generic expression for estimating the operational energy use in the CSAM process to deposit 1 kg of powder for printing a metal component. Equipment operating hours (trun) are the sum of product hours (ton) and idle hours (tidle). Production hours measure the time when gas or air flow is on. Idle hours are the preheating equipment, powder refilling, and maintenance of equipment times. The air compressor was not turned off during idle hours, due to the delays in preheating and restarting. However, the powder feeder was turned off to save powder during idle hours. Thus, the operating hours of the equipment were calculated as follows:
t r u n = t o n + t i d l e
The mass of powder required to produce a unit weight flange was calculated as follows:
m p = m f   ( 1 + G L ) η d
where mp and mf are the masses of the powder and flange, respectively; GL represents the geometric losses, which is a measure of the virtual augmentation of the workpiece extended surface due to powder pile up at the turning point of the spray track; ηd shows the powder deposition efficiency (78%) of the SPEE3D machine for printing the aluminum flange.
The powder feed rate is the rate of powder deposition to print a part. It is a ratio of the mass of powder and printing hours, and is calculated as follows:
m p ˙ = m p   t o n
The gas or air flow rate ( m a ˙ ) is calculated as follows:
m a ˙ = m p ˙ α
where, α is the ratio of the powder to gas mass flow rate.
The energy analysis of the CSAM process was conducted using the first law of thermodynamics. The CSAM technology includes the air compressor, the powder and air mixer, the nozzle, and the heater. The air compressor increases air pressure. The mixer mixes powder and compressed air, which are accelerated through a nozzle to increase the momentum and energy of the powder for powder deposition to achieve the desired geometry. Finally, the printed part was heat-treated to increase the mechanical properties of the printed part. The energy loss through the powder carrier line was neglected, due to the small surface of the tube and the high velocity of the powder. The energy use in the air compressor was calculated as in [54].
W ˙ a c = m ˙ a   c p   T a m b   r p γ a 1 γ a 1 η a c = 3 · V · I · P F
where cp is the specific heat capacity of air, Tamb is the ambient air temperature (25 °C) [55], rp is the is the measured air pressure at the exit and inlet of the compressor, γa is the specific heat ratio of air (1.4), and ηac is the efficiency of the air compressor (91%). The heat energy loss in the air–powder mixer, the air–powder carrier line, and the nozzles were neglected due to their low surface areas and times to transfer heat. Therefore, the energy use in the printing process is the measured electric power used for the mixer, printing arm, and substrate rotation, and is calculated as follows:
W ˙ p r i n t e r = 3 · V · I · P F
where V, I, and PF are the voltage, current, and power factor of electric energy use in the SPEE3D, respectively. The undeposited powder was collected in the extraction system, and is calculated as follows:
W ˙ E x t r a c t i o n = ρ ·   V ˙ · P = 3 · V · I · P F
where ρ is the density of air, V ˙ is the flow rate of the air and powder mixture through the extraction filter, and ∆P is the pressure difference. The energy used to anneal the printed part in the heat treatment furnace was calculated as follows:
Q ˙ p a r t = m p a r t c p a r t T T a m b
where mpart and cpart are the mass and the specific heat capacity of the part, respectively, and T and Tamb are the temperatures of annealing and the ambient air, respectively. Finally, the part was machined to achieve desirable surface properties. The energy used in machining was calculated using the empirical model provided in Table 3, considering a 1 mm tolerance for the finish machining [20]. The total energy used to manufacture the flange with CSAM technology is the sum of the energies used in each individual process.
E C S A M = W ˙ a c · t o n , c + W ˙ p r i n t e r · t o n , p r i n t e r + t i d l e + W ˙ E S · t o n , E S + Q ˙ p a r t · t o n , o v e n + t i d l e , o v e n + S E C F M · V F M
Table 5. Mechanical and electric parameters of CSAM process.
ParameterCompressorPrinterExtractionOven
FeederNozzle
Temperature (°C)Inlet25 40300–350-25
Outlet4040542-500
Pressure (MPa)Inlet0.103.453.450.050.10
Outlet3.603.453.000.110.10
Feed rate (g/min)15---1.44 *
Rotation (RPM)3600----
Current (Ampere)22.232400240
Voltage (V)4154156.714.5
Power factor0.870.850.850.85
* Units: kg

2.3. Impact Assessment

This study used the cumulative energy demand (CED) and cooperative effort on process emission in manufacturing (CO2PE) methodologies for the life cycle energy consumption and CO2-eq emissions, using a cradle-to-gate life cycle assessment methodology [56]. The cumulative energy use is the sum of energy use in the production of feedstock, transportation to the processing unit, and the CSAM process, and their respective emissions are life cycle carbon (LCC) emissions.
L C E C S A M = E i n g o t + E p o w d e r + E T r a n s p o r t + E C S A M
L C C C S A M = C E i n g o t + C E p o w d e r + C E T r a n s p o r t + C E C S A M
The life cycle energy use and emissions in conventional machining were investigated considering the rod and tube as the feedstock material.
L C E C M r o d = E i n g o t + E r o d + E T r a n s p o r t + E C M
L C C C M r o d = C E i n g o t + C E r o d + C E T r a n s p o r t + C E C M
L C E C M t u b e = E i n g o t + E t u b e + E T r a n s p o r t + E C M
L C C C M t u b e = C E i n g o t + C E t u b e + C E T r a n s p o r t + C E C M

3. Results and Discussion

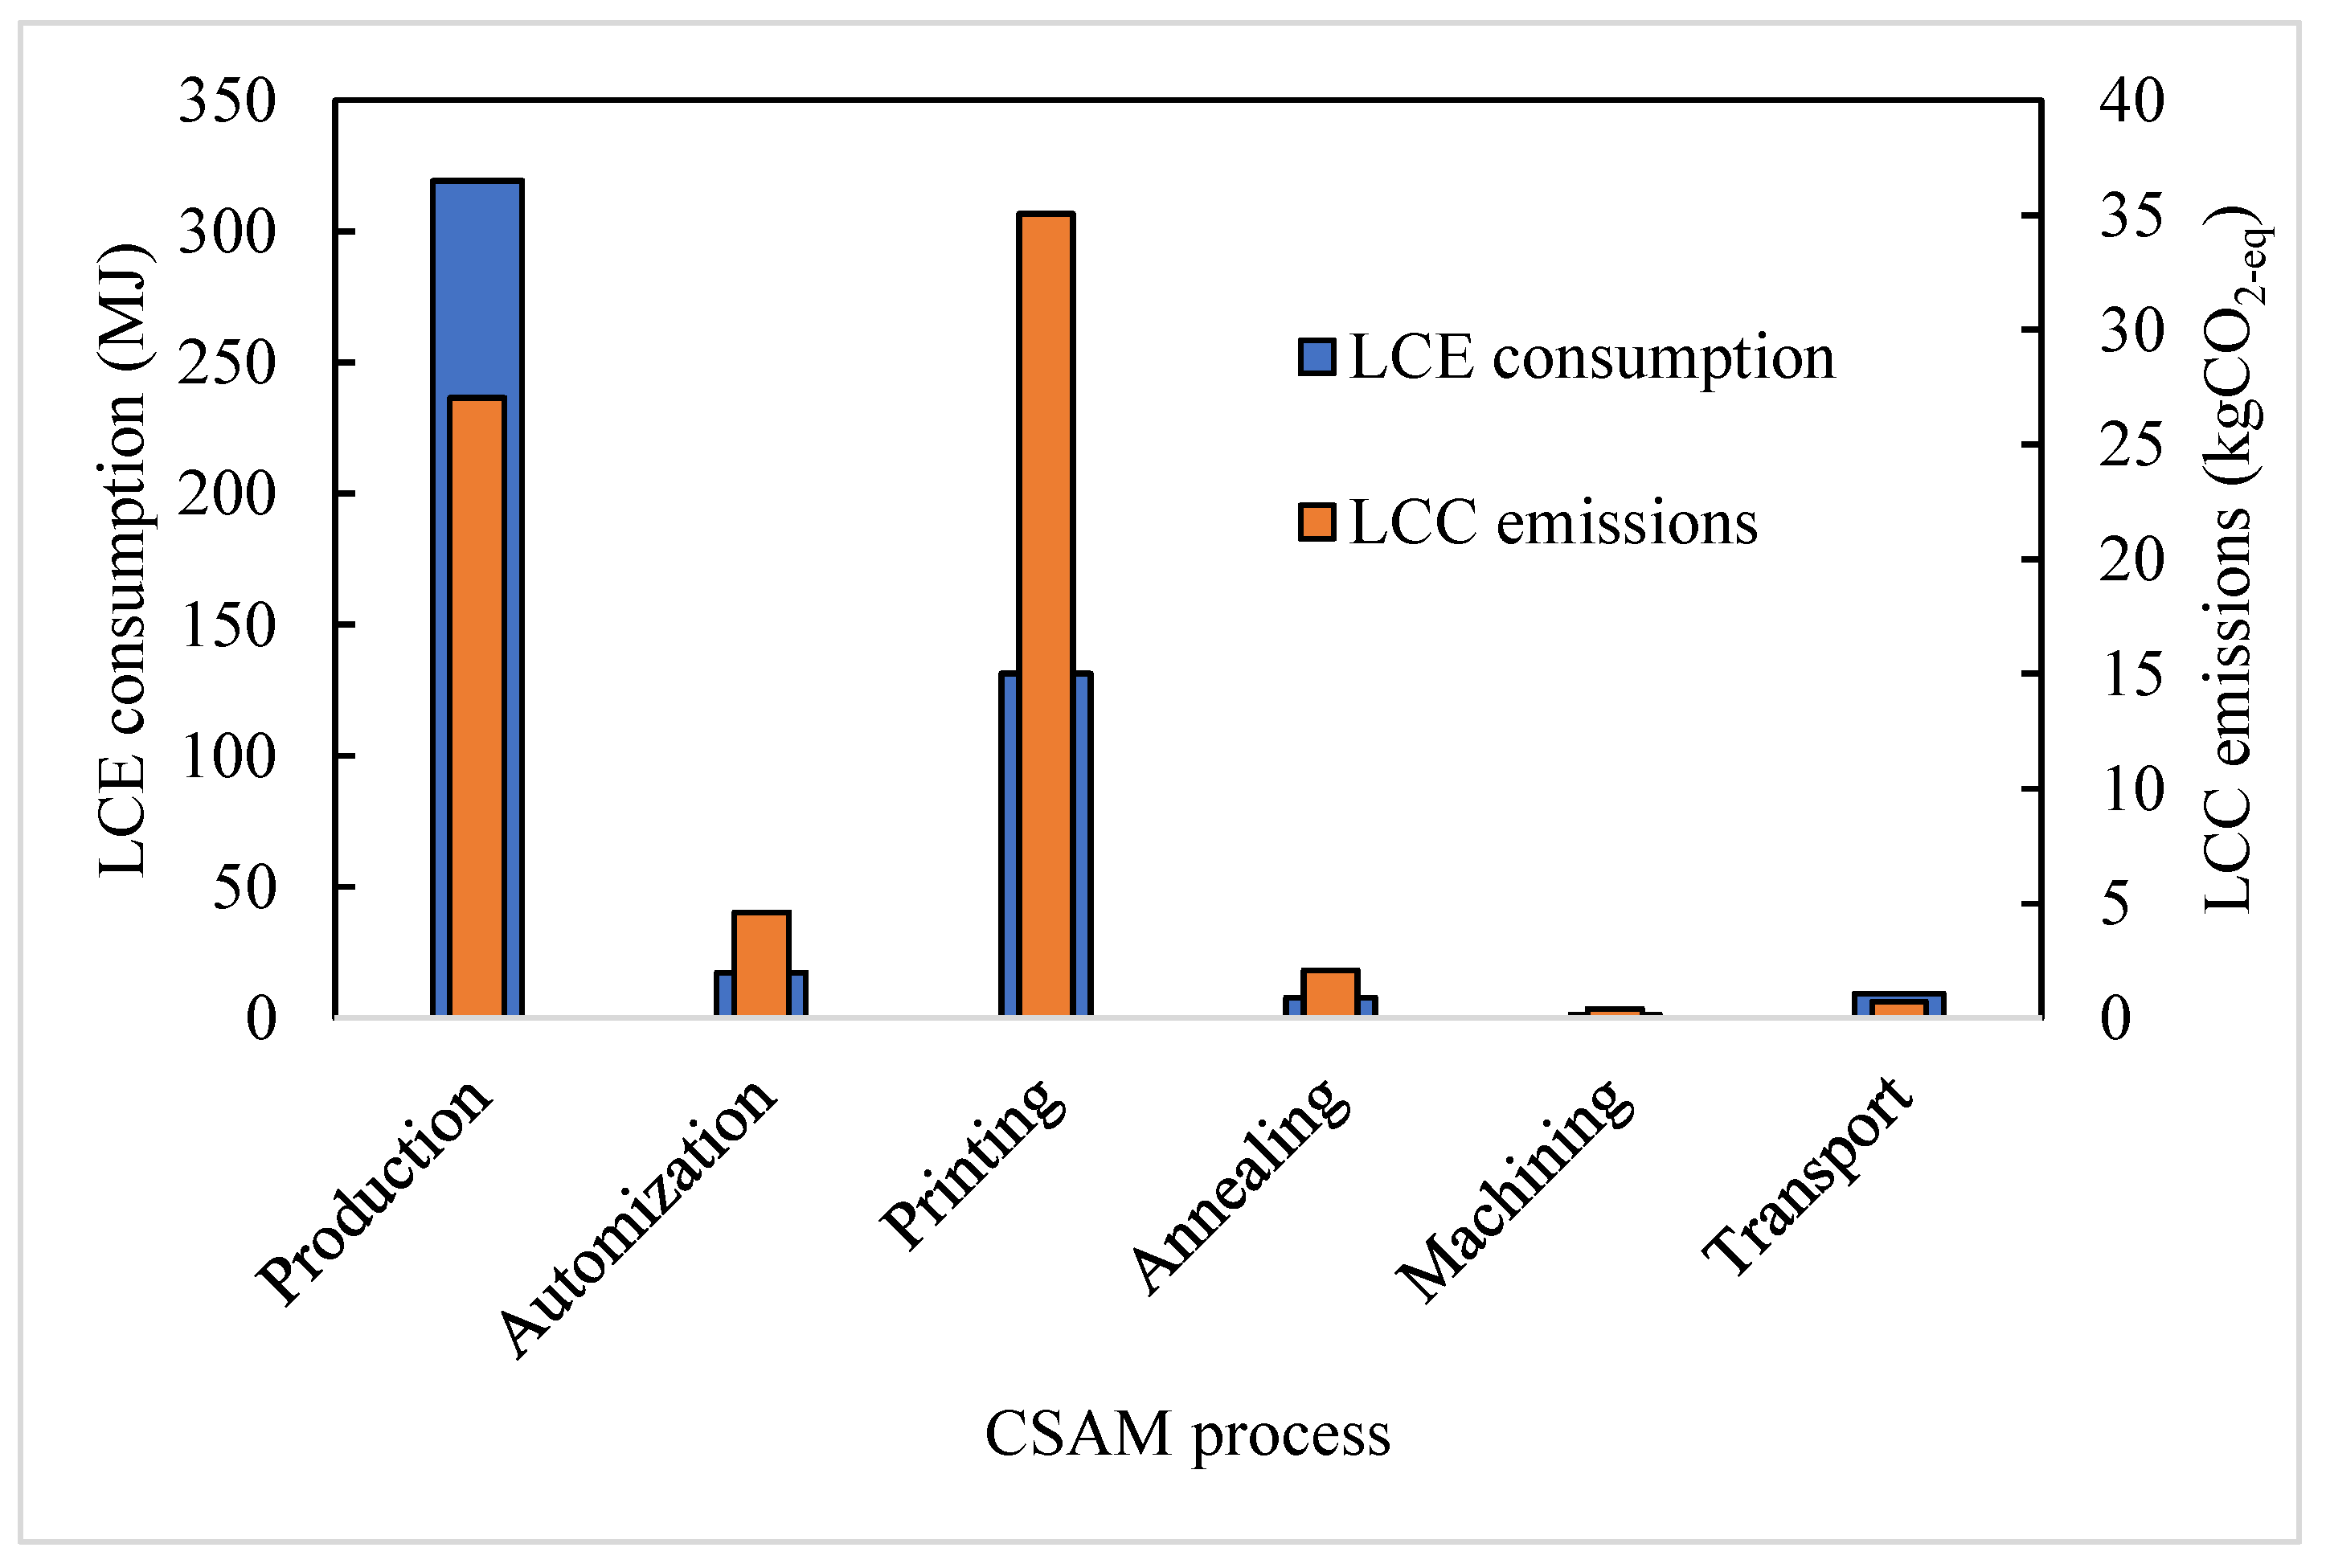
3.1. LCE Consumption and LCC Emissions of CSAM

Figure 6 shows the energy consumption and CO2 emissions for the printed aluminum alloy flange from the CSAM technology. Powder feedstock materials account for two-thirds and one-third of the LCE consumption (319 MJ) and LCC emissions (27 kg CO2-eq) for the printed part, respectively. The feeder alloy was gas atomized to produce powder, with energy use and CO2-eq emissions of 17 MJ and 5 kg CO2-eq, respectively. The printing process consumed less energy than feedstock material production because of its lower energy use in powder heating below the recrystallization temperature and in print arm movements, but it was responsible for high CO2-eq emissions due to a higher electricity emissions factor in Victoria than for natural gas consumption, which is a measure of the total CO2 emissions per unit (kWh) of electricity generated in a particular region. Thus, the operational energy consumption and CO2 emissions were 131 MJ and 35 kg CO2-eq to print the aluminum flange with a deposition efficiency of 78%. The printing process includes the average energy use and CO2 emissions in the air compressor, SPEE3D printer, and exhaust with SECs of 47 MJ/kg, 38 MJ/kg, 5.0 MJ/kg, and 1.0 MJ/kg, respectively. In post-manufacturing, semi-finish flange is annealed to release residual stress associated with the plastic deformation of metallic powder that occurs during printing. It consumes as much electric energy as 8 MJ and produces CO2 emissions of 2 kg CO2-eq. Finally, the heat-treated flange was machined to achieve desirable surface traits. Finish machining hardly consumed more electric energy than 1.03 MJ, emitting negligible CO2-eq. The auxiliary power consumption in the printing and machining process was eliminated due to negligible tooling and working fluid consumption in the machining process, and the absence of printer maintenance due to intermittent operation.

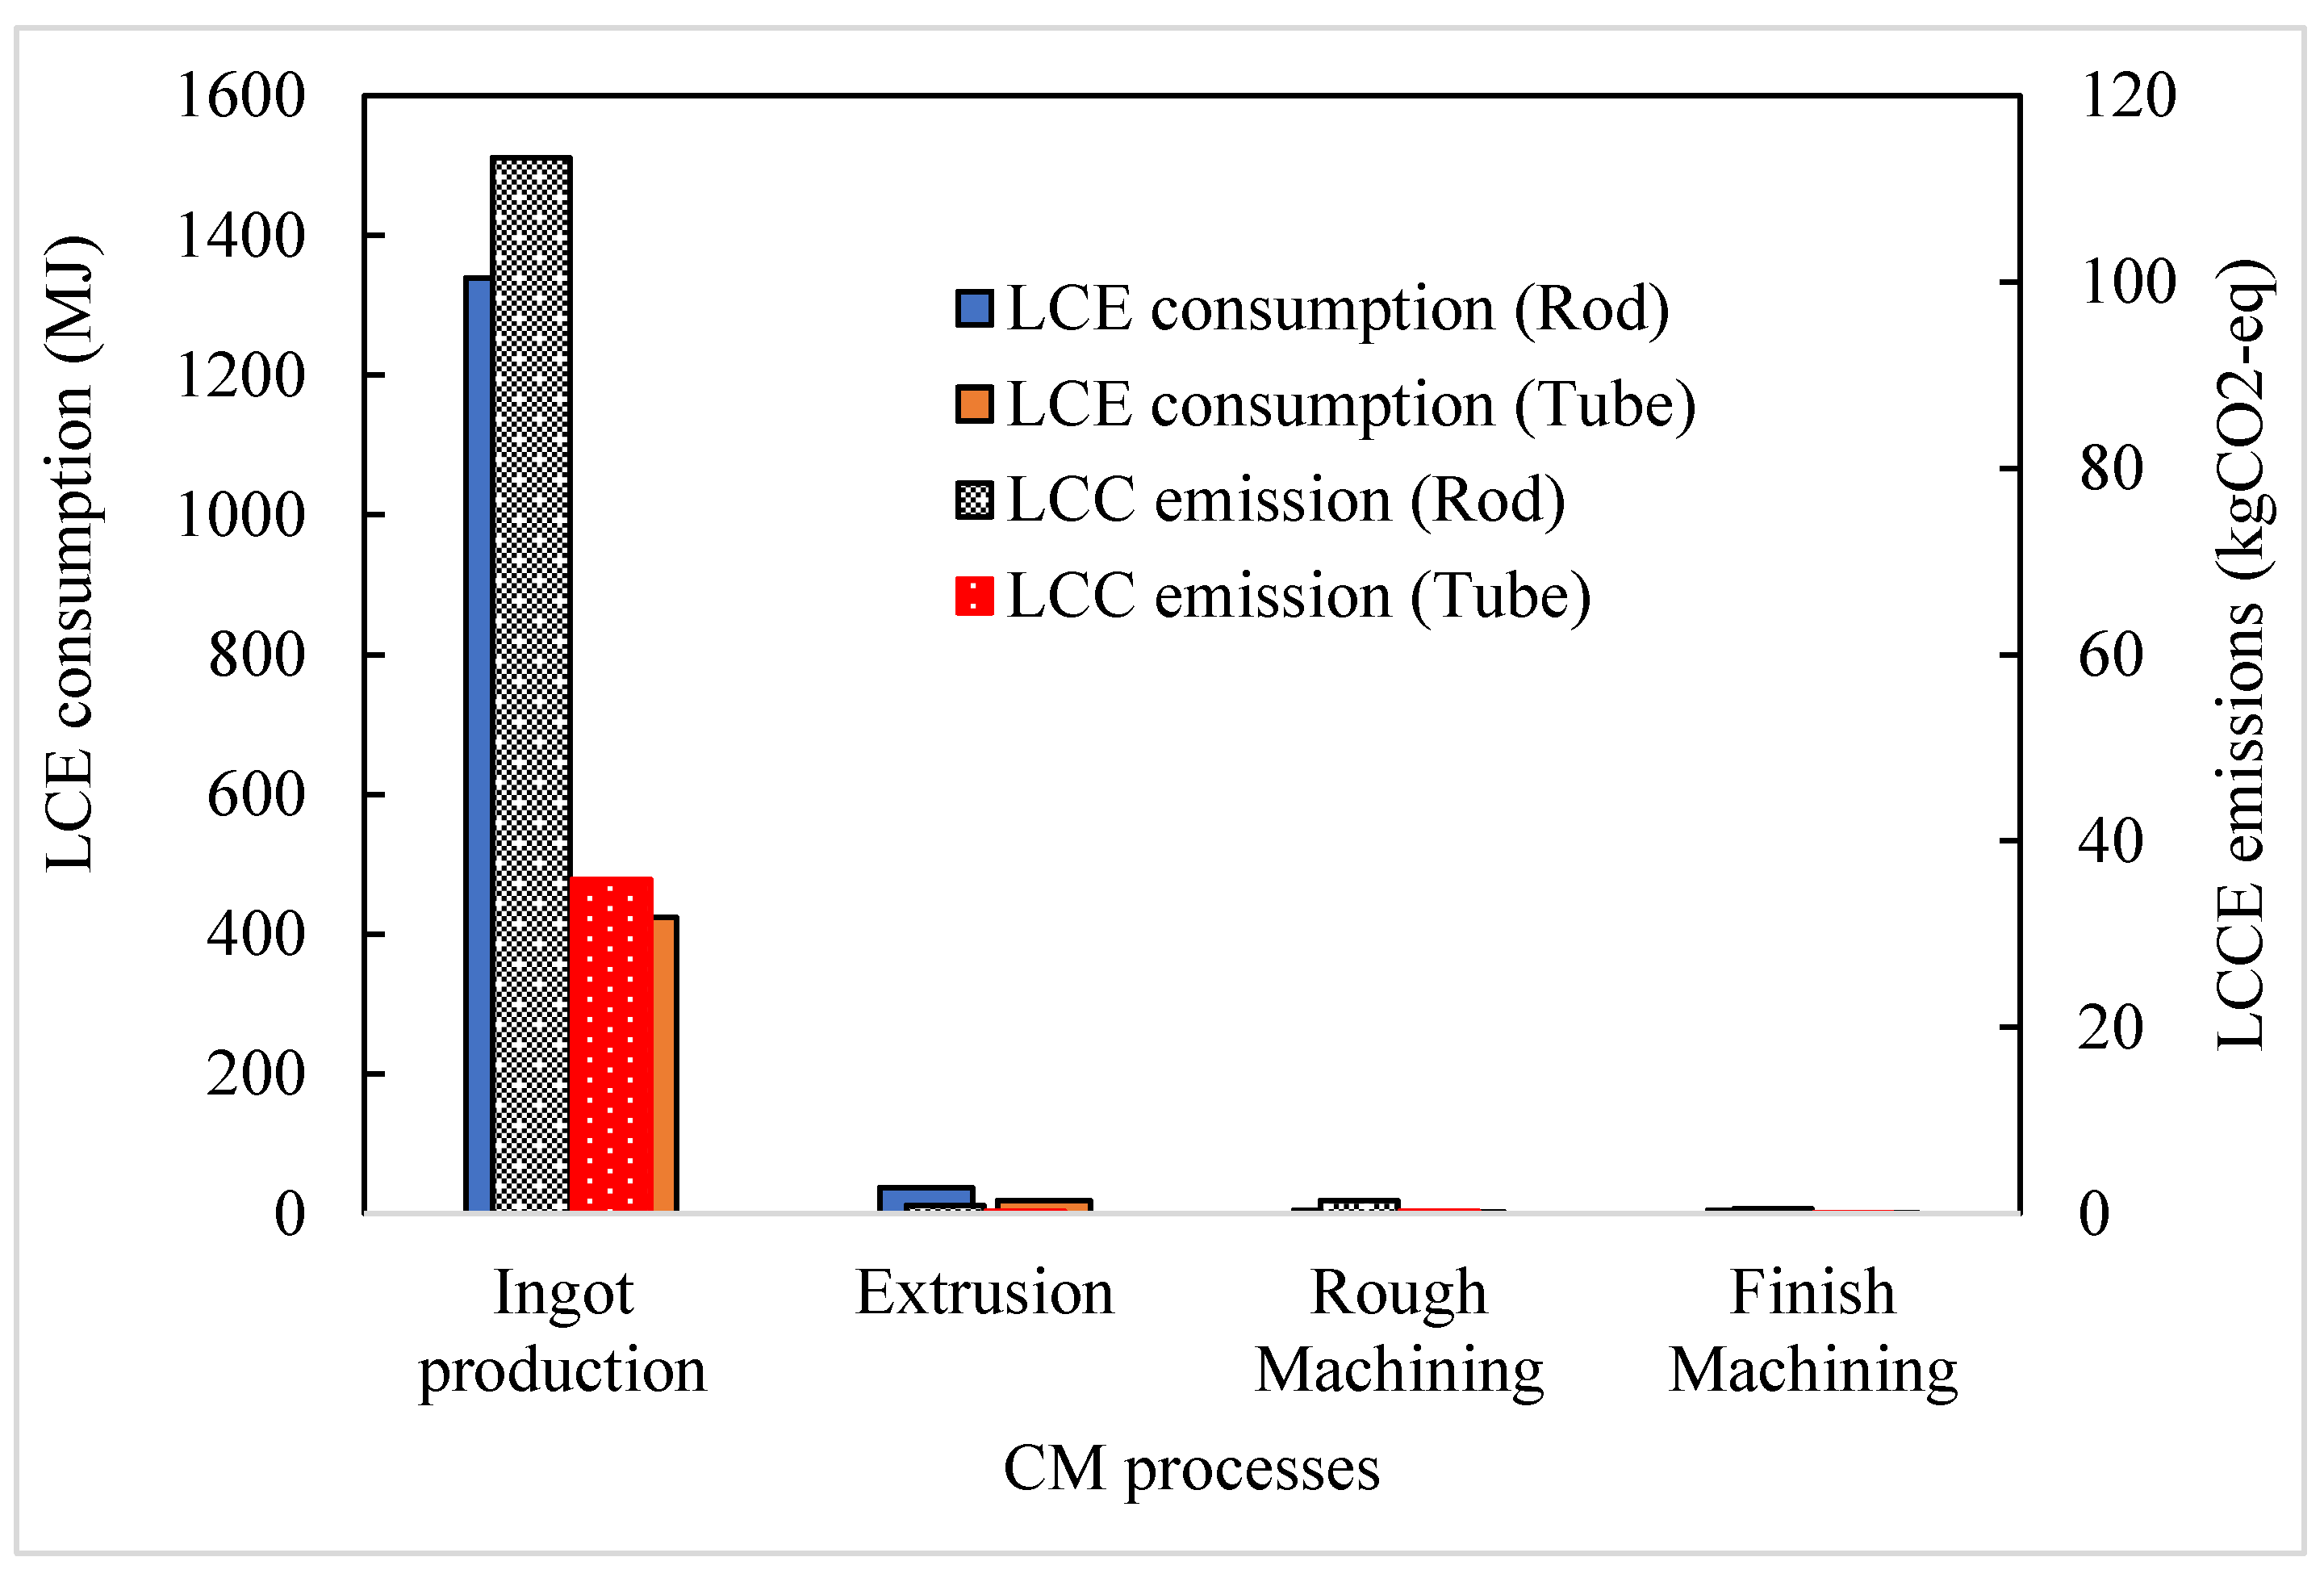
3.2. LCE Consumption and LCC Emissions of CM

Figure 7 shows the LCE consumption and LCC emissions in different process of conventional machining, considering the rod and tube. The primary energy use in producing the bar was three times that of tube production, due to the higher solid to cavity ratio of the flange produced from the standard bar than the tube. The conventional machining of flange had a part to cavity ratio of 85%, which is close to 87% for the machining of the aeroplane part [57]. Overall, the energy use and CO2-eq emissions in different processes of the conventional machining of the bar were three times the energy use and CO2-eq emissions in the conventional machining of of the tube to machine the flange. The ingot production and extrusion processes consumed energies of 1376 MJ and 442 MJ to produce the bar and rod, respectively; they emitted 114 kg CO2-eq and 36 kg CO2-eq, respectively. The conventional machining processes in the abrasive water jet cutting machine and the CNC machine consumed 9 MJ and 4 MJ energy to fabricate the flange using the rod and bar, respectively. The machining process energy consumption was 1% of LCE use, and it was responsible for 1% of the LCC emissions in conventional machining of the flange.

3.3. Parametric Analysis

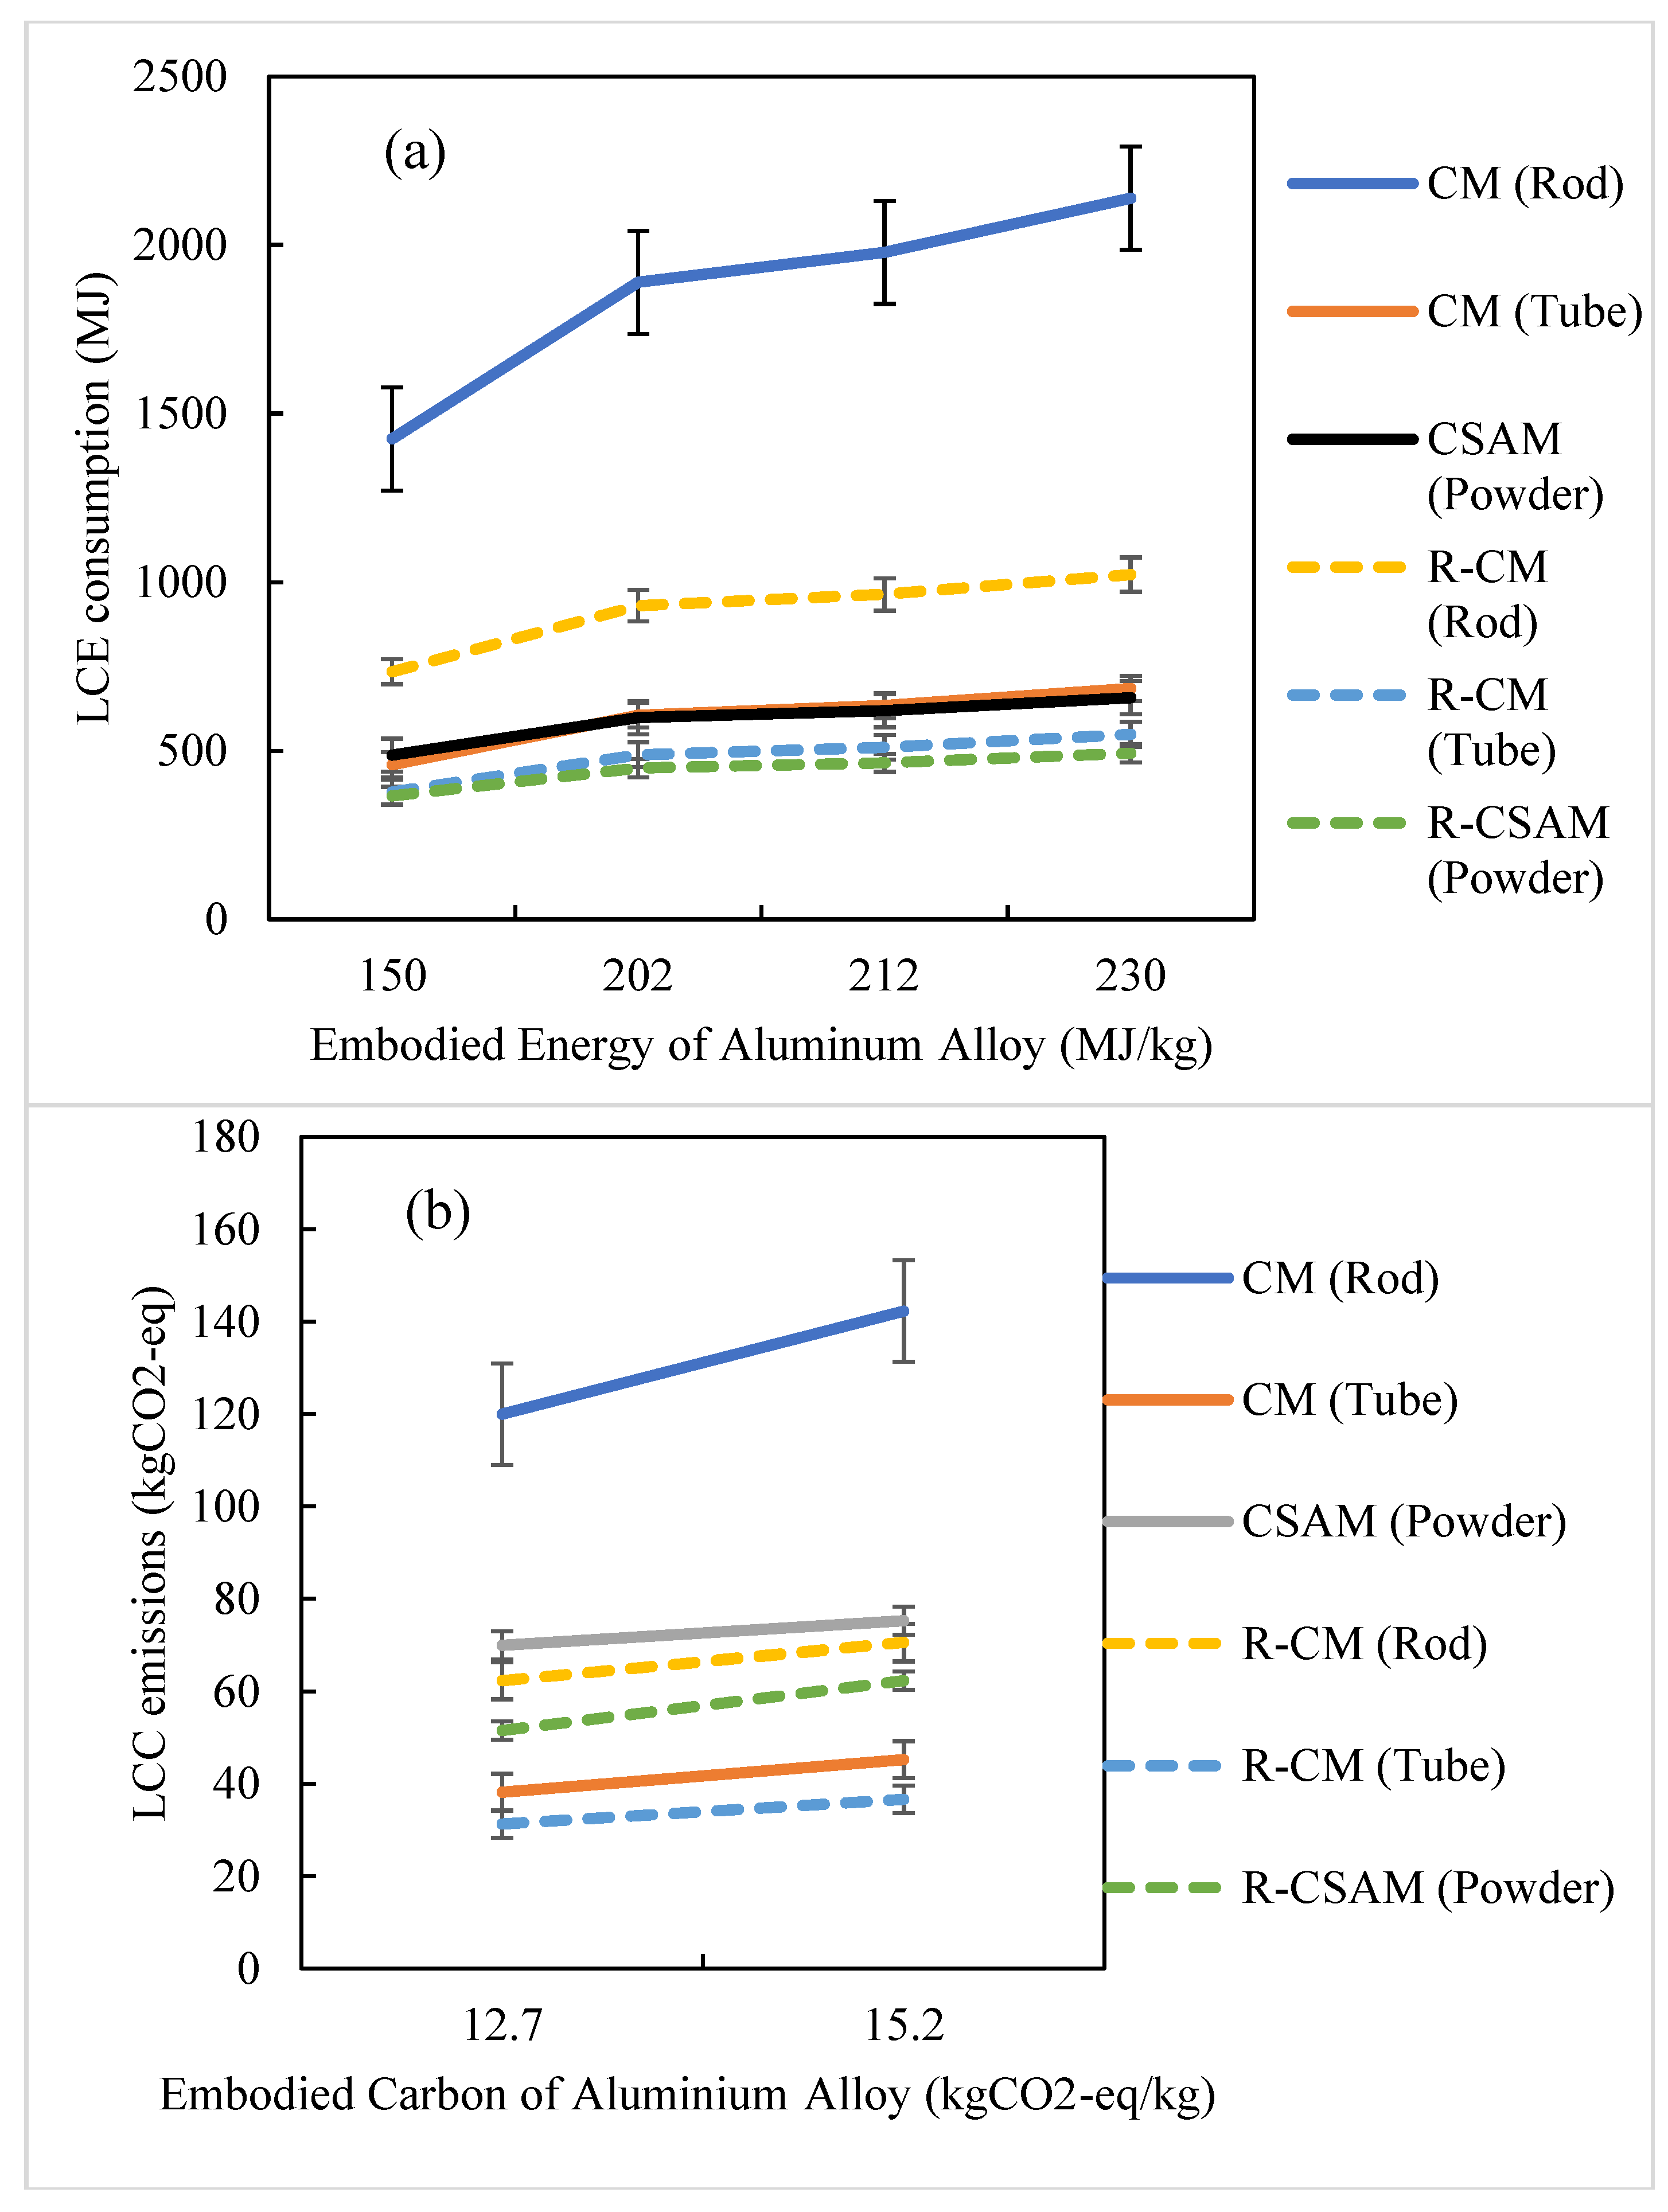
3.3.1. Effect of Energy Use and Emissions Associated with Ingot Production in LCE Consumption and LCC Emission of Printed and Machined Flange with and without Recycling

Figure 8a,b show the effect of the material-embodied energy and embodied carbon on LCE consumption and LCC emissions in the CM and CSAM processes, considering primary materials production and the recycling of scrap and powder waste. The LCE consumption and LCC emissions in the machined flange and the printed flange increased with the increase in embodied energy and embodied carbon because of the rod, tube, and powder production, which were responsible for 97%, 95%, and 70% of energy use and CO2 emissions, respectively. Consequently, the LCE consumption in the machined flange increased by 50% for both feedstock materials, with an uncertainty of 8% by changing the embodied energy from 150 MJ/kg to 230 MJ/kg. Similarly, the LCE consumption in the printed flange increased by 35%, with an uncertainty of 6% by increasing the embodied energy by 70 MJ/kg. The changes in the embodied energy and embodied carbon had a similar impact on LCC emissions in the machined and printed flanges, at estimated uncertainties of 9% and 4%, respectively.
The comparative analysis of the machined and printed flanges revealed that the machined flange that used extruded tube had the lowest environmental impact of 38–45 kg CO2-eq due to the smaller waste production involved, as seen in Figure 8b. The printed flange had moderate emissions of 70–75 kg CO2-eq without any recycling of powder. When the powder and the machined scrapings of the rod and the tube were recycled, the LCC emissions were reduced to 52–62 kg CO2-eq (powder), 31–37 kg CO2-eq (tube), and 61–70 kg CO2-eq (rod), respectively. In the case of recycling, the machined flange from the tube had the lowest environmental impacts, followed by the printed flange, and the machined flange from the rod. Thus, the CSAM technology is an environmentally sustainable alternative to CM of flange from rod instead of tube, due to its high electricity consumption in the printing process. The LCC emissions depend on the emissions factor of electricity. Therefore, the impact of regional emissions factors on LCC emissions associated with the printed and machined flanges are discussed in Section 3.3.2. Considering the emissions factor of Victoria, the machining of the tube is the most eco-efficient process to fabricate flanges for agricultural applications in Victoria.

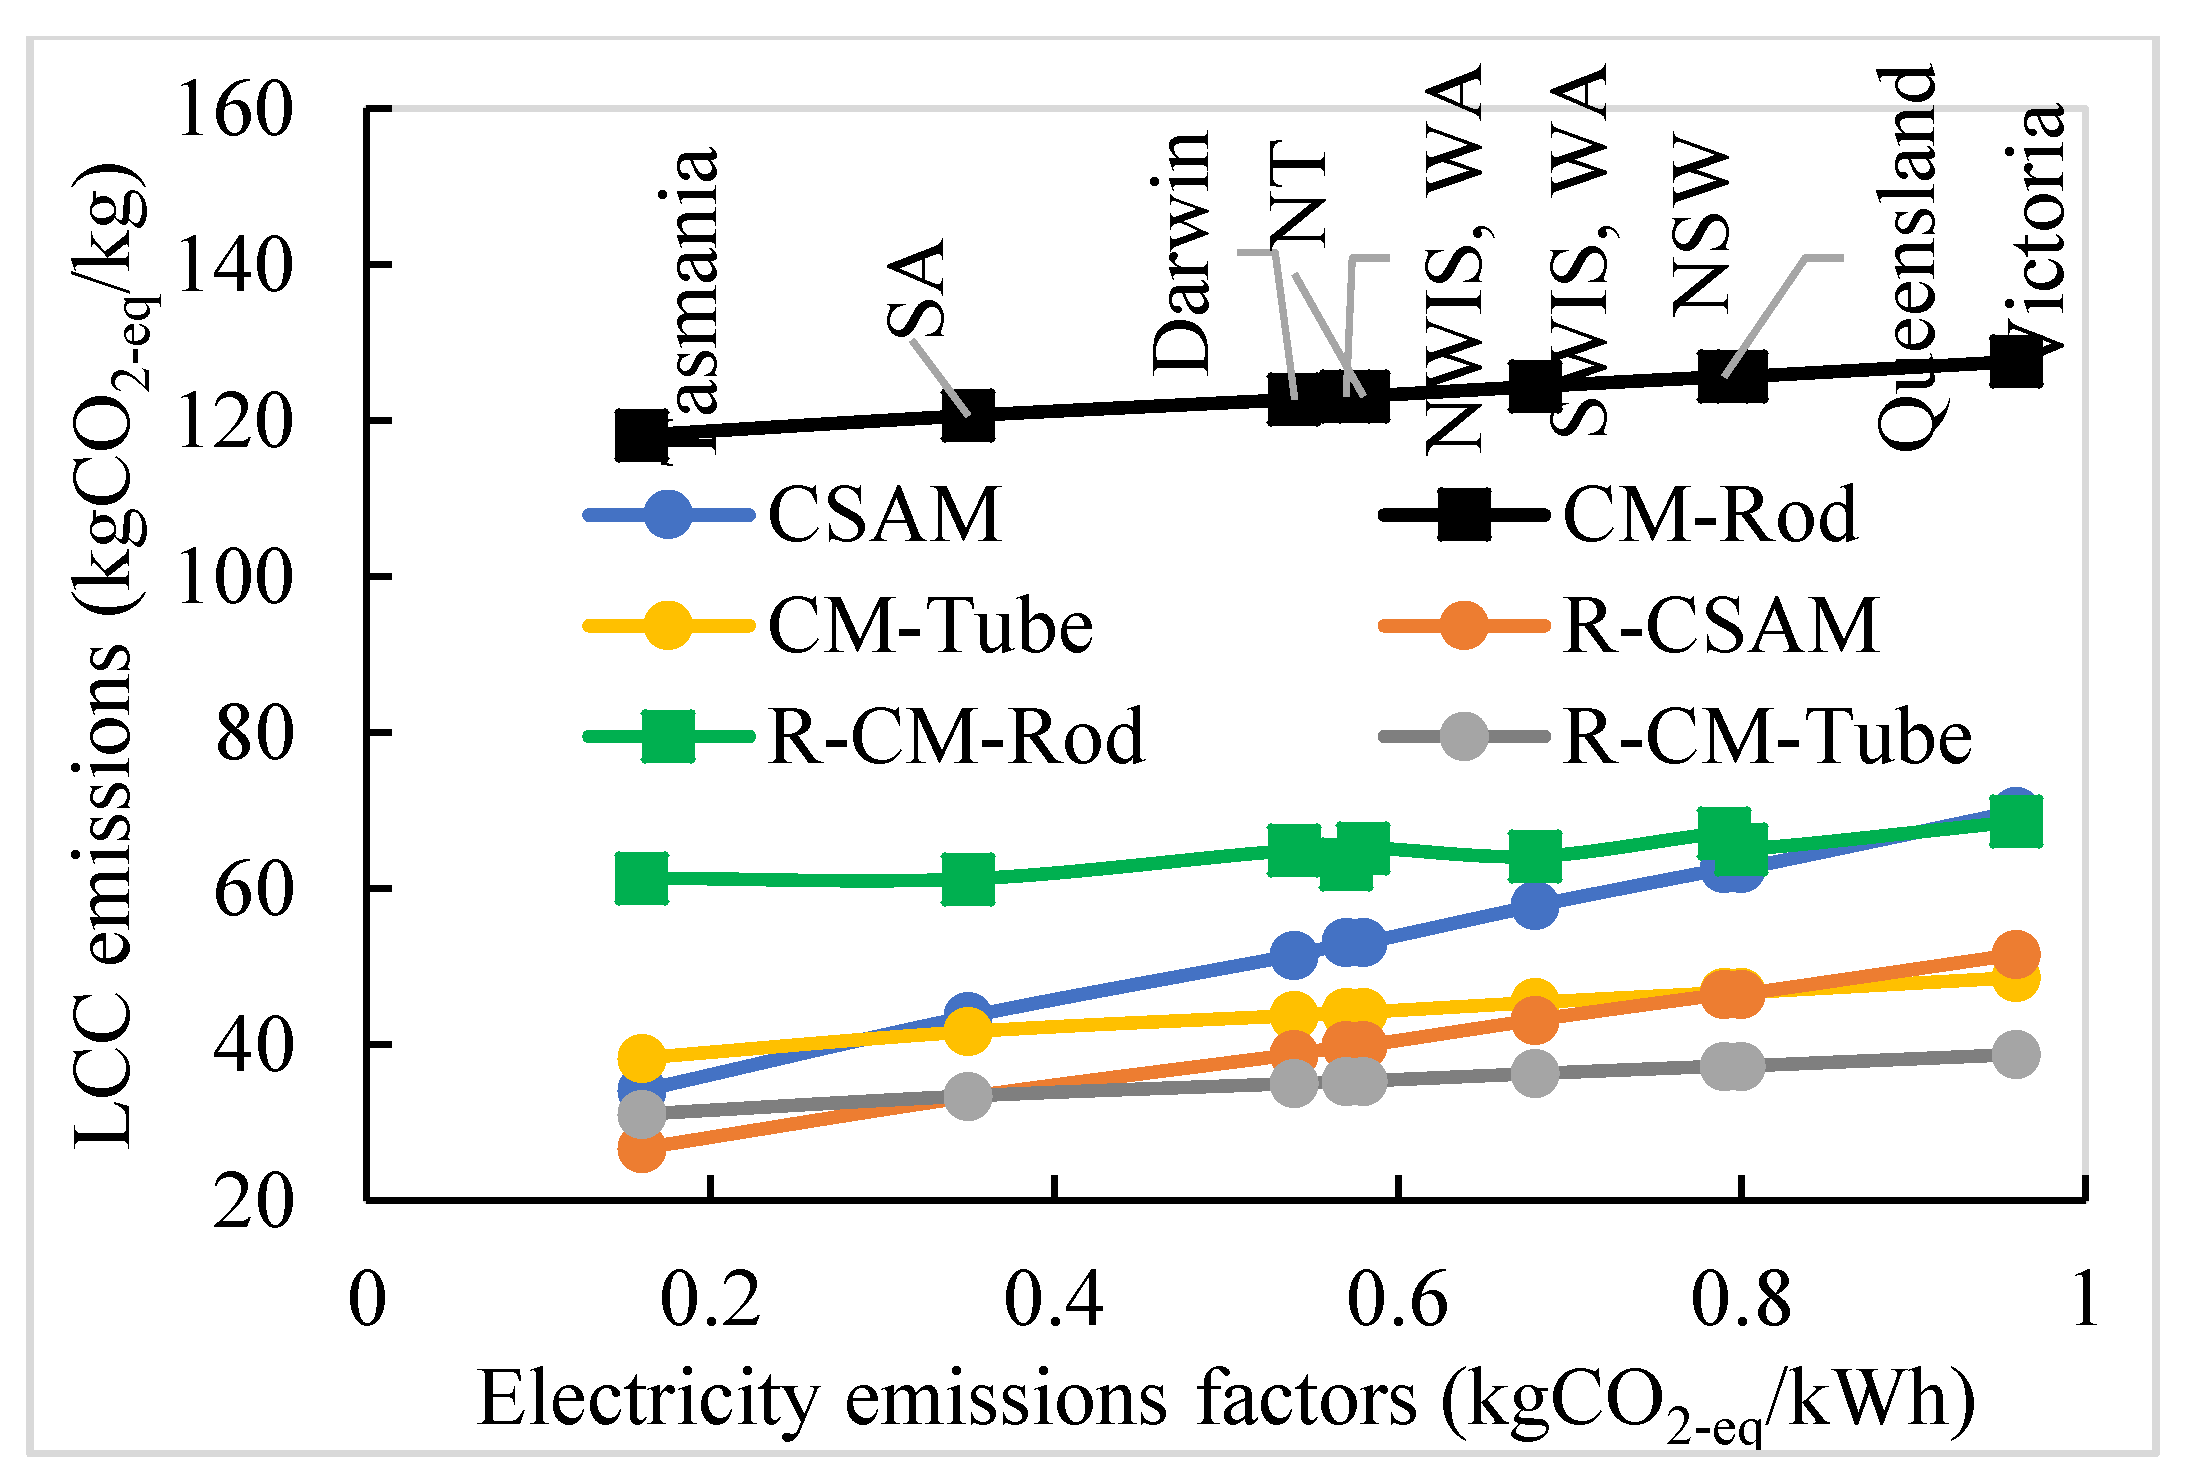
3.3.2. Impacts of Regional Electricity Emissions Factors on LCC Emissions of the Printed and Machined Flanges from Rod and Tube

Table 6 lists information related to regional emissions factors of electricity in Australia. Tasmania mainly generates electricity from renewable energy resources such as hydro power, resulting in the lowest emissions factor of 0.16 kg CO2-eq/kWh, while the Victorian electricity production sector heavily relies on fossil fuels, accounting for the highest emissions of 0.96 kg CO2-eq/kWh. To calculate the LCC emissions of the flange made from various processes in different regions, the regional emissions factor was multiplied with the operational energy consumptions of those processes. Figure 9 shows the impact of regional emissions factors on the LCC emissions of the printed flange and machined flange from the rod and tube, considering powder and scrape recycling. The unit emissions factor increases from Tasmania (0.16 kg CO2-eq) to Victoria (0.96 kg CO2-eq). The LCC emissions of a printed flange in Victoria are three times higher than the same flange printed in Tasmania, i.e., 34.1 kg CO2-eq and 26.7 kg CO2-eq with powder recycling, respectively. Changing the machining of a flange from Tasmania to Victoria increases the LCC emissions by 25–27% and 8–12%, considering tube and rod feedstock, respectively. Considering the present regional emissions factors in Australia, CSAM technology is a more eco-efficient process than CM for rods throughout Australia, with and without scrape recycling. However, it is the only more environmentally sustainable option than machining for tubes in Tasmania and South Australia.

3.3.3. Impact of Regional Electricity Emissions Factors on LCC Emissions of the Printed and Machined Flanges from Rod and Tube

Figure 10 compares the specific energy consumption of CSAM technology with other metal manufacturing technologies. The CSAM process consume less energy to print a part than AM technology, because it coalesces metal powder without melting or heating above the recrystallization temperature. However, other AM technologies use lasers, electron beams, and heating sources to melt or heat powder to combine with each other to make a part in SLM [59], SLS [60], EBM [61], and DMD [62]. However, hybrid technologies and wire arc additive manufacturing consume slightly less or equivalent energy to print a part than CSAM [25]. Moreover, the specific energy consumption depends upon the materials’ properties and deposition rates. For instance, SLM consumes ten times more energy than CSAM to print an aluminum alloy part because it has a lower deposition rate (0.075 g/min) than CSAM (175 g/min) [42]. Moreover, laser-based technologies consume 32 MJ of energy to preheat the printer bed for powder deposition, whilst CSAM consumes only 10 MJ to preheat the printer for a short period of time with compressed air, without using an additional heat source.
However, using aluminum alloy as a raw material in SLS, EBM, and DMD processes can be difficult. These processes use laser beams that reflect from the aluminum surface due to the higher reflectivity of aluminum, which may result in rough surfaces and higher energy consumption [20]. Furthermore, these methods produce aluminum parts by melting the powder above its recrystallization temperature, and thereby introduce metallurgical defects.

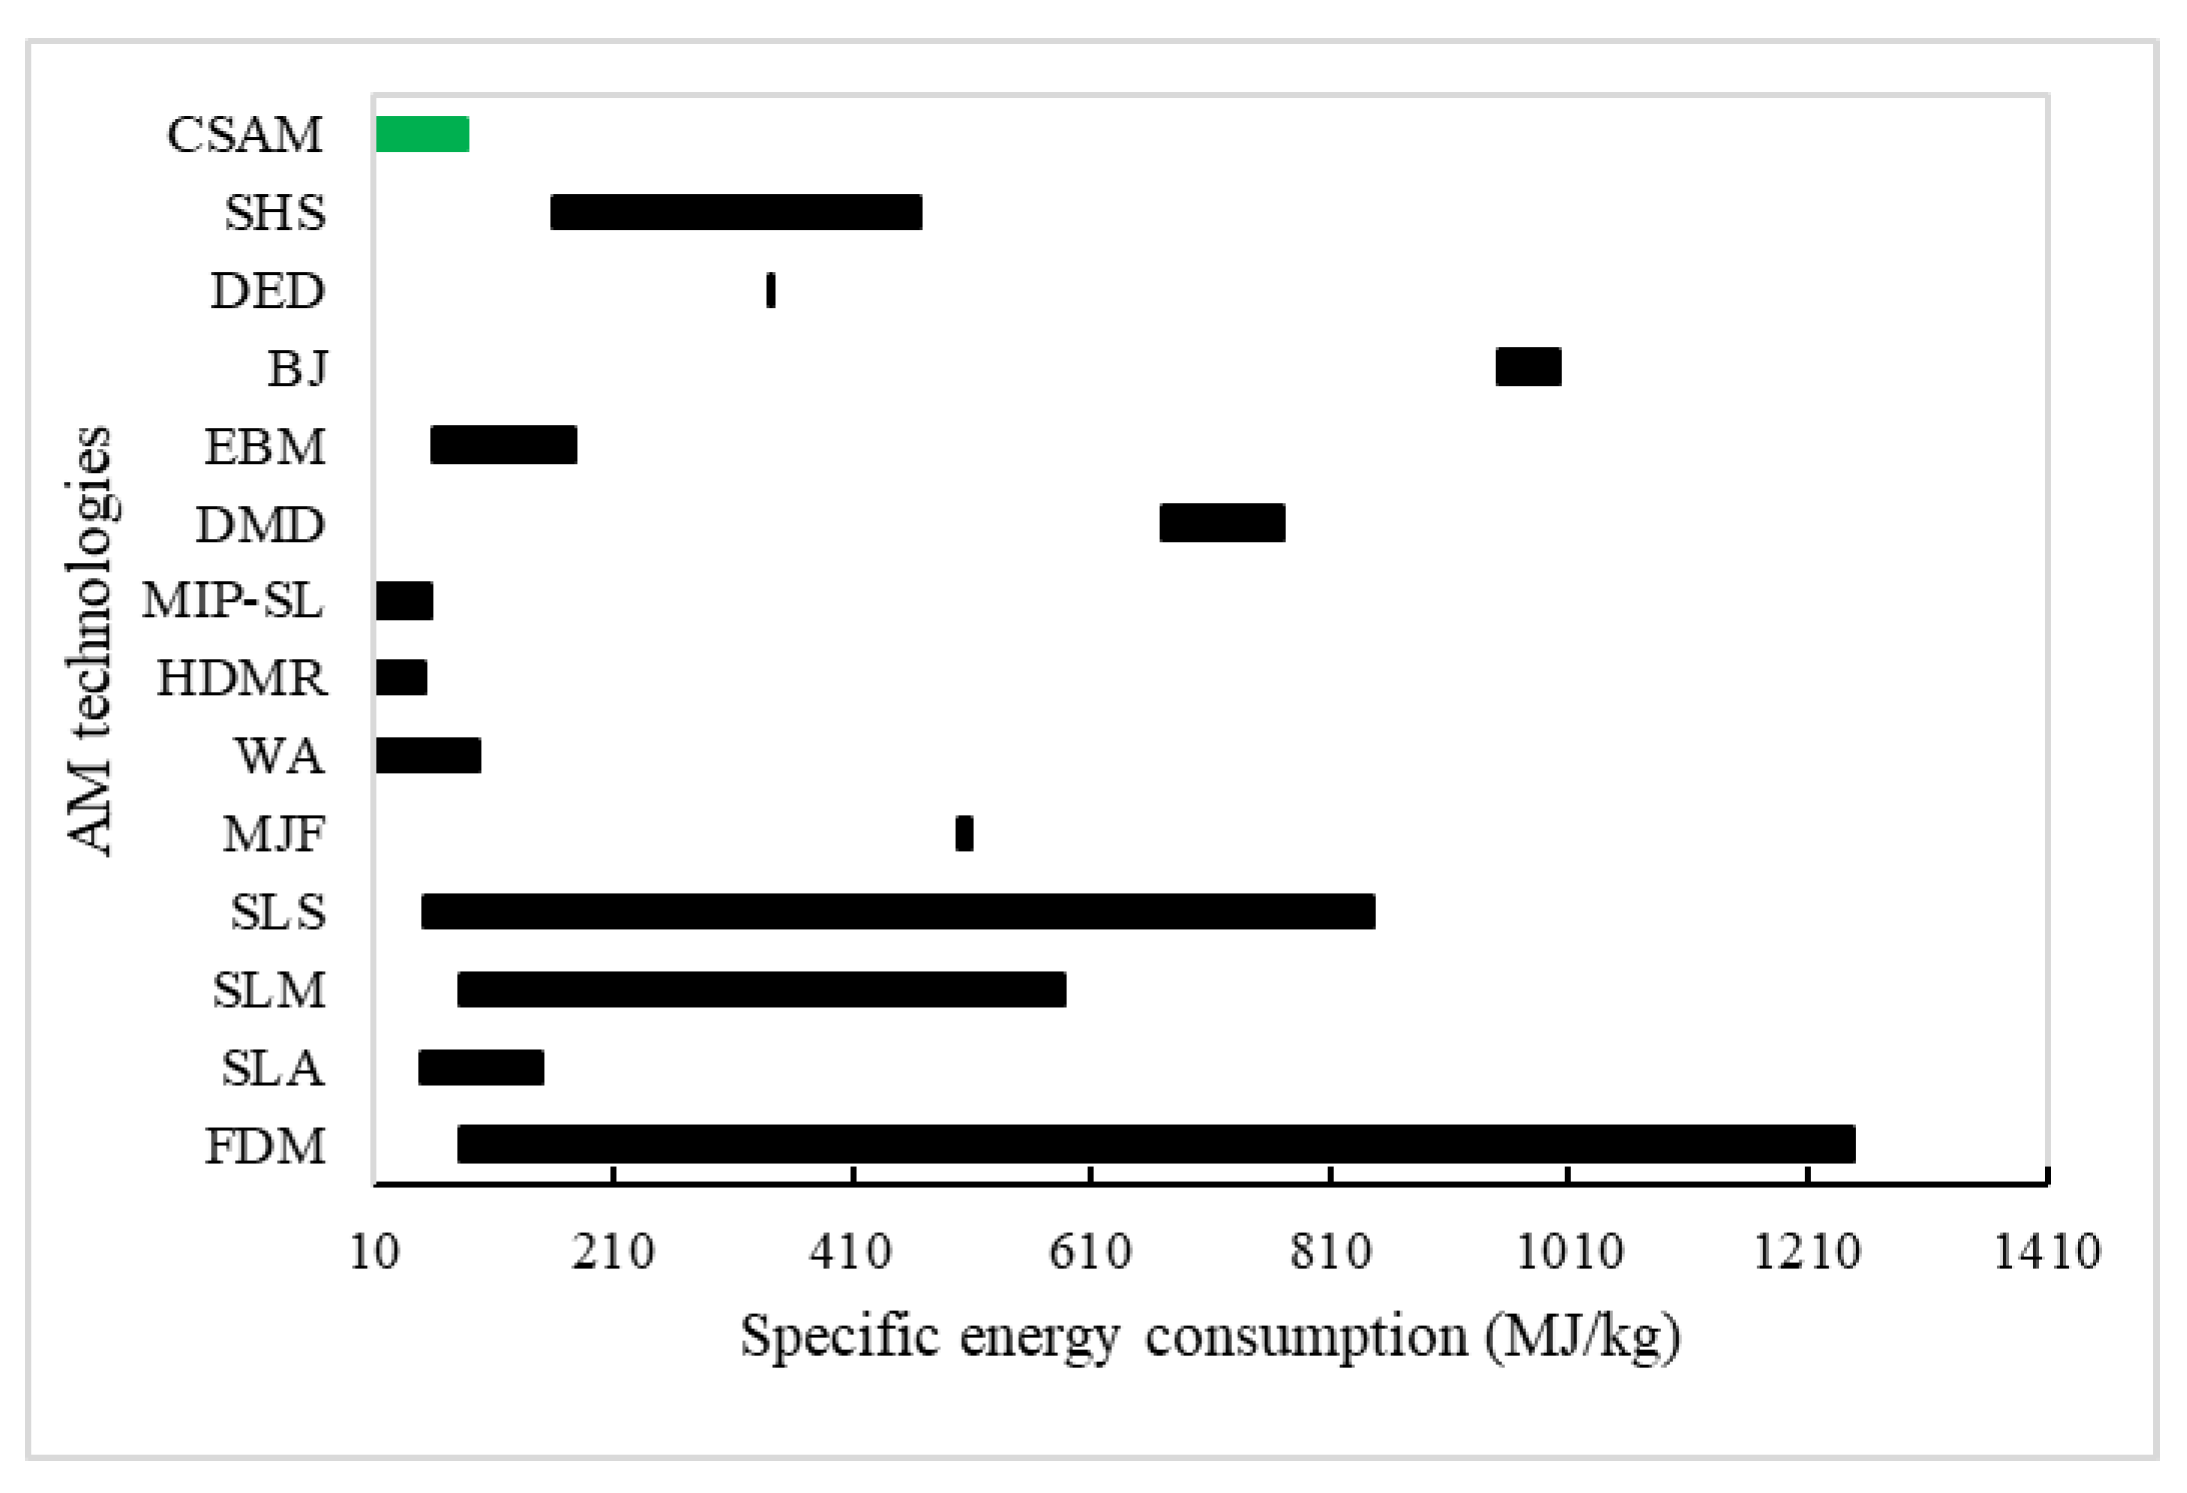
3.4. Qualitative Comparison of CSAM Technology with Conventional Manufacturing

The study considered the energy consumption for CM and CSAM, but there are also some intangibles that need to be considered. For example, the lead time needed to procure a part through the supply chain may affect the production capabilities of CM. The cost and energy losses can be substantial, and these were not considered in this investigation. This is especially true for time-critical industries such as farming, where the weather is beyond control. This may also be true for defense forces in the middle of a war. Such losses can be mitigated through producing parts using digital manufacturing methods like CSAM.
Moreover, the storage of parts requires large warehouses and manpower to manage. Sometimes, the stored parts may have to be kept in controlled environmental conditions. Furthermore, when a design modification must be made in conventional manufacturing, significant money, time, and energy must be spent on changing molds or dies. Hopefully, the changes are acceptable within the first iteration. However, in digital manufacturing, there is little effort required to make changes, as the manufacturing is freeform. Time considerations and change cycles consume energy downstream, and these can be substantial. Further research is needed to resolve some of these issues.

4. Conclusions

This study investigated the environmental impacts of a metal flange printed with a CSAM process compared with that of machined flange process. An aluminum alloy flange was considered as the functional unit. While calculating the environmental impact of various processes, the impacts of the embodied energy and embodied carbon of various ingot materials and metal recycling were also considered. The comparative analysis revealed that the tube-based machined flange (31 kg CO2-eq) accounted for one-third of the LCC emissions associated with the rod-based flange (114 kg CO2-eq). However, the printed flange had moderate LCC emissions of 70–75 kg CO2-eq, which were reduced to 52–62 kg CO2-eq when recycling of the powder was considered. The increasing embodied energy and embodied carbon of aluminum alloy increased LCE consumption by 49–50% for the machined flange and 35% for the printed flange. Similarly, the LCC emissions increased by 19% and 8% for the machined and printed flanges, with estimated uncertainties of 9% and 4%, respectively.
Finally, the impacts of regional emissions factors on LCE consumption and LCC emission were also investigated. Regional production of the printed and machined flanges revealed that the LCC emissions of the printed flange in Victoria were three times higher than that for the printed flange in Tasmania. For the same region, the machined flange resulted in only 8–12% and 25–17% increases in LCC emissions for the tube and rod feedstock, respectively.
In conclusion, CSAM is a more eco-efficient process than CM for flanges in Tasmania and South Australia. For other Australian regions, CM of flange from tube is the most environmentally friendly process.

5. Future Research Directions

The following are potential future research directions:
  • The present study will be compared with conventional metal forming processes, considering the mass production of components and complex geometric parts. Hence, previous studies also demonstrated that AM processes are only eco-efficient for complex geometry parts from a life cycle perspective [23].
  • Life cycle cost analyses should be conducted to investigate the economic benefits of CSAM technology over other CM processes and AM technologies.
  • A detailed parametric study will be conducted by developing a theoretical analytical model considering several design and operating parameters of CSAM processes, using the law of mass conservation, and the first and second laws of thermodynamics.
  • A comprehensive life cycle assessment will be conducted for different additive and traditional manufacturing technologies considering the same materials, and the operational energy use in each process will be monitored through a pilot case study.
CSAM processes will be a sustainable option throughout Australia due to their complete transition from fossil fuels to renewable energy production.

Author Contributions

Conceptualization, D.K. and S.P.; methodology, D.K. and K.K.; software, M.M.A.; validation, D.K., K.K. and S.P.; formal analysis, D.K.; investigation, D.K. and M.M.A.; resources, M.M.A.; data curation, K.K.; writing—original draft preparation, D.K.; writing—review and editing, S.P.; visualization, S.P.; supervision, M.M.A.; project administration, S.P.; funding acquisition, M.M.A. All authors have read and agreed to the published version of the manuscript.

Funding

This research was funded by AUSTRALIAN POSTGRADUATE RESEARCH, grant number int-1114″. APR.Intern (aprintern.org.au).

Data Availability Statement

Data will be available on request.

Acknowledgments

This research was supported by the Australian Postgraduate Research Internship program and SPEE3D. The authors would like to acknowledge the support of Novana Hutosait and Mohammed Abdul Khaliq from Swinburne University of Technology, and Byron Kennedy and Steve Camilleri from SPEE3D, Australia, for their in-kind support.

Conflicts of Interest

The authors declare no conflict of interest. The funders had no role in the design of the study; in the collection, analyses, or interpretation of data; in the writing of the manuscript; or in the decision to publish the results.

Nomenclature

m C M Raw material used in CM (kg)
m C S A M Raw material used in CSAM (kg)
m p a r t Mass of part (kg)
η e x t Resource efficiency of extrusion (%)
η C M Resource efficiency of CM (%)
η C S A M Deposition efficiency (%)
E E i n g o t Embodied Energy of ingot (MJ/kg)
E E r e c y c l e Embodied energy of recycled material (MJ/kg)
E E C T Embodied energy of cutting tool (MJ/kg)
E E C F Embodied energy of cutting fluid (MJkg)
m ˙ C F Mass flow rate of cutting fluid (kg/h)
E C M Primary energy production in CM (MJ/kg)
E C S A M Primary energy production in CSAM (MJ/kg)
MRRMaterial removal rate (mm3/sec)
SECSpecific energy consumption (MJ/kg)
AMAdditive manufacturing
CEDCumulative energy demand
CMConventional machining
CSAMCold spray additive manufacturing
CNCComputerized numerical control
CO2PECooperative effort on process emissions in manufacturing
DMDDirect metal deposition
FDMFused deposit modeling
GHGGreenhouse gas emissions
HDMRHybrid deposition and micro rolling
IEAInternational Energy Agency
LPBFLaser powder bed fusion
LCCLife cycle carbon
LCELife cycle energy
MIP-SLMask-image-projection-based stereolithography
MJFMulti-jet fusion
SLMSelective laser melting
SLSSelective laser sintering
SLAStereolithography
WAWire arc

References

  1. Kumar, D.; Memon, R.A.; Memon, A.G. Energy Analysis of Selected Air Distribution System of Heating, Ventilation and Air Conditioning System: A Case Study of a Pharmaceutical Company. Mehran Univ. Res. J. Eng. Technol. 2017, 36, 745–756. [Google Scholar] [CrossRef]
  2. Gao, C.; Wolff, S.; Wang, S. Eco-friendly additive manufacturing of metals: Energy efficiency and life cycle analysis. J. Manuf. Syst. 2021, 60, 459–472. [Google Scholar] [CrossRef]
  3. IEA. CO2 Emissions from Fuel Combustion Highlights. In Proceedings of the Twentieth Session of the Conference of the Parties to the Climate Change Convention (COP 20), in Conjunction with the Tenth Meeting of the Parties to the Kyoto Protocol (CMP 10), Lima, Peru, 1–12 December 2014; pp. 1–123. [Google Scholar]
  4. Gutowski, T.G.; Sahni, S.; Allwood, J.M.; Ashby, M.F.; Worrell, E. The energy required to produce materials: Constraints on energy-intensity improvements, parameters of demand. Philos. Trans. R. Soc. A Math. Phys. Eng. Sci. 2013, 371, 20120003. [Google Scholar] [CrossRef]
  5. Ford, S.; Despeisse, M. Additive manufacturing and sustainability: An exploratory study of the advantages and challenges. J. Clean. Prod. 2016, 137, 1573–1587. [Google Scholar] [CrossRef]
  6. Zhu, Q.; Li, X.; Li, F.; Zhou, D. The potential for energy saving and carbon emission reduction in China’s regional industrial sectors. Sci. Total Environ. 2020, 716, 135009. [Google Scholar] [CrossRef] [PubMed]
  7. Sgarbossa, F.; Peron, M.; Lolli, F.; Balugani, E. Conventional or additive manufacturing for spare parts management: An extensive comparison for Poisson demand. Int. J. Prod. Econ. 2021, 233, 107993. [Google Scholar] [CrossRef]
  8. de Oliveira Campos, F.; Araujo, A.C.; Jardini Munhoz, A.L.; Kapoor, S.G. The influence of additive manufacturing on the micromilling machinability of Ti6Al4V: A comparison of SLM and commercial workpieces. J. Manuf. Process. 2020, 60, 299–307. [Google Scholar] [CrossRef]
  9. Ingarao, G.; Priarone, P.C. A comparative assessment of energy demand and life cycle costs for additive- and subtractive-based manufacturing approaches. J. Manuf. Process. 2020, 56, 1219–1229. [Google Scholar] [CrossRef]
  10. Rejeski, D.; Zhao, F.; Huang, Y. Research needs and recommendations on environmental implications of additive manufacturing. Addit. Manuf. 2018, 19, 21–28. [Google Scholar] [CrossRef]
  11. Liu, Z.; Jiang, Q.; Ning, F.; Kim, H.; Cong, W.; Xu, C.; Zhang, H.-C. Investigation of Energy Requirements and Environmental Performance for Additive Manufacturing Processes. Sustainability 2018, 10, 3606. [Google Scholar] [CrossRef]
  12. Böckin, D.; Tillman, A.-M. Environmental assessment of additive manufacturing in the automotive industry. J. Clean. Prod. 2019, 226, 977–987. [Google Scholar] [CrossRef]
  13. Yin, S.; Cavaliere, P.; Aldwell, B.; Jenkins, R.; Liao, H.; Li, W.; Lupoi, R. Cold spray additive manufacturing and repair: Fundamentals and applications. Addit. Manuf. 2018, 21, 628–650. [Google Scholar] [CrossRef]
  14. Gutowski, T.; Jiang, S.; Cooper, D.; Corman, G.; Hausmann, M.; Manson, J.-A.; Schudeleit, T.; Wegener, K.; Sabelle, M.; Ramos-Grez, J.; et al. Note on the Rate and Energy Efficiency Limits for Additive Manufacturing. J. Ind. Ecol. 2017, 21, S69–S79. [Google Scholar] [CrossRef]
  15. Atzeni, E.; Barletta, M.; Calignano, F.; Iuliano, L.; Rubino, G.; Tagliaferri, V. Abrasive Fluidized Bed (AFB) finishing of AlSi10Mg substrates manufactured by Direct Metal Laser Sintering (DMLS). Addit. Manuf. 2016, 10, 15–23. [Google Scholar] [CrossRef]
  16. Hutasoit, N.; Javed, M.A.; Rashid, R.A.R.; Wade, S.; Palanisamy, S. Effects of build orientation and heat treatment on microstructure, mechanical and corrosion properties of Al6061 aluminium parts built by cold spray additive manufacturing process. Int. J. Mech. Sci. 2021, 204, 106526. [Google Scholar] [CrossRef]
  17. Yoon, H.-S.; Lee, J.-Y.; Kim, H.-S.; Kim, M.-S.; Kim, E.-S.; Shin, Y.-J.; Chu, W.-S.; Ahn, S.-H. A comparison of energy consumption in bulk forming, subtractive, and additive processes: Review and case study. Int. J. Precis. Eng. Manuf.-Green Technol. 2015, 1, 261–279. [Google Scholar] [CrossRef]
  18. Kellens, K.; Baumers, M.; Gutowski, T.G.; Flanagan, W.; Lifset, R.; Duflou, J.R. Environmental Dimensions of Additive Manufacturing: Mapping Application Domains and Their Environmental Implications. J. Ind. Ecol. 2017, 21, S49–S68. [Google Scholar] [CrossRef]
  19. Peng, S.; Li, T.; Wang, X.; Dong, M.; Liu, Z.; Shi, J.; Zhang, H. Toward a Sustainable Impeller Production: Environmental Impact Comparison of Different Impeller Manufacturing Methods. J. Ind. Ecol. 2017, 21, S216–S229. [Google Scholar] [CrossRef]
  20. Ingarao, G.; Priarone, P.C.; Deng, Y.; Paraskevas, D. Environmental modelling of aluminium based components manufacturing routes: Additive manufacturing versus machining versus forming. J. Clean. Prod. 2018, 176, 261–275. [Google Scholar] [CrossRef]
  21. Watson, J.K.; Taminger, K.M.B. A decision-support model for selecting additive manufacturing versus subtractive manufacturing based on energy consumption. J. Clean. Prod. 2018, 176, 1316–1322. [Google Scholar] [CrossRef]
  22. Yang, S.; Min, W.; Ghibaudo, J.; Zhao, Y.F. Understanding the sustainability potential of part consolidation design supported by additive manufacturing. J. Clean. Prod. 2019, 232, 722–738. [Google Scholar] [CrossRef]
  23. Torres-Carrillo, S.; Siller, H.R.; Vila, C.; López, C.; Rodríguez, C.A. Environmental analysis of selective laser melting in the manufacturing of aeronautical turbine blades. J. Clean. Prod. 2020, 246, 119068. [Google Scholar] [CrossRef]
  24. Wippermann, A.; Gutowski, T.G.; Denkena, B.; Dittrich, M.A.; Wessarges, Y. Electrical energy and material efficiency analysis of machining, additive and hybrid manufacturing. J. Clean. Prod. 2020, 251, 119731. [Google Scholar] [CrossRef]
  25. Zhang, H.; Huang, C.; Wang, G.; Li, R.; Zhao, G. Comparison of energy consumption between hybrid deposition & micro-rolling and conventional approach for wrought parts. J. Clean. Prod. 2021, 279, 123307. [Google Scholar] [CrossRef]
  26. Saboori, A.; Aversa, A.; Marchese, G.; Biamino, S.; Lombardi, M.; Fino, P. Application of Directed Energy Deposition-Based Additive Manufacturing in Repair. Appl. Sci. 2019, 9, 3316. [Google Scholar] [CrossRef]
  27. Morrow, W.; Qi, H.; Kim, I.; Mazumder, J.; Skerlos, S. Environmental aspects of laser-based and conventional tool and die manufacturing. J. Clean. Prod. 2007, 15, 932–943. [Google Scholar] [CrossRef]
  28. Priarone, P.C.; Campatelli, G.; Catalano, A.R.; Baffa, F. Life-cycle energy and carbon saving potential of Wire Arc Additive Manufacturing for the repair of mold inserts. CIRP J. Manuf. Sci. Technol. 2021, 35, 943–958. [Google Scholar] [CrossRef]
  29. Priarone, P.C.; Catalano, A.R.; Simeone, A.; Settineri, L. Effects of deposition parameters on cumulative energy demand for Cold Metal Transfer additive manufacturing processes. CIRP Ann. 2022, 71, 17–20. [Google Scholar] [CrossRef]
  30. Petrat, T.; Graf, B.; Gumenyuk, A.; Rethmeier, M. Laser Metal Deposition as Repair Technology for a Gas Turbine Burner Made of Inconel 718. Phys. Procedia 2016, 83, 761–768. [Google Scholar] [CrossRef]
  31. Louvis, E.; Fox, P.; Sutcliffe, C.J. Selective laser melting of aluminium components. J. Mater. Process. Technol. 2011, 211, 275–284. [Google Scholar] [CrossRef]
  32. Montero-Sistiaga, M.L.; Mertens, R.; Vrancken, B.; Wang, X.; Van Hooreweder, B.; Kruth, J.-P.; Van Humbeeck, J. Changing the alloy composition of Al7075 for better processability by selective laser melting. J. Mater. Process. Technol. 2016, 238, 437–445. [Google Scholar] [CrossRef]
  33. Zhou, Y.H.; Zhang, Z.H.; Wang, Y.P.; Liu, G.; Zhou, S.Y.; Li, Y.L.; Shen, J.; Yan, M. Selective laser melting of typical metallic materials: An effective process prediction model developed by energy absorption and consumption analysis. Addit. Manuf. 2019, 25, 204–217. [Google Scholar] [CrossRef]
  34. Prasad, K.; Khalik, M.A.; Hutasoit, N.; Rahman Rashid, R.A.; Rashid, R.; Duguid, A.; Palanisamy, S. Printability of low-cost pre-heat-treated ball milled Al7075 powders using compressed air assisted cold spray additive manufacturing. Addit. Manuf. Lett. 2022, 3, 100046. [Google Scholar] [CrossRef]
  35. Sun, S.; Zhang, D.; Palanisamy, S.; Liu, Q.; Dargusch, M.S. Mechanical properties and deformation mechanisms of martensitic Ti6Al4V alloy processed by laser powder bed fusion and water quenching. Mater. Sci. Eng. A 2022, 839, 142817. [Google Scholar] [CrossRef]
  36. Prashar, G.; Vasudev, H. A comprehensive review on sustainable cold spray additive manufacturing: State of the art, challenges and future challenges. J. Clean. Prod. 2021, 310, 127606. [Google Scholar] [CrossRef]
  37. Chohan, I.M.; Ahmad, A.; Sallih, N.; Bheel, N.; Ali, M.; Deifalla, A.F. A review on life cycle assessment of different pipeline materials. Results in Engineering 2023, 19, 101325. [Google Scholar] [CrossRef]
  38. LightSPEE3D. 2022. Available online: https://www.spee3d.com/ (accessed on 5 January 2022).
  39. Cresko, J.; Carpenter, A.; Das, S.; Dollinger, C.; Fisher, A.; Brueske, S.; Luo, A.A. Bandwidth Study on Energy Use and Potential Energy Saving Opportunities in U.S. Aluminum Manufacturing. The U.S. Department of Energy (DOE)’s Advanced Manufacturing Office (AMO): Washington, DC, USA, 2017. [Google Scholar]
  40. CO2 Footprint of Your Aluminum Profile. 2019. Available online: https://www.hydro.com/en-DE/about-hydro/hydro-worldwide/europe/austria/nenzing/hydro-nenzing/co2-footprint-of-your-aluminum-profile/ (accessed on 20 March 2022).
  41. Behrens, B.-A.; Frischkorn, C.; Bonhage, M. Reprocessing of AW2007, AW6082 and AW7075 aluminium chips by using sintering and forging operations. Prod. Eng. 2014, 8, 443–451. [Google Scholar] [CrossRef]
  42. Faludi, J.; Baumers, M.; Maskery, I.; Hague, R. Environmental Impacts of Selective Laser Melting: Do Printer, Powder, Or Power Dominate? J. Ind. Ecol. 2017, 21, S144–S156. [Google Scholar] [CrossRef]
  43. Ingarao, G.; Priarone, P.C.; Gagliardi, F.; Di Lorenzo, R.; Settineri, L. Subtractive versus mass conserving metal shaping technologies: An environmental impact comparison. J. Clean. Prod. 2015, 87, 862–873. [Google Scholar] [CrossRef]
  44. Priarone, P.C.; Robiglio, M.; Settineri, L. On the concurrent optimization of environmental and economic targets for machining. J. Clean. Prod. 2018, 190, 630–644. [Google Scholar] [CrossRef]
  45. Hammond, G.P.; Jones, C.I. Embodied energy and carbon in construction materials. Proc. Inst. Civ. Eng. Energy 2008, 161, 87–98. [Google Scholar] [CrossRef]
  46. Zavalan, F.-L.; Rona, A. A workflow for designing contoured axisymmetric nozzles for enhancing additively manufactured cold spray deposits. Addit. Manuf. 2023, 62, 103379. [Google Scholar] [CrossRef]
  47. Ingarao, G.; Priarone, P.C.; Di Lorenzo, R.; Settineri, L. A methodology for evaluating the influence of batch size and part geometry on the environmental performance of machining and forming processes. J. Clean. Prod. 2016, 135, 1611–1622. [Google Scholar] [CrossRef]
  48. Xiao, Y.; Reuter, M.A. Recycling of distributed aluminium turning scrap. Miner. Eng. 2002, 15, 963–970. [Google Scholar] [CrossRef]
  49. Kara, S.; Li, W. Unit process energy consumption models for material removal processes. CIRP Ann. 2011, 60, 37–40. [Google Scholar] [CrossRef]
  50. Jankovic, P.; Madic, M.; Petkovic, D.; Radovanovic, M. Analysis and modeling of the effects of process parameters on specific cutting energy in abrasive water jet cutting. Therm. Sci. 2018, 22 (Suppl. S5), 1459–1470. [Google Scholar] [CrossRef]
  51. Behrendt, T.; Zein, A.; Min, S. Development of an energy consumption monitoring procedure for machine tools. CIRP Ann. 2012, 61, 43–46. [Google Scholar] [CrossRef]
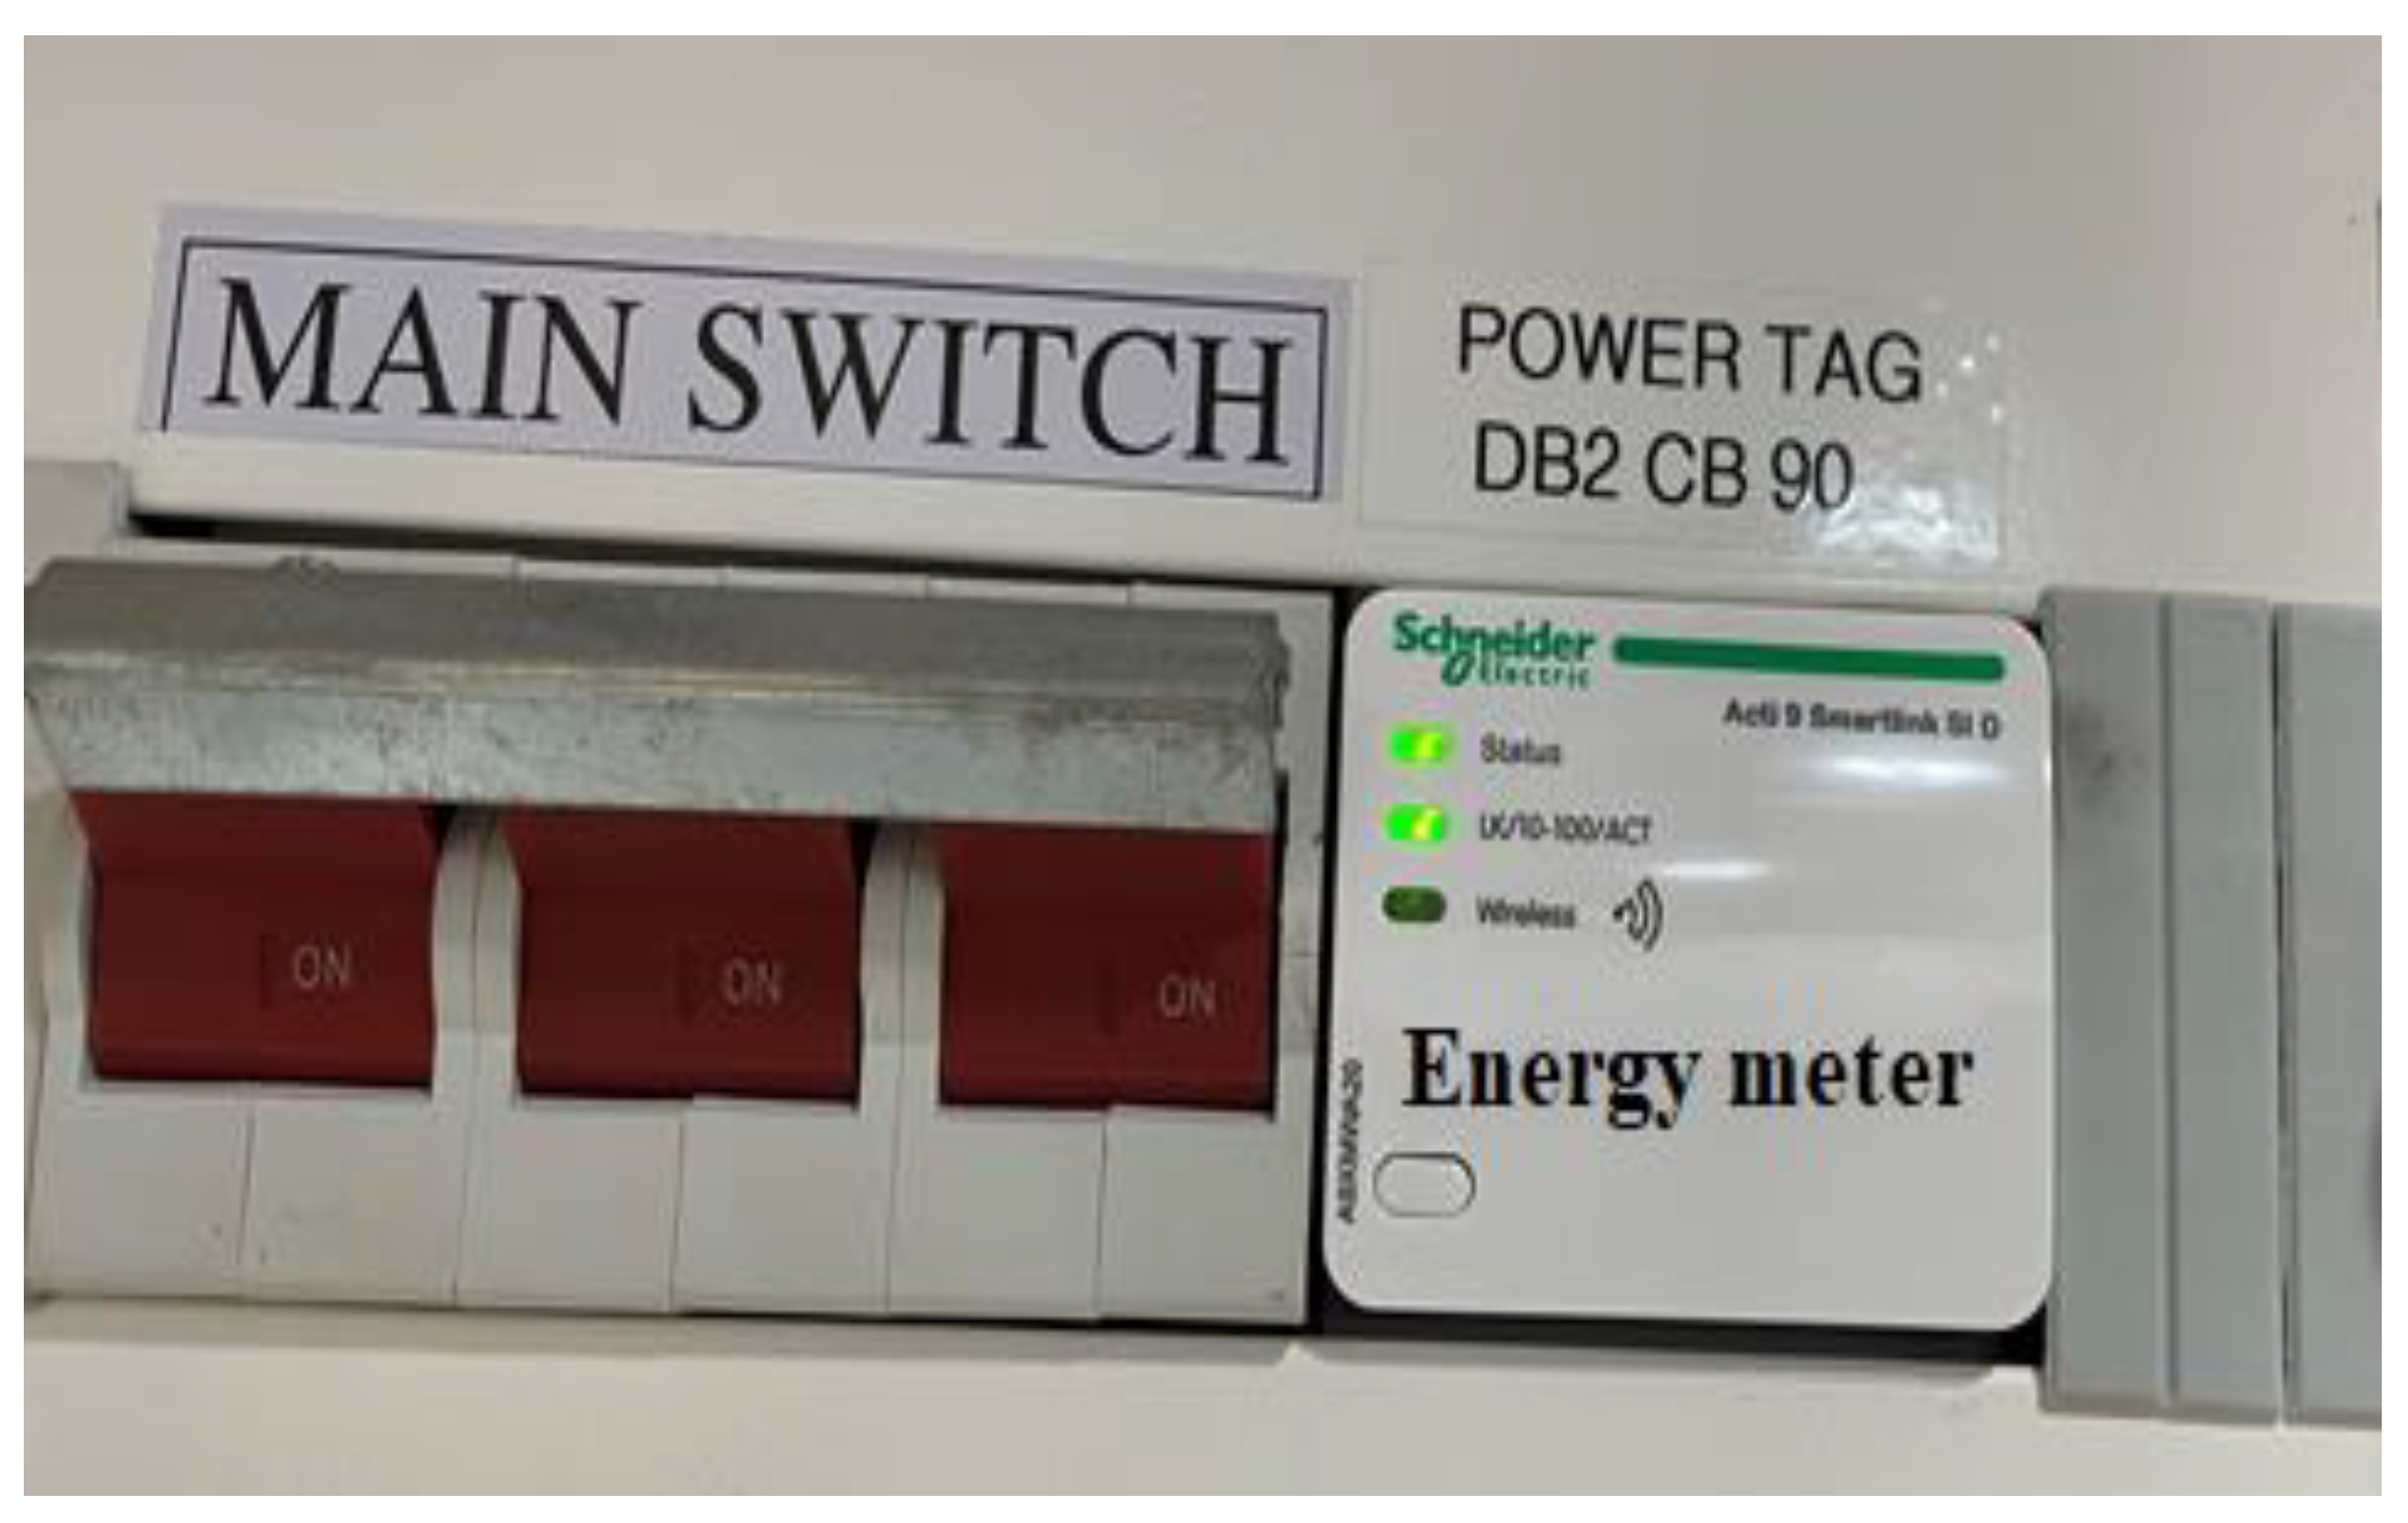
  52. EcoStruxure. Acti9 PowerTag Link. 2022. Available online: https://www.se.com/ww/en/product-range/64482-acti9-powertag-link/#documents (accessed on 13 July 2022).
  53. COA. National Greenhouse Accounts Factors; Department of the Environment: Canberra, Australia, 2021. [Google Scholar]
  54. Ali, M.S.; Shafique, Q.N.; Kumar, D.; Kumar, S.; Kumar, S. Energy and exergy analysis of a 747-MW combined cycle power plant Guddu. Int. J. Ambient. Energy 2020, 41, 1495–1504. [Google Scholar] [CrossRef]
  55. Tariq, N.H.; Gyansah, L.; Wang, J.Q.; Qiu, X.; Feng, B.; Siddique, M.T.; Xiong, T.Y. Cold spray additive manufacturing: A viable strategy to fabricate thick B4C/Al composite coatings for neutron shielding applications. Surf. Coat. Technol. 2018, 339, 224–236. [Google Scholar] [CrossRef]
  56. Acero, A.P.; Rodríguez, C.; Ciroth, A. LCIA Methods Impact Assessment Methods in Life Cycle Assessment and Their Impact Categories; GreenDelta GmbH: Berlin, Germany, 2016; Available online: https://eplca.jrc.ec.europa.eu/ilcd.html (accessed on 18 April 2024).
  57. Liu, Z.Y.; Li, C.; Fang, X.Y.; Guo, Y.B. Energy Consumption in Additive Manufacturing of Metal Parts. Procedia Manuf. 2018, 26, 834–845. [Google Scholar] [CrossRef]
  58. Kumar, D.; Alam, M.; Sanjayan, J.G. Development of sustainable heat resistive and storage panels for building envelope: An experimental and numerical study. Constr. Build. Mater. 2023, 403, 133093. [Google Scholar] [CrossRef]
  59. Ma, Z.; Gao, M.; Wang, Q.; Wang, N.; Li, L.; Liu, C.; Liu, Z. Energy consumption distribution and optimization of additive manufacturing. Int. J. Adv. Manuf. Technol. 2021, 116, 3377–3390. [Google Scholar] [CrossRef]
  60. Wiesea, M.; Leiden, A.; Rogall, C.; Thiede, S.; Herrmann, C. Modeling energy and resource use in additive manufacturing of automotive series parts with multi-jet fusion and selective laser sintering. Procedia CIRP 2021, 98, 358–363. [Google Scholar] [CrossRef]
  61. Baumers, M.; Tuck, C.; Wildman, R.; Ashcroft, I.; Hague, R. Shape Complexity and Process Energy Consumption in Electron Beam Melting: A Case of Something for Nothing in Additive Manufacturing? J. Ind. Ecol. 2017, 21, S157–S167. [Google Scholar] [CrossRef]
  62. Bourhis, F.L.; Kerbrat, O.; Hascoet, J.-Y.; Mognol, P. Sustainable manufacturing: Evaluation and modeling of environmental impacts in additive manufacturing. Int. J. Adv. Manuf. Technol. 2013, 69, 1927–1939. [Google Scholar] [CrossRef]
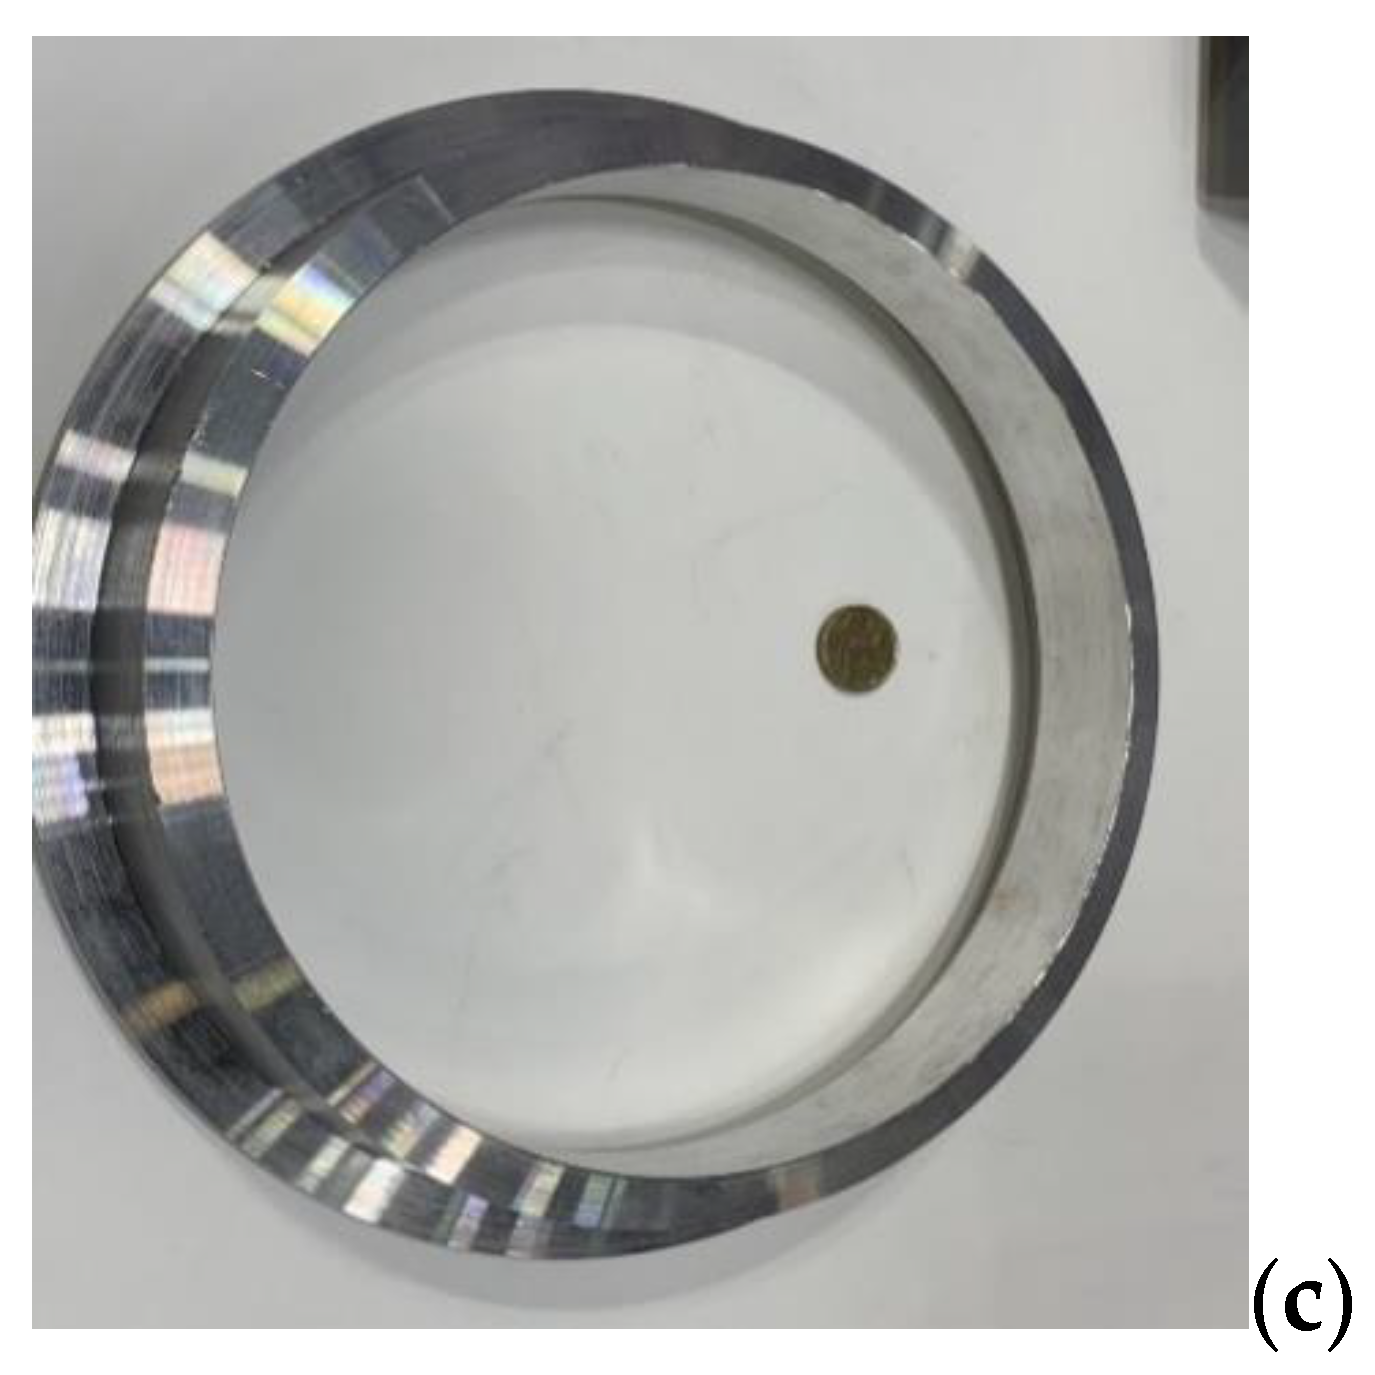
Figure 1. Life cycle assessment methodology (ISO 14040).
Metals 13 01684 g001
Figure 2. Life cycle phase of considered manufacturing technology.
Metals 13 01684 g002
Figure 3. Aluminum alloy (a) rod, (b) tube, and (c) flange.
Metals 13 01684 g003aMetals 13 01684 g003b
Figure 4. Acti 9 SmartLink SI device.
Metals 13 01684 g004
Figure 5. The electric power consumptions of different components in CSAM.
Metals 13 01684 g005
Figure 6. LCE consumption and LCC emissions in CSAM processes.
Metals 13 01684 g006
Figure 7. Life cycle energy consumption in CM process.
Metals 13 01684 g007
Figure 8. Effects of material embodied energy (a) and embodied carbon (b) on LCE consumption and LCC emissions in CM and CSAM processes with and without recycling. (Note: R denotes recycling process, and error bars show uncertainty).
Metals 13 01684 g008
Figure 9. Impact of regional emissions factors on LCC emissions of CSAM and CM technologies.
Metals 13 01684 g009
Figure 10. Comparison of specific energy consumptions in CSAM (Note: Green bar denotes the measured SEC of CSAM in this study).
Metals 13 01684 g010
Table 1. Aluminum alloy flange.
DescriptionUnitQuantity
Density of Al6061g/cm32.7
Volumecm3531.67
Masskg1.44
Lengthmm45
Inner diametermm202
Outer diametermm245
Powder feed ratekg/h2
Deposition efficiency%78
Finishing tolerancemm1
Operation periodmin87
Table 3. Empirical model for SEC of different CNC machines [49].
Machine TypeManufacture InformationSEC (kJ/cm3)R2Idle Power (Po) (kW)
Colchester Tornado A50Colchester Machine Tool Solutions, West Yorkshire, United KingdomSEC = 1.494 + 2.191/MRR0.9931.16
Mori Seiki NL2000MC/500DMG Mori Co., Ltd., Tokyo, JapanSEC = 3.6 + 2.445/MRR0.9271.58
IKEGAI AX 20Ikegai, Massachusetts, USASEC = 2.093 + 4.415/MRR0.9811.77
Mori Seiki SL-15Mori Seiki, Melbourne, AustraliaSEC = 2.378 + 2.273/MRR0.941.48
Nakamura TMC-15Nakamura-Tome Precision Industry Co., Ltd., Mainz-Bingen, GermanySEC = 3.73 + 2.349/MRR0.9291.54
Table 4. Machining parameters for aluminum alloy.
Process ParameterUnitsRoughingFinishing
Cutting speed (set constant), vc (mm/min)mm/min200,000225,000
Maximum spindle speed, nmax (rpm)rpm40004000
Feed, f (mm/rev)mm/rev0.30.15
Depth of cut, ap (mm)mm1.50.25
Lubrication conditions Wet cuttingWet cutting
Note: R2 shows the accuracy of the empirical model in calculating the SEC of the cutting process under different cutting conditions. The higher the R2, the greater the accuracy of the empirical model.
Table 6. Electricity emissions factors of electricity generation in different states of Australia [53,58].
StateEmissions Factor, kg CO2-eq/kWh
Tasmania0.18
South Australia0.33
Darwin Katherine Interconnected System (DKIS) in the Northern Territory0.55
Northern Territory (NT)0.58
North Western Interconnected System (NWIS) in Western Australia0.61
South West Interconnected System (SWIS) in Western Australia0.77
New South Wales and the Australian Capital Territory0.79
Queensland0.88
Victoria0.92
Note: The emissions factors is the sum of scope 2 and scope 3 emissions of purchased electricity from a grid.
Disclaimer/Publisher’s Note: The statements, opinions and data contained in all publications are solely those of the individual author(s) and contributor(s) and not of MDPI and/or the editor(s). MDPI and/or the editor(s) disclaim responsibility for any injury to people or property resulting from any ideas, methods, instructions or products referred to in the content.

