Article

Electrochemical Noise Analysis of the X70 Pipeline Steel under Stress Conditions Using Symmetrical and Asymmetrical Electrode Systems

by
Andres Carmona-Hernández
1,
Ricardo Orozco-Cruz
1,
Franco Antonio Carpio-Santamaria
1,
Clarisa Campechano-Lira
1,
Francisco López-Huerta
2,
Edgar Mejía-Sánchez
3,
Antonio Contreras
4 and
Ricardo Galván-Martínez
1,*
1
Instituto de Ingeniería, Universidad Veracruzana, S. S. Juan Pablo II, Zona Universitaria, Boca del Río 94294, Veracruz, Mexico
2
Facultad de Ingeniería Eléctrica y Electrónica, Universidad Veracruzana, Adolfo Ruiz Cortines No. 455, Fracc. Costa Verde, Boca del Río 94294, Veracruz, Mexico
3
Facultad de Ingeniería, Universidad Veracruzana, KM 1.0 Carretera Sumidero Dos Ríos, Veracruz 94452, Veracruz, Mexico
4
Instituto Mexicano del Petróleo, Eje Central Lázaro Cárdenas Norte 152, Col. San Bartolo Atepehuacan, Alcaldía Gustavo A. Madero, Mexico City 07730, Mexico
*
Author to whom correspondence should be addressed.
Metals 2022, 12(9), 1545; https://doi.org/10.3390/met12091545
Submission received: 5 August 2022 / Revised: 7 September 2022 / Accepted: 10 September 2022 / Published: 19 September 2022
(This article belongs to the Special Issue Corrosion Electrochemical Measurement, Analysis and Research)

Abstract

:
In this work, electrochemical monitoring of stress corrosion cracking (SCC) behavior of a X70 steel in acidic synthetic soil solution during the slow strain rate test (SSRT) was performed by electrochemical noise (EN) using the conventional arrangement of symmetrical electrodes and electrochemical emission spectroscopy (EES) using the asymmetrical arrangement replacing the second working electrode for a platinum micro-cathode. The statistical method, fast Fourier transform, and discrete wavelet transform were used for analyzing the potential and current signals recorded by both arrangements. The results showed that EN arrangement was more effective to detect the crack initiation at a point close to yield strength despite stress-induced asymmetry in one of the electrodes. For the EES arrangement, the micro-cathode had a strong influence on the electrochemical noise of the current and potential under stress conditions. From the transient features, statistical parameters, and wavelet analysis, a discontinuous transgranular SCC mechanism was found. The resistance values obtained by EN measurements had better correlation with the electrochemical impedance spectroscopy results (EIS) than EES measurements.

Graphical Abstract

1. Introduction

Stress corrosion cracking (SCC) is defined as the interaction of a tensile stress with a corrosion environment on a susceptible metallic surface resulting in crack initiation and propagation [1]. SCC is a common phenomenon in the petroleum sector, and it is one of the most critical corrosion mechanisms that can lead to catastrophic failures of buried steel pipelines, resulting in significant economic losses and potential safety hazards [2,3]. Thus, research activities focused on non-invasive monitoring of SCC mechanisms have in this field a significant practical importance [4]. One technique suitable for the detection of individual electrochemical events during SCC could be the electrochemical noise (EN). EN is a general term to describe the apparently random fluctuations of potential and current generated spontaneously by corrosion processes [5,6]. Unlike other electrochemical techniques, EN is carried out without external perturbation to the electrochemical system, so it could provide useful information on the mechanisms and kinetics of corrosion without altering some features of the electrochemical system under study [7]. The conventional EN measurement method uses three electrodes: two nominally identical working electrodes (WE), between which the current noise is measured using a zero-resistance ammeter (ZRA), and a reference electrode, which is used to determine the potential noise of the coupled working electrode pair [8,9]. In some experimental arrangements, such as crevice corrosion, wear corrosion, SCC, and fatigue corrosion studies, it is difficult to maintain the identical behavior for the two working electrodes [10,11]. In the case of SCC studies, using the slow strain rate test (SSRT), only one sample is under stress whereas the second originally identical sample is unstressed, resulting in a galvanic corrosion that may significantly accelerate the SCC process on the stressed sample. Despite this inconvenience, several works [12,13,14,15,16] have used the conventional EN arrangement to study the behavior SCC during the SSRT test, whereas other studies [17,18,19] have used a counter electrode made of the same material of the WE with larger area and different geometric configuration. In this aspect, Shahidi et al. [20] performed electrochemical current noise (ECN) measurements using symmetrical and asymmetrical electrode system (large difference in size between two WEs) and they found an increase of amplitude of current transients and the detection of a higher number of events.
On the other hand, some authors [21,22,23,24,25,26] carried out a modified EN technique, called electrochemical emission spectroscopy (EES), which was first proposed by Chen and Bogaerts [27]. Unlike the traditional EN arrangement, only one WE is used in EES and the second working electrode is replaced by a Pt micro-cathode. The Pt micro-cathode area should be made small enough so that the galvanic couple effect can be neglected. An assumption to justify the use of EES technique is that the noise generated by the Pt micro-electrode is insignificant compared to that generated by the WE, thus permitting the study of what is happening on the most active electrode [9]. Due to the apparent advantages of using the EES technique, some works [28,29,30] deliberately adopted the EES arrangement instead of using the conventional EN arrangement. However, studies such as Aballe et al. [28] and Bautista et al. [10] revelated that although the potential and current noise records using asymmetrical electrodes (EES arrangement) provided information on the fluctuations of the WE, the corrosion rate estimation from impedance noise (Zn) or resistance (Rn) was doubtful. In fact, they suggested to estimate Zn or Rn, only when the noise delivered by the micro-cathode predominates, that is, when a vigorous hydrogen evolution on the Pt micro-cathode takes place in an acidic solution. Cottis [9] claimed that the measured current noise can be affected by the impedance of the micro-cathode depending on the cathodic reaction that takes place on the micro-cathode surface. In a recent study, Hu et al. [29], reported high correlation between corrosion rates obtained from EES and linear polarization resistance (LPR) measurements on corrosion of aluminum in several solutions used to simulate different corrosion types. They claimed that EES measurements can be useful for in situ corrosion monitoring.
The aim of the present work was to show the advantages and disadvantages of using the EN and ESS arrangements to monitor the SCC process of a X70 steel immersed acidic solution. EN and EES analysis was carried out in time and frequency domain to identify the SCC crack initiation.

2. Materials and Methods

2.1. Material and Test Solution

X70 steel samples were obtained from a pipeline with external diameter of 36 in (914.4 mm) and a wall thickness of 0.902 in. (22.91 mm). Smooth cylindrical tensile samples were cut from the pipeline in the cross direction and machined according to the NACE TM-198 standard [30]. The chemical composition (wt. %) of X70 steel was 0.031 C, 1.48 Mn, 0.13 Si, 0.033 Al, 0.012 P, 0.002 S, 0.1 Nb, 0.29 Cu, 0.20 Ni, 0.27 Cr, 0.004 V, 0.012 Ti, and Fe as balance. The microstructure of X70 steel consists of fine grains of ferrite (F) and small regions of perlite (P) which is mainly in the grain limits as is shown in Figure 1. The mechanical properties of X70 steel including yield strength (σYS) 566 MPa, ultimate tensile strength (σUTS) 612 MPa, percentage elongation (%η) 14.5%, and percentage reduction in area (%ψ) 84%.
A synthetic soil solution NS4 was used as test solution containing the following composition: 0.483 g/L NaHCO3, 0.122 g/L KCl, 0.137 g/L CaCl2, and 0.131 g/L MgSO4.7H2O. NS4 solution was prepared from analytical grade reagents with distilled water at pH 3. The pH of the solution was adjusted by using a dilute solution of HCl.

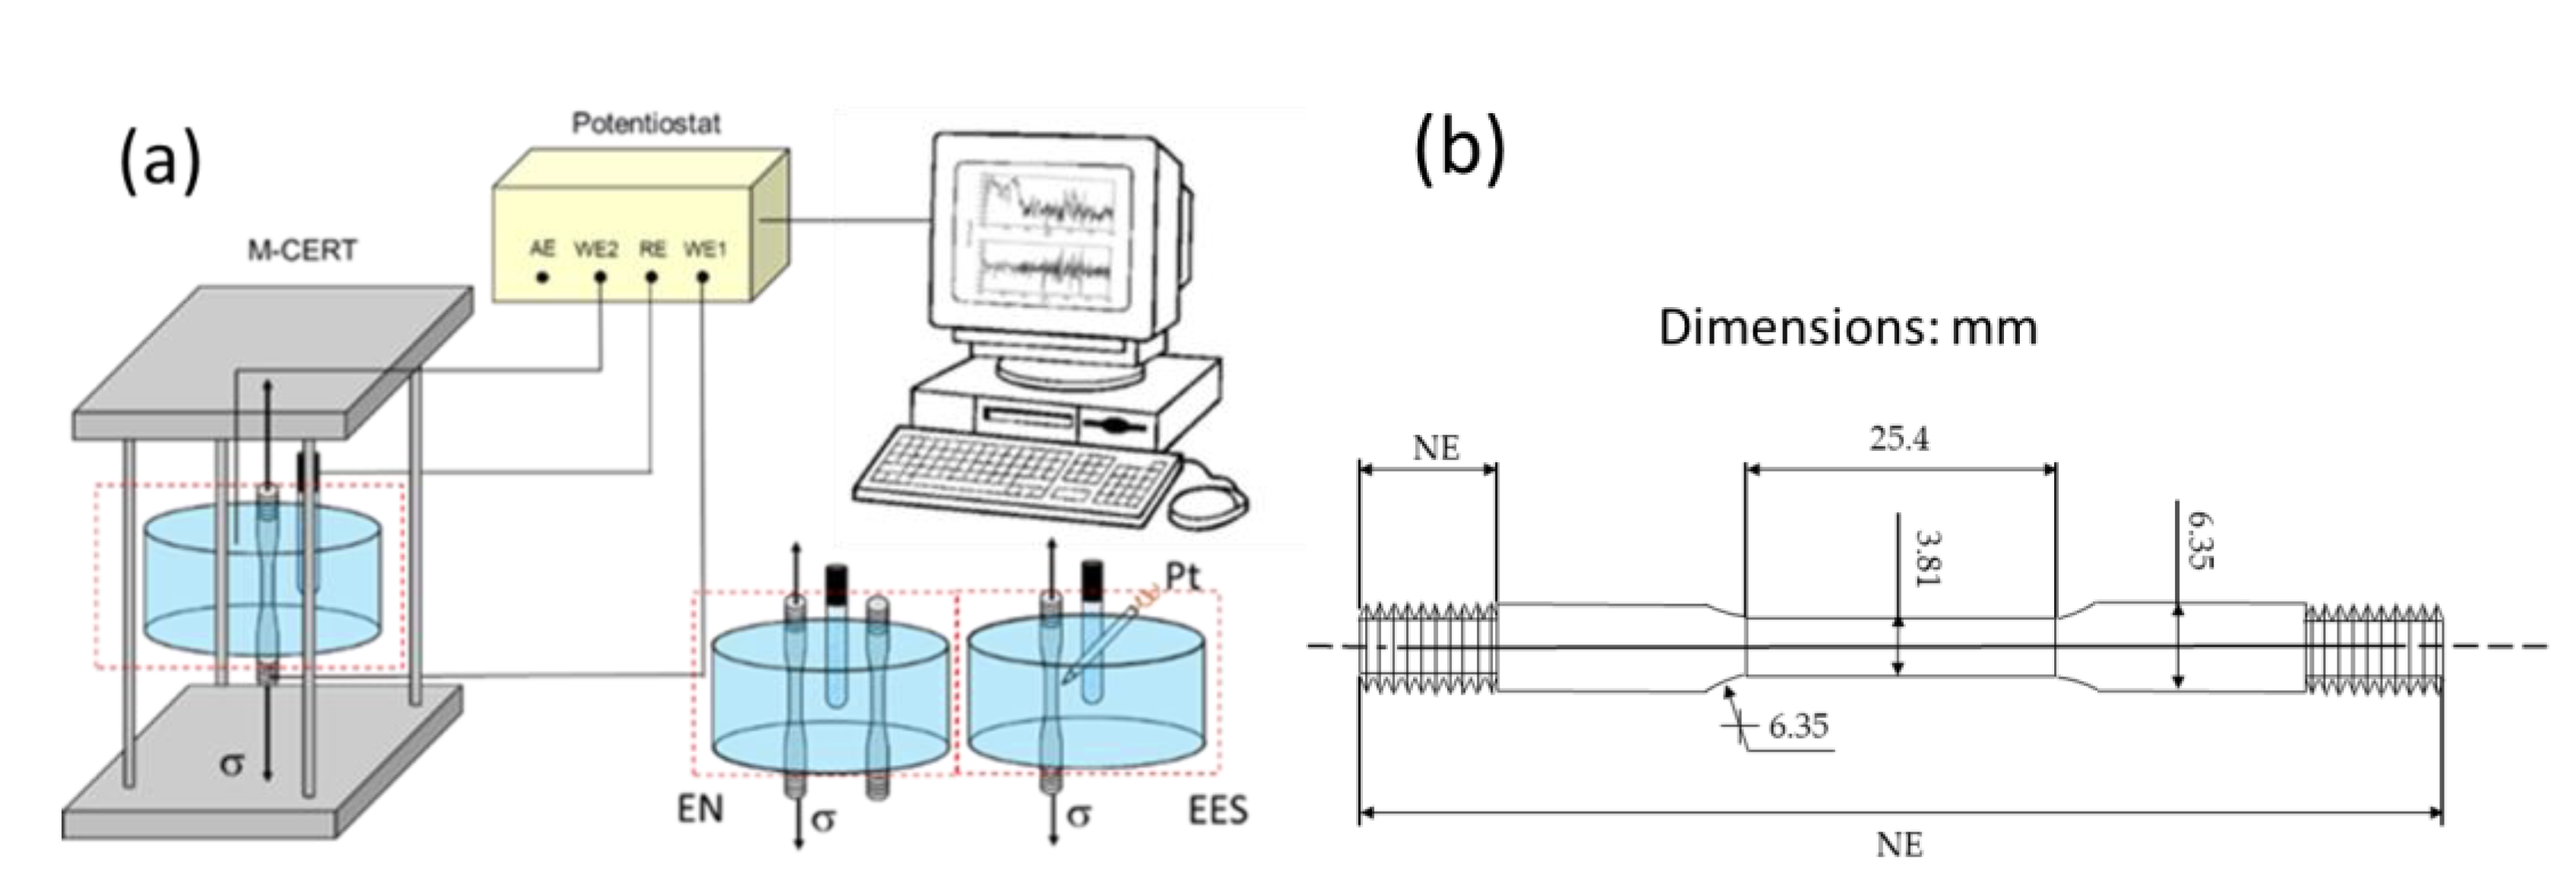
2.2. Slow Strain Rate Test (SSRT)

The SSRT test was performed in a mobile constant extension rate tests machine (MCERT, Intercorr, Houston, TX, USA) using a strain rate of 1 × 10⁻⁶ s−1. The SSRT tests were carried out both in air and the acidic NS4 solution at room temperature. Before each test, sample surface in the gauge section was polished with silicon carbide abrasive paper up to 1200 grit along the vertical direction to avoid small cracks with silicon carbide abrasive paper up to 1200 grit. All the specimens were rinsed with distilled water and degreased with acetone, and finally dried in air. The exposed area of specimen was 2.84 cm2. The mechanical characterization (tensile strengths and ductility parameters) derived from SSRT and fractographic analysis was discussed further in a previous work [31].

2.3. Electrochemical Noise (EN) Measurements

EN and EES measurements in current and potential were recorded during SSRT test using a potentiostat/galvanostat (ACM Instruments, Cumbria, United) as is shown in Figure 2. The conventional EN arrangement used a tensile sample as the working electrode, a nominally identical tensile sample as a second working electrode (WE,2) and a saturated calomel electrode (SCE) as reference electrode. For EES arrangement, the WE2 was substituted by a Pt microelectrode. The micro-cathode was made from commercial platinum wire (0.5 mm in diameter). The Pt tip was around 1 mm of length. EN and EES measurements were recorded at a sampling frequency of 1 Hz throughout the SSRT test. These records were divided into blocks of 4096 readings. For the statistical and frequency domain analysis, the DC trend removal of each block was removed using linear regression [32]. In the frequency domain analysis, the fast Fourier transform (FFT) was carried out to estimate the power spectral density (PSD) using a free program that was programed by the European Cooperative Group on Corrosion Monitoring of Nuclear Materials [33]. For the wavelet analysis, EN and EES data were analyzed by discrete wavelet transform (DWT). The calculations for the signal decomposition were performed at level 8 based on orthogonal db4 wavelet using the function wavedec [34].
Finally, in order to compare the resistance parameters obtained with the EN and EES analysis, the EIS technique was carried out during the SSRT test over a frequency range from 10 kHz to 0.01 Hz. Seven points per frequency decade were taken and an amplitude of 10 mV vs. open circuit potential (OCP). Instead of using a WE2, a graphite rod was used as counter electrode.

3. Results

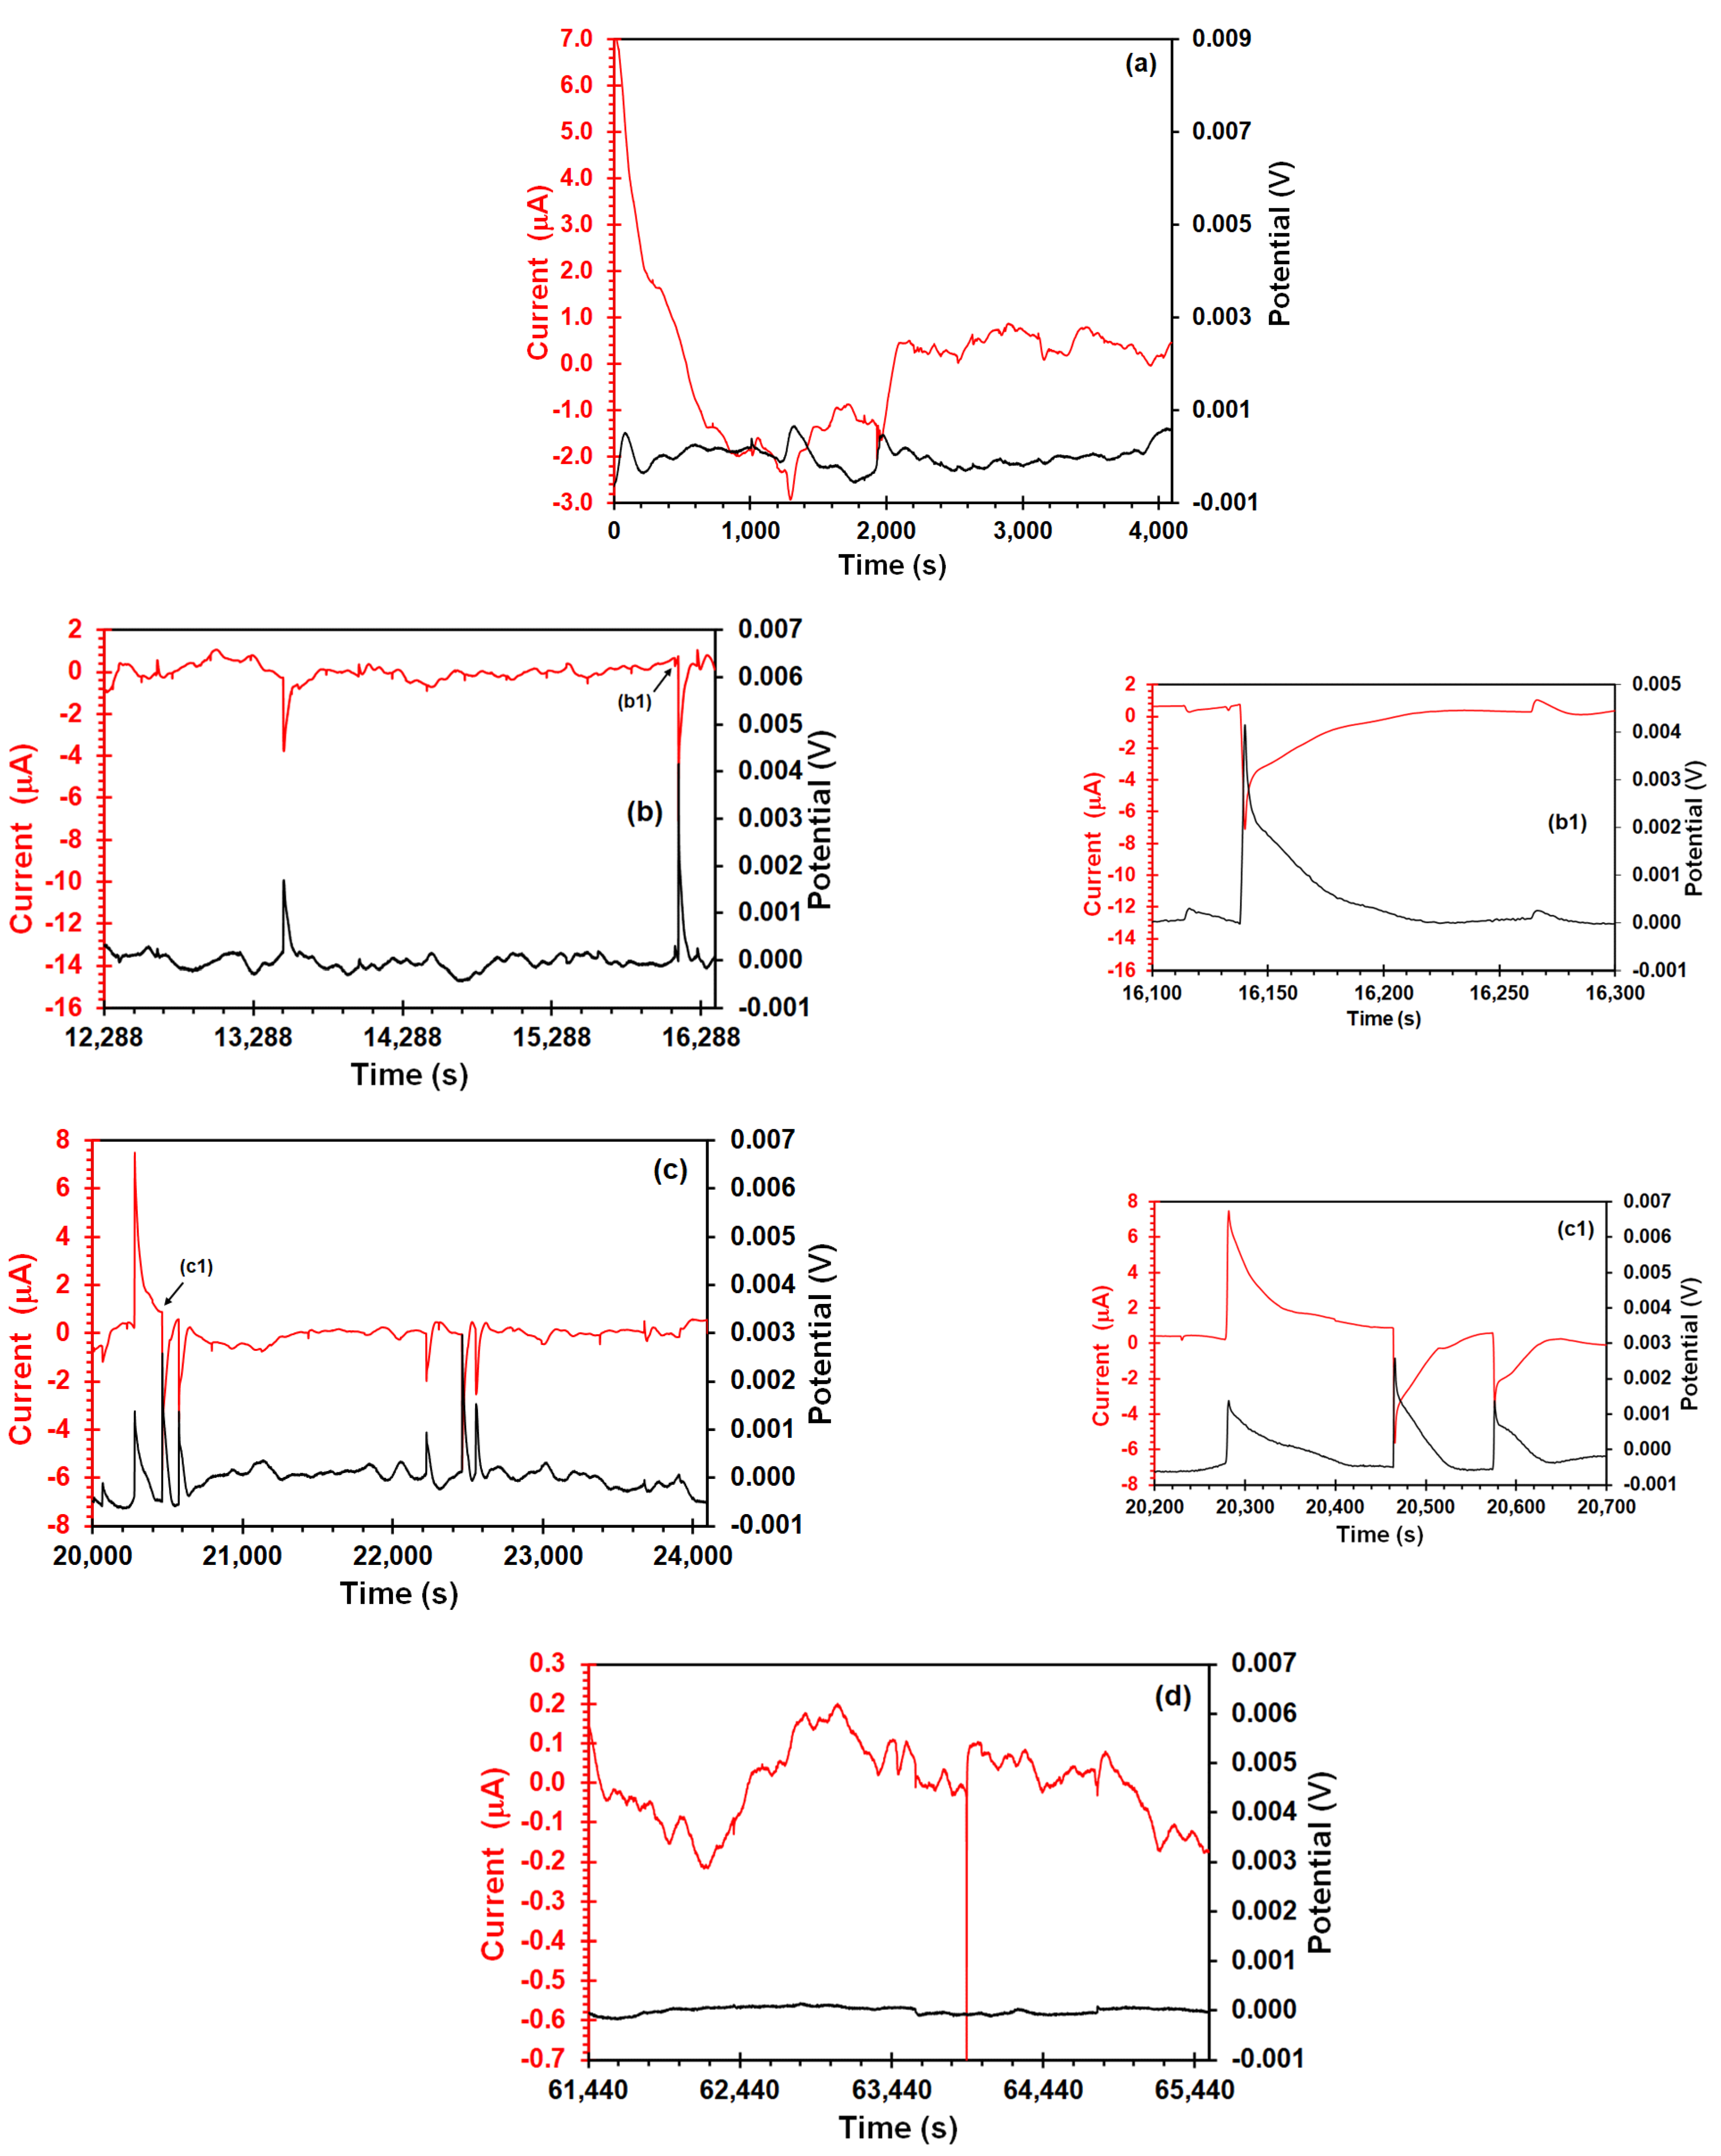
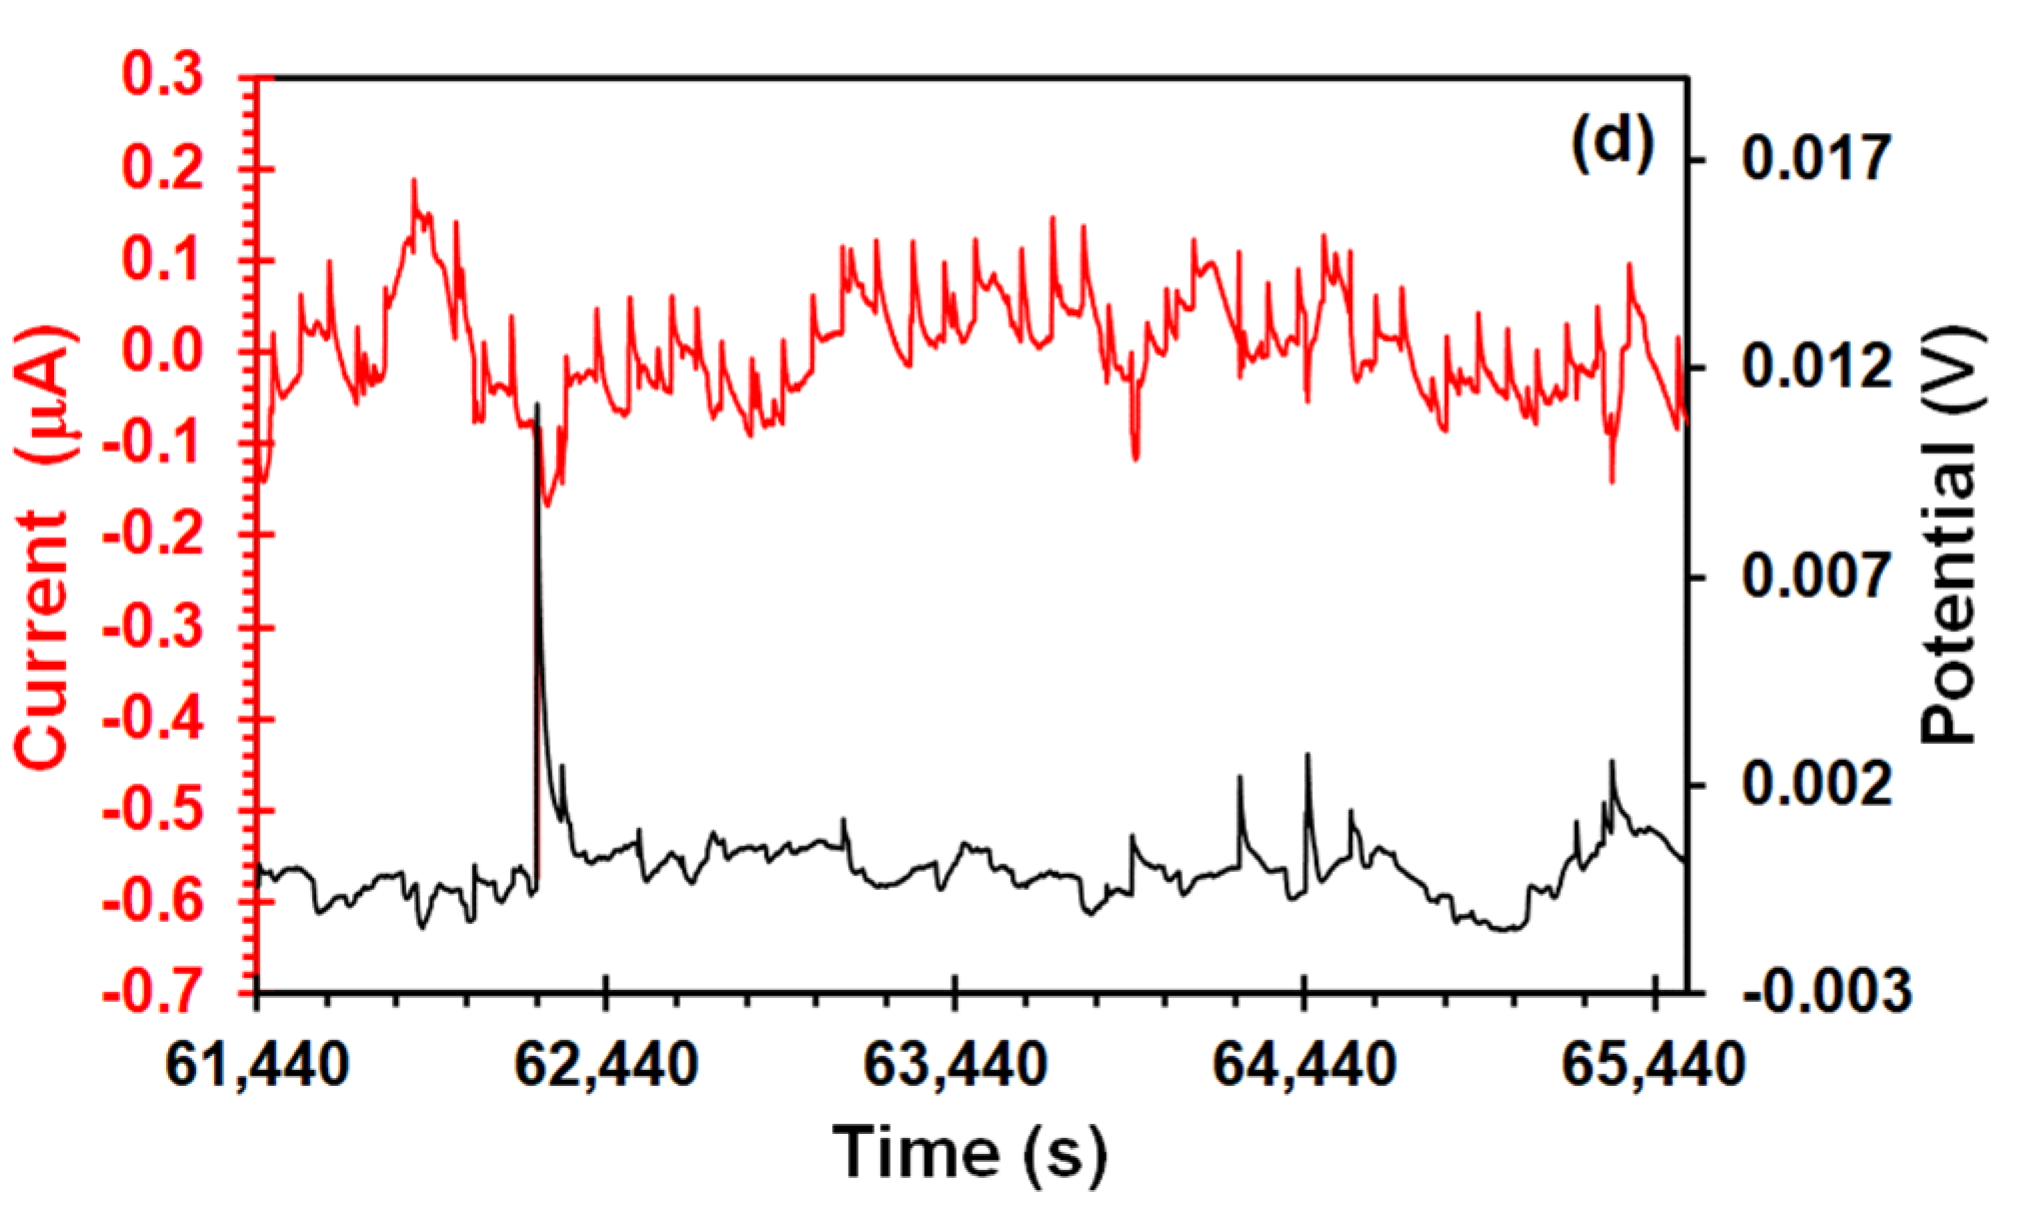
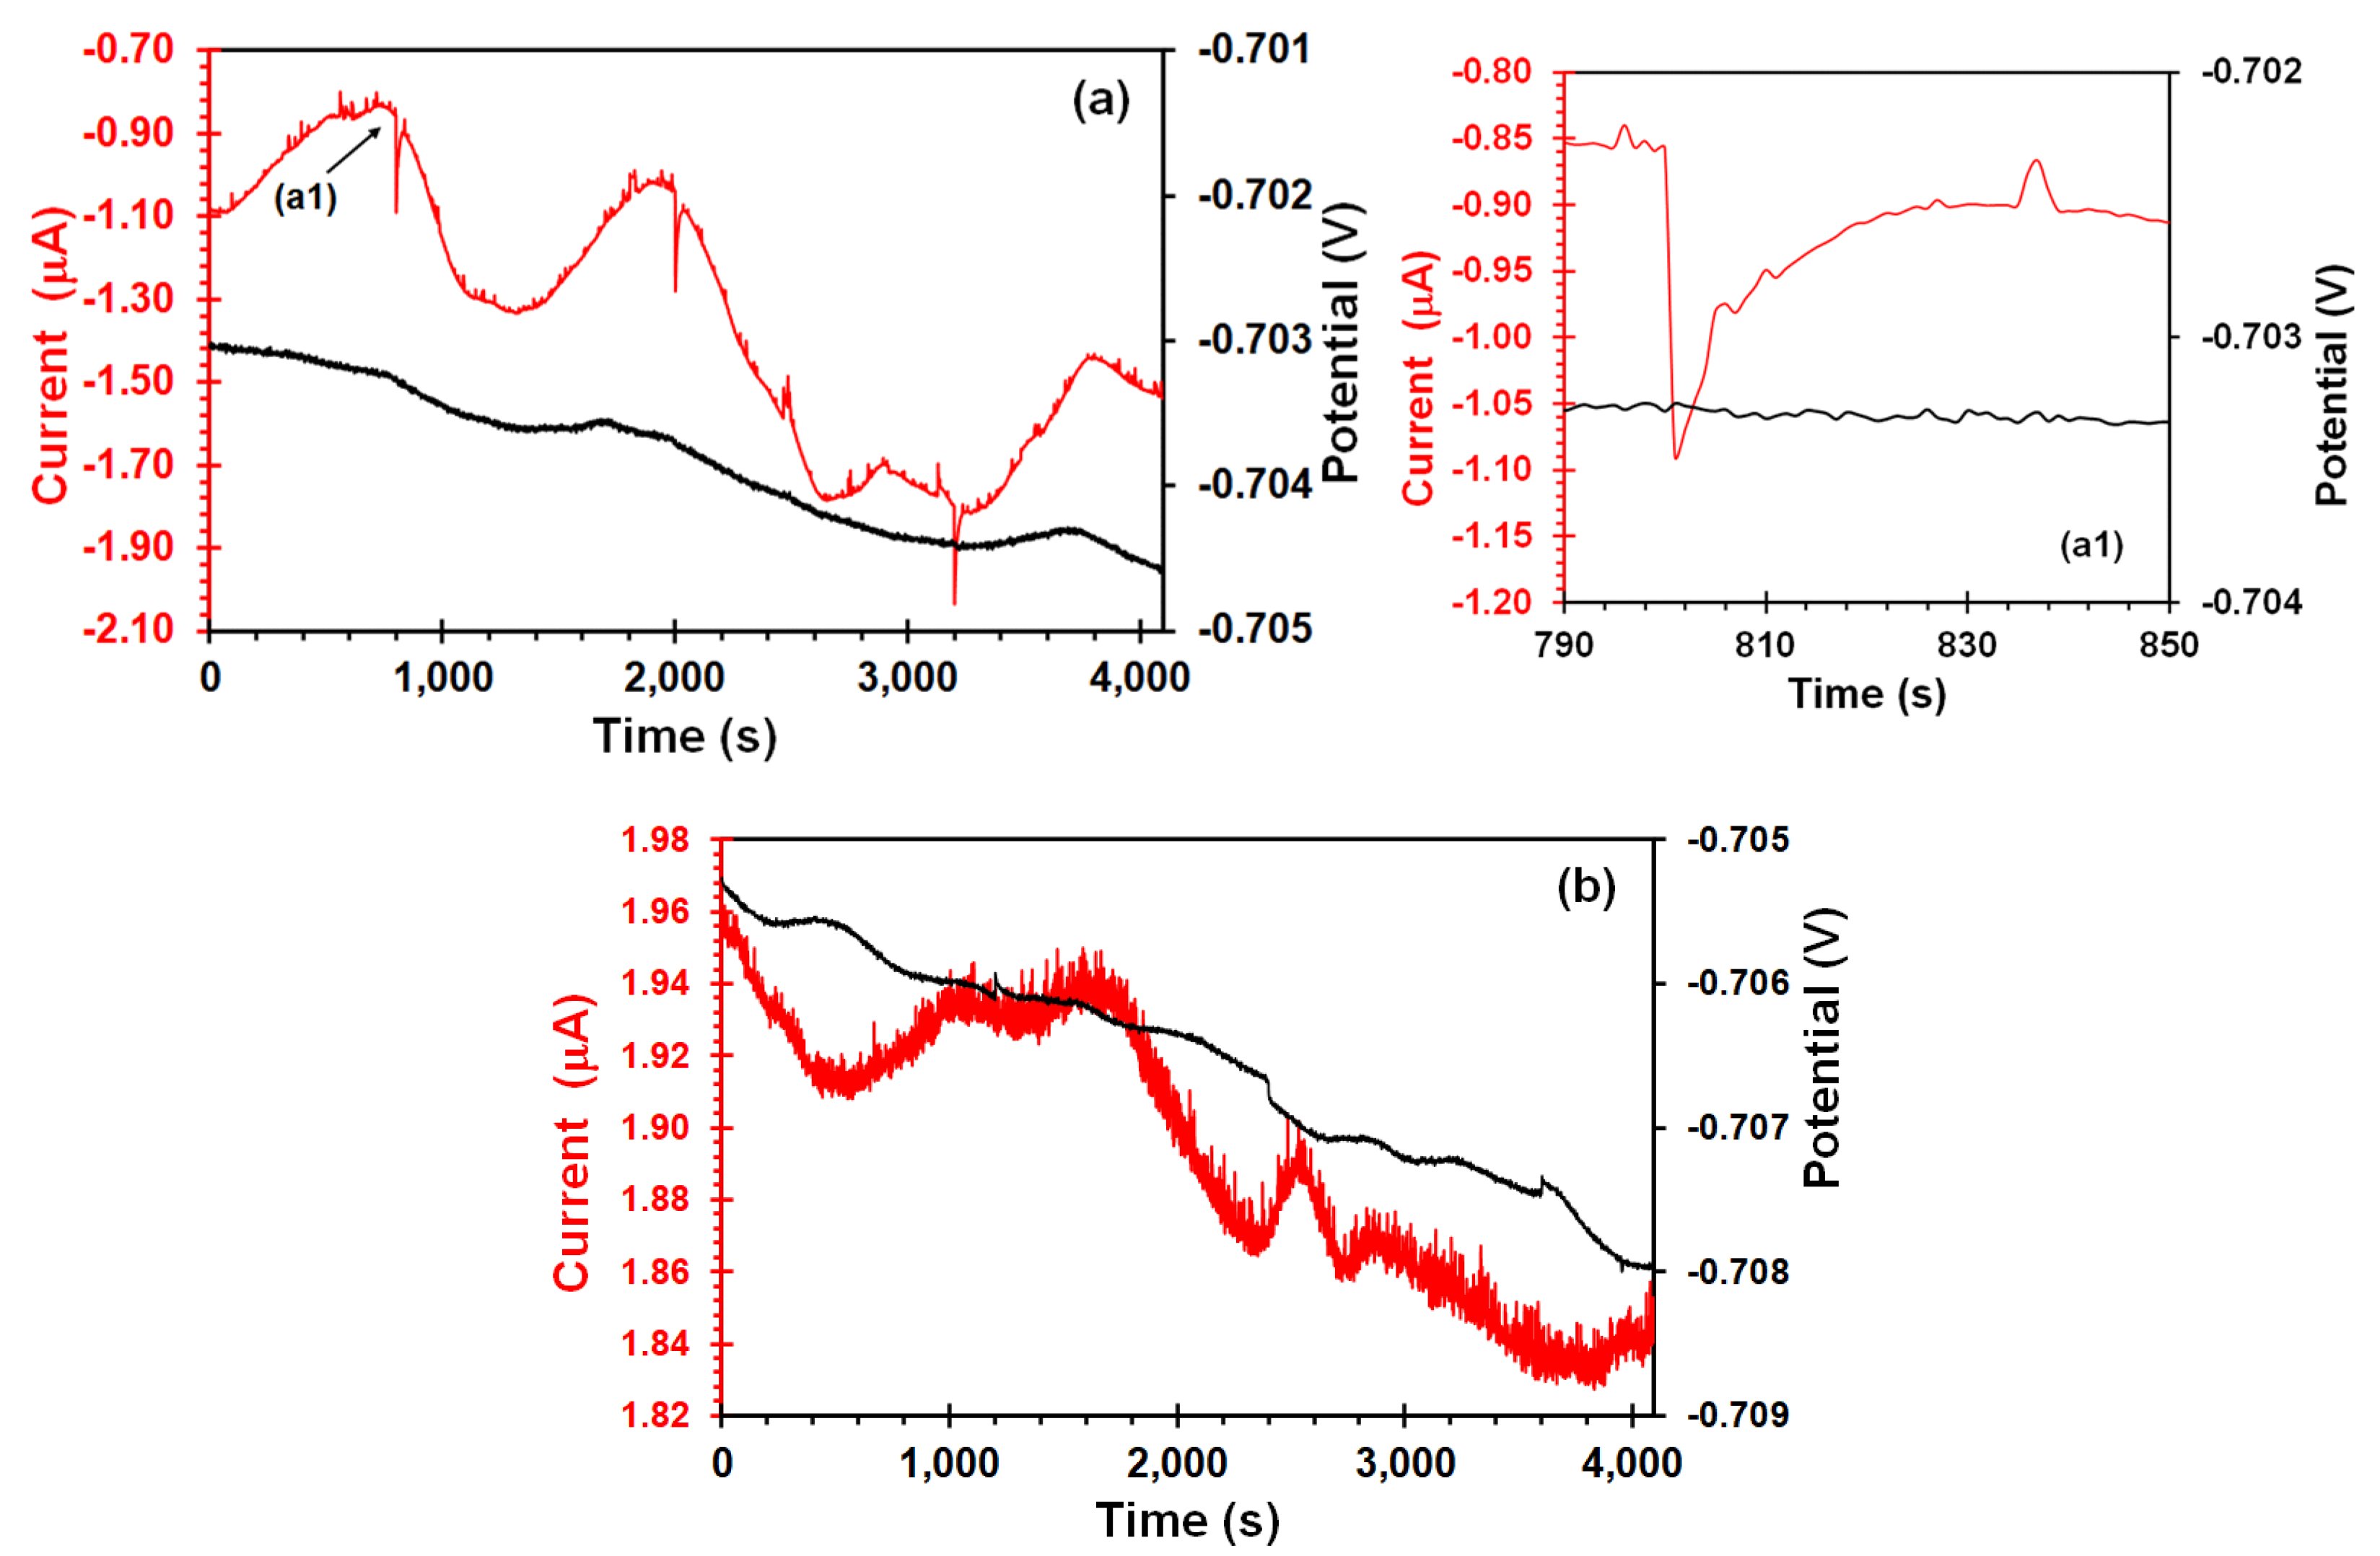
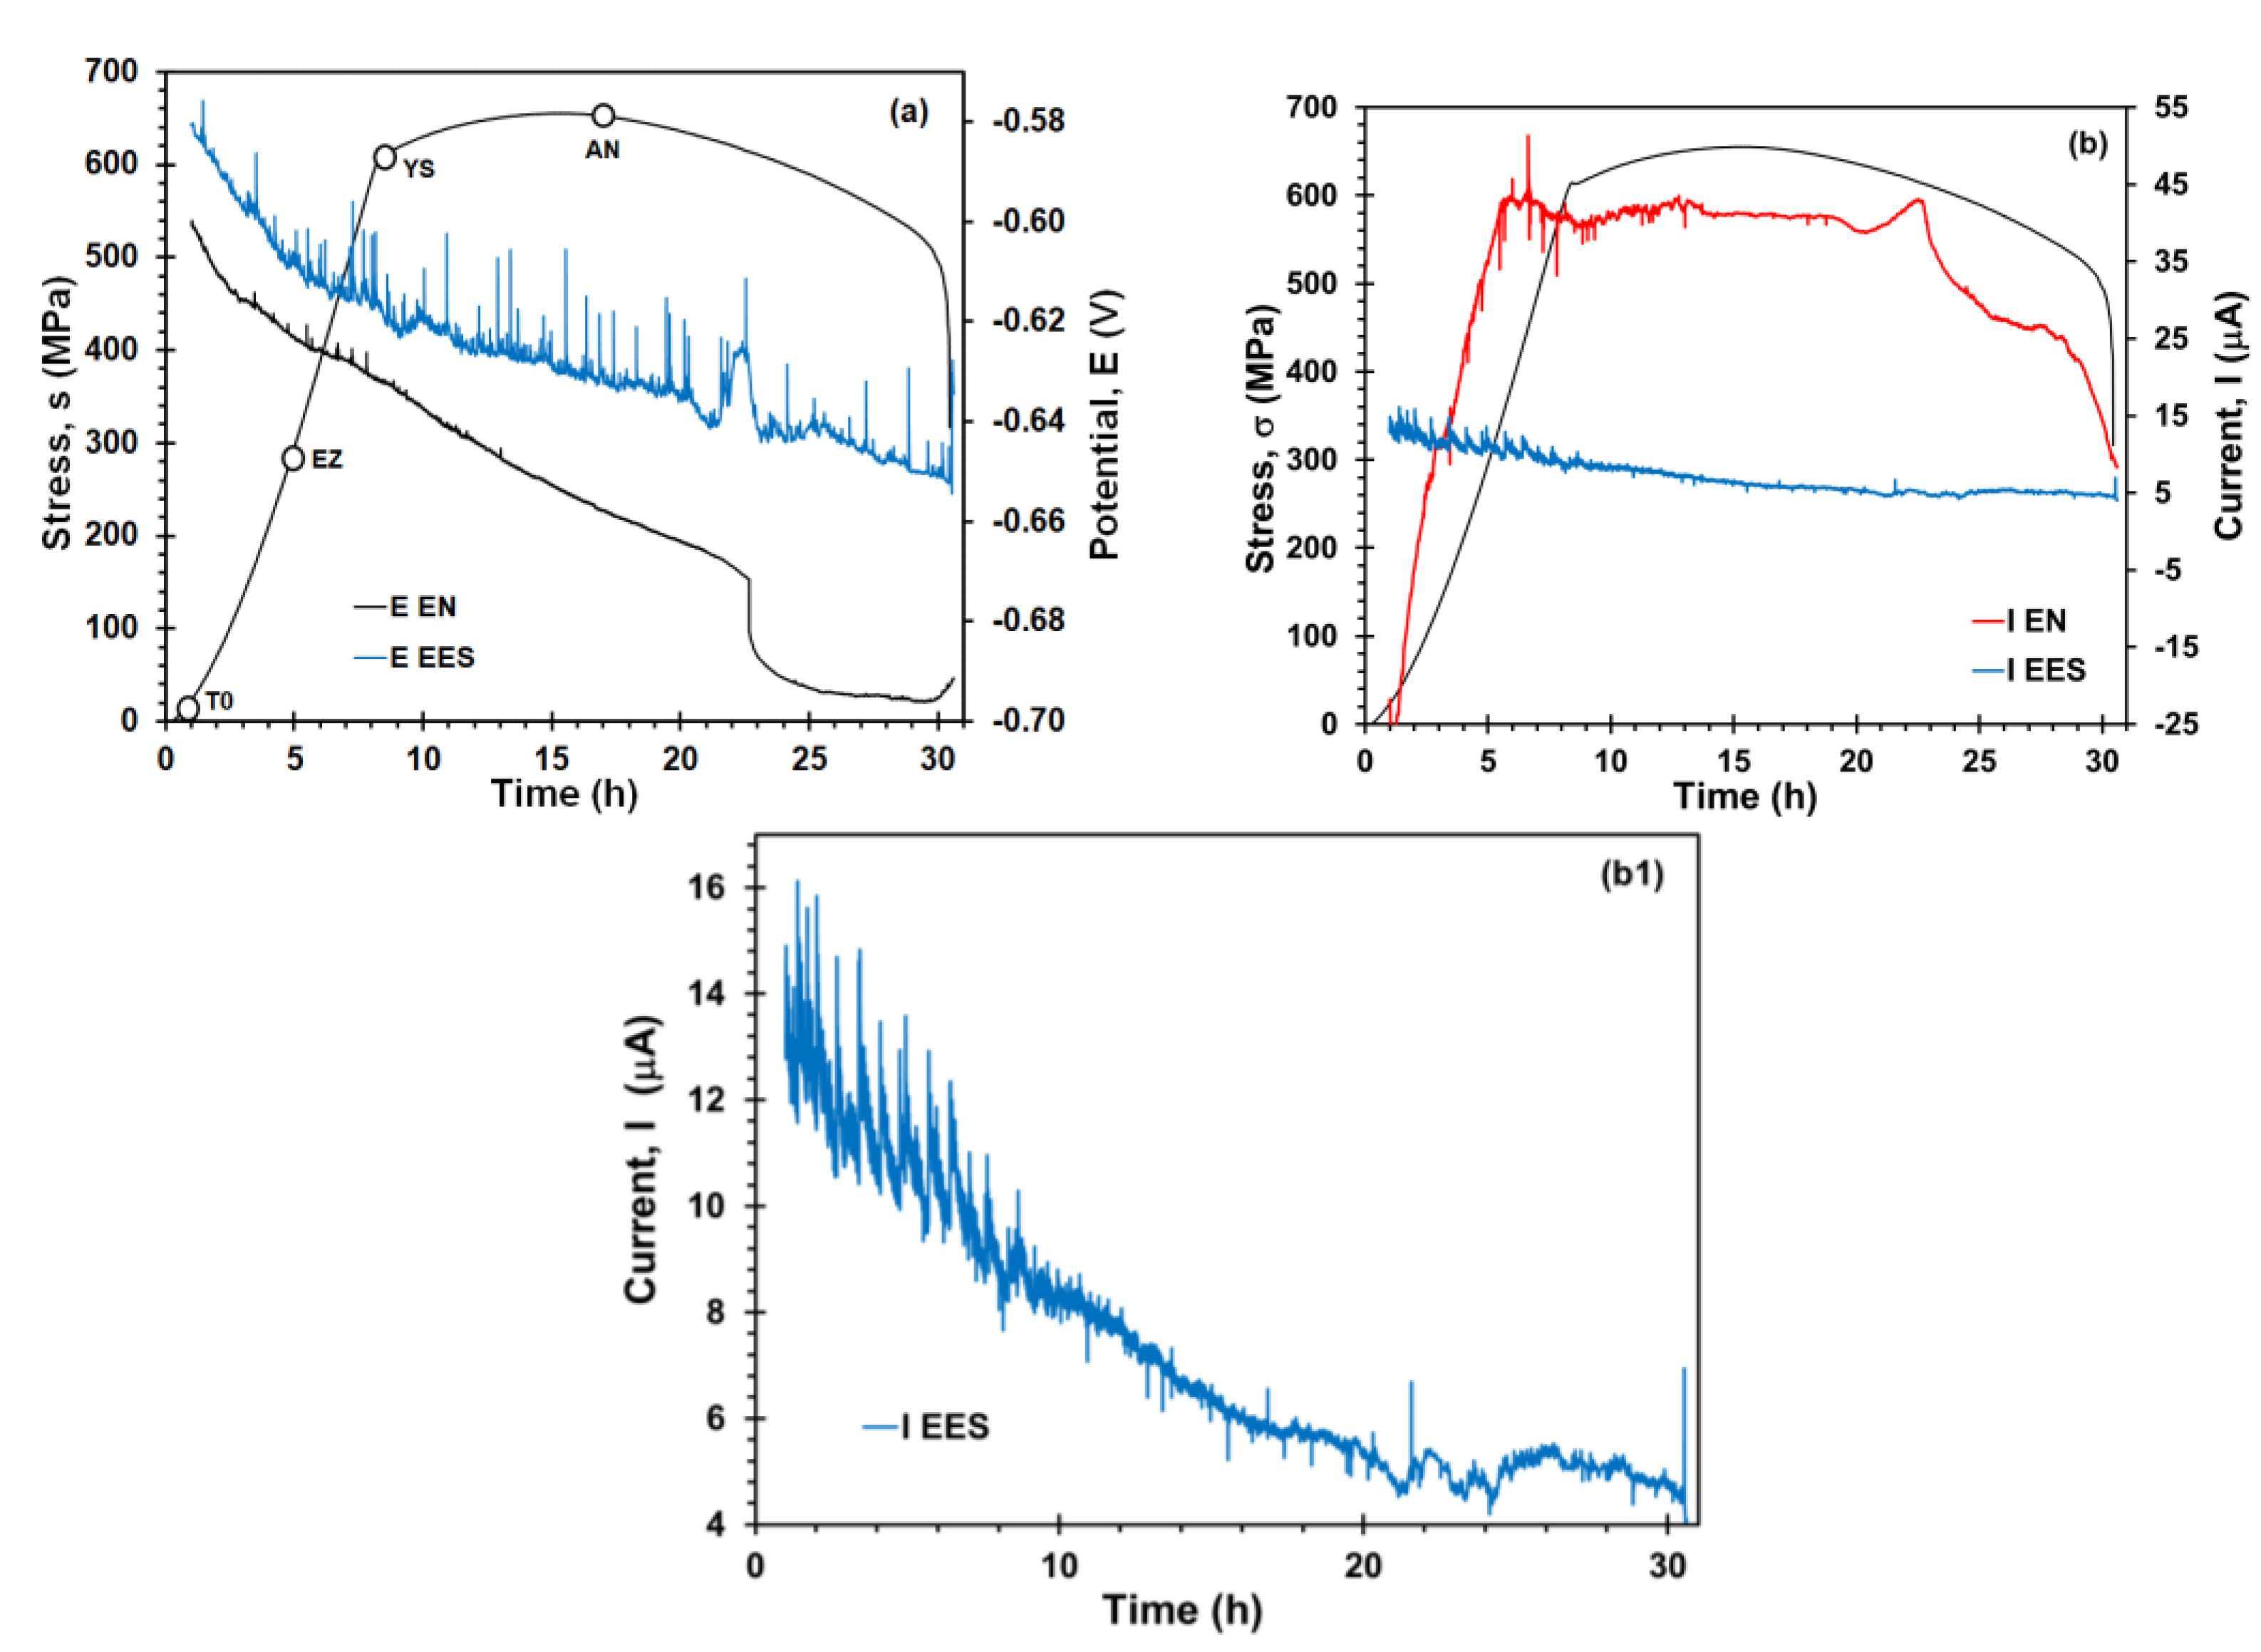
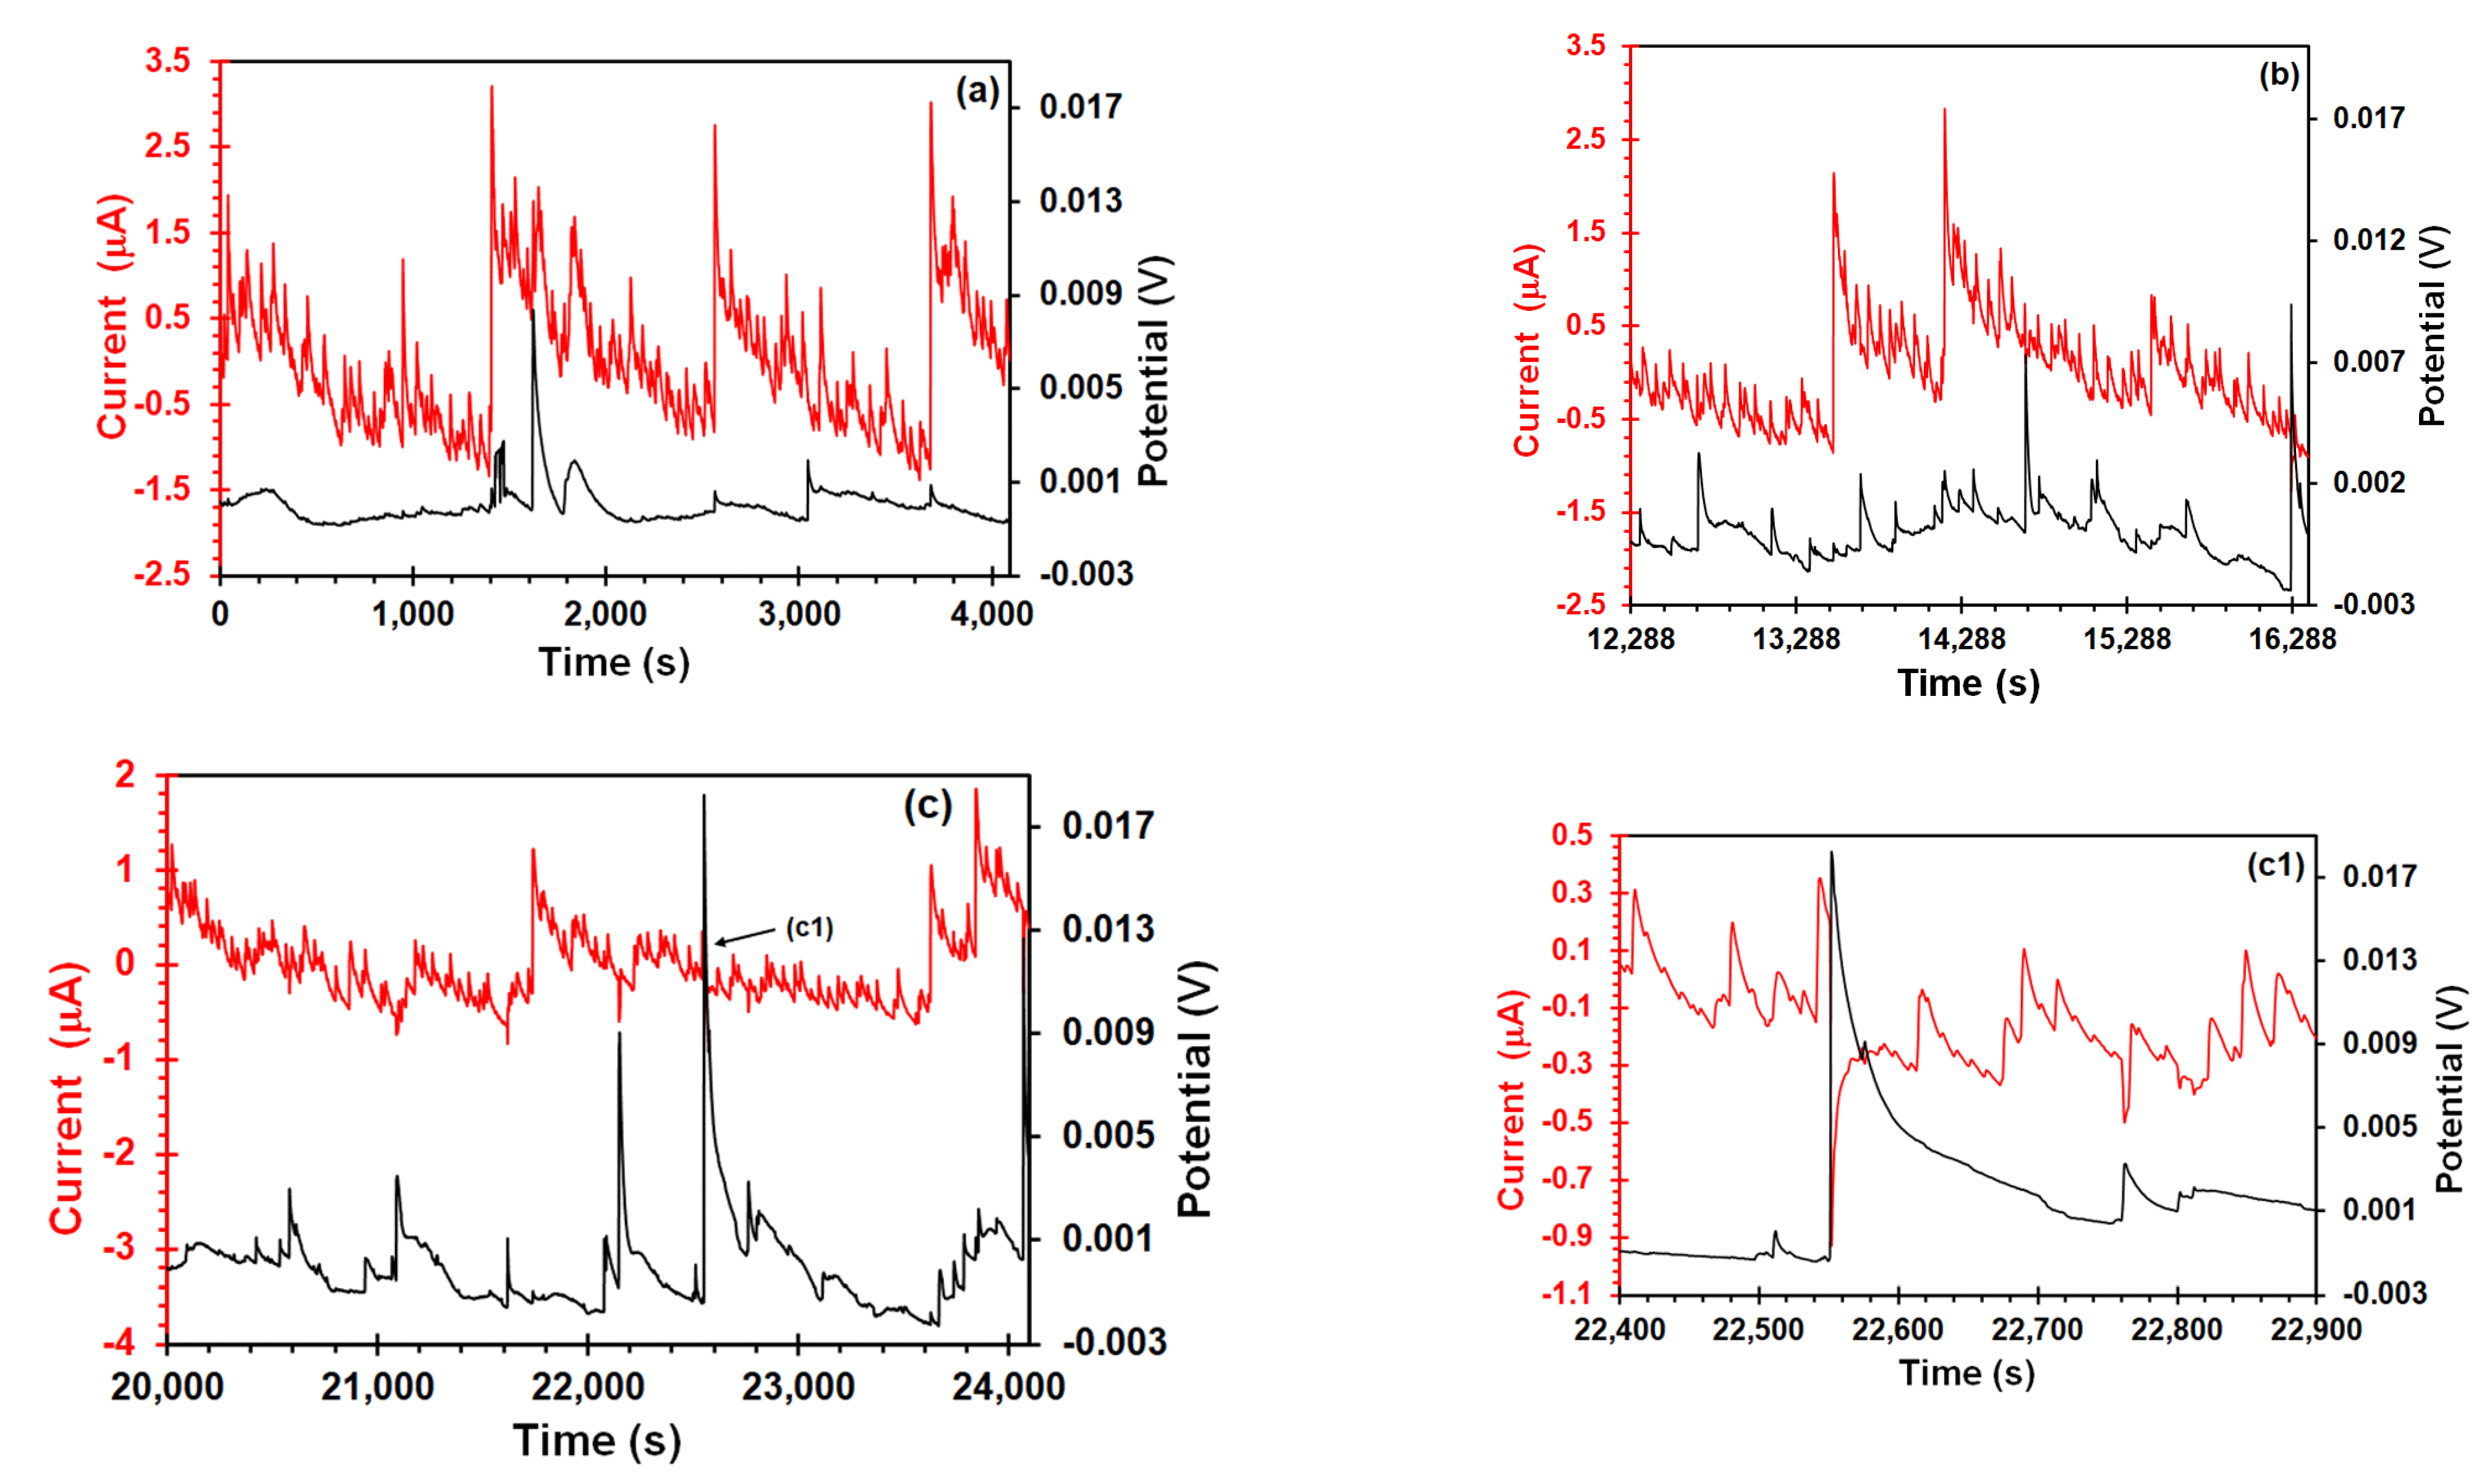
3.1. Transient Analysis during the SSRT Test

In order to discriminate signal features that may be not associated to SCC process, the raw EN and EES time records of X70 steel in the acidic solution in stress-free conditions are displayed in Figure 3. In the EN measurements (Figure 3a), some cathodic transients were observed in the current signal, characterized by a rapid decay (0.2 μA) followed by a slow logarithmic rise (30–40 s) and an anodic pick of short lifetime (5 s) and lower amplitude (20 nA). As shown in Figure 3(a1), the absence of potential transients correlated with these current transients can be due to corrosion event occurred on the WE2. This kind of current transients have been often associated to localized corrosion events such corrosion pits on the carbon steel [35,36]. Using the EES arrangement (Figure 3b), the current signal showed fluctuations with lower amplitude (0.01 μA) and higher frequency. In both arrangements, the potential signal features were similar. The coupling current was of the same order of magnitude and current signals exhibited a low frequency component (undulatory behavior). Homborg et al. [37] claimed that this behavior is typical of general corrosion, or a corrosion process limited by diffusion, in which the general corrosion is expected given the aggressive acid solution.
Figure 4 shows the EN and EES measurements during the SCC process. In this figure, it is possible to observe the stress–strain curve of X70 steel in the acidic NS4 solution, along with EN and EES time records during the SSRT test. For the potential time records (Figure 4a), the potential value gradually decreased as the SSRT elapsed. Cui et al. [38] found a similar behavior in their OCP measurements of X70 steel in NS4 solution during the SSRT test. The EES measurements showed a higher number of potential transients with of high amplitude (~20 mV), mainly after the stress reached the yield strength. This would suggest that EES arrangement exhibited higher sensibility to detect corrosion events. For the EN measurements, only few potential transients of relative high amplitude (3 mV) were observed close to yield strength. Likewise, as seen in Figure 4b, transients of high amplitude (~10 μA) in the EN current signal were revealed at the same stress level, probably due to SCC crack initiation on the steel surface. Some works [39,40] reported the detection of initiation of cracks closed to macroscopic yield strength value, which is enough stress level to induce localized microplastic deformation. On the other hand, the DC trend of current followed the trend of the SSRT curve. Li et al. [40] believe that the DC trend is caused by the actual asymmetry between the electrochemical activities of two working electrodes. However, the DC trend was less pronounced during the plastic deformation, condition in which the electrochemical behavior of both WE would be expected to be different from each other because of permanent deformation suffered by the stressed sample. Rather, the coupling current value increased as the stress level increased, which was an order of magnitude higher in comparison to stress-free conditions. This fact could indicate the electrode asymmetry suggesting that the stressed sample behaved preferentially as an anode whereas the unstressed sample acted as cathode [41]. In EES arrangement, the coupling current kept more stable, and it is shown in Figure 4(b1), the current noise was predominant during the elastic stress, and subsequently, the amplitude and occurrence of transients decreased as the SSRT test was carried out.
In order to identify a better evolution of transient’s features during the SSRT test, EN time records after trend removal corresponding to several points on the SSRT curve are shown in Figure 5. Those points are indicated in Figure 4a, where T0 is at the beginning of the test, EZ is the elastic zone, YS is the yield strength, and AN is after the necking. In case of potential and current measured at the beginning of the SSRT test (Figure 5a), they do not show transients. Figure 5b showed that appearance of potential and current transients started well below the yield point, σYS (approximately 30% of the σYS value). It should be noted that these current transients had similar features to those obtained in stress-free conditions (Figure 3(a1)), with the difference that amplitude (3 μA) and lifetime (from 30 to 60 s) of transients was higher under stress conditions. It is evidence of enhancement of electrochemical activity due to the stress effect. Moreover, the correlation of these current transients with positive potential transients of high amplitude (2–4 mV) could also be attributed to the nucleation, growth, and release of hydrogen bubbles that take place on the cathodic sites on the metal surface [42]. Once the yield point was reached (Figure 5c), a positive current transient with the highest amplitude and lifetime (~10 μA and ~200 s, respectively) was recorded (Figure 5(c1)). Jiao et al. [19] declared that strong long-period spikes can be originated from the initiation of micro-cracks. In addition, both potential and current signal showed some transients like those shown in Figure 5b followed by a couple of transients with similar features. Kim and Cho [12] showed this kind of couple transients during the SSRT in an acidified 3.5% NaCl solution. These transients seem to be a consequence of crack initiation, catalytic surface generation along with the hydrogen reduction, and consequently, generation of atomic hydrogen adsorption that takes place on this active surface. Some hydrogen atoms will have a chemical reaction and they can form molecular hydrogen bubbles, but others can diffuse into the steel because of enhancement of hydrogen diffusivity caused by dislocation movement during the stress application [43]. After the UTS (Figure 5d), the amplitude of potential and current decreased, and the current signal exhibited an undulatory behavior. Wang et al. [44] associated this low frequency component to crack propagation in their EN measurements on SCC of pre-cracked 304 stainless steel sample. However, this behavior can be attributed to the uniform corrosion that prevailed on the electrode surface after the necking zone.
Figure 6 shows EES arrangement, in case of Figure 6a, the current signal had saw-tooth-type shapes transients when the steel was subject under elastic stress. These types of transients were recorded by Du et al. [22] in their EES measurements of a 304 stainless steel in acidic NaCl solution during the SSRT. Likewise, electrochemical systems where the hydrogen bubble evolution take place on the catalytic electrode surface have also shown similar transient features [42,45]. The fact that this behavior was not shown in the unstressed sample (Figure 3b) suggests that it should be related to effect of stress on anodic and cathodic reactions that occurs on the metal/solution interface. Although the small area of platinum would not be enough to support the reduction of all electrons produced by the stress enhanced anodic reaction, some electrons could be reduced in platinum, contributing to the intensity of potential and current signals, and producing overlapped transients. This current signal pattern prevailed up to the yield point (Figure 6b,c) with the difference that amplitude of transients decreased (from 4 to 1 μA), whereas the amplitude of the potential transients increased (from 8 to 20 mV). Furthermore, from this point, most potential transients of high amplitude were correlated with negative current transients (Figure 6(c1)), suggesting that these transients correspond to those recorded in the EN measurements. It should be pointed out that one similarity between both arrangements was the unidirectionality of potential transients in the positive direction. Aballe et al. [28] believe that this unidirectionality is due to detachment of the H2 bubble, which causes a transient increase of the cathodic component of the current. In addition, Eden [46] found that transgranular SCC of carbon steel led to positive potential transients, associated with cathodic processes induced by crack propagation. Finally, after the necking zone (Figure 6d), the current signal features changed, exhibiting an undulatory behavior with occurrence of overlapped transients of quick rise (10 nA) and slow recovery (50–60 s). Ortiz et al. [47] recorded current EN signals with similar features after the yield point, attributing it to crack propagation by slip-step anodic dissolution mechanisms. However, the experimental conditions (acidic solution and the absence of a passive film on the metal surface) of the present study suggests that the SCC mechanism involved the combination of hydrogen embrittlement and anodic dissolution. This fact was confirmed by fractography analysis in a previous work [31].

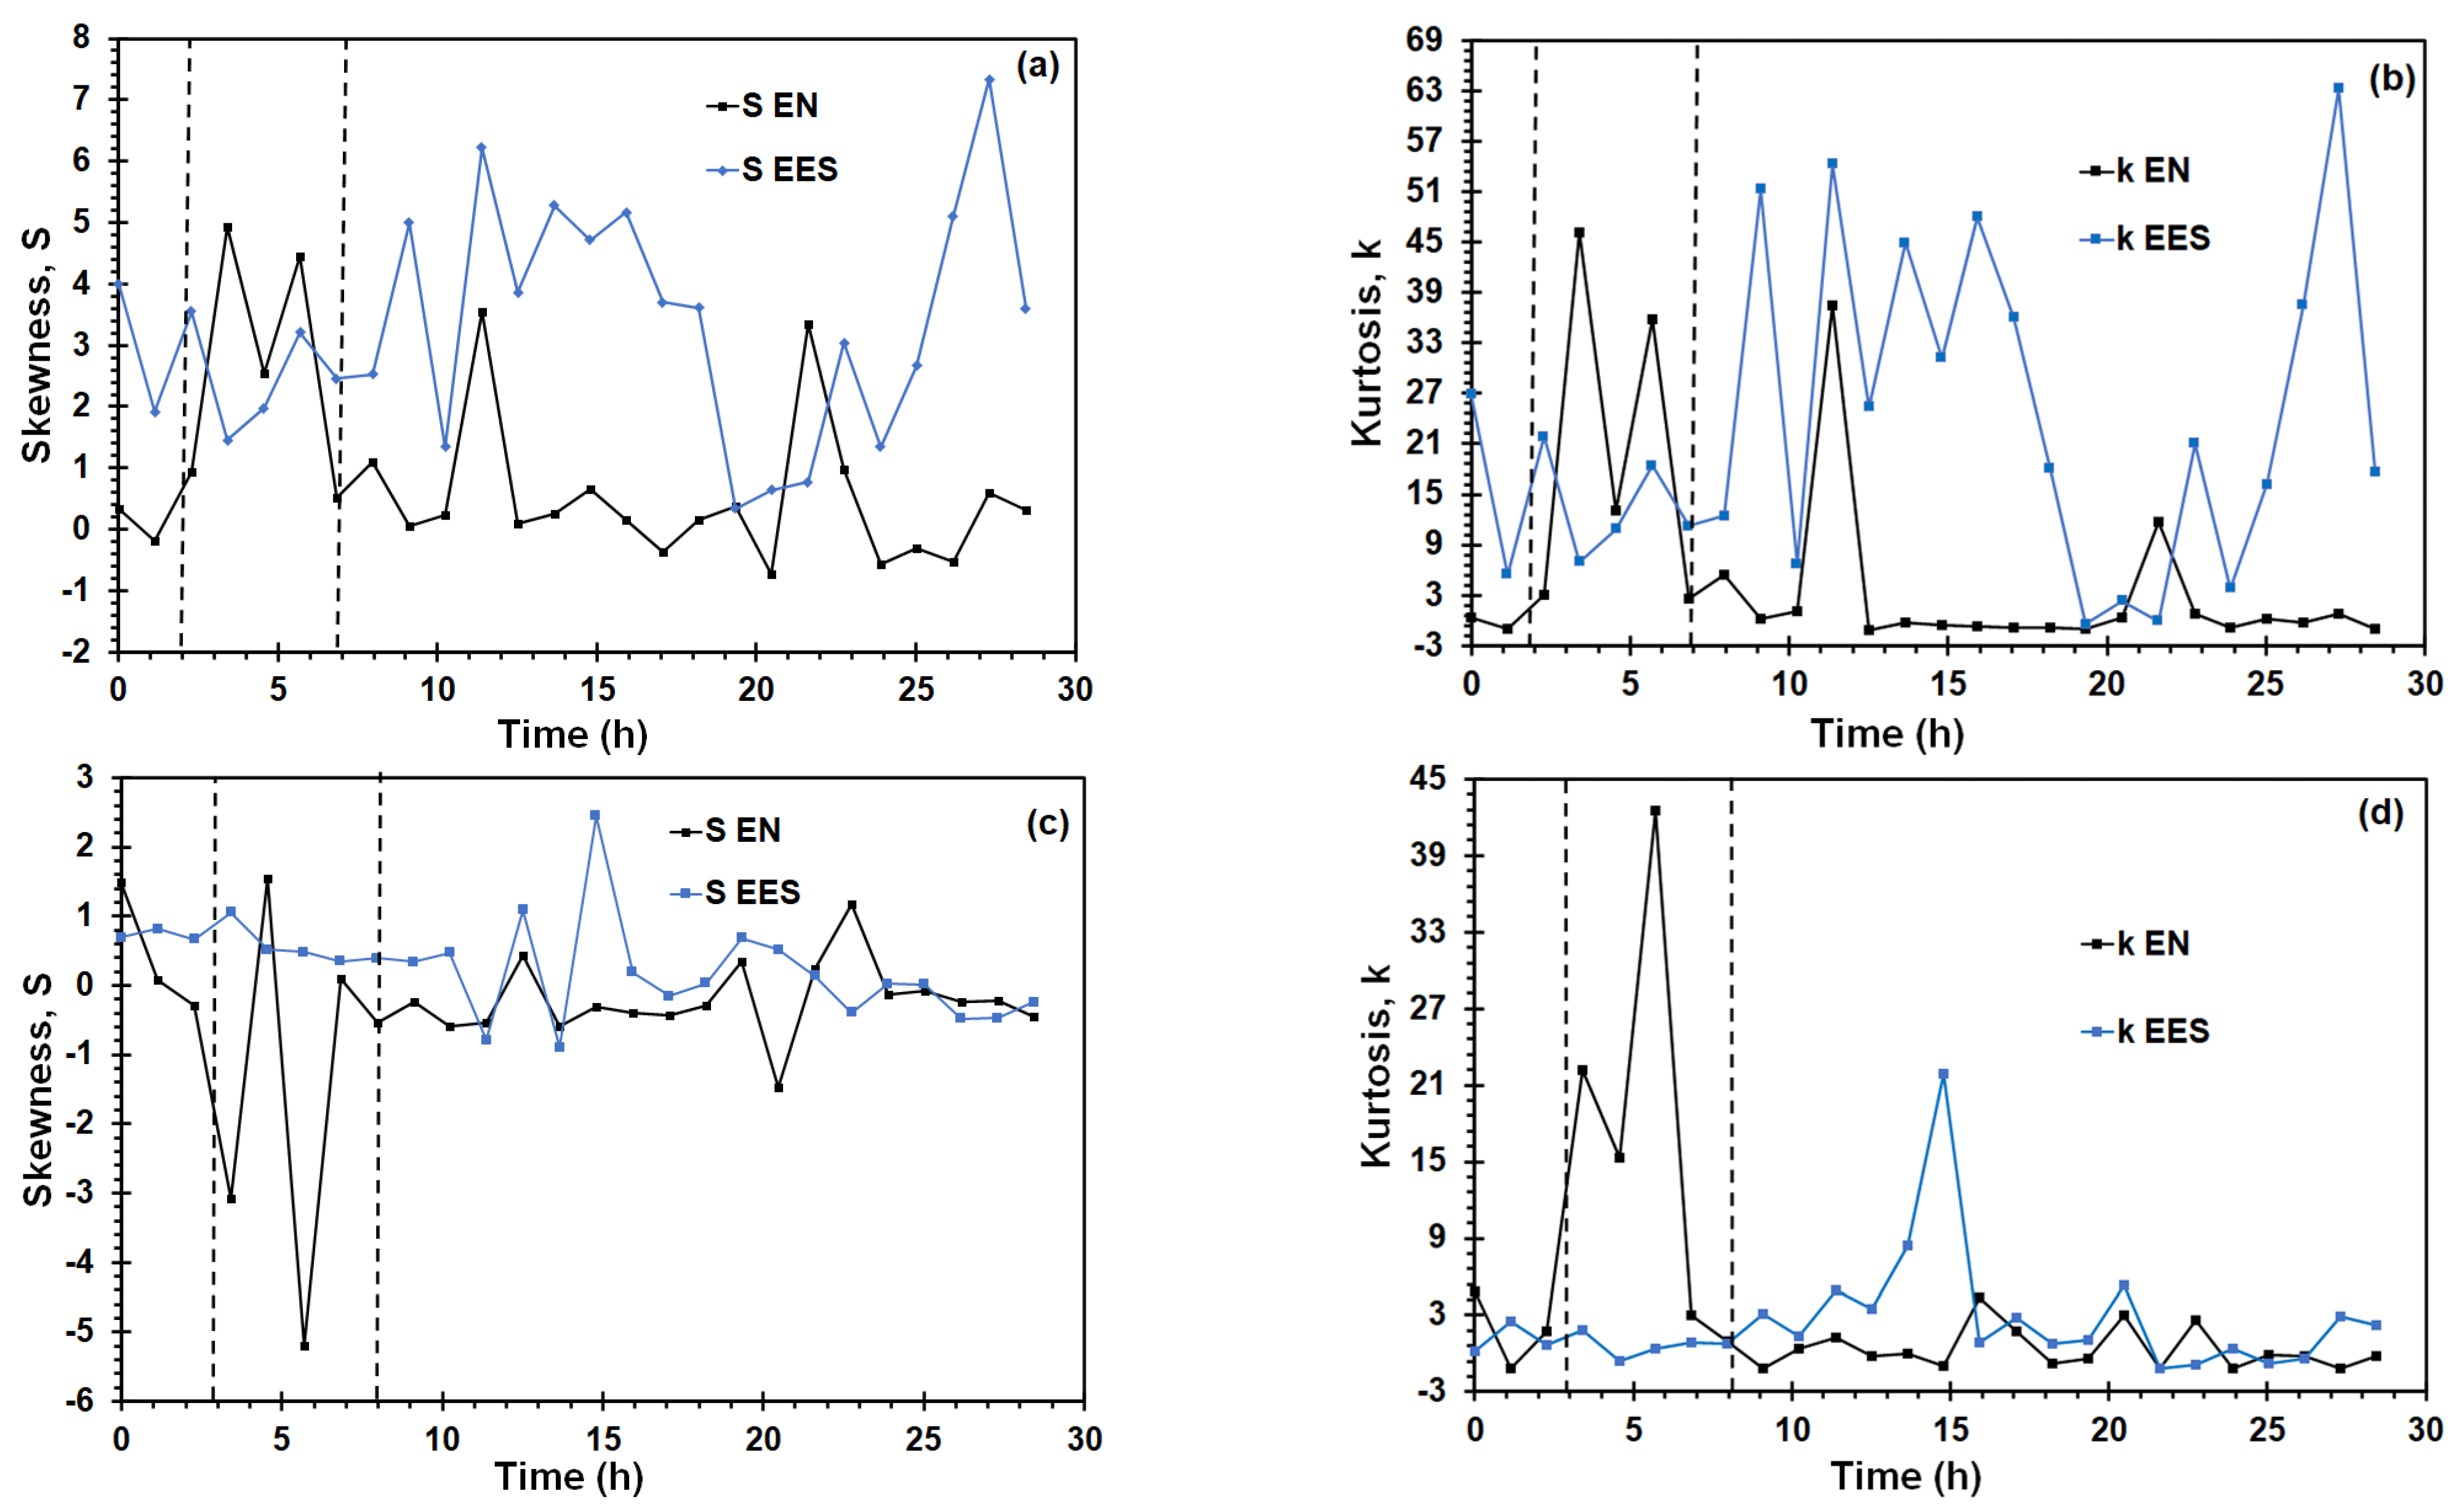
3.2. Statistical Analysis

Statistical parameters such as skewness (S) and kurtosis (k) of potential and current time series recorded using EN and EES arrangement during the SSRT test were determined in the time domain. S and k were calculated by the following equations [48]:
m n = 1 N i = 1 N ( i i ¯ ) n
S = m 3 m 2 2 / 3
k = m 4 m 2 2  
where N is the data number of time record, i represents potential or current noise, i ¯ is the potential or current mean value, and n is the moment order, m2, m3, and m4 the second, third, and fourth moments, respectively. S provides information about the asymmetry of the probability distribution of the EN data, whereas k is a measure of the shape of the EN data [49]. As seen in Figure 7a,b, the higher statistical parameters values arising from potential records were obtained from the EES measurements. In Figure 7c,d, the higher k values and lower S values derived from current signals were obtained with the EN arrangement near to the time interval of the yield point of the SSRT curve. This sharp decrease and increase of S and k values, respectively, can be associated to initiation of cracking. Reid and Eden [50] identified the corrosion type based on S and k values (see Table 1), which are summarized in the Table 1. According to this table, the S and k calculated would indicate a transgranular SCC. This cracking morphology occurs in the near-neutral pH SCC of pipelines, which involves the participation of hydrogen, diffusing towards the metal lattice and producing embrittlement. Liu et al. [51] reported that grains of X70 steel have an anodic behavior in comparison to the grain boundary in a NS4 solution. Therefore, the anodic dissolution takes place preferentially into the grains, becoming the active path to crack advance.
Localization index (LI) is another statistical parameter used to identify the corrosion processes mechanism. LI is calculated as:
LI = σ I I RMS  
where σI is the current standard deviation and IRMS is the current root mean square value. An LI value between 0.1 and 1.0 indicates localized corrosion, a value between 0.01 and 0.1 is indicative of mixed corrosion, and for passive or uniform conditions the range is between 0.01 and 0.001 [52].
Figure 8 shows the variation of LI value test calculated from current time records using the EN and EES arrangement during the SSRT test. Some authors [37,52] have emphasized that LI has some theoretical limitations, and it should be associated to asymmetry of working electrodes rather than the corrosion mechanism. The IL values obtained with the EN arrangement indicated localized corrosion process during the first 8 h of exposure, time at which nucleation of microcracks is presumed to have initiated, then the IL values corresponded to general and mixed corrosion, whilst the IL derived from EES measurements indicated mixed corrosion during the whole SSRT test.
Mixed corrosion means that localized corrosion processes such as corrosion pits, microcracks, and uniform corrosion coexisted on the metal surface. This is confirmed from Figure 9, showing SEM images of the side surface or the gage section showed mixed and localized corrosion in forms of pits (Figure 9a); few secondary cracks with corrosion products caused by the SCC process were observed (Figure 9b,c). Few branched cracks caused by the SCC process were observed (Figure 9d). A brittle fracture was observed (Figure 9e), with some transgranular cracks in the surface fracture (Figure 9e,f), that involved the hydrogen embrittlement mechanism.

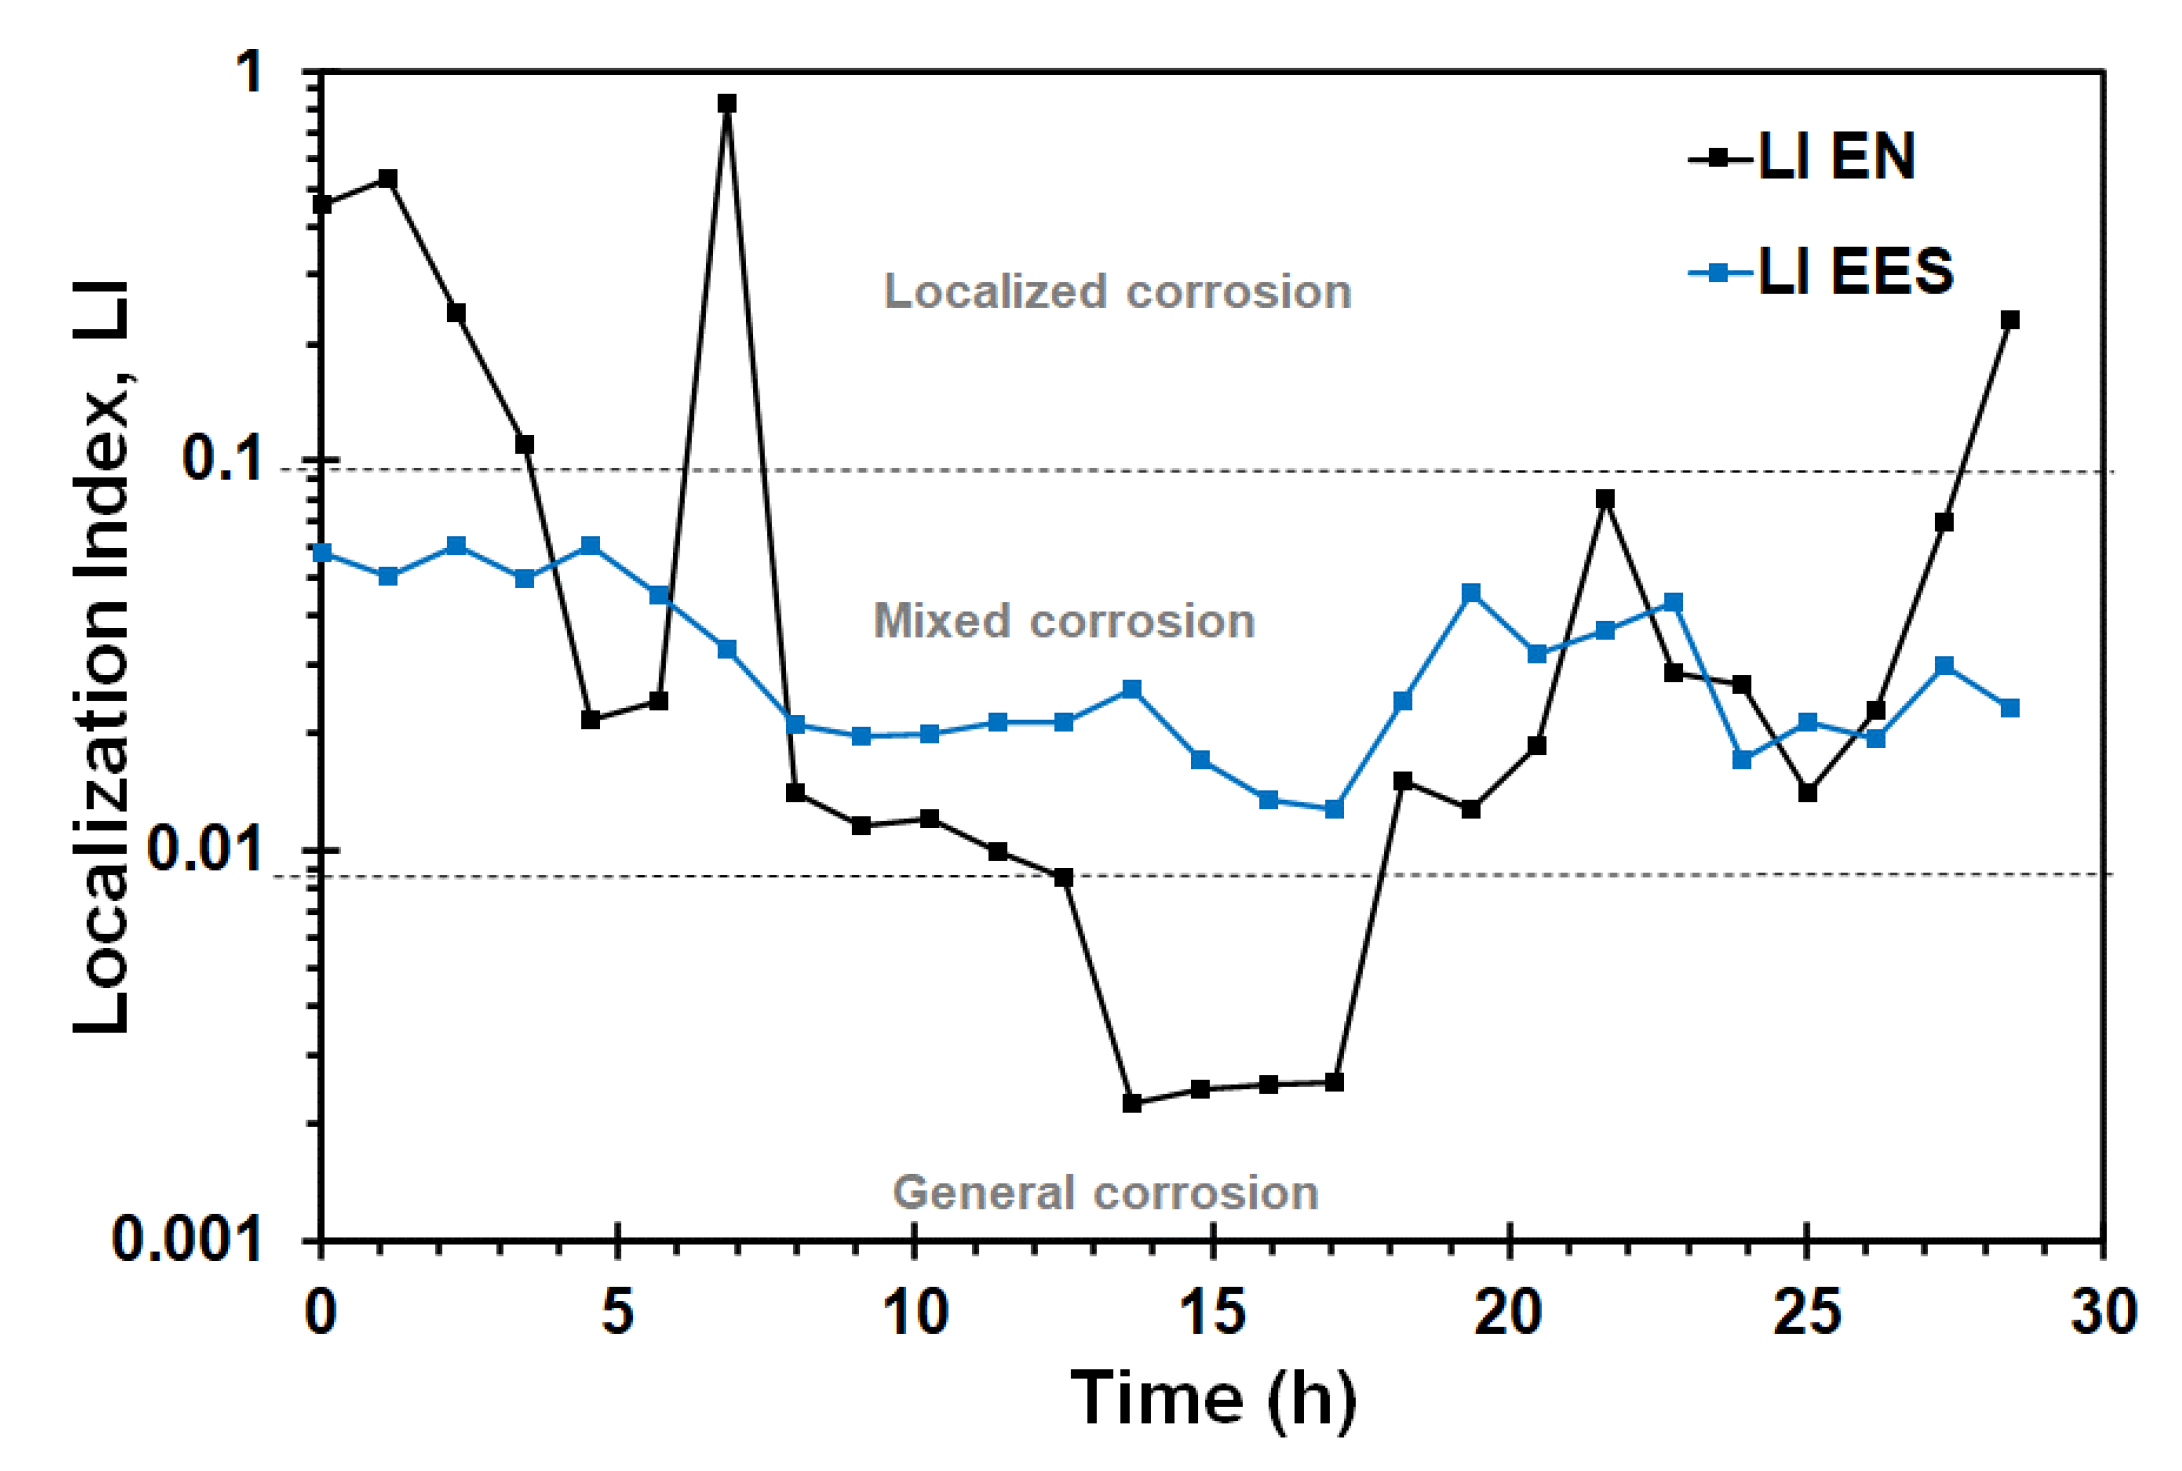
3.3. Frequency Domain Analysis

The EN and EES data were transformed from time domain to frequency domain by FFT to estimate the potential PSD (PSDE) and current (PSDI). The parameter associated to the corrosion resistance in the frequency domain is the spectral noise impedance Zn(f), defined as square root of the PSDE and PSDI quotient (see Equation (5)) [53].
Z n f = PSD E f PSD I f
Several works [54,55] have shown that Zn(f) and modulus impedance (|Z|) derived from EIS measurements can be comparable if both parameters present a low-frequency plateau and when the corrosion process is under charge transfer control. The noise impedance (Zn) value was estimated using the method described by Mansfeld et al. [54], which consists of calculating the mean value of Zn(f) in the low frequency plateau. Finally, the noise resistance (Rn), defined in Equation (6), was calculated to compare with the other resistance parameters.
R n = σ E σ I  
Figure 10 shows the values of Rn, Zn obtained from EN and EES measurements and |Z| at the frequency of 0.1 Hz arising from EIS measurements during the SSRT test. Zn and Rn values were in good agreement for each arrangement. Furthermore, with the resistance parameters it was found that they have good agreement using both arrangements at the beginning of the test. However, Zn values obtained from EES were increased until two orders of magnitude whereas the Zn values derived from EN remained in the same order of magnitude in comparison to |Z| as SSRT test elapsed. According to the theoretical predictions about Zn and |Z| relationship reported by Bautista et al. [10], the results for EES measurements would imply that the noise level of the micro-cathode was lower than the noise level of the stressed sample or that is to say, the impedance of micro-cathode was higher than the |Z| of the stressed sample. The EN arrangement may have the same limitations, where it would be expected that the noise level of stressed sample higher than unstressed sample, nevertheless, the difference between Zn and |Z| obtained from EN arrangement was less pronounced compared to EES arrangement. From this result, it can be concluded that the corrosion rate cannot be accurately estimated using the EES arrangement under the present conditions.
The roll-off slope of potential PSD (βE) and current PSD (βI) are parameters in the frequency domain that have been used to differentiate between localized and uniform corrosion processes. βE values lower than −20 dB/dec correspond to localized corrosion, whereas βE values higher than −20 dB/dec correspond to general corrosion or passivation [48,56]. Figure 11a shows that βE values are higher than −20 dB/dec and were obtained after a point closed to yield strength using both arrangements, being more evident the results obtained by the EN arrangement. This increment of βE values can be associated to pit nucleation and/or crack initiation, whereas the decrease of βE can be attributed to predominant corrosion uniform that happened on the metal surface. Similar behavior is shown in the βI value (Figure 11b). Li et al. [57] reported the transition point detection from uniform corrosion to pitting corrosion during the SCC using the βE value. Therefore, the βE value was more sensible to identify a change in the corrosion process that occurred on the metal surface.

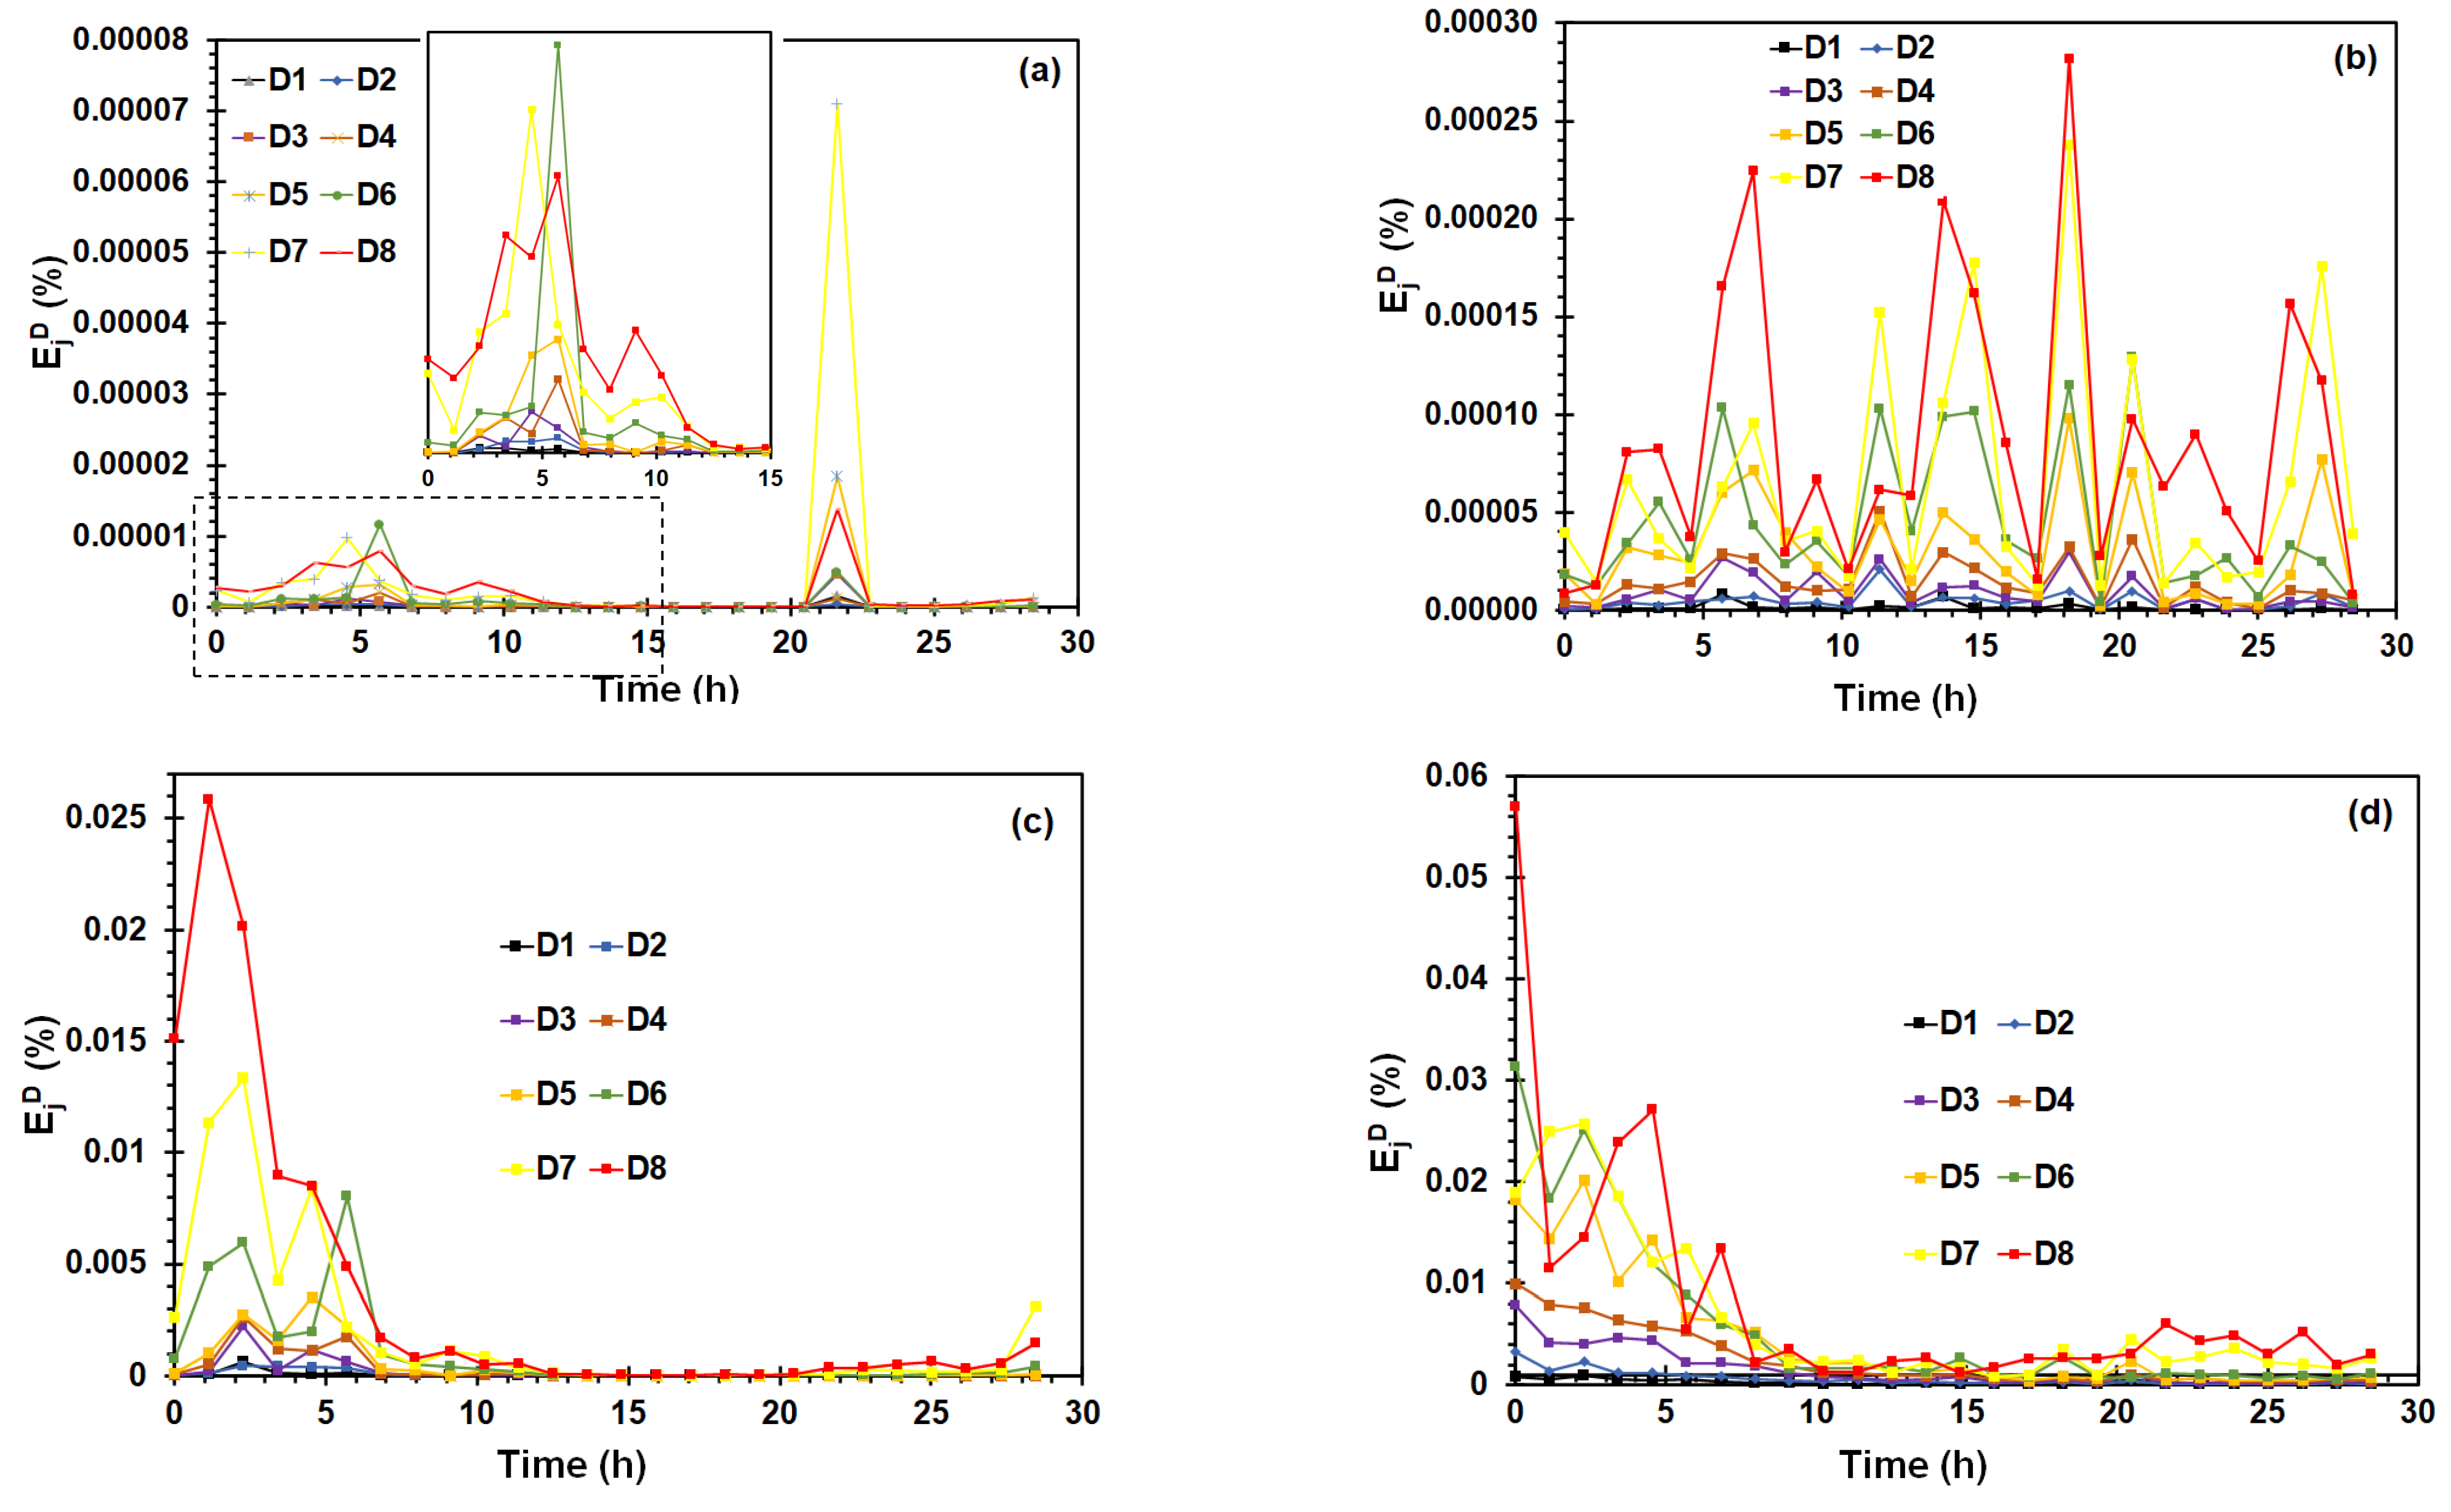
3.4. Wavelet Analysis

Wavelet analysis is a mathematical tool in the time-frequency, specifically, the DWT is an algorithm that discomposes the potential and current of the electrochemical noise in a set of approximation coefficients (S) and details coefficients (crystals, D) where S contains information about the DC trend of the signal, whereas crystals (D) contain information about local fluctuations in the noise signal. Results of the wavelet transform can be represented using the energy distribution plot (EDP) of the crystals. The energy, E, of a signal (EN or EES time record), xn, containing N number of data points, where it is estimated by following expressions [56]:
E Xn = n = 1 N x n 2
The fraction of energy associated with each crystal can be calculated as:
E j d = 1 E Xn n = 1 N / 2 J d j , n 2   j = 1 , , J  
The EDP calculated from wavelet transform has been used as “fingerprints” of noise signals and can discriminate different corrosion mechanisms [58]. Figure 12 shows the evolution of Ejd values of each crystal (D1–D8) obtained from EN and EES measurements. For EN measurements (Figure 12a), the variation of Ejd derived from potential signals revealed that the highest fraction energy of crystals was observed in a point closed to yield point, concentrating the relative energy distribution on crystals D6 and D7, which contains information about all transients with large time scale (low frequency) of 64–32 s and 128–64 s, respectively.
The energy pick at approximately 22 h was discarded because it was caused by the sudden decrease of potential values in a point after the necking zone (see Figure 4a), where the plastic instability prevails. On the other hand, Figure 12b show that several picks of the Ejd value were observed during the SSRT test using the EES arrangement, the relative energy was distributed on large time scale the D7 and D8. Figure 12c,d showed that the behavior of Ejd during the SSRT test was similar using both arrangements, reaching the Ejd highest values during the first hours of SSRT test, concentrating the relative energy distribution on D6–D8 crystals. Suresh et al. [48] showed that maximum values of Ejd concentrated on D1–D3, provide information about rapid events such as metastable pitting, D3–D6 is associated with repassivation/pits propagation, and the large time scale D6–D8 crystal that it gives information about the diffusion or pits growth. In order to get the EN and EES measurements, the SCC process of X70 steel was characterized by transients and fluctuations of medium and large time scale.
The crack nucleation in active sites such as corrosion pits, and crack propagation caused by synergic of stress, anodic dissolution, and hydrogen diffusion in the steel, involved medium and large time scale process.
It is worth noting that SCC may propagate by discontinuous or continuous processes, and each process has different current and potential signals characteristics [59,60]. The discontinuous process is similar to the occurrence of metastable pitting due to the crack tip evolution that leads to abrupt current transients, whereas the continuous process may lead to a decrease in the noise level due to a shielding effect of the crack tip. The evolution of EN signals and behavior of some parameters obtained by mathematical methods during the SSRT test indicated that SCC crack propagation was a discontinuous process before the necking zone, then the SCC crack propagation was shielded due to uniform corrosion or a possible transition of discontinuous to continuous SCC propagation mechanism.

4. Conclusions

The comparative study of electrochemical study of the SCC process of a X70 steel in acidic NS4 solution during the SSRT between EN and EES measurements was carried out, and it generated the following conclusions:
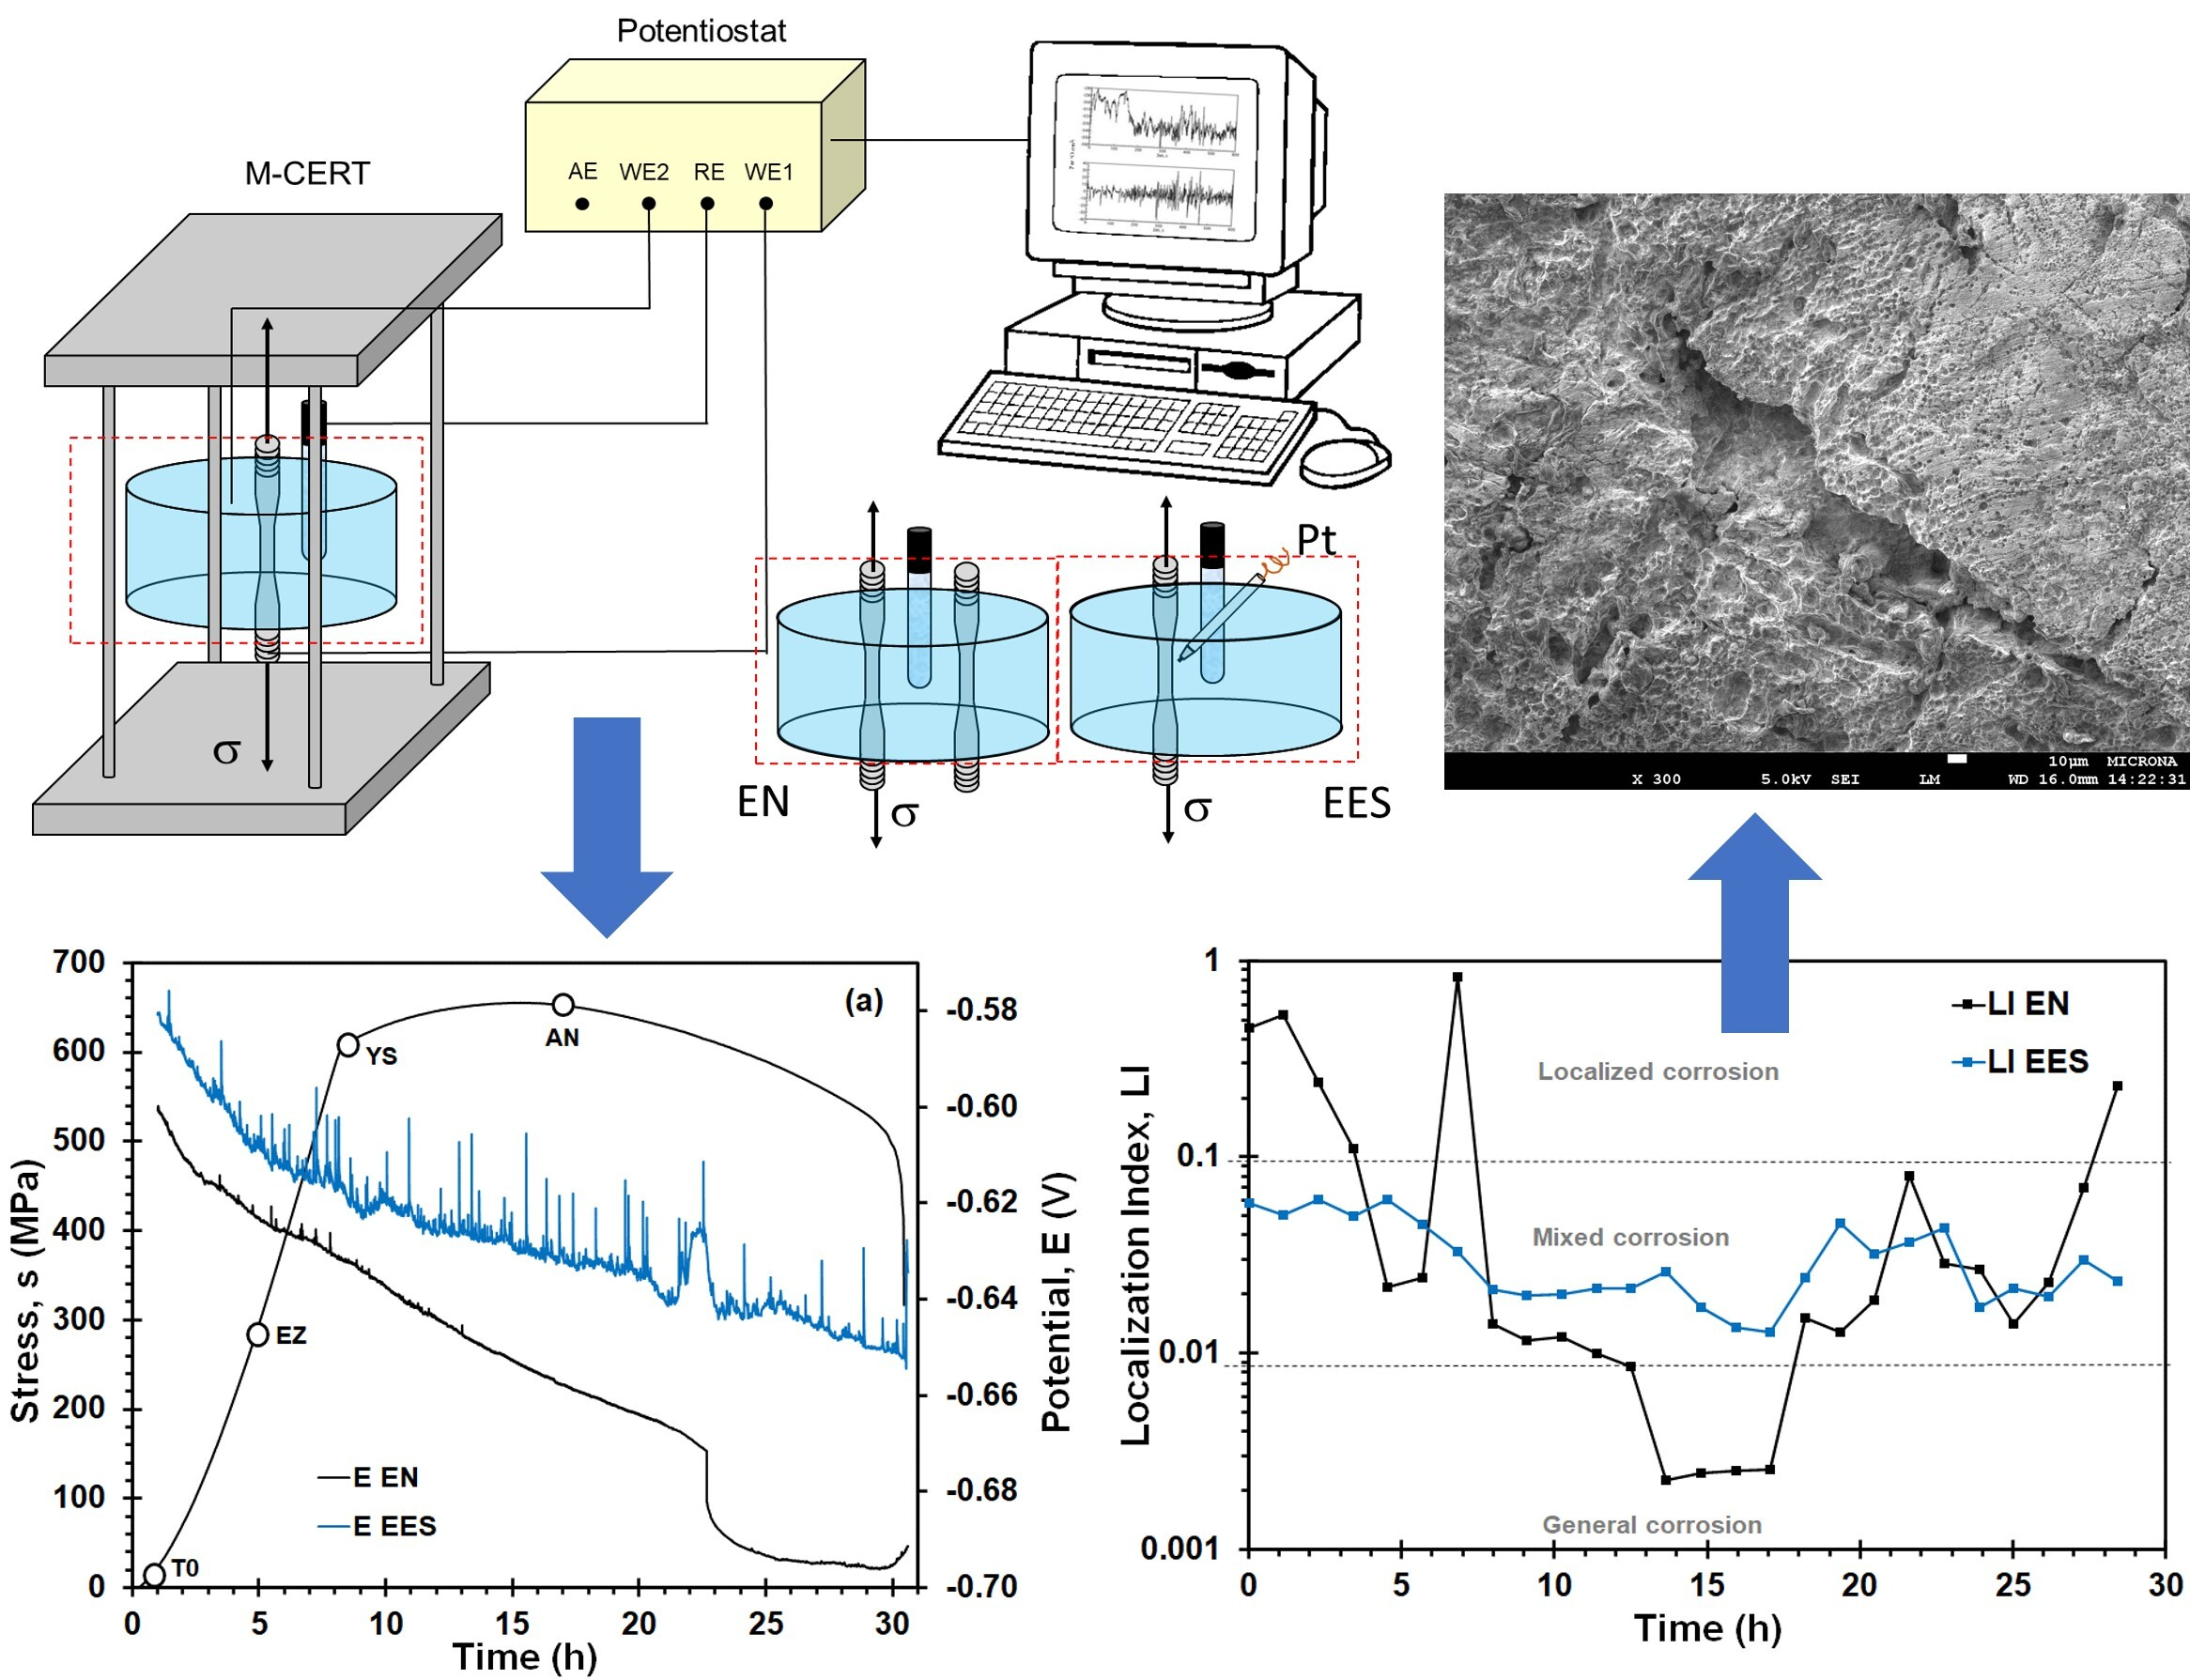
  • The stress had a strong influence on the characteristic of transients recorded by both arrangements, showing more sensibility to record a higher number of transients using the EES arrangement. However, this fact complicated the identification of a possible SCC crack initiation.
  • The examination of transients, statistical, and wavelets analysis indicated that EN measurements were more effective to detect the initiation of SCC cracking at a point close to the yield strength. After the necking, the uniform corrosion of the steel predominated in the EN measurements.
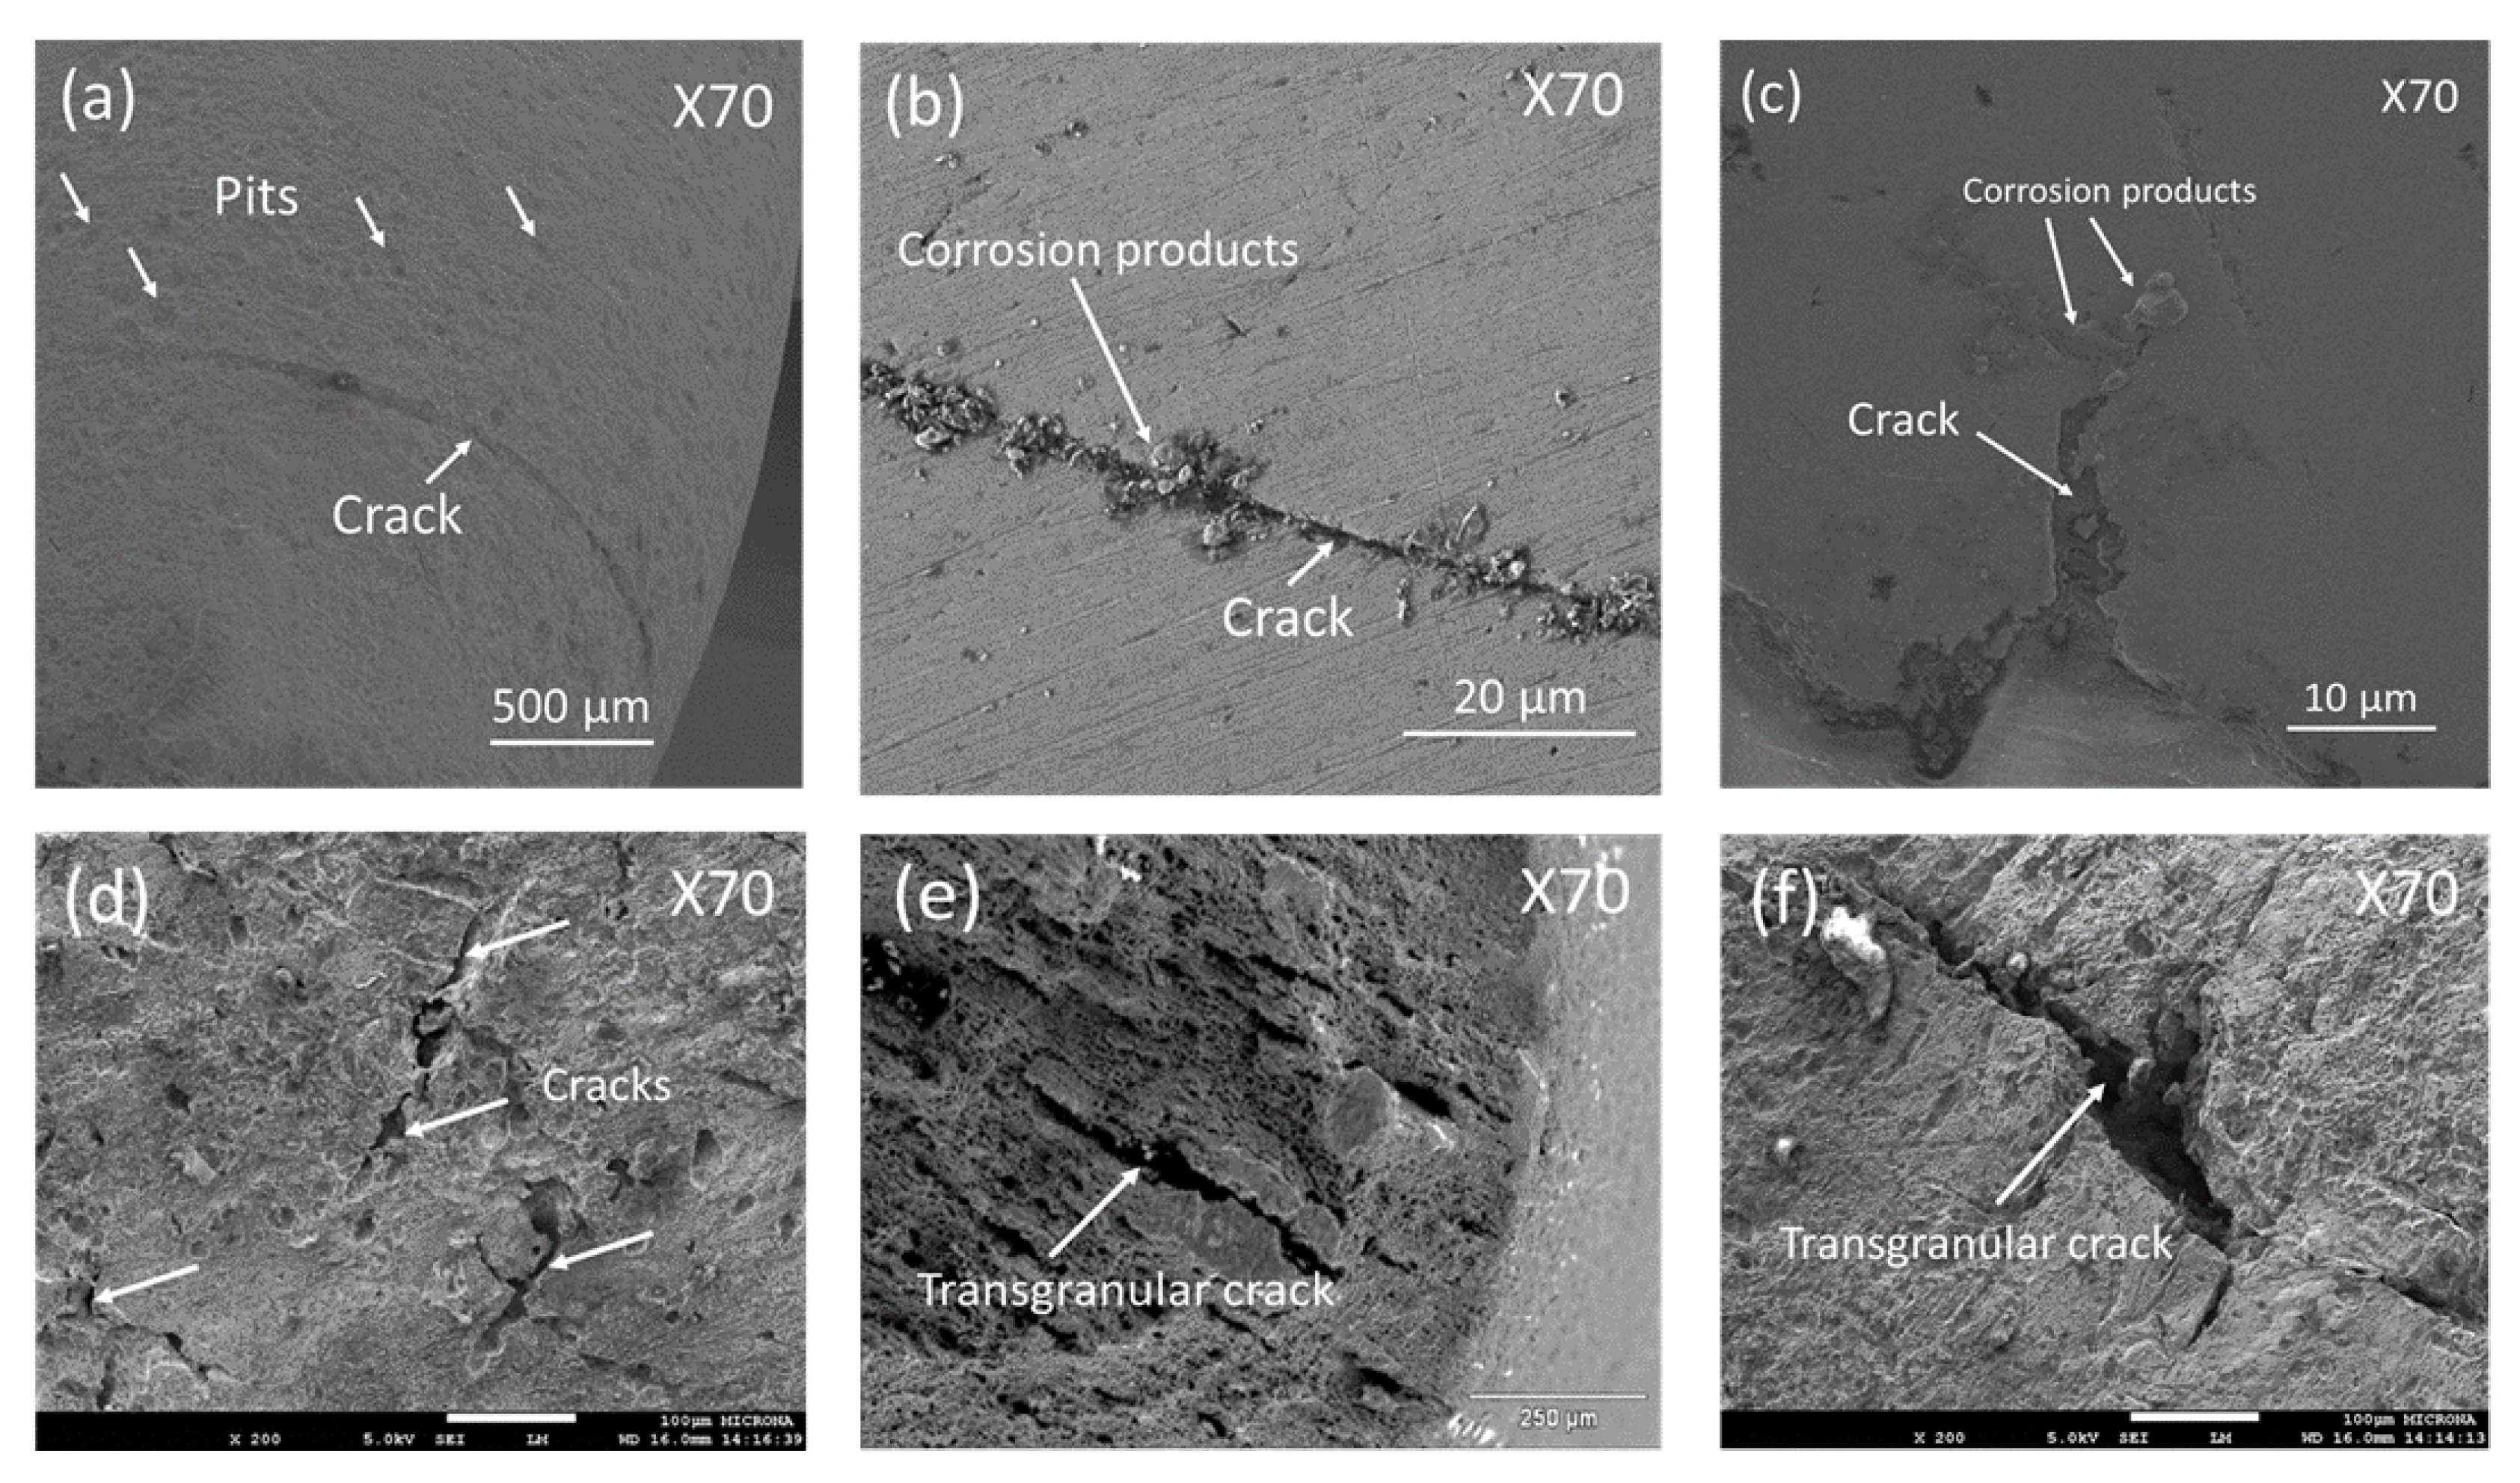
  • The analysis of the features of EN signals with statistical and wavelet analysis suggested a discontinuous SCC transgranular cracking that involved the hydrogen embrittlement and anodic dissolution mechanism.
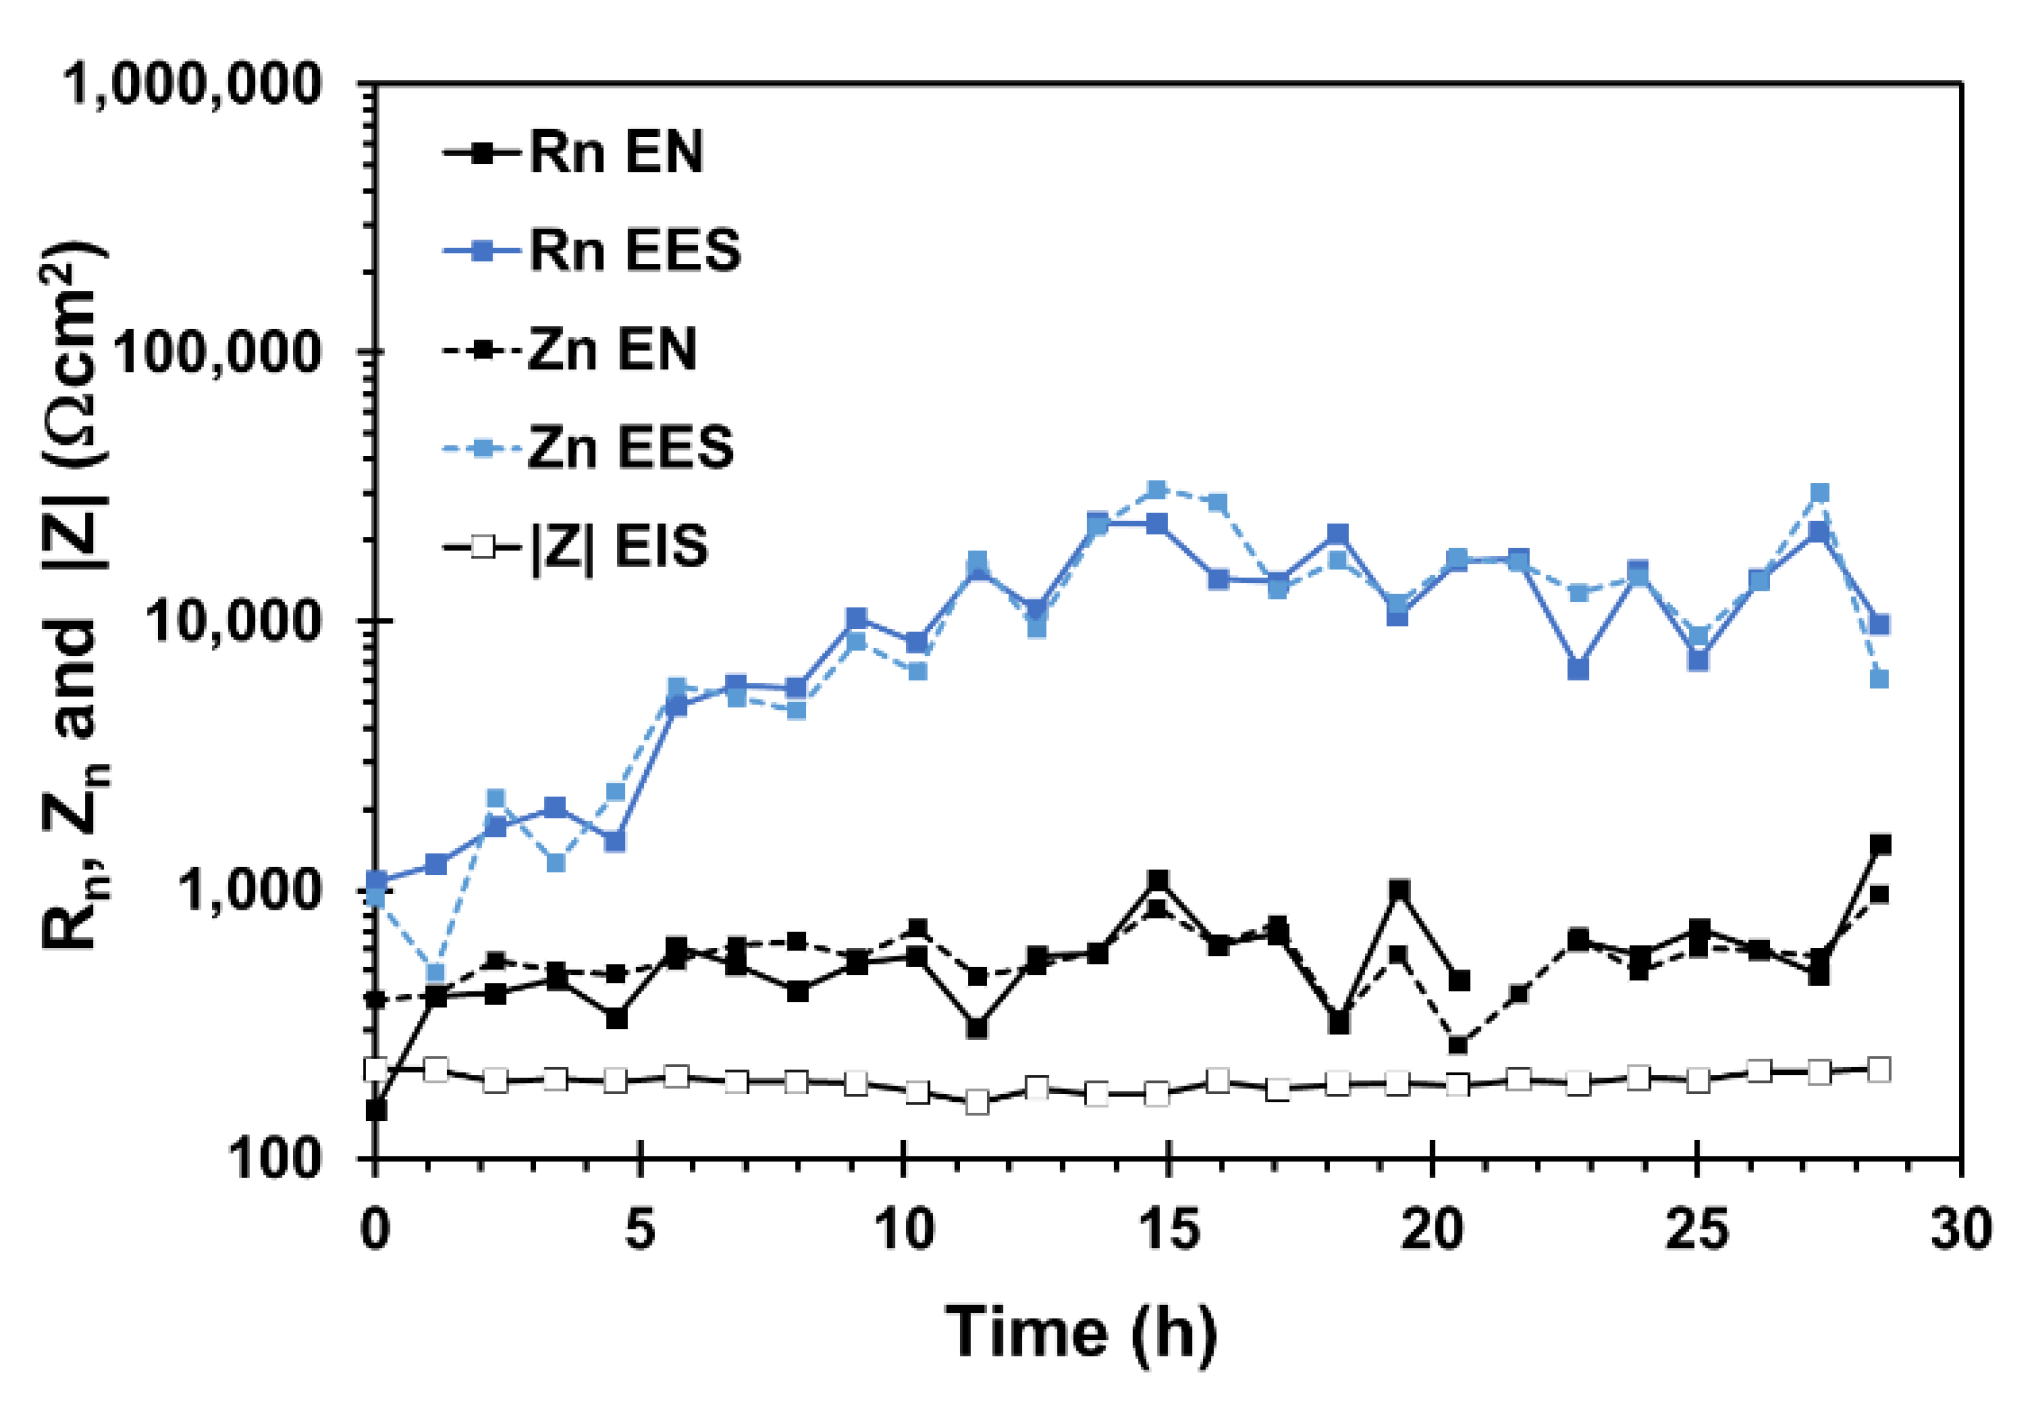
  • The Zn and Rn obtained by EN measurements had a better correlation with |Z| derived from EIS than EES measurements

Author Contributions

Conceptualization, A.C.-H., A.C. and R.G.-M.; data curation, R.O.-C., F.L.-H. and E.M.-S.; formal analysis, A.C.-H., A.C. and R.G.-M.; investigation, A.C.-H., A.C. and R.G.-M.; methodology, A.C.-H. and R.G.-M.; project administration, R.O.-C. and R.G.-M.; resources, R.O.-C., F.L.-H. and E.M.-S.; software, F.A.C.-S. and C.C.-L.; supervision, C.C.-L., F.L.-H. and E.M.-S.; validation, A.C. and R.G.-M.; visualization, F.A.C.-S. and C.C.-L.; writing—original draft, A.C.-H. and R.G.-M.; writing—review and editing, R.O.-C., F.A.C.-S., A.C. and R.G.-M. All authors have read and agreed to the published version of the manuscript.

Funding

This research received no external funding.

Institutional Review Board Statement

Not applicable.

Informed Consent Statement

Not applicable.

Data Availability Statement

The data presented in this study are available on request from the corresponding author.

Conflicts of Interest

The authors declare no conflict of interest.

References

  1. Zhu, M.; Du, C.; Li, X.; Liu, Z.; Wang, S.; Li, J.; Zhang, D. Effect of AC Current Density on Stress Corrosion Cracking Behavior of X80 Pipeline Steel in High PH Carbonate/Bicarbonate Solution. Electrochim. Acta 2014, 117, 351–359. [Google Scholar] [CrossRef]
  2. Sadeghi Meresht, E.; Shahrabi Farahani, T.; Neshati, J. Failure Analysis of Stress Corrosion Cracking Occurred in a Gas Transmission Steel Pipeline. Eng. Fail. Anal. 2011, 18, 963–970. [Google Scholar] [CrossRef]
  3. Breimesser, M.; Ritter, S.; Seifert, H.P.; Virtanen, S.; Suter, T. Application of the Electrochemical Microcapillary Technique to Study Intergranular Stress Corrosion Cracking of Austenitic Stainless Steel on the Micrometre Scale. Corros. Sci. 2012, 55, 126–132. [Google Scholar] [CrossRef]
  4. Calabrese, L.; Bonaccorsi, L.; Galeano, M.; Proverbio, E.; di Pietro, D.; Cappuccini, F. Identification of Damage Evolution during SCC on 17-4 PH Stainless Steel by Combining Electrochemical Noise and Acoustic Emission Techniques. Corros. Sci. 2015, 98, 573–584. [Google Scholar] [CrossRef]
  5. Aldrich, C.; Qi, B.C.; Botha, P.J. Analysis of Electrochemical Noise Data with Phase Space Methods. Miner. Eng. 2006, 19, 1402–1409. [Google Scholar] [CrossRef]
  6. Xia, D.H.; Song, S.Z.; Behnamian, Y. Detection of Corrosion Degradation Using Electrochemical Noise (EN): Review of Signal Processing Methods for Identifying Corrosion Forms. Corros. Eng. Sci. Technol. 2016, 51, 527–544. [Google Scholar] [CrossRef]
  7. Montoya-Rangel, M.; de Oca, N.G.M.; Gaona-Tiburcio, C.; Colás, R.; Cabral-Miramontes, J.; Nieves-Mendoza, D.; Maldonado-Bandala, E.; Chacón-Nava, J.; Almeraya-Calderón, F. Electrochemical Noise Measurements of Advanced High-Strength Steels in Different Solutions. Metals 2020, 10, 1232. [Google Scholar] [CrossRef]
  8. Al-Mazeedi, H.A.A.; Cottis, R.A. A Practical Evaluation of Electrochemical Noise Parameters as Indicators of Corrosion Type. Electrochim. Acta 2004, 49, 2787–2793. [Google Scholar] [CrossRef]
  9. Cottis, R.A. The Significance of Electrochemical Noise Measurements on Asymmetric Electrodes. Electrochim. Acta 2007, 52, 7585–7589. [Google Scholar] [CrossRef]
  10. Bautista, A.; Bertocci, U.; Huet, F. Noise Resistance Applied to Corrosion Measurements: V. Influence of Electrode Asymmetry. J. Electrochem. Soc. 2001, 148, B412–B418. [Google Scholar] [CrossRef]
  11. Wu, P.Q.; Celis, J.P. Electrochemical Noise Measurements on Stainless Steel during Corrosion-Wear in Sliding Contacts. Wear 2004, 256, 480–490. [Google Scholar] [CrossRef]
  12. Kim, J.J.; Cho, S.J. Detection of Stress Corrosion Cracking of a Martensitic Stainless Steel by Electrochemical Noise Analysis. J. Mater Sci. Lett. 2003, 22, 865–867. [Google Scholar] [CrossRef]
  13. Kovač, J.; Leban, M.; Legat, A. Detection of SCC on Prestressing Steel Wire by the Simultaneous Use of Electrochemical Noise and Acoustic Emission Measurements. Electrochim. Acta 2007, 52, 7607–7616. [Google Scholar] [CrossRef]
  14. Ritter, S.; Horner, D.A.; Bosch, R.W. Corrosion Monitoring Techniques for Detection of Crack Initiation under Simulated Light Water Reactor Conditions. Corros. Eng. Sci. Technol. 2012, 47, 251–264. [Google Scholar] [CrossRef]
  15. Carpintero-Moreno, E.J.; Uruchurtu-Chavarin, J.; Rosales, I.; Campillo, B.; Leduc-Lezama, L. Effect of Heat Treatment on the Stress Corrosion Cracking Susceptibility of a Dual-Phase Steel. Corrosion 2013, 69, 843–850. [Google Scholar] [CrossRef]
  16. Engler, T.; Andersohn, G.; Oechsner, M.; de Araújo, F.D.; Kaufmann, H.; Melz, T. Bewertung Der Anfälligkeit von Aluminiumlegierungen Gegenüber Schwingungsrisskorrosion. Materwiss Werksttech 2018, 49, 264–272. [Google Scholar] [CrossRef]
  17. Watanabe, Y.; Kondo, T. Current and Potential Fluctuation Characteristics in Intergranular Stress Corrosion Cracking Processes of Stainless Steels. Corrosion 2000, 56, 1250–1255. [Google Scholar] [CrossRef]
  18. Gomez-Duran, M.; Macdonald, D.D. Stress Corrosion Cracking of Sensitized Type 304 Stainless Steel in Thiosulfate Solution: I. Fate of the Coupling Current. Corros. Sci. 2003, 45, 1455–1471. [Google Scholar] [CrossRef]
  19. Jiao, Y.; Zhang, D.; Yu, J.; Lv, Y.; Zhang, X.; Dong, Z. Early Identification of Stress Corrosion Cracking of P110 Low Alloy Steel in Downhole Fluid by Electrochemical Noise Measurement. Corros. Eng. Sci. Technol. 2021, 56, 230–243. [Google Scholar] [CrossRef]
  20. Shahidi, M.; Jafari, A.H.; Hosseini, S.M.A. Comparison of Symmetrical and Asymmetrical Cells by Statistical and Wavelet Analysis of Electrochemical Noise Data. Corrosion 2012, 68, 1003–1014. [Google Scholar] [CrossRef]
  21. Arganis-Juarez, C.R.; Malo, J.M.; Uruchurtu, J. Electrochemical Noise Measurements of Stainless Steel in High Temperature Water. Nucl. Eng. Des. 2007, 237, 2283–2291. [Google Scholar] [CrossRef]
  22. Du, G.; Li, J.; Wang, W.K.; Jiang, C.; Song, S.Z. Detection and Characterization of Stress-Corrosion Cracking on 304 Stainless Steel by Electrochemical Noise and Acoustic Emission Techniques. Corros. Sci. 2011, 53, 2918–2926. [Google Scholar] [CrossRef]
  23. Toppo, A.; Pujar, M.G.; Mallika, C.; Kamachi Mudali, U.; Dayal, R.K. Effect of Nitrogen on Stress Corrosion Behavior of Austenitic Stainless Steels Using Electrochemical Noise Technique. J. Mater. Eng. Perform. 2015, 24, 1140–1149. [Google Scholar] [CrossRef]
  24. Zhao, R.; Xia, D.H.; Song, S.Z.; Hu, W. Detection of SCC on 304 Stainless Steel in Neutral Thiosulfate Solutions Using Electrochemical Noise Based on Chaos Theory. Anti-Corros. Methods Mater. 2017, 64, 241–251. [Google Scholar] [CrossRef]
  25. Mohajernia, S.; Pour-Ali, S.; Hejazi, S.; Saremi, M.; Kiani-Rashid, A.R. Hydroxyapatite Coating Containing Multi-Walled Carbon Nanotubes on AZ31 Magnesium: Mechanical-Electrochemical Degradation in a Physiological Environment. Ceram. Int. 2018, 44, 8297–8305. [Google Scholar] [CrossRef]
  26. Liu, Y.; Feng, J.; Tan, S.; Cheng, Y.; Hu, J. Investigation of Inhibition of Stress Corrosion Cracking of Welded Ti-6Al-4V Alloy Using Electrochemical Noise. Int. J. Electrochem. Sci. 2020, 15, 9204–9222. [Google Scholar] [CrossRef]
  27. Chen, J.F.; Bogaerts, W.F. Electrochemical Emission Spectroscopy for Monitoring Uniform and Localized Corrosion. Corrosion 1996, 52, 753–759. [Google Scholar] [CrossRef]
  28. Aballe, A.; Bautista, A.; Bertocci, U.; Huet, F. Measurement of the Noise Resistance for Corrosion Applications. Corrosion 2001, 57, 35–42. [Google Scholar] [CrossRef]
  29. Hu, Q.; Zhang, T.; Chen, S.; Hu, K.; Yin, Q.; Wang, F. An Instantaneous Corrosion Monitoring Technique Based on Combining Modified Electrochemical Noise and Artificial Neural Network for Determination of Corrosion Type and 2014 Aluminium Alloy Corrosion Rate in NaCl and Ce(NO3)3 Solutions. Int. J. Electrochem. Sci. 2022, 17, 220213. [Google Scholar] [CrossRef]
  30. NACE TM0198. Slow Strain Rate Test Method for Screening Corrosion-Resistant Alloys for Stress Corrosion Cracking in Sour Oilfield Service; NACE International: Houston, TX, USA, 2004. [Google Scholar]
  31. Carmona-Hernandez, A.; Orozco-Cruz, R.; Mejía-Sanchez, E.; Espinoza-Vazquez, A.; Contreras-Cuevas, A.; Galvan-Martinez, R. Study of SCC of X70 Steel Immersed in Simulated Soil Solution at Different PH by EIS. Materials 2021, 14, 7445. [Google Scholar] [CrossRef]
  32. Mansfeld, F.; Sun, Z.; Hsu, C.H.; Nagiub, A. Concerning Trend Removal in Electrochemical Noise Measurements. Corros. Sci. 2001, 43, 341–352. [Google Scholar] [CrossRef]
  33. Ritter, S.; Huet, F.; Cottis, R.A. Guideline for an Assessment of Electrochemical Noise Measurement Devices. Mater. Corros. 2012, 63, 297–302. [Google Scholar] [CrossRef]
  34. Misiti, M.; Misiti, Y.; Oppenheim, G.; Poggi, J.M. Wavelet Toolbox User’s Guide R2015b. MATLAB 2014. Available online: http://courses.washington.edu/me333afe/Wavelet_Toolbox_Misiti_Ch1.pdf (accessed on 5 July 2022).
  35. Cheng, Y.F.; Luo, J.L.; Wilmott, M. Spectral Analysis of Electrochemical Noise with Different Transient Shapes. Electrochim. Acta 2000, 45, 1763–1771. [Google Scholar] [CrossRef]
  36. Jiang, X.; Nešić, S.; Huet, F.; Kinsella, B.; Brown, B.; Young, D. Selection of Electrode Area for Electrochemical Noise Measurements to Monitor Localized CO2 Corrosion. J. Electrochem. Soc. 2012, 159, C283–C288. [Google Scholar] [CrossRef]
  37. Homborg, A.M.; Tinga, T.; van Westing, E.P.M.; Zhang, X.; Ferrari, G.M.; de Wit, J.H.W.; Mol, J.M.C. A Critical Appraisal of the Interpretation of Electrochemical Noise for Corrosion Studies. Corrosion 2014, 70, 971–987. [Google Scholar] [CrossRef]
  38. Cui, Z.; Liu, Z.; Wang, L.; Li, X.; Du, C.; Wang, X. Effect of Plastic Deformation on the Electrochemical and Stress Corrosion Cracking Behavior of X70 Steel in Near-Neutral PH Environment. Mater. Sci. Eng. A 2016, 677, 259–273. [Google Scholar] [CrossRef]
  39. Wei, Y.J.; Xia, D.H.; Song, S.Z. Detection of SCC of 304 NG Stainless Steel in an Acidic NaCl Solution Using Electrochemical Noise Based on Chaos and Wavelet Analysis. Russ. J. Electrochem. 2016, 52, 560–575. [Google Scholar] [CrossRef]
  40. Li, J.; Du, C.W.; Liu, Z.Y.; Li, X.G.; Liu, M. Effect of Microstructure on the Corrosion Resistance of 2205 Duplex Stainless Steel. Part 2: Electrochemical Noise Analysis of Corrosion Behaviors of Different Microstructures Based on Wavelet Transform. Constr. Build. Mater. 2018, 189, 1294–1302. [Google Scholar] [CrossRef]
  41. Astarita, A.; Curioni, M.; Squillace, A.; Zhou, X.; Bellucci, F.; Thompson, G.E.; Beamish, K.A. Corrosion Behaviour of Stainless Steel-Titanium Alloy Linear Friction Welded Joints: Galvanic Coupling. Mater. Corros. 2015, 66, 111–117. [Google Scholar] [CrossRef]
  42. Bouazaze, H.; Cattarin, S.; Huet, F.; Musiani, M.; Nogueira, R.P. Electrochemical Noise Study of the Effect of Electrode Surface Wetting on the Evolution of Electrolytic Hydrogen Bubbles. J. Electroanal. Chem. 2006, 597, 60–68. [Google Scholar] [CrossRef]
  43. Ramamurthy, S.; Atrens, A. Stress Corrosion Cracking of High-Strength Steels. Corros. Rev. 2013, 31, 1–31. [Google Scholar] [CrossRef]
  44. Wang, X.; Wang, J.; Fu, C.; Gao, Y. Determination of Corrosion Type by Wavelet-Based Fractal Dimension from Electrochemical Noise. Int. J. Electrochem. Sci. 2013, 8, 7211–7222. [Google Scholar]
  45. Gabrielli, C.; Huet, F.; Nogueira, R.P. Electrochemical Noise Measurements of Coalescence and Gas-Oscillator Phenomena on Gas-Evolving Electrodes. J. Electrochem. Soc. 2002, 149, E71. [Google Scholar] [CrossRef]
  46. Eden Electrochemical Noise-The First Two Octaves-Part I. In Proceedings of the Corrosion 98; NACE: Houston, TX, USA, 1998.
  47. Ortiz Alonso, C.; Lucio-Garcia, M.; Hermoso-Diaz, I.; Chacon-Nava, J.; Martinez-Villafañe, A.; Gonzalez-Rodriguez, J. Detection of Sulfide Stress Cracking in a Supermartensitic Stainless Steel. Electrochemical Noise. Int. J. Electrochem. Sci. 2014, 9, 6717–6733. [Google Scholar]
  48. Suresh, G.; Mudali, U.K. Electrochemical Noise Analysis of Pitting Corrosion of Type 304l Stainless Steel. Corrosion 2014, 70, 283–293. [Google Scholar] [CrossRef]
  49. Nagiub, A.M. Comparative Electrochemical Noise Study of the Corrosion of Different Alloys Exposed to Chloride Media. Engineering 2014, 6, 1007–1016. [Google Scholar] [CrossRef]
  50. Reid, S.A.; Eden, D.A. Assessment of Corrosion. US9264824B1, 24 July 2001. [Google Scholar]
  51. Liu, Z.Y.; Li, X.G.; Cheng, Y.F. In-Situ Characterization of the Electrochemistry of Grain and Grain Boundary of an X70 Steel in a near-Neutral PH Solution. Electrochem. Commun. 2010, 12, 936–938. [Google Scholar] [CrossRef]
  52. Mansfeld, F.; Sun, Z. Localization Index Localization Index Obtained from Electrochemical Noise Analysis. Corrosion 1999, 55, 915–918. [Google Scholar] [CrossRef]
  53. Jez, M.; Mitoraj, M.; Godlewska, E.; Jakubowska, M.; Bas, B. Evaluation of Corrosion Behaviour of Selected Metallic Samples by Electrochemical Noise Measurements. J. Solid State Chem. 2014, 18, 1635–1646. [Google Scholar] [CrossRef]
  54. Lee, C.; Mansfeld, F. Analysis of Electrochemical Noise Data for a Passive System in the Frequency Domain. Corros. Sci. 1998, 39, 959–962. [Google Scholar] [CrossRef]
  55. Xia, D.-H.; Song, S.; Behnamian, Y.; Hu, W.; Cheng, Y.F.; Luo, J.-L.; Huet, F. Review—Electrochemical Noise Applied in Corrosion Science: Theoretical and Mathematical Models towards Quantitative Analysis. J. Electrochem. Soc. 2020, 167, 081507. [Google Scholar] [CrossRef]
  56. Smith, M.T.; Macdonald, D.D. Wavelet Analysis of Electrochemical Noise Data. Corrosion 2009, 65, 438–448. [Google Scholar] [CrossRef]
  57. Li, X.; Song, J.; Gan, K.; Xia, D.H.; Gao, Z.; Liu, C.; Liu, Y. Identifying Sulfide Stress Cracking Stages on a HSLA Pipeline Steel in H2S Environment by Electrochemical Noise. J. Electroanal. Chem. 2020, 876, 114480. [Google Scholar] [CrossRef]
  58. Xie, L.; Zhou, W.; Zou, S. Pitting Behavior of Ti-15-3 Titanium Alloy with Different Surface in Salt Spray Studied Using Electrochemical Noise. J. Mater. Res. Technol 2021, 14, 2865–2883. [Google Scholar] [CrossRef]
  59. Anita, T.; Pujar, M.G.; Shaikh, H.; Dayal, R.K.; Khatak, H.S. Assessment of Stress Corrosion Crack Initiation and Propagation in AISI Type 316 Stainless Steel by Electrochemical Noise Technique. Corros. Sci. 2006, 48, 2689–2710. [Google Scholar] [CrossRef]
  60. Calabrese, L.; Galeano, M.; Proverbio, E. Identifying Corrosion Forms on Synthetic Electrochemical Noise Signals by the Hilbert–Huang Transform Method. Corros. Eng. Sci. Technol. 2018, 53, 492–501. [Google Scholar] [CrossRef]
Figure 1. Microstructure of the API X70 steel obtained by optical microscopy. Where P is perlite and F is ferrite.
Metals 12 01545 g001
Figure 2. (a) Experimental setup of EN and EES measurements during SSRT test, (b) dimensions of SSRT specimen.
Metals 12 01545 g002
Figure 3. Time records of potential and current of X70 steel in acidic NS4 solution after 7 h of the exposure time obtained from (a) EN measurements, (a1) enlarged cathodic transient, (b) EES measurements.
Metals 12 01545 g003
Figure 4. SSRT curves and time records of potential and current obtained from EN and EES arrangement of X70 steel in acidic NS4 solution during the SSRT test, (a) potential records, (b) current records, and (b1) enlarged current record obtained from EES measurements. The point where the EN was measured are T0 at the beginning of the test, EZ being the elastic zone, YS the yield strength, and AN after the necking.
Metals 12 01545 g004
Figure 5. Potential and current vs. time of X70 steel in the acidic NS4 solution by the EN arrangement at different points during the SSRT test: (a) At the beginning of the test, (b) elastic zone, (b1) enlarged transients, (c) yield strength, (c1) enlarged transients, and (d) after the necking zone.
Metals 12 01545 g005
Figure 6. Potential and current time signals of X70 steel in the acidic NS4 solution recorded using the EES arrangement at different points during the SSRT test: (a) At the beginning of the test, (b) elastic zone (c) yield strength, (c1) enlarged transients, and (d) after the necking zone.
Metals 12 01545 g006aMetals 12 01545 g006b
Figure 7. Skewness (S) and kurtosis (k) of potential and current signals with EN and EES measurement of X70 steel in NS4 solution at different pH during SSRT test: (a) S potential, (b) k potential, (c) S current, and (d) k current.
Metals 12 01545 g007
Figure 8. LI values during the SSRT obtained with EN and EES measurements of X70 steel in the acidic NS4 solutions.
Metals 12 01545 g008
Figure 9. SEM images of the side surface of tensile sample after the SSRT test. (a) showing some pits, (b,c) showing a crack with corrosion products, (d) some branched cracks, (e,f) transgranular cracks.
Metals 12 01545 g009
Figure 10. Variation of the Rn, Zn, and 1Z1values during the SSRT obtained with EN and EES measurements of X70 steel in the acidic NS4 solution.
Metals 12 01545 g010
Figure 11. Variation of the roll off slope, (a) βE, and (b) βI during the SSRT obtained from the EN and EES measurements of X70 steel in the acidic NS4 solution.
Metals 12 01545 g011
Figure 12. Fraction wavelet energy distribution during the SSRT test derived from (a) potential EN signals (b) potential EES signals, (c) current EN signals, and (d) current EES signals.
Metals 12 01545 g012
Table 1. Skewness and kurtosis values for corrosion processes.
Corrosion TypePotentialCurrent
SkewnessKurtosisSkewnessKurtosis
Uniform<±1<3<±1<3
Pitting<−2>>3>±2>>3
Transgranular (SCC)420−420
Intergranular (SCC #1)−6.618 to 1141.5 to 3.26.4 to 15.6
Intergranular (SCC #2)−2 to −65 to 453 to 610 to 60
Publisher’s Note: MDPI stays neutral with regard to jurisdictional claims in published maps and institutional affiliations.

