Article

High-Strain Rate Spall Strength Measurement for CoCrFeMnNi High-Entropy Alloy

1
School of Aeronautics and Astronautics, Purdue University, West Lafayette, IN 47907, USA
2
Center for Integrated Nanotechnologies, Sandia National Laboratories, Albuquerque, NM 87185, USA
3
Metallurgy and Materials Joining Department, Sandia National Laboratories, Albuquerque, NM 87185, USA
4
Coatings and Additive Manufacturing Department, Sandia National Laboratories, Albuquerque, NM 87185, USA
*
Author to whom correspondence should be addressed.
Metals 2022, 12(9), 1482; https://doi.org/10.3390/met12091482
Submission received: 8 August 2022 / Revised: 29 August 2022 / Accepted: 2 September 2022 / Published: 7 September 2022
(This article belongs to the Special Issue Dynamic Response of Metals under Extreme Conditions)

Abstract

:
In this study, we experimentally investigate the high stain rate and spall behavior of Cantor high-entropy alloy (HEA), CoCrFeMnNi. First, the Hugoniot equations of state (EOS) for the samples are determined using laser-driven CoCrFeMnNi flyers launched into known Lithium Fluoride (LiF) windows. Photon Doppler Velocimetry (PDV) recordings of the velocity profiles find the EOS coefficients using an impedance mismatch technique. Following this set of measurements, laser-driven aluminum flyer plates are accelerated to velocities of 0.5–1.0 km/s using a high-energy pulse laser. Upon impact with CoCrFeMnNi samples, the shock response is found through PDV measurements of the free surface velocities. From this second set of measurements, the spall strength of the alloy is found for pressures up to 5 GPa and strain rates in excess of 106 s−1. Further analysis of the failure mechanisms behind the spallation is conducted using fractography revealing the occurrence of ductile fracture at voids presumed to be caused by chromium oxide deposits created during the manufacturing process.

1. Introduction

High-entropy alloys (HEAs), particularly those composed of at least four elemental constituents with equimolar or near-equimolar components, have shown great promise for applications in aviation and aerospace fields owing to their high strength and thermal stability at high temperatures [1,2,3]. The so-called Cantor alloy, equiatomic CoCrFeMnNi, has been of particular interest. This specific quinary HEA possesses a combination of high strength and high ductility [4,5,6,7,8,9], as well as the ability to sustain high levels of fracture toughness at extremely low temperatures [7,8,9]. These properties make CoCrFeMnNi a strong candidate as a structural material for a range of applications for which high strength and fracture resiliency are key, particularly in aerospace and nuclear applications. However, continued research is needed to fully understand how these materials perform under dynamic-loading conditions. More specifically, the shock properties of HEAs at ultra-high strain rates are of significant interest to the fundamental shock physics community and to the broader scientific community.
Previous investigations into the spall strength and equations of state (EOS) of conventional structural materials involve the use of single-stage gas guns in combination with a variety of measurement methods such as a Doppler Pin System (DPS) [10] or Photo Doppler Velocimetry (PDV) [11] to record free surface velocities in order to derive spall strength and EOS. For instance, Jiang et al. [12] used a gas-gun system setup to investigate the dynamic response of CoCrFeMnNi alloys, including the Hugoniot elastic limit (HEL) and EOS coefficients. Gas-gun systems, however, are not always readily available to provide an abundant amount of high-throughput data across a broad range of impact velocities. As an alternative, recent research has been trending towards using high-energy single-pulse lasers to achieve high-velocity impacts in order to investigate spall strengths and failure mechanisms for various materials [13,14,15,16,17,18].
Lou et al. [19] and Swift et al. [20] developed a laser-launch system capable of determining EOS using Cu, Ga, and NiTi flyers impacting a known polymethyl methacrylate, PMMA, target with flyer impact velocities less than 200 m/s. Further studies demonstrated that combining several high-energy lasers is capable of extending the velocity range for impacts in these studies in excess of 10 km/s [21]. The extension of this system to high-energy single-pulse lasers used to investigate spall strength to determine materials’ EOS is a viable and efficient technique as it allows for a decreased timeline of the evaluation of a variety of emerging materials with respect to their responses under shock loading conditions.
In addition to the aforementioned experimental studies, previous research has also shown that the behavior of HEAs under high-strain rate loading conditions can be assessed through numerical simulations. Molecular dynamics (MD) simulations have been used to further analyze the spall strength and failure mechanisms [22,23]. These simulations have been used to numerically predict spall strengths of materials and their relations to strain rates as well as determine the failure mechanisms at the atomic scale. However, successful modeling of these physics has sometimes relied upon the experimental results for EOS [23]. Furthermore, experimental results serve as a useful determination in assessing the accuracy of these models. Thus, reliable experimental findings are required prior to the full implementation of numerical analyses.
In this article, we report the design and results of experiments conducted to obtain the equation of state (EOS) and spall strength of an additively manufactured CoCrFeMnNi HEA at high strain rate for the first time. Specifically, we conducted high-strain rate experiments (>106 s−1) that rely on high-speed impact loading to generate large dynamic hydrostatic stresses in a target material. A laser-induced projectile impact testing (LIPIT) setup allows for the acceleration of thin metal flyers at velocities in excess of ~1 km/s. PDV measurements record velocity profiles during the impacts in order to derive the key parameters to describe the dynamic behavior of the Cantor samples. Post-shock specimen recovery allows for simple analysis of void nucleation and fragmentation due to spalling of CoCrFeMnNi HEA. This study provides further insight into the microstructural features of the additively manufactured specimens that can act as failure mechanism sites within this material.

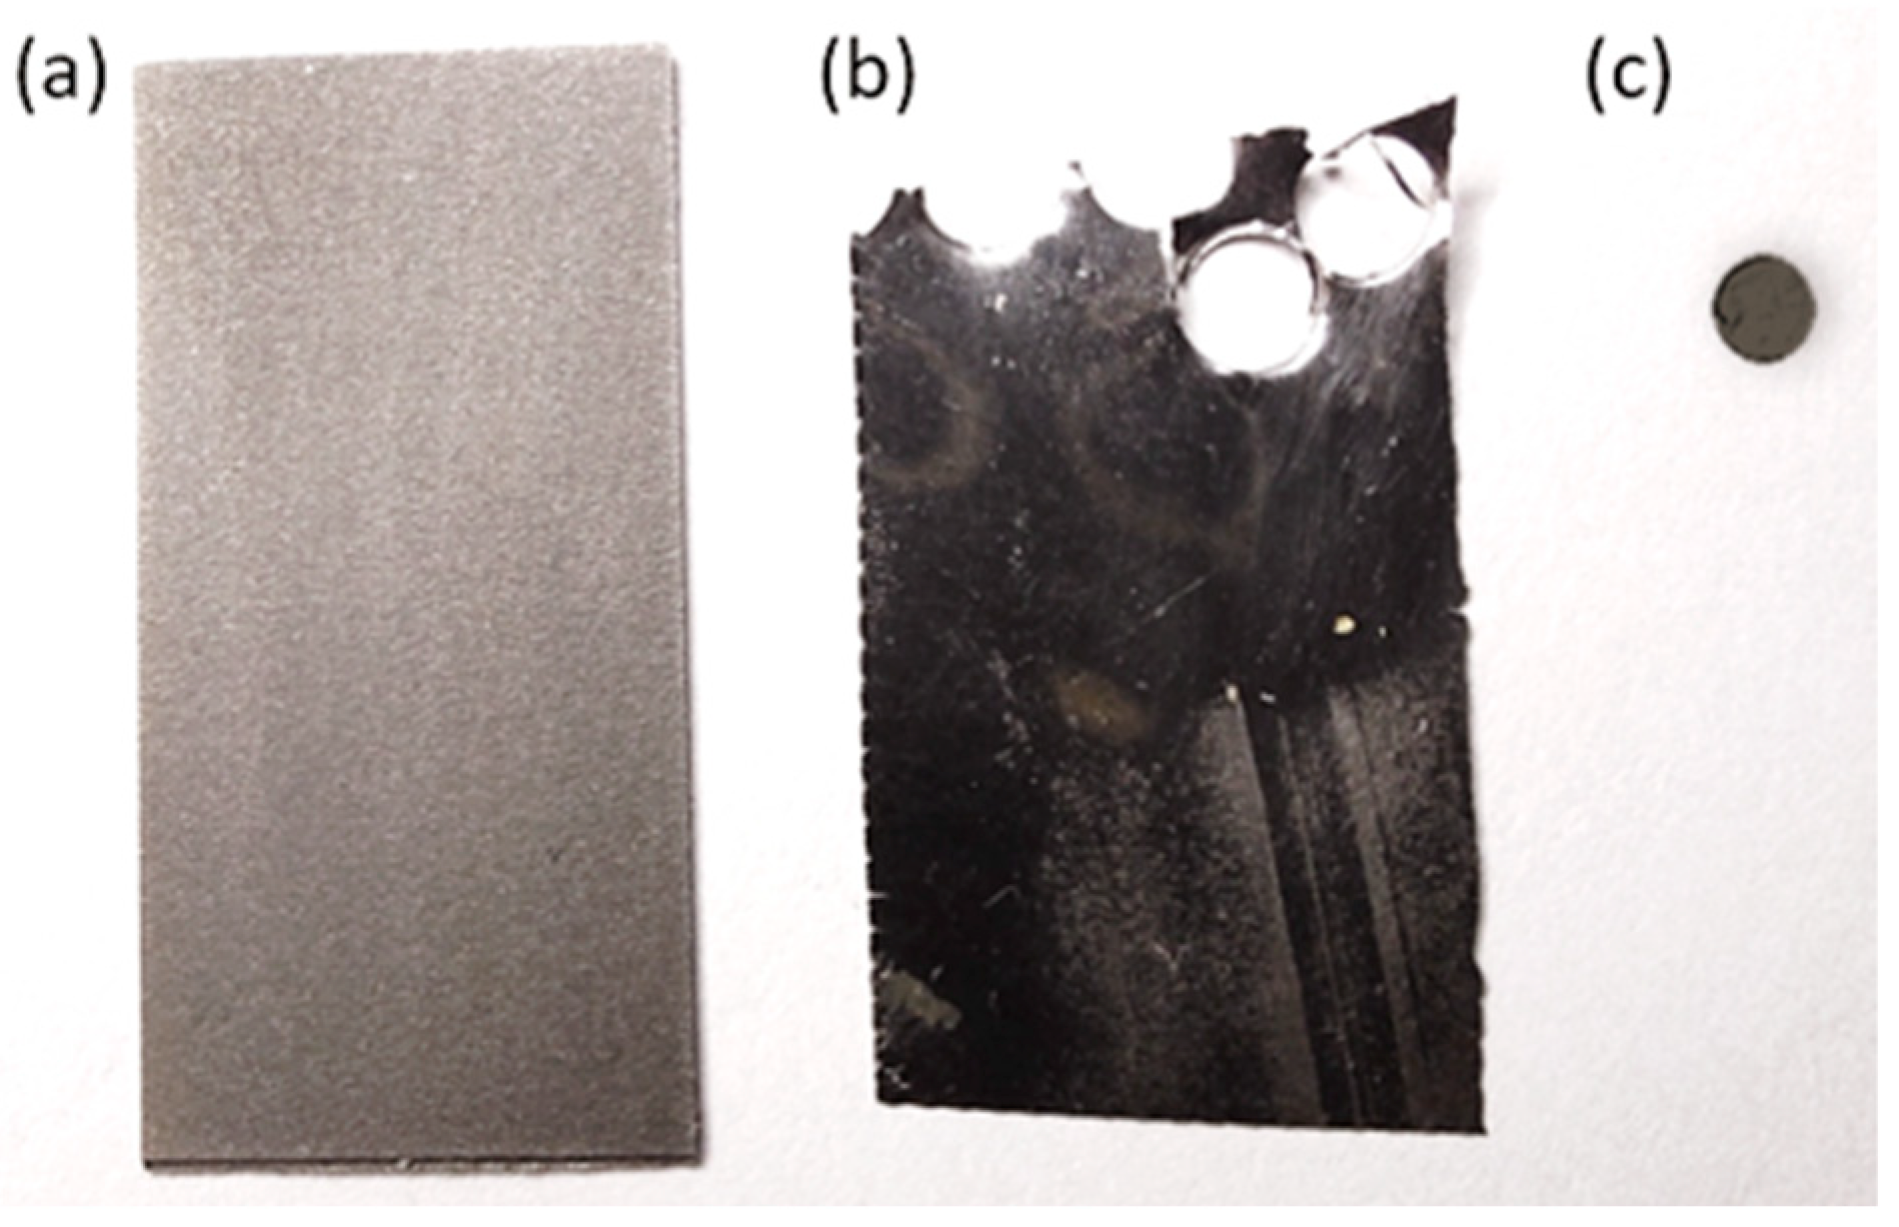
2. Materials and Methods

In this study, we investigated shock properties of an additively manufactured CoCrFeMnNi HEA sample using a laser-based flyer plates system with micron-scale disk impactors. The HEA samples were manufactured using a laser-based directed energy deposition (DED) technique, Laser Engineered Net Shaping (LENS) [24]. The samples provided for testing were rectangular with an original thickness of approximately 300 μm and are shown in Figure 1. In order to create the disk impactors required for testing, these samples were then polished using increasingly fine-grit sandpaper to reduce the specimen to the desired thickness while maintaining planarity along the surface in order to ensure consistent impact velocities and profiles. Additionally, the polishing process resulted in a mirrored finish along the surface, increasing the flyers’ reflectivity. This mirrored finish was intended to maximize the reliability of photon Doppler velocimetry (PDV) measurements. Finally, 1.5 mm diameter flyers were punched from these prepared specimens for testing. Punching of the disks was reserved for the final step so as to avoid creating irregularities of the both the surface and overall shape of the flyers.
The testing equipment utilized in these studies is a modified version of the micron-scale impact platform developed and used in previous studies [25,26]. The laser-based impact setup used is shown in Figure 2, where the flyer is a thin foil launched by intense laser pulses, accelerating up to ~1 km/s in less than 100 ns. The flyer launch assembly consists of CoCrFeMnNi HEA impactors of 10–25 μm thickness glued to glass substrates. A high-energy nanosecond pulsed laser delivered a spatially homogeneous convergent beam directed through the glass to the glass–epoxy–flyer interface. An Nd:YAG laser, Continuum laser, was used, that produces up to 0.75 J at 1.064 μm, with a nominal pulse duration of 8 ns. A uniform beam profile was generated using a 25 mm diameter diffractive optical element (HOLO/OR). After the diffractive optic, the beam was focused with an aspheric objective lens with a 60 mm focal length to produce an 800 μm homogenized focused spot concentric with the flyer disk.
The HEA flyer disk is accelerated inside a vacuum channel of 150 μm length and ultimately impacts a Lithium Fluoride (LiF) glass target with known shock properties [27]. The PDV system depicted in Figure 2 uses a single-mode fiber that was collimated to 1.5 mm diameter using a collimator and focused onto the target using an aspheric lens with a long working distance of 17.5 mm. The reflected signal from the flyer was probed through the LiF glass target and mixed with the original reference signal coming from a splitter to create interference. The mixed signal was detected through a 20 GHz photodiode detector and recorded on an oscilloscope. The interferogram produced during the impact was analyzed using a short-term Fourier transform to obtain the impact velocity of the flyer and particle velocity of the target at the flyer–target interface. Since the LiF glass window is a standard material with known EOS, the shock state of the impactor can be deduced via the impedance mismatch technique in Equation (1) [28], where US and UP are the shock and particle velocities found through Equations (2) and (3) respectively.
ρ U S ,   H E A U P , H E A + H E L H E A = ρ U S , L i F U P , L i F + H E L L i F ,
where
U S = c 0 + s U P
and
U P , H E A = V U P , L I F
This technique utilizes conservation of mass, energy, and momentum to derive relations between shock and particle velocity between the two mediums. PDV measurements record both the impact velocity, V, of the flyer and the particle velocity in the LiF target. These values allow for the Hugoniot pressure to develop in the LiF. Thus, the only remaining unknown in Equation (1) is US,HEA. This system of equations allows for the Hugoniot coefficient s and bulk sound speed c0 to be determined.
Using the same system, slight modifications to the setup were made to investigate the spall strength of the material. Spall strength can be used to provide further insights into the failure and deformation mechanisms of the HEA when the tensile load exceeds the fracture energy and voids nucleate in the material. To perform spall testing of HEA specimens, an aluminum 1100 foil disk was used as an impactor and an HEA foil was used as the target. Figure 3a shows the schematic of spall failure inside the HEA target. As shown in this figure, the intersection of reflected shock wave by the free surface of impactor and specimen leads to dynamic tensile stresses that ultimately result in failure. The PDV measurements of velocity along the free surface of the target are used to find the spall strength. We estimate the spall strength by determining the difference between the maximum particle velocity and the minimum of the spall pullback, as depicted by ∆v in the free surface velocity profile in Figure 3b. The momentum conservation condition in Equation (4) is then applied to estimate spall strength as a function of material properties and this pullback velocity [29], where cB is the bulk sound speed of the material. The strain rate induced by this impact is calculated according to Equations (4) and (5) [19], such that:
σ s p a l l = 1 2 ρ o c B Δ v
ε ˙ 1 c B d u P d t 1 2 c B Δ v Δ t
Post-shock specimen recovery reveals further details into the mechanisms present during spallation of the tested specimens. Post-impact optical microscopy image analysis of the HEA target specimen is utilized to evaluate whether there is void nucleation present in the material. In the asymmetric collision between the aluminum flyer and HEA target, there is a change of flyer speed before and after the collision. High magnification images of the HEA target after impact can be processed to locate the clusters of voids, which can be classified as clusters when linked and in close enough proximity. The density of the voids in the HEA as a function of the calculated shock pressure gives a second measurement for spall strength which can be used to validate the first. Furthermore, scanning electron microscope (SEM) imaging with energy dispersive spectroscopy (EDS) allows for the determination of the microstructural features of the specimens. These features can be linked to failures within the samples in order to ascertain the impacts of AM LENS processes on the dynamic behaviors of the CoCrFeMnNi samples.

3. Results and Discussion

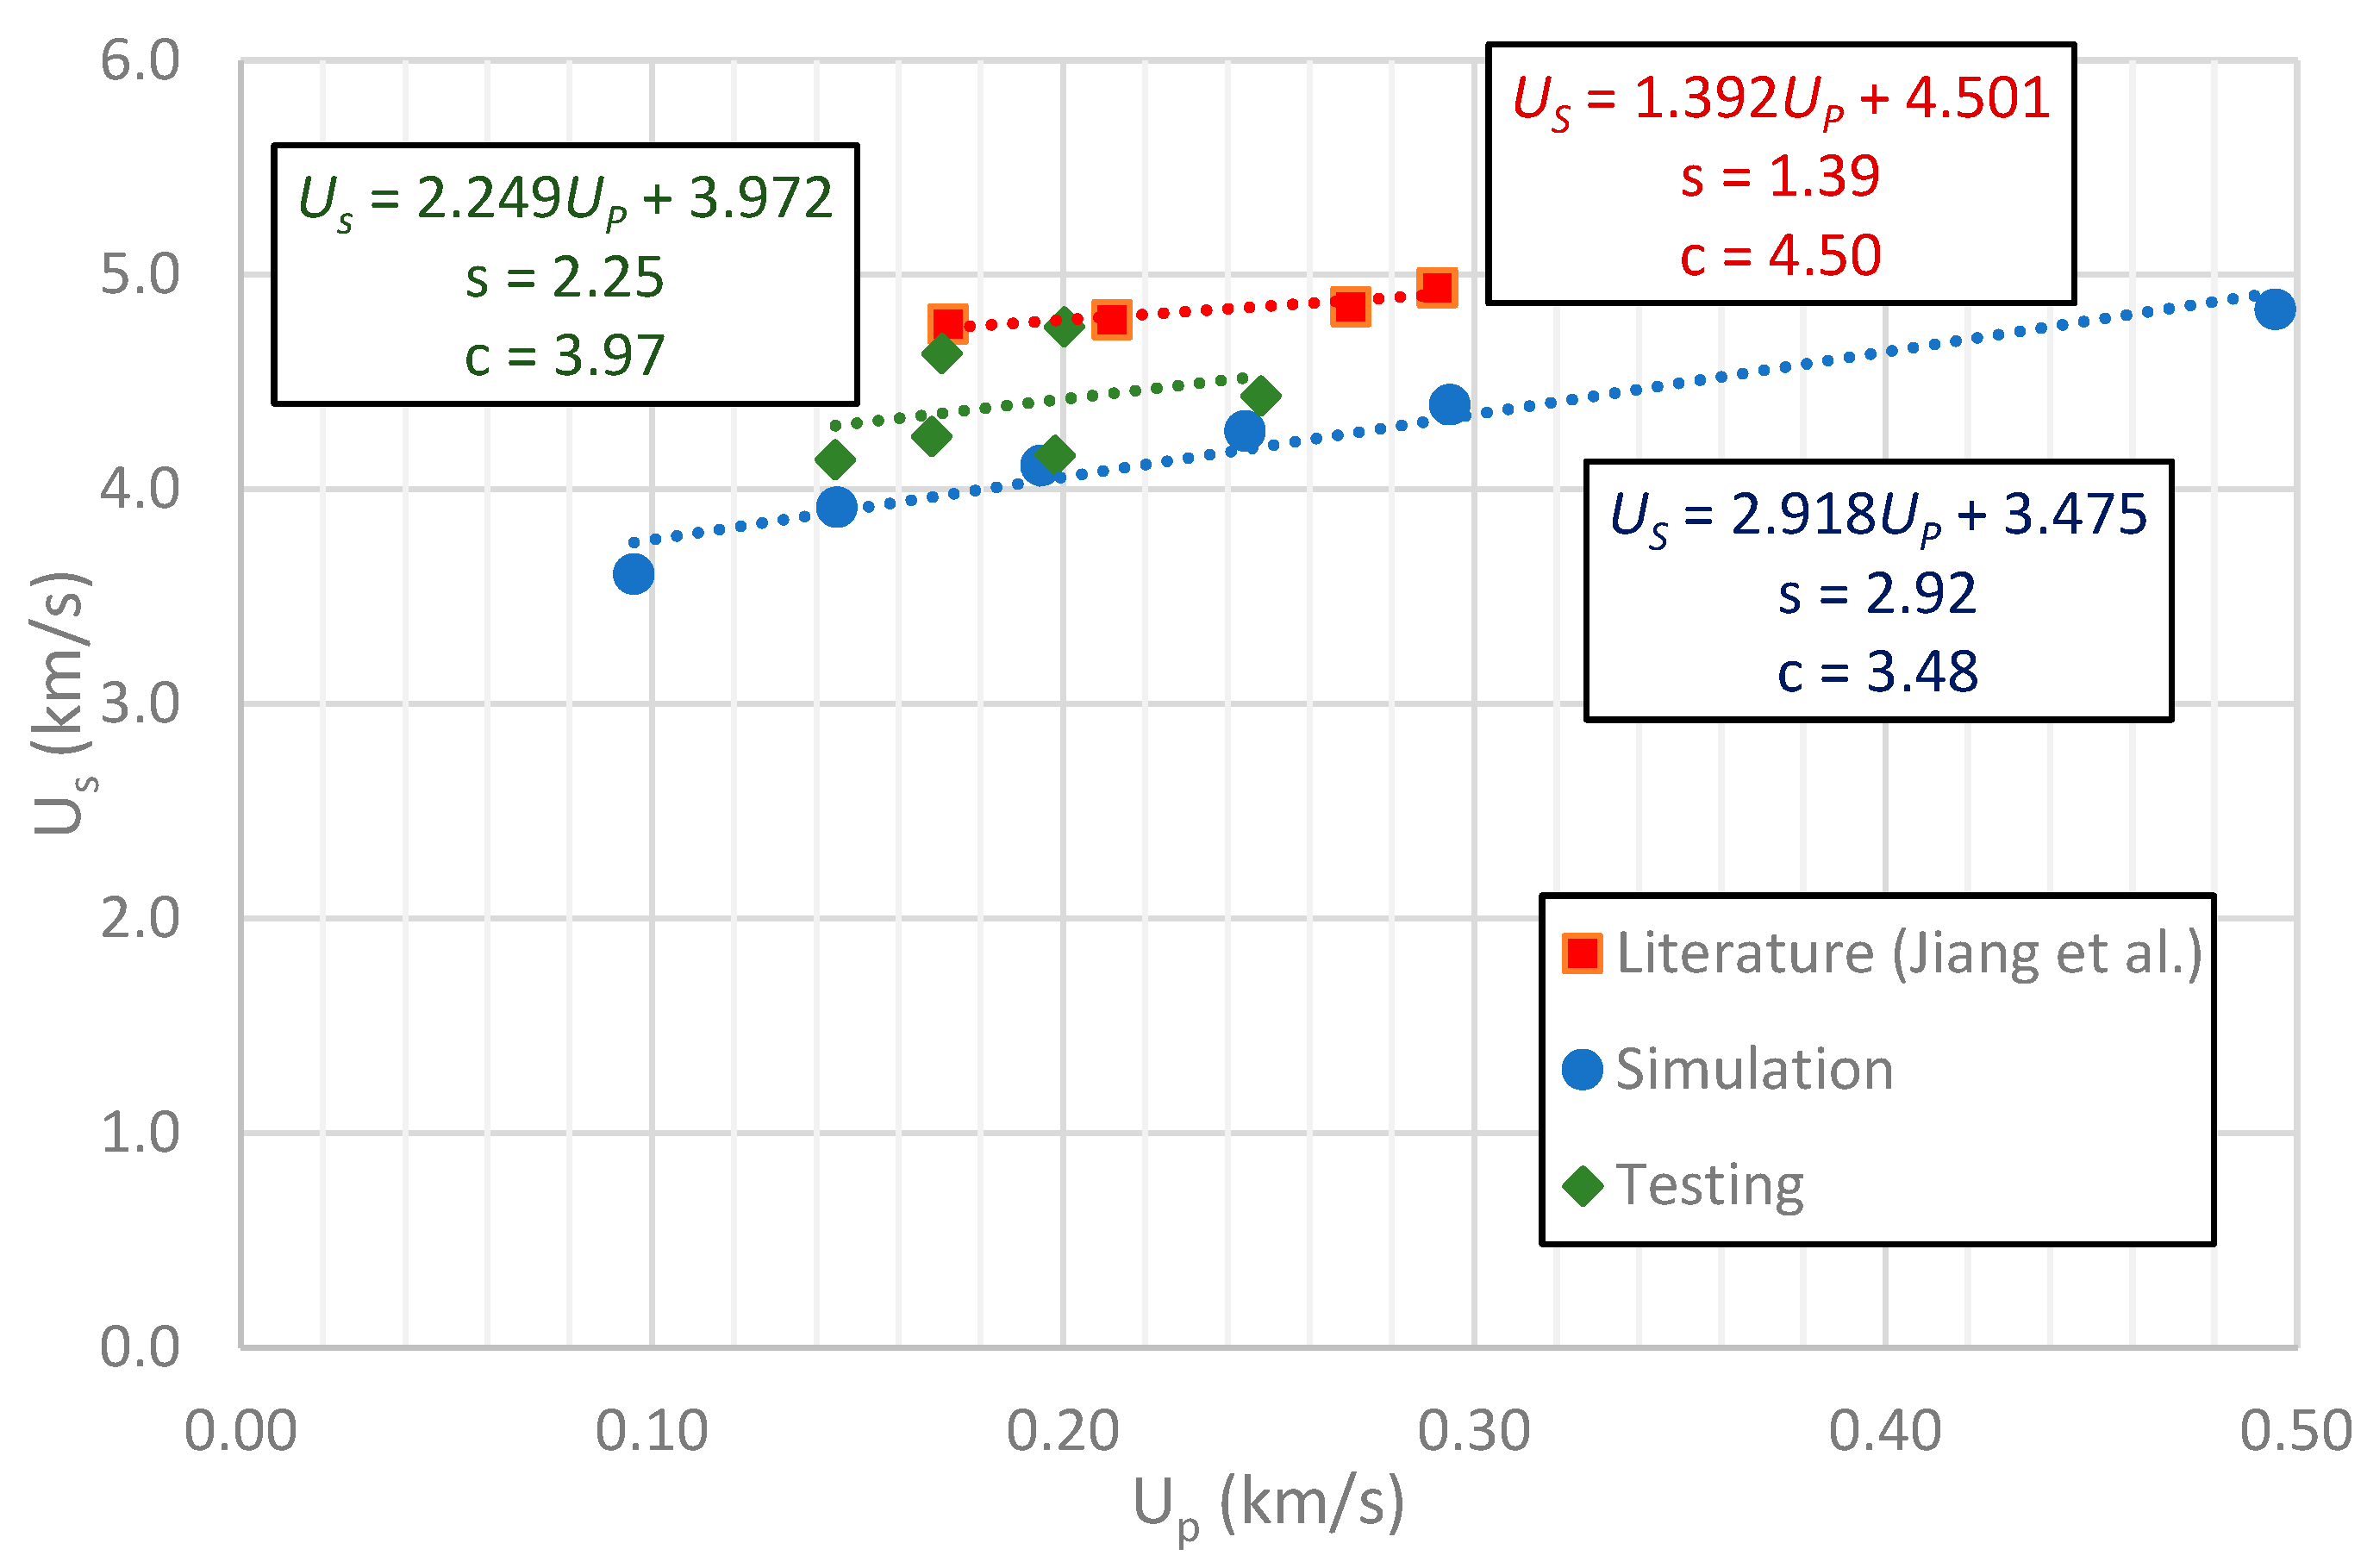
3.1. Equation of State
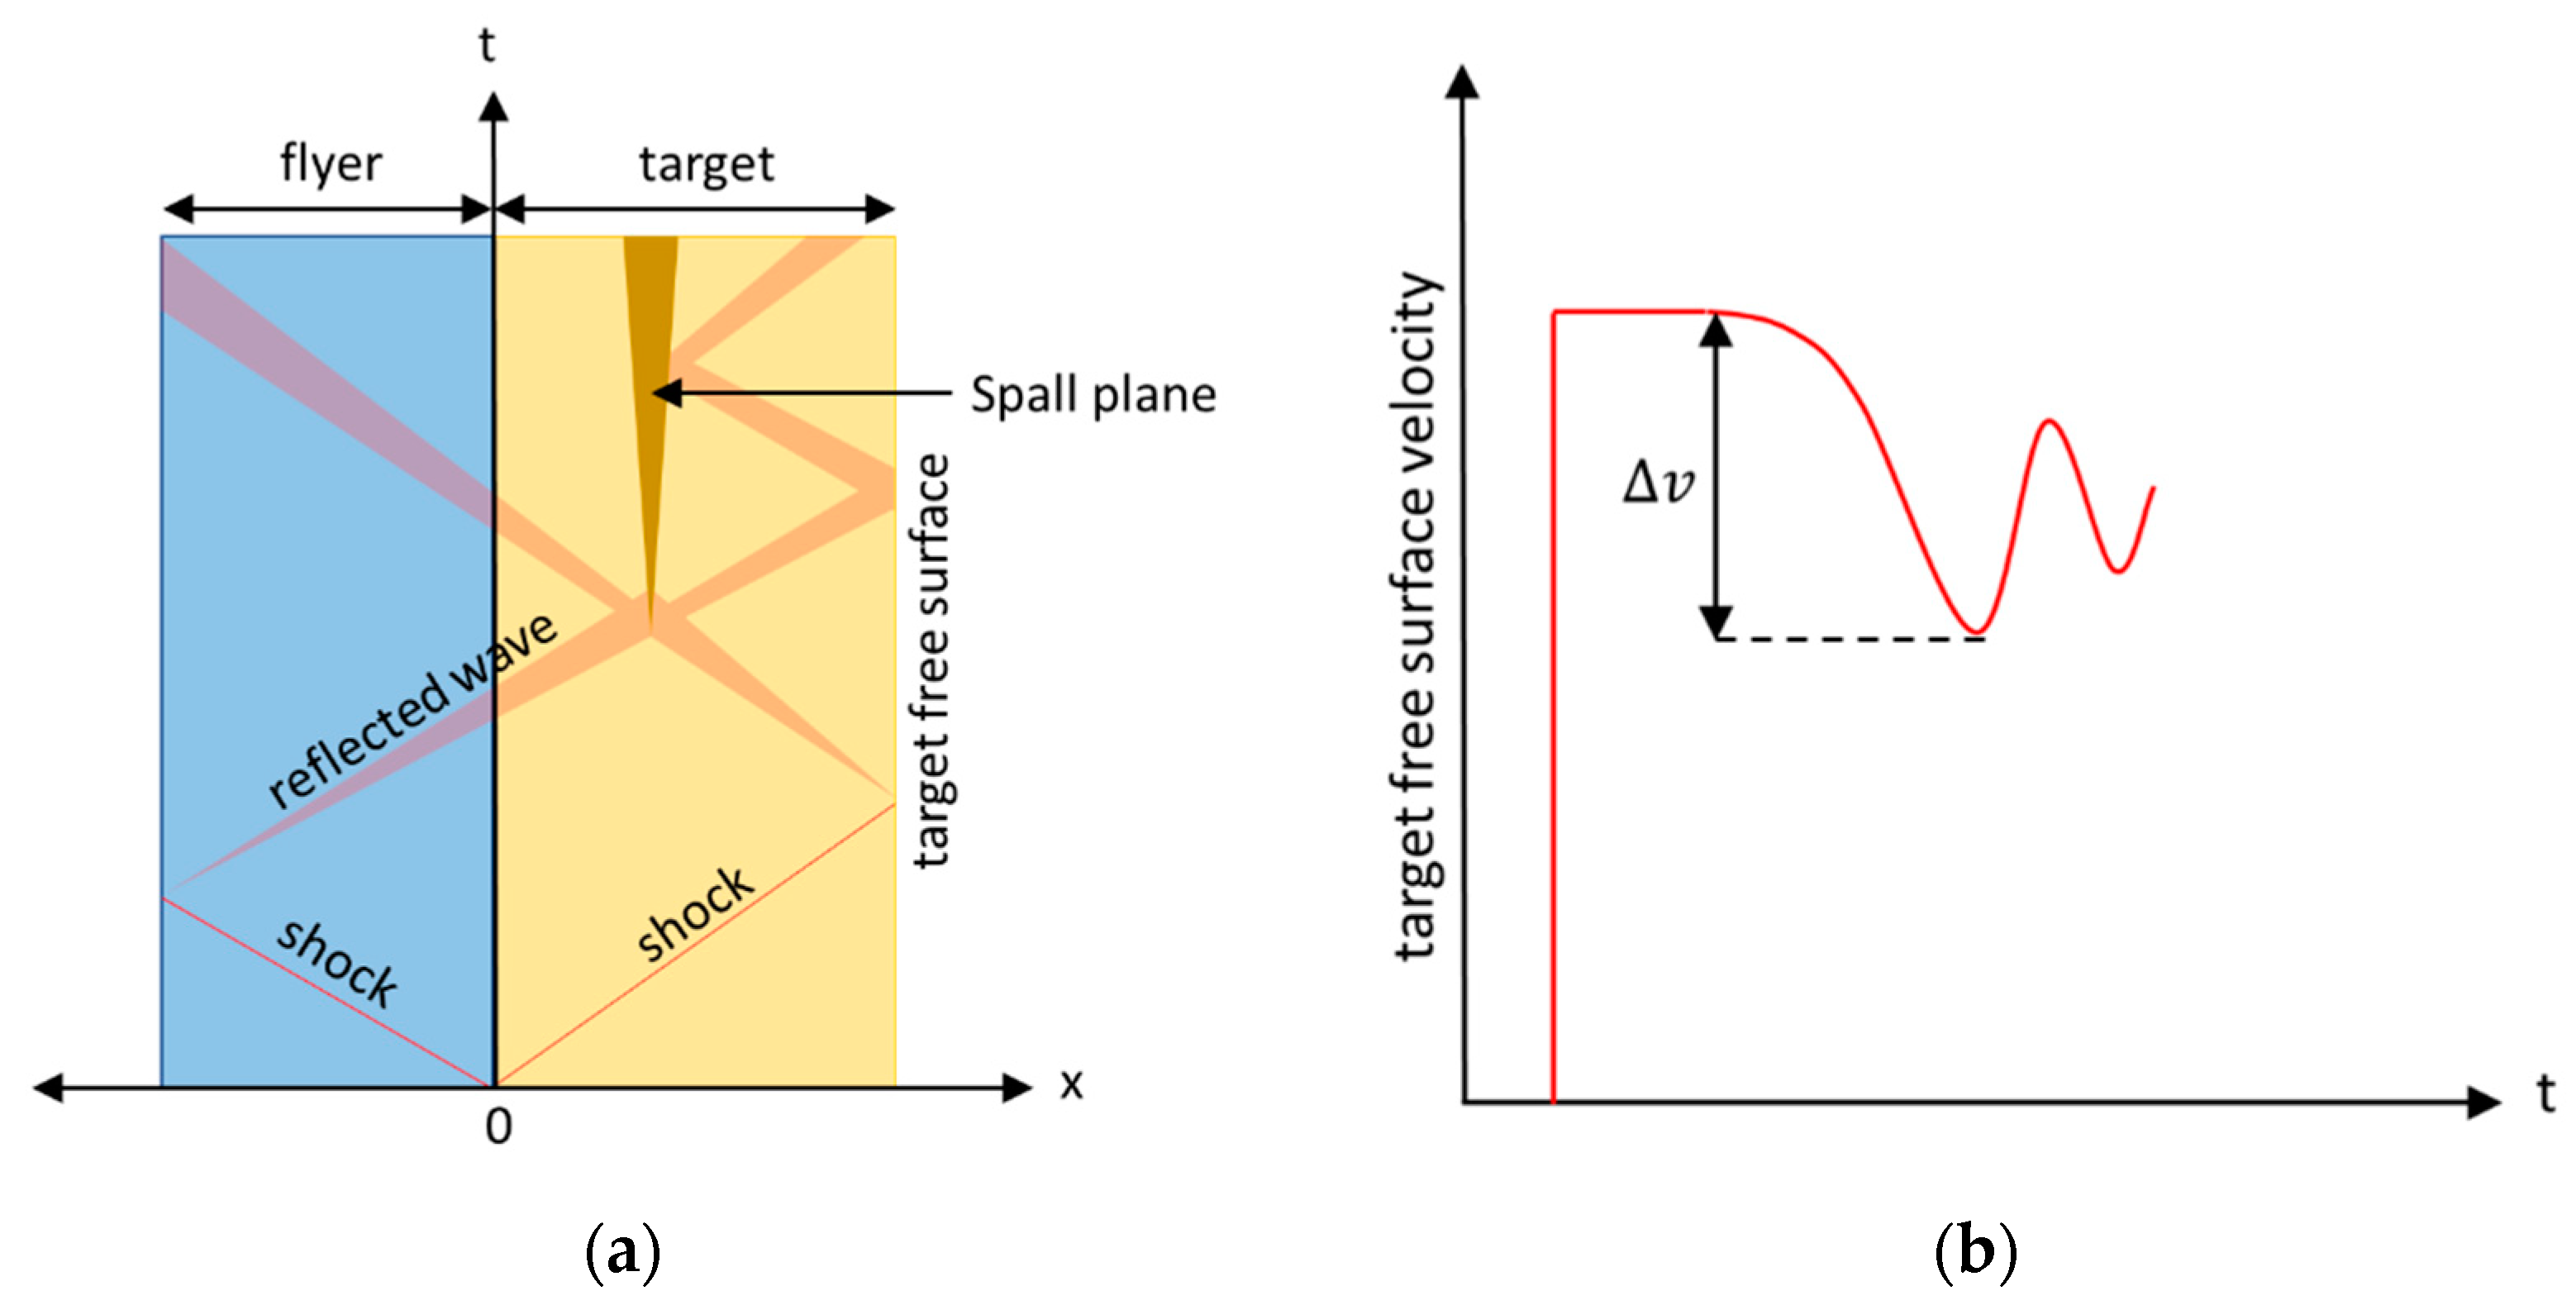
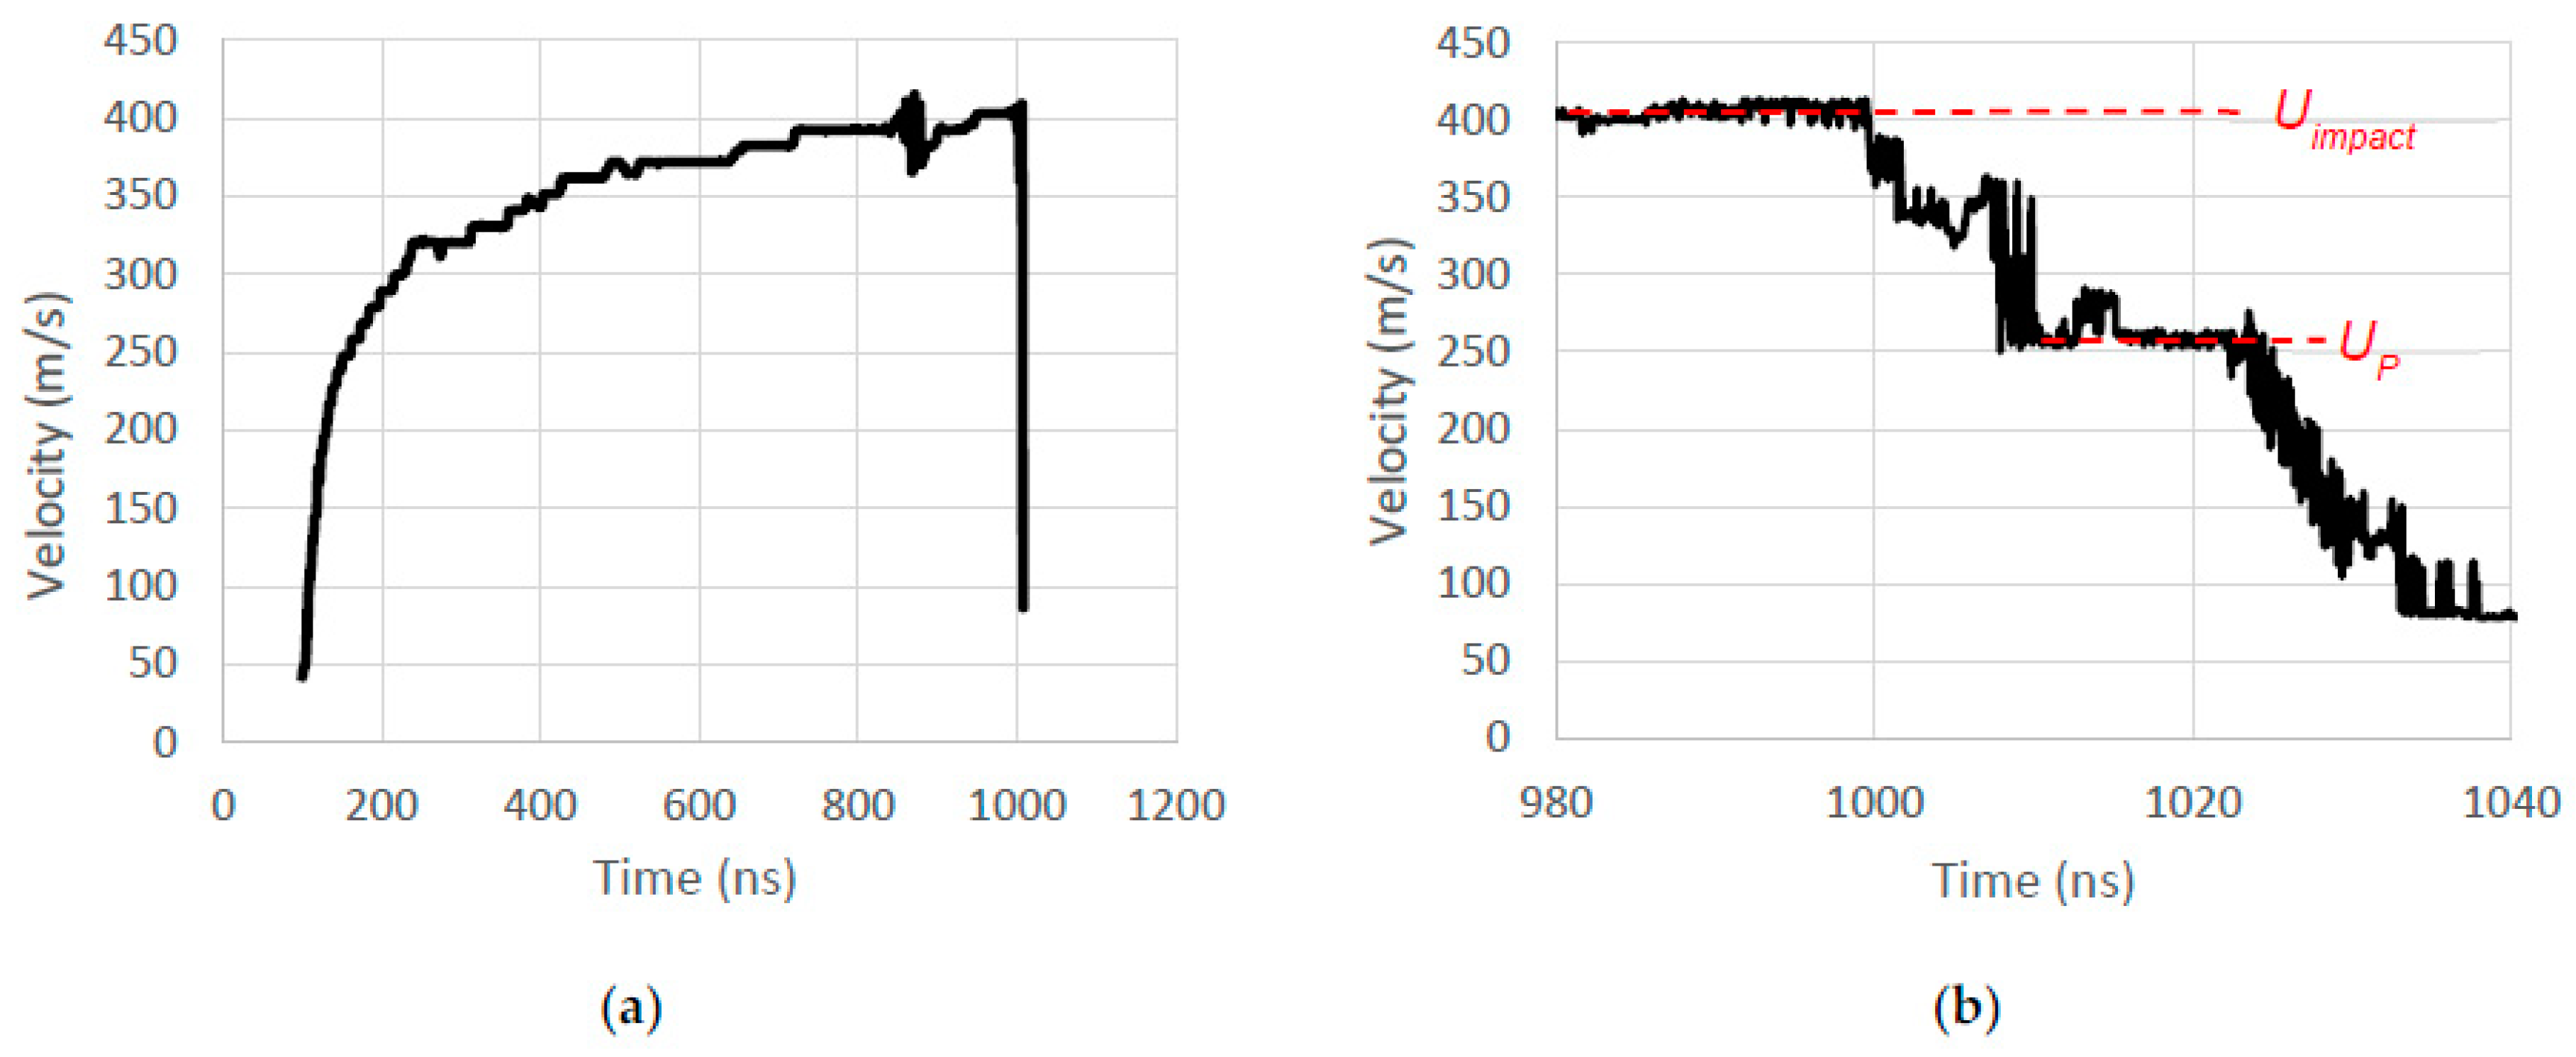
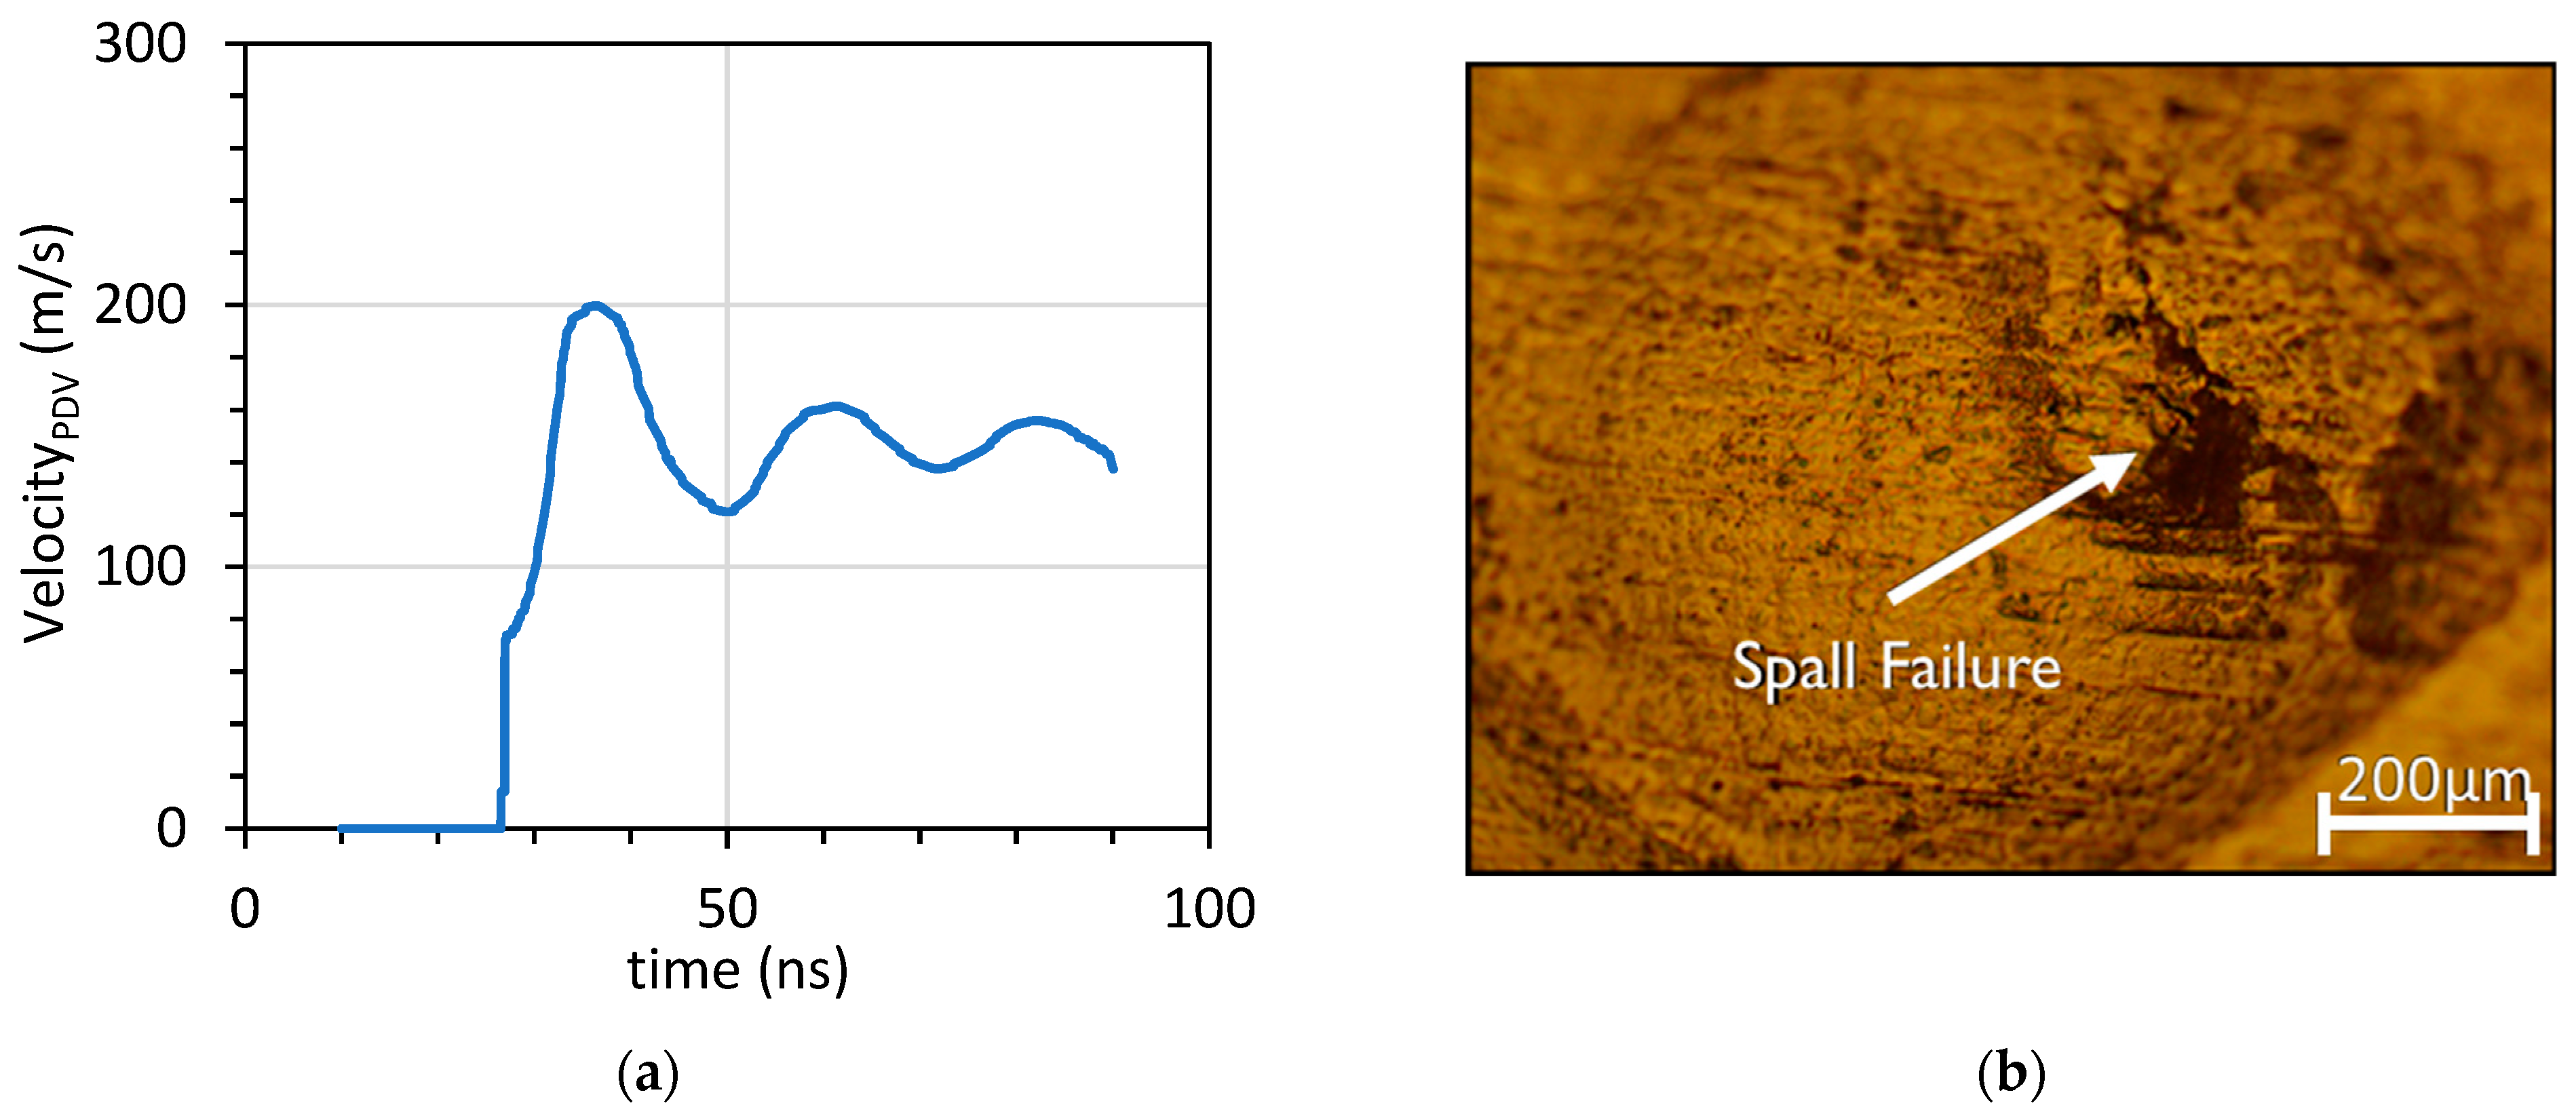
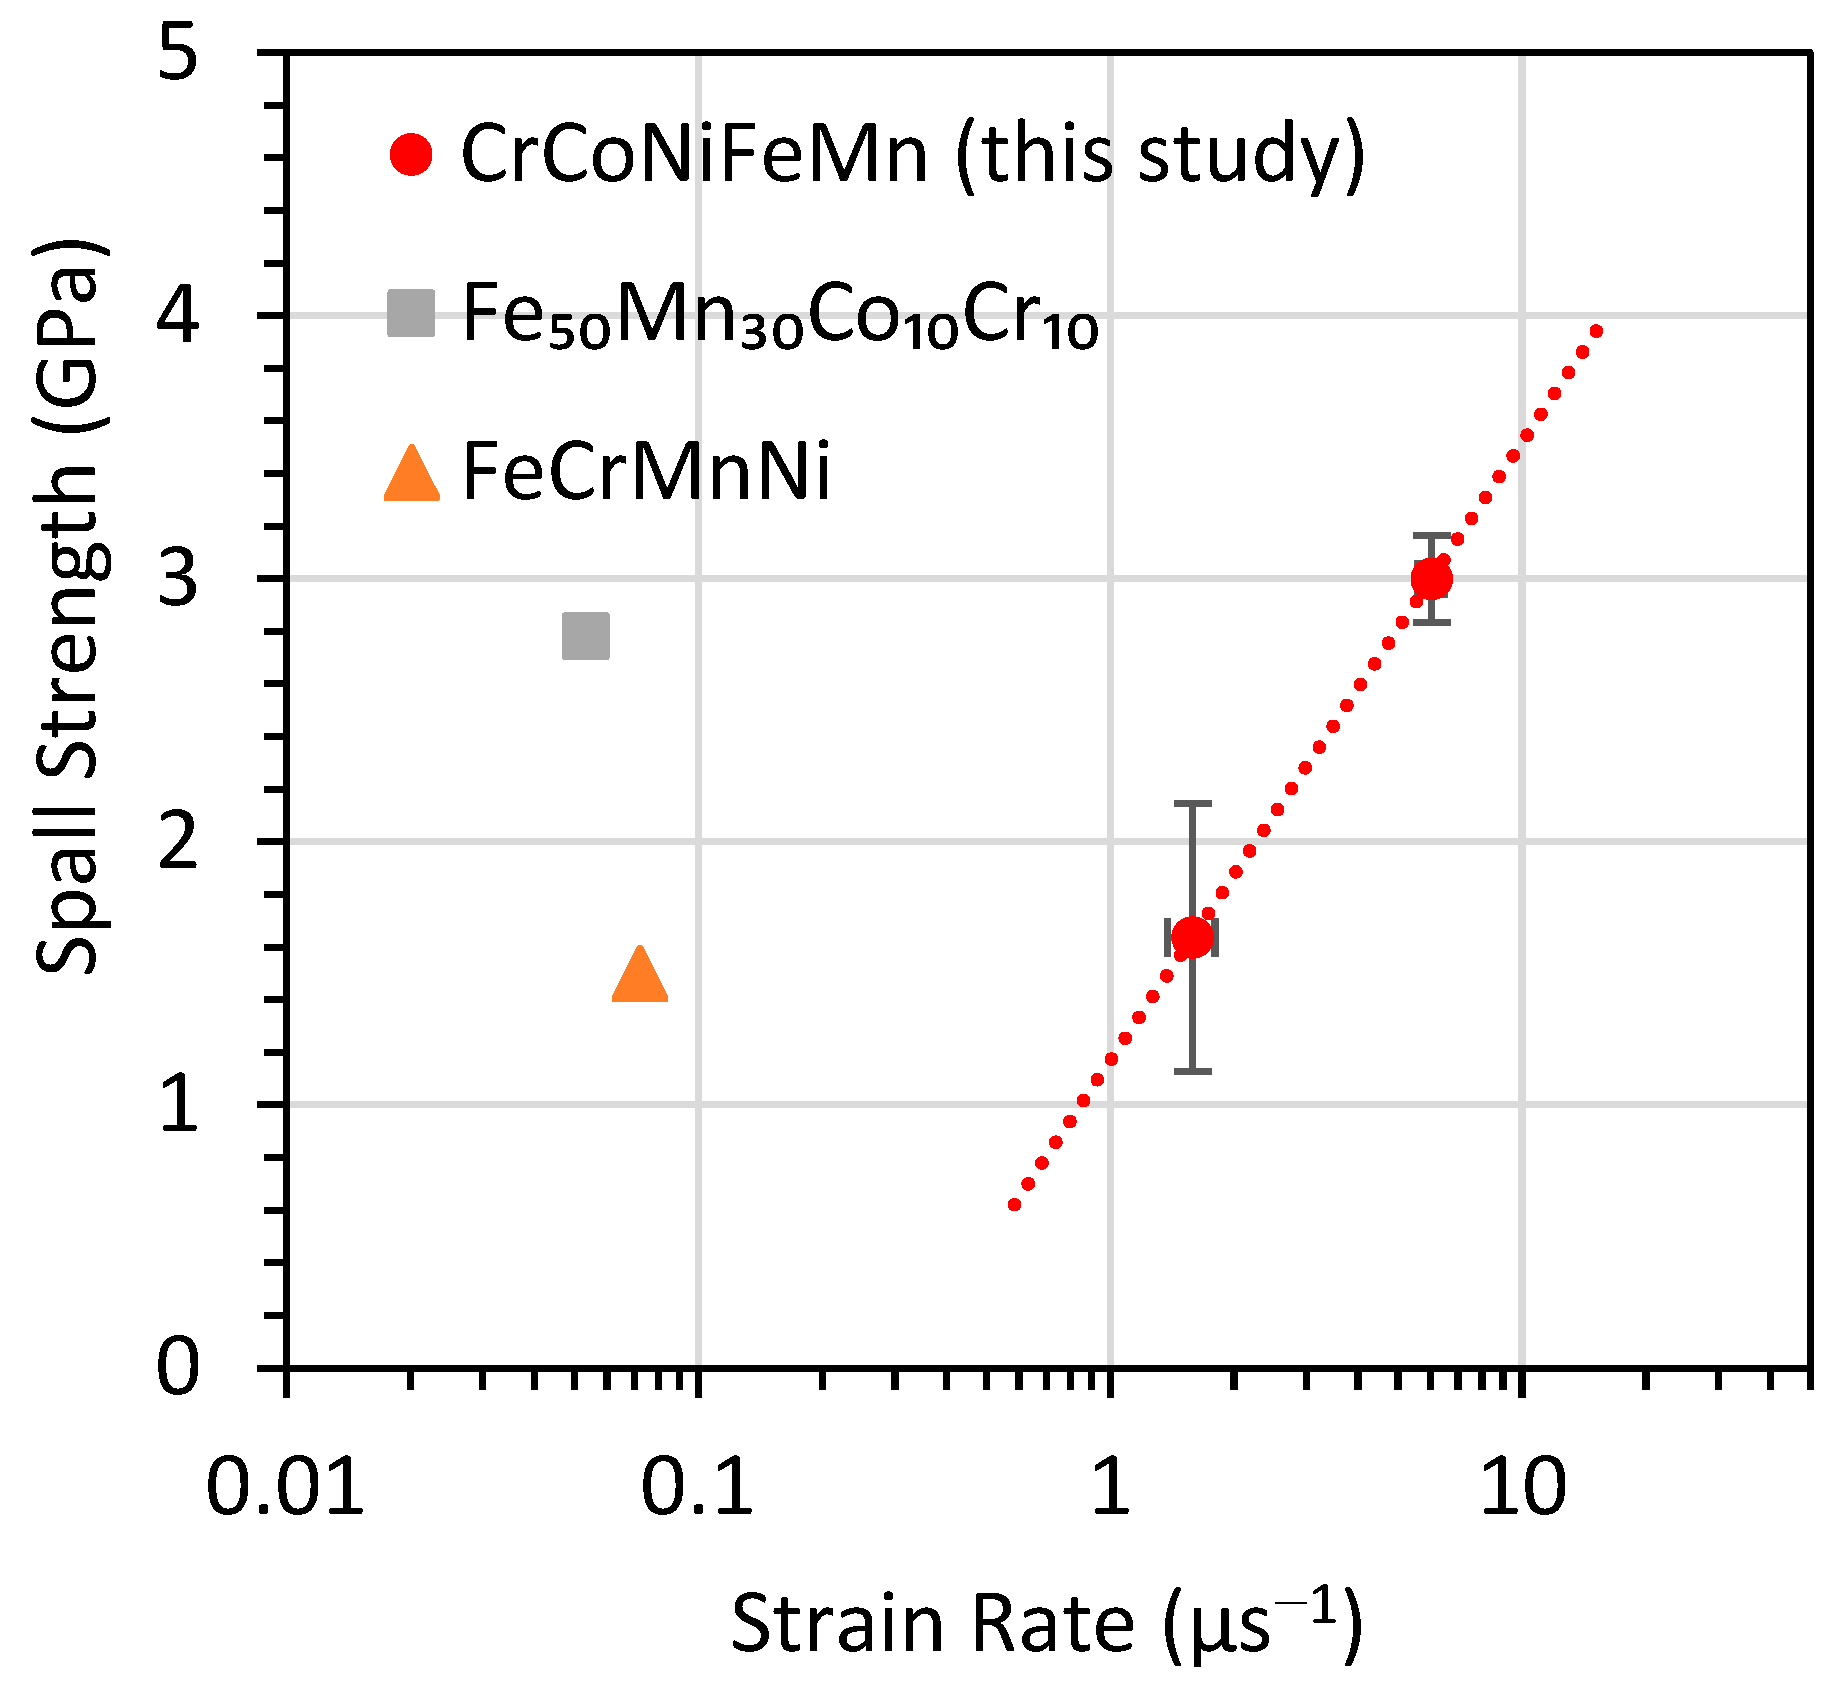
Figure 4a shows a velocity history obtained by PDV of the impact faces of an HEA flyer of 25μm thicknesses, launched across a 150 μm gap at LiF glass targets. A laser energy of 800 mJ was used to accelerate the HEA flyers to a velocity of approximately 400 m/s. We note that there is then a sudden reduction in the recorded velocity of the flyer as it impacts the LiF glass target. Figure 4b shows the impact velocity profile around this region. Rather than a sudden decrease in the velocity of the flyer to rest, we measured a period of around 15 ns in which the flyer and LiF glass interface have a relatively constant velocity, as indicated in Figure 4b. This is an indication of the particle velocity within the LiF glass target behind the shock wave induced by the impact of the HEA flyer.
Using these PDV measurements, we wish to extract two parameters for the flyer/target impacts. These are (i) the flyer impact velocity in free space and (ii) the velocity of the flyer/target interface, or Uimpact and Up in Figure 4b, respectively. From the known EOS for the LiF glass target, the relation between shock velocity (Us) and particle velocity (Up) for the HEA flyer can be obtained from impedance balance using the Uimpact and Up data points. This experiment is then repeated several times with variations in the thickness of the flyer ranging from 10 to 25 μm, allowing for several different impact velocities to be reached. These varying impact velocities result in unique measured particle velocities in the LiF glass target and thus different UsUp relations are found in the HEA sample.
Plotting each of these relations in Figure 5, we observe a general positive relation between particle velocity and shock, as should be expected. Furthermore, these results are compared to those obtained previously using a gas-gun experiment with a DPS [12], which examined drop-cast Cantor alloy, as well as to results of atomistic simulations, which look at the micro-scale relations between the particles to derive Hugoniot pressures. From these results, a linear curve fitting of the Us–Up relations allows the Hugoniot coefficients for the CoCrFeMnNi samples examined to be determined. As shown in Figure 5, the expected bulk sound speed, c, is expected to be 3.97 km/s, with a slope of 2.25 representing the Hugoniot coefficient with a coefficient of determination of 0.10. The Hugoniot coefficient and bulk sound speed reported by Jiang et al. [12] were 1.39 and 4.50 km/s, respectively. A linear approximation of the MD simulation in the same velocity range as these experiments found these values to be 2.92 and 3.48 km/s, respectively.
Our measurements are in agreement with both the findings of the MD simulations and EOS for the same alloy fabricated through a non-AM process determined through use of the gas-gun. However, we point out that these results have more variability than those produced in the gas-gun experiments. The results of this study allow us to compare the AM HEA samples to previous EOS and spall studies of similar materials. Furthermore, the experimental techniques used in this study can be compared to previous techniques, primarily those used in determination of EOS. While there are certain advantages offered by the techniques utilized in the study, there are also deficiencies which must be properly considered.
To begin, we are unable to determine the HEL of the material from these measurements. Calculations performed to determine the coefficients of the Hugoniot EOS relied upon published values. The PDV measurements are unable to provide a velocity-time profile from which this limit could be deduced as it is in other studies [12] requiring less-available gas-gun experimental setups. Second, while there are minor variations in these values between similar materials [12] and the impacts of these variations are minor for the purposes of this study, they do highlight a shortcoming of this experimental approach. A novel material with unknown values would have no clear counterparts to reference for a reasonable approximation of its elastic limit. Therefore, there would be little confidence in the results generated in these studies.
Additionally, there were greater variations in the PDV measurements of the present study than those found in previous studies using traditional DPS methods. This variation is presumed to be caused by several factors. First, the homodyne PDV system used had significant noise at lower frequencies. As a result of this, trials with velocity profiles below ~0.13 km/s did not provide useful results. On the other side of this envelope, the current experimental setup and procedures are unable to achieve the high velocities necessary for testing over a large range. While it is known that thinner flyers will achieve higher impact velocities and generate greater shock velocities, there are limitations to reducing thickness. Polishing below 10 µm creates uneven shapes and surfaces of the flyer non-conducive for testing. Furthermore, the impacts with these thinner flyers do not create strong shock signals for determining the particle velocity in the LiF target.
To mitigate these issues, several modifications are proposed for future work. Improvements to the current system can allow for greater determination of impact and particle velocities behind the shock, especially those occurring at lower velocities. Several authors have proposed an implementation of a heterodyne PDV system in flyer-impact experiments [30,31,32] rather than the current homodyne system used for this study. Referring to Figure 2, instead of splitting the 1550 nm CW laser prior to mixing with the returned signal, another signal with a wavelength of 0.1 pm difference is mixed. This allows for the noise which typically occurs around the 0–0.1 GHz band to upshift to >1.5 GHz, well outside of the testing range. This upshift allows for further testing of the lower velocities. To achieve higher velocities, an increase in power in laser energy beyond 0.8 J over the same pulse width can achieve higher impact velocities for same-thickness flyers. Laser power cannot be increased continually without potentially damaging the flyer during launch; however, small increases could allow for testing over an increased range of velocities, allowing for greater fidelity in conclusions regarding the Hugoniot coefficients.

3.2. Spall Strength

Figure 6a shows a PDV measurement during the impact experiments of HEA target using aluminum flyers. These experiments provide a direct measurement of the free surface velocity of the HEA alloy samples during impact with the aluminum flyer. This velocity profile is the signature of a spall failure where material begins to lose cohesive strength under dynamic tension and pieces of the target material begin to separate from the overall foil. Figure 6b shows how this failure appears within the HEA targets after testing. The tensile wave interactions resulting from reflections of the shock wave have exceeded the local tensile strength of the HEA sample. These failures result in the nucleation of voids within the material. A spall failure along the surface of the sample is readily apparent where a crack has propagated due to material separation.
The free surface velocity history shown in Figure 6a can be analyzed to understand the stress history in the target throughout the spall failure process. At ∼39 ns, the free surface velocity peaks at around 200 m/s. This peak free surface velocity corresponds to the maximum compressive hydrostatic stress seen in the sample. The free surface velocity measured by the PDV then decreases until reaching a local minimum. This “pullback” velocity signal occurs at ∼50 ns, while the free surface velocity is 121 m/s. The corresponding “pullback” velocity defined as ∆v, is measured as ~79 m/s in this trial. From here, the spall strength of the material is then estimated using Equation (3). The strain rate induced by the flyer impacts within the HEA samples are also determined. Strain rate is determined based upon the slope of the velocity profile at the midpoint between the peak compressive stress and the pullback signal.
This strain rate will differ depending on the thickness of the aluminum flyer used in the trial. Aluminum flyers of 25 µm and 50 µm thicknesses were used in these experiments which had resulting flyout velocities prior to impact with the HEA targets of around 1.0 km/s and 0.5 km/s, respectively. The differences in these flyouts and the resulting impacts produced different free surface velocity profiles. The variations of the spall strength and the strain rate for each test scenario are shown in Figure 7.
In Figure 7, the data point corresponding to the 50 µm aluminum flyers had a strain rate of 1.58 µs−1 with an observed spall strength of 1.64 GPa. Meanwhile, for the 25 µm flyer case, where the impact velocity was nearly double that of the 50 µm, the strain rate was 6.02 µs−1, with a spall strength of 3.00 GPa. The higher velocity impacts resulted in both a higher strain rate and greater spall strength being observed within the HEA samples. This positive correlation between these two variables is expected. Previous studies on similar materials observed similar behaviors [10,11].
Figure 7 also shows a comparison of the CoCrFeMnNi HEA sample tested in this study to previous spall–strain rate studies examining similar HEAs produced under conventional methods [10,11]. These studies tested at strain rate magnitudes lower than those present in these experiments. However, the spall strengths of those materials at those lower strain rates are similar to the spall strength determined for this HEA produced using AM methods. There can be several reasons for these discrepancies. Analysis of the specimens impacted by 25 µm flyers did not show the evident spall failures of those impacted by the 50 µm flyers seen in Figure 6b. It is possible that the tensile stress waves created by these failures were insufficient to produce a strong spall failure. Thus, the spall strength observed in these higher strain rate tests may not fully reflect the behavior of the material. In future studies, achieving higher strain rates with flyers in excess of 50 µm thickness would be desired. These trials have shown that spallation occurs throughout the sample, increasing confidence that the spall strength calculated accurately reflects the material’s behavior. To achieve higher strain rates with these flyers would require certain modifications to the current experimental design. Increasing the energy of the laser at the point of launch can best increase the impact velocity of the aluminum flyers. Similar to the solutions addressed in the previous section, increasing the energy output of a single pulse at the point of launch through the use of a different pulse laser or modifications to the diffractive elements prior to the aspheric lens in order to decrease spot size would achieve this. Flyers of 50 µm and greater could then be used to achieve the high strain rates produced by the 25 µm flyers in these studies while still producing evident spall failures.
Additionally, differences between the AM CoCrFeMnNi samples tested in this study and the compared HEA specimens may have resulted in similar spall strengths despite the increased strain rates present. While the compositions of these materials differ and could have contributed to these discrepancies, there are also dissimilarities in the manufacturing processes. These differing processes may have resulted in microstructural features that can better explain these findings. To do so, post-shock recovered samples were examined to identify and characterize the spall failures in the samples.

3.3. Fractography Analysis

High-magnification images were taken using an SEM of the post-shock recovered samples in order to better observe the spallation within the material. In Figure 8, a cross-section of a post-impacted 100 µm HEA target with the aluminum flyer plate is shown. Outlined in Figure 8 is the region highlighted by the black box in which spall is expected to occur based upon calculations involving wave speed and thicknesses of the target and flyer [29]. The other red-highlighted regions indicate the regions in which spallation damage was observed within the sample. The enlarged images of these areas show rounded crack tips. This indicates ductile behavior in the HEA sample despite the high strain rates present.
Also notable in these analyses are the locations at which spall failure occurred. While spallation is observed within the expected region, as shown in the left and center enlarged images of Figure 8, there are also indications of spall failure outside of these regions, as shown in the right image. These failures occurred much nearer to the surface, between the HEA target and the aluminum impactor. While these failures appear to be of a similar nature as those in the expected spall region as indicated by the rounded crack tips indicative of ductile failure, the formation of these failures in an unanticipated location is investigated.
To understand the presence of these spall failures outside of the predicted spall planes, we acquired further SEM images to reveal features in the microstructure of this material, prior to impact experiments. In Figure 9, the two images in the top left show the presence of both pores and low atomic number (Z) constituents throughout the samples. The low atomic number constituents are distinguishable from the porosities in the secondary electron SEM image in Figure 9b, which shows topographic features. The corresponding EDS maps show local enrichment of Cr and O in the areas corresponding to the low-Z constituents, suggesting that these are Cr-oxides. However, these cannot be identified as oxides with complete certainty because the O Kα X-ray line at 0.525 keV is unable to be deconvoluted from the Cr Lα line at 0.573 eV on the EDS elemental spectrum. Due to the overlapping X-ray energies, further characterization of these AM samples would be needed to confirm that the light elemental phases shown in the EDS elemental maps are indeed Cr-oxides. It is hypothesized that during the laser-based DED AM process, chromium preferentially oxidized to form these chromium-oxide deposits in the material. Regardless, both the formation of these low-Z constituents as well as the porosities observed in the material may have served as nucleation sites about which the crack could propagate when subjected to the tensile waves induced by the shock [33]. The presence of these areas outside of the predicted spall plane thus resulted in crack formation as observed in the spall failure samples. To understand which of these two features is responsible for the failures, or whether both equally contributed, further EDS imagining of post-impact samples would be required.

4. Conclusions

In this study, we investigated the behavior of an AM CoCrFeMnNi HEA when subjected to shock loading via an LIPIT system. This approach allows for greater versatility in studying the dynamic behaviors of novel materials compared to traditional methods involving DPS and gas-gun experiments.
  • Determination of Hugoniot EOS coefficient and bulk sound speed can be determined from PDV measurements. These results are reliant upon HEL data from similar materials to be available.
  • Future EOS determination can be improved through testing across a wider range of impact velocities and the implementation of an improved heterodyne PDV system compared to the available homodyne system used in this study.
  • Spall strength determination using the free surface velocity of the HEA targets showed measured spall strength approximately increased material spall strength at higher strain rates.
  • Achieving higher impact velocities with flyers of at least 50 µm thickness will produce greater spallation in the materials and lend greater confidence in the accurate assessment of the material’s spall strength.
  • Post-shock recovered samples showed evidence of ductile fracture in spall regions. This spallation occurred both within and outside of the region predicted by the shock wave speeds.
  • SEM imaging showed the presence of voids in areas outside of the predicted spall region. Furthermore, EDS elemental maps showed the presence of Cr-rich oxides as well as porosities within the HEA samples.
  • Porosities and Cr-oxides outside of the predicted spall region may have served as void nucleation sites, explaining spallation observed throughout post-impacted samples rather than analytically predicted regions.
  • Further investigation into the exact microstructural features in the failure regions will better describe whether the voids’ formations are more attributable to the pores or low-Z constituents.
  • Refinement of the manufacturing process to prevent the formation of the porosities and low-Z constituents may allow for increased spall strength in the material at high strain rates.

Author Contributions

Conceptualization, A.D.; methodology, A.D. and A.E.; software, A.D.; validation, A.D. and A.E.; formal analysis, A.D. and A.E.; investigation, A.D., A.E., E.B. and A.K.; resources, E.B., R.D. and A.K.; data curation, A.E.; writing—original draft preparation, A.D. and A.E.; writing—review and editing, A.E., T.D., R.D., A.K., E.B. and V.T.; visualization, A.D., A.E., E.B. and A.K.; supervision, V.T.; project administration, V.T.; funding acquisition, R.D. and V.T. All authors have read and agreed to the published version of the manuscript.

Funding

This research was funded by Sandia National Laboratories, grant number 2193858.

Institutional Review Board Statement

Not applicable.

Data Availability Statement

Not applicable.

Acknowledgments

R.D. is supported by the Center for Integrated Nanotechnologies, an Office of Science User Facility operated for the U.S. Department of Energy. Sandia National Laboratories is a multi-mission laboratory managed and operated by National Technology and Engineering Solutions of Sandia, LLC., a wholly owned subsidiary of Honeywell International, Inc., for the U.S. Department of Energy’s National Nuclear Security Administration under contract DE-NA0003525. The views expressed in this article do not necessarily represent the views of the U.S. Department of Energy or the United States Government.

Conflicts of Interest

The authors declare no conflict of interest.

References

  1. Dada, M.; Popoola, P.; Adeosun, S.; Mathe, N. High Entropy Alloys for Aerospace Applications. Aerodynamics 2021, 7, 1–16. [Google Scholar] [CrossRef]
  2. Dixit, S.; Rodriguez, S.; Jones, M.R.; Buzby, P.; Dixit, R.; Argibay, N.; DelRio, F.W.; Lim, H.H.; Fleming, D. Refractory High-Entropy Alloy Coatings for High-Temperature Aerospace and Energy Applications. J. Therm. Spray Technol. 2022, 31, 1021–1031. [Google Scholar] [CrossRef]
  3. Ye, Y.; Wang, Q.; Lu, J.; Liu, C.; Yang, Y. High-entropy alloy: Challenges and prospects. Mater. Today 2015, 19, 349–362. [Google Scholar] [CrossRef]
  4. Cantor, B.; Chang, I.T.H.; Knight, P.; Vincent, A.J.B. Microstructural development in equiatomic multicomponent alloys. Mater. Sci. Eng. A 2004, 375–377, 213–218. [Google Scholar] [CrossRef]
  5. Yeh, J.-W.; Chen, S.K.; Lin, S.-J.; Gan, J.-Y.; Chin, T.-S.; Shun, T.-T.; Tsau, C.-H.; Chang, S.-Y. Nanostructured High-Entropy Alloys with Multiple Principal Elements: Novel Alloy Design Concepts and Outcomes. Adv. Eng. Mater. 2004, 6, 299–303. [Google Scholar] [CrossRef]
  6. Miracle, D.B.; Senkov, O.N. A critical review of high entropy alloys and related concepts. Acta Mater. 2017, 122, 448–511. [Google Scholar] [CrossRef]
  7. Gali, A.; George, E. Tensile properties of high- and medium-entropy alloys. Intermetallics 2013, 39, 74–78. [Google Scholar] [CrossRef]
  8. Gludovatz, B.; Hohenwarter, A.; Catoor, D.; Chang, E.H.; George, E.P.; Ritchie, R.O. A fracture-resistant high-entropy alloy for cryogenic applications. Science 2014, 345, 1153–1158. [Google Scholar] [CrossRef]
  9. Zhang, Z.; Mao, M.M.; Wang, J.; Gludovatz, B.; Zhang, Z.; Mao, S.X.; George, E.; Yu, Q.; Ritchie, R.O. Nanoscale origins of the damage tolerance of the high-entropy alloy CrMnFeCoNi. Nat. Commun. 2015, 6, 10143. [Google Scholar] [CrossRef]
  10. Yang, Y.; Yang, S.; Wang, H. Effects of microstructure on the evolution of dynamic damage of Fe50Mn30Co10Cr10 high entropy alloy. Mater. Sci. Eng. A 2020, 802, 140440. [Google Scholar] [CrossRef]
  11. Hawkins, M.C.; Thomas, S.A.; Hixon, R.S.; Gigax, J.; Li, N.; Fensin, S. Dynamic Properties of FeCrMnNi, a High Entropy Alloy; Nevada National Security Site (NNSS): North Las Vegas, NV, USA, 2021. [Google Scholar]
  12. Jiang, Z.J.; He, J.Y.; Wang, H.Y.; Zhang, H.S.; Lu, Z.P.; Dai, L.H. Shock compression response of high entropy alloys. Mater. Res. Lett. 2016, 4, 226–232. [Google Scholar] [CrossRef]
  13. Peralta, P.; Digiacomo, S.; Hashemian, S.; Luo, S.-N.; Paisley, D.; Dickerson, R.; Loomis, E.; Byler, D.; McClellan, K.; D’Armas, H. Characterization of Incipient Spall Damage in Shocked Copper Multicrystals. Int. J. Damage Mech. 2008, 18, 393–413. [Google Scholar] [CrossRef]
  14. Fujiwara, H.; Brown, K.E.; Dlott, D.D. High-energy flat-top beams for laser launching using a Gaussian mirror. Appl. Opt. 2010, 49, 3723–3731. [Google Scholar] [CrossRef]
  15. Brown, K.E.; Shaw, W.L.; Zheng, X.; Dlott, D. Simplified laser-driven flyer plates for shock compression science. Rev. Sci. Instrum. 2012, 83, 103901. [Google Scholar] [CrossRef] [PubMed]
  16. Curtis, A.D.; Banishev, A.A.; Shaw, W.L.; Dlott, D.D. Laser-driven flyer plates for shock compression science: Launch and target impact probed by photon Doppler velocimetry. Rev. Sci. Instrum. 2014, 85, 043908. [Google Scholar] [CrossRef]
  17. Mallick, D.; Zhao, M.; Parker, J.; Kannan, V.; Bosworth, B.; Sagapuram, D.; Foster, M.; Ramesh, K. La-ser-driven flyers and nanosecond-resolved velocimetry for spall studies in thin metal foils. Exp. Mech. 2019, 59, 611–628. [Google Scholar] [CrossRef]
  18. Mallick, D.D.; Ramesh, K. Dynamic fragmentation of boron carbide using laser-driven flyers. Int. J. Impact Eng. 2019, 136, 103416. [Google Scholar] [CrossRef]
  19. Luo, S.N.; Swift, D.C.; Tierney, T.E.; Paisley, D.L.; Kyrala, G.A.; Johnson, R.P.; Hauer, A.A.; Tschauner, O.; Asimow, P.D. Laser-induced shock waves in condensed matter: Some techniques and applications. High Press. Res. 2004, 24, 409–422. [Google Scholar] [CrossRef]
  20. Swift, D.C.; Niemczura, J.G.; Paisley, D.L.; Johnson, R.P.; Luo, S.-N.; Iv, T.E.T. Laser-launched flyer plates for shock physics experiments. Rev. Sci. Instrum. 2005, 76, 093907. [Google Scholar] [CrossRef]
  21. Shui, M.; Chu, G.; Zhu, B.; He, W.; Xi, T.; Fan, W.; Xin, J.; Gu, Y. Hypervelocity launching of flyers at the SG-III prototype laser facility. J. Appl. Phys. 2016, 119, 035903. [Google Scholar] [CrossRef]
  22. Zhu, Y.; Liao, X.; Wu, X. Deformation twinning in nanocrystalline materials. Prog. Mater. Sci. 2012, 57, 1–62. [Google Scholar] [CrossRef]
  23. Thürmer, D.; Zhao, S.; Deluigi, O.R.; Stan, C.; Alhafez, I.A.; Urbassek, H.M.; Meyers, M.A.; Bringa, E.M.; Gunkelmann, N. Exceptionally high spallation strength for a high-entropy alloy demonstrated by experiments and simulations. J. Alloys Compd. 2021, 895, 162567. [Google Scholar] [CrossRef]
  24. Melia, M.A.; Carroll, J.D.; Whetten, S.R.; Esmaeely, S.N.; Locke, J.; White, E.; Anderson, I.; Chandross, M.; Michael, J.R.; Argibay, N.; et al. Mechanical and Corrosion Properties of Additively Manufactured CoCrFeMnNi High Entropy Alloy. Addit. Manuf. 2019, 29. [Google Scholar] [CrossRef]
  25. Dhiman, A.; Olokun, A.; Tomar, V. Microscale Analysis of Stress Wave Propagation through Plastic Bonded Explosives under Micro-Sphere Shock Impact. J. Dyn. Behav. Mater. 2021, 7, 294–306. [Google Scholar] [CrossRef]
  26. Dhiman, A.; Rai, A.; Wang, H.; Prakash, C.; Tomar, V. Dynamic Stress Evaluation due to Hypervelocity Impact using Time Gated Raman Spectroscopy. DYMAT Winter Sch. 2020, 12, 1–6. [Google Scholar]
  27. Marsh, S.P. LASL Shock Hugoniot Data; University of California press: Berkeley, CA, USA, 1980. [Google Scholar]
  28. Meyers, M.A. Dynamic Behavior of Materials; John wiley & sons: New York, NY, USA, 1994. [Google Scholar]
  29. Thomas, S.; Hawkins, M.; Matthes, M.; Gray III, G.; Hixson, R. Dynamic strength properties and alpha-phase shock Hugoniot of iron and steel. J. Appl. Phys. 2018, 123, 175902. [Google Scholar] [CrossRef]
  30. Holtkamp, D.B. Survey of Optical Velocimetry Experiments Applications of PDV, A Heterodyne Velocimeter. In Proceedings of the 2006 IEEE International Conference on Megagauss Magnetic Field Generation and Related Topics, Santa Fe, NM, USA, 5–10 November 2006; pp. 119–128. [Google Scholar] [CrossRef]
  31. Kettenbeil, C.; Mello, M.; Bischann, M.; Ravichandran, G. Heterodyne transverse velocimetry for pressure-shear plate impact experiments. J. Appl. Phys. 2018, 123, 125902. [Google Scholar] [CrossRef]
  32. Mallick, D.; Zhao, M.; Bosworth, B.; Schuster, B.; Foster, M.; Ramesh, K. A Simple Dual-Beam Time-Multiplexed Photon Doppler Velocimeter for Pressure-Shear Plate Impact Experiments. Exp. Mech. 2018, 59, 41–49. [Google Scholar] [CrossRef]
  33. Wayne, L.; Krishnan, K.; DiGiacomo, S.; Kovvali, N.; Peralta, P.; Luo, S.; Greenfield, S.; Byler, D.; Paisley, D.; McClellan, K. Statistics of weak grain boundaries for spall damage in polycrystalline copper. Scr. Mater. 2010, 63, 1065–1068. [Google Scholar] [CrossRef]
Figure 1. (a) Additively manufactured specimen (b) Polished specimen (c) Punched flyer cut-out from (b).
Metals 12 01482 g001
Figure 2. Schematic of laser flyer launch system with photon Doppler velocimeter (PDV). BE = beam expander, BH = beam homogenizer, OBJ = objective lens, AL = aspheric lens, FI = Faraday isolator, Reprinted with permission from ref. [25]. Copyright 2022 Springer.
Metals 12 01482 g002
Figure 3. (a) Schematic of spall due to flyer impact in Lagrange frame (b) Velocity profile at the free surface of the target during spall failure.
Metals 12 01482 g003
Figure 4. (a) Velocity profile of flyer impact on glass (b) Velocity profile measured at the flyer–glass interface.
Metals 12 01482 g004
Figure 5. UsUp relations found in experiment compared to MD Simulation and previous literature [9] which allows equation of state to be derived.
Metals 12 01482 g005
Figure 6. (a) Particle velocity measured from the free surface of the HEA target (b) Spall failure in the target.
Metals 12 01482 g006
Figure 7. Strain rate dependence of spall strength for CoCrFeMnNi alloy compared to similar alloys.
Metals 12 01482 g007
Figure 8. Post-impact cross-section images showing spallation in HEA target both within and outside of predicted spall region.
Metals 12 01482 g008
Figure 9. Backscatter SEM (a) and secondary electron SEM (b) images of porosities and low atomic number constituents within HEA sample with the corresponding EDS elemental maps (ch). Windows 50 µm wide at 20 kV.
Metals 12 01482 g009
Publisher’s Note: MDPI stays neutral with regard to jurisdictional claims in published maps and institutional affiliations.

