Article

Numerical Investigation on the Effect of Residual Stresses on the Effective Mechanical Properties of 3D-Printed TPMS Lattices

1
Advanced Digital & Additive Manufacturing Center, Khalifa University, Abu Dhabi P.O. Box 127788, United Arab Emirates
2
Department of Mechanical Engineering, Khalifa University, Abu Dhabi P.O. Box 127788, United Arab Emirates
*
Author to whom correspondence should be addressed.
Metals 2022, 12(8), 1344; https://doi.org/10.3390/met12081344
Submission received: 29 June 2022 / Revised: 6 August 2022 / Accepted: 8 August 2022 / Published: 12 August 2022
(This article belongs to the Special Issue 3D Printing of Metal)

Abstract

:
The layer-by-layer process of additive manufacturing (AM) is known to give rise to high thermal gradients in the built body resulting in the accumulation of high residual stresses. In the current study, a numerical investigation is conducted on the effect of residual stresses on the mechanical properties of IN718 triply periodic minimal surface (TPMS) lattices fabricated using the selective laser melting (SLM) process for different relative densities. The AM simulation of four different sheet- and ligament-based TPMS topologies, namely, Schwarz Primitive, Schoen Gyroid, Schoen IWP-S, and IWP-L, are performed using a sequentially coupled thermomechanical finite element model to evaluate the thermal histories and residual stress evolution throughout the SLM process. The finite element results are utilized to obtain the effective mechanical properties, such as elastic modulus, yield strength, and specific energy absorption (SEA), of the TPMS lattices while accounting for the residual stress field arising from the SLM process. The mechanical properties are correlated to relative density using the Gibson–Ashby power laws and reveal that the effect of the residual stresses on the elastic modulus of the as-built TPMS samples can be significant, especially for the Schwarz Primitive and Schoen-IWP-L TPMS topologies, when compared to the results without accounting for residual stresses. However, the effect of the residual stresses is less significant on yield strength and SEA of the TPMS samples. The work demonstrates a methodology for numerical simulations of the SLM process to quantify the influence of inherited residual stresses on the effective mechanical properties of complex TPMS topologies.

1. Introduction

Over the past couple of decades, advancements in additive manufacturing (AM) have enabled the fabrication of complex lattice structures including the triply periodic minimal surface (TPMS) [1,2], but these structures are difficult to produce with conventional manufacturing methods due to the associated high cost and low efficiency [3]. TPMS structures are three-dimensional open-celled structures composed of one or more repeating unit cells in an orderly pattern [4]. These structures have a high specific strength and stiffness, and a high surface-area-to-volume ratio, which are features desired in many mechanical applications [5,6]. However, due to the sequential layer-by-layer nature of the selective laser melting (SLM) process, part of the heat is absorbed during melting of the powder layer and part of the heat is conducted to the already solidified layers below and through convection to the surroundings. This cyclic nature of thermal loads leads to a transient change in temperature. The steep thermal gradients induce a strain mismatch between the newly formed layers and pre-solidified layers beneath during heating and cooling cycles, resulting in the accumulation of residual stresses [7]. The inherited residual stresses in SLM are known to affect the dimensional accuracies and shape of the parts, contributing to crack formation and delamination of layers. Additionally, residual stress drastically affects the fatigue life and the loading capacity of the parts [8,9]. Hence, quantifying residual stresses arising from the SLM process is becoming more critical. Depending on the magnitude of the residual stresses and their effect, they can be classified as type I, II, or III residual stresses [10]. Type I residual stresses act over larger length scales, e.g., macroscale, due to nonuniform heating and cooling rates throughout the AM process, which can result in nonnegligible deformations. Type II stresses that act at the microstructural level, e.g., grain size level, can occur due to phase transformation in the material at the microscale, while type III stresses exist over atomic scales caused by dislocation and point defects. The focus of the current study is macroscopic residual stresses of type I. As the SLM process involves many process parameters, experimentally evaluating residual stresses is time-consuming [11,12], and hence, numerical analysis based on the finite element method (FEM) is an efficient way simulate the thermomechanical behavior and quantify the residual stresses during the SLM process. The most widely used thermomechanical approach is the indirect sequentially coupled analysis that is performed in two stages. First, a transient temperature field of the built part is simulated, and the temperature results are then used to perform the mechanical analysis. This method is computationally less expensive compared to fully coupled analysis in which the temperature and displacement degrees of freedom are solved simultaneously and updated for each time increment [13]. An indirect coupling approach has been successfully used to investigate the AM process to predict residual stress formations and geometric deformations to good accuracies [14,15,16,17,18,19].
Numerical methods based on finite element analysis (FEA) have been extensively used alongside experiments to investigate the mechanical properties of TPMS structures fabricated from the AM process [20,21,22,23,24]. Al-Rub et al. [25] used FEA to investigate the effective anisotropic elastic and plastic properties along with the deformation mechanism under different load combinations of Schoen’s IWP TPMS and proposed a cost-effective finite-element simulation framework for the IWP structural system. Al-Ketan et al. [26] studied the topology–property relationship of lattice structures based on the TPMS IWP minimal surfaces, and FEA was used to investigate the stiffness and strength of different relative densities of the TPMS structure along with experimental investigations. The work showed that the sheet-based IWP lattice structure exhibited high structural efficiency compared to other strut-based and skeletal-based lattice structures. Yang et al. [27] used a numerical approach to quantify the influence of various geometric factors such as surface thickness, sample size, and number of surface periods, etc., on the overall structural response of gyroid structures. Lee et al. [28] investigated the mechanical properties and deformation behavior under several different stress states of the Schwarz Primitive unit cell under periodic boundary conditions. Zheng et al. [29] using the finite volume method found that the mechanical properties are highly dependent on topological architectures of TPMS structures. Abueidda et al. [30] in their work predicted and compared the electrical/thermal conductivities, elastic properties, and anisotropies of different TPMS foams. Maskery et al. [31] used FEA to predict the stress distribution in polymer-based TPMSs under compressive loads with good agreement with experiments, and the investigation also indicated that the cell geometry played a key role in determining the deformation mechanism, failure modes, and the associated mechanical properties.
In general, FEA has been effectively used to investigate the elastic and plastic properties of TPMS structures; however, to the best of the authors knowledge, numerical thermomechanical analysis to quantify the effect of residual stresses inherited from the SLM process on the effective mechanical properties of TPMS structures is a topic not addressed in the literature. Hence, in this work, an FEA simulation scheme is proposed to evaluate the residual stresses from the SLM process and to quantify its influence on the effective mechanical properties of TPMS structures. Four different TPMS topologies are considered: Schwarz sheet-based Primitive, Schoen sheet-based Gyroid, Schoen sheet-based I-WP, and ligament-based I-WP (henceforth referred to P-S, G-S, IWP-S, and IWP-L, respectively). Inconel 718 (IN718), which is a commonly used grade for metallic 3D printing, is considered as the base material, and the effective mechanical properties from the thermomechanical simulations of the AM-built TPMS lattices are compared with their reference counterparts, i.e., lattices without residual stresses.

2. Modeling Framework
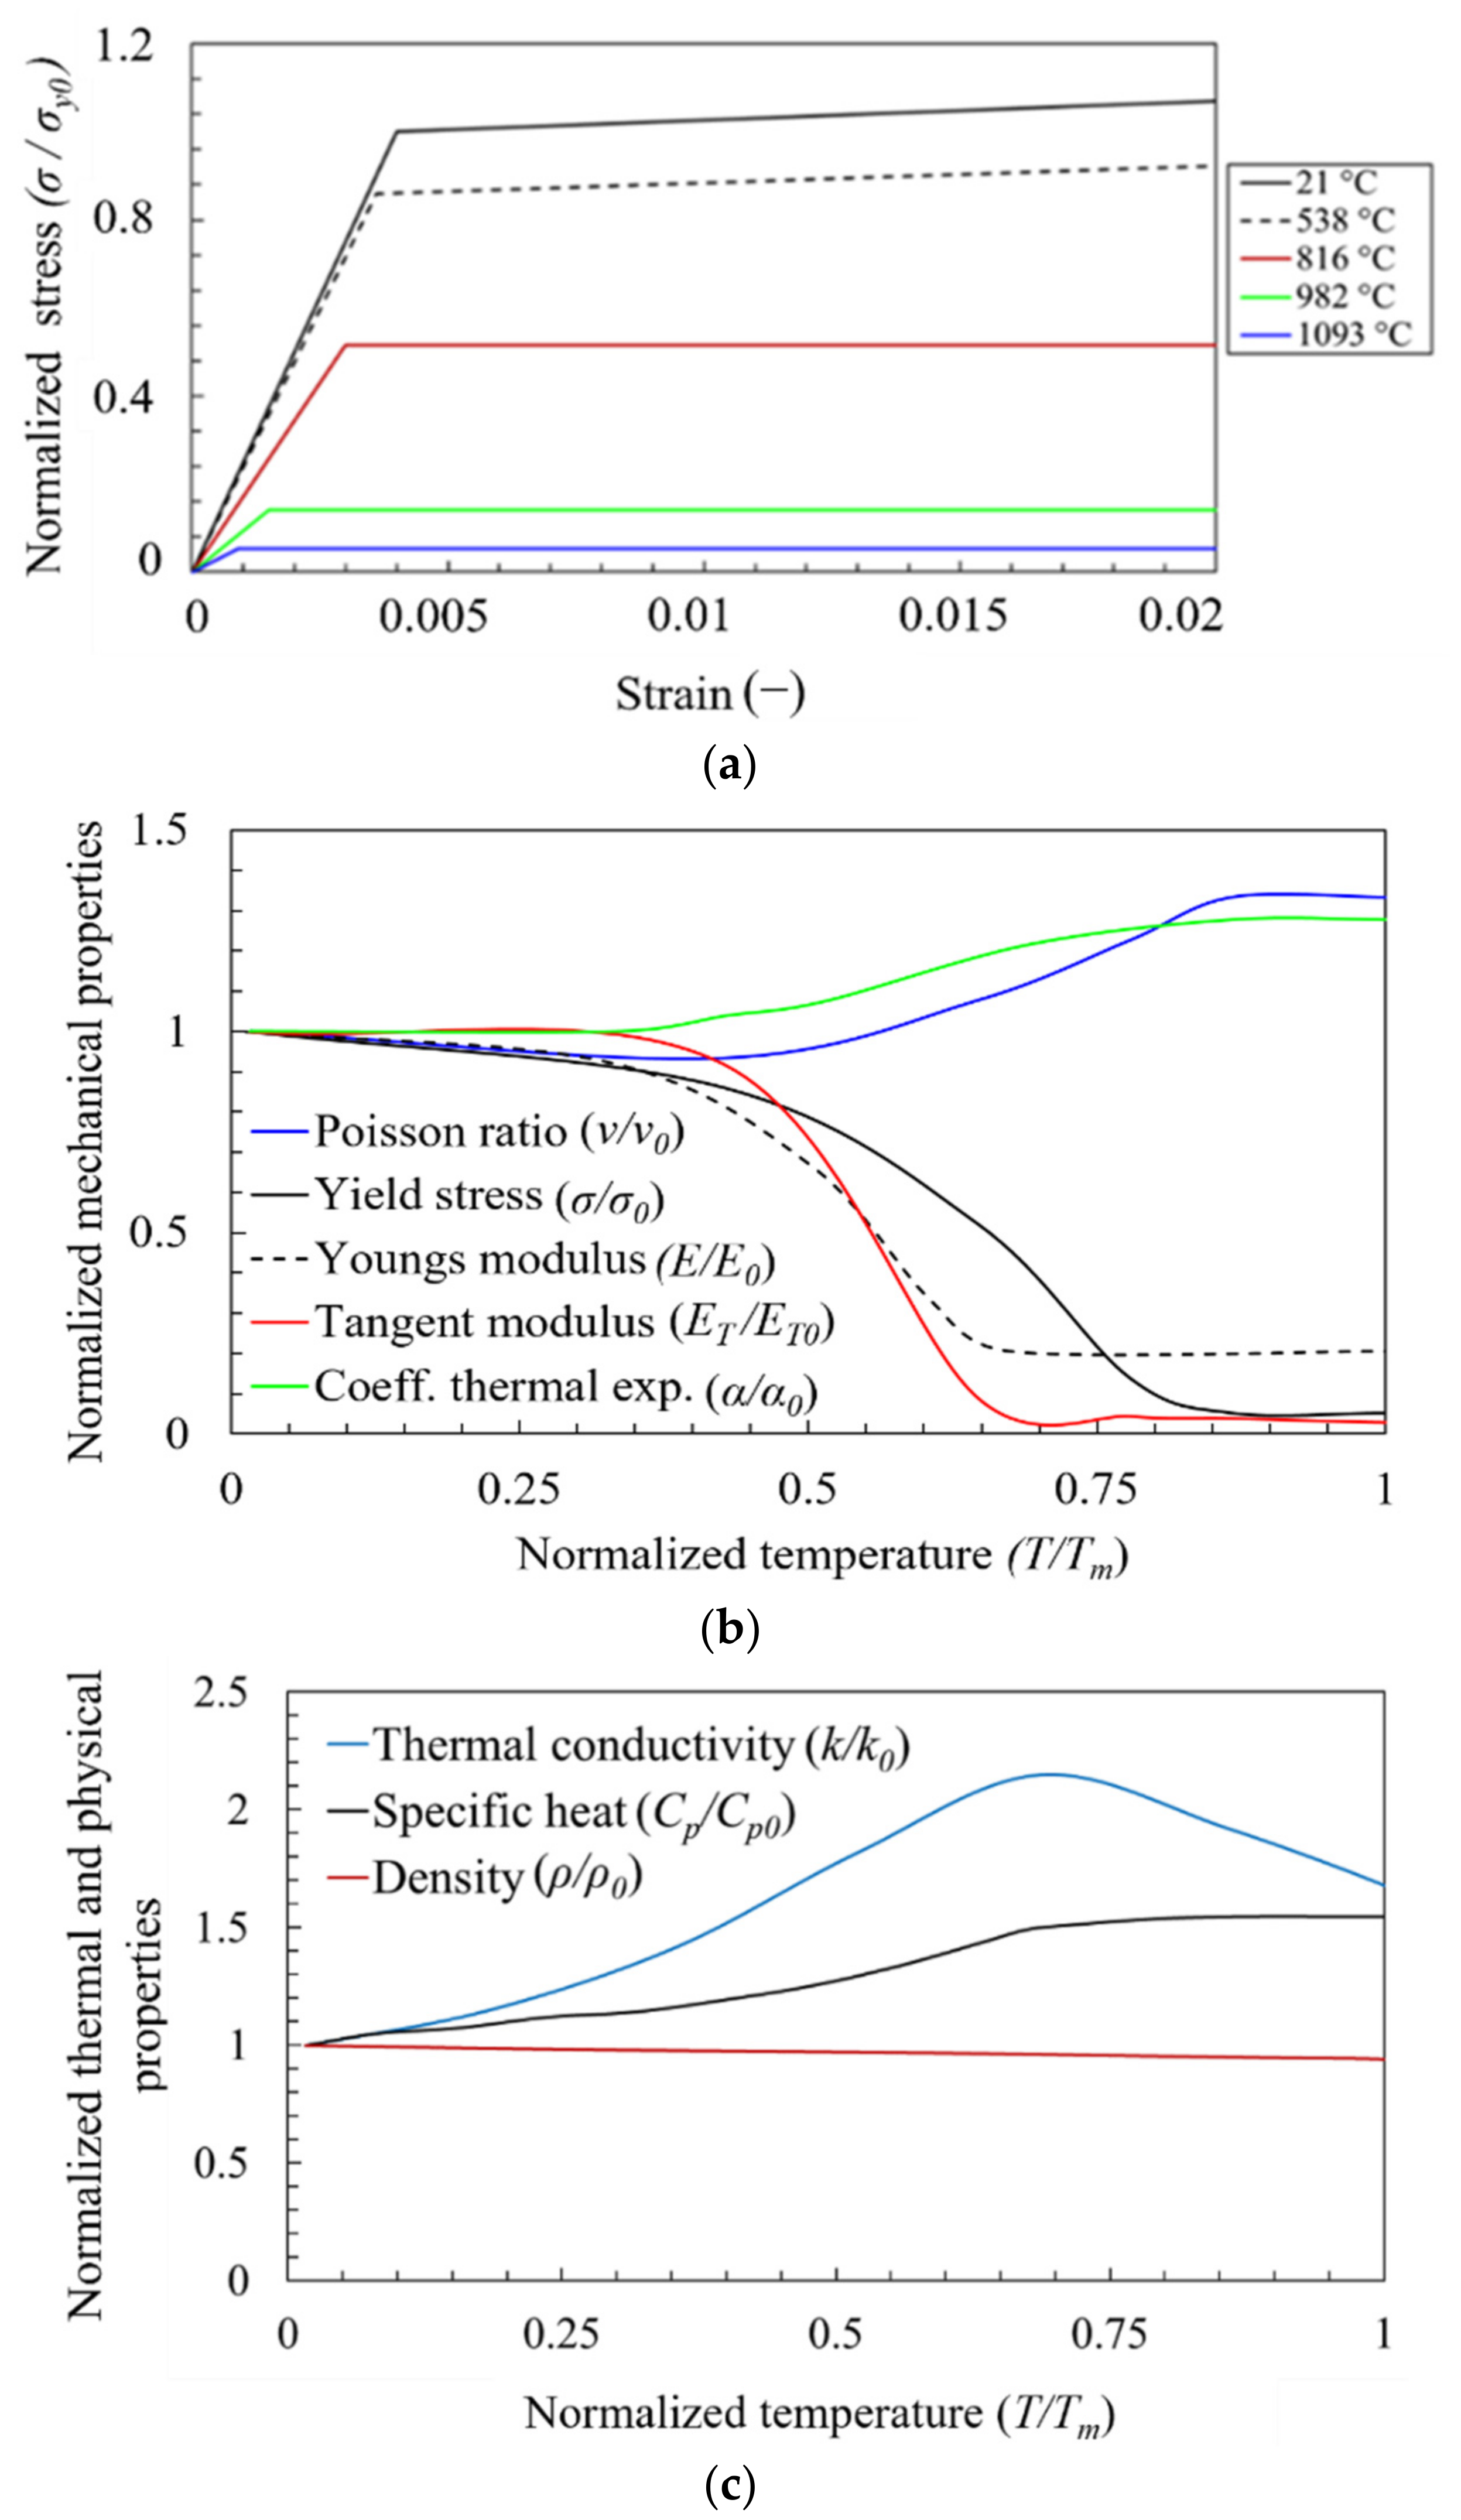
Figure 1 shows a schematic representation of the AM process with governing thermal conditions. Assuming a homogenous medium with isotropic thermal properties, e.g., no spatial change in thermal conductivity of the material, the transient temperature distribution T (x, y, z, t) throughout the workpiece during the SLM process is governed by the following three-dimensional thermal transient conduction equation:
k T   2 T + Q = ρ   C p T   T t
where Cp is the temperature-dependent specific heat capacity, ρ is the density, T is the temperature, t is the time, Q is the internal heat generation rate, and k is the temperature-dependent thermal conductivity of the isotropic material. The initial and final (e.g., cooling stage) thermal condition for temperature distribution throughout the powder bed is given by
T x , y , z , t = 0 = T 0 ,   T x , y , z , t = = T 0
where T0 = 22 °C corresponds to room temperature. The base of the substrate is preheated and subjected to a temperature of 100 °C during the build stage and is brought back to room temperature during the cooling phase. The boundary conditions for all other surfaces are assumed to be under heat loss to the surrounding gas by free air convection with a heat transfer coefficient, h = 1 × 10⁻⁵ W/mm2 °C.
The layer-by-layer formation during the SLM process gives rise to large thermal gradients in parts, which, in turn, leads to the accumulation of residual stress and strain during the solidification phase. The related stress and strain in the parts are associated with the following equation:
σ = D ε e
where {σ} is the stress vector, [D] is the elasticity stiffness matrix, and {εe} is the elastic strain vector. Using a simplified elastic–plastic hardening model, {εe} can be expressed as:
ε e = ε ε p ε t
where ε is the total strain vector, {εp} is the plastic strain vector, and {εt} is the thermal strain vector. Using Equation (4) in Equation (3) may be written as follows:
ε = D 1 σ + ε p + ε t
For isotropic material, the above stress–strain relationship can be elaborated in Cartesian co-ordinates as follows [32]:
ε x = 1 E   σ x   v σ y + σ z + ε x p + ε t
ε y = 1 E   σ y   v σ x + σ z + ε y p + ε t
ε z = 1 E   σ z   v σ x + σ y + ε z p + ε t
γ x y =   τ x y 2 G + γ x y p   ,       γ x z =   τ x z 2 G + γ x z p   ,       γ y z =   τ y z 2 G + γ y z p
where E is the elastic modulus; G is the shear modulus; ν is Poisson’s ratio; τ x y , τ x z , and τ y z are the shear stress components; γ x y , γ x z , and γ y z are the corresponding shear strain components. The thermal strain component arising due to volume change caused by temperature variations can be expressed as follows:
ε t = α e Δ T = α e T T r e f
where αe is the coefficient of thermal expansion, T is the instantaneous temperature, and Tref is the reference temperature with respect to time at t = 0. The deviator stresses according to the Prandtl–Reuss equation of plasticity can be represented as follows:
d ε x p   σ x = d ε y p   σ y = d ε z p   σ z = d γ x y p   τ x y = d γ y z p   τ y z = d γ z x p   τ z x = d λ
σ x = σ x σ m   ,                 σ y = σ y σ m   ,                   σ z = σ z σ m
where σ′x, σ′y, and σ′z are the deviator stresses in the x, y, and z directions, respectively; is the instant positive constant of proportionality. Σm refers to the mean stress, which can be evaluated as follows:
σ m = σ x + σ y + σ z 3
Substituting the values of ε x p , ε y p , ε z p , and ε t in Equations (6)–(9), the resultant equations can be stated as below in Equations (14)–(17):
ε x = 1 E σ x   v σ y + σ z + σ x d λ + α e Δ T
ε y = 1 E σ y   v σ x + σ z + σ y d λ + α e Δ T
ε z = 1 E σ z y   v σ x + σ y + σ z d λ + α e Δ T
γ x y = τ x y 2 G +   τ x y d λ ,   γ x z = τ x z 2 G +   τ x z d λ ,   γ y z = τ y z 2 G +   τ y z d λ
Finally, the Von Mises stress σm is computed as follows:
  σ m = 1 2 [ σ x σ y 2 + σ y σ z 2 + σ z σ x 2 + 6 τ x y 2 + τ y z 2 + τ z x 2 ]
where σ x , σ y , and σ z are the x, y, and z components of stress, respectively.

2.1. Material

Temperature-dependent physical and thermal properties of Inconel 718 (IN718) including density ρ, specific heat Cp, and thermal conductivity k are used as input properties to perform the transient thermal analysis. For the transient mechanical analysis, the temperature-dependent elastic modulus E, yield strength σy, Poisson’s ratio ν, plastic tangent modulus ET, and coefficient of thermal expansion α are used.
The stress–strain curves of IN718 at various temperatures are shown Figure 2a, pertaining to stress normalized with the yield strength (σy0) at room temperature (T0). The evolution of the temperature-dependent thermal, physical, and mechanical properties is shown in Figure 2b,c, respectively, where the properties are normalized with their corresponding value at room temperature, and the temperature is normalized with the melting temperature value of IN718 (e.g., Tm = 1260 °C). The corresponding properties at room temperature for IN718 are provided in Table 1.

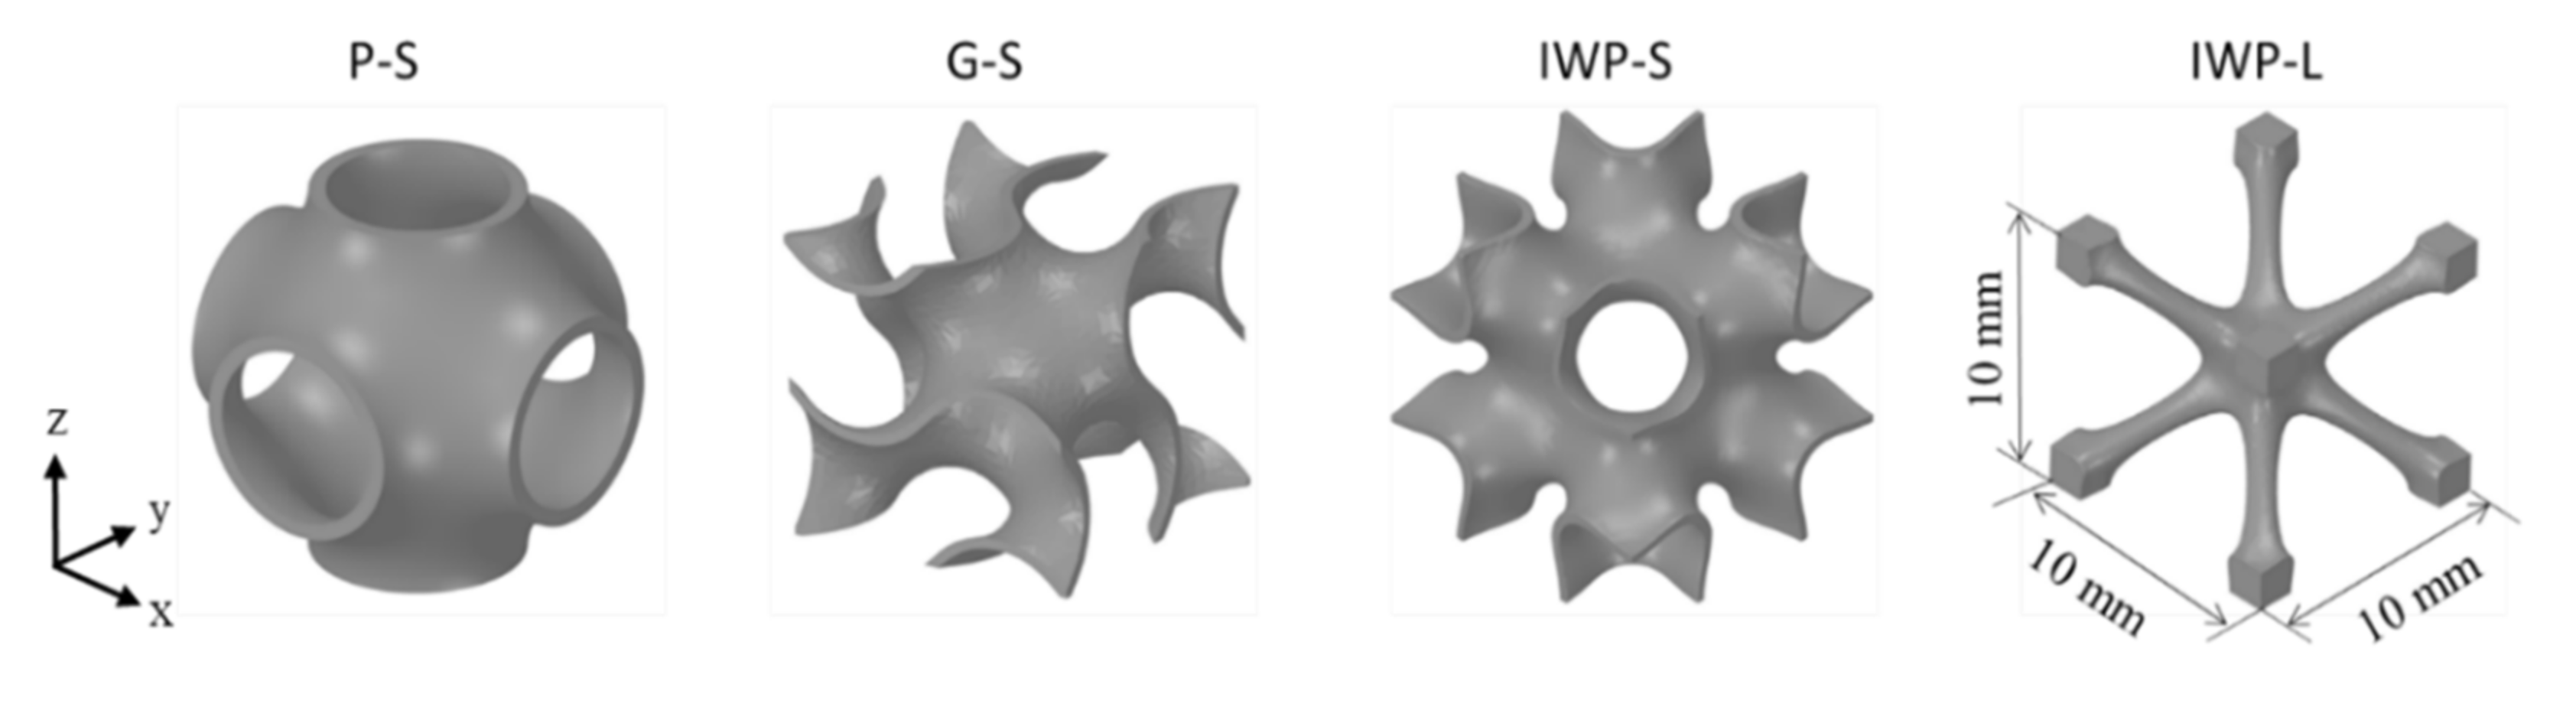
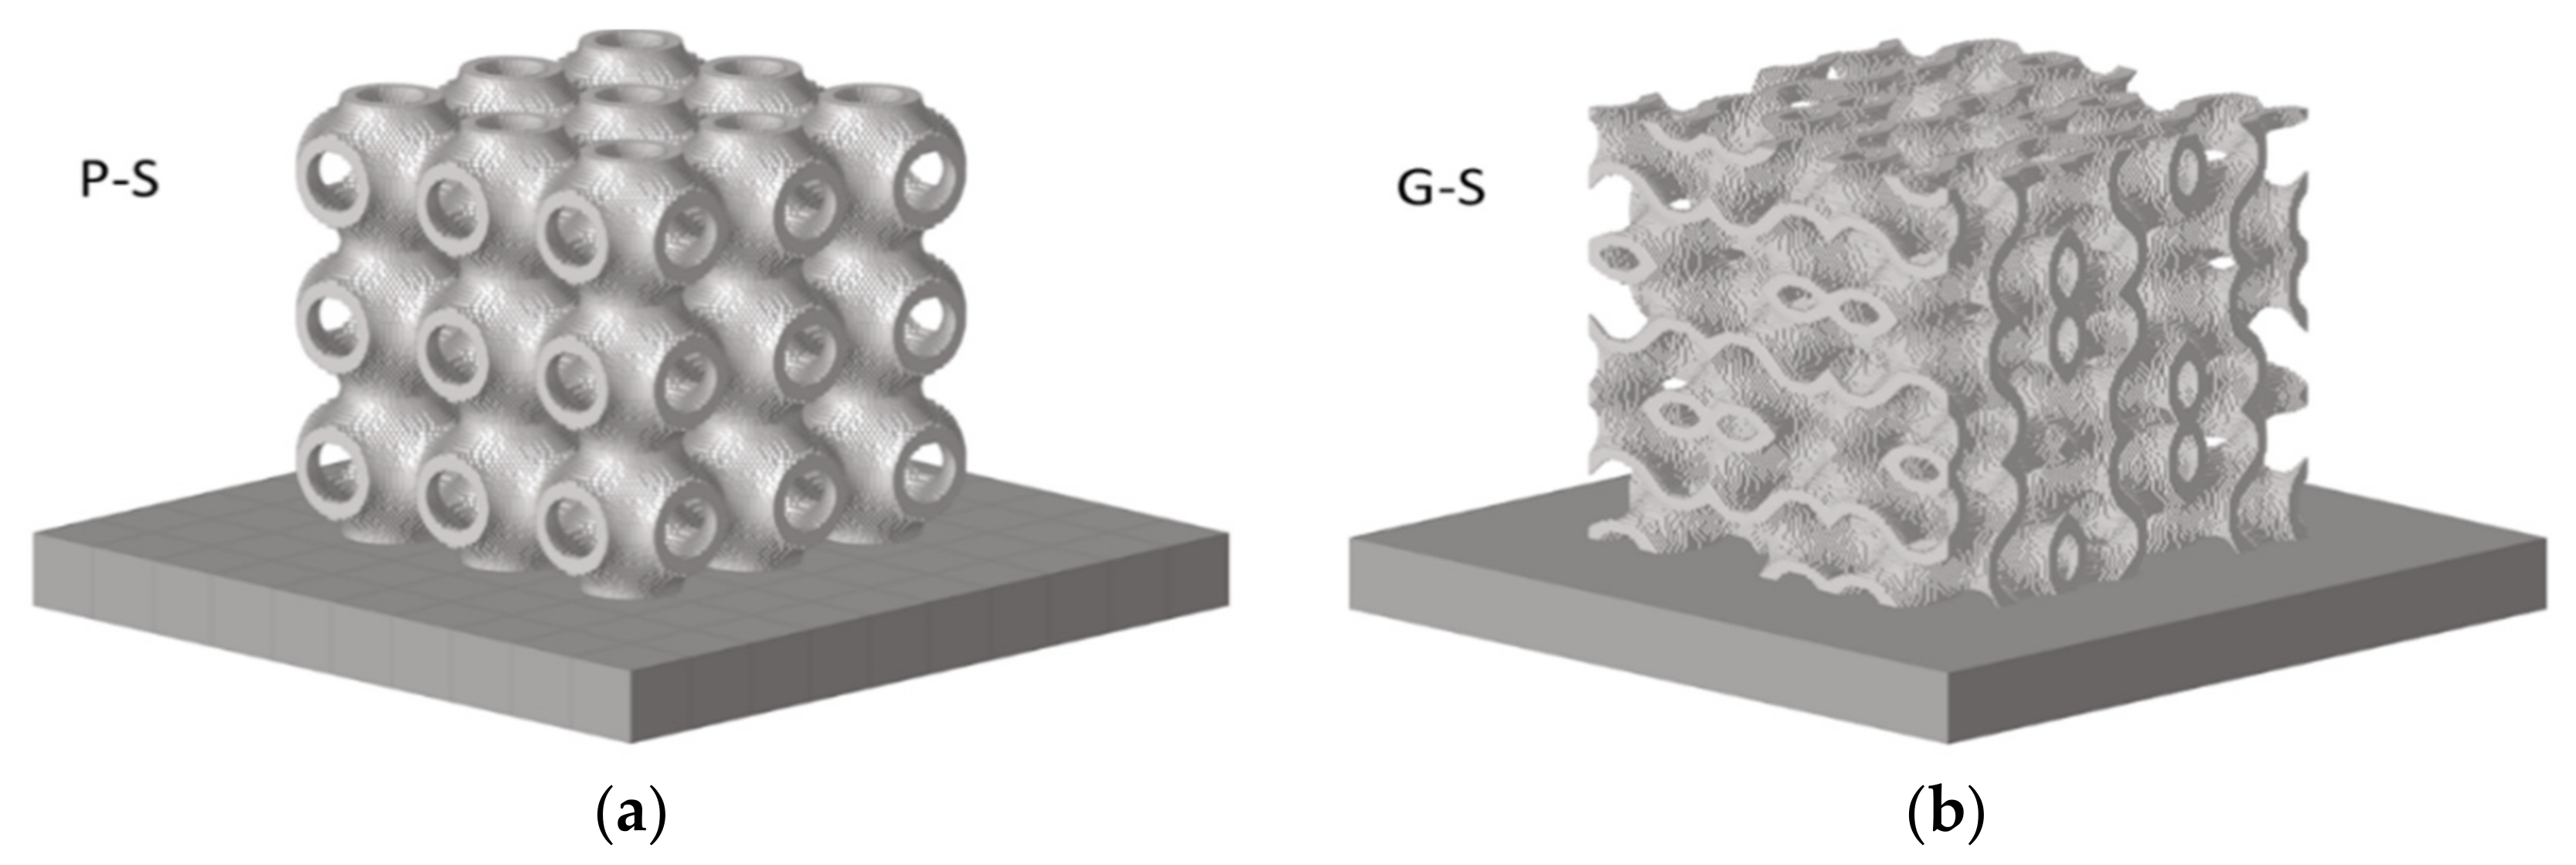
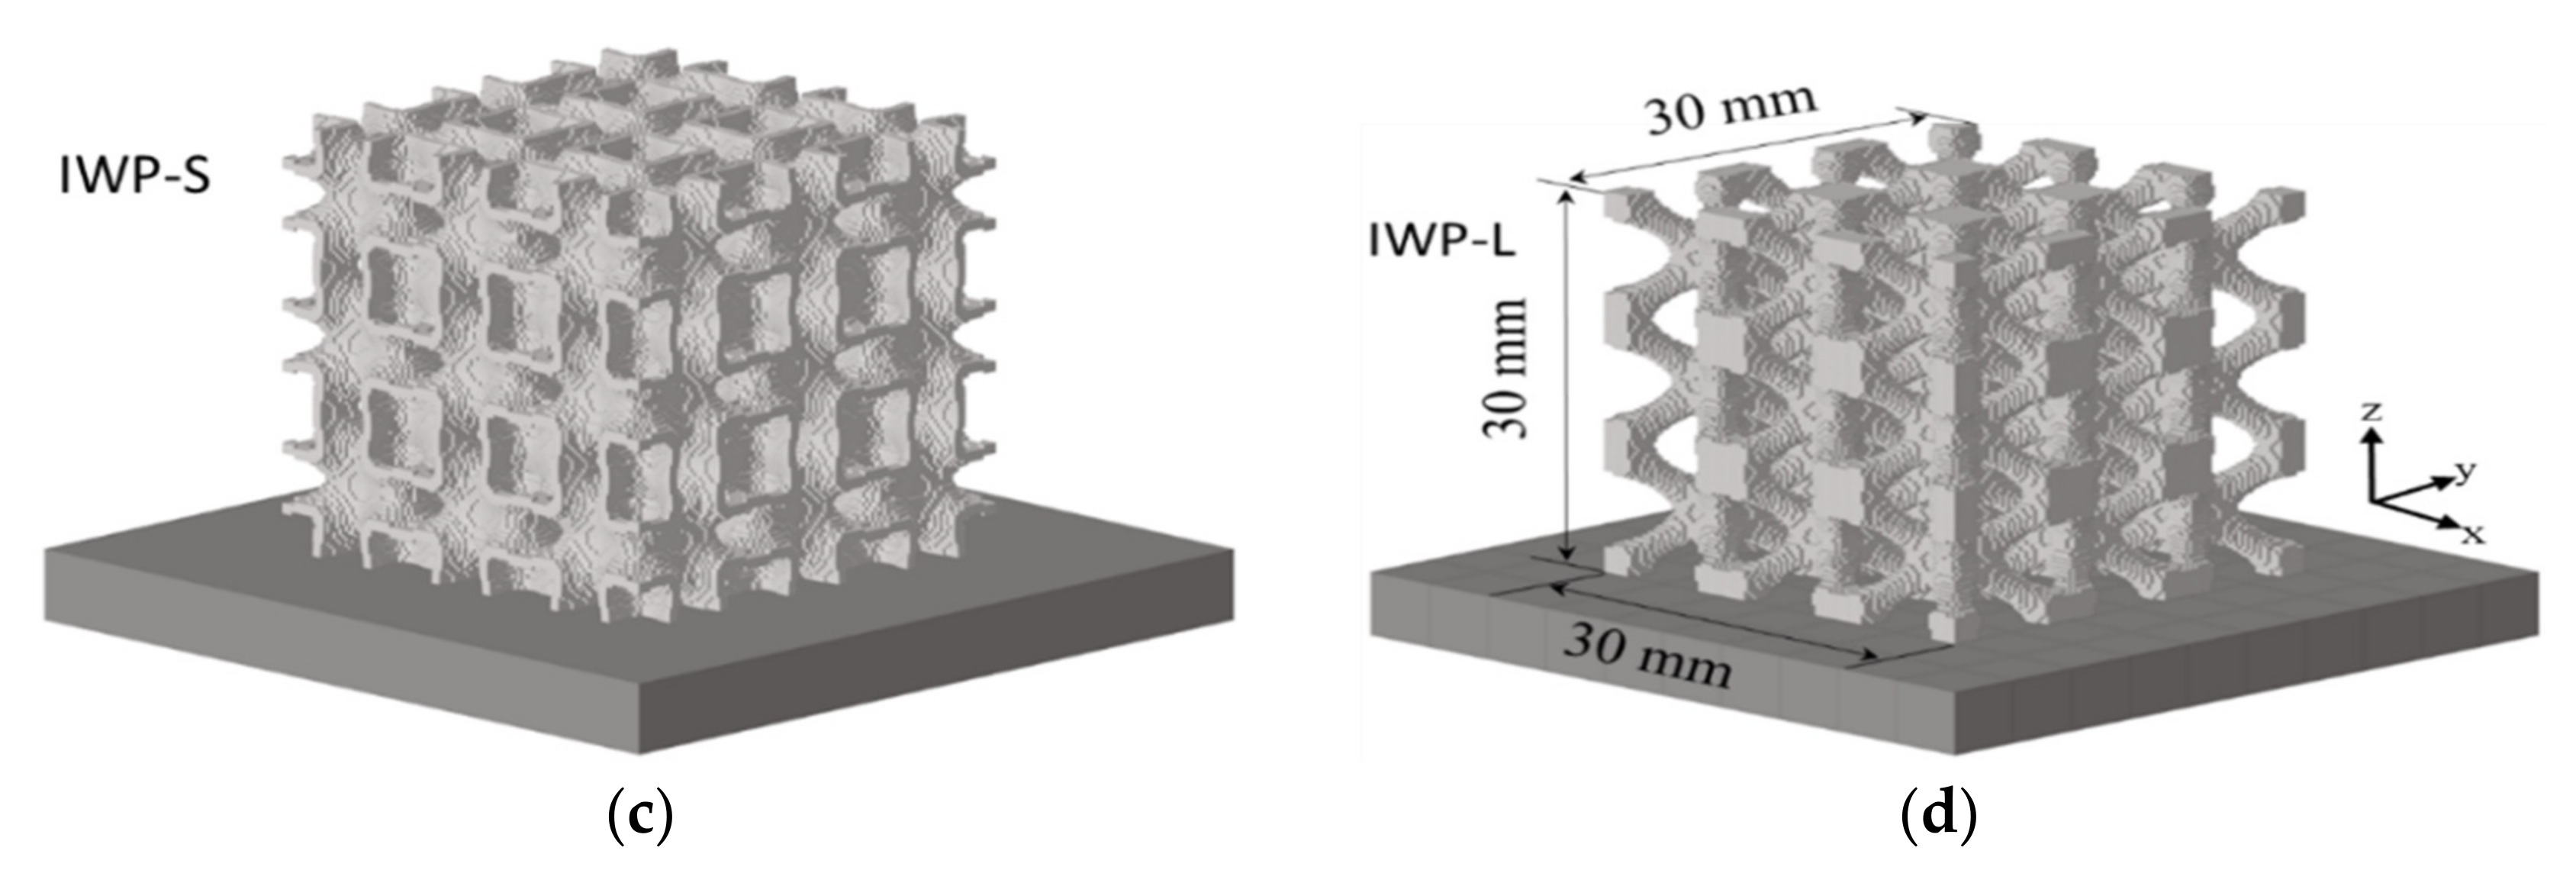
2.2. Design of Triply Periodic Minimum Surfaces (TPMS)

In TPMS structures, the mean curvature of a minimal surface is zero at every point and periodic in the three perpendicular directions. Table 2 provides the level-set approximations for the TPMS surfaces used in this work (P-S for Schwartz Primitive, G-S for Schoen Gyroid, and IWP for Schoen I-wrapped package) for generating the lattices in terms of local Cartesian coordinates, x, y, and z, and a specified level-set constant, c. A detailed design process for creating TPMS topologies was covered in the work by Al-Ketan and Abu Al-Rub [4]. Furthermore, Al-Ketan and Abu Al-Rub [34] developed a free software called MSLattice for generating TPMS-based lattices of either sheet-network type or ligament-network type. In sheet-network TPMS lattices, the level-set parameter c is set to zero such that the minimal surface splits the 3D space into two domains of equal volumes, and the relative density is varied through the thickening of the minimal surface, whereas, in ligament-network TPMS lattices, the level-set parameter c is used to control the proportion volumes of the two domains split by the minimal surface such that the smaller volume is solidified (e.g., for c = 0, the relative density is 50%). For this study, TPMS lattice structures shown in Figure 3 are investigated, where P-S, G-S, and IWP-S are sheet-based TPMS structures, while IWP-L is a ligament-based TPMS lattice. Three relative densities ( ρ ¯ = ρ/ρs) of values 10%, 20%, and 30% of the mentioned TPMS structure are considered for this study, where ρ is the apparent density of the lattice structure and ρs is the density of its base solid material. The 3 × 3 × 3 cell configuration is selected for this study based on the yield stress convergence studies performed using different cell configurations (e.g., 3 × 3 × 3, 4 × 4 × 4, 5 × 5 × 5, and 6 × 6 × 6) considered for the P-S ( ρ ¯ = 20 % ) lattice structure, with the method of evaluating yield strength as described in Section 2.4. As shown in Figure 4, the normalized yield stress value of different cell configurations is compared with that calculated from the equation by Lee et al. [28], which uses a unit cell P-S lattice structure with periodic boundary conditions and assumes the base material to be an isotropic solid with elastic modulus Es = 200 GPa, yield strength σs = 400 MPa, and Poisson’s ratio νs = 0.3. Although it is observed that a higher cell configuration of 6 × 6 × 6 gives a value closer to matching the results by Lee et al. [28], the time required to simulate such an AM build configuration will be very large and with only a marginal gain in accuracy. Hence, to reduce the overall computational time, the 3 × 3 × 3 cell configuration is used for simulating residual stresses of the TPMS structures as well as their effective mechanical properties, which is within a 2% agreement with the results in [28]. The TPMS lattices are designed using the MSLattice, Al-Ketan and Abu Al-Rub (Abu Dhabi, UAE) simulation tool [34].

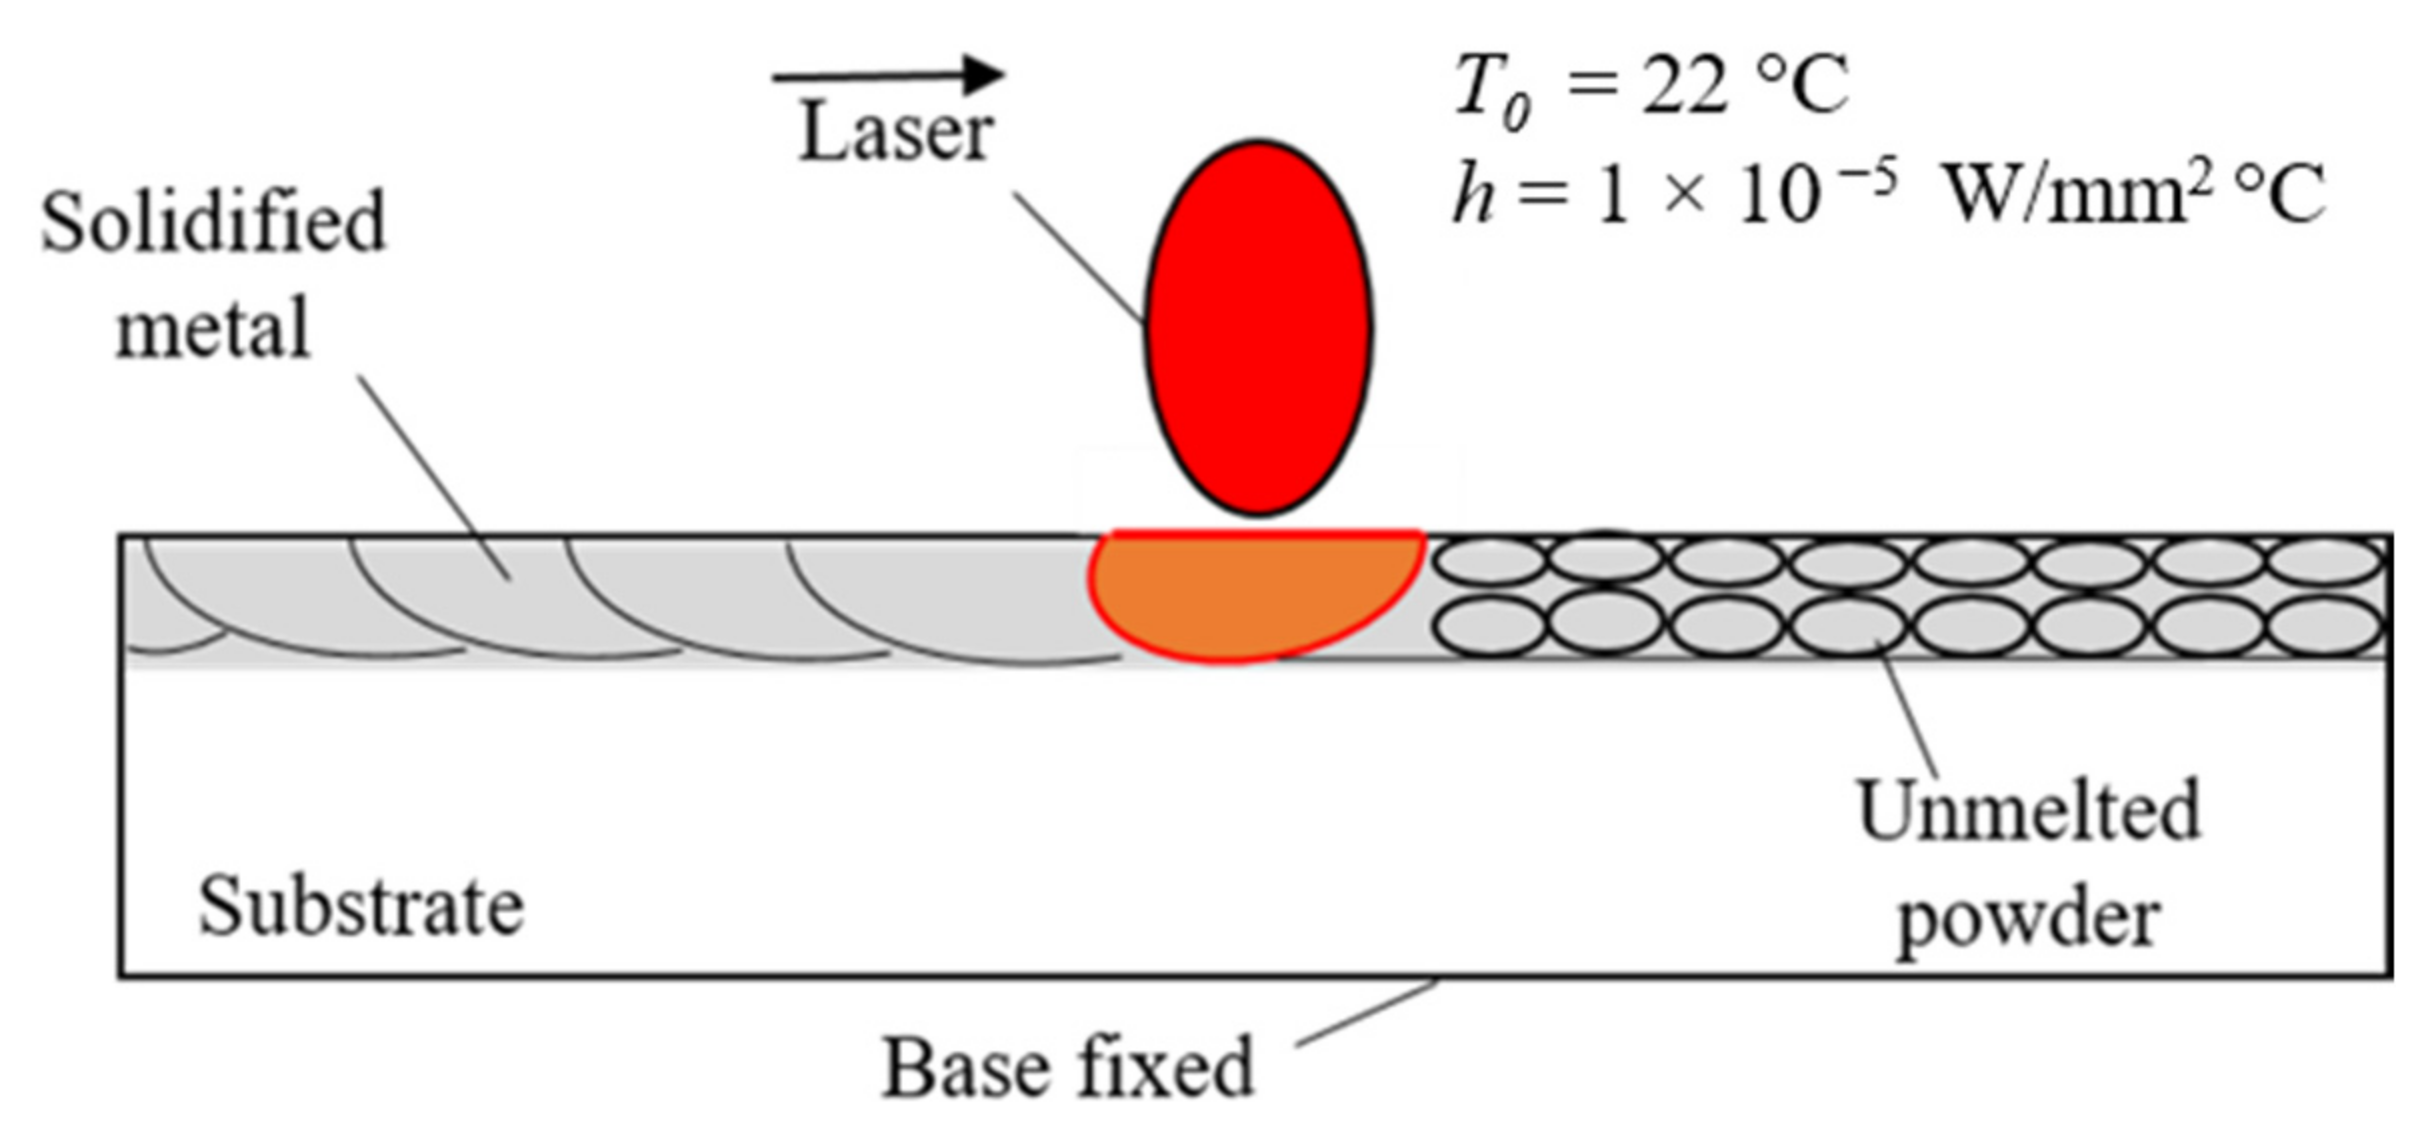
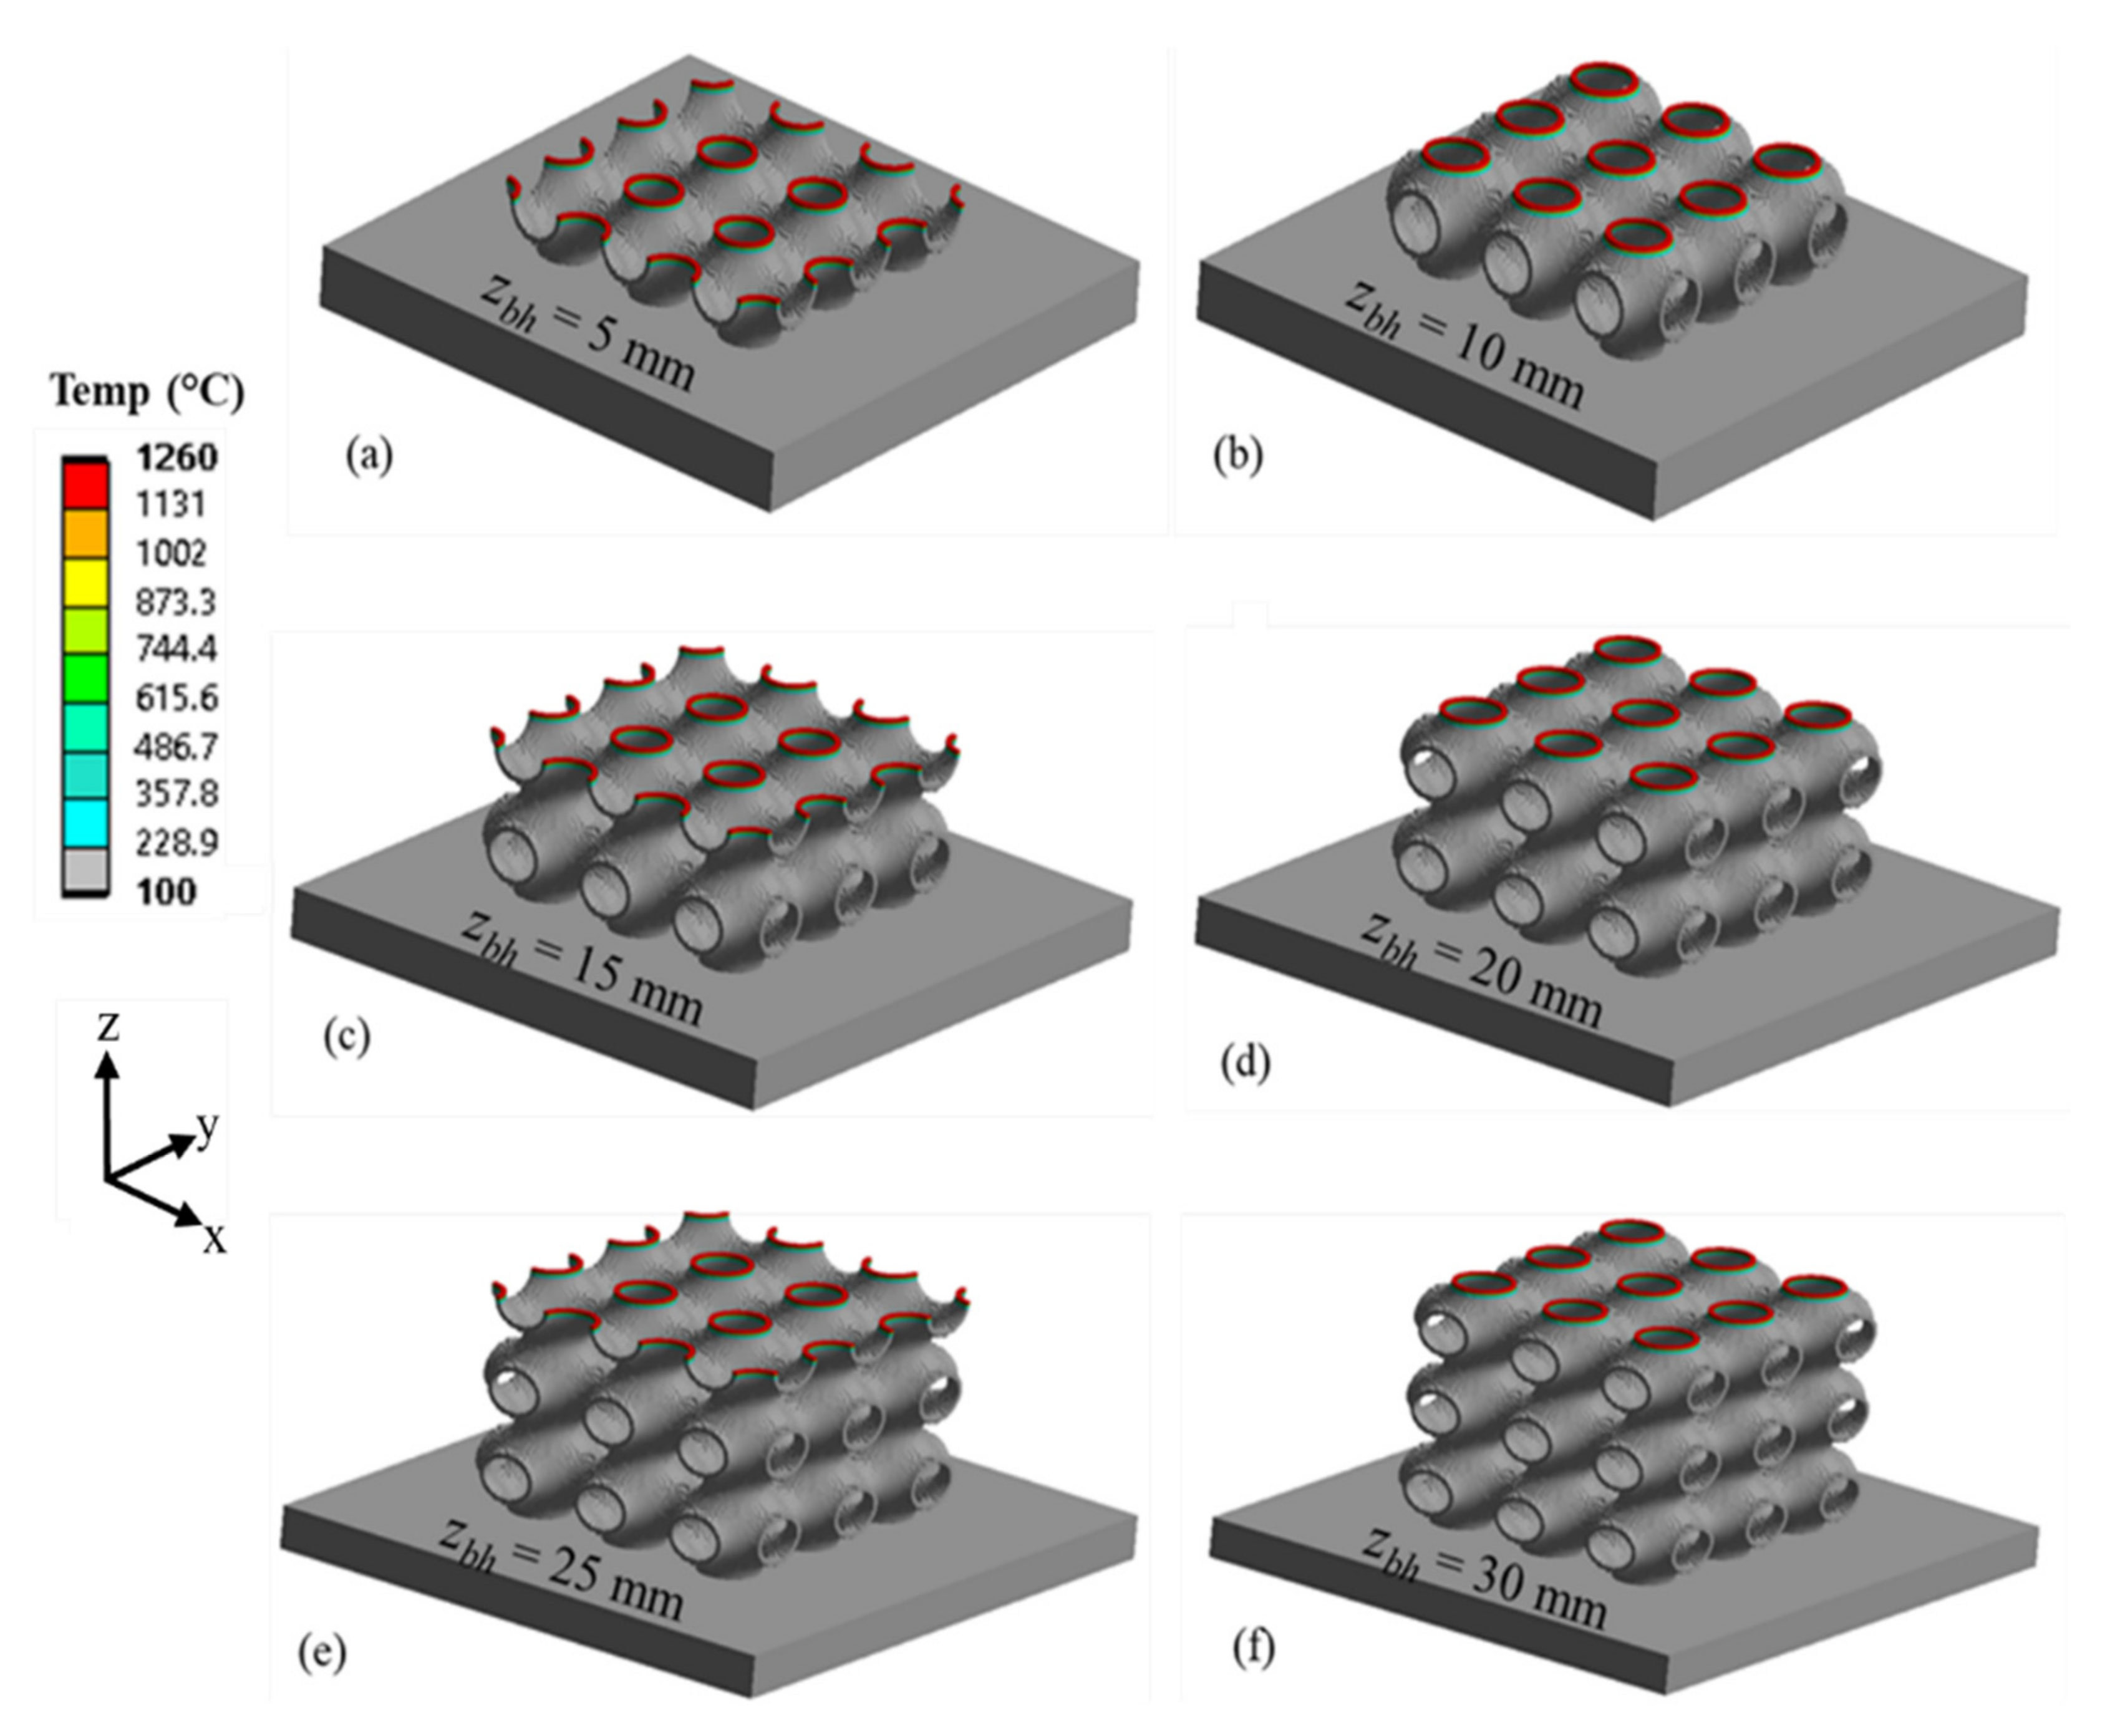
2.3. Residual Stress Simulation

A nonlinear transient thermal analysis of the layer-by-layer buildup of the process is first performed to obtain the temperature histories during the melting and solidification stages. This is followed by a transient elastic–plastic mechanical analysis, where the transient temperature profile from the transient thermal analysis is used as input in the mechanical model. Ansys-WB [33] provides the multiphysics capability for performing such sequentially coupled thermomechanical analysis. The internal residual stress formation occurs during the cyclic heating and cooling due to the layer-by-layer nature of the SLM process and continually evolves during the process. The residual stress profile throughout the part is attained after the final cooling phase to room temperature (e.g., 22 °C). The baseplate removal option available in the simulation tool [33] is performed and the final residual stress state of the build is used as the initial stress profile for evaluating the effective mechanical properties of the TPMS samples.
The processing parameters used for performing the TPMS AM build simulation with IN718 material are as follows: the laser scan speed is 1200 mm/s, the powder layer thickness is 40 µm, and the preheat temperature of the IN718 base plate is set to 100 °C and switches to room temperature during the cooling phase after completion of the build, where build supports are not considered for this study. The simulation is performed on the four TPMS topologies considering three different relative densities, e.g., ρ ¯ = 10%, 20%, and 30%. The AM simulation tool performs a thermal analysis followed by a quasi-static elastic–plastic mechanical analysis. The thermal analysis records the temperature histories of elements activated layer-wise using the element birth and death technique until completion of the build and cooling to room temperature; this layer-wise activation is illustrated in Figure 5, e.g., the first element layer (highlighted in purple) is activated for deposition while the rest of the element layers above represent the material to be deposited and are to be activated in subsequent stages. The thermal histories are then used as input for mechanical analysis to evaluate the stresses by layer-wise activation in a similar pattern as in the thermal analysis, and the stress state at the cooling of the build is calculated. As modeling every physical layer of deposition is computationally expensive and impractical, a simplified lumped-layer approach is used in which activation of each finite element layer accounts for the deposition of several layers of actual metal powder at once [33]. Incorporating this approach, the TPMS lattice is modeled with hexahedral elements (e.g., HEX8) with an element layer height of 0.4 mm as per the size range (i.e., 10~20 times the powder layer) [33]; thus, for this work, a total build height of 30 mm will have 75 element activation layers corresponding to 750 physical layers of actual metal powder, where the base plate (50 mm × 50 mm × 10 mm) uses a coarser mesh size of 5 mm. The meshed models for the four TPMS lattice structures are shown in Figure 6, pertaining to relative density ρ ¯ = 10%, with a total number of elements in the range of 250,000 to 600,000 for different relative densities of the TPMS lattice.
The various stages of build formation during the thermal analysis are consolidated and shown in Figure 7a–f pertaining to the P-S lattice structure ( ρ ¯ = 10%) through the built stage, e.g., build height zbh. The thermal analysis terminates after the cooling phase when the part cools to room temperature (22 °C). Similarly, layer-by-layer simulation is performed during transient structural analysis using temperature histories, and the final vector principal stress on the nodes is grouped and exported to be used as an input as pre-stress to evaluate the mechanical properties during tensile and compression loading simulation.

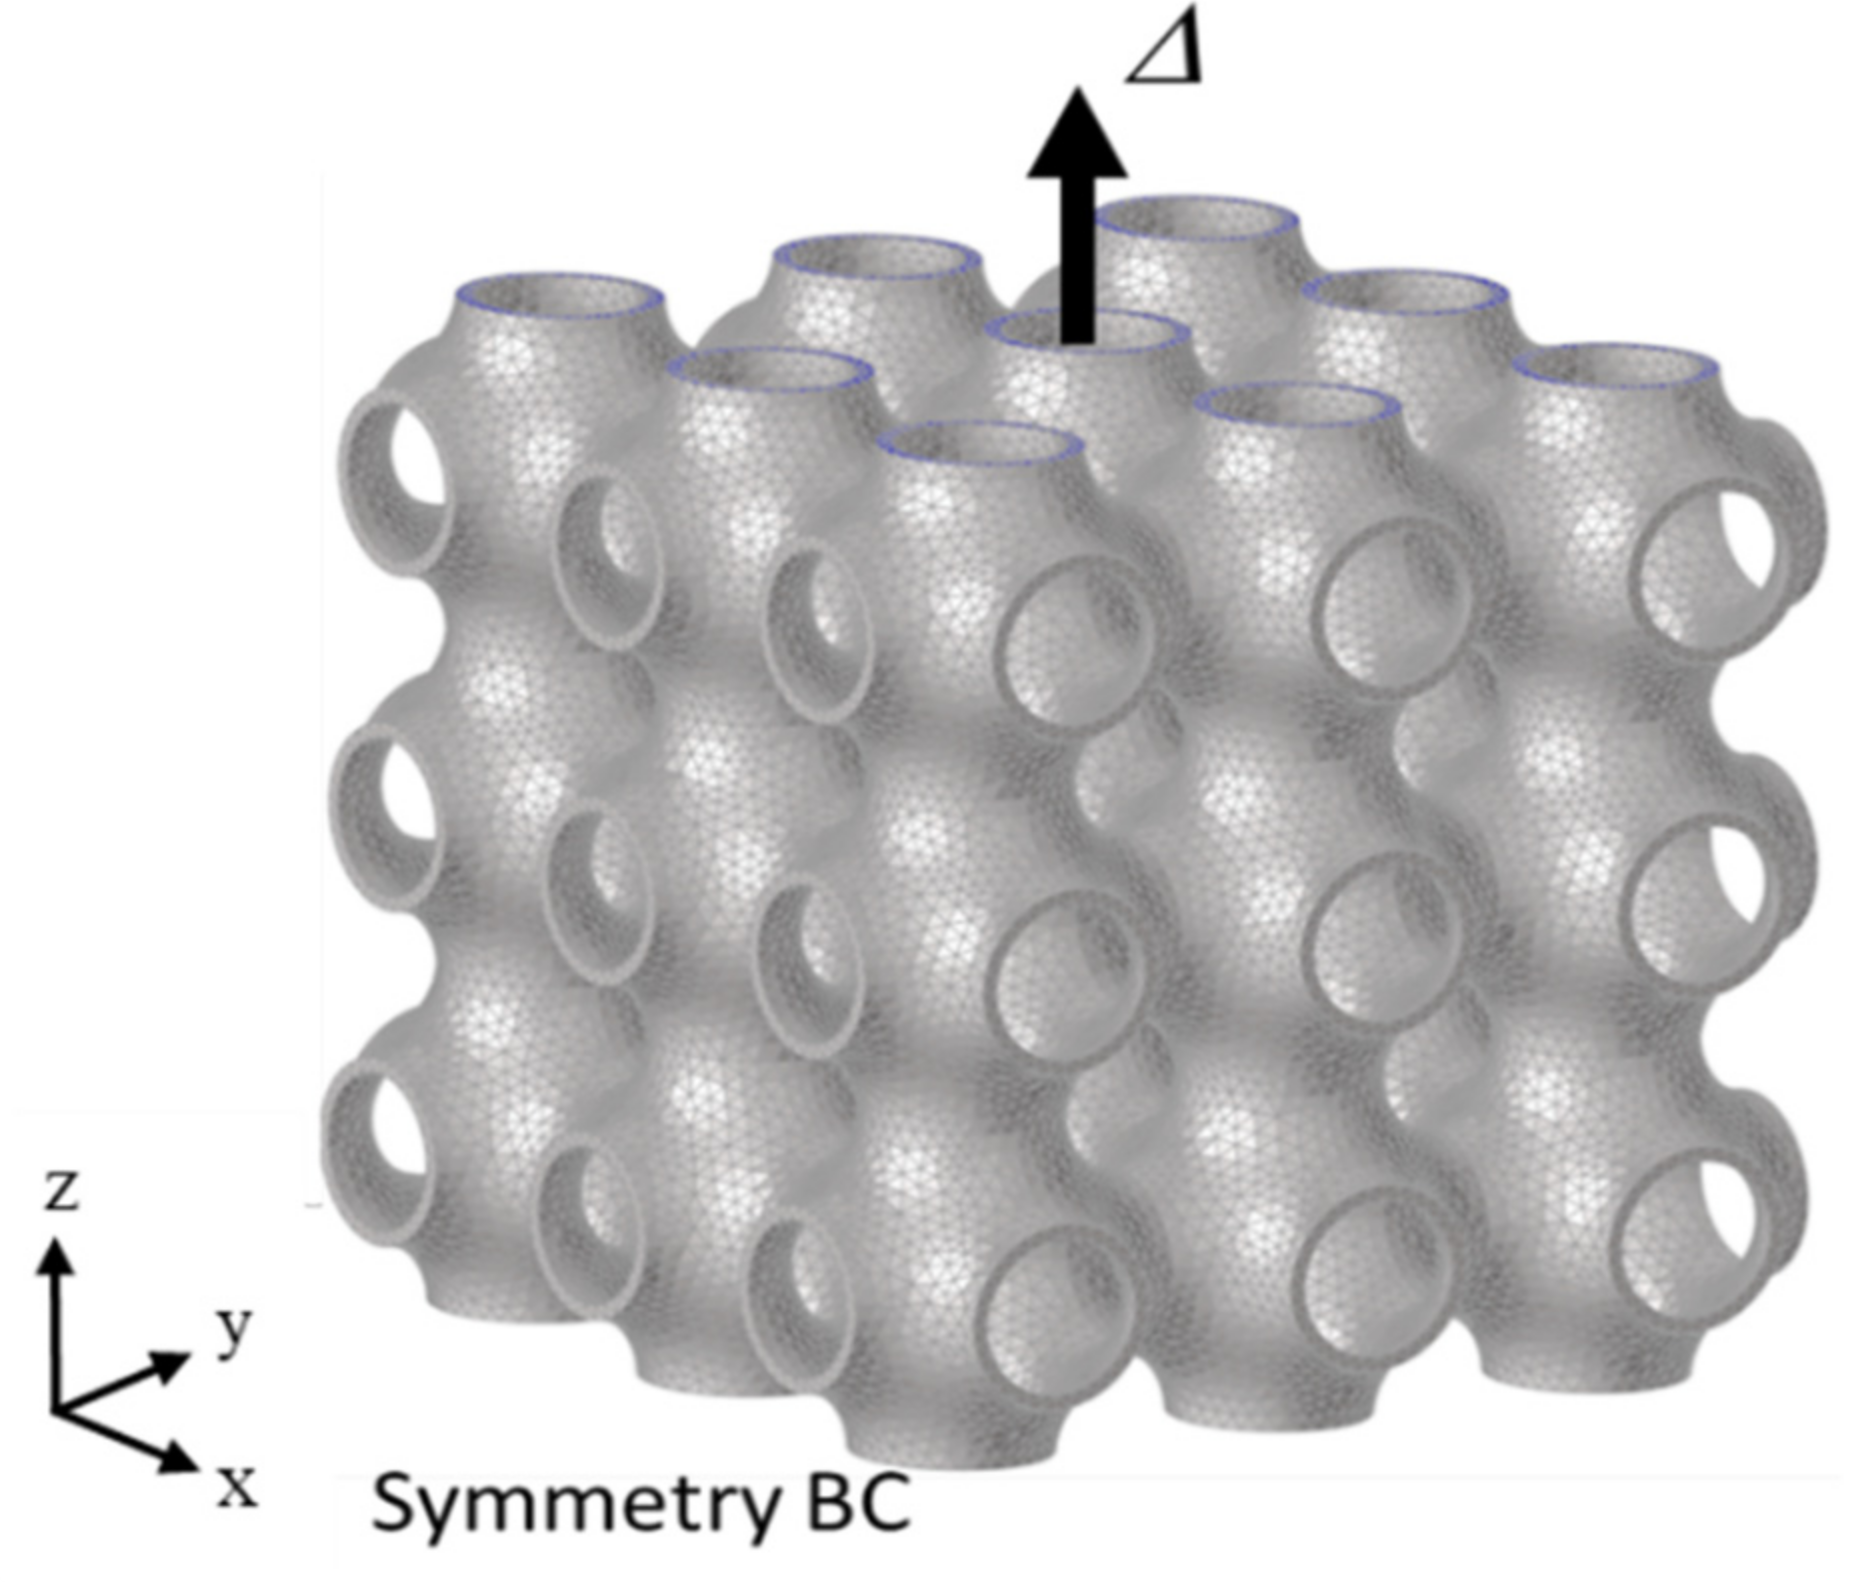
2.4. Mechanical Simulation

The final stress state evaluated from the AM simulation is imported as the initial residual stresses field for investigating the mechanical properties of the corresponding TPMS lattices under tensile and compressive loading. The mechanical properties of the TPMS are determined considering uniaxial tensile and compression loading in the build direction (z-direction). The finite element model uses a tetrahedral element with a mesh size of 0.25 mm from mesh convergence studies performed for estimating the yield strength of the configuration of the P-S ( ρ ¯ = 20%) lattice structure, and a bilinear elastic-plastic material model with linear plastic hardening is used for all mechanical simulations. Figure 8 shows the representation of the tensile and compression loading case and symmetric boundary conditions in the z-direction applied on the base plane for a P-S lattice structure. In the mechanical simulation, all six components of the stress tensor are mapped onto the nodes of the FE model as initial conditions. A displacement load in the z-direction is applied to the top surface of the lattice, with a magnitude of Δ = ±3 mm in tension or compression, respectively, which corresponds to a total normal average strain of 10%. This is applied via a remote reference point coupled to the top built surface [33]. The reaction force at the remote node is monitored to obtain the uniaxial stress–strain response during the loading of the TPMS lattices, where the uniaxial stress is defined as the ratio between the reaction force and the area of the TPMS lattice (30 mm × 30 mm). The yield strength is determined from the stress–strain response through the 0.2% offset strain method, whereas the elastic modulus in tension and compression is evaluated from the slope of the stress–strain curves in the elastic region. The uniaxial tensile and compression loading simulations are also performed incorporating the effect of the full-field residual stress profile imported from the AM simulation (c.f., Figure 10) and the results are compared with the case without residual stresses as the initial condition for all the TPMS lattices and relative densities.

3. Results and Discussion

To verify the modeling framework proposed herein and the residual stress results, the current simulation approach of layer-wise activation described in Section 2.3 is compared with a case of experimentally measured residual stress by An et al. [35] on a curved thin-walled plate, for which the details are presented in Appendix A.
For the TPMS lattice structures and for their three relative densities, the evolution of stresses for the total build height of the samples is shown in Figure 9. The stress is calculated by determining the reaction force of the constrained base nodes in the build direction (z-direction) over its projected base area (30 mm × 30 mm). This provides a measure of the level of the stress in the build direction, which, as can be seen in Figure 9, is compressive in nature during the build-up stage, with an increase in magnitude as the relative density increases. The stress level during the build-up stage is observed to be higher in G-S and IWP-S lattice structures as compared to P-S and IWP-L for the same densities. In Figure 10, which shows the Von Mises residual stress contours for all TPMS lattices at relative density ρ ¯ =10%, the color contours are unified and used within the same limits for comparison purposes. As evident, the residual stress profiles differ for each TPMS, and hence, its effect on the effective mechanical properties will vary for each topology. It is also interesting to note that the residual stresses are nonuniformly distributed through the printing z-direction. The predicted stress values are higher in magnitudes than the initial yield stress of the material (e.g., 648 MPa). This is expected as the finite element model used in the current study does not consider the convective heat transfers in the molten pool; hence, computed peak temperatures and temperature gradients are slightly overestimated and consequently higher residual stress values are determined [36].

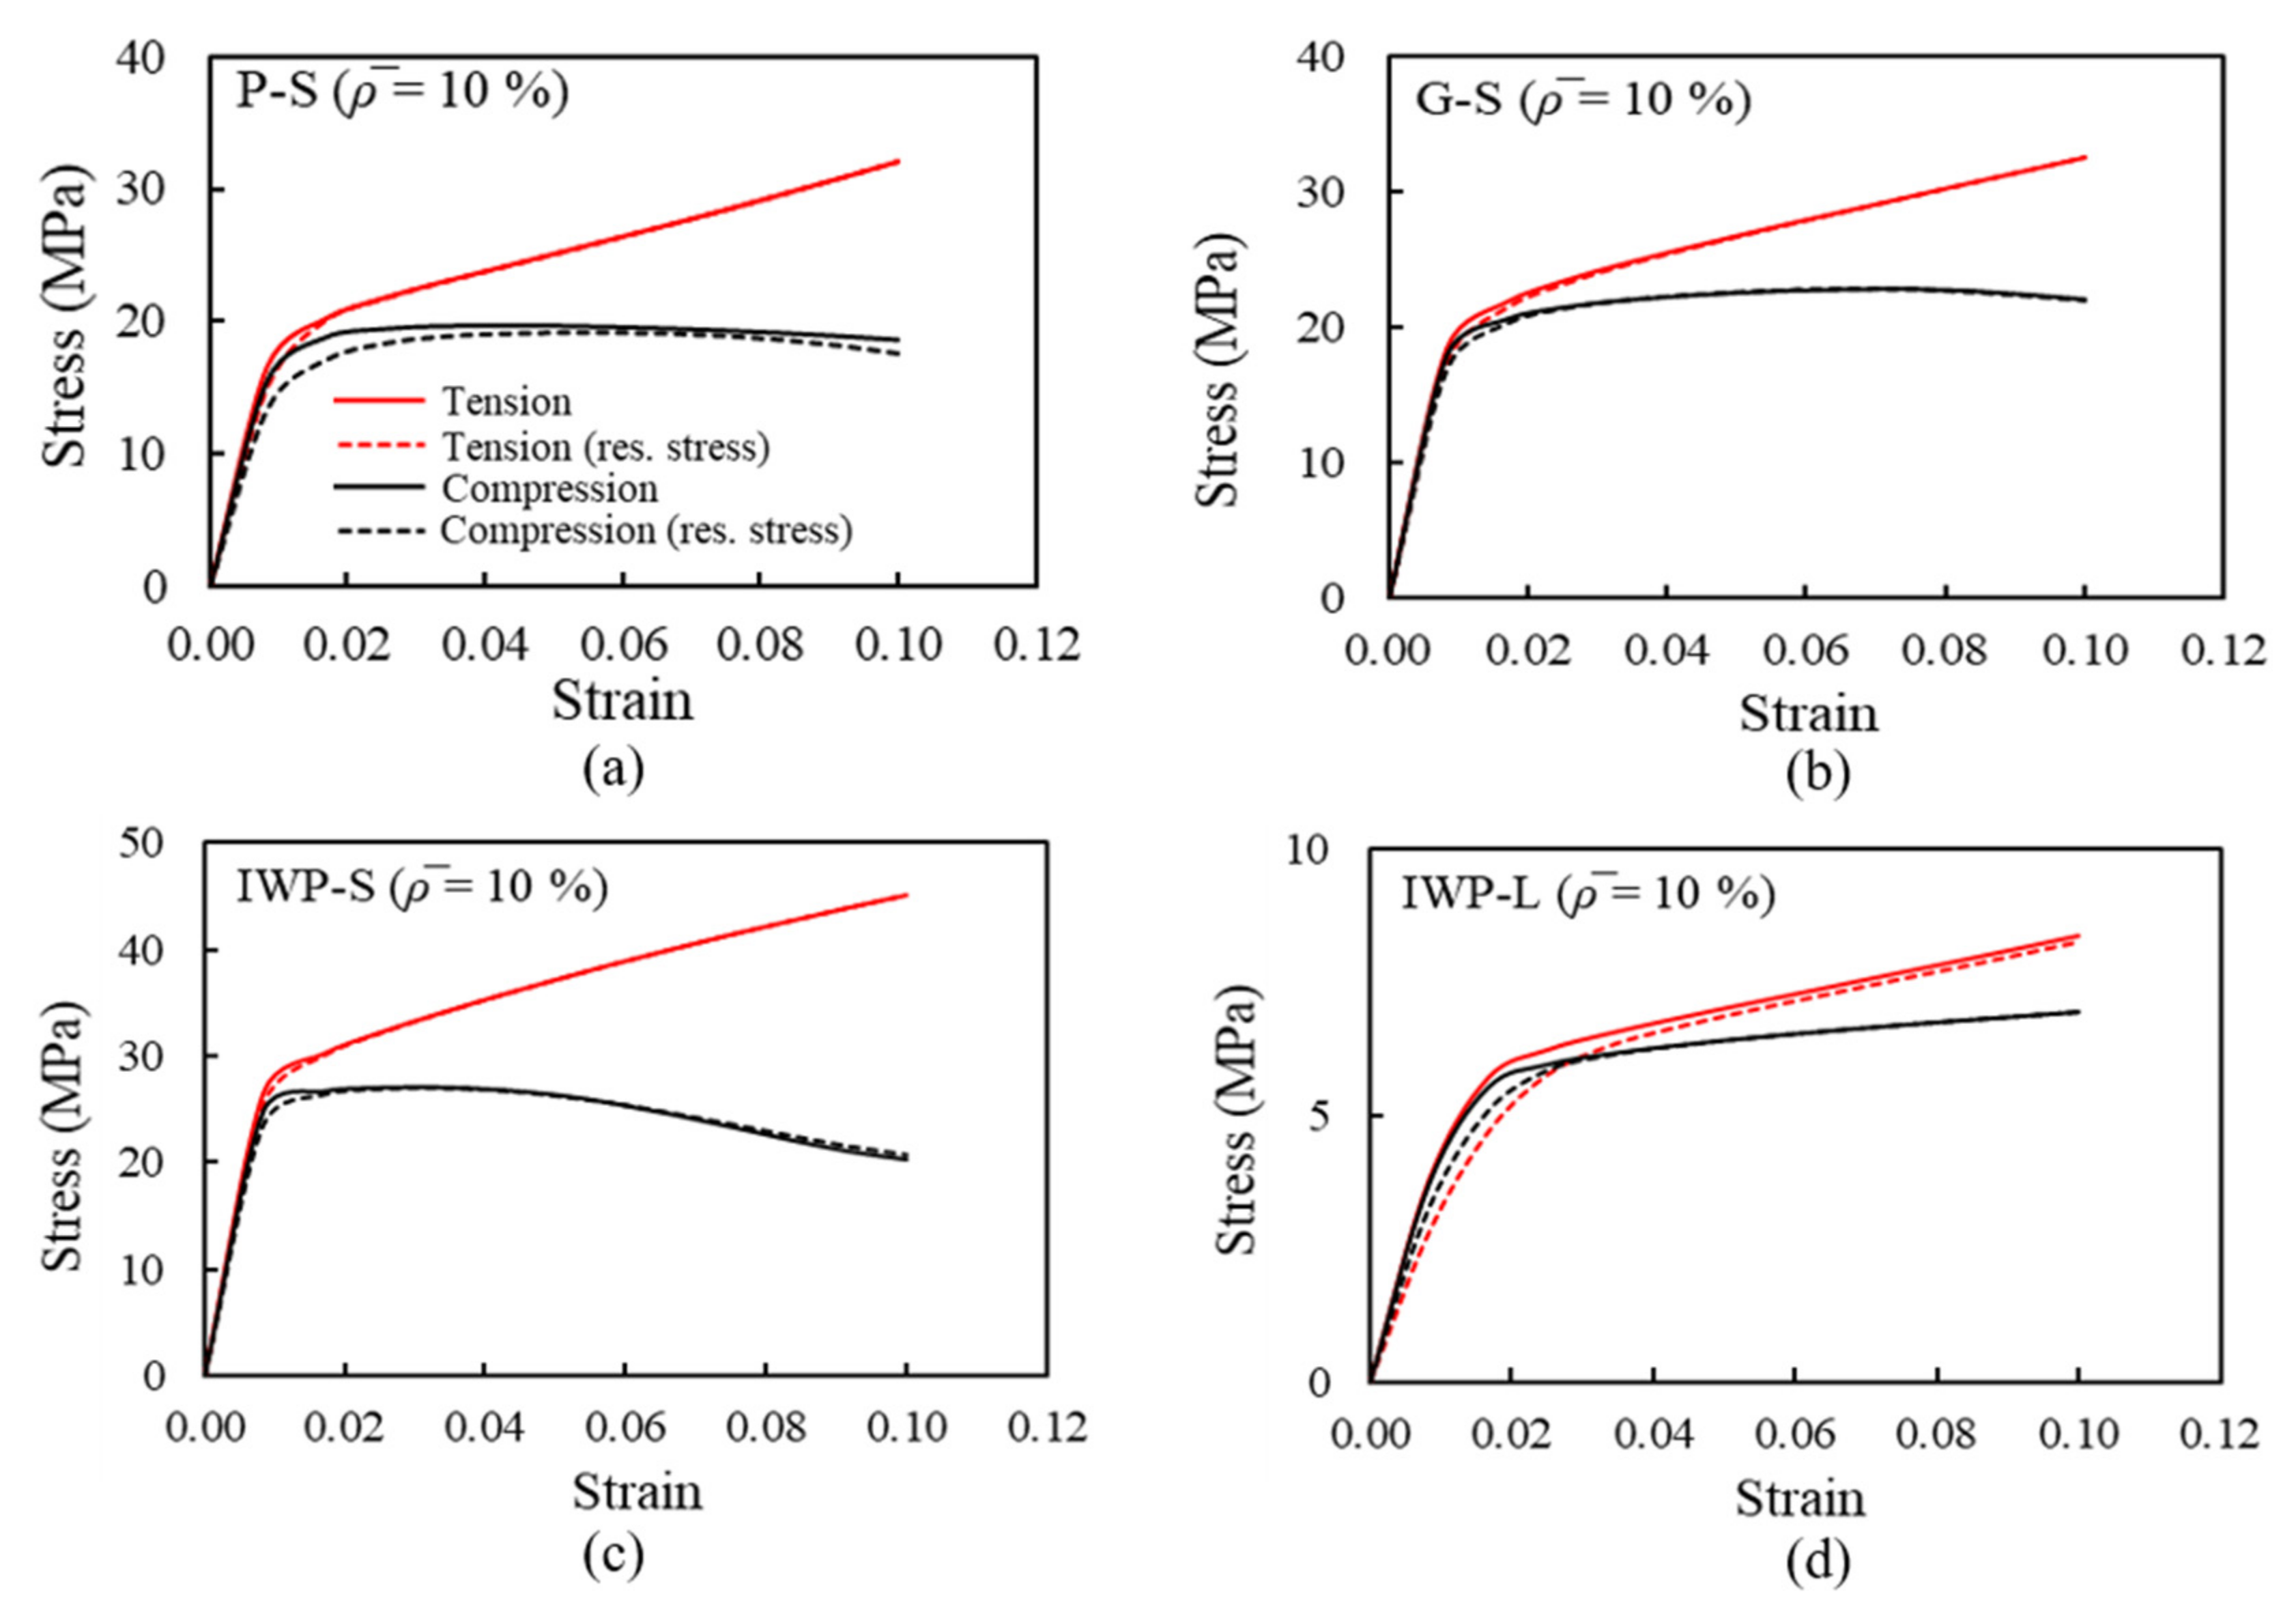
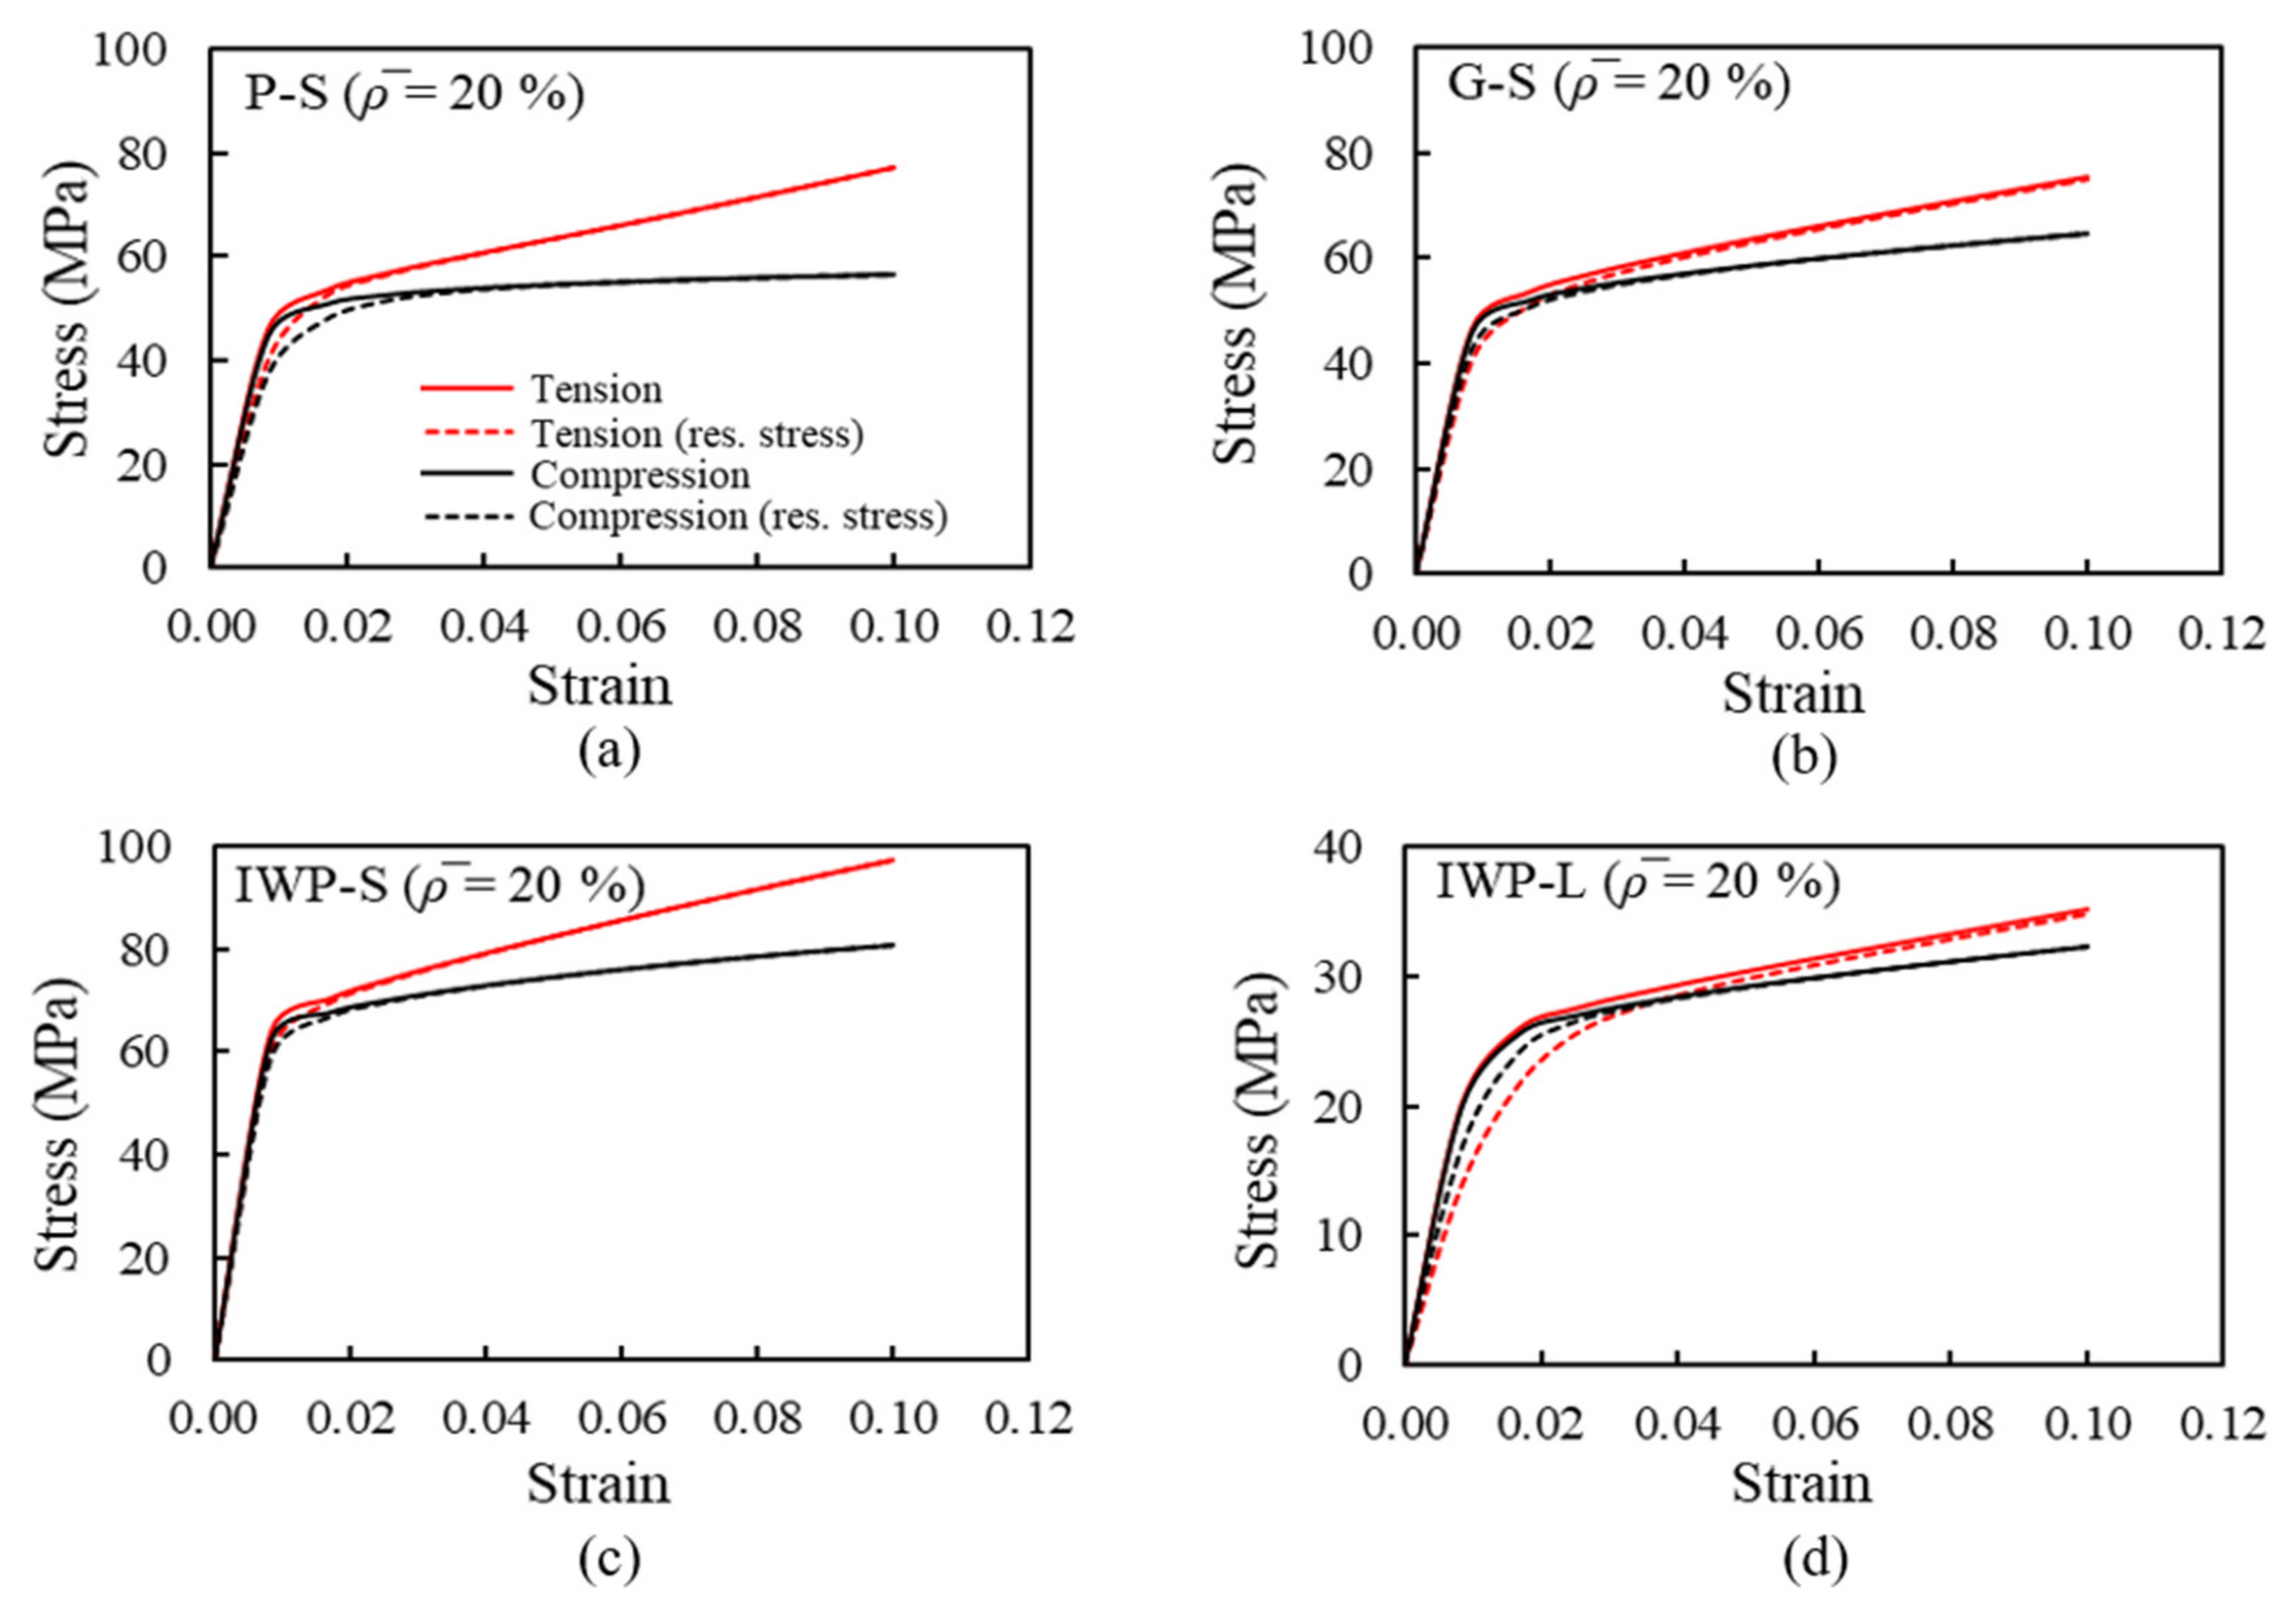
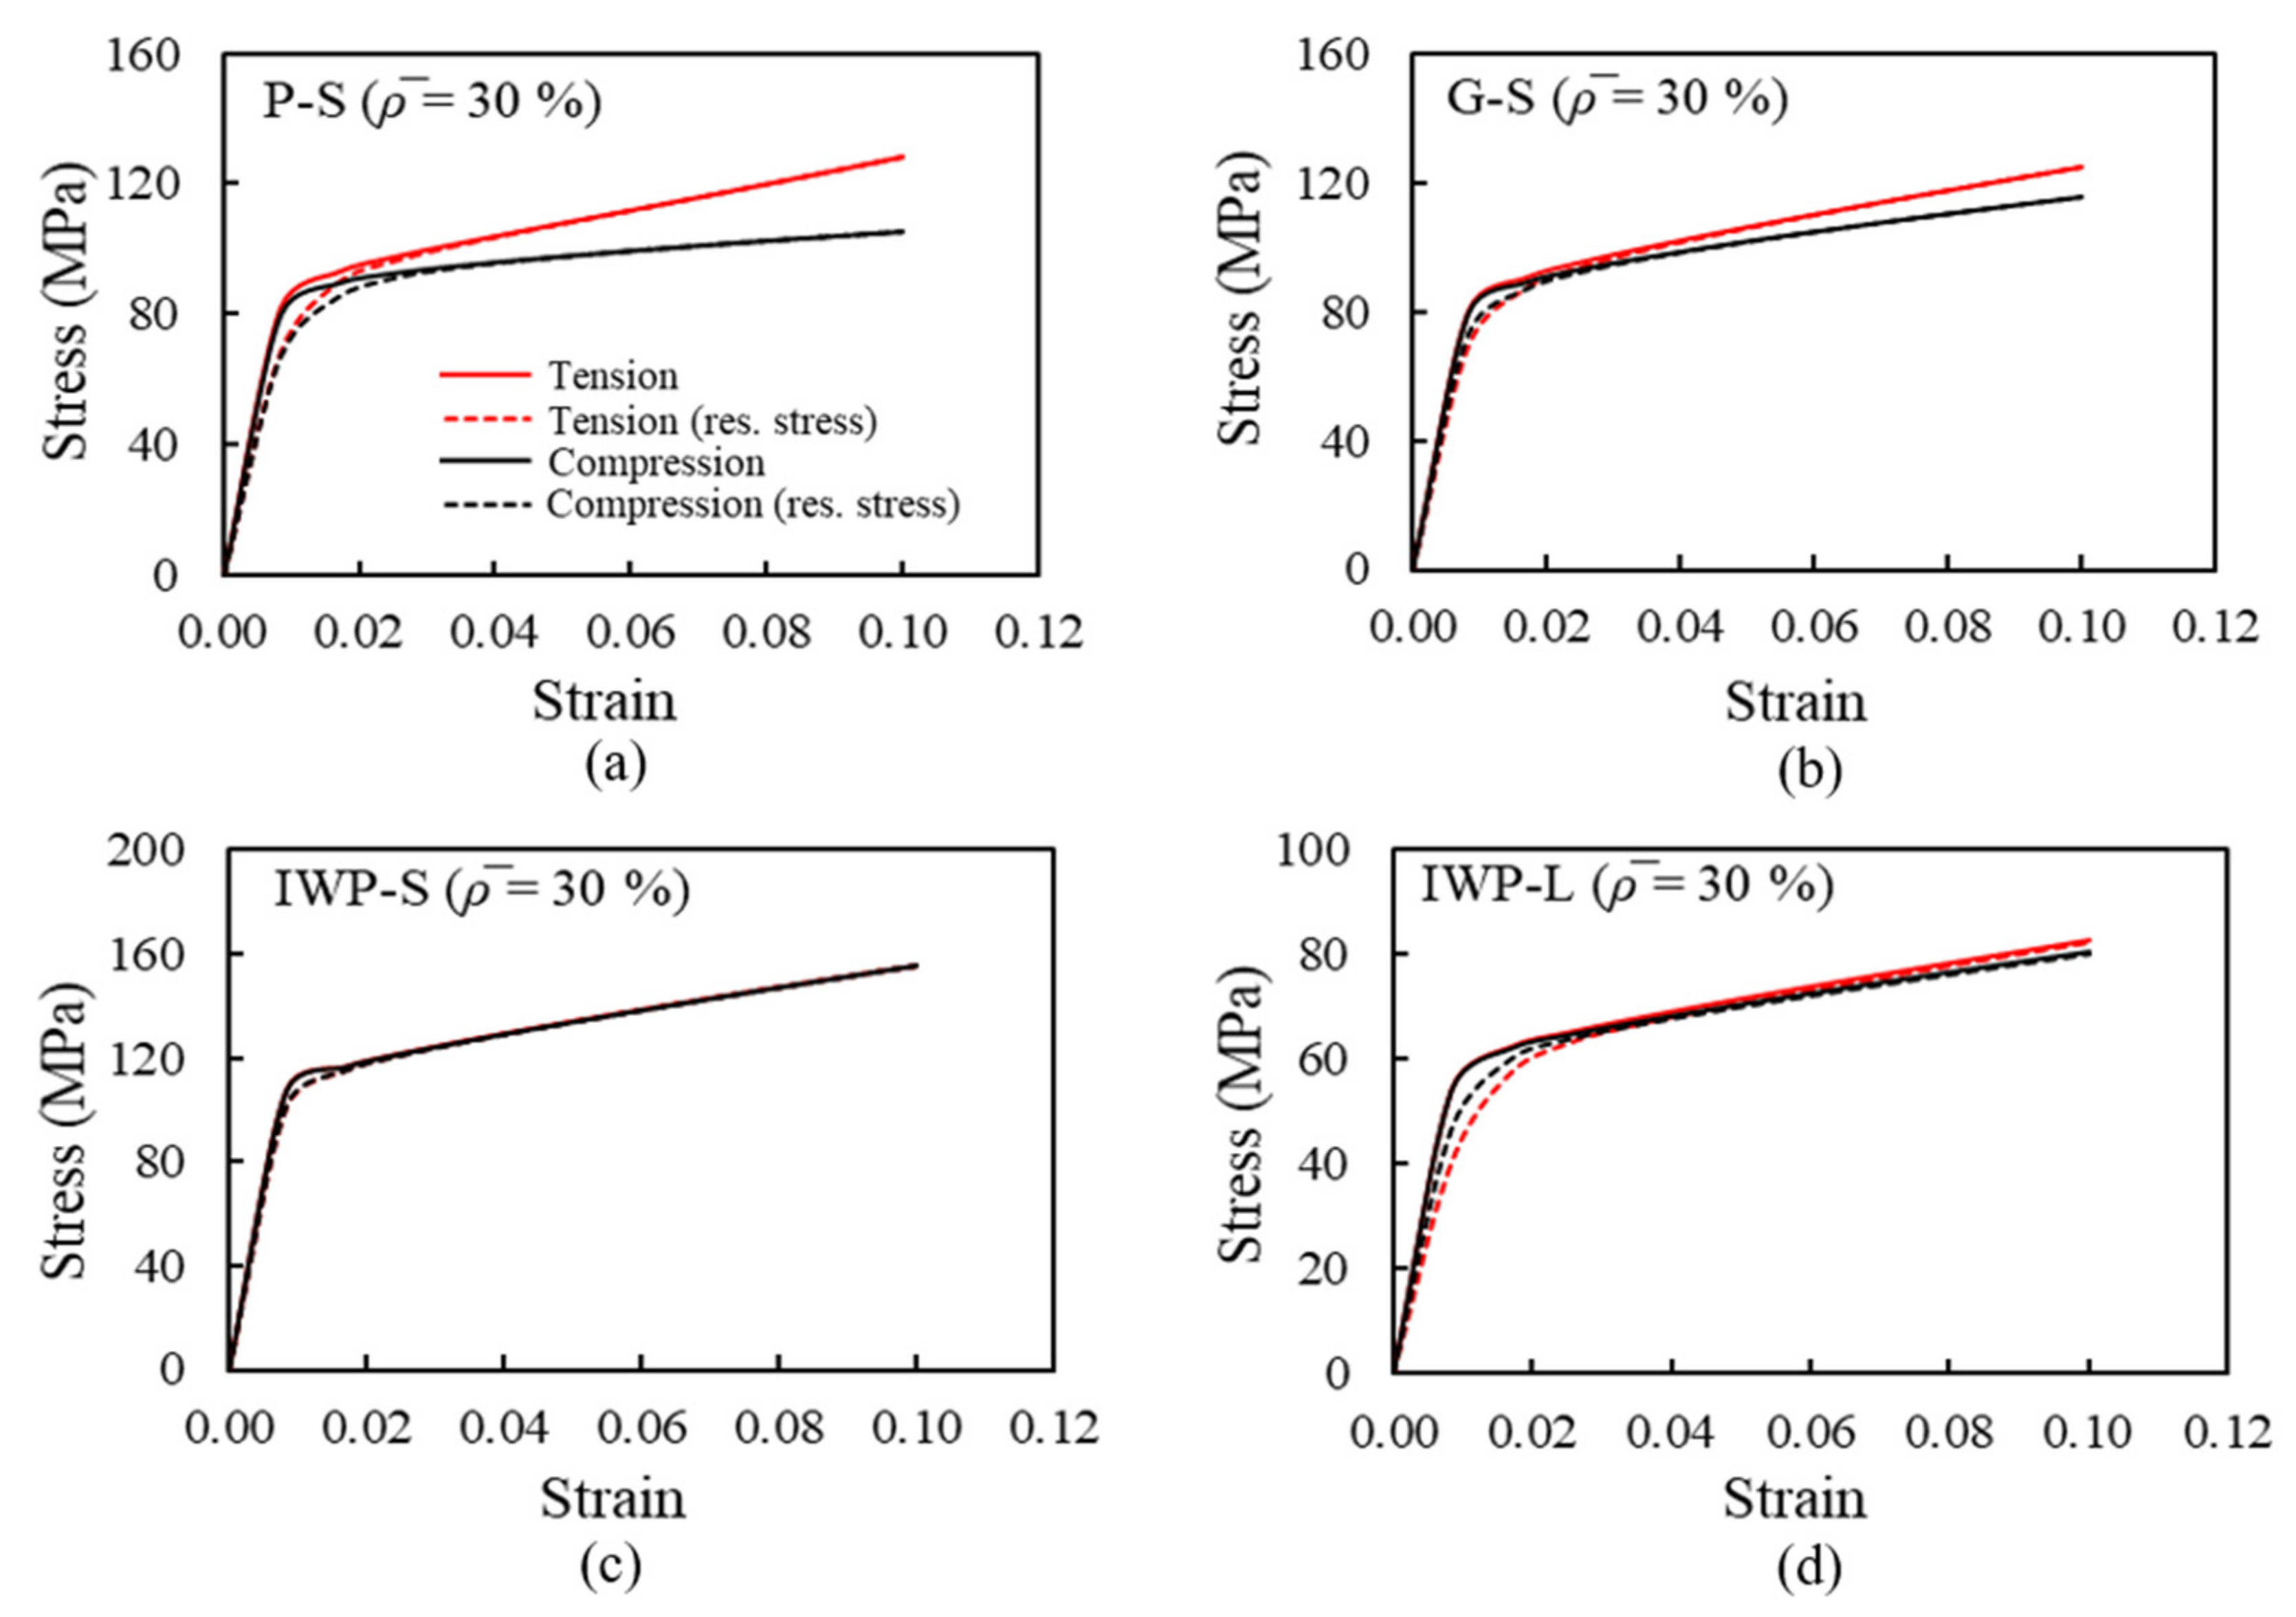
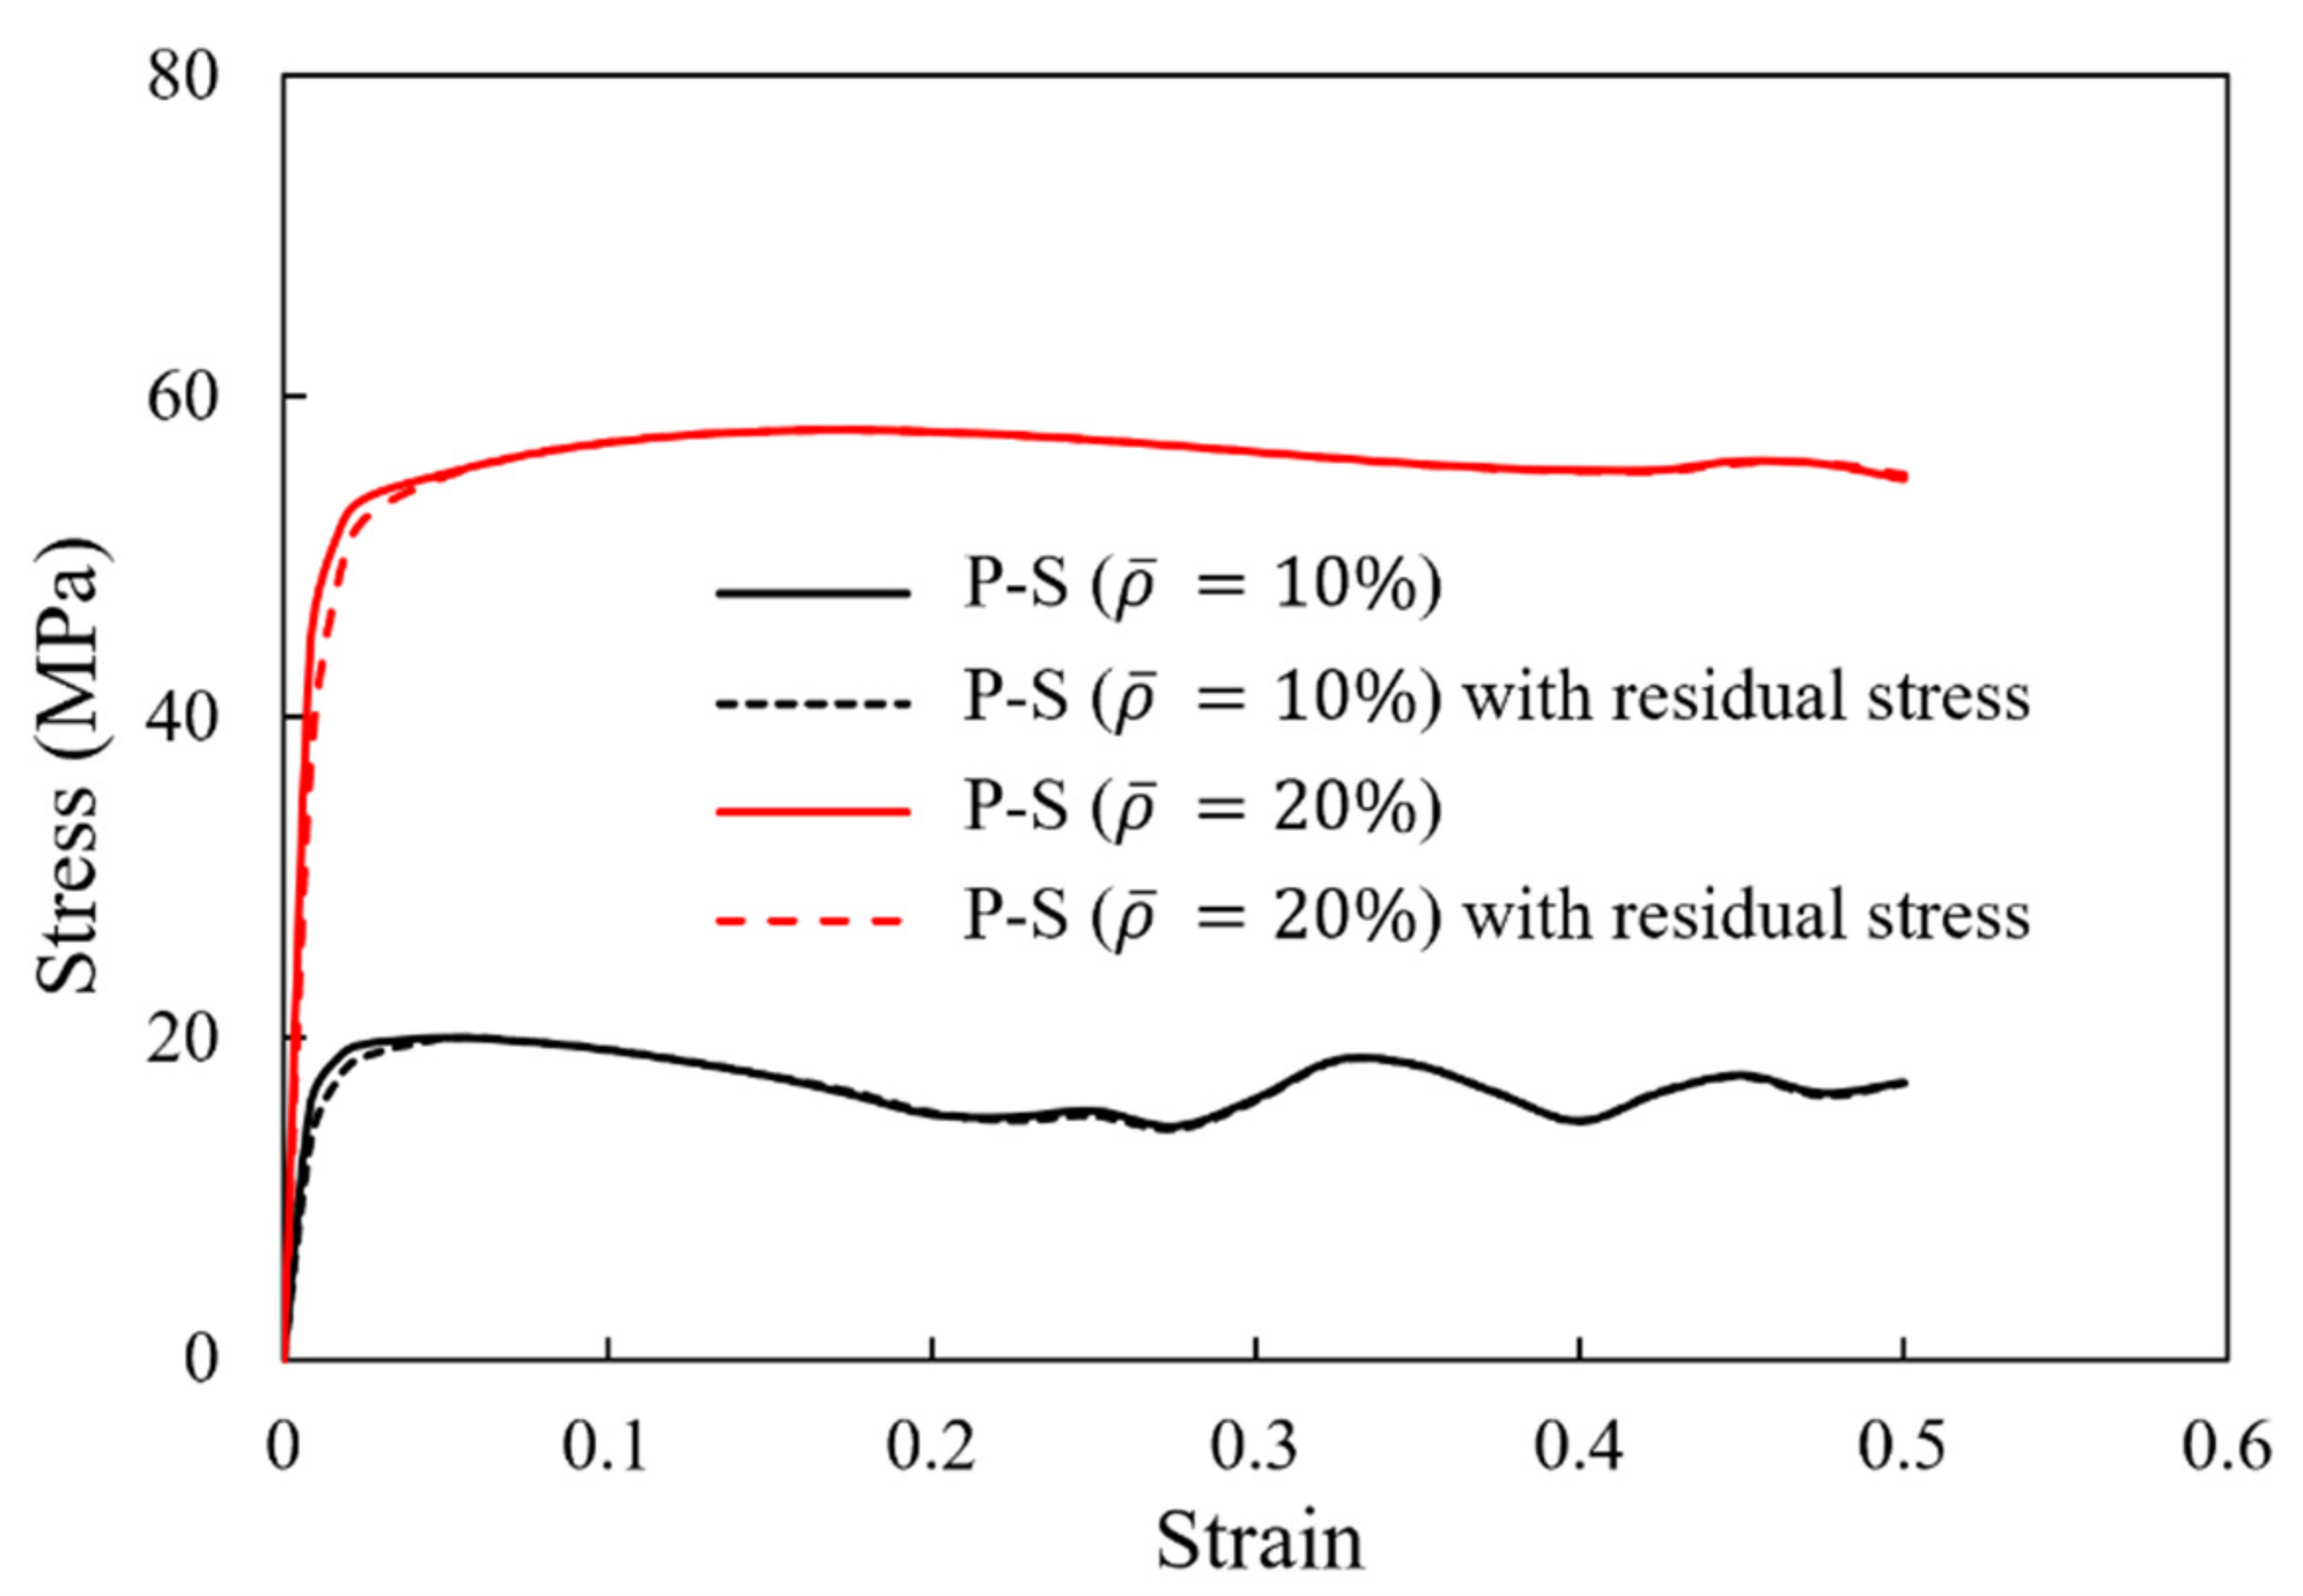
3.1. Stress–Strain Curves

The uniaxial tensile and compression stress–strain curves for all four TPMS lattices and the three relative densities considered are shown in Figure 11, Figure 12 and Figure 13, both for the cases with and without the incorporation of residual stress effects from the AM process. As can be seen for P-S in Figure 11a, Figure 12a and Figure 13a, the effect of the residual stress on both stiffness and onset of yielding is notable, especially under compression loading. This is attributed to the high level of residual stresses present in the P-S topology, as shown in Figure 10a, as compared to the G-S and IWP-S in Figure 10b,c, respectively. A similar trend in the influence of the residual stresses on the mechanical response can be observed in Figure 12d and Figure 13d for IWP-L, which is also attributed to the level of residual stresses associated with the IWP-L topology, as shown in Figure 10d. For all the sheet-based TPMS topologies, e.g., P-S, G-S, and IWP-S, subjected to compression loading, e.g., Figure 11a–c, softening is observed beyond the point of onset of yielding, especially for ρ ¯ =10%, which is associated with localized deformation and buckling of the TPMS walls. This trend diminishes as ρ ¯ increases; however, the difference in mechanical response between the compression and tension loading persists for all ρ ¯ . At large deformations, e.g., strain values larger than 2%, it is observed that the mechanical response of all the TPMS topologies and for all relative densities is not affected by the presence of residual stress, neither for compression nor tension loading.

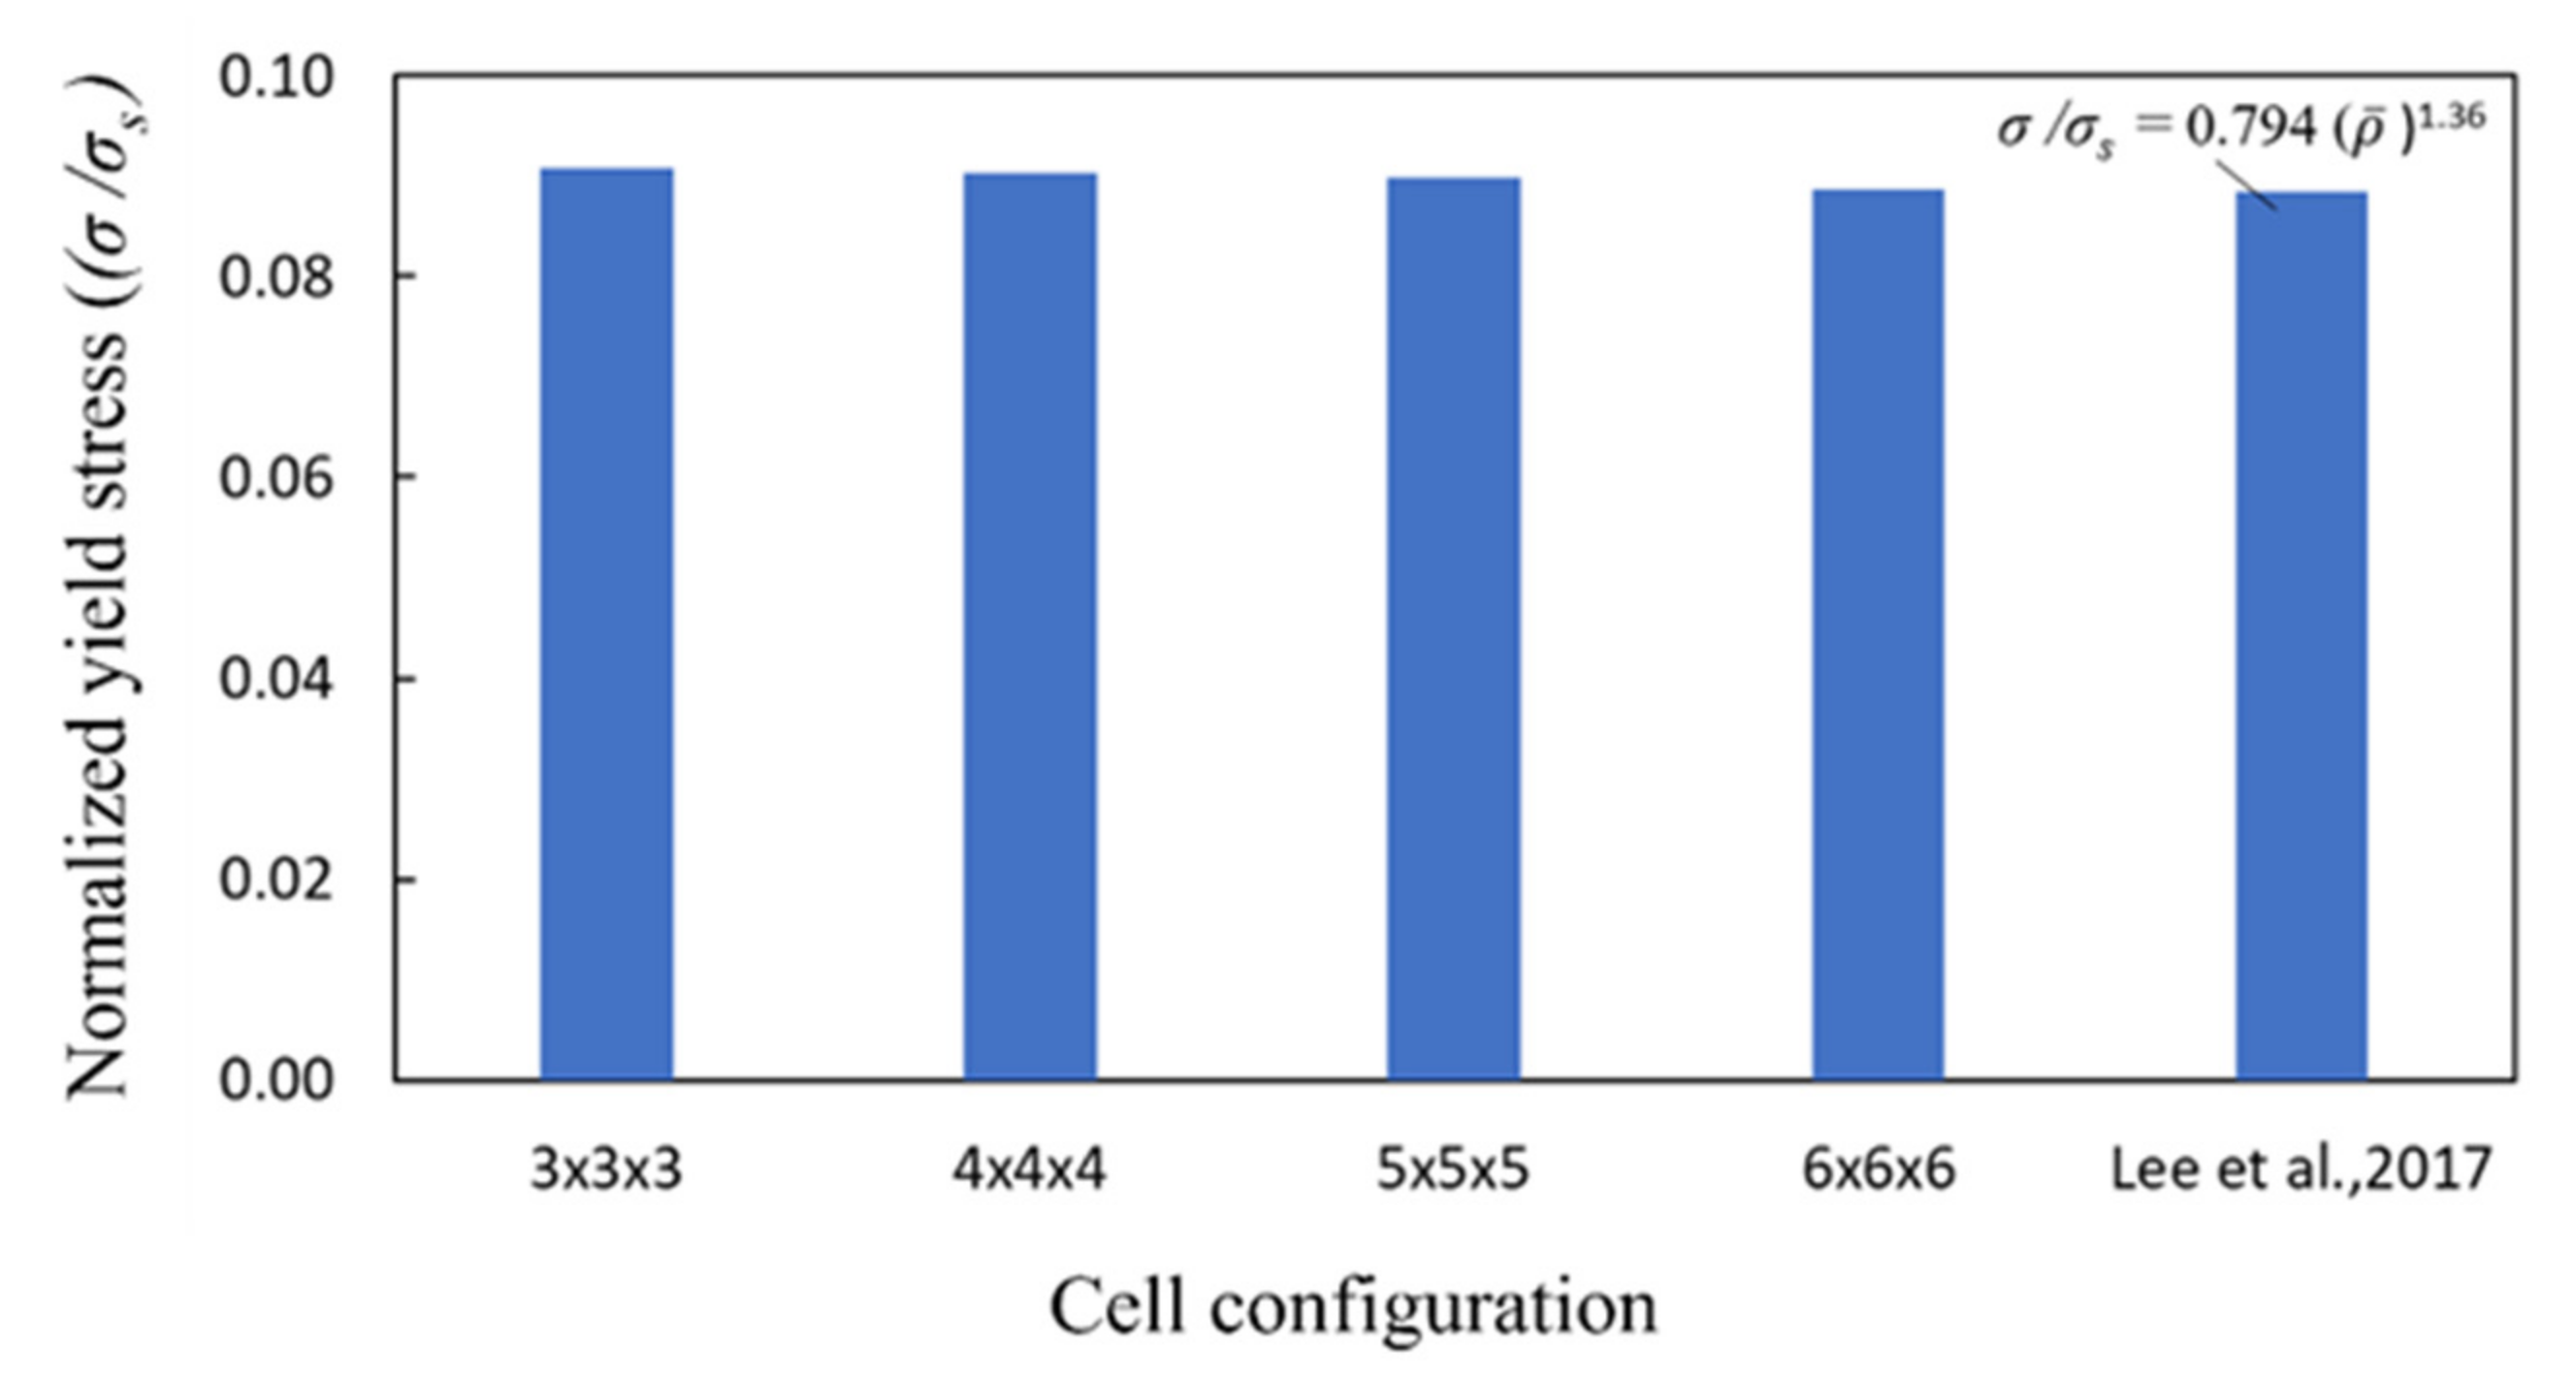
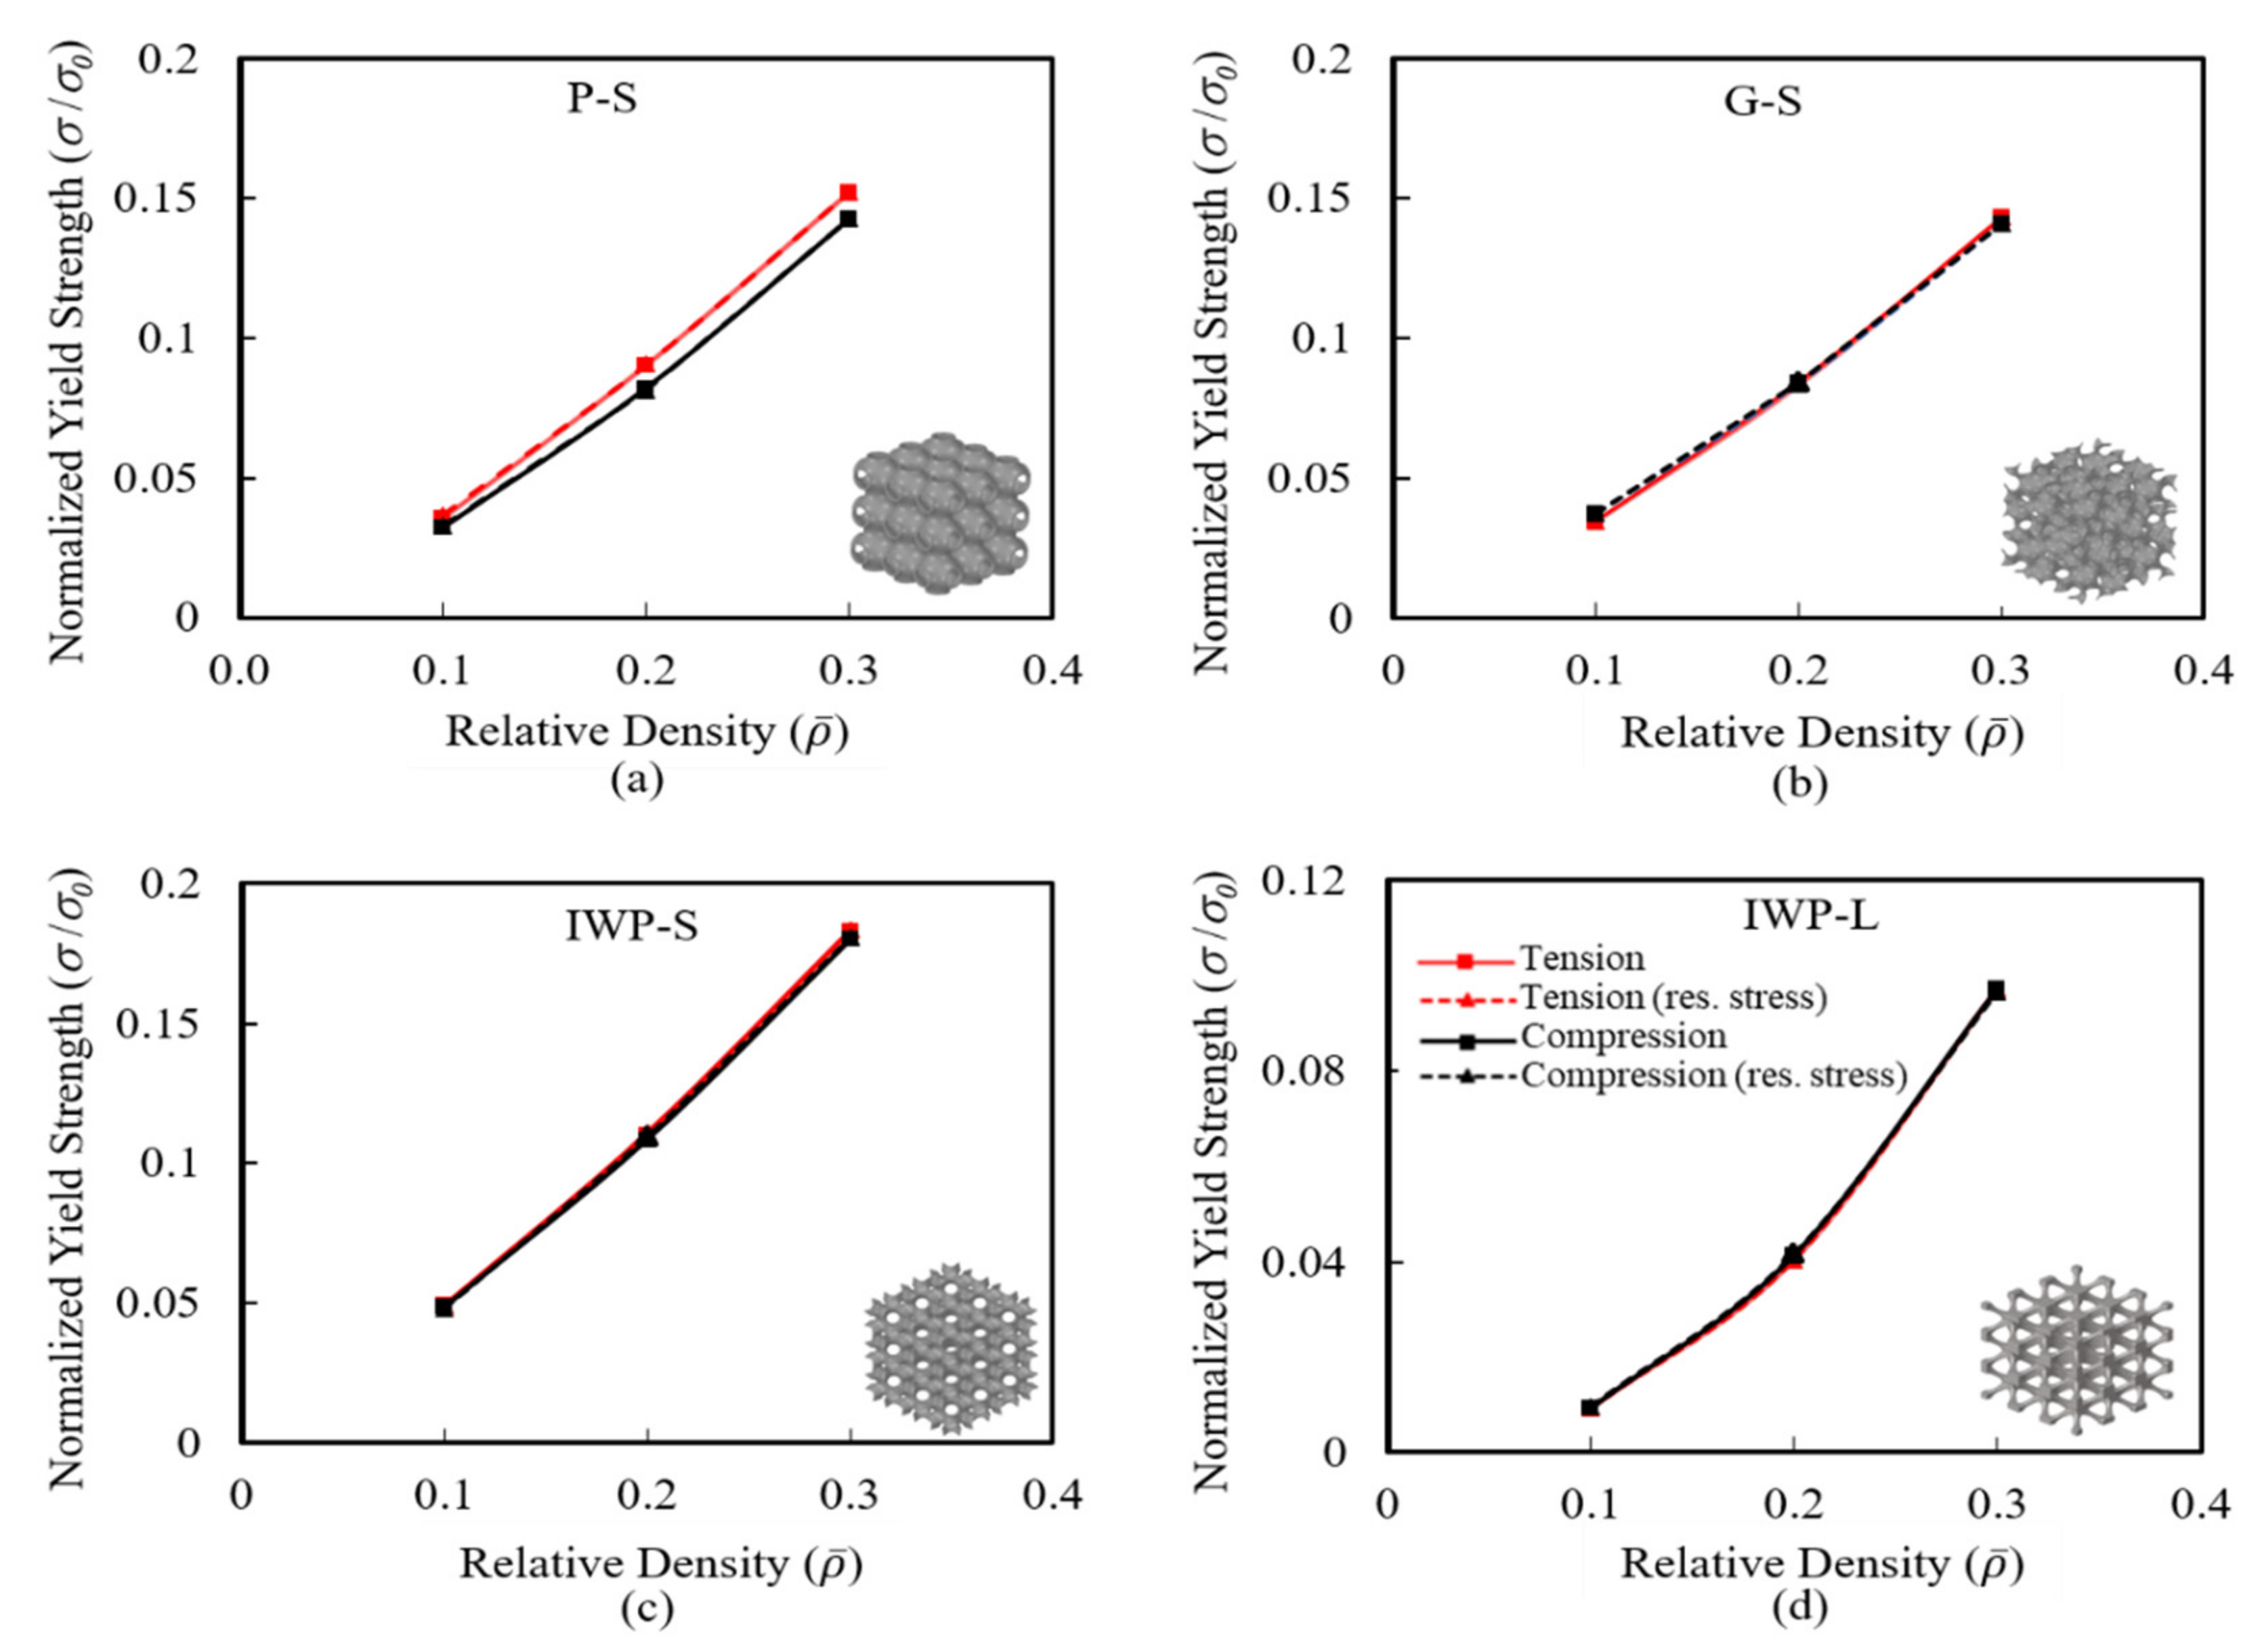
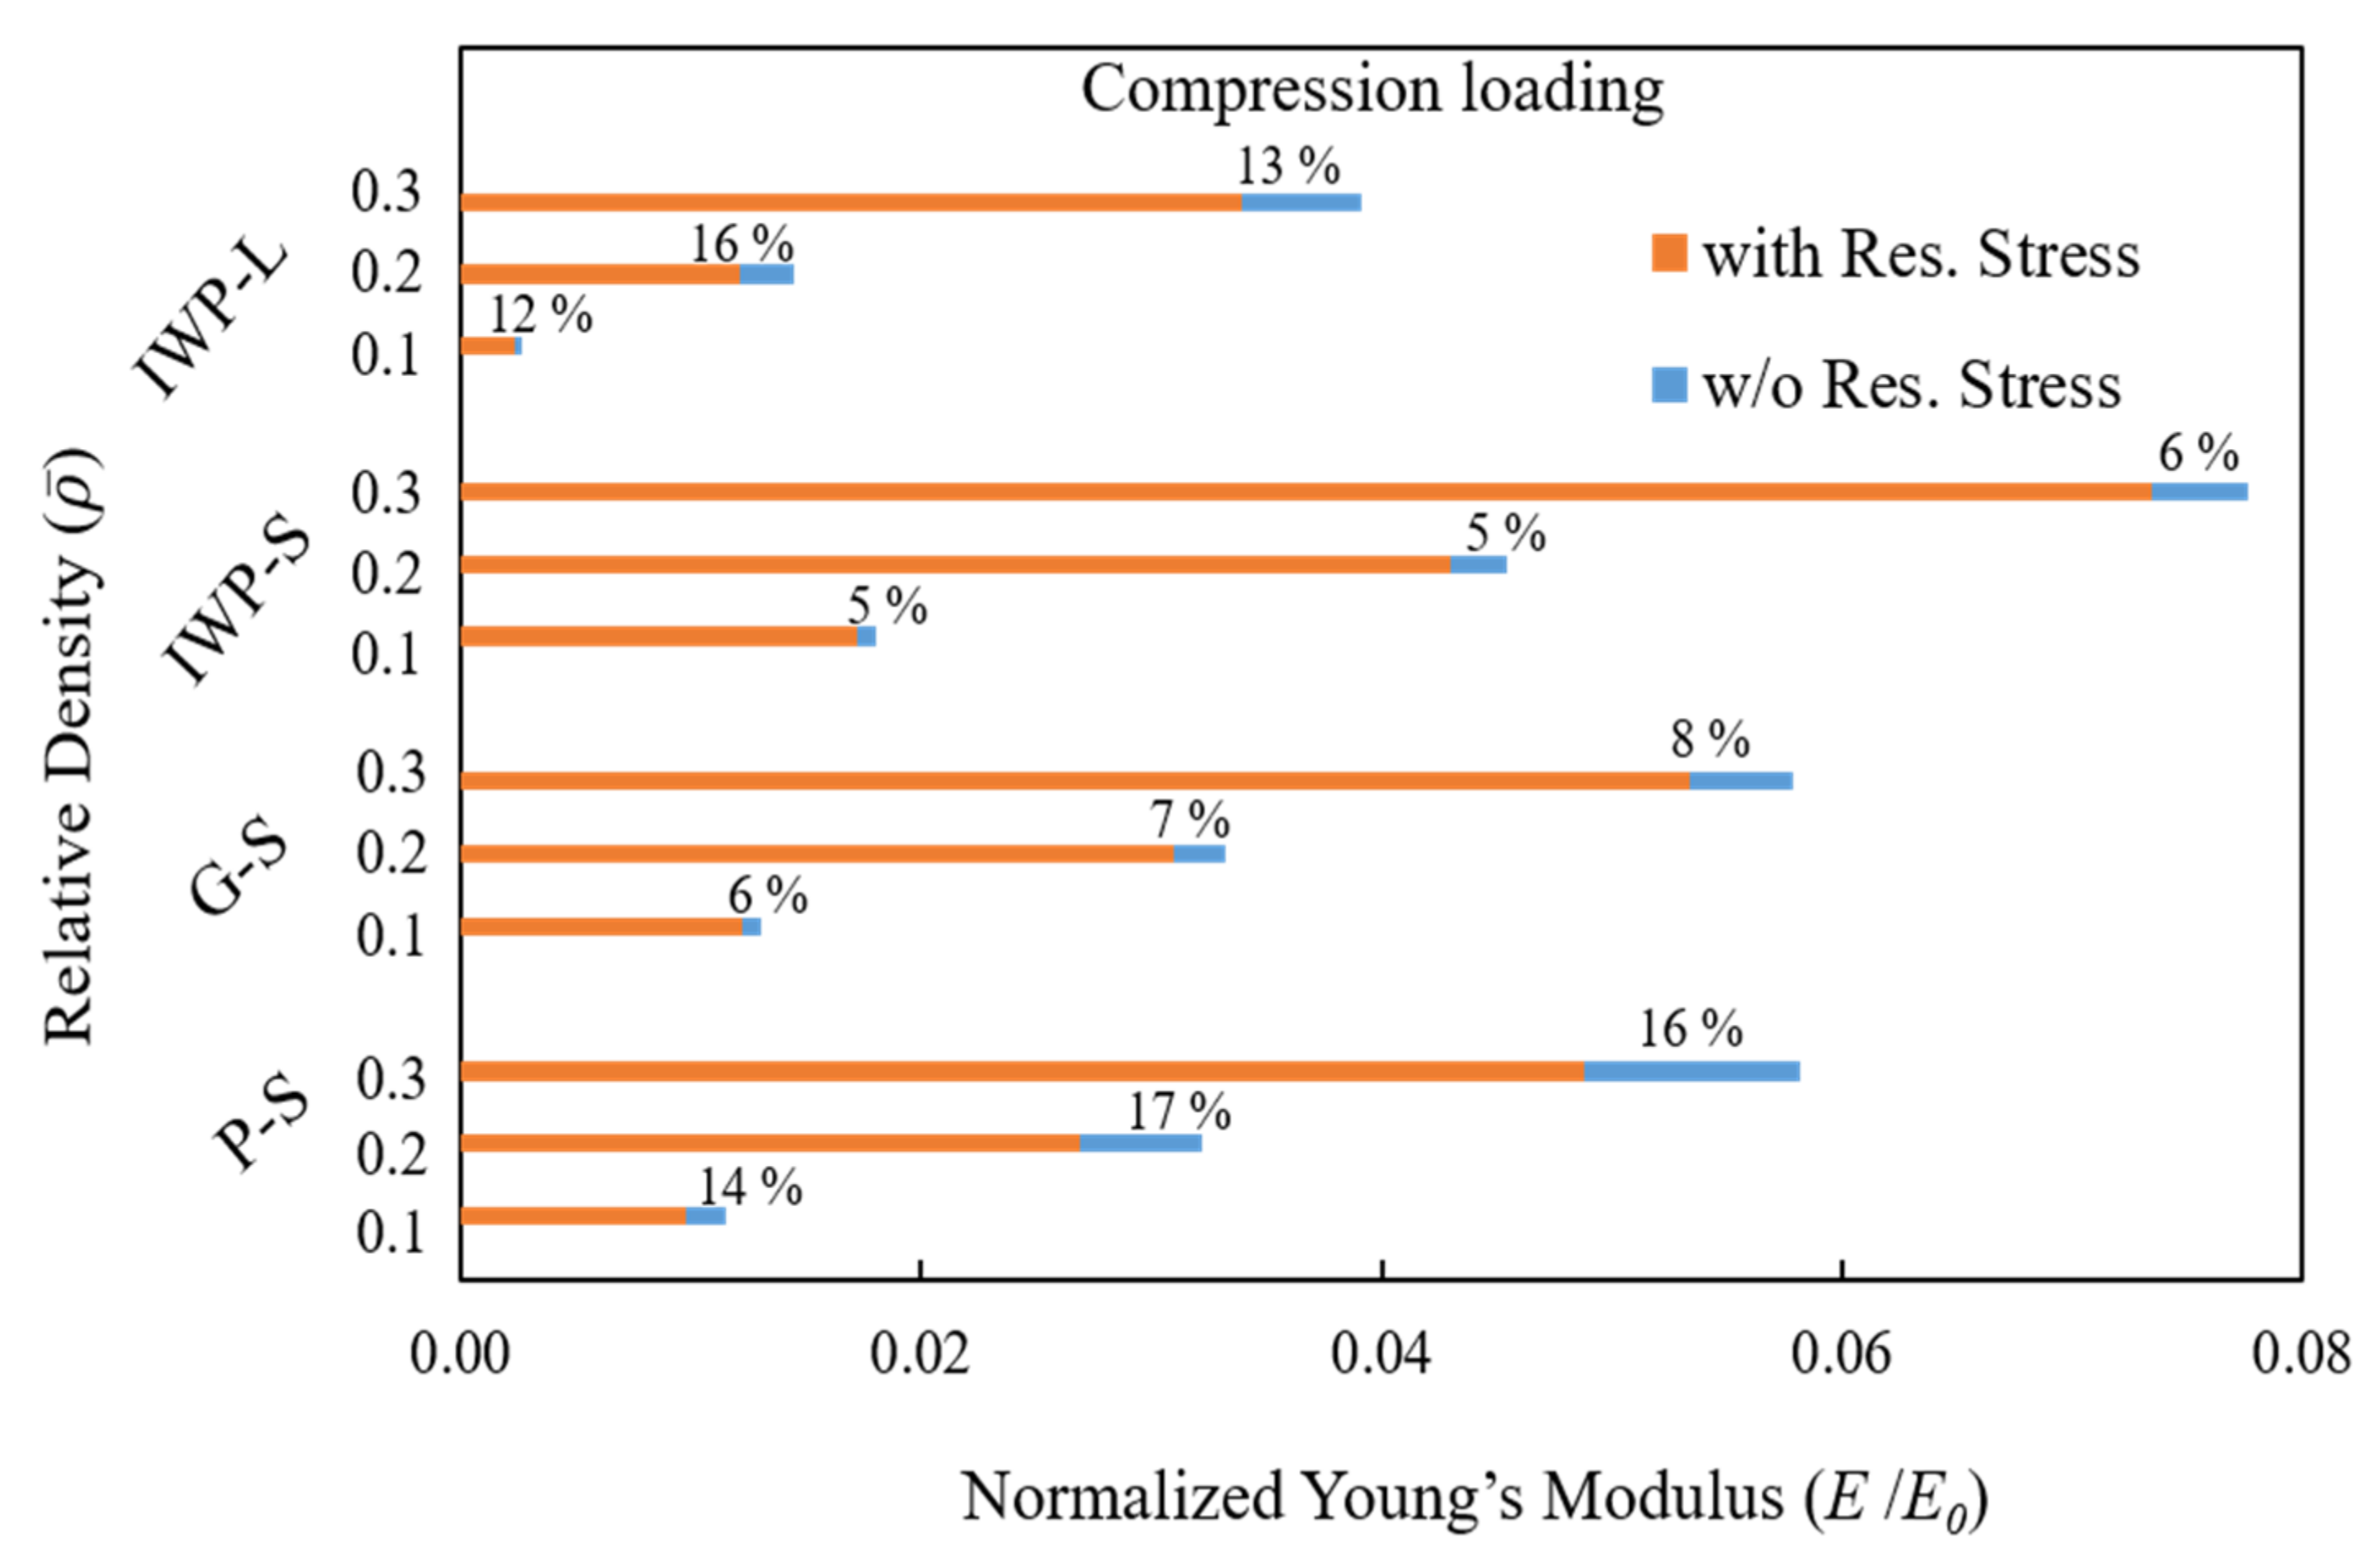
3.2. Effective Elastic Modulus and Yield Strength

The elastic modulus and yield strength of the different TPMS lattices for the three different densities considered are extracted from the stress–strain curves, for both tension and compression loading, with and without the residual stress effects. The Gibson–Ashby power law is used to correlate Young’s modulus E and yield strength σ to relative densities ρ ¯ of TPMS structures and is given by the following equations [37];
E / E 0 = C 1   ρ ¯ n
σ / σ 0 = C 2   ρ ¯ m
where E0 and σ0 correspond to the Young’s modulus and yield strength of the solid base material at room temperature (e.g., see Table 1), while E and σ are the elastic modulus and yield strength of the lattice at a relative density ρ ¯ , C1 and C2 are the scaling coefficients, and n and m are the scaling exponents of the fitting curves.
The normalized Young’s modulus (E/E0) and normalized yield strength (σ/σ0) values for different relative densities are shown in Figure 14 and Figure 15, respectively. The elastic modulus and yield strength of the lattice structures increase with the increase in relative densities for all TPMS structures, as expected. Considering the effect of residual stresses, e.g., Figure 14, the TPMS accounting for residual stresses shows a lower elastic modulus in the build z-direction compared with the reference TPMS without residual stresses. The effect of residual stress is most prominent on the sheet-based TPMS P-S in Figure 14a and the ligament-based IWP-L in Figure 14d. There is also a notable difference in stiffness under compression and tension loading. However, as seen in Figure 15, there is an insignificant effect of the residual stress on the yield strength in the build z-direction. Figure 16 and Figure 17 show the amount of reduction (%) in Young’s modulus due to the effect of residual stress in tensile and compressive loading, respectively. In tensile loading, the amount of reduction in elastic modulus due to residual stress is observed to be more prominent (>25%) in IWP-L for all relative densities, and for P-S structures, a reduction of more than 15% is observed at higher relative density, and the percentage reduction in elasticity was observed to be least in the case of IWP-S. For the compressive loading case, the reduction in elastic modulus is less prominent for IWP-L compared to in tensile loading and a very nominal reduction in elastic modulus is found in the case of G-S and IWP-S lattices due to residual stress. However, the P-S structure showed almost the same amount of reduction in elastic modulus compared to the tensile loading case. The power law coefficient and exponents of the scaling laws in Equations (19) and (20) for elastic modulus and yield strength for the four TPMS topologies are given in Table 3. The effect of the residual stress can be realized from the values of the fitting constant and exponent C1 and n, respectively, on the elastic modulus, and similarly for the effect of indicating distinctly different values, especially for the IWP-L topology. The nature of elastic deformation behaviors of the TPMS structures under tensile/compression loading can be best explained using the exponent value n of the power law in Equation (19) [38]. From the n exponent values of the respective TPMS in Table 3, in uniaxial tensile and compression loading, the sheet-based P-S, G-S, and IWP-S structures show a mixed mode of deformation (e.g., 1 < n < 2), although stretching may be more pronounced, while the ligament-based IWP-L lattice shows a predominantly bending behavior (n     2), indicating that deformation behavior is strongly related to the topology of the TPMS. These observations agree well with the behavior reported in the literature on TPMSs [26,39]. In addition, it can be observed that due to predominantly bending behavior, the IWP-L shows less mechanical stiffness and strength compared to the sheet-based TPMS of the same relative densities as indicated by the respective values of magnitude in Figure 14 and Figure 15.

3.3. SEA Simulation

The specific energy absorption (SEA) value is defined as the energy absorbed by a material under uniaxial compression, normalized by its density, and involves large deformation up to the point of densification of the lattice structure. The objective here is to investigate the effect of the residual stress on the SEA capacity. The SEA is expressed as
SEA = 1 ρ ¯ 0 ε D     σ   d ε
where σ is the compressive stress, ε is the compressive strain, and εD is the densification strain. The full-scale FEA models of the two TPMS configurations shown in Figure 18 are subjected to compressive loads to investigate the SEA value with and without accounting for residual stresses for different relative densities. The lower rigid plate is fixed, whereas the upper rigid plate is given a prescribed total displacement of Δ = 15 mm, corresponding to a total compressive strain of 50% in the build z-direction. A general contact interaction is defined between the upper and lower rigid plates, and the TPMS lattice with a frictional coefficient of 0.1 and the self-contact between surfaces of the TPMS are assigned a friction coefficient of 0.2.
Figure 18 shows the equivalent plastic strain (PEEQ) for the P-S lattice for ρ ¯ = 10% and 20%. The reaction force on the upper rigid plate is obtained from which the effective compressive stress over the lattice is determined for both the cases with and without residual stresses accounted for. As shown in Figure 19, there is a change in elastic modulus as observed in previous sections due to residual stress; however, beyond the yield region, the stress–strain response reveals that the effect of the residual stresses is insignificant on the SEA capacity of the lattice structure, and is found to be same as compared to the reference TPMS, e.g., without residual stresses.

4. Conclusions

The effective mechanical properties such as elastic modulus, yield strength, and SEA of four TPMS structures with varying relative densities ( ρ ¯ = 10%, 20% and 30%) are investigated considering the influence of residual stress evaluated from the SLM process through sequentially coupled thermomechanical simulations. When incorporating the residual stresses arising from the SLM process, the effective elastic modulus of all TPMS lattices in the build direction is lower in comparison with the reference TPMS in which the residual stresses are not accounted for. The decrease in stiffness is more prominent in sheet-based P-S and ligament-based IWP-L due to the higher accumulation of residual stress, and a stiffness reduction of more than 25% is observed in IWP-L. In addition, the fitting constant and exponent C1 and n, respectively, in the Gibson–Ashby power law show distinctly different values, especially for the IWP-L topology, indicating the influence of residual stress on the elastic modulus of the TPMS. The sheet-based TPMS (P-S, G-S, and IWP-S) with a relative density of 10% show softening behavior beyond the yield region in compression loading, while for higher densities of all TPMSs, the tensile and compression behaviors show consistent hardening. The influence of residual stresses on yield strength and SEA is insignificant in the build direction for all TPMSs, indicating that residual stresses have little effect beyond the yield region in both compression and tension loading.
The findings with regard to the variation in stiffness due to residual stress inherited from the SLM process are significant as stiffness is known to considerably affect the vibration and fatigue properties of parts and hence needs to be accounted for in any design process. Further investigations for the anisotropic behavior of the TPMS structures considering the loading in other directions, the effect of various scanning strategies and post-heat treatment procedures on residual stress mitigations in TPMS lattices, and its influence on mechanical properties may be undertaken.

Author Contributions

Conceptualization, I.B. and R.K.A.A.-R.; methodology, N.A., I.B. and R.K.A.A.-R.; software, N.A.; validation, N.A.; formal analysis, N.A.; investigation, N.A.; resources, I.B. and R.K.A.A.-R.; data curation, N.A.; writing—original draft preparation, N.A.; writing—review and editing, I.B. and R.K.A.A.-R.; visualization, N.A.; supervision, I.B. and R.K.A.A.-R.; project administration, I.B. and R.K.A.A.-R.; funding acquisition, I.B. and R.K.A.A.-R. All authors have read and agreed to the published version of the manuscript.

Funding

The authors acknowledge the financial support provided by Khalifa University under Award No. RCII-2019-003.

Institutional Review Board Statement

Not applicable.

Informed Consent Statement

Not applicable.

Data Availability Statement

Not applicable.

Conflicts of Interest

The authors declare no conflict of interest.

Appendix A. Verification of Residual Stresses

For verification of residual stress values obtained through the simulations in the current study, experimentally measured values from the published literature [35] are used. The referenced work uses the neutron diffraction method to measure the inherited residual stress in a curved thin-walled plate fabricated through a metallic LPBF process. Figure A1a shows the geometric dimensions of the build made of Inconel 625 (IN625) material grade deposited on a stainless-steel base plate. The example case selected for comparison is deposited in a vertical orientation with a powder layer thickness of 30 μm. The simulation model uses an element layer height of 0.3 mm as per the recommended size range mentioned in Section 2.3, and a coarse mesh size of 2 mm is used for the baseplate. The location of the residual stress measurement path (e.g., T1) is at mid-height of the build indicated by the red dotted line shown in Figure A1a. Figure A1b depicts the comparison of stress component σz in the build direction along path T1, with markedly good agreement between the simulation results and the experimental measurements.
Figure A1. Sample used for comparison with current simulation study: (a) geometric dimension of the curve plate and stress measurement location (T1) indicated by red dotted line; (b) comparison of simulated residual stress component σz with experimental measurements from literature [35].
Metals 12 01344 g0a1

References

  1. Hossain, U.; Ghouse, S.; Nai, K.; Rt, J. Controlling and Testing Anisotropy in Additively Manufactured Stochastic Structures. Addit. Manuf. 2021, 39, 101849. [Google Scholar] [CrossRef]
  2. Maconachie, T.; Leary, M.; Lozanovski, B.; Zhang, X.; Qian, M.; Faruque, O.; Brandt, M. SLM Lattice Structures: Properties, Performance, Applications and Challenges. Mater. Des. 2019, 183, 108137. [Google Scholar] [CrossRef]
  3. Zhang, L.; Song, B.; Fu, J.J.; Wei, S.S.; Yang, L.; Yan, C.Z.; Li, H.; Gao, L.; Shi, Y.S. Topology-Optimized Lattice Structures with Simultaneously High Stiffness and Light Weight Fabricated by Selective Laser Melting: Design, Manufacturing and Characterization. J. Manuf. Process. 2020, 56, 1166–1177. [Google Scholar] [CrossRef]
  4. Al-Ketan, O.; Abu Al-Rub, R.K. Multifunctional Mechanical Metamaterials Based on Triply Periodic Minimal Surface Lattices. Adv. Eng. Mater. 2019, 21, 1–39. [Google Scholar] [CrossRef]
  5. Maskery, I.; Aremu, A.O.; Parry, L.; Wildman, R.D.; Tuck, C.J.; Ashcroft, I.A. Effective Design and Simulation of Surface-Based Lattice Structures Featuring Volume Fraction and Cell Type Grading. Mater. Des. 2018, 155, 220–232. [Google Scholar] [CrossRef]
  6. Ahmed, N.; Barsoum, I.; Haidemenopoulos, G.; Al-Rub, R.K.A. Process Parameter Selection and Optimization of Laser Powder Bed Fusion for 316L Stainless Steel: A Review. J. Manuf. Process. 2022, 75, 415–434. [Google Scholar] [CrossRef]
  7. Liu, Y.; Yang, Y.; Wang, D. A Study on the Residual Stress during Selective Laser Melting (SLM) of Metallic Powder. Int. J. Adv. Manuf. Technol. 2016, 87, 647–656. [Google Scholar] [CrossRef]
  8. Mercelis, P.; Kruth, J.P. Residual Stresses in Selective Laser Sintering and Selective Laser Melting. Rapid Prototyp. J. 2006, 12, 254–265. [Google Scholar] [CrossRef]
  9. Parry, L.A.; Ashcroft, I.A.; Wildman, R.D. Geometrical Effects on Residual Stress in Selective Laser Melting. Addit. Manuf. 2019, 25, 166–175. [Google Scholar] [CrossRef]
  10. Withers, P.J.; Bhadeshia, H.K.D.H. Residual Stress Part 2—Nature and Origins. Mater. Sci. Technol. 2001, 17, 366–375. [Google Scholar] [CrossRef]
  11. Withers, P.J.; Bhadeshia, H.K.D.H. Residual Stress Part 1—Measurement Techniques. Mater. Sci. Technol. 2001, 17, 355–365. [Google Scholar] [CrossRef]
  12. Rangaswamy, P.; Griffith, M.L.; Prime, M.B.; Holden, T.M.; Rogge, R.B.; Edwards, J.M.; Sebring, R.J. Residual Stresses in LENS® Components Using Neutron Diffraction and Contour Method. Mater. Sci. Eng. A 2005, 399, 72–83. [Google Scholar] [CrossRef]
  13. Nytra, M.; Kubı, P. A Fully Coupled Thermomechanical Damage Analysis of Hot Closed Die Forging Using Finite Element Modeling. J. Mater. Eng. Perform. 2020, 29, 8236–8246. [Google Scholar] [CrossRef]
  14. Denlinger, E.R.; Gouge, M.; Irwin, J.; Michaleris, P. Thermomechanical Model Development and in Situ Experimental Validation of the Laser Powder-Bed Fusion Process. Addit. Manuf. 2017, 16, 73–80. [Google Scholar] [CrossRef]
  15. Mukherjee, T.; Zhang, W.; DebRoy, T. An Improved Prediction of Residual Stresses and Distortion in Additive Manufacturing. Comput. Mater. Sci. 2017, 126, 360–372. [Google Scholar] [CrossRef]
  16. Ali, H.; Ghadbeigi, H.; Mumtaz, K. Effect of Scanning Strategies on Residual Stress and Mechanical Properties of Selective Laser Melted Ti6Al4V. Mater. Sci. Eng. A 2018, 712, 175–187. [Google Scholar] [CrossRef]
  17. Schoinochoritis, B.; Chantzis, D.; Salonitis, K. Simulation of Metallic Powder Bed Additive Manufacturing Processes with the Finite Element Method: A Critical Review. Proc. Inst. Mech. Eng. Part B J. Eng. Manuf. 2017, 231, 96–117. [Google Scholar] [CrossRef]
  18. Chen, Q.; Taylor, H.; Takezawa, A.; Liang, X.; Jimenez, X.; Wicker, R.; To, A.C. Island Scanning Pattern Optimization for Residual Deformation Mitigation in Laser Powder Bed Fusion via Sequential Inherent Strain Method and Sensitivity Analysis. Addit. Manuf. 2021, 46, 102116. [Google Scholar] [CrossRef]
  19. Mirkoohi, E.; Sievers, D.E.; Garmestani, H.; Liang, S.Y. Thermo-Mechanical Modeling of Thermal Stress in Metal Additive Manufacturing Considering Elastoplastic Hardening. CIRP J. Manuf. Sci. Technol. 2020, 28, 52–67. [Google Scholar] [CrossRef]
  20. Al-Ketan, O.; Lee, D.W.; Rowshan, R.; Abu Al-Rub, R.K. Functionally Graded and Multi-Morphology Sheet TPMS Lattices: Design, Manufacturing, and Mechanical Properties. J. Mech. Behav. Biomed. Mater. 2020, 102, 103520. [Google Scholar] [CrossRef]
  21. Afshar, M.; Pourkamali Anaraki, A.; Montazerian, H. Compressive Characteristics of Radially Graded Porosity Scaffolds Architectured with Minimal Surfaces. Mater. Sci. Eng. C 2018, 92, 254–267. [Google Scholar] [CrossRef] [PubMed]
  22. Montazerian, H.; Davoodi, E.; Asadi-Eydivand, M.; Kadkhodapour, J.; Solati-Hashjin, M. Porous Scaffold Internal Architecture Design Based on Minimal Surfaces: A Compromise between Permeability and Elastic Properties. Mater. Des. 2017, 126, 98–114. [Google Scholar] [CrossRef]
  23. Al-Ketan, O.; Rezgui, R.; Rowshan, R.; Du, H.; Fang, N.X.; Abu Al-Rub, R.K. Microarchitected Stretching-Dominated Mechanical Metamaterials with Minimal Surface Topologies. Adv. Eng. Mater. 2018, 20, 1800029. [Google Scholar] [CrossRef]
  24. Dalaq, A.S.; Abueidda, D.W.; Abu Al-Rub, R.K.; Jasiuk, I.M. Finite Element Prediction of Effective Elastic Properties of Interpenetrating Phase Composites with Architectured 3D Sheet Reinforcements. Int. J. Solids Struct. 2016, 83, 169–182. [Google Scholar] [CrossRef]
  25. Abu Al-Rub, R.K.; Lee, D.-W.; Khan, K.A.; Palazotto, A.N. Effective Anisotropic Elastic and Plastic Yield Properties of Periodic Foams Derived from Triply Periodic Schoen’s I-WP Minimal Surface. J. Eng. Mech. 2020, 146, 04020030. [Google Scholar] [CrossRef]
  26. Al-Ketan, O.; Abu Al-Rub, R.K.; Rowshan, R. The Effect of Architecture on the Mechanical Properties of Cellular Structures Based on the IWP Minimal Surface. J. Mater. Res. 2018, 33, 343–359. [Google Scholar] [CrossRef]
  27. Yang, E.; Leary, M.; Lozanovski, B.; Downing, D.; Mazur, M.; Sarker, A.; Khorasani, A.M.; Jones, A.; Maconachie, T.; Bateman, S.; et al. Effect of Geometry on the Mechanical Properties of Ti-6Al-4V Gyroid Structures Fabricated via SLM: A Numerical Study. Mater. Des. 2019, 184, 108165. [Google Scholar] [CrossRef]
  28. Lee, D.W.; Khan, K.A.; Abu Al-Rub, R.K. Stiffness and Yield Strength of Architectured Foams Based on the Schwarz Primitive Triply Periodic Minimal Surface. Int. J. Plast. 2017, 95, 1–20. [Google Scholar] [CrossRef]
  29. Zheng, X.; Fu, Z.; Du, K.; Wang, C.; Yi, Y. Minimal Surface Designs for Porous Materials: From Microstructures to Mechanical Properties. J. Mater. Sci. 2018, 53, 10194–10208. [Google Scholar] [CrossRef]
  30. Abueidda, D.W.; Abu Al-Rub, R.K.; Dalaq, A.S.; Lee, D.W.; Khan, K.A.; Jasiuk, I. Effective Conductivities and Elastic Moduli of Novel Foams with Triply Periodic Minimal Surfaces. Mech. Mater. 2016, 95, 102–115. [Google Scholar] [CrossRef]
  31. Maskery, I.; Sturm, L.; Aremu, A.O.; Panesar, A.; Williams, C.B.; Tuck, C.J.; Wildman, R.D.; Ashcroft, I.A.; Hague, R.J.M. Insights into the Mechanical Properties of Several Triply Periodic Minimal Surface Lattice Structures Made by Polymer Additive Manufacturing. Polymer 2018, 152, 62–71. [Google Scholar] [CrossRef]
  32. Waqar, S.; Guo, K.; Sun, J. FEM Analysis of Thermal and Residual Stress Profile in Selective Laser Melting of 316L Stainless Steel. J. Manuf. Process. 2021, 66, 81–100. [Google Scholar] [CrossRef]
  33. ANSYS Analysis User’s Manual Version; ANSYS: Canonsburg, PA, USA, 2020.
  34. Al-Ketan, O.; Abu Al-Rub, R.K. MSLattice: A free software for generating uniform and graded lattices based on triply periodic minimal surfaces. Mater. Des. Process. Commun. 2020, 3, e205. [Google Scholar] [CrossRef]
  35. An, K.; Yuan, L.; Dial, L.; Spinelli, I.; Stoica, A.D.; Gao, Y. Neutron Residual Stress Measurement and Numerical Modeling in a Curved Thin-Walled Structure by Laser Powder Bed Fusion Additive Manufacturing. Mater. Des. 2017, 135, 122–132. [Google Scholar] [CrossRef]
  36. Manvatkar, V.; De, A.; Debroy, T. Heat Transfer and Material Flow during Laser Assisted Multi-Layer Additive Manufacturing. J. Appl. Phys. 2014, 116, 1–8. [Google Scholar] [CrossRef]
  37. Gibson, L.J.; Ashby, M.F. Cellular Solids: Structure and Properties, 1st ed.; Cambridge University Press: Cambridge, UK, 2001. [Google Scholar]
  38. Ejeh, C.J.; Barsoum, I.; Abu Al-Rub, R.K. Flexural Properties of Functionally Graded Additively Manufactured AlSi10Mg TPMS Latticed-Beams. Int. J. Mech. Sci. 2022, 223, 107293. [Google Scholar] [CrossRef]
  39. Al-Ketan, O.; Rowshan, R.; Abu Al-Rub, R.K. Topology-Mechanical Property Relationship of 3D Printed Strut, Skeletal, and Sheet Based Periodic Metallic Cellular Materials. Addit. Manuf. 2018, 19, 167–183. [Google Scholar] [CrossRef]
Figure 1. Representation of the AM process with thermal conditions.
Metals 12 01344 g001
Figure 2. Normalized temperature-dependent properties for IN718: (a) stress–strain curves, (b) mechanical properties, and (c) thermal and physical properties.
Metals 12 01344 g002
Figure 3. TPMS unit cell topologies pertaining to, e.g., relative density of ρ ¯ = 10, with unit cell dimensions of 10 mm × 10 mm × 10 mm.
Metals 12 01344 g003
Figure 4. Convergence study of normalized yield strength values for different cell configurations of P-S ( ρ ¯ = 20 % ) compared with calculated value from Lee et al. [28].
Metals 12 01344 g004
Figure 5. The illustration shows the activation of the first layer of elements (highlighted in purple color) for deposition; the rest of the layers above are in the deactivated state representing the material to be deposited.
Metals 12 01344 g005
Figure 6. 3 × 3 × 3 cell configuration FEA models used for AM buildup simulation on an IN718 baseplate: (a) P-S (b) G-S (c) IWP-S, and (d) IWP-L.
Metals 12 01344 g006aMetals 12 01344 g006b
Figure 7. Various stages of 3 × 3 × 3 AM buildup simulation for P-S ( ρ ¯ =10%) for build height: (a) zbh = 5 mm, (b) zbh = 10 mm, (c) zbh = 15 mm, (d) zbh = 20 mm, (e) zbh = 25 mm, and (f) zbh = 30 mm at completion of build.
Metals 12 01344 g007
Figure 8. FE model of P-S pertaining to ρ ¯ = 10% with uniaxial loading and symmetric BC.
Metals 12 01344 g008
Figure 9. Stress evolution in build direction during the build height (30 mm) of TPMS for various relative densities: (a) PS, (b) G-S, (c) IWP-S, and (d) IWP-L.
Metals 12 01344 g009
Figure 10. Von Mises residual stress field in the TPMS lattices build of ρ ¯ = 10%: (a) P-S, (b) G-S, (c) IWP-S, and (d) IWP-L.
Metals 12 01344 g010
Figure 11. The stress–strain curve for tension/compression loading for ρ ¯ = 10% with and without residual stress: (a) P-S, (b) G-S, (c) IWP-S, and (d) IWP-L.
Metals 12 01344 g011
Figure 12. The stress–strain curve for tension/compression loading for ρ ¯ = 20% with and without residual stress: (a) P-S, (b) G-S, (c) IWP-S, and (d) IWP-L.
Metals 12 01344 g012
Figure 13. The stress–strain curve for tension/compression loading for ρ ¯ = 30% with and without residual stress: (a) P-S, (b) G-S, (c) IWP-S, and (d) IWP-L.
Metals 12 01344 g013
Figure 14. Effect of residual stresses on the normalized Young’s modulus (E/E0) with respect to relative density ρ ¯ : (a) P-S, (b) G-S, (c) IWP-S, and (d) IWP-L.
Metals 12 01344 g014
Figure 15. Effect of residual stresses on the normalized yield strength (σ/σ0) with respect to relative density ρ ¯ : (a) P-S, (b) G-S, (c) IWP-S, and (d) IWP-L.
Metals 12 01344 g015
Figure 16. The reduction in Young’s modulus in percentages for tensile loading for all TPMSs and their relative densities.
Metals 12 01344 g016
Figure 17. The reduction in Young’s modulus in percentages for compressive loading for all TPMSs and their relative densities.
Metals 12 01344 g017
Figure 18. Equivalent plastic strain (PEEQ) contour plots at 50% deformation P-S with: (a) ρ ¯ = 10% and (b) ρ ¯ = 20%.
Metals 12 01344 g018
Figure 19. Stress–strain compression response for P-S lattice of ρ ¯ = 10% and 20%, with and without the effect of residuals tresses.
Metals 12 01344 g019
Table 1. IN718 physical, mechanical, and thermal material properties at room temperature (T0) [33].
PropertyValue
Density ρ0 (kg/m3)8220
Specific heat Cp0 (J/kg °C)421
Conductivity k0 (W/m °C)11.9
Yield strength σ0 (MPa)648
Poisson ratio ν00.3
Thermal expansion α0 (°/C)1.44 × 10−5
Young’s modulus E0 (GPa)165
Table 2. Level-set equation for P-S, G-S, and IWP [4], where x, y, and z are Cartesian coordinates, and c is the level-set constant that controls the thickness of TPMS surfaces.
TPMSLevel-Set Equations
P-S cos x + cos y + cos z = c      
G-S sin x cos y + sin y cos z + sin z cos x = c    
IWP2 ( cos x cos y + cos y cos z + cos z cos x ) − ( cos 2 x + cos 2 y + cos 2 z ) = c
Table 3. Scaling law parameters, normalized young’s modulus, and yield strength.
P-SYoung’s ModulusYield StrengthG-SYoung’s ModulusYield Strength
C1nC2mC1nC2m
Tension0.341.450.761.33Tension0.291.330.681.29
Tension
(residual stress)
0.261.380.721.30Tension
(residual stress)
0.221.250.671.29
Compression0.341.470.741.36Compression0.291.350.601.20
Compression
(residual stress)
0.281.460.701.33Compression
(residual stress)
0.271.320.601.20
Lee et al. [28]0.611.570.791.36Al-Ketan et al. [23]0.511.380.441.24
IWP-SYoung’s ModulusYield StrengthIWP-LYoung’s ModulusYield Strength
C1nC2mC1nC2m
Tension0.361.270.761.20Tension0.722.411.262.13
Tension
(residual stress)
0.331.250.771.20Tension
(residual stress)
0.512.401.272.13
Compression0.381.330.751.20Compression0.722.431.272.13
Compression
(residual stress)
0.361.320.761.20Compression
(residual stress)
0.612.411.232.11
Al-Ketan et al. [26]0.791.480.691.24Al-Ketan et al. [26]1.282.641.052.14
Publisher’s Note: MDPI stays neutral with regard to jurisdictional claims in published maps and institutional affiliations.

