Article

Fatigue Lifetime Analysis of a Bicycle Frame Made by Additive Manufacturing Technology from AlSi10Mg

Institute of Applied Mechanics and Mechatronics, Faculty of Mechanical Engineering, Slovak University of Technology, Námestie Slobody 17, 812 31 Bratislava, Slovakia
*
Author to whom correspondence should be addressed.
Metals 2022, 12(8), 1277; https://doi.org/10.3390/met12081277
Submission received: 19 June 2022 / Revised: 22 July 2022 / Accepted: 25 July 2022 / Published: 29 July 2022
(This article belongs to the Special Issue New Trends in Fatigue of Metals)

Abstract

:
The development of additive manufactured metals is in the transition phase, from research into the technology of 3D printing and the resulting properties of the metals towards their use in industrial practice. The article analyses the possibilities of producing bicycle frames using 3D printing. The stresses in a bicycle frame are analysed for the measured load spectra and FEM simulation. The approach to the fatigue life assessment of the bicycle frame is based on directly measured load multipliers and detailed FEM simulation with the subsequent calculation of fatigue damage in the individual planes of the critical point of the frame respecting the multiaxial stress state. The scatter of the cyclic properties of the AM material is considered by a statistical approach. The operational fatigue lifetimes of a frame made by 3D printing and one of conventional technology are compared.

1. Introduction

Additive manufacturing (AM) is one of hottest topics in the component production field. The technology allows the designer to increase design complexity or change the key component features during the design cycle without a significant increase in production costs. While nowadays many AM-produced materials equal or even exceed their conventionally produced counterparts in static mechanical properties [1], there is still a significant gap in cyclic performance [2]. Various postprocessing techniques have been discussed to further increase the cyclic properties of AM parts (heat treatment, surface treatment, etc.) [3,4,5].
AlSi10Mg alloy is one of the most widely used aluminium alloys for additive manufacturing by SLM [6,7,8,9]. Materials of this type (silumin) are used to produce important structural elements such as combustion engine and transmission housings, wheel discs, aerospace components and others. The material is characterised by good foundry properties, weldability and good thermal conductivity. The precipitation of intermetallic Mg2Si particles hardens the base matrix without affecting other mechanical properties. Current AM technology enables the production of complete complex components such as a bicycle frame and offers a useful scope for shape optimization. Moreover, the AM production of a whole frame allows welding operations to be omitted. The question is whether these benefits are sufficient when set against the lower fatigue resistance of AM-produced components.
The article analyses the possibilities of producing bicycle frames using 3D printing. The operational fatigue lifetimes of a frame made by 3D printing and one of conventional technology are compared and analysed.
To compare and analyse the fatigue lifetimes of a bicycle frame produced by AM technology and one of conventional technology, the operational loading history and material parameters under cyclic loading have to be known.
For this reason, the following experimental procedures were carried out for the purpose of the analyses in this paper:
-
The measurement of the load waveform in the form of acceleration for selected types of obstacles.
-
Cyclic fatigue tests on specimens fabricated by AM technology as well as by conventional casting.
From the fatigue life assessment procedures used, a suitable methodology for the assessment of this complex structure was contrived, including:
-
The identification of the loading of the frame model by an appropriate overload multiplier to obtain relevant stress values.
-
Appropriate modelling at the root of the notch for the use of the local stress–strain approach.
-
An adequate method for identifying and accounting for cycles.
-
A suitable criterion to consider multiaxiality.
-
A method for calculating fatigue damage in individual planes to find the critical plane.
-
Consideration of the nonproportionality of normal and shear stresses.

2. Materials and Methods

2.1. Operational Loading Estimation

The key aspect of the fatigue lifetime estimation of construction in real operation is to know the loading histories in the critical point of the construction. In this paper, the methodology illustrated in Figure 1 is implemented.
In the first step, the loading spectra corresponding to selected obstacles were measured using accelerometers. FEM analysis was used to calculate stress in the critical place corresponding to each loading channel measured. For each loading channel, an influence matrix was used to transform measured acceleration into stress history in the critical place. As a linear model was used, a linear combination of stresses caused by each channel defined the stress history in critical places.
[ σ x τ x y τ x z τ x y σ y τ y z τ x z τ y z σ z ] i , ( t ) = K i , l o n a l o n ( t ) + K i , v e r a v e r ( t ) + K i , l a t a l a t ( t )

2.1.1. Loading History Acquisition

The loading process during a ride over selected obstacles was measured using accelerometers (B&K 4507 B 004 with a measuring range of 71 g and a frequency range of between 0.3 and 6 kHz) attached to the bicycle frame. The positions of the accelerometers are shown in Figure 2.
The measured accelerations were processed using bandpass filtering (1 ÷ 8 Hz). Filtration is a crucial part of measurement postprocessing to obtain and keep only the relevant part of the measured signal [10]. The unfiltered measured signal is shown in Figure 3.

2.1.2. Definition of Standard Operational Load Histories

The relevant obstacles were identified (riding across a ditch, riding down stairs and jumping from a height of 0.6 m). The maximal acceleration for each obstacle and each direction is shown in Table 1.
The accelerations corresponding to each obstacle after filtering are shown in Figure 4. The remaining part of the loading process was not used during the lifetime estimation, as maximal stress amplitudes caused by loading outside the chosen obstacles were much below the cyclic anelasticity limit [11].
In order to compare the fatigue performance of AM material with its standard counterpart under various loading situations, the following loading cases were specified for fatigue lifetime estimation:
  • Riding through a ditch.
  • Riding down stairs.
  • Jumping.
  • A hypothetical track consisting of 5 ditches, 20 stairs and 4 jumps.

2.1.3. FEM Analysis and Loading Process in the Critical Place of the Frame

To identify the critical place of the frame, FEM analysis was used. Solid elements with high density mash were used in a mathematical model [12]. The mathematical model was verified against measurements previously carried out with a strain gauge placed on the bicycle frame. Figure 5 shows the critical place on the frame.
Three FEM simulations were realized (corresponding to each loading direction) to obtain the influential matrixes used to transform measured acceleration to stress histories in the critical place. As the exact critical spot was different for each loading situation, the whole area shown in Figure 6 was analysed during the fatigue lifetime estimation.

2.2. Fatigue Lifetime Estimation

As the stress state in the critical place has a multiaxial character, a multiaxial fatigue lifetime estimation procedure was carried out.

2.2.1. Material

A comparative study of three aluminium-based materials was carried out: two forms of AlSi10Mg (an AM version and a cast version) and Al6061-T6 were chosen. Additively manufactured specimens were printed on a ConceptLaser Xline 2000R (a laser head power of 1000 W and a sintering layer height of 0.05 mm were used). Two sets of specimens with different printing orientations were produced. The specimens marked as vertical (ver) were printed with the layer orientation perpendicular to the main axes of the specimen. The specimens marked as horizontal (hor) were printed with the layer orientation parallel to the main axes. Conventionally cast ALSi10Mg specimens were turned from ingot cast by SLOVALCO, a.s. The chemical compositions for both specimen types are in Table 2.
The third material used in the analysis was Al6061-T6. It is a standard aluminium alloy used in bicycle frame production and thus is used as a reference point in the analysis. The material properties were taken from [6].
The material parameters for both AlSi10Mg variants were obtained experimentally. The experiment was carried out in the strength and elasticity laboratory for operational lifetime and materials testing of the Faculty of Mechanical Engineering, STU. An MTS Bionix 370.02 axial/torsional testing system was used. The geometry utilized for the AM-produced specimens and the geometry utilized for the conventionally cast specimens are shown in Figure 7.
The experiments were carried out in the force control mode. The so-called technical initiation of a fatigue crack (a crack with an approximate size of 0.5–1 mm) was defined as the failure condition of the experimental specimens. The fatigue crack initiation was determined based on a continuous measurement of the deformation response (strain and distortion) to the loading regime of the test specimen σa = const. The completion of the test was defined either (a) by the increase in the deformation by 10% in reference to the mean value (an indication of the technical initiation of fatigue crack [13]) or (b) by reaching the lifetime of 2.106 cycles. All the tests were conducted with temperature monitoring to ensure that the temperature of the specimens did not exceed 50 degrees Celsius. A summary of the stress amplitude loading conditions and experimental fatigue life for each test performed is included in Table 3.
The material properties used in the analyses are summarized in Table 4.
The regression curves of the Basquin equation (regress line—solid; boundary of 95% prediction interval—dashed) for both orientations of AM-produced AlSi10Mg are in Figure 8. The cycles labelled as Nf represent fatigue life up to the failure condition defined previously. In further analysis, the material parameters corresponding to vertical print orientation are used. Using parameters corresponding to horizontal print orientation could lead to nonconservative error in the lifetime estimation of components printed in general orientation.
The regression curves of the Basquin equation (regress line—solid; boundary of 95% prediction interval [14,15]—dashed) for the materials used for fatigue lifetime estimation are in Figure 9.

2.2.2. Multiaxial Fatigue Assessment

When estimating fatigue lifetime under multiaxial variable amplitude loading, several key aspects must be considered. The methodology that identifies individual loading cycles in multiaxial loading histories must be implemented. A multiaxial fatigue criterion which transforms the multiaxial stress state to the equivalent stress amplitude (comparable with the appropriate fatigue curve) must be chosen, with appropriate methodology that considers the nonproportionality of loading cycles. Finally, the damage accumulation rule must be used to accumulate the fatigue damage caused by each individual loading cycle.

Cycle Counting Method

Several cycle counting methods have been proposed and analysed by multiple authors [16,17,18,19,20,21,22]. The methodology described in [23] is used to identify the individual loading cycle for each selected obstacle. The cycle counting method is based on cycle identification in relative maximum shear stress histories (calculated from multiaxial loading histories) acting in the critical place of construction (in our case in each node region around the critical point described in Section 2.2).

Multiaxial Fatigue Criterion

Multiple criteria based on various parameters and principles have been introduced [24,25,26,27,28,29,30,31,32,33,34] for estimating fatigue lifetime under multiaxial loading. Of these techniques, the most popular ones today are based on the critical plane approach. They are based on the premise that fatigue cracks usually initiate in preferred planes within a material. The criteria then calculate the damage parameter (equivalent stress or strain amplitude) in a so-called critical plane that is used for fatigue lifetime estimation.
The Findley [24,25] criterion is used for lifetime estimation. The equivalent stress amplitude in the critical plane is calculated as a linear combination of shear stress amplitude (τcr,a) and maximal normal stress (σn,max) acting on the plane during the loading cycle (the critical plane is then a plane with maximal equivalent stress):
( τ c r , a + k f i n σ n , m a x ) m a x = τ f * ( 2 N f ) b
kfin is the Findley coefficient, the weighting influence of normal stress, which is determined from fatigue curves under two different stress states. In the case of fully reversed and pulsating axial tests, it can be calculated by solving the following equation:
σ c , R = 1 σ c , R = 0 = k f i n + 1 + k f i n 2 2 k f i n + 1 + 2 k f i n 2
τf* is a modified strength coefficient calculated using the appropriate fatigue curve, in our case a pure tension/compression Basquin curve:
τ f * = σ f 1 + k f i n 2 + k f i n 2
The parameters for pulsating loading were derived from a pure axial test using the Morrow mean stress model [35]:
σ a m = σ a ( 1 σ m σ f )
The material properties featured in Equation (3) are summarized in Table 5.

The Damage Accumulation Rule

As the analysed loading sequences are nonproportional with variable amplitudes, the procedure to determine the critical plane is based on the damage accumulated in each plane. The damage corresponding to each plane is calculated from Nf:
D = 1 N f
The total damage corresponding to the whole loading sequence is then calculated using the well-known Palmgren–Miner linear damage accumulation rule [36,37]:
D =   n i N f i
As the position of the critical plane depends on the loading sequence, a search through multiple planes must be carried out. Socie’s [37] proposal to evaluate planes with a 20° increment angle (leading to 36 planes evaluated in every element of the critical area) leads to a 20% error in estimated lifetimes. To achieve lower error margins, the increment angle of 10° was used (162 evaluated planes in each element).

Nonproportionality

When recalculating the loading stresses in a particular plane, the direction of the normal stress is given by the plane normal vector, but the shear stress direction can vary as a result of nonproportionality in the loading history. In general, it can be described by a two-dimensional path. For a proportional load history, this path is a line, but in nonproportional loading, the path can have a complex 2D shape (Figure 10).
The problem then arises of how to calculate the shear stress amplitude acting on the plane. Multiple methods have been proposed based on various shapes circumscribing the shear stress path [38,39,40,41]. In this paper, the Dang Van method based on a minimum circumscribing circle [39] is used. A circle is found to cover the shear path and then its radius represents the shear stress amplitude.

3. Results

As the focus of this paper is to compare the performance of additive manufactured material to its conventionally produced counterparts, the fatigue lifetime estimation was carried out in probabilistic form considering the scatter of the cyclic properties of the material [14,15]. The result of such an analysis is the distribution function of fatigue lifetime for each proposed loading history and given material.

3.1. Individual Loading Segments

The distribution function of fatigue lifetime for each individual obstacle is summarized in Figure 11. Each line represents one of the analysed materials.
The fatigue life (Nf) is described by the number of repetitions of the loading signals representing each obstacle. The results of Nf, corresponding to the regress line of material parameters, for AM AlSi10Mg, cast AlSi10Mg and Al6061 are summarized in Table 6.

3.2. Standard Operational Unit

The distribution function of fatigue lifetime for each material corresponding to the hypothetical track proposed in Section 2.2 is presented in Figure 12. Each line represents one of the analysed materials.

4. Conclusions

The fatigue lifetime estimation of a bicycle frame under real operational loading was documented in the article. The analysis was carried out for three different material types: AM manufactured AlSi10Mg, conventionally cast AlSi10Mg and conventionally produced Al6061-T6. The fatigue lifetime estimation procedure was introduced and described, consisting of the following parts: loading process acquisition, the calculation of stress histories in critical places and multiaxial fatigue assessment under variable amplitude loading. The results show that the safe life approach with appropriate parameter settings (multiaxiality, nonproportionality, critical plane approach, etc.) can also be used to assess the fatigue life of structures made using additive technologies.
Based on the findings presented in the paper, the following conclusions can be formulated:
  • The fatigue life of the bicycle frame fabricated by AM technology is significantly lower compared to that of conventionally cast material for the as-built condition. The reason for this is not only the dispersion and anisotropy of material properties due to AM technology, but as the results in Figure 9, Figure 11 and Figure 12 show, it is the physical limits of the current AM metal technology.
  • One of the possibilities to increase the fatigue performance of AM materials could be decreasing the scatter of fatigue curves by making the production process more stable and homogenous. As seen in Table 6, decreasing the fatigue curve scatter on AM-produced material could decrease the gap between the AM-produced material and Al6061 for a higher probability of occurrence (the lifetime multiplier rises with higher probability P). However, as can be seen in Figure 11 and Figure 12 and mainly in Figure 9, this could have a significant effect only in the low cycle fatigue region (around Nf = 1000 cycle to failure), where the scatter bands for AM and cast ALSi10Mg overlap.
  • The different fatigue curve slopes of AM and cast AlSi10Mg have a more significant influence on the gap between estimated lifetimes. In the presented analysis, due to severe loading conditions the lifetime estimation falls in the region where the fatigue curves for AM and cast specimens overlap. In the situation with less severe loading, the gap between predicted lifetimes will further increase due to the different slopes of both fatigue curves causing higher lifetime prediction in higher cycle regions (Figure 9).
  • It should be noted that the real gap between the predicted lifetime of a frame of AM AlSi10Mg and a frame of Aal6061-T6 will be significantly smaller. The predicted lifetime of Al6061 assumes the material state in T6 tempering treatment. In reality, due to the welding procedure needed to produce the frame from AL6061, the material properties in critical places will deteriorate significantly, thus lowering the gap between predicted lifetimes.
  • One further way of increasing the fatigue properties of structures produced by AM technology is by additional heat treatment, the potential benefit of which is significantly determined by the chemical composition of the material (this is very limiting for this type of silumin).

Author Contributions

Computing, M.M. and R.Ď.; conceptualization and methodology, V.C.; computing simulations, M.S. and T.K.; experiments, M.S., M.M. and V.C. All authors have read and agreed to the published version of the manuscript.

Funding

This research was funded by the Slovak Research and Development Agency under the contract No. APVV-17-0666 and Slovak Educational Grant Agency under the contract No. KEGA 041STU4/2020 and Czech Technological Agency under the contract No. TREND FW01010462.

Institutional Review Board Statement

Not applicable.

Informed Consent Statement

Not applicable.

Data Availability Statement

Not applicable.

Conflicts of Interest

The authors declare no conflict of interest.

Nomenclature

kfincoefficient weighting the normal stress by Findley criterion
σn,maxmaximal normal stress acting on plane during cycle
τa,crshear stress amplitude acting on critical plane
Nfnumber of cycles to failure
τ*fFindley’s fatigue strength coefficient
bfatigue strength exponent for tension/compression loading
σ′ffatigue strength coefficient for tension/compression loading
σc,R = −1fatigue limit (Nf = 2e6) for tension/compression fully reversed loading
σc,R = 0fatigue limit (Nf = 2e6) for tension/compression pulsating loading
PIprediction interval

References

  1. Lewandowski, J.J.; Seifi, M.; Clarke, D.R. Metal Additive Manufacturing: A Review of Mechanical Properties. Annu. Rev. Mater. Res. 2016, 46, 151–186. [Google Scholar] [CrossRef] [Green Version]
  2. Aboulkhair, N.T.; Simonelli, M.; Parry, L.; Ashcroft, I.; Tuck, C.; Hague, R. 3D printing of Aluminium alloys, Additive Manufacturing of Aluminium alloys using selective laser melting. Prog. Mater. Sci. 2019, 106, 100578. [Google Scholar] [CrossRef]
  3. Molaei, R.; Fatemi, A. Fatigue Design with Additive Manufactured Metals. Procedia Eng. 2018, 213, 5–16. [Google Scholar] [CrossRef]
  4. Yadollahi, A.; Mahmoudi, M.; Elwany, A.; Doude, H.; Bian, L.K.; Newman, J.C. Fatigue-life prediction of additively manufactured material: Effects of heat treatment and build orientation. Fatigue Fract. Eng. Mater. Struct. 2020, 43, 831–844. [Google Scholar] [CrossRef]
  5. Enrique, P.D.; Keshavarzkermani, A.; Esmaeilizadeh, R.; Peterkin, S.; Jahed, H.; Toyserkani, E.; Zhou, N.Y. Enhancing fatigue life of additive manufactured parts with electrospark deposition post-processing. Addit. Manuf. 2020, 36, 101526. [Google Scholar] [CrossRef]
  6. Uzan, N.E.; Shneck, R.; Yeheskel, O.; Frage, N. Fatigue of AlSi10Mg specimens fabricated by additive manufacturing selective laser melting (AM-SLM). Mater. Sci. Eng. 2017, 704, 229–237. [Google Scholar] [CrossRef]
  7. Leon, A.; Shirizly, A.; Aghion, E. Corrosion Behavior of AlSi10Mg Alloy Produced by Additive Manufacturing (AM) vs. Its Counterpart Gravity Cast Alloy. Metals 2016, 6, 148. [Google Scholar] [CrossRef]
  8. Zhuo, L.; Wang, Z.; Zhang, H.; Yin, E.; Wang, Y.; Xu, T.; Li, C. Effect of post-process heat treatment on microstructure and properties of selective laser melted AlSi10Mg alloy. Mater. Lett. 2019, 234, 196–200. [Google Scholar] [CrossRef]
  9. Fousová, M.; Dvorský, D.; Michalcová, A.; Vojtěch, D. Changes in the microstructure and mechanical properties of additively manufactured AlSi10Mg alloy after exposure to elevated temperatures. Mater. Charact. 2018, 137, 119–126. [Google Scholar] [CrossRef]
  10. Tůma, J. Vehicle Gearbox Noise and Vibration: Measurement, Signal Analysis, Signal Processing and Noise Reduction Measures; Wiley: Hoboken, NJ, USA, 2014. [Google Scholar] [CrossRef]
  11. Chmelko, V. Cyclic anelasticity of metals. Cyclic anelasticity of metals. Metl. Mater. 2014, 52, 353–359. [Google Scholar] [CrossRef] [Green Version]
  12. Chmelko, V.; Harakaľ, M.; Žlábek, P.; Margetin, M.; Ďurka, R. Simulation of Stress Concentrations in Notches. Metals 2022, 12, 43. [Google Scholar] [CrossRef]
  13. Tipton, S.M. Multiaxial plasticity and fatigue life prediction in coiled tubing. In Advances in Fatigue Lifetime Predictive Techniques: 3rd Volume; Mitchell, M.R., Landgraf, R.W., Eds.; ASTM International: Montgomery County, MD, USA, 1996; pp. 283–304. [Google Scholar] [CrossRef]
  14. Kliman, V. Probabilistic approach to operational fatigue-life evaluation. Part II. Calculation of fatigue-life distribution function with respect to inhomogeneity of material properties and random loading. Kov. Mater. Met. Mater. 1999, 37, 18–33. [Google Scholar]
  15. Kliman, V.; Kepka, M.; Václavík, J. Influence of scatter of cyclic properties of material on operational endurance of construction. Kov. Mater. Met. Mater. 2010, 48, 367–378. [Google Scholar] [CrossRef] [Green Version]
  16. Bannantine, A.J.; Socie, D.F. A variable amplitude multiaxial fatigue life prediction method. In Fatigue Under Biaxial and Multiaxial Loading, European Structural Integrity Society ESIS Publication 10; Mechanical Engineering Publications: London, UK, 1991; pp. 367–370. [Google Scholar]
  17. Wang, C.H.; Brown, M.W. Life prediction techniques for variable amplitude multiaxial fatigue—Part 1: Theories. J. Eng. Mater. Technol. 1996, 14, 367–370. [Google Scholar] [CrossRef]
  18. Wang, C.H.; Brown, M.W. Life prediction techniques for variable amplitude multiaxial fatigue—Part 2: Comparison with experimental results. J. Eng. Mater. Technol. 1996, 118, 371–374. [Google Scholar] [CrossRef]
  19. Anes, V.; Reis, L.; Li, B.; de Freitas, M. New cycle counting method for multiaxial fatigue. Int. J. Fatigue 2014, 67, 78–94. [Google Scholar] [CrossRef]
  20. Wang, X.-W.; Shang, D.-G.; Sun, Y.-J.; Liu, X.-D. Algorithms for multiaxial cycle counting method and fatigue life prediction based on the weight function critical plane under random loading. Int. J. Damage Mech. 2019, 28, 1367–1392. [Google Scholar] [CrossRef]
  21. Meggiolaro, M.A.; de Castro, J.T.P. An improved multiaxial rainflow algorithm for non-proportional stress or strain histories—Part I: Enclosing surface methods. Int. J. Fatigue 2012, 42, 217–226. [Google Scholar] [CrossRef]
  22. Meggiolaro, M.A.; de Castro, J.T.P. An improved multiaxial rainflow algorithm for non-proportional stress or strain histories—Part II: The Modified Wang-Brown method. Int. J. Fatigue 2012, 42, 194–206. [Google Scholar] [CrossRef]
  23. Margetin, M.; Biro, D. Multiaxial cycle counting method for non-proportional multiaxial variable loading signals based on modified maximal shear stress. MATEC Web Conf. 2019, 300, 17003. [Google Scholar] [CrossRef] [Green Version]
  24. Findley, W.N. Fatigue of metals under combinations of stresses. Trans. ASME 1957, 79, 1337–1347. [Google Scholar] [CrossRef]
  25. Findley, W.N. A theory for the effect of mean stress on fatigue of metals under combined torsion and axial load or bending. Trans. ASME 1959, 81, 301–305. [Google Scholar] [CrossRef]
  26. McDiarmid, D.L. A general criterion for high cycle multiaxial fatigue failure. Fatigue Fract. Eng. Mater. Struct. 1991, 14, 429–453. [Google Scholar] [CrossRef]
  27. McDiarmid, D.L. A shear stress based critical plane criterion of multiaxial fatigue failure for design and life prediction. Fatigue Fract. Engng. Mater. Struct. 1994, 17, 1475–1484. [Google Scholar] [CrossRef]
  28. Dang Van, K.; Griveau, B.; Message, O. On a New Multiaxial Fatigue Limit Criterion: Theory and Application. Biaxial and Multiaxial Fatigue, EGF 3; Mechanical Engineering Publications: London, UK, 1989; pp. 479–496. [Google Scholar]
  29. Dang-Van, K. Macro-micro approach in high-cycle multiaxial fatigue. In Advances in Multiaxial Fatigue; ASTM STP 1191; McDowell, D.L., Ellis, R., Eds.; American Society for Testing and Materials: Philadelphia, PA, USA, 1993; pp. 120–130. [Google Scholar]
  30. Carpinteri, A.; Spagnoli, A. Multiaxial high-cycle fatigue criterion for hard metals. Int. J. Fatigue 2001, 23, 135–145, ISSN 0142-1123. [Google Scholar] [CrossRef]
  31. Fatemi, A.; Socie, D.F. A critical plane approach to multiaxial fatigue damage including out-of-phase loading. Fatigue Fract. Eng. Mater. Struct. 1988, 11, 149–165. [Google Scholar] [CrossRef]
  32. Brown, M.W.; Miller, K.J. A Theory for Fatigue Failure under Multiaxial Stress-Strain Conditions. Proc. Inst. Mech. Eng. 1973, 187, 745–755. [Google Scholar] [CrossRef]
  33. Smith, R.N.; Watson, P.; Topper, T.H. A stress-strain parameter for the fatigue of metals. J. Mater. 1970, 5, 767–778. [Google Scholar]
  34. Margetin, M.; Ďurka, R.; Chmelko, V. Multiaxial fatigue criterion based on parameters from torsion and axial S-N curve. Frat. Ed Integrita Strutt. 2016, 10, 146–152. [Google Scholar] [CrossRef] [Green Version]
  35. Morrow, J. Fatigue Properties of Metals. In Fatigue Design Handbook; Section 3.2, Pub. No. AE-4; Society of Automotive Engineers: Warrendale, PA, USA, 1968. [Google Scholar]
  36. Palmgren, A.G. Die Lebensdauer von Kugellagern (Life Length of Roller Bearings or Durability of Ball Bearings). Zeitschrift des Vereines Deutscher Ingenieure (ZVDI), 14, 339-341.Miner, M.A. (1945) Cumulative Damage in Fatigue. J. Appl. Mech. 1924, 3, 159–164. [Google Scholar]
  37. Darrell, S.; Marquis, G.B. Multiaxial Fatigue; Society of Automotive Engineers: Warrendale, PA, USA, 2000. [Google Scholar]
  38. Araújo, J.A.; Dantas, A.P.; Castro, F.C.; Mamiya, E.N.; Ferreira, J.L.A. On the characterization of the critical plane with a simple and fast alternative measure of the shear stress amplitude in multiaxial fatigue. Int. J. Fatigue 2011, 33, 1092–1100. [Google Scholar] [CrossRef]
  39. Van Dang, K.; Le Douaron, A.; Lieurade, H.P. Multiaxial Fatigue Limit: A New Approach. Fracture 84; Elsevier: Amsterdam, The Netherlands, 1984; pp. 1879–1885. [Google Scholar] [CrossRef] [Green Version]
  40. Graham, R.L. An efficient algorith for determining the convex hull of a finite planar set. Informat. Process. Lett. 1972, 1, 132–133. [Google Scholar] [CrossRef]
  41. Anes, V.; Reis, L.; Freitas, M. Effect of Shear/Axial Stress Ratio on Multiaxial Non-Proportional Loading Fatigue Damage on AISI 303 Steel. Metals 2022, 12, 89. [Google Scholar] [CrossRef]
Figure 1. Estimating loading histories in the critical place.
Metals 12 01277 g001
Figure 2. Accelerometer positions on bicycle frame: 1—longitudinal direction (x); 2—lateral direction (y); 3—vertical direction (z).
Metals 12 01277 g002
Figure 3. Measured signal before filtering.
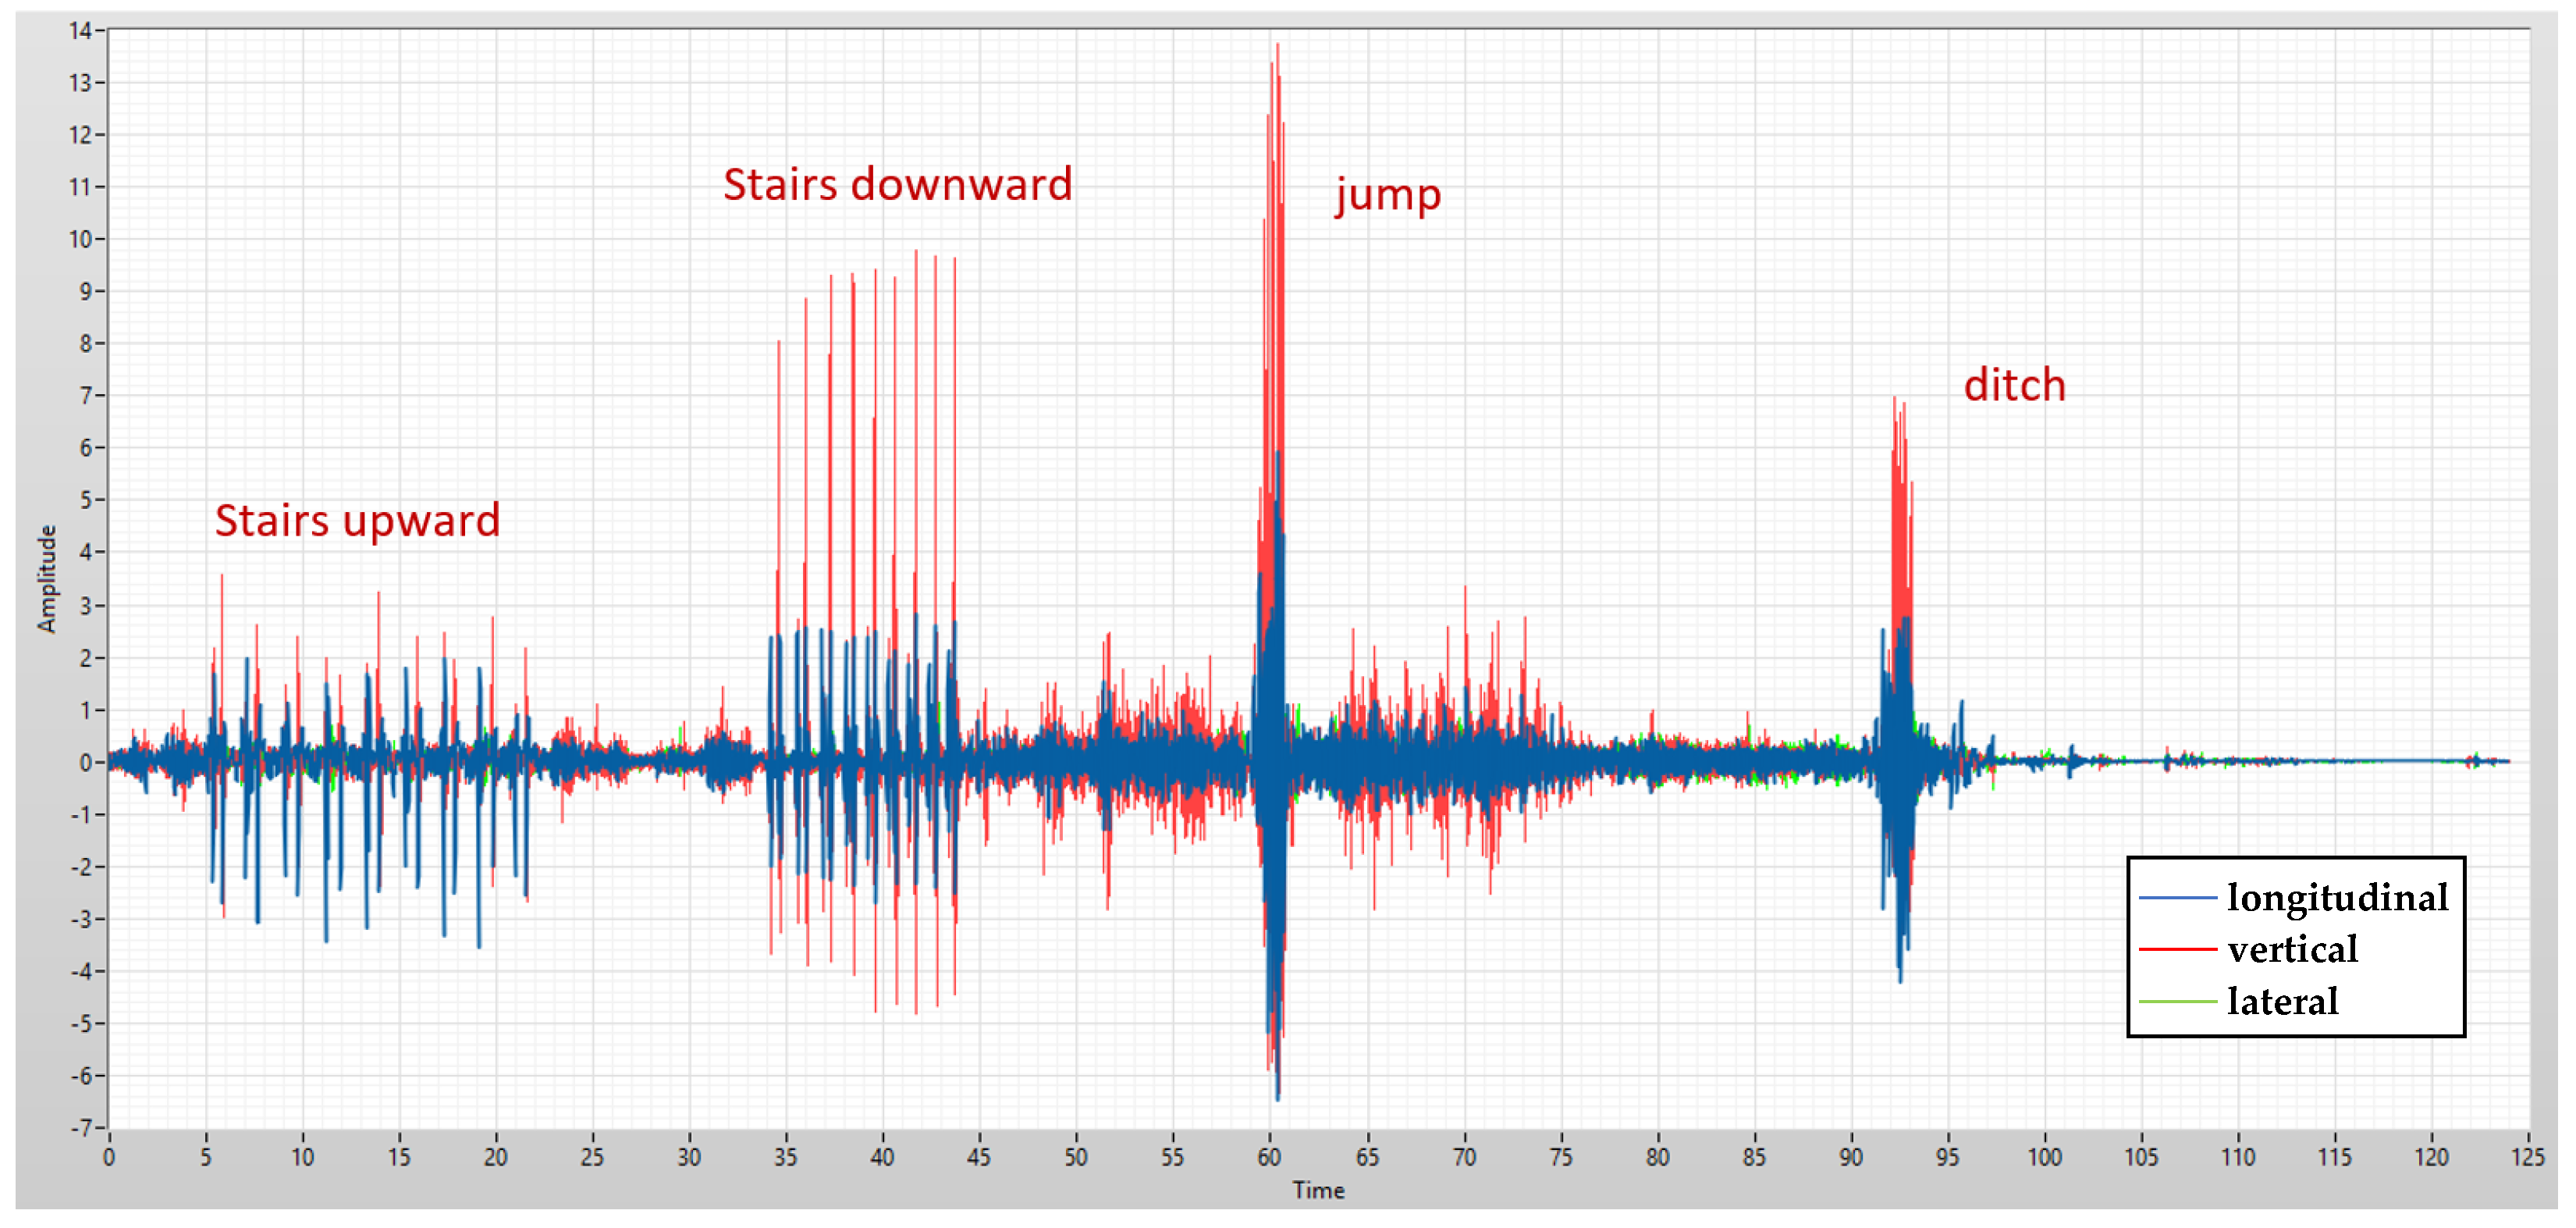
Metals 12 01277 g003
Figure 4. Filtered signals for each obstacle type, from left to right: ditch, stairs and jump.
Metals 12 01277 g004
Figure 5. FEM model with the critical place of the structure.
Metals 12 01277 g005
Figure 6. Area of expected failure.
Metals 12 01277 g006
Figure 7. Geometry of the experimental specimens (in millimetres). AM—left; cast—right.
Metals 12 01277 g007
Figure 8. The Basquin curves for the AM specimens with experimental points.
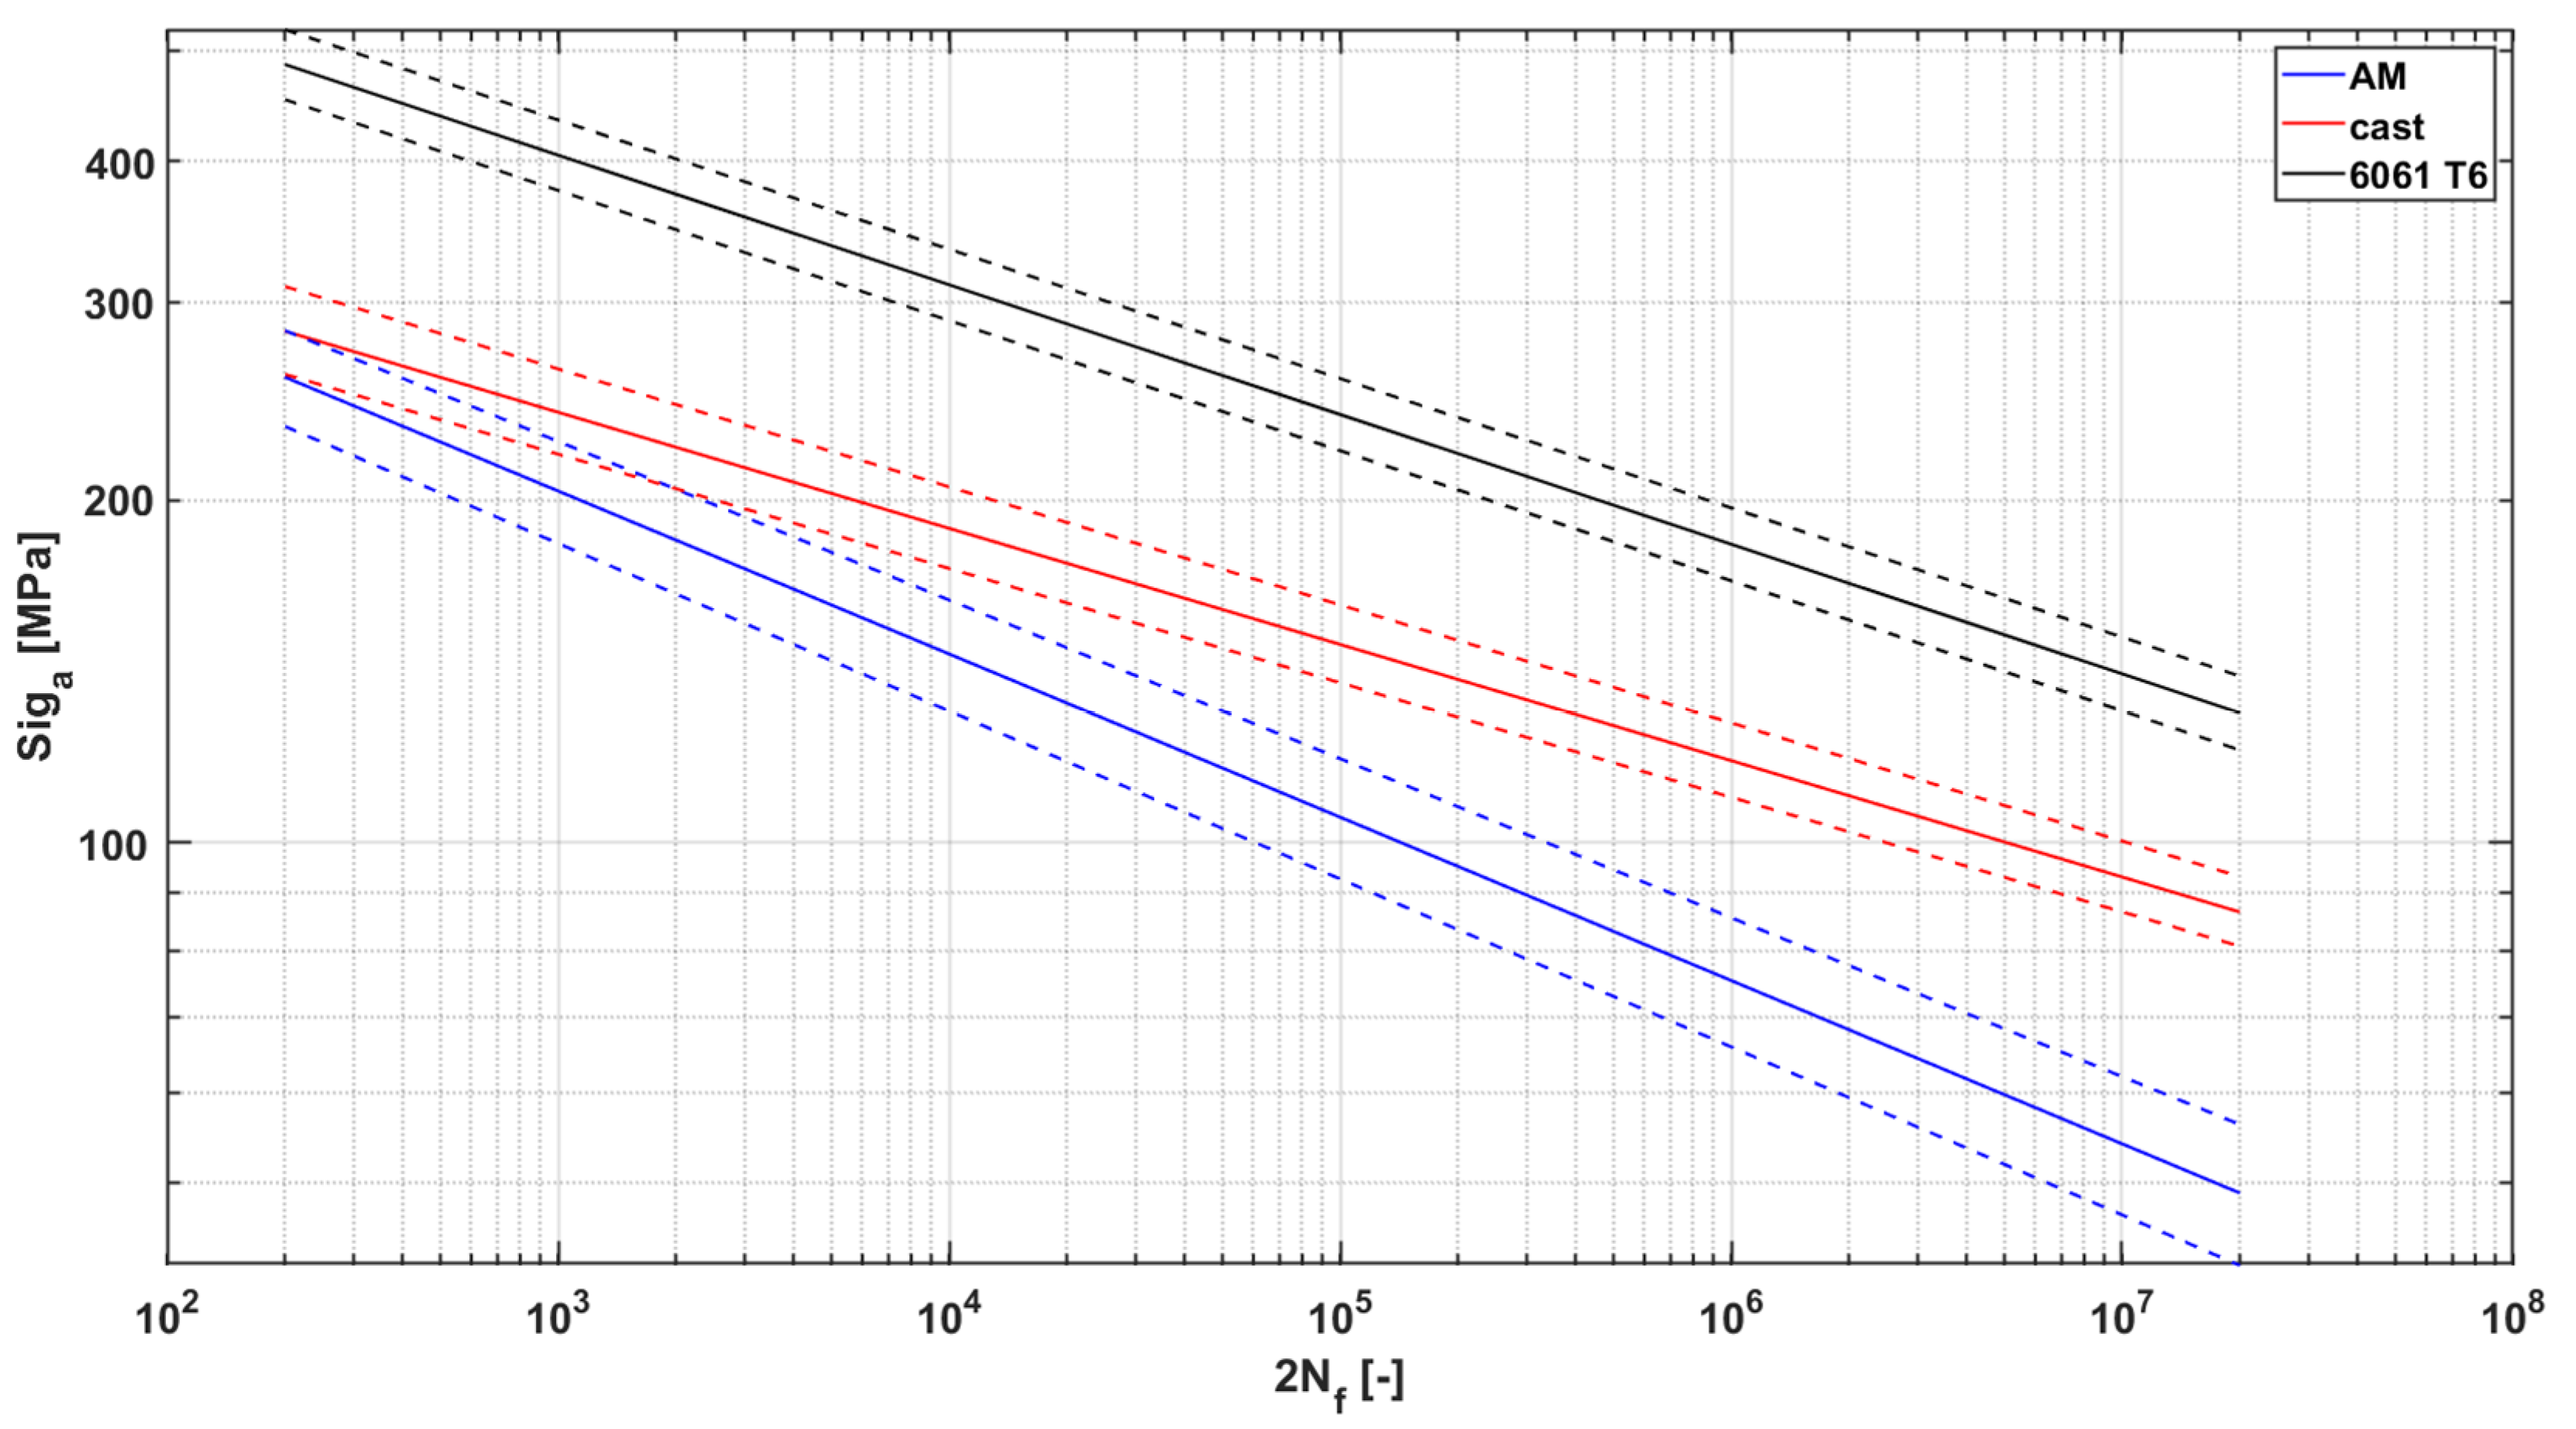
Metals 12 01277 g008
Figure 9. Comparison of Basquin curves for each analysed material.
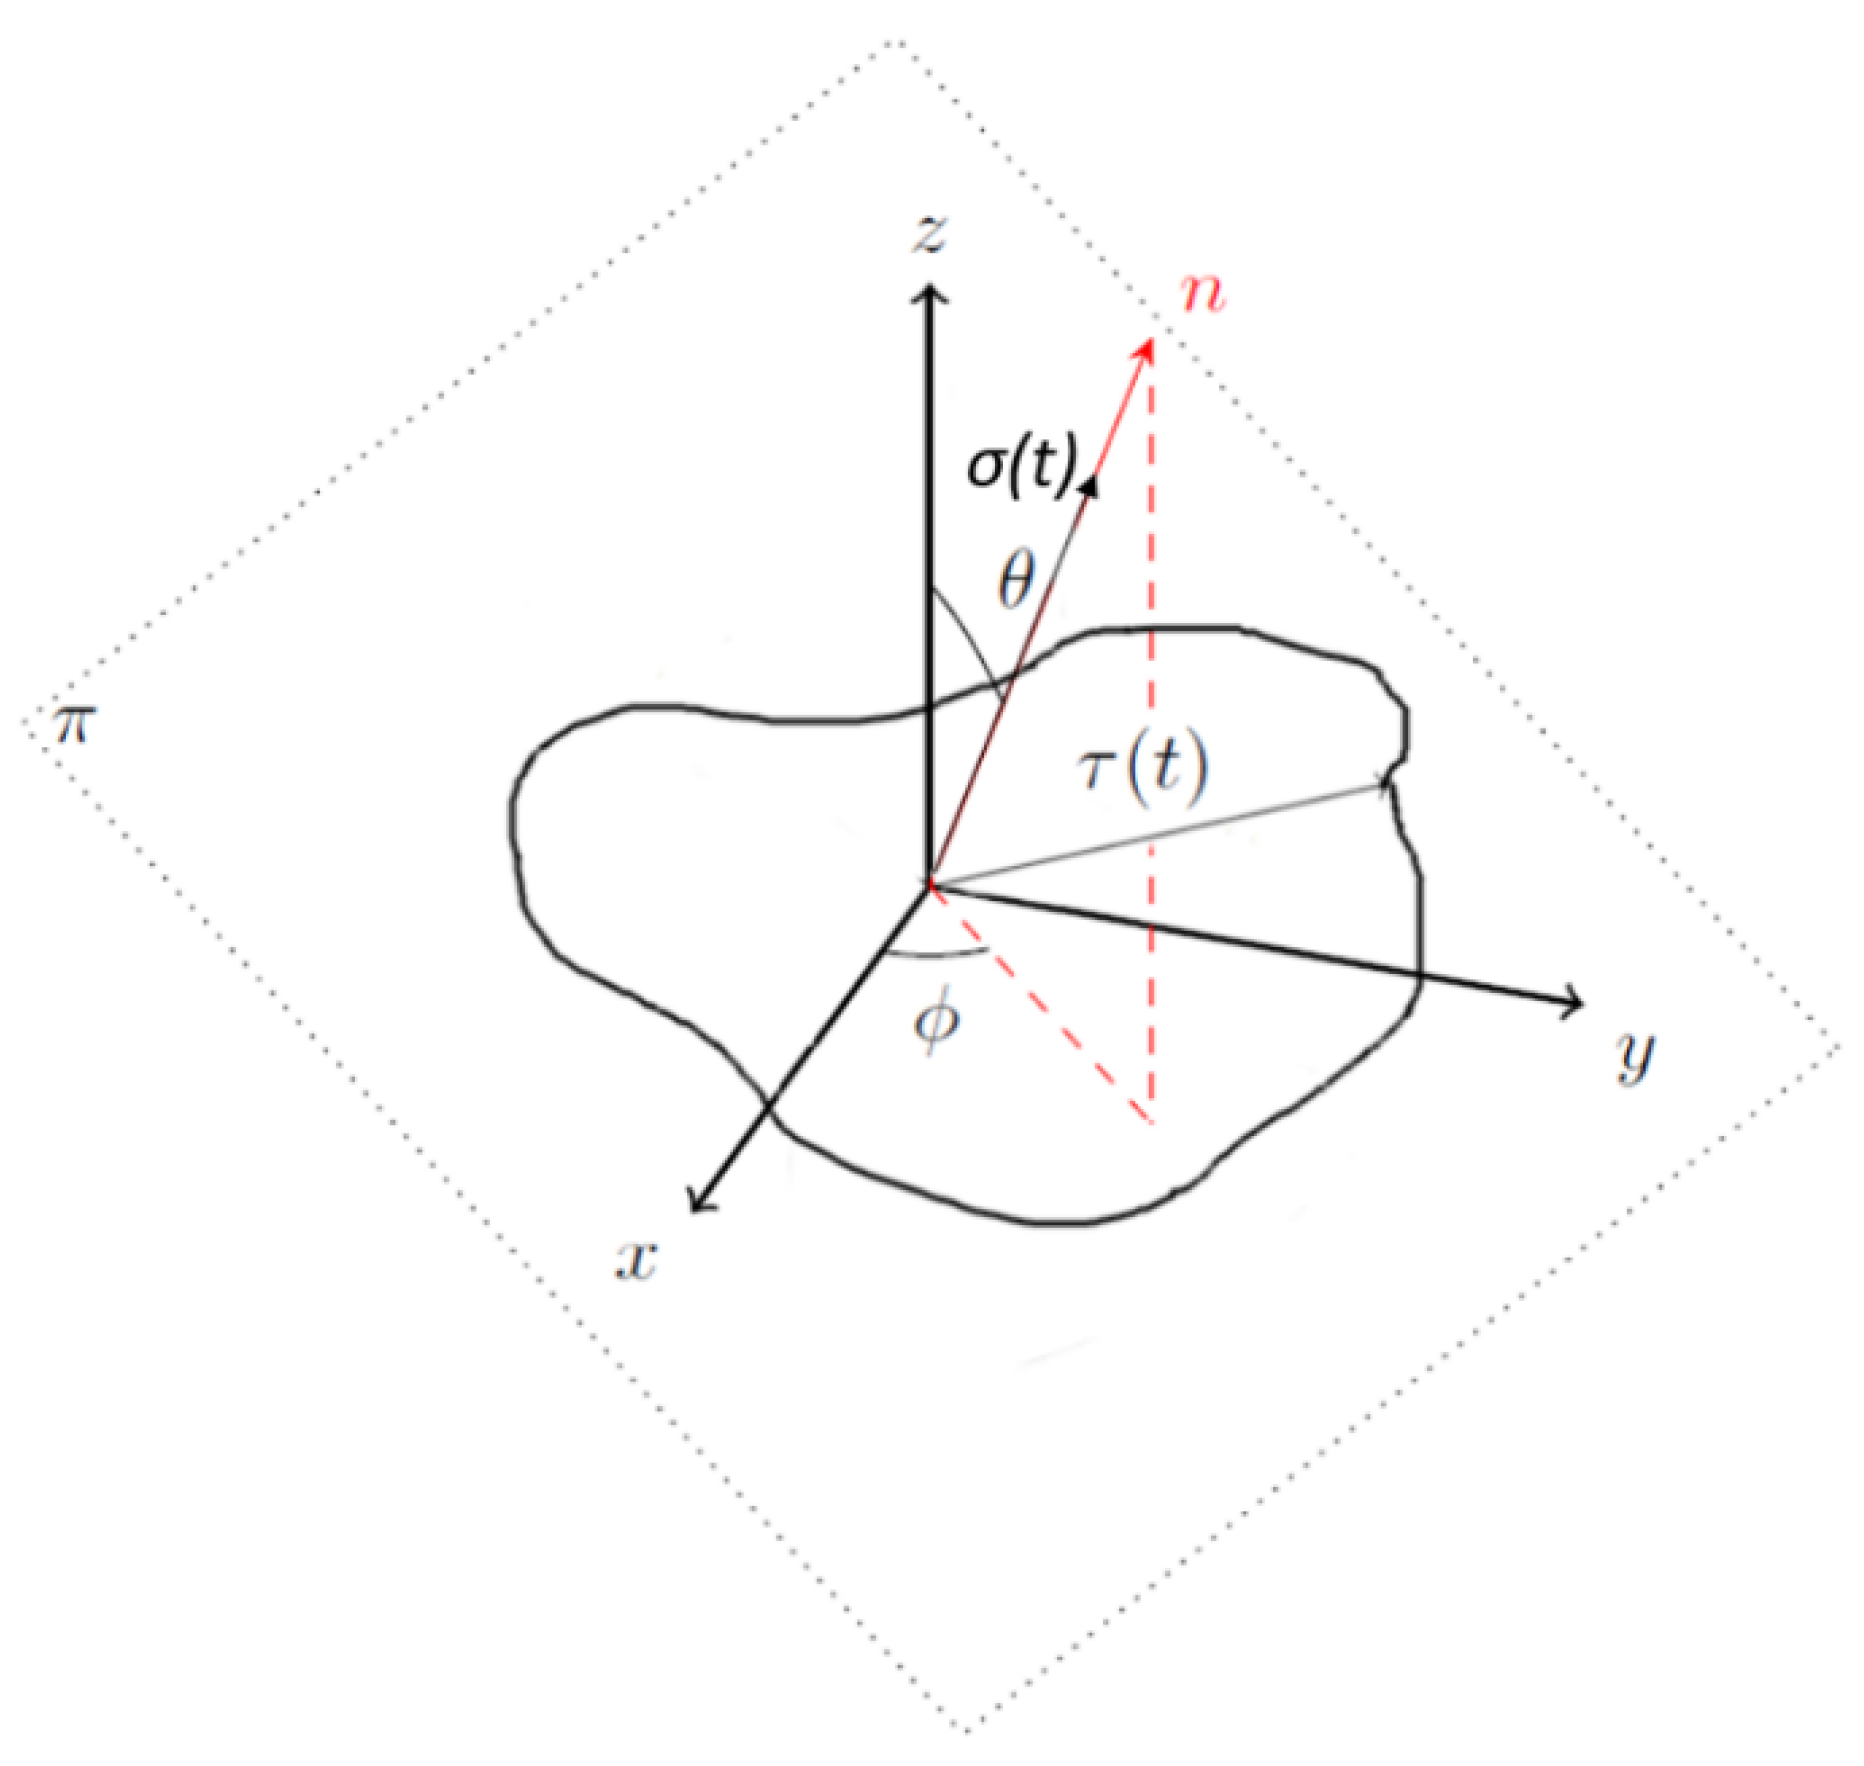
Metals 12 01277 g009
Figure 10. Normal stress and shear stress path in a material plane.
Metals 12 01277 g010
Figure 11. Fatigue lifetime distribution function for each obstacle.
Metals 12 01277 g011
Figure 12. Fatigue lifetime distribution function of loading history consisting of 5 ditches, 20 stairs and 4 jumps.
Metals 12 01277 g012
Table 1. Maximal acceleration in each direction and obstacle type.
Tyre PressureMaximal Acceleration
Vertical Lateral Longitudinal
24 psi2.2 g (stairs)0.3 g (stairs)0.5 g (stairs)
2.4 g (ditch)0.5 g (ditch)1.4 g (ditch)
2.8 g (jump)0.7 g (jump)0.9 g (jump)
Table 2. Chemical compositions of tested AlSi10Mg specimens.
AlSi10MgSi [%]Mg [%]Fe [%]Ti [%]Mn [%]Cu [%]Zn [%]
Cast10.20.3460.1120.1210.0460.00170.02
AM10.10.380.09<0.03<0.03<0.03<0.03
Table 3. Experimental results of the cyclic test of AlSi10Mg.
VerticalHorizontalCast
nσa [MPa]Nfnσa [MPa]Nfnσa [MPa]Nf
199.496,8681106.06143,4551111420,028
279.54531,1372160.799045214267,842
388.42260,9693131.9439,1713104.62,000,000 *
4100.155,256484.652,000,000 *4131.3159,821
578.22216,330592.64326,5675125.6525,180
681.09651,087694.73146,8276147.1107,620
773.02183,515787.081,780,16871679939
896.31121,432892.874,8088125.6404,954
9103.5531,253982.3269,0579116.2407,764
1063.872,351,5641079.542,050,569
* Test stopped after 2,000,000 cycles.
Table 4. Cyclic material parameters.
Mat.Cyclic Axial
RL97.5% PI2.5% PI
σf′ [MPa]bσ [-]σf′ [MPa]bσ [-]σf′ [MPa]bσ [-]
AM_Vertical553−0.1442595−0.1404511−0.1483
AM_Horizontal651−0.1449956−0.1587472−0.1332
Cast488−0.1028539−0.1044443−0.1012
Al6061-T6 [6]895−0.1148959−0.1145834−0.1151
Table 5. Fatigue limit used in fatigue lifetime estimation.
Mat.Cyclic Axial
RL97.5% PI2.5% PI
σc,R = −1 [MPa]σc,R = 0 [MPa]σc,R = −1 [MPa]σc,R = 0 [MPa]σc,R = −1 [MPa]σc,R = 0 [MPa]
AM Vertical625571625449
Cast10282110869577
Al6061-T6156131168137145126
Table 6. Number of obstacle repetitions to failure corresponding to 50% probability of occurrence.
Mat.DitchStairJump
NfNfNf
AM73.6104.234.3
Cast166.7211.555.9
Al6061-T619,737.527,313.87375.9
Publisher’s Note: MDPI stays neutral with regard to jurisdictional claims in published maps and institutional affiliations.

