Article

Comparison between Fractal and Statistical Approaches to Model Size Effects in VHCF

by
Stefano Invernizzi
1,*,†,
Davide Paolino
2,†,
Francesco Montagnoli
1,†,
Andrea Tridello
2,† and
Alberto Carpinteri
1,3,†
1
Department of Structural, Geotechnical and Building Engineering, Politecnico di Torino, Corso Duca degli Abruzzi 24, 10129 Torino, Italy
2
Department of Mechanical and Aerospace Engineering, Politecnico di Torino, Corso Duca degli Abruzzi 24, 10129 Torino, Italy
3
Department of Civil and Environmental Engineering, Shantou University, Shantou 515063, China
*
Author to whom correspondence should be addressed.
These authors contributed equally to this work.
Metals 2022, 12(9), 1499; https://doi.org/10.3390/met12091499
Submission received: 3 August 2022 / Revised: 2 September 2022 / Accepted: 3 September 2022 / Published: 10 September 2022
(This article belongs to the Special Issue New Trends in Fatigue of Metals)

Abstract

:
Size effects concern the anomalous scaling of relevant mechanical properties of materials and structures over a sufficiently wide dimensional range. In the last few years, thanks to technological advances, such effects have been experimentally detected also in the very high cycle fatigue (VHCF) tests. Research groups at Politecnico di Torino are very active in this field, observing size effects on fatigue strength, fatigue life and fatigue limit up to the VHCF regime for different metal alloys. In addition, different theoretical models have been put forward to explain these effects. In the present paper, two of them are introduced, respectively based on fractal geometry and statistical concepts. Furthermore, a comparison between the models and experimental results is provided. Both models are able to predict the decrement in the fatigue life and in the conventional fatigue limit.

1. Introduction

During the last decades, ultrasonic fatigue testing machines (UFTMs) have been widely exploited to explore the fatigue mechanical behaviour of materials in the very-high cycle fatigue (VHCF) domain [1], permitting to test specimens beyond one billions of cycles in a reasonable testing time. Recently, in many different mechanical and aeronautical applications the design standards prescribe to extend the fatigue life of structural components up to a number of cycles higher than 100 millions, i.e., in the VHCF domain [2]. Therefore, it follows that these kind of fatigue testing machines have allowed for an easier investigation of the VHCF behaviour, since the specimens are broken by means of very-high frequency mechanical vibrations with a rather small amplitude [3,4]. More recently, the concept of very-high-cycle low-amplitude fatigue has been applied to the field of civil engineering to explain the collapse of the Morandi bridge (Italy) [5,6,7]. In fact, according to Invernizzi et al. [8] the failure of the stay cables of Polcevera viaduct may have been triggered from the combined effect of gigacycle fatigue and corrosion.
On the other hand, a tricky and arising question involving the UFTMs is whether the influence of the frequency affects the obtained VHCF mechanical properties. Generally, no significant frequency influences have been observed on the fatigue response of metallic materials if the time-dependent phenomena are avoided and the fatigue tests are performed at cyclic frequencies in the range from 1 up to about 1000 Hz [2]. On the other hand, it should be considered that UFTMs work at a much higher frequency than the one commonly reachable with conventional fatigue testing machines, which make yet controversial the application of this kind of technology to characterise the fatigue response of a material. On the other hand, comparative investigations concerning the study of the frequency dependence on the VHCF response showed that the main important contributions are caused by the strain rate and environment conditions [2]. More in details, it was found that differences in the VHCF lifetime with the loading frequency can be explained by the strain-rate dependence of materials with a body-centred cubic (BCC) lattice due to changes in their cyclic stress-strain behaviour. In addition, it was observed that different fatigue strengths could be also found for materials with a face-centred cubic crystal (FCC) lattice due to the effect of the testing environment, although the strain-rate influence on the fatigue response is negligible [2].
Another open issue in the understanding of gigacycle fatigue behaviors concerns the effect of specimen size on the fatigue response. An accurate prediction of metallic components against fatigue failures requires the development of theoretical models able to predict the effect of the loaded volume on the fatigue strength [9]. In fact, it is well-known that the component size strongly affects the gigacycle fatigue resistance [10]. On the other hand, in order to avoid time-consuming and expensive full-scale fatigue experiments, the laboratory tests are often conducted with specimens much smaller than the actual machine components [11]. In addition, due to the need to guarantee a resonance frequency of the specimens very close to the working frequency of the UFTMs, sample size range able to be tested with this kind of fatigue apparatus is often limited. As a consequence, it becomes of paramount importance to have appropriate theoretical models to achieve the required structural integrity and reliability.
The first attempt to study the statistical size effect on the VHCF response was done by Furuya [12,13,14], who carried out ultrasonic fatigue tests on high-strength steel samples with a risk-volume ranging between 33 mm 3 and 781 mm 3 . From this experimental campaign, it was found that the larger specimens showed lower fatigue resistance due to the appearance of larger inclusions in the fish-eye fracture origin. In fact, it is well-known that crack nucleation in the VHCF domain is originated from the largest inclusion embedded in the risk-volume, which represents the weakest site within the highly-stressed volume [15,16,17]. Hence, since the VHCF fracture mechanism is governed by the defect population, it follows that the gigacycle fatigue strength can be related to the size of the largest defect within the risk-volume according to Murakami’s model [18,19]. On the other hand, the probability to find pores of larger size increases with the risk-volume [20], so that the VHCF resistance turns out dependent on the specimen size.
Few years later, uniaxial ultrasonic fatigue tests at constant amplitude were performed by Xue et al. [21] on a set of aluminium-silicon-copper cast alloy hourglass samples with two different diameters in the middle cross-section. They observed that the fatigue crack initiation was always originated by pores located in the sub-surface. Furthermore, a detrimental effect of the risk-volume on the fatigue life was also found in this aluminium cast alloy.
The influence of size-effects has been also investigated by testing the so-called Gaussian specimens with a geometry that allows to increase the tested risk-volume in ultrasonic fatigue tests and ensures an almost uniform stress distribution along the gage length [22]. This specimen geometry has been exploited to investigate the influence of size-effect in H13 steels with different degrees of cleanliness [23,24,25] and in AlSi10Mg alloy specimens produced through Additive Manufacturing (AM) technologies [26]. For the H13 steel, experimental tests have been carried out on specimens with risk-volumes from 50 mm 3 to about 5000 mm 3 [23,25]. The experimental results have shown that size-effect significantly affects the VHCF response for this kind of steel and the main reason has been attributed to the increment in inclusion size with the risk-volume [23,24,25]. Accordingly, by increasing the material cleanliness, a reduction in the influence of size-effects should be expected. The analysis of the experimental results on AlSi10Mg specimens with risk-volumes ranging from 250 mm 3 to about 2300 mm 3 has confirmed that the defect size increment with the risk-volume mainly controls size-effects in VHCF. However, the Authors in [25,27] pointed out that the analysis of the defect size distribution is not enough for properly modelling size effects, but the stress gradient and the stress distribution within the risk-volume should be also taken into account.
In the present paper, two models for the analysis of size effects in VHCF are proposed. The first method is based on fractal geometry concepts, whereas the second method is based on the weakest link principle and starts from the stress gradient within the risk-volume and from the statistical distribution of the fatigue life. In the first part of the paper, the analytical formulation of the proposed models is provided. Thereafter, the models are validated on experimental data obtained by testing hourglass and dog-bone specimens made of the aluminum alloy EN-AW6082 T6.

2. Methodologies

2.1. The Fractal Approach

In this sub-section, a theoretical model for the assessment of the specimen-size dependent P-S-N curves will be described. Almost three decades ago, the fractal geometry was successfully adopted by Carpinteri to model the size effect on the ultimate tensile strength and fracture energy of quasi-brittle materials [28,29]. In this framework, the property of self-similarity of the whole defect population is taken into account by adopting a fractal geometrical model [30]. Subsequently, Macek [31,32] studied the correlation between fractal dimension of the fracture surface and fatigue loading condition for aluminium and steel alloy samples. Another interesting application of the fractal geometry was done by Niccolini et al. [33] to study the influence of microstructural disorder on creeping materials.
More recently, the concept of fractality was exploited to provide a theoretical explanation for the decrement in VHCF resistance with the structural size [34]. In this context, the disorder due to inherent defects is taken into account by assuming that the reacting section, or ligament, of a disordered material is a lacunar fractal set with a non-integer dimension lower than 2. Therefore, according to [35,36,37], a negative scaling law for the VHCF strength can be assumed:
Δ σ = Δ σ * b d σ ,
where Δ σ * is the fractal VHCF resistance, with physical dimensions given by F L ( 2 d σ ) , b is the characteristic specimen size, whereas d σ is the dimensional decrement of the reacting cross-section, which considers the disordered nature of the material microstructure due to the presence of cracks and voids population. It is worth to note that the term Δ σ * is invariant with respect to the scale of observation, i.e., it can be considered as the true material VHCF resistance, for a fixed number of cycles. Furthermore, since d σ ranges from 0 up to 0.5, a decrement in the VHCF resistance is expected by Equation (1).
Analogously, a similar negative scaling law can be written for the intercept with the ordinate axis of the median S-N curve, Δ σ 0 ; 50 % :
Δ σ 0 ; 50 % = Δ σ 0 ; 50 % * b d σ ,
where the term Δ σ 0 ; 50 % * is the intercept of the median fractal S-N curve.
On the other hand, when designing structural components under the action of cyclic loadings, one of the factors that must be considered is the probabilistic nature of the fatigue behaviour of the metallic materials [38]. In other words, due to the large dispersion of the experimental data, it is needed to implement a statistical approach for the construction of proper S-N curves, which makes it possible to design the structural component with a sufficient safety margin against the fatigue failure during their service life. In the following, it is assumed that the normalised fatigue life, N ¯ , is described by the two-parameter Weibull distribution:
P ( N ¯ ) = 1 exp N ¯ β ¯ α ¯ ,
which allows to assess the probability of failure of a structural component. In Equation (3) it has been implicitly assumed that the shape and scale parameters, α ¯ and β ¯ respectively, are considered constant for all the stress levels, since the probability of failure is defined in terms of the normalised fatigue life. This new random variable is derived by dividing the number of cycles to failure N, obtained experimentally for a certain stress range Δ σ ¯ , by the corresponding median fatigue life, which is assessed according to the following equation:
N 50 % = Δ σ 0 ; 50 % Δ σ ¯ m .
This strategy, proposed in [38] and subsequently exploited in [34,39], is a very effective and robust technique capable of estimating the two Weibull parameters with reduced data samples. The best fitting parameters can be assessed by the Maximum Likelihood Method (MLM), which is a very versatile and reliable method [40]. Subsequently, it is possible to compute S-N curves for a different probability of failure, P, by using the following expression according to [38]:
N = β ¯ ln 1 P 1 / α ¯ Δ σ 0 , 50 % Δ σ m ,
where Δ σ 0 , 50 % and m are the best-fitting parameters of the median stress-life curve, whereas α ¯ and β ¯ are the two Weibull distribution parameters. Hence, Equation (4) makes it possible to obtain the analytical expression for the probabilistic stress-life curves.
Subsequently, the relationship for the specimen-size dependent probabilistic stress-life curves can be obtained by substituting Equation (2) in Equation (5):
N = β ¯ ln 1 P 1 / α ¯ Δ σ 0 , 50 % * Δ σ m b m d σ ,
which yields to a vertical downward translation of P-S-N curves by increasing the specimen size. In other words, Equation (6) predicts a decrement in the VHCF life with the specimen size, for a fixed stress range and probability of failure. Analogously, Equation (6) can be rewritten by expressing the VHCF resistance as a function of the number of cycles, N:
Δ σ = Δ σ 0 , 50 % * N 1 / m b d σ { β ¯ ln 1 P 1 / α ¯ } 1 / m .
This equation implies that, the larger the specimen dimension, the lower the VHCF strength, being N and P the same. In addition, if Equation (1) is substituted into Equation (6), the nominal VHCF resistance is replaced by the corresponding fractal quantity, so that the set of specimen-size dependent P-S-N curves collapse onto a single specimen-size independent fractal stress-life, P-S*-N, curve:
N = β ¯ ln 1 P 1 / α ¯ Δ σ 0 , 50 % * Δ σ * m .
Thus, Equation (8) can be considered as an intrinsic material property, since it is no longer specimen-size dependent. Thus, although the introduction of the fractal model leads to work with mechanical quantities having non-integer and unfamiliar physical dimensions, this is the quid pro quo to be paid for having the true VHCF resistance of the material. Eventually, note that the analytical expression of the median fractal stress-life curve can be obtained by setting P = 0.5 :
N = Δ σ 0 , 50 % * Δ σ * m .

2.2. A New Statistical Approach

In this sub-section, the statistical model accounting for size-effects in VHCF is described. The objective of this model is to collapse data obtained by testing parts with different sizes and volumes into one ’master curve’ that can be used for the design of components. The part volume is discretized in sub-volumes subjected to an almost constant stress [27]. This can be easily achieved with a finite element analysis.
In general, the cumulative distribution (CDF, F N | s = s i , v = 1 ) of the fatigue life of a generic element with unit volume ( v = 1 ) subjected to an applied stress amplitude s equal to s i ( s = s i ) is reported in the following equation:
P N | s = s i , v = 1 n = F N | s = s i , v = 1 n ; s M A X , s i s M A X ,
where N is the random fatigue life (i.e., number of cycles to failure random variable), n is the determination of N and s M A X is the maximum applied stress amplitude within the component volume. Accordingly, Equation (10) expresses the probability of a VHCF fatigue failure in an element volume due to an applied stress amplitude equal to s i . The probability of a fatigue life larger than n (reliability) can be easily obtained from Equation (10):
P N | s = s i , v = 1 > n = R N | s = s i , v = 1 n ; s M A X , s i s M A X = 1 F N | s = s i , v = 1 .
The fatigue life, N i , of a group of elements characterized by a volume v i obtained as the sum of v i unit volumes subjected to the stress amplitude s i , corresponds to the minimum among the fatigue lives of each element in the group, according to the Weakest Link Principle:
N i = min N | s = s i , v = 1 1 , N | s = s i , v = 1 2 , , N | s = s i , v = 1 i , , N | s = s i , v = 1 v i .
Equation (12) can be also rewritten, according to Equation (10), as a function of the probability of failure:
F N i n ; S M A X , s i s M A X , v i = 1 i = 1 v i 1 F N | s = s i , v = 1 = 1 1 F N | s = s i , v = 1 v i .
Finally, the fatigue life of the component is the minimum among the fatigue lives related to all the applied stress amplitudes in the part (Equation (12)):
N = min N 1 , N 2 , , N i , , N n s ,
with a corresponding probability of failure:
F N n ; s M A X = 1 i = 1 n s 1 F N i n ; s M A X , s i S M A X , v i = 1 i = 1 n s 1 F N | s = s i , v = 1 v i .
With easy passages that involve a logarithmic transformation, it can be shown that the reliability of the investigated part becomes:
R N n ; s M A X = exp i = 1 n s v i ln R N | s = s i , v = 1 .
Equation (16) has a general form and models size-effects by considering the influence of the stress distribution within the component. A generic statistical distribution has been considered for the fatigue life. The statistical distribution of the fatigue life, which has not been defined yet, should be thereafter considered. According to the literature, a Weibull distribution has proven effective for modelling the VHCF life [25,41,42,43,44,45,46] and it will be considered also for the proposed model:
F N | s = s i , v = 1 n ; s M A X , s i s M A X = 1 exp n β i α ,
being β i and α the scale and the shape parameters, respectively. In order to model the dependency of the fatigue strength on the stress distribution, the scale parameter β i can be expressed as a function of the applied stress ratio, s r a t i o , i = s i s M A X :
β i = γ s M A X k · s i s M A X k = γ s M A X k · s r a t i o , i k ,
being γ a constant parameter to be estimated from the experimental data. By substituting Equations (17) and (18) in Equation (16), the reliability of the part can be expressed as:
R N n ; s M A X = exp n α γ s M A X k α i = 1 n s v i s r a t i o , i α k .
The terms in Equation (19) can be grouped to put in evidence an equivalent volume, v e q :
v e q = i = 1 n s v i s r a t i o , i α k = i = 1 n s v i s r a t i o , i δ ,
being δ a constant coefficient to be estimated from the experimental data, to improve the fitting capability of the model. Equation (19) can be further simplified by introducing an equivalent scale factor η e q :
η e q = γ · v e q 1 / α · s M A X k = γ · s e q , M A X k ,
being s e q , M A X = v e q 1 / k α s M A X . According to Equation (21), the scale factor η e q is a function of s e q , M A X , which in turn depends on v e q . Accordingly, data obtained through tests on specimens with different volumes can be considered together and collapsed into a unique ‘master curve’. With easy passages, the equivalent stress can be finally expressed as:
S e q , M A X = i = 1 n s v i s r a t i o , i δ δ 1 s M A X ,
and the probability of failure assumes the final compact form reported in the following equation:
F N ( n ; s e q , M A X ) = 1 exp n n e q s e q , M A X α .
The statistical model obtained in Equation (23) has been developed to assess the variation of the fatigue response with the component size. It has a compact form and depends on four parameters, α , β , γ , δ that must be estimated from the experimental data. It is based on the experimental evidence that the stress distribution within components has a significant influence on size-effects in VHCF, as discussed in [25]. The influence of the stress distribution is accounted by subdividing the total volume in sub-elements characterized by an almost uniform stress distribution and thereafter by applying the weakest-link principle. The final failure occurs when the weakest sub-element fails, i.e., the fatigue life of the component corresponds to the fatigue life of the weakest element. Previous models developed by the Authors [23,24,25,26,27] considered the statistical distribution of defect size and its variation with the component volume for modelling size-effects. The distribution of defect size can be assessed by measuring with a Scanning Electron Microscope (SEM) the size of the defects from which the crack has originated. However, the SEM is not always available in testing Labs or the defect originating the fatigue failure is not visible or easily measurable on the fracture surfaces. With the model in Equation (23), these possible critical aspects can be overcome. One of the main advantages of this method is that it models size-effects in VHCF starting from the stress distribution within the component, which can be easily obtained through a Finite Element Analysis. The variation of the fatigue strength with the part size is strongly influenced by the stress distribution in the part and not only depends on some geometric parameters, such as the diameter or the volume. For example, components with complex shapes, like those obtained through topology optimization and produced through Additive Manufacturing processes, are generally characterized by interconnected beams-like structures with different diameters and, for each of them, a limit strength should be assessed, making the design process rather difficult. On the other hand, when the risk-volume is considered for modelling size-effect, the influence of the stress distribution is not accounted for. The proposed statistical model allows to overcome these criticalities.
The block diagram showing the steps to be followed for the application of the statistical model described in Section 2.2 is reported in Figure 1.

3. Comparison with Experimental Results

In this section, fatigue data of an ultrasonic fatigue campaign investigating the size effect on aluminium alloy samples are analysed according to the two different models proposed in Section 2.

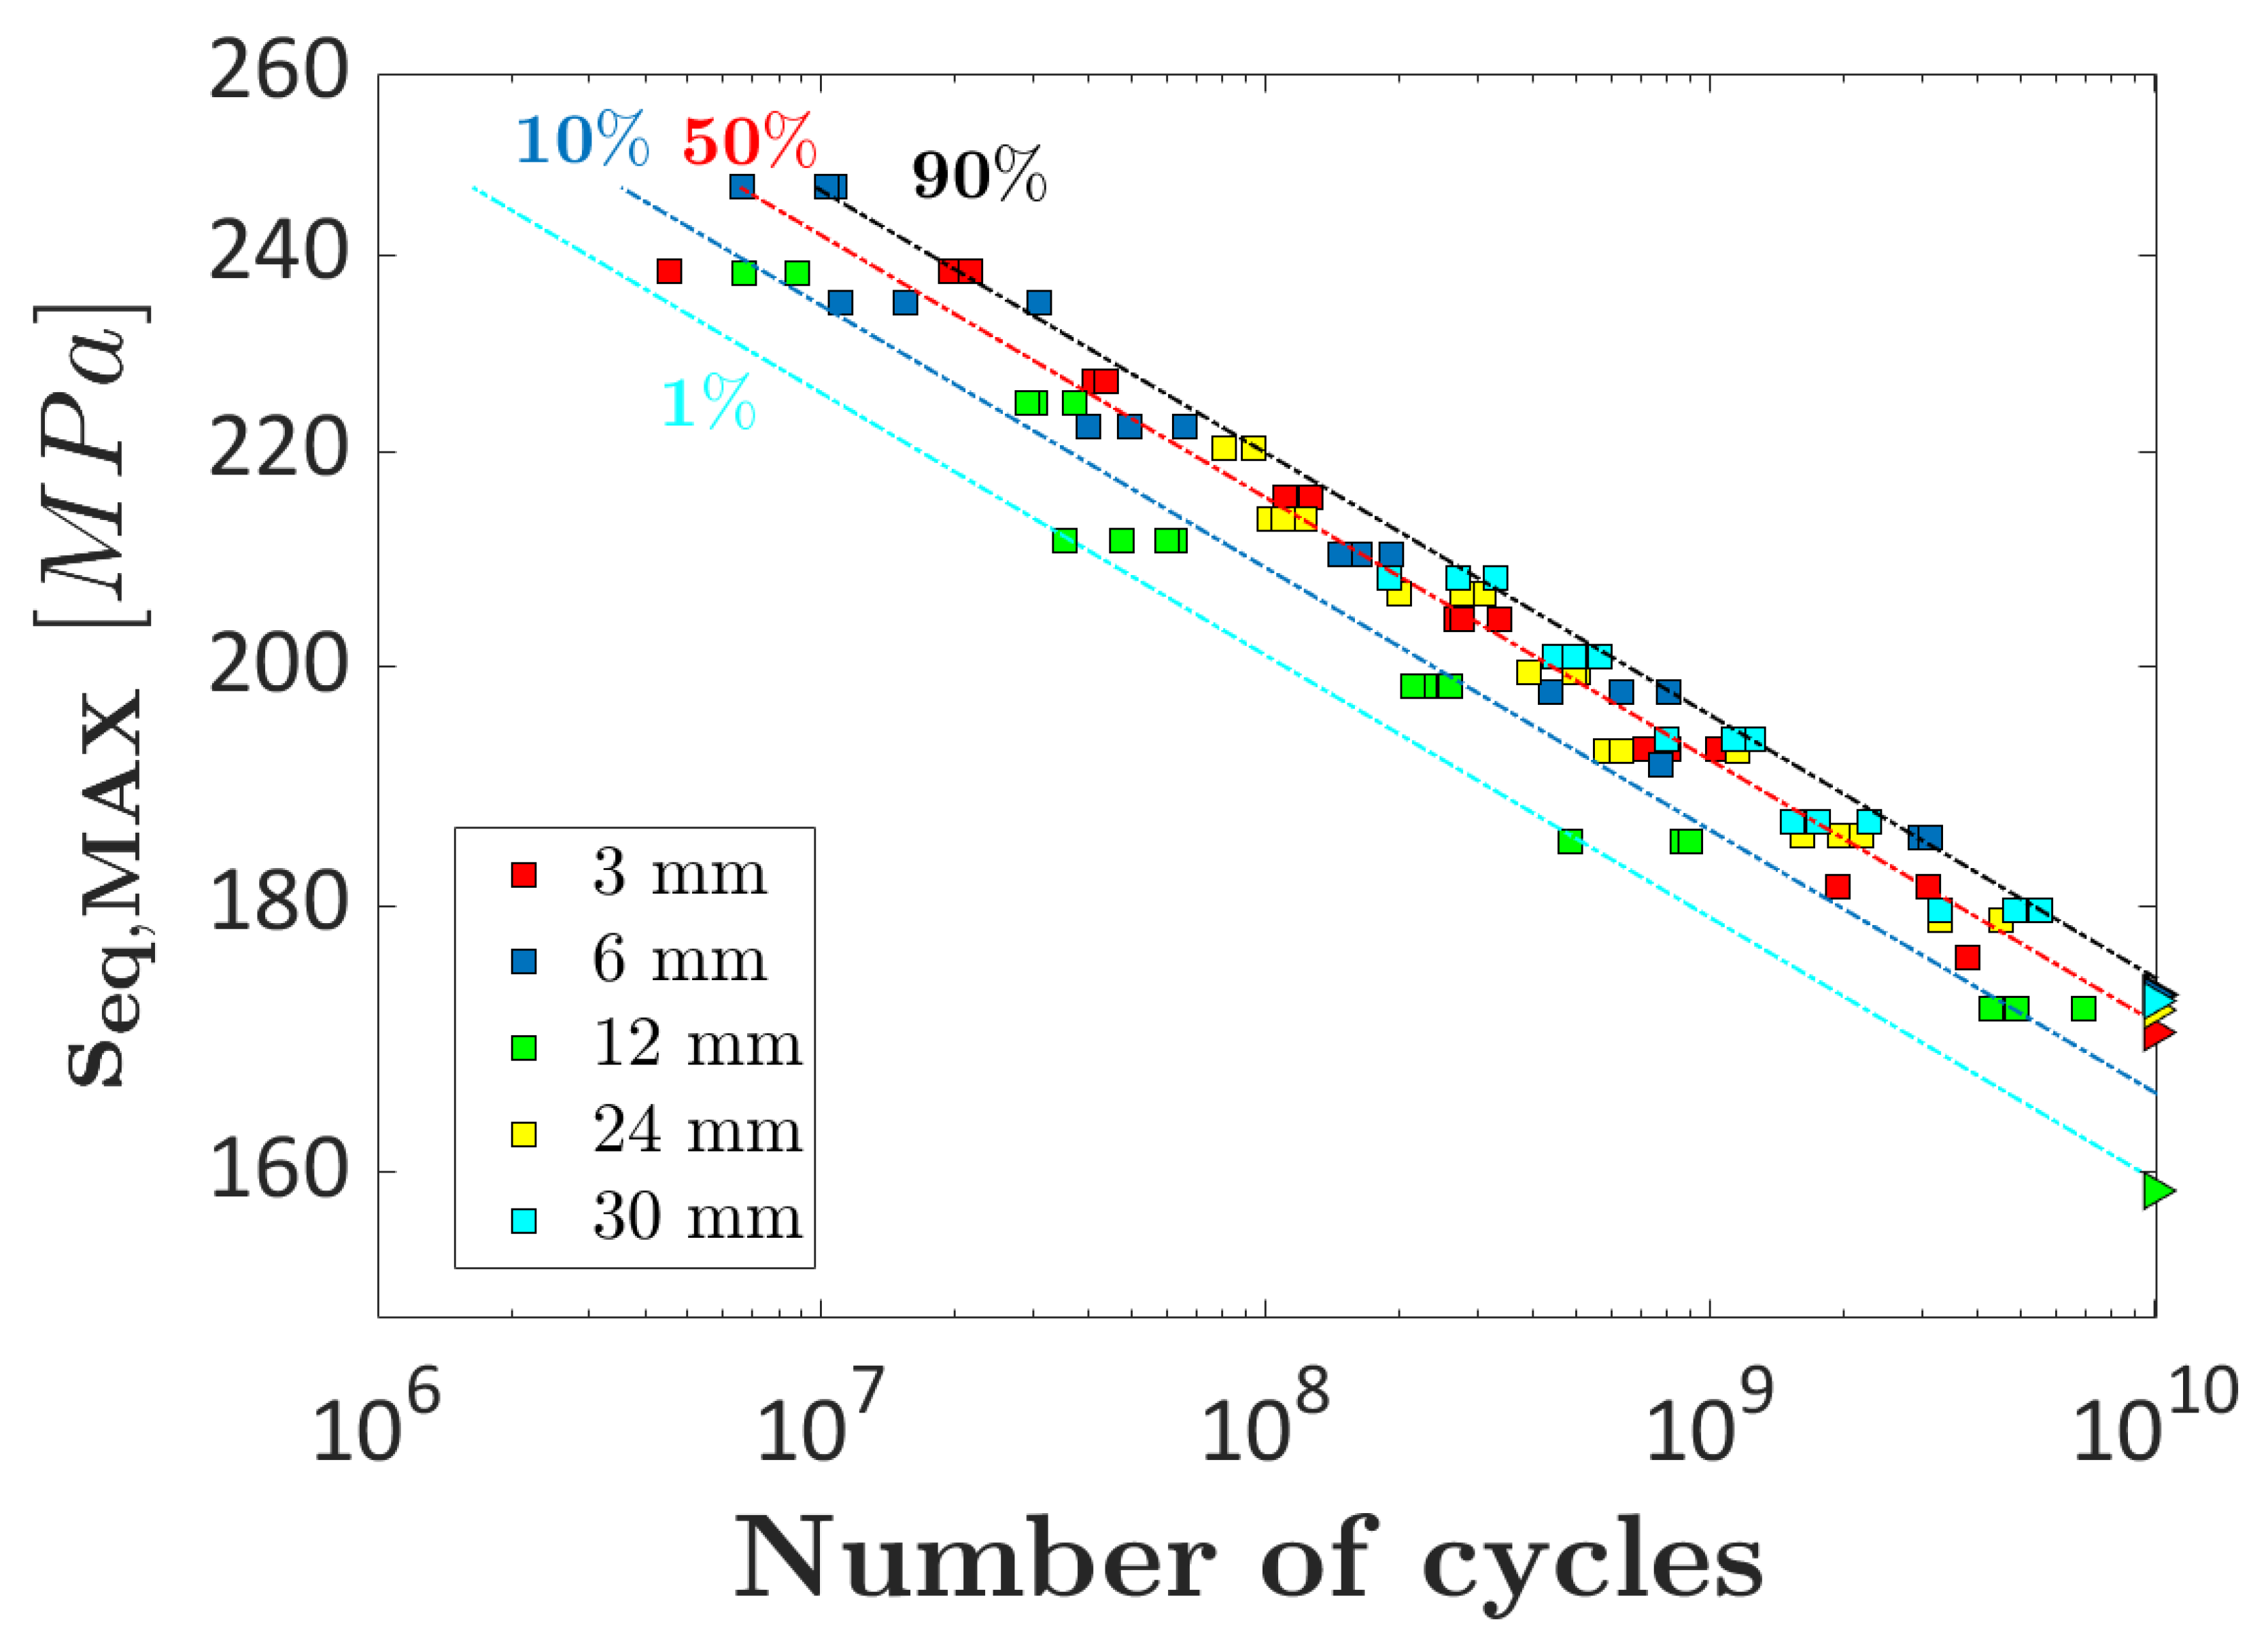
3.1. EN-AW6082 Aluminum Alloy

In this experimental campaign, fully reversed ultrasonic VHCF tests were carried out on hourglass and dog-bone specimens made of aluminium alloy EN-AW6082 T6. In order to investigate the size effect on the VHCF resistance on this material, the ultrasonic fatigue tests were conducted on specimens spanning over a much wide dimensional range. In particular, samples with one full order of magnitude in terms of diameter in the middle cross-section were subjected to cyclic loadings. More in detail, twenty hourglass specimens of 3 mm in diameter, twenty hourglass specimens of 6 mm in diameter, twenty hourglass specimens of 12 mm in diameter, twenty-one dog-bone specimens of 24 mm in diameter, and seventeen dog-bone of 30 mm in diameter were tested with the UFTM, developed by the Italian company Italsigma®, up to failure or up to 10 10 cycles. After the fatigue tests, fractographic analyses of broken specimens subjected to VHCF were carried out by using both an optical microscopes. The fracture surface morphologies showed that the crack initiation site was always located at the sample surface. This experimental evidence is consistent with the fatigue fracture surface morphologies observed in other experimental campaigns concerning aluminium alloy samples [47,48]. In fact, whereas subsurface crack nucleation is usually expected in the VHCF regime for ferrous materials, with the “optically dark areas” detected together with a plateau in the S-N curve [49], VHCF crack initiation at the aluminium sample surface could be observed [50]. Moreover, the influence of structural size can be clearly detected by the fatigue experimental results, and it was possible to observe a transition from small scales, where the size effect was more pronounced, to larger scale, where the size effect was vanishing. For more details, see [51].

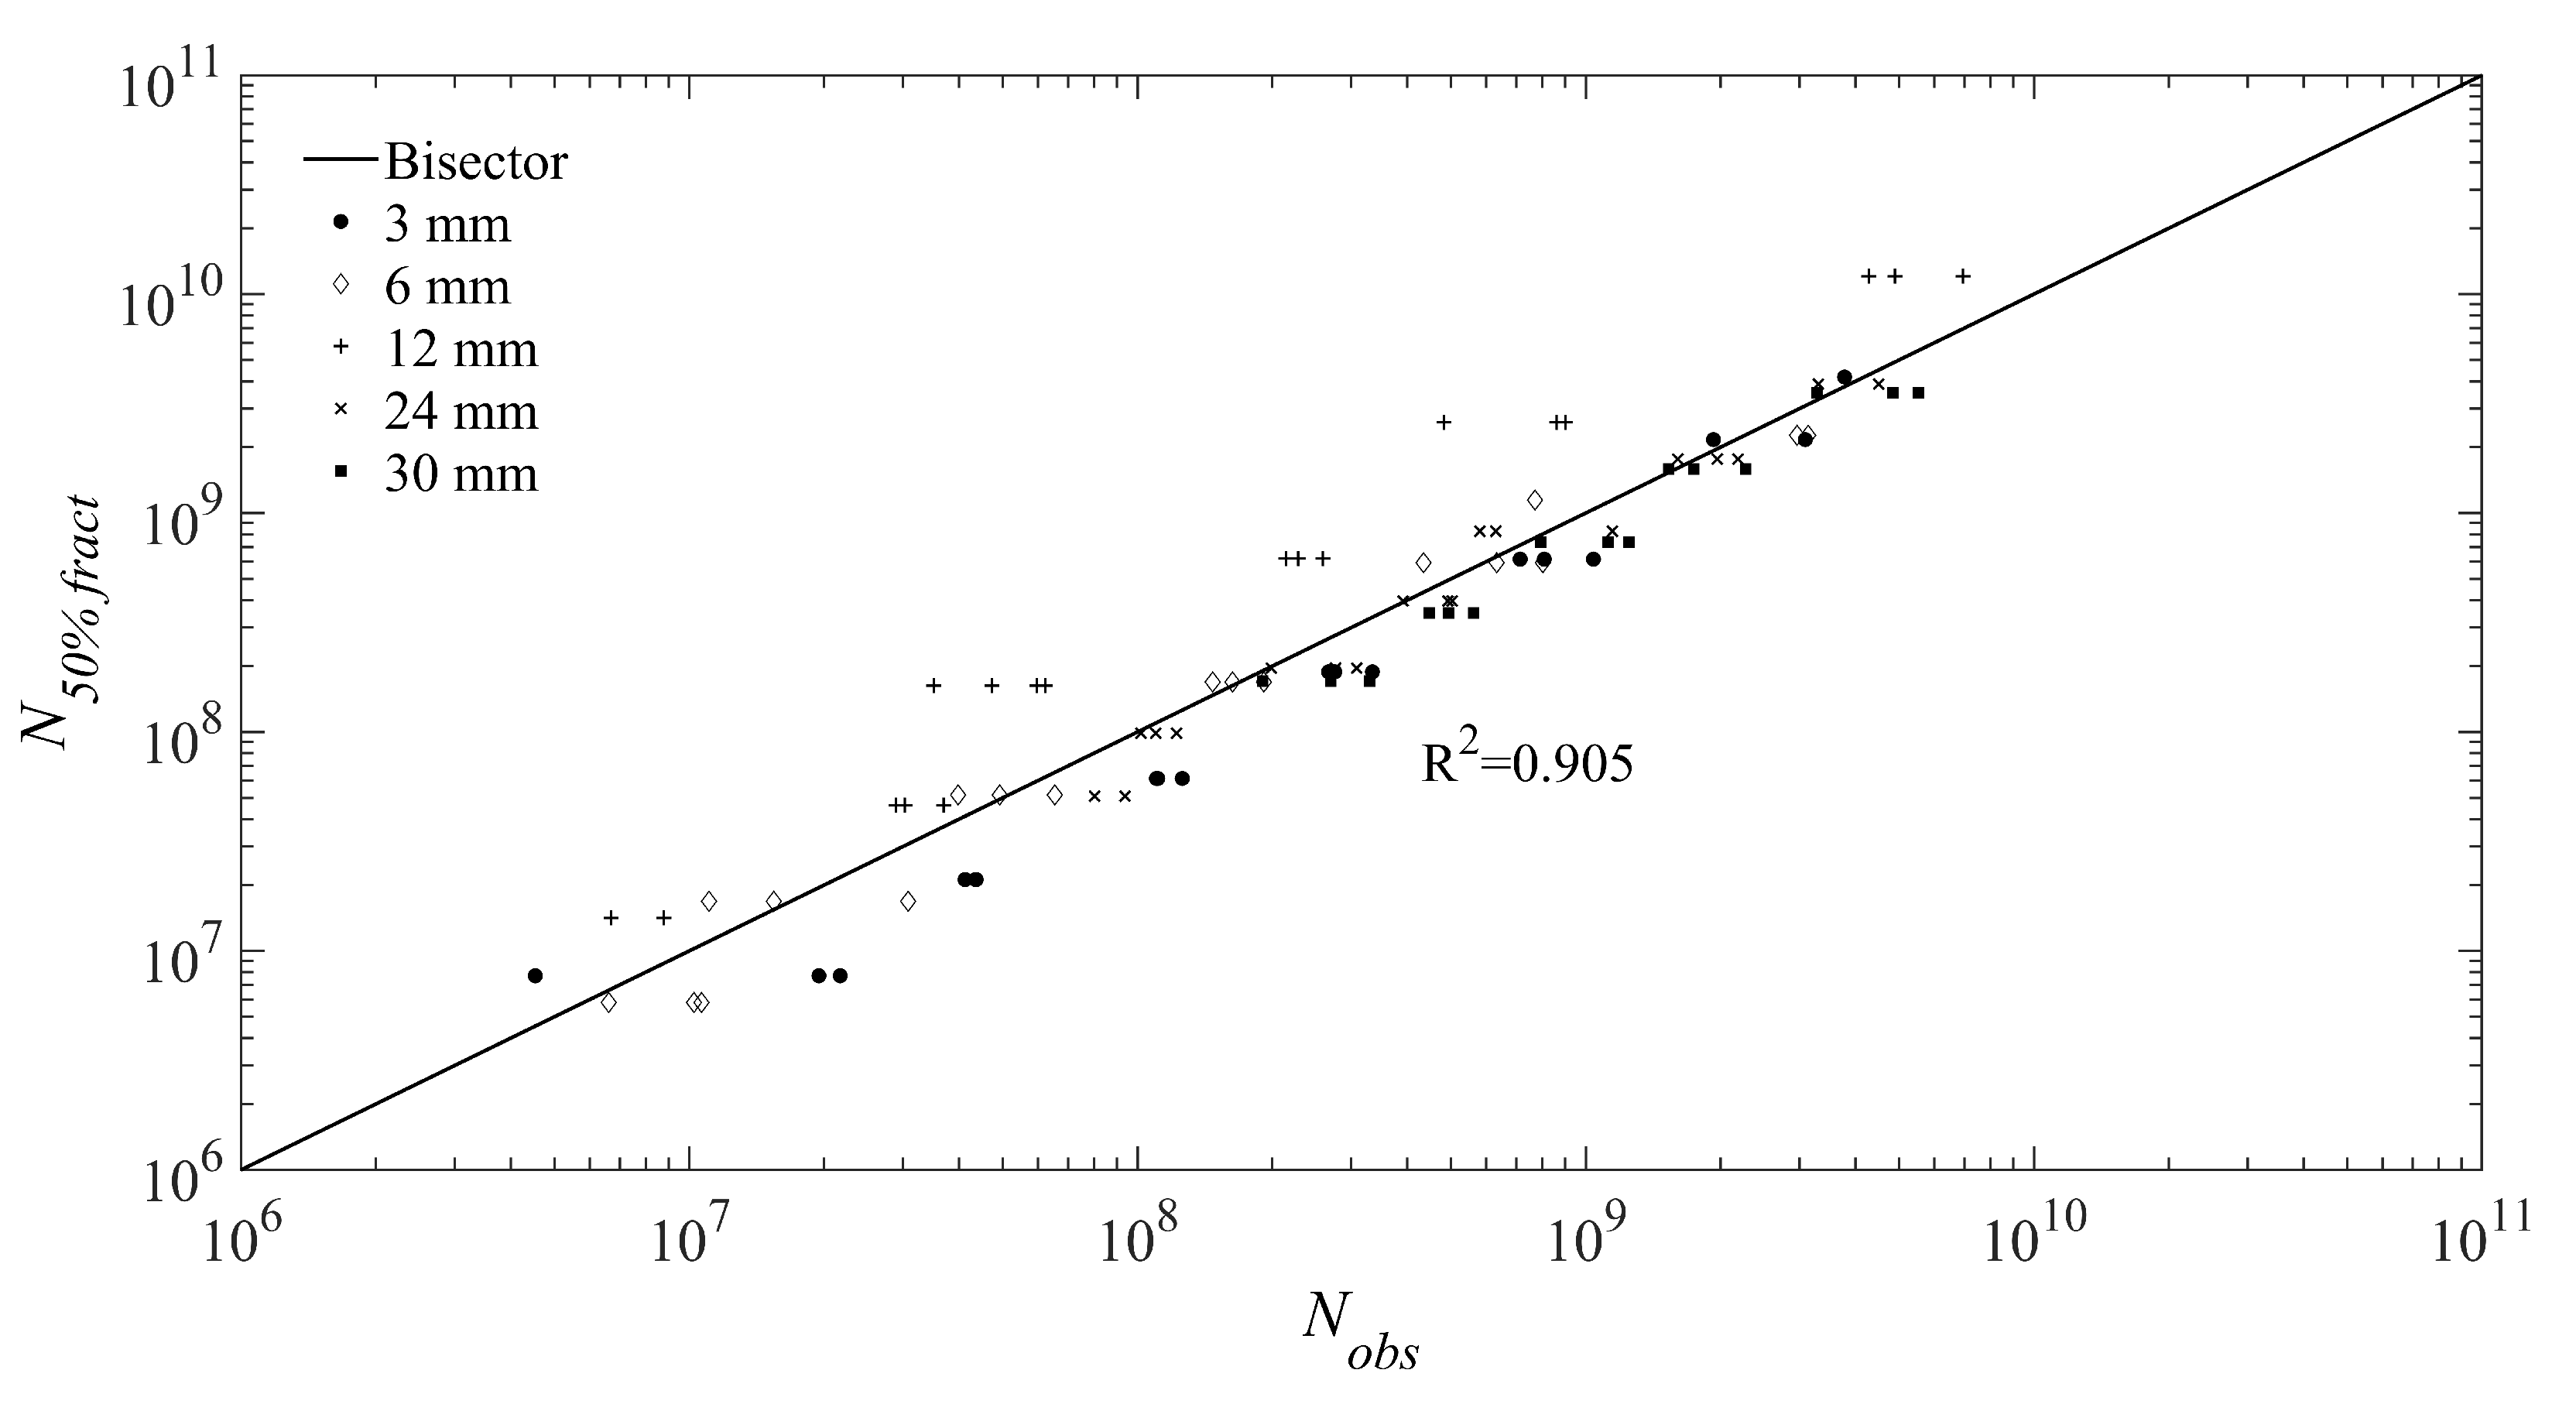
3.2. The Fractal Approach

In this sub-section, the scale effect found in ultrasonic fatigue tests on the aluminium alloy samples is analysed according to the fractal model reported in Section 2.1. The assessment of the five free-parameters entering Equation (6) has been done by adopting the method of least squares, first, and subsequently the maximum likelihood technique. More in detail, the dimensional decrement d σ , the coefficient Δ σ 0 , 50 % * , and the exponent m have been assessed to collapse the experimental data regarding different specimen sizes into a single specimen-size independent median fractal stress-life curve. In other words, when the nominal stress range is replaced by the corresponding fractal quantity, the experimental data collapse onto a single fractal stress-life curve, independently of the specimen size. Hence, the application of the least square method provided a value of the dimensional decrement d σ equal to 0.091, which implies that the anomalous physical dimensions of the fractal stress-range are F L 1.909 . Furthermore, the coefficient of the power-law for the median fractal Wöhler’s curve, Δ σ 0 , 50 % * and the exponent m were also estimated, so that it was possible to obtain the median fractal stress-life curve.
Subsequently, the application of the maximum likelihood method provided the values of the two parameters of the Weibull distribution, i.e., β ¯ and α ¯ , which was expressed in terms of the random variable N ¯ . The random variable N ¯ is given by dividing the experimentally observed number of cycles by the median fatigue life predicted by Equation (9). Table 1 shows the values of the five free-parameters entering Equation (6) with the corresponding 95% confidence intervals, whereas Figure 2 shows the estimated CDF for the fractal experimental data.
Subsequently, the evaluation of Weibull CDF adherence to the experimental data was carried out by means of the application of four goodness-of-fit (GoF) statistics tests, i.e., the χ 2 test, the Kolmogorov-Smirnov (K-S) test, the Cramer-von Mises (C-vM) test, and the Anderson-Darling (A-D) test. Table 2 reports the estimated values of the χ 2 test, the A-D test, the C-vM test, and K-S test for the fractal experimental data, as well as the critical values at the 5% significance level. In all cases, the GoF statistics tests do not reject the null hypothesis that the experimental data come from two-parameter Weibull distribution at the 5% significance level.
In addition, the fitting capabilities of assumed CDF to the experimental data was assessed by the Quantile-Quantile (Q-Q) probability plot. The Q-Q plot was obtained by plotting the estimated normalised VHCF life against the corresponding experimental values. In the construction of the Q-Q plot, the empirical cumulative distribution function, F ¯ , was assessed according to Bernard’s median rank [52,53]:
F ¯ = i 0.3 M + 0.4
where M is the sample size. If the assumed CDF is appropriate, the data in the Q-Q plot should be roughly linear and follow the bisector of the first quadrant. Figure 3 depicts the Q-Q plots for the whole experimental dataset. From Figure 3, it can be observed that there exists a good agreement between the normalised VHCF life deriving from the model and the experimental ones. In fact, the Q-Q plot shows that the experimental data are distributed along the bisector of the first quadrant, with a high correlation coefficient, R 2 , equal to 0.9899. Thus, the Q-Q plot provides further confirmation that the experimental data can be described by the two-parameter Weibull distribution.
The estimated probabilistic fractal stress-life curves, P-S*-N, corresponding to the α th quantiles, 5%, 50%, and 95% are plotted against the experimental data in Figure 4. According to this figure, the estimated P-S*-N curves fit the experimental data very well.
The flowchart of the described procedure for the assessment of the model parameters is summarised in Figure 5.

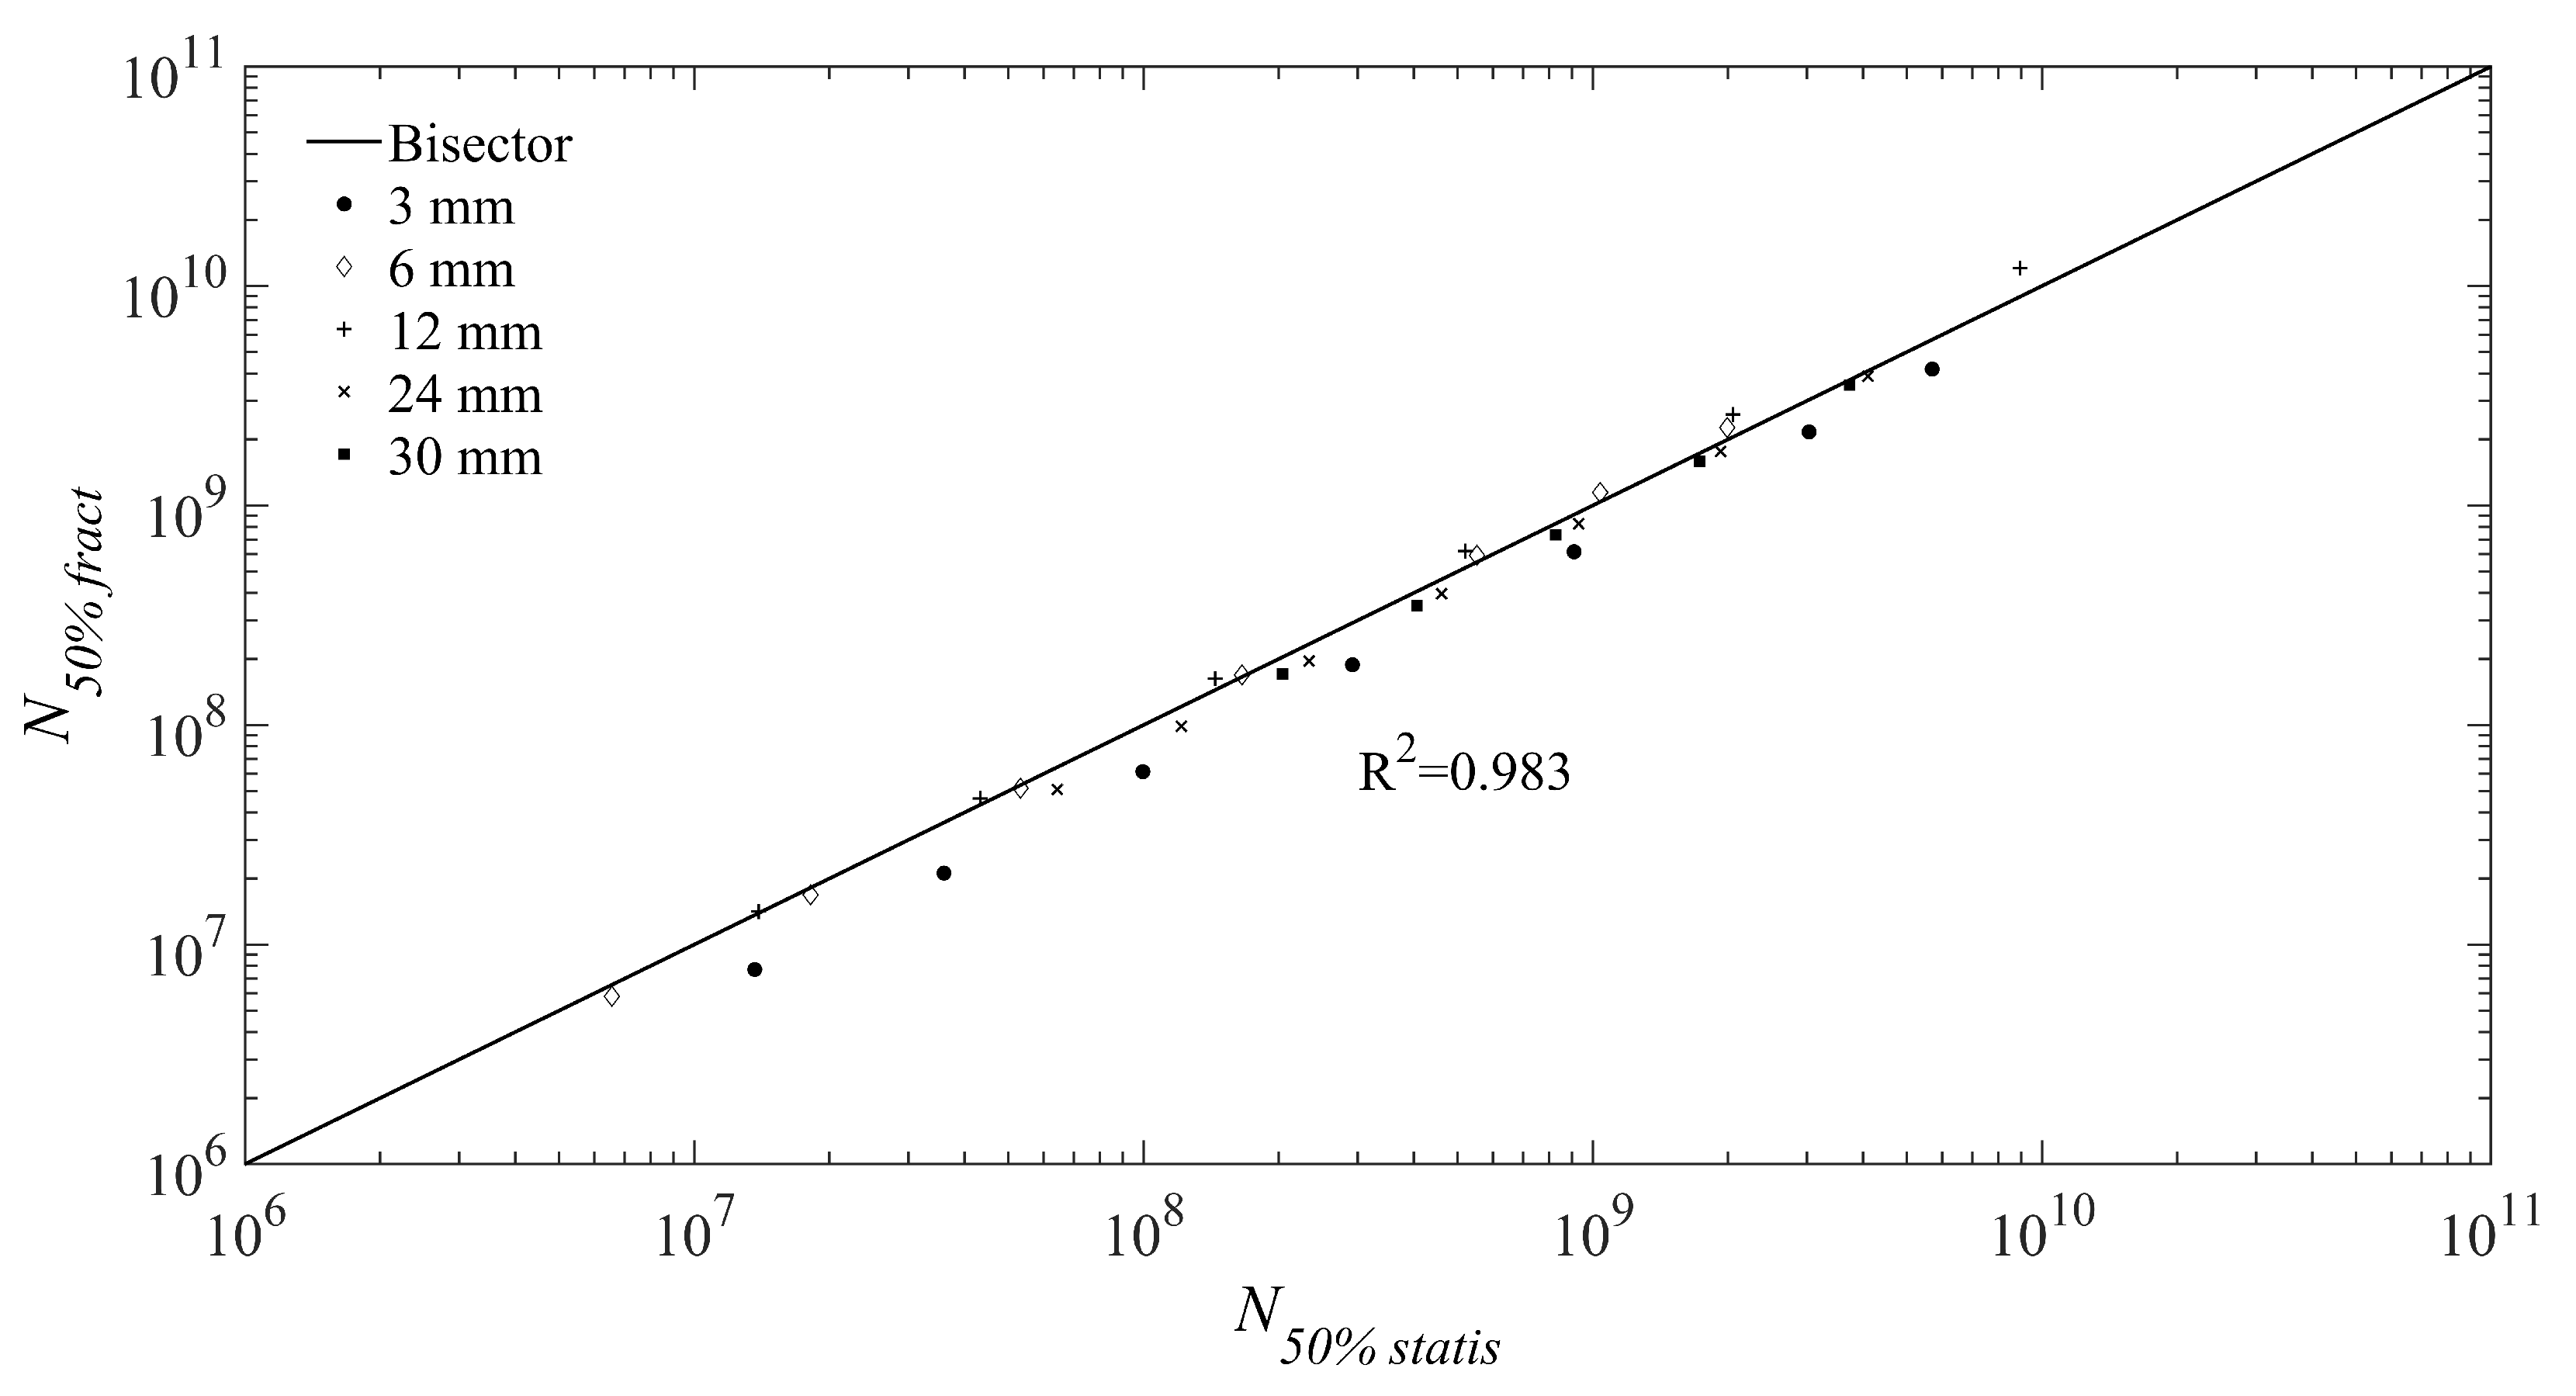
3.3. The New Statistical Model

In this sub-section, the new statistical model previously described is validated on the obtained experimental data. The stress distribution of the tested specimens has been computed through Finite Element Analyses (FEAs). The commercial software Ansys has been used for the FEAs. In particular, half of the specimen geometry has been modelled due to its symmetry and axisymmetric plane elements have been used for the mesh. A modal analysis has been thereafter carried out. The volume with stress ratios above a specific value, which is varied in the range 100–0% with steps of 0.5 % , has been extracted with the modal analysis. It is worth noting that a mesh convergence analysis has been carried out to assess the element size providing a volume variation smaller than 0.01 mm3 for each stress ratio. Given the stress distribution for each tested specimen, the constant coefficients of the model have been estimated from the experimental data. A Matlab script has been written for estimating the unknown parameters, α , β , γ , and δ . In particular, the parameter estimation has been carried out by maximizing the likelihood function of the model shown in Equation (23), with the equivalent stress s e q , M A X computed by considering the stress distribution. The “fminsearch” algorithm, based on the Nelder–Mead simplex algorithm [54], has been employed for the application of the Maximum Likelihood principle. With this approach, both failures and runout data have been considered.
Figure 6 plots the s e q , M A X with respect to the number of cycles to failures. The square markers are the experimental failures, whereas the triangle markers are the runout data. Al the data obtained by testing specimens with different risk-volumes are plotted. The estimated 90 % , median, 10 % and 1 % quantile curves are also plotted.
According to Figure 6, the estimated curves are in good agreement with the experimental data. By considering the equivalent stress, the experimental failures are properly collapsed into a unique curve. The experimental failures are concentrated close to the median curve and the scatter is limited, with all the data except two above the 1 % quantile curves.
Figure 7 shows the Probability-Probability (P-P) plot of the investigated data. The abscissa axis is the experimental CDF, whereas the ordinate axis is the CDF estimated with the proposed method. The experimental CDF has been computed with the Kaplan-Meier estimate of the empirical cumulative distribution function. The experimental data together with the bisector are shown in Figure 7.
The P-P plot further confirms the validity of the proposed method, with all the experimental failures concentrated close to the bisector and with limited scatter. The estimated median slope is 1.004 , with the 95 % confidence interval equal to [0.995:1.013]. The confidence interval includes the unit value, confirming the good agreement between the estimated and the experimental data. The analyses carried out in this section have proven the validity of the proposed new statistical method and the effectiveness of a strategy based on the equivalent stress for collapsing experimental data obtained by testing specimens with different volumes in a unique ‘master curve’. The proposed method, accordingly, can be reliably used for the assessment of size-effect in VHCF, even if the defect size distribution is not known, thus significantly simplifying the analysis of the experimental data.

3.4. Comparison between the Two Theoretical Models

In this sub-section, the two theoretical models are quantitatively put in comparison by exploiting the experimental dataset shown in Section 3.1. Firstly, the capability to fit the experimental dataset of each of the two introduced models was assessed.
In Figure 8, the median fatigue life predicted by the fractal model, according to Equation (9), is plotted against the experimentally observed number of cycles for the whole experimental dataset in a bi-logarithmic diagram. The obtained R 2 is quite close to 1, though the R 2 value is also inherently influenced by the experimental data dispersion.
Analogously, Figure 9 shows the median number of cycles estimated by the new statistical model of Section 2.2. A very good R 2 value is obtained in this case as well.
In addition, the two proposed models are further compared between them in Figure 10. In this diagram, the values of the median number of cycles estimated by the statistical model are plotted versus the predicted ones by the fractal approach ( R 2 = 0.983 ).

4. Conclusions

In the present paper a comparison between fractal and statistical approaches to model size effects in VHCF has been presented. The fractal model is formulated upon the hypothesis that the material ligament is well represented by a lacunar fractal. In this way, the distribution of defects in the material, which act as seeds for fatigue cracks nucleation, is condensed in one only parameter, the fractal dimension of the ligament. Moreover, it is assumed that the structures, or samples, under consideration are geometrically self-similar, therefore the details of the stress state do not come into play explicitly. As a consequence, the scaling behaviour of fatigue strength and fatigue life directly depends on the fractal dimension of the ligament, which is the real disorder parameter of the microstructure. In addition, the fractal model is basically a deterministic model, though it can be equipped for statistical management of result dispersion as shown in the paper.
On the contrary, the new statistical model starts from the stress amplitude distribution within the tested risk-volumes, which can be easily obtained through Finite Element Analyses, and from the statistical distribution of the fatigue life, assumed to follow a Weibull distribution. Thereafter, the Weakest Link approach is applied and the dependency between the fatigue life and the specimen size is assessed. With this approach, an equivalent stress and an equivalent volume can be defined for each tested specimen, thus allowing to collapse data obtained by testing specimens with different volumes into a unique ‘master curve’.
In order to assess the behavior of the two models, a particularly wide dimensional range campaign is considered. The aluminum samples, tested at the Department of Structural, Geotechnical and Building Engineering of the Politecnico di Torino (Italy), span over one order of magnitude for the diameter length. For the first time, VHCF ultrasonic tests have been performed on hourglass and dog-bone samples with a maximum ligament diameter of 30 mm. The two models are both able to reproduce correctly the experimentally observed size effects.
The fractal model is supposed to apply strictly to a set of geometrically self-similar specimens, since the proposed model does not account for stress concentration aspects in an explicit way. On the other hand, due to the working principle of UFTMs, it is impossible to design perfect geometrically self-similar specimens. Nevertheless, the measured scattering, for the considered experimental results, is limited to a quite small amount.
The statistical model developed in the present paper can estimate the size-effect without the need of knowing the statistical distribution of defect size, which generally controls the VHCF response. Therefore, it can be applied reliably if the defect size distribution cannot be assessed, e.g., if a Scanning Electron Microscope is not available or the critical defect is not visible on the fracture surface. However, if defects significantly affect the fatigue response contributing to a large scatter of the experimental data, their influence may not be neglected. Accordingly, a further validation of the model on datasets characterized by a large scatter due to a prevalent influence of defects would further extend its use and is planned in future works. The procedure for parameter estimation may be not straightforward. Indeed, the proposed statistical model can be applied only if the stress distribution is assessed through finite element analysis. Moreover, the parameter estimation is carried out by applying the Maximum Likelihood Principle, which requires the application of iterative optimization algorithms. However, even if these two drawbacks may limit the use of the present model, it must be noted that the required finite element analyses is a simple linear elastic analysis and the parameter estimation is fast (i.e., less than 1 min) and of simple implementation.
The assessment of size-effects in VHCF is of fundamental importance for the design of components. Indeed, even if experimental tests on specimens with large volumes are possible, the volume of components used in practical structural applications is still significantly larger. Since VHCF tests can be hardly carried out on full-scale components, the allowable stress to be considered when the component is to be designed must be reliably estimated with statistical models. The proposed methodologies share the same objective of allowing a reliable estimation of the limit stress for volumes larger than those of laboratory specimens subjected to ultrasonic fatigue tests. The increment in the specimen volume in experimental tests has permitted a reliable validation of the proposed models, which have proven to properly assess size-effects for a large range of sizes. Accordingly, it can be reasonably expected that they can be used for the design of large components subjected to fatigue loads for a very high number of cycles.

Author Contributions

Conceptualization, S.I., D.P., F.M., A.T. and A.C.; methodology, S.I., D.P., F.M., A.T. and A.C.; validation, S.I., D.P., F.M., A.T. and A.C.; formal analysis, S.I., D.P., F.M., A.T. and A.C.; investigation, S.I., F.M. and A.C.; writing—original draft preparation, S.I., D.P., F.M., A.T.; writing—review and editing, S.I., D.P., F.M., A.T. and A.C. All authors have read and agreed to the published version of the manuscript.

Funding

Part of the research leading to the results reported in the paper (in particular, the part related to the development of the new statistical approach) has received funding from the European Union’s Horizon 2020 innovation action program under grant agreement No. 101006844—Fatigue4Light project.

Data Availability Statement

The data presented in this study are available on request from the corresponding author.

Conflicts of Interest

The authors declare no conflict of interest.

Abbreviations

The following abbreviations are used in this manuscript:
UFTMUltrasonic fatigue testing machine
VHCFVery-High Cycle Fatigue
P-S-NProbabilistic stress-life
MLMMaximum Likelihood Method
P-S*-NProbabilistic fractal stress-life
CDFCumulative distribution function
SEMScanning Electron Microscope
K-SKolmogorov-Smirnov
C-vMCramer-von Mises
A-DAnderson-Darling
GoFGoodness of fit
Q-QQuantile-Quantile
FEAFinite Element Analyses
P-PProbability-Probability

References

  1. Fitzka, M.; Schönbauer, B.M.; Rhein, R.K.; Sanaei, N.; Zekriardehani, S.; Tekalur, S.A.; Carroll, J.W.; Mayer, H. Usability of Ultrasonic Frequency Testing for Rapid Generation of High and Very High Cycle Fatigue Data. Materials 2021, 14, 2245. [Google Scholar] [CrossRef] [PubMed]
  2. Schneider, N.; Bödecker, J.; Berger, C.; Oechsner, M. Frequency effect and influence of testing technique on the fatigue behaviour of quenched and tempered steel and aluminium alloy. Int. J. Fatigue 2016, 93, 224–231. [Google Scholar] [CrossRef]
  3. Ilie, P.; Lesperance, X.; Ince, A. Development of an ultrasonic fatigue testing system for gigacycle fatigue. Mater. Des. Process. Commun. 2019, 2, e120. [Google Scholar] [CrossRef]
  4. Lesperance, X.; Ilie, P.; Ince, A. Very high cycle fatigue characterization of additively manufactured AlSi10Mg and AlSi7Mg aluminium alloys based on ultrasonic fatigue testing. Fatigue Fract. Eng. Mater. Struct. 2021, 44, 876–884. [Google Scholar] [CrossRef]
  5. Invernizzi, S.; Montagnoli, F.; Carpinteri, A. Fatigue Assessment of the Collapsed XXth Century Cable-Stayed Polcevera Bridge in Genoa. Procedia Struct. Integr. 2019, 18, 237–244. [Google Scholar] [CrossRef]
  6. Invernizzi, S.; Montagnoli, F.; Carpinteri, A. The collapse of the Morandi’s bridge: Remarks about fatigue and corrosion. In Proceedings of the IABSE Symposium, Wroclaw 2020: Synergy of Culture and Civil Engineering—History and Challenges, Wroclaw, Poland, 7–9 October 2020; pp. 1040–1047. [Google Scholar]
  7. Invernizzi, S.; Montagnoli, F.; Carpinteri, A. Corrosion Fatigue Investigation on the Possible Collapse Reasons of Polcevera Bridge in Genoa. Lect. Notes Mech. Eng. 2020, 151–159. [Google Scholar] [CrossRef]
  8. Invernizzi, S.; Montagnoli, F.; Carpinteri, A. Very High Cycle Corrosion Fatigue Study of the Collapsed Polcevera Bridge, Italy. J. Bridge Eng. 2022, 27, 04021102. [Google Scholar] [CrossRef]
  9. Ye, W.-L.; Zhu, S.-P.; Niu, X.-P.; He, J.-C.; Wang, Q. Fatigue Life Prediction of Notched Components Under Size Effect Using Stress Gradient-Based Approach. Int. J. Fract. 2021, 234, 249–261. [Google Scholar] [CrossRef]
  10. Zheng, Z.; Zhan, M.; Fu, M.W. Microstructural and Geometrical Size Effects on the Fatigue of Metallic Materials. Int. J. Mech. Sci. 2022, 218, 107058. [Google Scholar] [CrossRef]
  11. Isakov, M.; Rantalainen, O.; Saarinen, T.; Lehtovaara, A. Large-Scale Fatigue Testing Based on the Rotating Beam Method. Exp. Tech. 2022. [Google Scholar] [CrossRef]
  12. Furuya, Y. Specimen Size Effects on Gigacycle Fatigue Properties of High-Strength Steel under Ultrasonic Fatigue Testing. Scr. Mater. 2008, 58, 1014–1017. [Google Scholar] [CrossRef]
  13. Furuya, Y. Size Effects in Gigacycle Fatigue of High-Strength Steel under Ultrasonic Fatigue Testing. Procedia Eng. 2010, 2, 485–490. [Google Scholar] [CrossRef]
  14. Furuya, Y. Notable Size Effects on Very High Cycle Fatigue Properties of High-Strength Steel. Mater. Sci. Eng. A 2011, 528, 5234–5240. [Google Scholar] [CrossRef]
  15. Beretta, S.; Anderson, C.; Murakami, Y. Extreme Value Models for the Assessment of Steels Containing Multiple Types of Inclusion. Acta Mater. 2006, 54, 2277–2289. [Google Scholar] [CrossRef]
  16. Sun, C.; Song, Q. A Method for Predicting the Effects of Specimen Geometry and Loading Condition on Fatigue Strength. Metals 2018, 8, 811. [Google Scholar] [CrossRef]
  17. Aranđelović, M.; Sedmak, S.; Jovičić, R.; Perković, S.; Burzić, Z.; Radu, D.; Radaković, Z. Numerical and experimental investigations of fracture behaviour of welded joints with multiple defects. Materials 2021, 14, 4832. [Google Scholar] [CrossRef]
  18. Murakami, Y.; Kodama, S.; Konuma, S. Quantitative Evaluation of Effects of Non-Metallic Inclusions on Fatigue Strength of High Strength Steels. I: Basic Fatigue Mechanism and Evaluation of Correlation between the Fatigue Fracture Stress and the Size and Location of Non-Metallic Inclusions. Int. J. Fatigue 1989, 11, 291–298. [Google Scholar] [CrossRef]
  19. Murakami, Y.; Usuki, H. Quantitative Evaluation of Effects of Non-Metallic Inclusions on Fatigue Strength of High Strength Steels. II: Fatigue Limit Evaluation Based on Statistics for Extreme Values of Inclusion Size. Int. J. Fatigue 1989, 11, 299–307. [Google Scholar] [CrossRef]
  20. Beretta, S. More than 25 years of Extreme Value Statistics for Defects: Fundamentals, Historical Developments, Recent Applications. Int. J. Fatigue 2021, 151, 106407. [Google Scholar] [CrossRef]
  21. Xue, H.; Sun, Z.; Zhang, X.; Gao, T.; Li, Z. Very High Cycle Fatigue of a Cast Aluminum Alloy: Size Effect and Crack Initiation. J. Mater. Eng. Perform. 2018, 27, 5406–5416. [Google Scholar] [CrossRef]
  22. Paolino, D.S.; Tridello, A.; Chiandussi, G.; Rossetto, M. On specimen design for size effect evaluation in ultrasonic gigacycle fatigue testing. Fatigue Fract. Eng. Mater. Struct. 2014, 37, 570–579. [Google Scholar] [CrossRef]
  23. Tridello, A. VHCF response of two AISI H13 steels: Effect of manufacturing process and size-effect. Metals 2019, 9, 133. [Google Scholar] [CrossRef]
  24. Tridello, A.; Paolino, D.S.; Chiandussi, G.; Rossetto, M. Effect of electroslag remelting on the VHCF response of an AISI H13 steel. Fatigue Fract. Eng. Mater. Struct. 2017, 40, 1783–1794. [Google Scholar] [CrossRef]
  25. Tridello, A.; Paolino, D.S.; Rossetto, M. Ultrasonic VHCF Tests on Very Large Specimens with Risk-Volume Up to 5000 mm3. Appl. Sci. 2020, 10, 2210. [Google Scholar] [CrossRef]
  26. Tridello, A.; Fiocchi, J.; Biffi, C.A.; Rossetto, M.; Tuissi, A.; Paolino, D.S. Size-effects affecting the fatigue response up to 109 cycles (VHCF) of SLM AlSi10Mg specimens produced in horizontal and vertical directions. Int. J. Fatigue 2022, 160, 106825. [Google Scholar] [CrossRef]
  27. Paolino, D.S. Very high cycle fatigue life and critical defect size: Modeling of statistical size effects. Fatigue Fract. Eng. Mater. Struct. 2021, 44, 1209–1224. [Google Scholar] [CrossRef]
  28. Carpinteri, A. Scaling Laws and Renormalization Groups for Strength and Toughness of Disordered Materials. Int. J. Solids Struct. 1994, 31, 291–302. [Google Scholar] [CrossRef]
  29. Carpinteri, A. Fractal Nature of Material Microstructure and Size Effects on Apparent Mechanical Properties. Mech. Mater. 1994, 18, 89–101. [Google Scholar] [CrossRef]
  30. Carpinteri, A.; Chiaia, B.; Ferro, G. Size Effects on Nominal Tensile Strength of Concrete Structures: Multifractality of Material Ligaments and Dimensional Transition from Order to Disorder. Mater. Struct. 1995, 28, 311–317. [Google Scholar] [CrossRef]
  31. Macek, W. Fractal analysis of the bending-torsion fatigue fracture of aluminium alloy. Int. J. Fatigue 2019, 99, 97–107. [Google Scholar] [CrossRef]
  32. Macek, W. Correlation between fractal dimension and areal surface parameters for fracture analysis after bending-torsion fatigue. Metals 2021, 11, 1790. [Google Scholar] [CrossRef]
  33. Niccolini, G.; Rubino, A.; Carpinteri, A. Dimensional transitions in creeping materials due to nonlinearity and microstructural disorder. Chaos Solitons Fractals 2020, 141, 110345. [Google Scholar] [CrossRef]
  34. Invernizzi, S.; Montagnoli, F.; Carpinteri, A. Experimental evidence of specimen-size effects on EN-AW6082 aluminum alloy in VHCF regime. Appl. Sci. 2021, 11, 4272. [Google Scholar] [CrossRef]
  35. Carpinteri, A.; Montagnoli, F.; Invernizzi, S. Scaling and Fractality in Fatigue Resistance: Specimen-Size Effects on Wöhler’s Curve and Fatigue Limit. Fatigue Fract. Eng. Mater. Struct. 2020, 43, 1869–1879. [Google Scholar] [CrossRef]
  36. Montagnoli, F.; Invernizzi, S.; Carpinteri, A. Fractality and Size Effect in Fatigue Damage Accumulation: Comparison between Paris and Wöhler Perspectives. Lect. Notes Mech. Eng. 2020, 1, 188–196. [Google Scholar] [CrossRef]
  37. Carpinteri, A.; Montagnoli, F. Scaling and Fractality in Fatigue Crack Growth: Implications to Paris’ Law and Wöhler’s Curve. Procedia Struct. Integr. 2019, 14, 957–963. [Google Scholar] [CrossRef]
  38. Freire Júnior, R.C.S.; Belísio, A.S. Probabilistic S-N Curves Using Exponential and Power Laws Equations. Compos. Part B Eng. 2014, 56, 582–590. [Google Scholar] [CrossRef]
  39. Pedrosa, B.; Correia, J.A.F.O.; Rebelo, C.A.S.; Veljkovic, M. Reliability of Fatigue Strength Curves for Riveted Connections Using Normal and Weibull Distribution Functions. ASCE-ASME J. Risk Uncertain. Eng. Syst. Part A Civ. Eng. 2020, 6, 04020034. [Google Scholar] [CrossRef]
  40. Barbosa, J.F.; Carlos Silverio Freire Júnior, R.; Correia, J.A.F.O.; De Jesus, A.M.P.; Calçada, R.A.B. Analysis of the Fatigue Life Estimators of the Materials Using Small Samples. J. Strain Anal. Eng. Des. 2018, 53, 699–710. [Google Scholar] [CrossRef]
  41. Tridello, A.; Boursier Niutta, C.; Rossetto, M.; Berto, F.; Paolino, D.S. Statistical models for estimating the fatigue life, the stress-life relation and the P-S-N curves of metallic materials in Very High Cycle Fatigue: A review. Fatigue Fract Eng Mater Struct. 2022, 45, 332–370. [Google Scholar] [CrossRef]
  42. Sakai, T.; Lian, B.; Takeda, M.; Shiozawa, K.; Oguma, N.; Ochi, Y.; Nakajima, M.; Nakamura, T. Statistical duplex S-N characteristics of high carbon chromium bearing steel in rotating bending in very high cycle regime. Int. J. Fatigue 2010, 32, 497–504. [Google Scholar] [CrossRef]
  43. Bomas, H.; Burkart, K.; Zoch, H.W. Evaluation of S-N curves with more than one failure mode. Int. J. Fatigue 2011, 33, 19–22. [Google Scholar] [CrossRef]
  44. Li, W.; Sun, Z.; Zhang, Z.; Deng, H.; Sakai, T. Evaluation of crack growth behavior and probabilistic S-N characteristics of carburized Cr-Mn-Si steel with multiple failure modes. Mater Des. 2014, 64, 760–768. [Google Scholar] [CrossRef]
  45. Muniz-Calvente, M.; Fernández-Canteli, A.; Pyttel, B.; Castillo, E. Probabilistic assessment of VHCF data as pertaining to concurrent populations using a Weibull regression model. Fatigue Fract. Eng. Mater. Struct. 2017, 40, 1772–1782. [Google Scholar] [CrossRef]
  46. Sun, C.; Zhang, X.; Liu, X.; Hong, Y. Effects of specimen size on fatigue life of metallic materials in high-cycle and very-high-cycle fatigue regimes. Fatigue Fract. Eng. Mater. Struct. 2016, 39, 770–779. [Google Scholar] [CrossRef]
  47. Weixing, Y.; Shenjie, G. VHCF test and life distribution of aluminum alloy LC4CS. Int. J. Fatigue 2008, 30, 172–177. [Google Scholar] [CrossRef]
  48. Wen, F.; Xing, Z.; Tan, C.; Pu, J.; Zhou, L. Study on very-high-cycle fatigue property of 2A60 aluminum alloy. J. Phys. Conf. Ser. 2021, 1802, 022079. [Google Scholar] [CrossRef]
  49. Sharma, A.; Chul, M.; Ahn, B. Recent advances in very high cycle fatigue behavior of metals and alloys—A Review. Metals 2020, 10, 1200. [Google Scholar] [CrossRef]
  50. Stanzl-Tschegg, S.E.; Mayer, H.R. Fatigue and fatigue crack growth of aluminium alloys at very high numbers of cycles. Int. J. Fatigue 2001, 23, 231–237. [Google Scholar] [CrossRef]
  51. Montagnoli, F. Very-High Cycle Fatigue: Size Effects and Applications in Civil Engineering. Ph.D. Thesis, Politecnico di Torino, Torino, Italy, November 2021. [Google Scholar]
  52. Bernard, A.; Bos-Levenbach, J. The Plotting of Observations on Probability-Paper; Statistische Afdeling; Stichting Mathematische Centrum: Amsterdam, The Netherlands, 1955. [Google Scholar]
  53. Fothergill, J.C. Simplex Estimating the cumulative probability of failure data points to be plotted on Weibull and other probability paper. IEEE Trans. Electr. Insul. 1990, 25, 489–492. [Google Scholar] [CrossRef]
  54. Nelder, J.A.; Mead, R.A. Simplex Method for Function Minimization. Comput. J. 1965, 7, 308–313. [Google Scholar] [CrossRef]
Figure 1. Flow chart showing the procedure to be followed for the application of the statistical model.
Metals 12 01499 g001
Figure 2. CDF for the experimental fractal data.
Metals 12 01499 g002
Figure 3. Q-Q plot for the normalised VHCF life.
Metals 12 01499 g003
Figure 4. Estimated specimen-size independent probabilistic fractal stress-life curves against the experimental data.
Metals 12 01499 g004
Figure 5. Flowchart for the determination of the free parameters of the fractal model.
Metals 12 01499 g005
Figure 6. Plot of s e q , M A X with respect to the number of cycles to failure: experimental data and estimated 90 % , median, 10 % and 1 % quantile curves.
Metals 12 01499 g006
Figure 7. Probability-Probability (P-P) plot of the experimental data: estimated CDF with respect to the experimental CDF.
Metals 12 01499 g007
Figure 8. Median fatigue life predicted by the fractal model ( N 50 % f r a c t ) versus the experimentally observed number of cycles ( N o b s ).
Metals 12 01499 g008
Figure 9. Median fatigue life predicted by the statistical model ( N 50 % s t a t i s ) versus the experimentally observed number of cycles ( N o b s ).
Metals 12 01499 g009
Figure 10. Median fatigue life predicted by the fractal model ( N 50 % f r a c t ) versus the statistical model ( N 50 % s t a t i s ).
Metals 12 01499 g010
Table 1. Best-fitting of free-parameters entering Equations (8) and (9).
Δ σ 0 , 50 % * (N mm 1.909 ) d σ m α ¯ β ¯ R 2
996.10.09121.21.31512.08610.913
[ 936.1 ; 1059.9 ] [ 0.045 ; 0.136 ] [ 19.5 ; 22.2 ] [ 1.1763 ; 1.4296 ] [ 1.9122 ; 2.6583 ]
Table 2. Goodness-of-fit statistics test results for the whole experimental dataset.
GoF Statistics Tests χ 2 K-SC-vMA-D
Actual values11.00000.06150.04130.3504
Critical values21.66600.14270.22000.7529
Publisher’s Note: MDPI stays neutral with regard to jurisdictional claims in published maps and institutional affiliations.

