Article

Why Color Matters—Proposing a Quantitative Stability Criterion for Laser Beam Processing of Metals Based on Their Fundamental Optical Properties

1
Institute of Photonic Technologies (LPT), Friedrich-Alexander-Universität Erlangen-Nürnberg, Konrad-Zuse-Straße 3/5, 91052 Erlangen, Germany
2
Erlangen Graduate School in Advanced Optical Technologies, Friedrich-Alexander-Universität Erlangen-Nürnberg, Paul-Gordan-Straße 6, 91052 Erlangen, Germany
3
Bayerisches Laserzentrum GmbH, Konrad-Zuse-Straße 2/6, 91052 Erlangen, Germany
*
Author to whom correspondence should be addressed.
Metals 2022, 12(7), 1118; https://doi.org/10.3390/met12071118
Submission received: 22 May 2022 / Revised: 20 June 2022 / Accepted: 20 June 2022 / Published: 29 June 2022

Abstract

:
With its excellent automation capability and localized energy input enabling precise, reproducible welds, laser beam welding represents a preferred industrial joining technology. Electro-mobility drastically increases the need for defect-free and automatable copper joining technologies. However, copper welds that are produced with state-of-the-art infrared lasers often suffer from spattering and porosity. Recent publications show distinct improvements using novel beam sources at visible wavelengths, attributing them to increased absorptivity. Nevertheless, this cannot fully explain the steadier process behavior. This wavelength-dependent process stability has not yet been investigated sufficiently. Therefore, we have developed a predictive material-dependent criterion indicating process stability based on the example of copper heat-conduction spot welding. For this purpose, we combined energy balances with thermo-physical material properties, taking into account the wavelength and temperature dependence of the optical properties. This paper presents the key mechanism that we identified as decisive for process stability. The criterion revealed that X-points (unique, material-specific wavelengths) represent critical stability indicators. Our calculations agree very well with experimental results on copper, steel and aluminum using two different wavelengths and demonstrate the decisive, material-dependent wavelength impact on process stability. This knowledge will help guide manufacturers and users to choose and develop beam sources that are tailored to the material being processed.

1. Introduction

Laser beam welding of metals is a widely used process in various industry sectors, e.g., the automotive industry [1,2]. Since the development of the first high-power beam sources, its applicability has steadily broadened and further expanded through the development of novel beam sources. The change from the pioneering CO2 lasers ( λ = 10 . 6   µ m ) to solid-state lasers ( λ     1   µ m ) realized as thin-disk or fiber lasers based on Yb:YAG and Nd:YAG led to strong increases in efficiency, absorptivity and applicability [2,3]. Due to the rapidly expanding market for electric mobility, copper, with its excellent electrical conductivity, and thus also copper joining—ranging from small applications, such as hair-pins up to large cross-section applications like high-current conductors—has been gaining importance [4,5]. However, copper welding with near-infrared (IR) laser sources suffers from low absorptivity and low reproducibility, i.e., locally varying welding depths, as well as process instabilities, resulting in excessive spatter formation and porosity [6].
In laser-based material processing, process stability signifies a stable or quasi-stationary process. This means that when using a coordinate system that moves with the laser beam velocity or drilling speed, the process appears as stationary, i.e., the process variables are constant or move only slowly. Deviations from this state, so-called process instabilities, typically lead to events that produce negative impacts on the resulting process quality, e.g., melt waves leading to spattering and rough surfaces of the weld seam, or oscillations of the vapor capillary leading to porosity within the weld seam [1,2,7].
To meet this challenge arising during copper welding, high-power beam sources at even shorter wavelengths, especially frequency-doubled Yb:YAG lasers at λ = 515   nm (green wavelength region) [8,9] and diode lasers at λ = 450   nm (blue wavelength region) [10,11,12] have been developed, as higher absorptivity values at these shorter wavelengths were expected [6,10,13,14]. Initially, their industrial applicability was very limited due to their low laser power, and in the case of the diode lasers, their low beam quality. Meanwhile, commercial systems reach laser powers of 3 kW (green), and even diode lasers (blue) reach 1 kW of laser power at a beam parameter product of 40   mm · mrad and a fiber with 400   µ m diameter, enabling their use in a wide range of industrial welding applications [8,15]. First results confirm the anticipated higher absorptivities and show drastic improvements regarding process stability and reproducibility [5,6]. However, the mechanisms leading to this increase in stability are not yet fully understood.
To identify these mechanisms, we investigate the relationships that form the basis of this phenomenon. For this purpose, we introduce a material-specific criterion predicting process stability based on the example of pulsed heat-conduction welding, as it represents one of the most basic laser-based welding processes and is widely applied for the joining of thin parts, e.g., foils. For this, we conduct thorough literature research for the optical properties regarding wavelength and temperature, and conduct validation experiments on copper, steel and aluminum using both an IR and green beam sources. On the one hand, this process stability criterion enables quick evaluation of wavelength regimes that are beneficial to laser-material processing of a specific material; on the other hand, the criterion facilitates an analysis of the origin of the strongly changing process stability with wavelength and material.

2. Materials and Methods

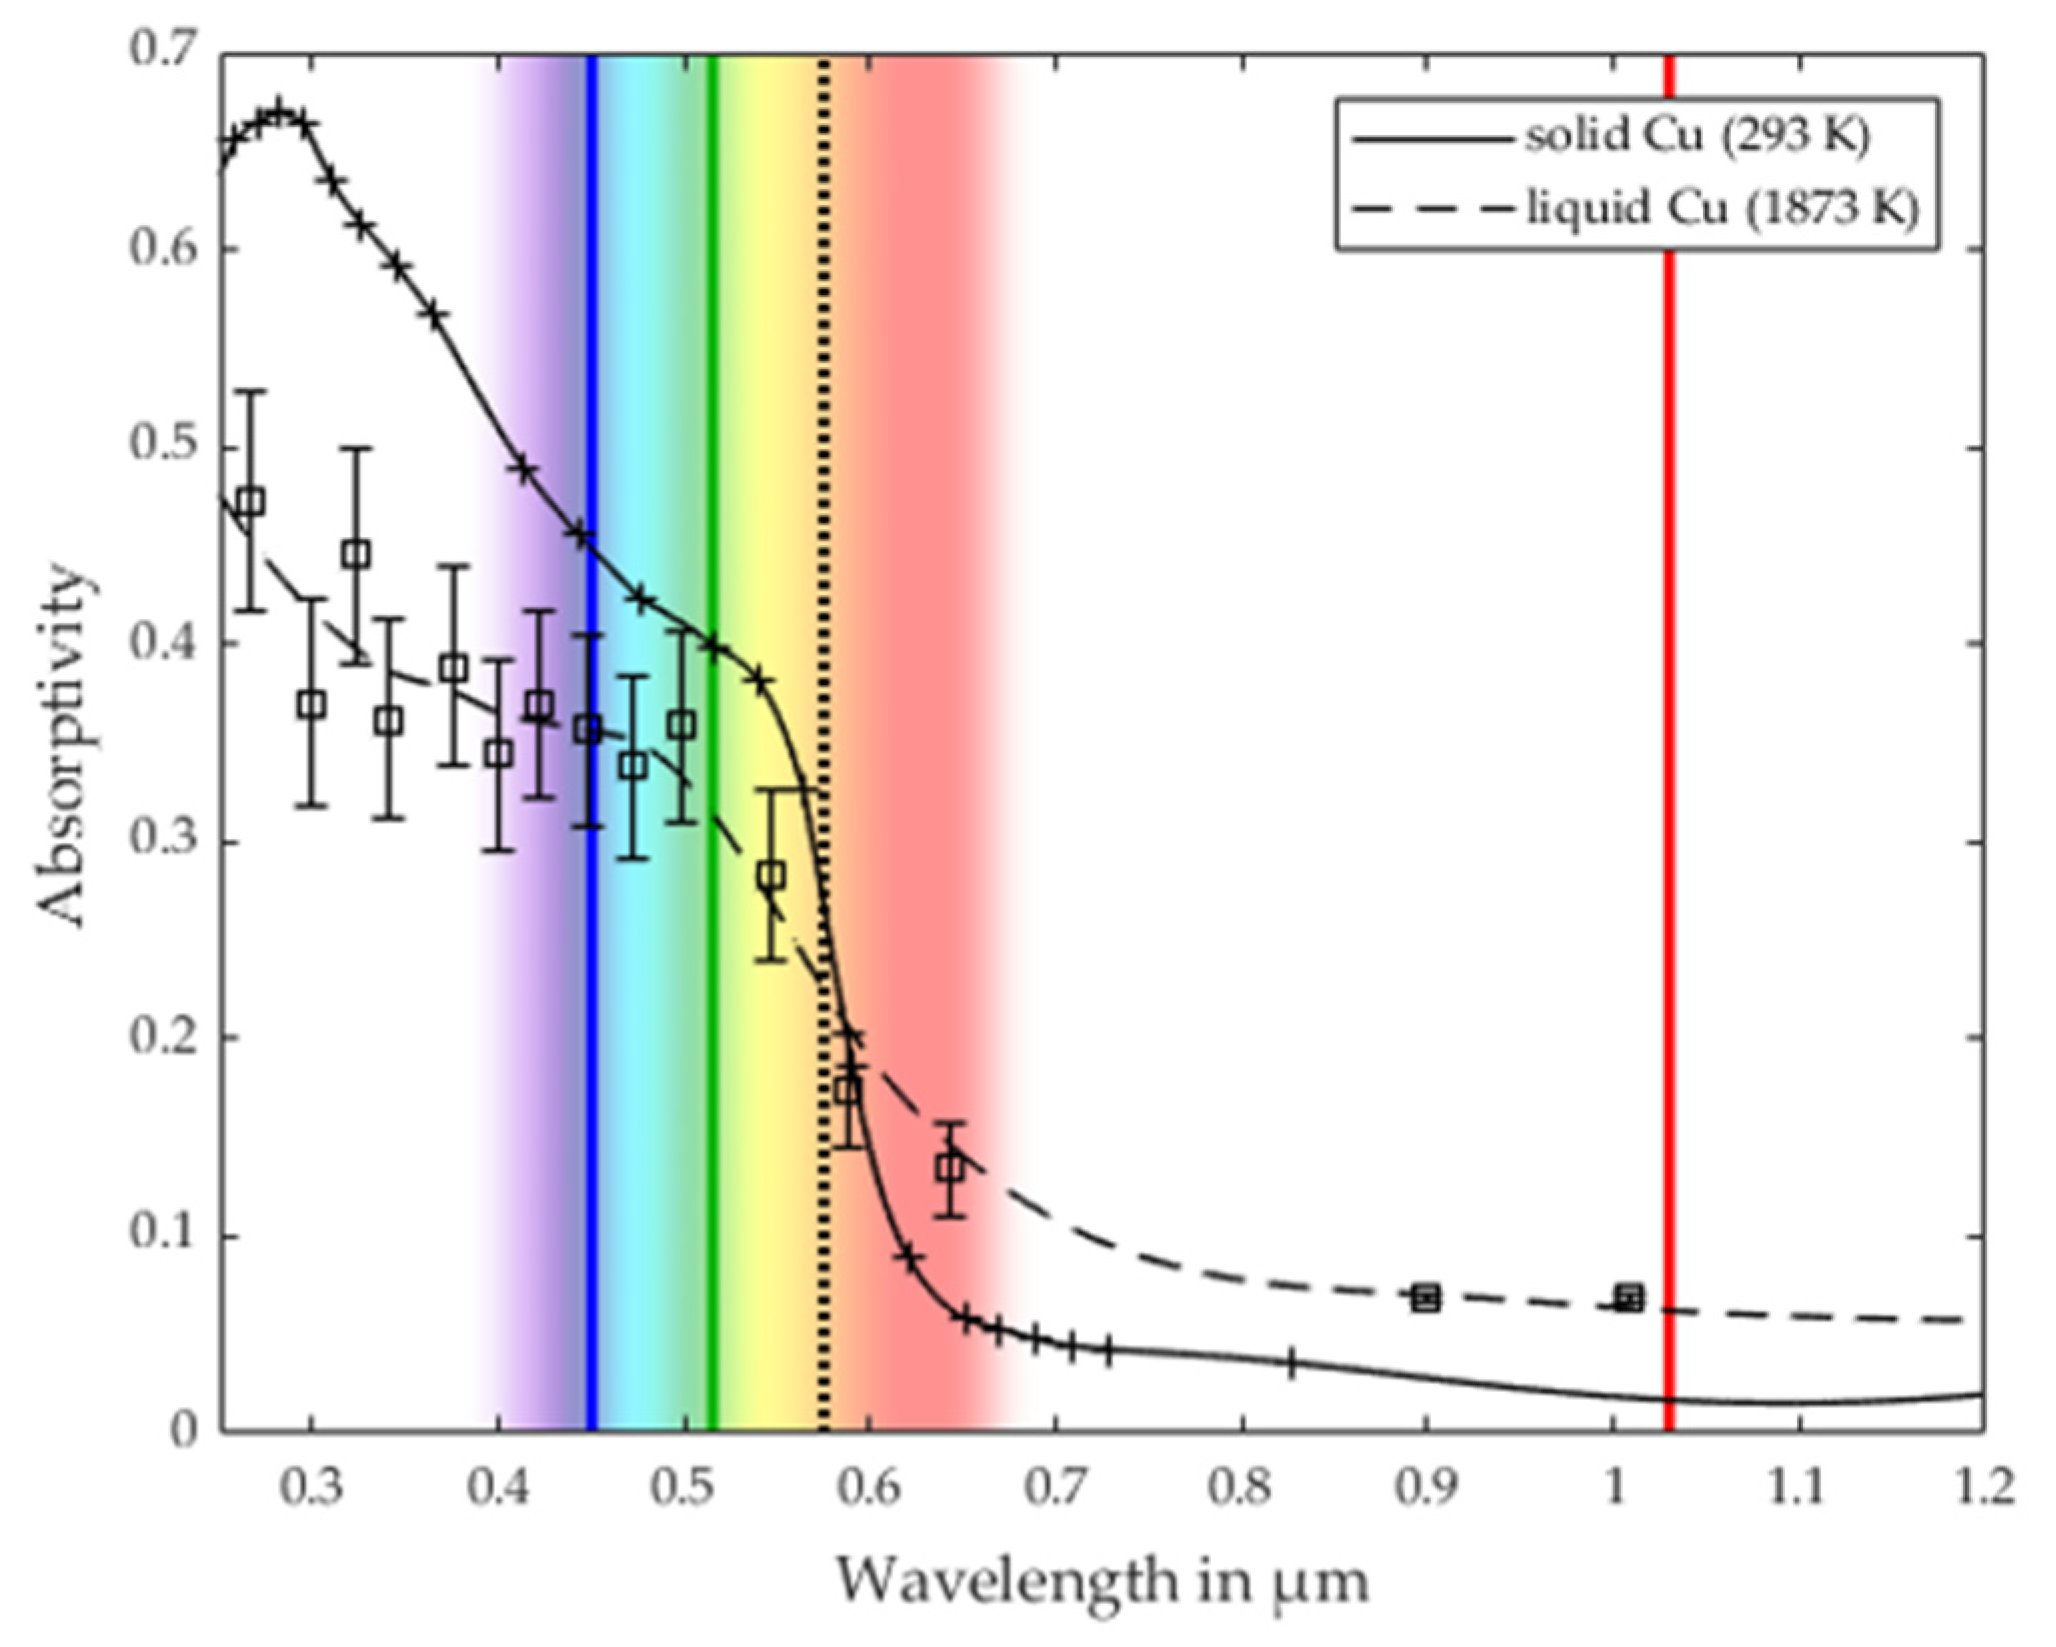
2.1. Evaluation of the Optical and Thermo-Physical Properties

While temperature-dependent values for thermo-physical properties are available from commercial databases for pure metals, as well as alloys, there are no such ready-to-use data available in the literature or databases for the wavelength and temperature-dependent absorptivity A ( λ , T ) . Thus, we conducted extensive literature research for the optical properties over a temperature range from room temperature to elevated temperatures at the molten state for copper [16,17,18,19,20,21,22,23,24,25,26,27,28,29,30,31,32,33], aluminum [27,28,29,30,34,35,36,37,38,39,40,41,42,43,44,45,46] and iron [26,27,28,29,30,46,47,48,49,50,51,52,53,54,55]. The wavelength region of interest was defined to cover the full visible spectrum and parts of the neighboring IR spectrum, including the wavelength of IR disk lasers at λ = 1030   nm . Therefore, we selected an interval of at least 400 1030   nm for each material. In order to assess the consistency and accuracy of the measurements, we compared various sources in the form of the refractive index, as well as regarding the resulting absorptivities of unpolarized light at normal incidence. To further ensure consistency, we only considered measurements spanning the whole wavelength region of interest for the final selection.
The optical properties of metals in the literature within the wavelength and temperature regime of interest were acquired using a set of different measurement and analysis techniques. Regarding the samples, either polished bulk specimens or thin films are utilized. The thin films are prepared by ultra-high vacuum deposition [20,25,56,57], as especially on transition metals, oxide layers can form even under vacuum conditions and considerably hamper the reflectivity of the specimens. For measurements above melting temperature, bulk specimens are typically contained in ceramic dishes and heated electromagnetically. The targeted temperature is monitored during the measurement using thermocouples [29,58]. To prevent oxidation during the optical measurements, either inert nitrogen atmosphere is employed [26,56] or hydrogen atmosphere, especially using liquid specimens [29]. For noble metals, such as copper, room temperature measurements could be conducted even under normal air atmosphere without impairments from oxidation [20]. Regarding the measurement principles, some works use the Kramers–Kronig relations to extract the complex refractive index from, e.g., reflectivity measurements [25,34], while other works use ellipsometry [29], reflectometry [48,58] or combine the transmission and reflection measurements of thin films [20] to obtain the refractive index purely experimentally. Kramers–Kronig based approaches feature the advantage over fully experimental approaches of being able to check the data for consistency using multiple sum-rule tests; however, they necessitate a consistent data set of at least one optical quantity over ideally the whole frequency domain, which represents a major challenge [34]. Therefore, such approaches could be found only for room-temperature data [25,34,48].
The availability of optical data in general and specifically of data at the elevated temperatures of the metals and wavelength regime of interest in this study were very limited, as no dataset could be found for the full wavelength range of interest for other temperatures than room temperature and one temperature that was slightly above melting temperature. Therefore, we selected one dataset at the solid state that was measured at room temperature, representing the absorptivity at the solid state A sol ( λ ) , and one at the liquid state (Cu: 1873 K, Fe: 1873 K, Al: 1173 K), representing the absorptivity at the liquid state A liq ( λ ) , respectively, for each metal [29,31,35,55,58].
We interpolated all values over the wavelength ranges of interest and calculated the absorptivity values for unpolarized light at normal incidence. All the calculations were performed using Matlab R2019b (MathWorks, Natick, MA, USA) and Maple 2019 (Waterloo Maple Inc., Waterloo, ON, Canada). Due to the noisiness of the data, we performed additional smoothing of the refractive index values taken from Miller [29] using the locally weighted scatter plot smooth function (loess) that were provided by Matlab. As far as the sources provided error ranges, we converted them to those of the absorptivity values using the Gaussian rule of error propagation [59]. In continuative calculations for the process stability criterion, we omitted error calculations.
Various wavelength-dependent and partially temperature-dependent fitting methods—especially adapted Drude–Lorentz models for the optical properties—have been proposed in the literature. However, due to interband transitions, none of these fitting models were able to describe A ( λ , T ) with sufficient accuracy over the whole wavelength regime and the metals of interest for this study [60,61,62,63]. These transitions complicate and dominate the optical behavior in this wavelength regime and moreover, their temperature dependence is not yet fully understood, making temperature-dependent fitting inaccurate [63,64]. Therefore, we omitted the fitting of the temperature and the wavelength dependence of the optical properties.
As absorptivity monotonically increases or decreases with temperature at a given wavelength, we can safely assume that waiving the fitting of A ( λ , T ) and using only state-dependent values for the absorptivity ( A sol ( λ ) and A liq ( λ ) ) instead introduces only a systematic and therefore reproducible error with a small variation over the wavelength [63,65]. Due to the interband transitions, the use of temperature- and wavelength-dependent fitting models would introduce a hardly-assessable error that fluctuates more rapidly with both temperature and wavelength within the wavelength and temperature regime under investigation.
For the thermo-physical properties, density, specific heat and heat of fusion, the validated commercial material database JMatPro® (version 9.0, Sente Software Ltd., Guildford, UK) was used to export temperature-dependent values from room temperature up to evaporation temperature [66].

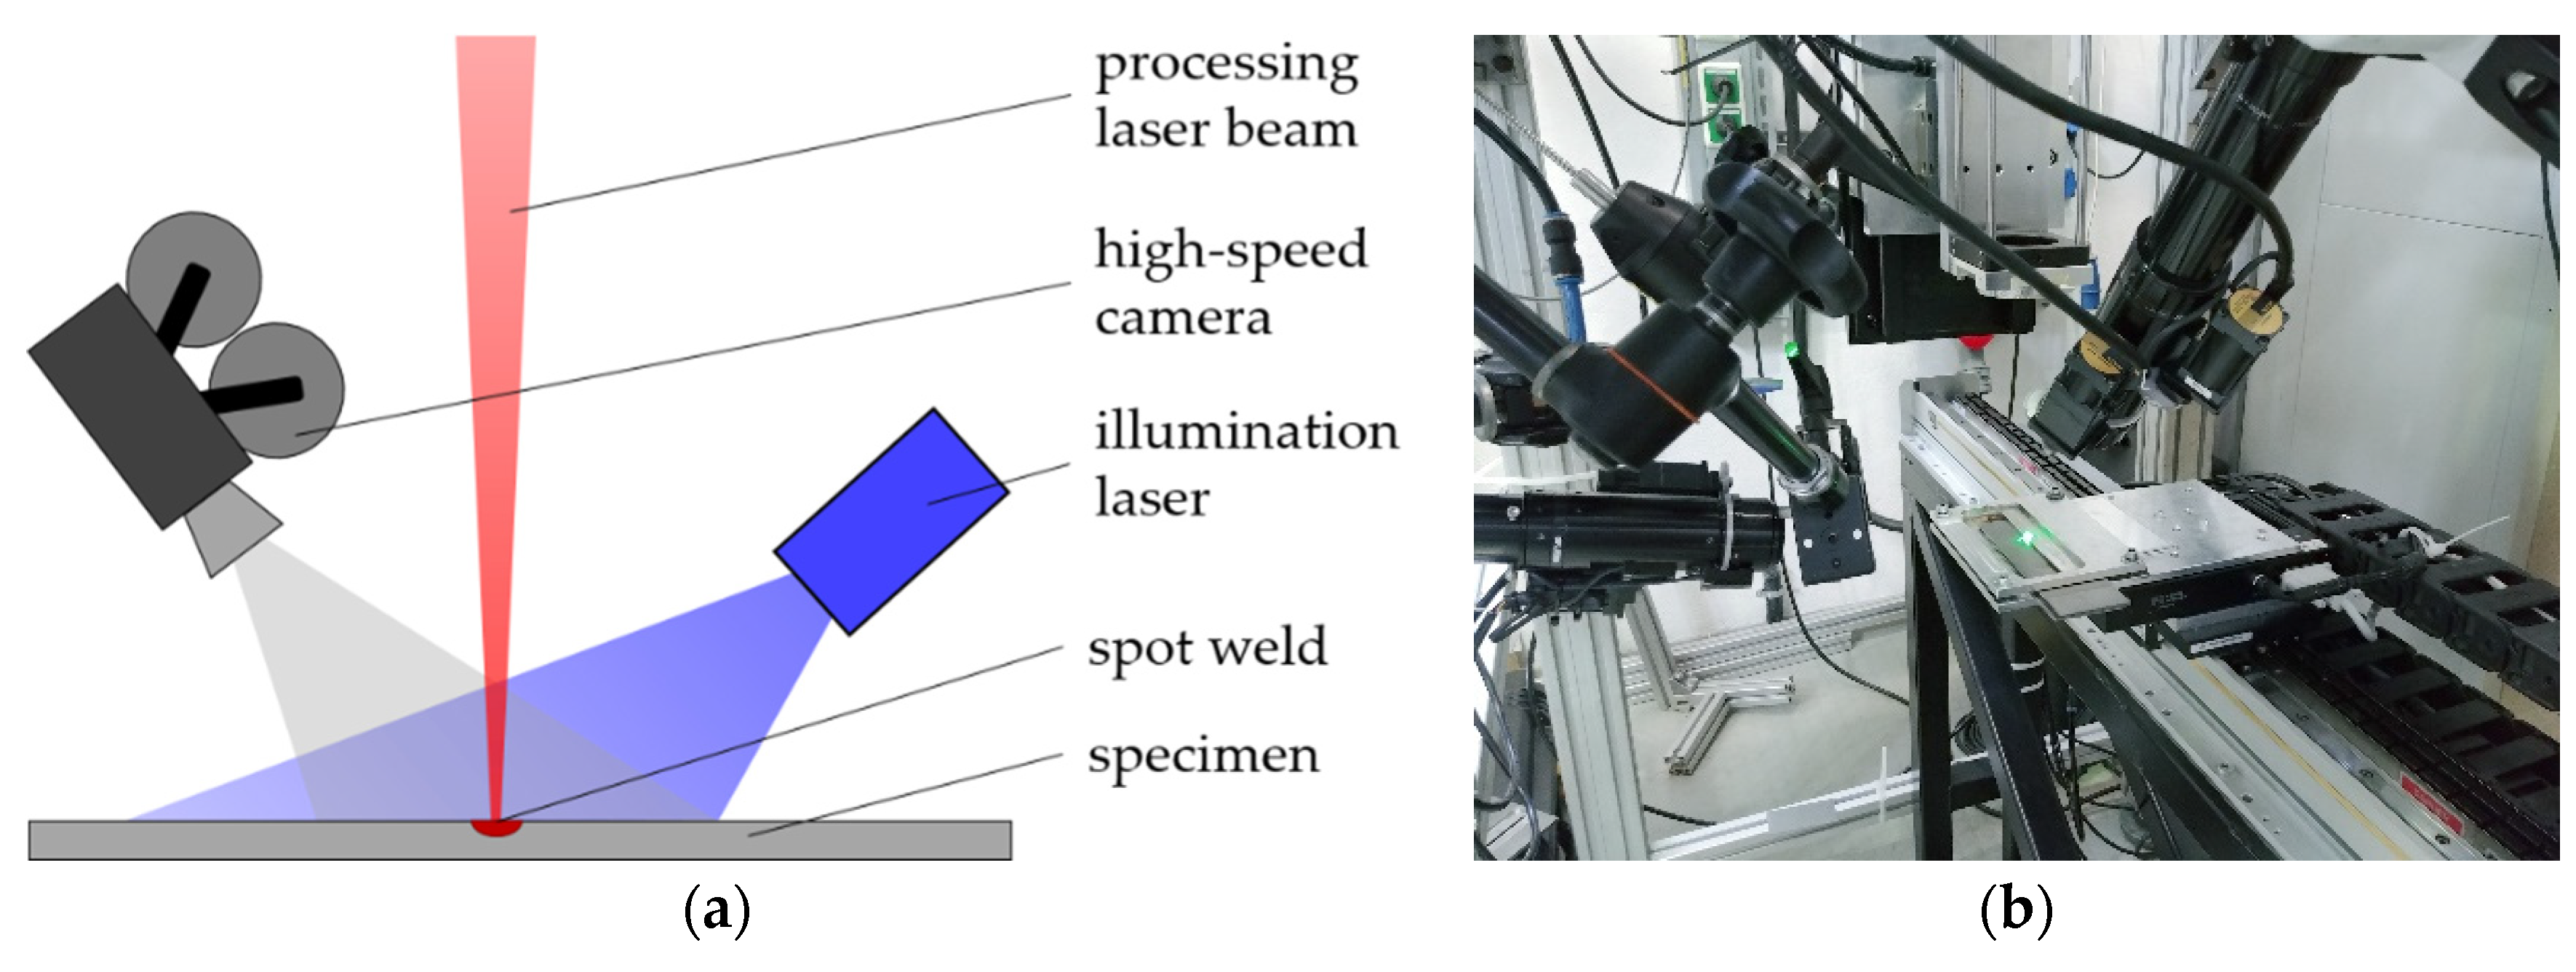
2.2. Experimental Setup

For the experimental results, spot welds in 1 mm thick sheets of copper (Cu-HCP), iron (unalloyed steel 1.0330) and aluminum (Al99.5) were produced using a green laser beam at λ = 515   nm (TruDisk 3022, Trumpf, Ditzingen, Germany) and an IR laser beam at λ = 1030   nm (TruDisk 8001, Trumpf, Ditzingen, Germany), as shown in Figure 1. The beam diameter was set to d = 300   μ m ; the beam was stationary; its profile was quasi-Gaussian; and the pulse length was τ = 5   ms for both beam sources. The pulse power was chosen such that the resulting welding depth was d z = 400   μ m for both wavelengths and all materials. For this, we conducted parameter studies for all materials with both beam sources varying the laser power and produced quasi-longitudinal grindings of the lines of spot welds. To ensure that the maximum welding depth was acquired, we conducted quadratic fits of the welding depths of at least three measured spot welds, including a maximum weld depth and one neighboring weld spot at each side of it, and calculated the maximum weld depth of each fit. Then, we computed the average of three of these maximums as the measured welding depth. The laser power that was necessary to achieve the desired welding depth was then calculated from piecewise linear fits of the measured and calculated maximum welding depths.
We measured the onset of melting and evaporation visually using a high-speed camera (Phantom v1210, VisionResearch, Wayne, NJ, USA). The framerate was set to 100 kHz, resulting in a spatial resolution of 256 × 256 pixels. The camera recorded alternatingly both with and without the use of an illumination laser at λ = 808   nm , P Peak = 500   W and a pulse length of τ = 40   ns (Cavilux HF, Cavitar, Tampere, Finland). The criterion for the onset of melting was the formation of an initial small melt pool. The criterion for the onset of evaporation was an aspect ratio (depth to radius) of the vapor-induced depletion in the melt pool approaching one.

3. Results

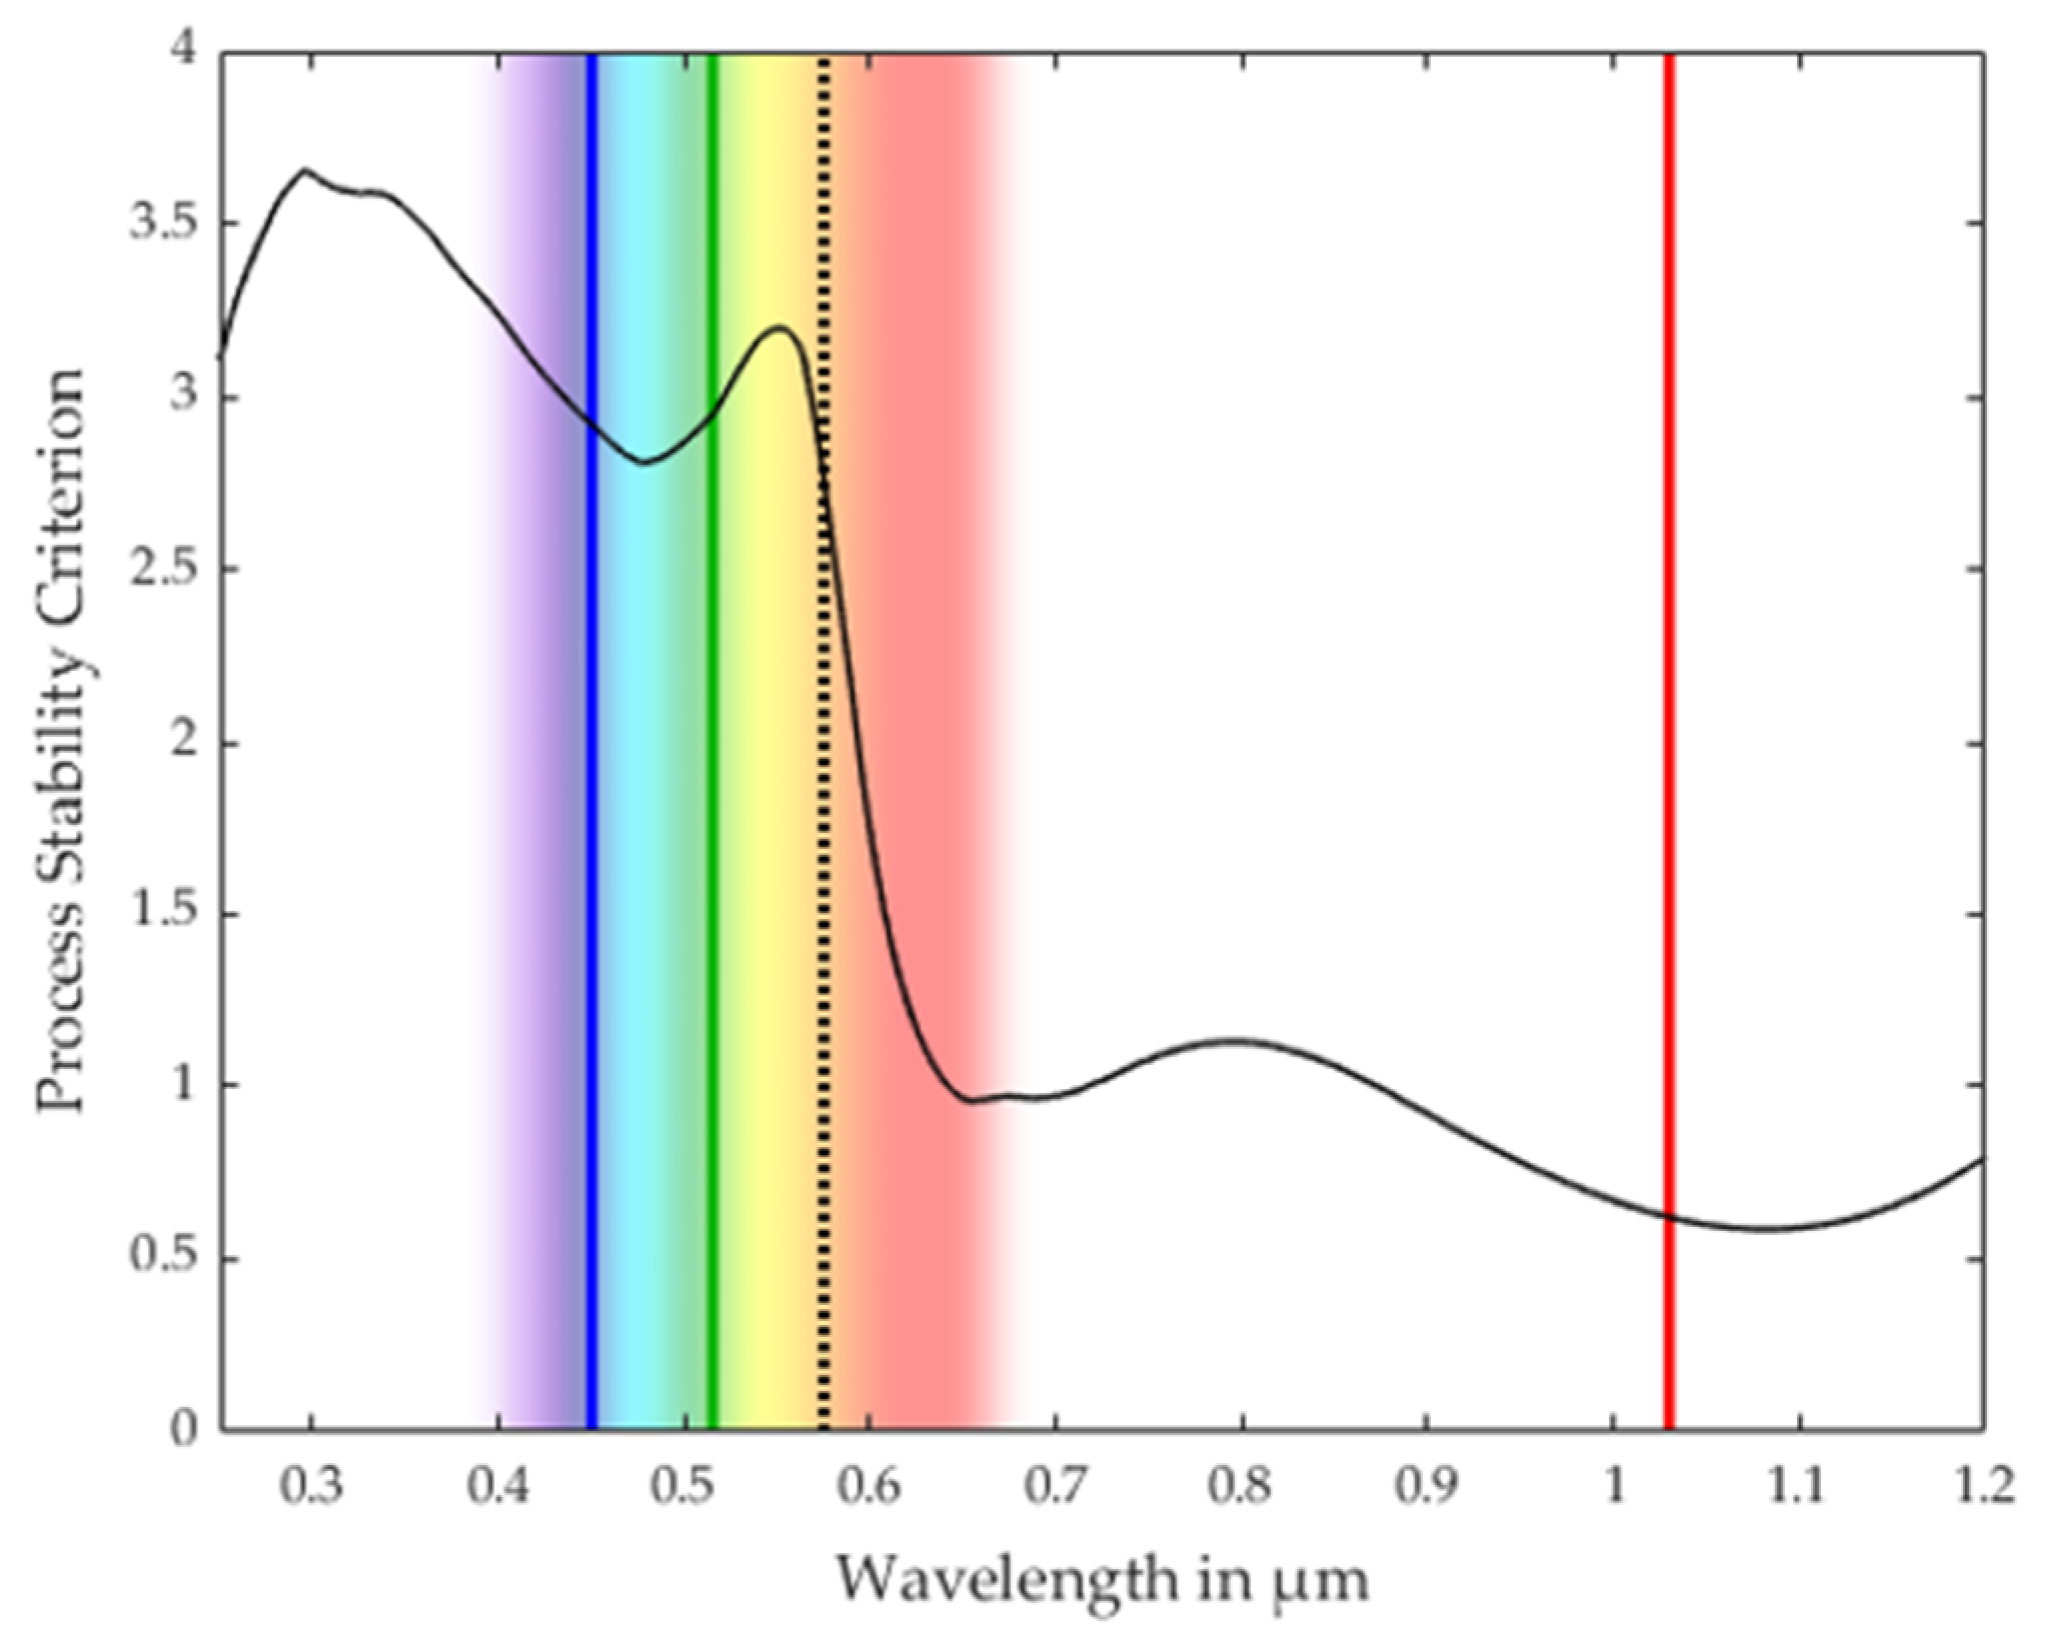
3.1. Process Stability Criterion

Although evaporation-driven deep-penetration welding represents the most commonly used welding process since it enables deep and narrow weld seams, heat-conduction welding can also be employed, particularly when thin sheets up to a thickness of 1, 5 mm or foils are to be joined [1,7]. As heat-conduction represents a very calm and stable process resulting in very smooth, high-quality weld surfaces, compared to deep-penetration welding, it also represents a popular joining process for applications using hard-to-process materials, such as copper [1].
In pulsed or spot heat-conduction welding, a stationary laser pulse impinges onto the material and heats it until a shallow, semi-spherical melt pool forms. Since evaporation is the driving mechanism of unwanted melt ejection due to its accompanying recoil pressure, intensities and pulse durations are typically chosen in such a way that evaporation is minimized.
These restrictions impose lower and upper boundaries to the heat input: although the melting temperature T m must be exceeded, the evaporation temperature T v should be avoided or only barely reached. Thus, the minimum specific energy input per unit mass from the laser is given by
E Min ( λ ) = E T 0 T m ( λ ) = T 0 T m c P ( T ) A ( λ , T ) dT + H m A ( λ , T m ) ,
with T 0 as room temperature, c P ( T ) as the temperature-dependent specific heat, A ( λ , T ) as the temperature and wavelength-dependent absorptivity at normal incidence and H m representing the latent heat of fusion. As described in Section 2.1, we replaced the temperature-dependent absorptivity A ( λ , T ) in our calculations by phase-dependent data A sol ( λ ) and A liq ( λ ) due to limited data availability. The upper limit for the specific energy input per unit mass from the laser is analogously given by
E Max ( λ ) = E T 0 T v ( λ ) = T 0 T m c P ( T ) A ( λ , T ) dT + H m A ( λ , T m ) + T m T v c P ( T ) A ( λ , T )   dT .
In this equation, the latent heat of vaporization is not included since evaporation is to be avoided; thus, the mass loss due to evaporation can be neglected. In laser material processing, as soon as the evaporation temperature is reached, the evaporation-driven recoil pressure sets in and strongly influences the process dynamics, even if the overall evaporation rate is very low. Typically, even in strongly evaporation-driven laser-based processes, e.g., deep-penetration welding, the evaporation rates are orders of magnitude smaller, compared to the fusion rate and are often even negligible [67,68].
As can be seen in Figure 2, the absorptivities of both solid and liquid copper decrease almost monotonically with wavelength, as expected. The absorptivity of solid copper shows a sharp reduction at around λ     575   nm , which can be attributed to interband transitions from the d-bands to p-states at the Fermi level [69]. This effect is weaker for the absorptivity of liquid copper, as the energy bands broaden with temperature. Moreover, while for λ   <   575   nm the absorptivity of solid copper is higher than the value of liquid copper, for λ   >   575   nm it becomes lower.
Looking at the minimum and maximum specific energy inputs that are necessary from the laser for heat-conduction welding, as given in Equations (1) and (2) and shown in Figure 3, both values increase strongly with the wavelength reaching a maximum at around 1 . 1   μ m , which can be ascribed to the decreasing absorptivity.
Going one step further, as the two specific energies E Min ( λ ) and E Max ( λ ) given in Equations (1) and (2) can be regarded as the energetic boundaries of the theoretical process window, the welding process should work correctly, as long as the energy input ranges within these borders. The likelihood of reaching or passing these borders and producing defects like spatters (upper boundary) or a loss of fusion (lower boundary) will scale with the relative size of this theoretical process window Δ E rel ( λ ) :
PSC = Δ E rel ( λ ) = E T m T v ( λ ) E T 0 T m ( λ ) = E T 0 T v ( λ ) E T 0 T m ( λ ) E T 0 T m ( λ ) .
This theoretical process window, as given by the gray area in Figure 3, increases with wavelength. However, no distinctive characteristic is directly noticeable. As the relative size of this theoretical process window acts as a measure of process stability, we decided to define it as the process stability criterion (PSC). Although we are very aware that heat-conduction losses influence the energy balance during welding, especially using highly thermally conducting materials like copper, we decided not to include them in the PSC criterion for three reasons. First, heat-conduction losses strongly depend on the used process parameters and therefore they can only be expressed and quantified in dependence of the process parameters, not as a universal process parameter-independent measure that is only dependent on the used material and wavelength [70,71]. Second, heat-conduction losses only depend on the heat input that is caused by the laser beam but are independent of the laser wavelength itself. Therefore, we can regard the influence of heat conduction as constant and therefore negligible when comparing welds with different wavelengths, but similar overall in terms of energy input and remaining process parameters. Last, it is technically not possible to measure heat-conduction losses sufficiently accurately with the temporal and spatial resolution that such an approach would necessitate to allow for validation and evaluation.
Looking at the values of the PSC, as defined in Equation (3) for copper, shown in Figure 4, we see comparably high values of ~ 3 for λ     575   nm . Additionally, a sudden and distinct drop to values <   1 for larger wavelengths can be noticed. Both observations are in accordance with the general trend towards lower absorptivities at larger wavelengths and with the experimental results that show an unstable welding process for IR laser beams at λ = 1030   nm and stable results using green and blue laser beams [5,6].
The surprisingly abrupt change of the PSC starting at around λ     575   nm is significantly stronger and more sudden than the change of the absorptivity values around this wavelength, as shown in Figure 2. Investigating further, it turned out that this was no coincidental effect, but the result of an inherent optical property of metals—the so-called X-point. The X-point is a specific wavelength λ X , at which absorptivity is independent of temperature and at which the sign of the temperature dependence of the absorptivity changes from negative to positive with an increasing wavelength, as given in Equation (4) and shown in Figure 2 [72]:
A T ( λ X ) = 0   with   A T ( λ   <   λ X )   <   0   and   A T ( λ   >   λ X )   >   0
The X-point has been proven to be present in both the solid and the liquid state of metals [73]. Its wavelength features no or only slight variations with temperature and its value is assumed to be connected to the melting temperature of the metal [72,74]. While the existence of X-points has been known for decades due to absorptivity and emissivity measurements, they have since rarely been a topic of research, and their physical origin remains not fully understood [72,74]. For copper, values ranging from 560   nm to 575   nm were measured [17,75,76] which we can confirm, as can be seen in Figure 2.
Regarding the process of heat-conduction welding using wavelengths below the X-point, this means that, compared to using wavelengths above the X-point, less laser energy is necessary to heat the considered material up to the liquid state, but more energy is necessary until the molten material reaches the evaporation temperature. Therefore, the relative size of the theoretical process window size Δ E rel increases and so the process becomes more stable, making the X-point the decisive turning point for process stability. This is valid as the change in absorptivity with temperature A T exhibits only a low variation with temperature, apart from small fluctuations in the short wavelength region due to interband transitions that lead to narrow absorptivity peaks which broaden and typically disappear rapidly with increasing temperature [18,36,77].
In the field of laser material processing, the term X-points has appeared in very few publications in the context of distinguishing different wavelength regimes in models for the refractive index, but their distinct influence on laser-material processing itself has never been mentioned or discussed [43,61,78]. The subject of temperature dependence of the absorptivity of copper at visible wavelengths in general has been ignored, even in current simulative studies, using temperature-independent values [79,80,81]. In the few cases of attempts to research or measure data for different temperatures and states at visible wavelengths, the reversed temperature dependence of the absorptivity was either attributed to oxide layers [82] or dismissed as implausible [14]. In many experimental publications on copper welding, this issue is circumvented by stating the increasing absorptivity with temperature and the additional absorptivity jump at the phase change for λ = 1   µ m , together with the trend of increasing room-temperature absorptivity with decreasing wavelength [4,83,84,85]. This leads to the misleading expectation that both trends together will hold for shorter wavelengths, in turn leading to even higher absorptivity values for molten copper. Meanwhile, first simulative approaches seem to follow this expectation and assume increasing absorptivity values with temperature even in the green wavelength regime for their analyses [86].

3.2. Validation of the Process Stability Criterion for Copper

In order to confirm this criterion, heat-conduction spot welding experiments of copper specimens were conducted using green ( λ = 515   nm ) and IR ( λ = 1030   nm ) high-power Yb:YAG beam sources. Table 1 shows the resulting heat-up time spans from the beginning of the τ = 5   ms long laser pulse until the onset of melting and evaporation.
While in the experiments with the IR laser, the onset of melting took almost six times as long as compared with the green laser; the time span until evaporation was reached was only 2.5 times as long for the IR laser, which was in accordance with the respective PSC values, indicating a more stable process using the green laser. Looking at the corresponding standard deviations further shows the increased stability. While for the green wavelength, the melting onset could be measured within the full measurement accuracy of 0.01 ms that the used framerate allowed, meaning the deviation of the melting onset was below the measurement accuracy, the melting onset using the IR radiation deviated much more. For the evaporation time spans, this trend increased even more, with IR reaching a standard deviation four times as high for the green wavelength, resulting in a stronger variation of the reached welding depths. Comparing these results with those using the two different wavelengths on other materials enables an even more quantified validation of the PSC.

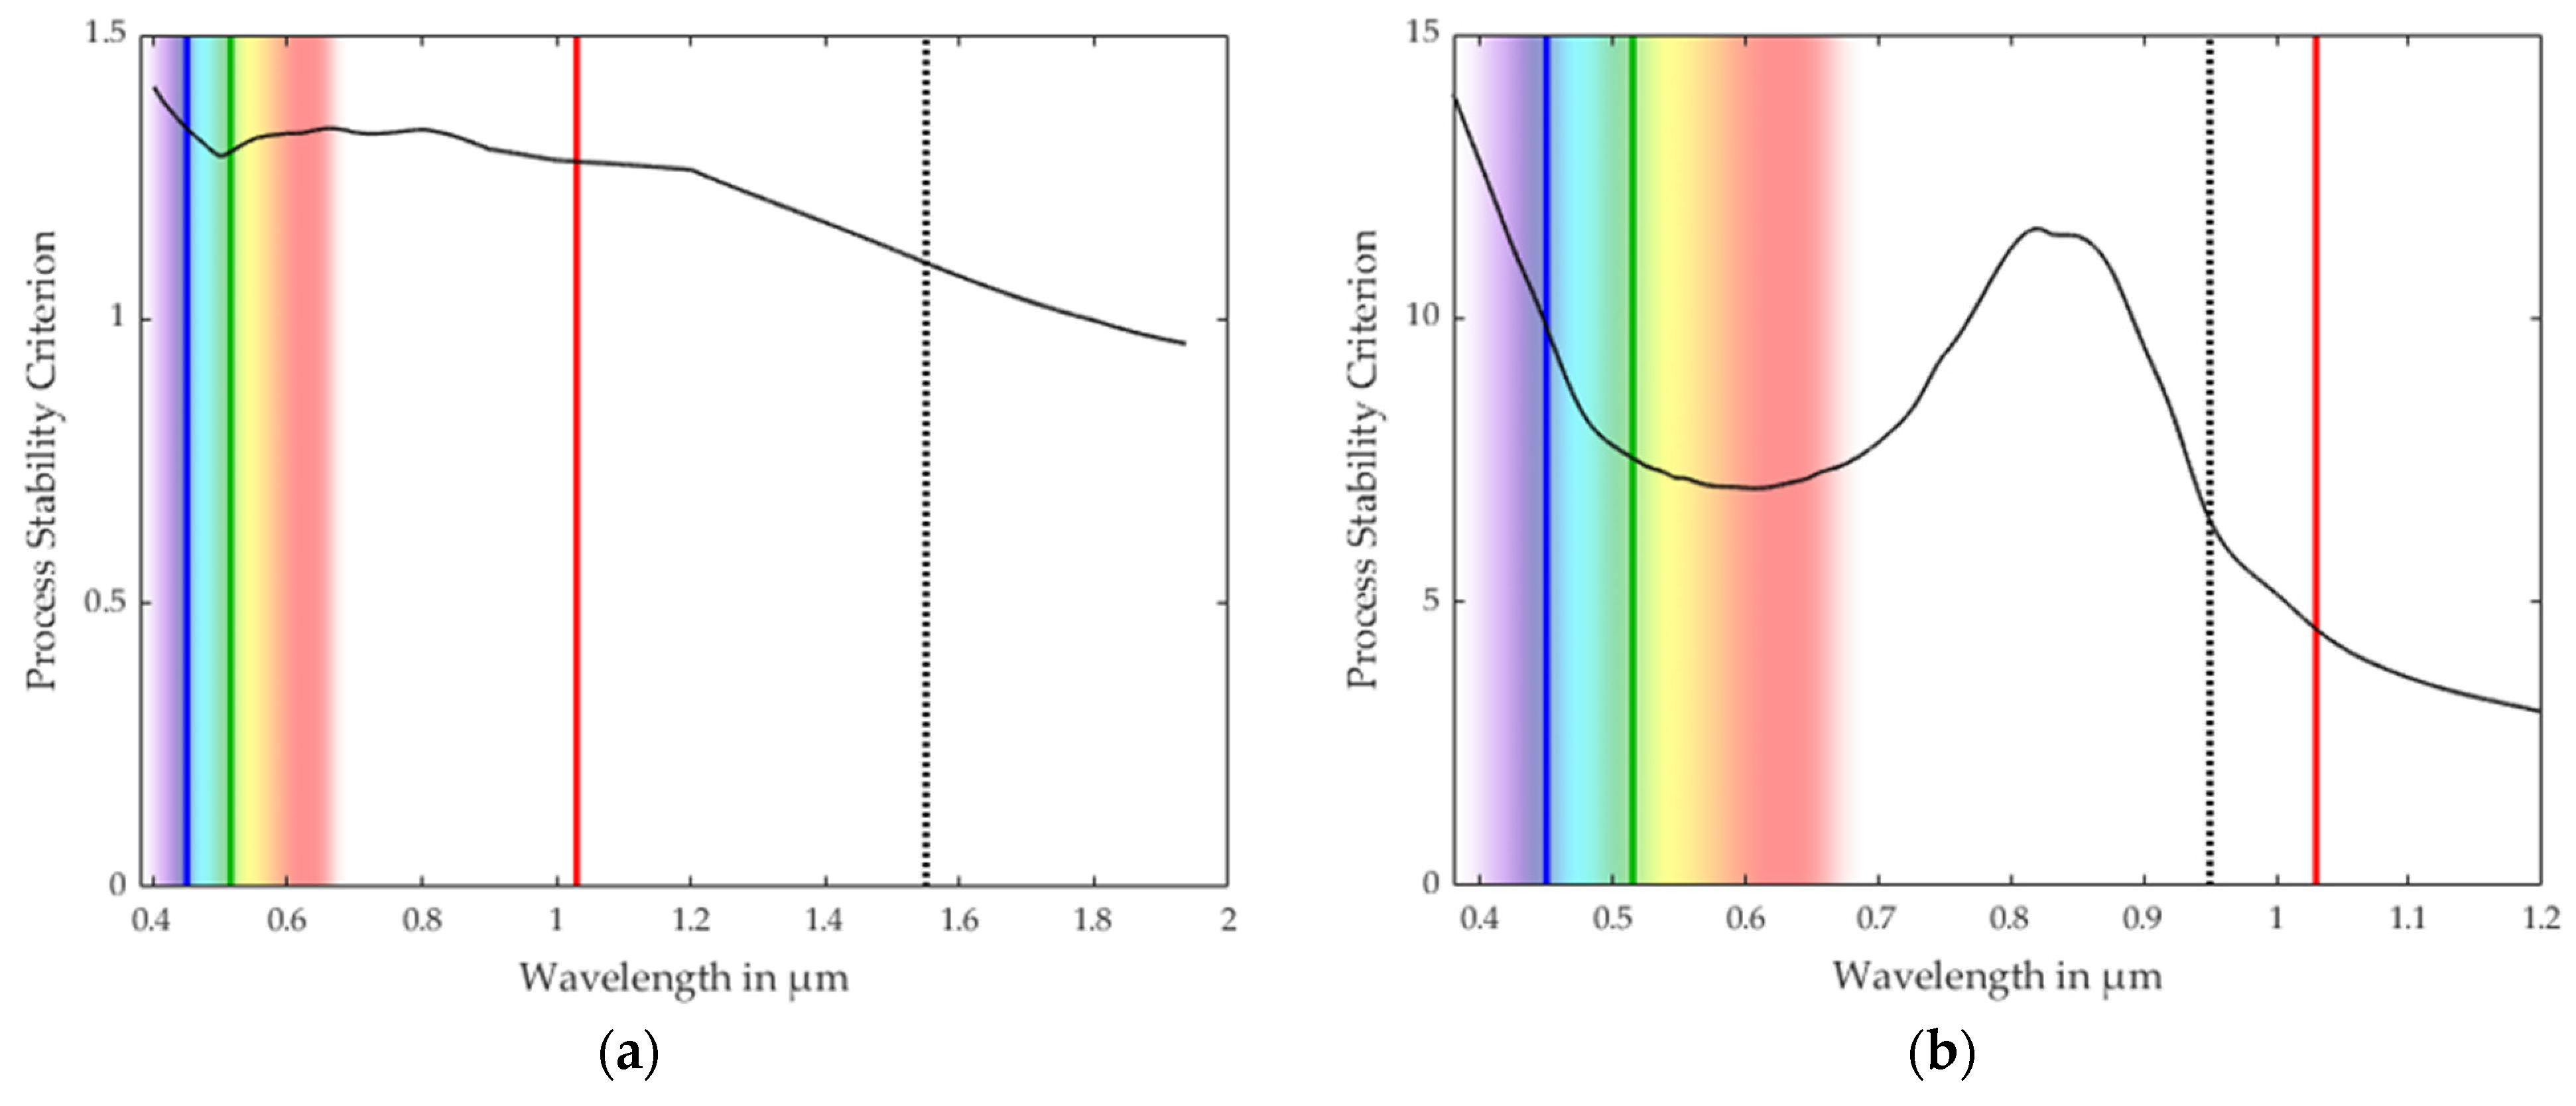
3.3. Comparison with the Process Stability Criterion of Iron and Aluminum

To put these findings into perspective, we investigated the absorptivity and calculated the PSC for the most common base metals used in laser beam welding, iron and aluminum. The values are displayed in Figure 5 and Figure 6.
Iron exhibits relatively high absorptivity values decreasing monotonously with wavelength, as shown in Figure 5a. For wavelengths λ   <   1 . 55   μ m , the absorptivity values at the solid state are consistently larger than those at the liquid state, which is in accordance with the literature values of the X-point wavelength λ X ,   Fe of iron of λ X ,   Fe     1 . 55   μ m , suggesting a stable welding process for the wavelength regime under investigation [72,77]. The corresponding PSC of iron, as shown in Figure 6a, shows almost constant values around 1.3 along the whole wavelength range under consideration, which are low compared to the value of copper at the wavelength region λ     575   nm , but still twice as high compared to the value of copper at ~ 1   μ m .
While the situation for iron in this wavelength regime turns out to be rather stable, the behavior of aluminum resembles more the situation of copper. Looking at the absorptivity curves of solid and liquid aluminum, as shown in Figure 5b, interband transition peaks dominate both curves. Whereas the peak for the solid aluminum is very steep and located at ~ 800   nm , the peak of the liquid state is broader with a maximum at ~ 650   nm . Apart from these overlying peaks, the absorptivity for solid aluminum generally decreases with wavelength, while the absorptivity for liquid aluminum increases slightly with wavelength. Due to the strong interband transitions in both the solid and liquid state, X-point determination proves to be challenging, as the shifted peaks lead to three intersection points of the two curves instead of the expected single one. Although even in the thoroughly conducted literature study no explicitly stated values for the X-point of aluminum could be found, we were able to calculate estimates based on temperature-dependent absorptivity measurements [37,75]. According to these estimates, the X-point features a comparably strong temperature dependence and should be positioned at λ X ,   Al     950   nm .
Looking at the PSC of aluminum, as given in Figure 6b, its values are overall comparably high and generally decrease with wavelength. The interband transition peak is still present, but due to its peak position right between the wavelengths of interest, its influence on the values at these wavelengths can be regarded as negligible. Within the visible wavelength region, the values are slightly higher than for the wavelengths above the interband transition peak at ~ 800   nm , suggesting a more stable welding process using green radiation than using IR.
To validate these findings, we carried out spot welding experiments on iron and aluminum using the same setup as for the previous copper experiments, as given in Table 2. For iron, the ratio of the time spans until melting and evaporation is reached remain rather constant for both used wavelengths. This agrees very well with the hardly varying values of the PSC. Regarding aluminum, the absolute values of the measured time spans vary quite considerably. However, the ratio of the time span until melting to that until evaporation decreases strongly, changing the wavelength from green to IR, which is also in agreement with the corresponding PSC values.
To compare these findings on the three different metals using a more quantitative approach, we used the definition of the PSC as PSC = E T m T v ( λ ) E T 0 T m ( λ ) and the fact that the energy input into the material can be regarded as linear following E abs ( t ) = P Laser A ( λ , T )     t . This enables the conclusion that the ratio of the time spans of the phase changes (phase change ratio, PCR) PCR = t T m T v t T 0 T m should scale with their corresponding energies, leading to the expectation that the ratio PSC PCR should be constant, i.e., independent of the used wavelength and material. We calculated these ratios for all experimentally assessed materials and wavelengths, as shown in Figure 7, and achieved an average value for this ratio of PSC PCR = 0.178 ± 0.024 .
Considering that heat losses, especially due to convective heat transfer, are neglected in these calculations, these values are in excellent accordance with the proposed PSC. Regarding the used wavelengths, the values that are reached for IR are consistently slightly lower than those for the green wavelength. However, as the time spans that are necessary to reach the melting and evaporation temperature are also consistently longer for IR than for the green wavelength for all the metals under investigation, we can attribute this differing effect to the also consistently differing amount of energy loss due to conductive heat transfer, as the heat conduction-relevant product of   Δ T     Δ t is correspondingly smaller for IR.

4. Discussion

In laser material processing, the improvement of the copper welding process by changing the wavelength from IR to green lasers has fully met the expectations regarding the three distinctive categories of absorptivity, reproducibility and process stability. The increased absorptivity becomes apparent from the analysis of the wavelength and temperature-dependent optical properties and clearly improves the process by enabling larger welding depths, higher feed rates and more quickly overstepping the energy-input threshold to deep-penetration welding.
The surge in reproducibility can also be traced back to increased absorptivity. Especially for copper spot welding or copper heat-conduction welding, reproducibility, meaning that consecutive spot welds or weld lines feature a steady welding depth, represents the most important quality feature. Using IR radiation, even hardly visible surface irregularities, such as scratches, which are normal for technical surfaces, often lead to a loss of fusion [87]. This is caused by the very low absorptivity of copper at room temperature in this wavelength regime in combination with its drastic increase with temperature and the very high thermal conductivity. These factors hinder absorption and heating very effectively when the already small absorptivity value at room temperature of 2% is even further reduced by surface irregularities. This effect is also visible in the up to more than three times higher standard deviation for the time spans until melting and evaporation temperature is reached for IR in comparison to green, as given in Table 1. Especially for spot welding, the opposite effect has also been reported [87]. Whenever surface irregularities lead to a slight increase in absorptivity, the relatively large time span to reach evaporation is shortened drastically, leading to a faster and stronger onset of evaporation and pronounced spattering during these single spot welds. This results in a much less uniform and reproducible size of the spot welds using IR radiation, compared to using green laser beams [87]. Both effects can be fully explained with the larger values of the process stability criterion and the changing temperature-dependence of the absorptivity.
Often, the increased process stability is also attributed to the overall increase in absorptivity, like for the reproducibility, or it is not explained at all [6,88]. Process stability is a decisive prerequisite, especially for continuous welding processes to reach uniform weld depths and even, high-quality weld surfaces. Following our results concerning the changing absorptivity values with regard to wavelength and temperature, our process stability criterion and the connection to the X-point, we argue that it is primarily the changing temperature dependence of the absorptivity with wavelength and much less the overall increase in absorptivity with wavelength that is responsible for the increasing process stability. The decreasing absorptivity with temperature leads to the effect that the warmer the melt surface, the less efficiently it absorbs. This means that in heat-conduction welding, unwanted crossing of the deep-penetration threshold is effectively hampered, like it is for spot-welding. In deep-penetration welding, where temperatures on the surface of the vapor capillary reach evaporation temperature and the temperature profile can be patchy due to the wavy surface geometry, this decreasing absorptivity with temperature will also have a damping effect on this dynamic, leading to a more stable vapor capillary and melt flow, which is confirmed by current experimental investigations [89]. If the absorptivity values for the green wavelength increase with temperature as much as they do for the IR radiation, it becomes obvious by looking at the process stability criterion attaining similar values that this would lead to similarly instable processes, but at lower overall laser powers. Looking at the relative size of the theoretical process window, we could demonstrate that the changing temperature dependence of the absorptivity with temperature represents no disadvantage but shows very advantageous effects on process stability in laser beam welding.
Although our results concentrate on pulsed heat-conduction welding, their implications can be transferred to several other laser-based material processing methods. The powder-bed fusion of metals using a laser beam (PBF-LB/M) represents a line-by-line and layer-by-layer welding process for the generation of free-form parts that are typically conducted in heat-conduction welding mode right at the energy input threshold to deep-penetration welding [90,91,92]. When evaporation intensifies, spattering and powder denudation increase due to the higher evaporation flow velocities, leading to higher porosity and reduced quality [93,94]. Therefore, process stability plays a crucial role for the quality of the built parts. However, due to local geometry variations and the drastic difference in thermal conductivity from powder to bulk material, local heat transport can vary considerably. Therefore, lasers in the visible wavelength regime are expected to have even larger beneficial effects on the powder-bed fusion of copper alloys, since these changes in heat transport will have less impact on process stability, leading to less spattering and porosity. First investigations confirm these expectations [95,96].
In deep-penetration welding, the high beam intensities that are used within the interaction zone lead to the formation of a vapor capillary due to the evaporation-driven recoil pressure resulting in characteristic deep and narrow welds. Due to multiple reflections within the vapor capillary, the total absorptance, which can be modelled analytically in a very basic approach as 1     R N with reflectivity R and number of incidences N is typically much higher than the absorptivity of a single incidence A = 1     R [2]. Therefore, the influence of the increased absorptivities due to the wavelength change onto the overall heat input will not be significant. However, it must be kept in mind that due to the non-normal incidence at the vapor capillary, laser–material interaction behaves in a more complex way, and the absorptivity value that is calculated for normal incidence cannot be applied. Thus, the shape and stability of the vapor capillary will be influenced by the reverse temperature dependence of the optical properties. Apart from the damping effect of the inverse temperature-dependence of the absorptivity onto the process dynamics, i.e., stabilizing the vapor capillary and leading to a more stable melt flow, as just described, first investigations of the resulting cross-sectional areas report on considerably narrower welds at the same weld depth for green, compared to IR for copper [6]. However, almost no difference is observed for stainless steel, which is in full accordance with the results of this study [6]. It is assumed that for green laser wavelengths more of the laser energy is deposited to deeper areas at the bottom of the vapor capillary, compared to IR. However, so far, no further explanation has been given for the origin of these changes. Here, we made a first step towards understanding these differences in behavior of the vapor capillary, but further studies are necessary to investigate this in more detail.
Regarding laser-beam drilling with short laser pulses, a situation similar to deep-penetration welding is expected. The common influence of multiple reflections will lead to similar changes of the shape of the borehole, as observed for the cross-sections of deep-penetration welding. Due to the high intensities that are used, plasma formation sets in rapidly, and correspondingly, the pulse intensity reaching the surface of the work piece decreases drastically [97,98]. Therefore, assuming overall similar absorptivities, high absorptivity values for solid material with negative temperature dependence are expected to be more beneficial for the overall heat input and ablation efficiency than low absorptivities with positive temperature dependence. Further in-depth investigations are needed to analyze this behavior more profoundly.

Author Contributions

Conceptualization, S.K. and M.S.; methodology, S.K.; software, S.K.; validation, S.K. and F.K.; formal analysis, S.K.; investigation, S.K.; resources, S.K. and M.S.; data curation, S.K.; writing—original draft preparation, S.K.; writing—review and editing, S.K., F.K. and M.S.; visualization, S.K.; supervision, M.S.; project administration, S.K. and M.S.; funding acquisition, S.K and M.S. All authors have read and agreed to the published version of the manuscript.

Funding

The authors acknowledge financial support by the German National Science Foundation (DFG) within the project 407703212.

Institutional Review Board Statement

Not applicable.

Informed Consent Statement

Not applicable.

Data Availability Statement

The research data are available from the corresponding author upon reasonable request.

Acknowledgments

The authors acknowledge the support of the Erlangen Graduate School in Advanced Optical Technologies (SAOT). The authors would like to thank TRUMPF GmbH for their support, especially for providing the beam source at the green wavelength. The authors would like to thank Eric Eschner and Florian Klämpfl for their support with the experiments, and Michael Rasch and Florian Huber for their support with the metallographic analyses.

Conflicts of Interest

The authors declare no conflict of interest. The funders had no role in the design of the study; in the collection, analyses, or interpretation of data; in the writing of the manuscript, or in the decision to publish the results.

References

  1. Hügel, H.; Graf, T. Laser in der Fertigung: Grundlagen der Strahlquellen, Systeme, Fertigungsverfahren; Springer: Wiesbaden, Germany, 2014; ISBN 3834818178. [Google Scholar]
  2. Schmidt, M.; Zäh, M.; Li, L.; Duflou, J.; Overmeyer, L.; Vollertsen, F. Advances in macro-scale laser processing. CIRP Ann.-Manuf. Technol. 2018, 67, 719–742. [Google Scholar] [CrossRef]
  3. Kaplan, A.F. Fresnel absorption of 1μm- and 10μm-laser beams at the keyhole wall during laser beam welding: Comparison between smooth and wavy surfaces. Appl. Surf. Sci. 2012, 258, 3354–3363. [Google Scholar] [CrossRef]
  4. Hess, A.; Weber, R.; Heider, A.; Graf, T. Forced deep-penetration welding with low-power second-harmonic assistance of cw copper welding with 1 μm wavelength. Phys. Procedia 2010, 5, 29–36. [Google Scholar] [CrossRef] [Green Version]
  5. Haubold, M.; Ganser, A.; Eder, T.; Zäh, M.F. Laser welding of copper using a high power disc laser at green wavelength. Procedia CIRP 2018, 74, 446–449. [Google Scholar] [CrossRef]
  6. Engler, S.; Ramsayer, R.; Poprawe, R. Process Studies on Laser Welding of Copper with Brilliant Green and Infrared Lasers. Phys. Procedia 2011, 12, 339–346. [Google Scholar] [CrossRef]
  7. Poprawe, R. Lasertechnik für die Fertigung: Grundlagen, Perspektiven und Beispiele für den Innovativen Ingenieur; Springer: Berlin, Germany, 2005; ISBN 3540214062. [Google Scholar]
  8. Pricking, S.; Baumann, F.; Zaske, S.; Dold, E.; Kaiser, E.; Killi, A. Progress in green disk laser development for industrial high power applications. In Solid State Lasers XXX: Technology and Devices, Proceedings of the SPIE LASE 2021, Online Only, 6–12 March 2021; Clarkson, W.A., Shori, R.K., Eds.; SPIE: Bellingham, WA, USA, 2021; Volume 11664, ISBN 9781510641631. [Google Scholar]
  9. Kaiser, E.; Dold, E.-M.; Killi, A.; Zaske, S.; Pricking, S. Application benefits of welding copper with a 1 kW, 515 nm continuous wave laser. In Proceedings of the 10th CIRP Conference on Photonic Technologies LANE 2018, Fürth, Germany, 3–6 September 2018; Schmidt, M., Vollertsen, F., Dearden, G., Eds.; Bayerisches Laserzentrum GmbH: Erlangen, Germany, 2018. [Google Scholar]
  10. König, H.; Lell, A.; Ali, M.; Stojetz, B.; Eichler, C.; Peter, M.; Löffler, A.; Strauss, U.; Baumann, M.; Balck, A.; et al. Blue 450 nm high power semiconductor continuous wave laser bars exceeding rollover output power of 80 W. In High-Power Diode Laser Technology XVI, Proceedings of the SPIE LASE 2018, San Francisco, CA, USA, 27 January–1 February 2018; Zediker, M.S., Ed.; SPIE: Bellingham, WA, USA, 2018; Volume 10514, ISBN 978-1-510615-13-7. [Google Scholar]
  11. Baumann, M.; Balck, A.; Malchus, J.; Chacko, R.V.; Marfels, S.; Witte, U.; Dinakaran, D.; Ocylok, S.; Weinbach, M.; Bachert, C.; et al. 1000 W blue fiber-coupled diode-laser emitting at 450 nm. In High-Power Diode Laser Technology XVII, Proceedings of the SPIE LASE 2019, San Francisco, CA, USA, 2–7 February 2019; Zediker, M.S., Ed.; SPIE: Bellingham, WA, USA, 2019; Volume 10900, p. 3. ISBN 9781510624429. [Google Scholar]
  12. Zediker, M.S.; Fritz, R.D.; Finuf, M.J.; Pelaprat, J.M. Laser welding components for electric vehicles with a high-power blue laser system. J. Laser Appl. 2020, 32, 22038. [Google Scholar] [CrossRef]
  13. Zhang, X.; Miyagi, M.; Okamoto, S. Fundamental study on welding properties of 515 nm green laser. In Proceedings of the 33rd International Congress on Laser Materials Processing, Laser Microprocessing and Nanomanufacturing, San Diego, CA, USA, 19–23 October 2014; Laser Institute of America, Ed.; Laser Institute of America: Orlando, FL, USA, 2014; pp. 458–462, ISBN 978-1-940168-02-9. [Google Scholar]
  14. Engler, S. Laserstrahlschweißen von Kupferwerkstoffen Mit Brillanten Strahlquellen im Infraroten und Grünen Wellenlängenbereich. Ph.D. Thesis, RWTH Aachen, Aachen, Germany, 2015. [Google Scholar]
  15. Britten, S.W.; Schmid, L.; Molitor, T.; Rütering, M. Blue high-power laser sources for processing solutions in e-mobility and beyond. Procedia CIRP 2020, 94, 592–595. [Google Scholar] [CrossRef]
  16. Hagemann, H.-J.; Gudat, W.; Kunz, C. Optical Constants from the Far Infrared to the X-ray Region: Mg, Al, Cu, Ag, Au, Bi, C, and Al2O3. J. Opt. Soc. Am. 1975, 65, 742. [Google Scholar] [CrossRef]
  17. Otter, M. Optische Konstanten massiver Metalle. Z. Physik 1961, 161, 163–178. [Google Scholar] [CrossRef]
  18. Otter, M. Temperaturabhängigkeit der optischen Konstanten massiver Metalle. Z. Physik 1961, 161, 539–549. [Google Scholar] [CrossRef]
  19. Ehrenreich, H.; Philipp, H.R. Optical Properties of Ag and Cu. Phys. Rev. 1962, 128, 1622–1629. [Google Scholar] [CrossRef]
  20. Johnson, P.B.; Christy, R.W. Optical Constants of the Noble Metals. Phys. Rev. B 1972, 6, 4370–4379. [Google Scholar] [CrossRef]
  21. Comins, N.R. The optical properties of liquid metals. Philos. Mag. 1972, 25, 817–831. [Google Scholar] [CrossRef]
  22. Hodgson, J.N. Infra-red measurements of the optical constants of liquid silver. Philos. Mag. 1960, 5, 272–277. [Google Scholar] [CrossRef]
  23. Fujioka, Y.; Wada, T. Effect of Temperature upon the Reflectivity of Copper, Silver and Gold. Sci. Pap. Inst. Phys. Chem. Res. 1934, 25, 9–19. [Google Scholar]
  24. Beaglehole, D. Optical properties of copper and gold in the vacuum ultra-violet. Proc. Phys. Soc. 1965, 85, 1007–1020. [Google Scholar] [CrossRef]
  25. Hagemann, H.-J.; Gudat, W.; Kunz, C. Optical Constants from the Far Infrared to the X-ray Region: Mg, Al, Cu, Ag, Au, Bi, C, and Al2O3. DESY SR-74/4. 1974. Available online: https://refractiveindex.info/download/data/1974/Hagemann%201974%20-%20DESY%20report%20SR-74-7.pdf (accessed on 1 May 2022).
  26. Johnson, P.; Christy, R. Optical constants of transition metals: Ti, V, Cr, Mn, Fe, Co, Ni, and Pd. Phys. Rev. B 1974, 9, 5056–5070. [Google Scholar] [CrossRef]
  27. Spisz, E.W.; Weigand, A.J.; Bowman, R.L.; Jack, J.R. Solar Absorptances and Spectral Reflectances of 12 Metals for Temperatures Ranging from 300 to 500 K; NASA TN D-5353; National Aeronautics and Space Administration: Washington, DC, USA, 1969.
  28. Ordal, M.A.; Long, L.L.; Bell, R.J.; Bell, S.E.; Bell, R.R.; Alexander, R.W.; Ward, C.A. Optical properties of the metals Al, Co, Cu, Au, Fe, Pb, Ni, Pd, Pt, Ag, Ti, and W in the infrared and far infrared. Appl. Opt. 1983, 22, 1099. [Google Scholar] [CrossRef]
  29. Miller, J.C. Optical properties of liquid metals at high temperatures. Philos. Mag. 1969, 20, 1115–1132. [Google Scholar] [CrossRef]
  30. Ordal, M.A.; Bell, R.J.; Alexander, R.W.; Long, L.L.; Querry, M.R. Optical properties of fourteen metals in the infrared and far infrared: Al, Co, Cu, Au, Fe, Pb, Mo, Ni, Pd, Pt, Ag, Ti, V, and W. Appl. Opt. 1985, 24, 4493. [Google Scholar] [CrossRef]
  31. Lynch, D.W.; Hunter, W.R. Comments on the Optical Constants of Metals and an Introduction to the Data for Several Metals. In Handbook of Optical Constants of Solids I; Palik, E.D., Ed.; Academic Press: Cambridge, MA, USA, 1998; pp. 275–367. ISBN 0125444206. [Google Scholar]
  32. Babar, S.; Weaver, J.H. Optical constants of Cu, Ag, and Au revisited. Appl. Opt. 2015, 54, 477. [Google Scholar] [CrossRef]
  33. Dold, B.; Mecke, R. Optische Eigenschaften von Edelmetallen, Übergangsmetallen und deren Legierungen im Infrarot. Optik 1965, 22, 435–446. [Google Scholar]
  34. Shiles, E.; Sasaki, T.; Inokuti, M.; Smith, D.Y. Self-consistency and sum-rule tests in the Kramers-Kronig analysis of optical data: Applications to aluminum. Phys. Rev. B 1980, 22, 1612–1628. [Google Scholar] [CrossRef]
  35. Smith, D.Y.; Shiles, E.; Inokuti, M. The Optical Properties of Metallic Aluminum. In Handbook of Optical Constants of Solids I; Palik, E.D., Ed.; Academic Press: Cambridge, MA, USA, 1998; pp. 369–408. ISBN 0125444206. [Google Scholar]
  36. Mathewson, A.G.; Myers, H.P. Optical absorption in aluminium and the effect of temperature. J. Phys. F Met. Phys. 1972, 2, 403–415. [Google Scholar] [CrossRef]
  37. Kalenskii, A.V.; Zvekov, A.A. Temperature dependences of the optical properties of aluminum nanoparticles. Tech. Phys. Lett. 2017, 43, 535–538. [Google Scholar] [CrossRef]
  38. Liljenvall, H.G.; Mathewson, A.G.; Myers, H.P. The temperature dependence of the optical constants of aluminium. Solid State Commun. 1971, 9, 169–170. [Google Scholar] [CrossRef]
  39. Krishnan, S.; Nordine, P.C. Optical properties of liquid aluminum in the energy range 1.2–3.5 eV. Phys. Rev. B 1993, 47, 11780–11787. [Google Scholar] [CrossRef]
  40. Krishnan, S.; Nordine, P.C. Analysis of the optical properties of liquid aluminum. Phys. Rev. B 1993, 48, 4130–4131. [Google Scholar] [CrossRef]
  41. Benedict, L.X.; Klepeis, J.E.; Streitz, F.H. Calculation of optical absorption in Al across the solid-to-liquid transition. Phys. Rev. B 2005, 71, 16. [Google Scholar] [CrossRef]
  42. Havstad, M.A.; McLean, W.; Self, S.A. Apparatus for the measurement of the optical constants and thermal radiative properties of pure liquid metals from 0.4 to 10 μm. Rev. Sci. Instrum. 1993, 64, 1971–1978. [Google Scholar] [CrossRef]
  43. Dausinger, F. Strahlwerkzeug Laser: Energieeinkopplung und Prozesseffektivität; Teubner: Stuttgart, Germany, 1995; ISBN 3-519-06217-8. [Google Scholar]
  44. Akashev, L.A.; Kononenko, V.I. Optical Properties of Liquid Aluminum and Al-Ce Alloy. High Temp. 2001, 39, 384–387. [Google Scholar] [CrossRef]
  45. Hüttner, B. Optical properties of polyvalent metals in the solid and liquid state: Aluminium. J. Phys. Condens. Matter 1994, 6, 2459–2474. [Google Scholar] [CrossRef]
  46. Schulz, L.G.; Tangherlini, F.R. Optical Constants of Silver, Gold, Copper, and Aluminum. II. The Index of Refraction n. J. Opt. Soc. Am. 1954, 44, 362. [Google Scholar] [CrossRef]
  47. Krishnan, S.; Yugawa, K.J.; Nordine, P.C. Optical properties of liquid nickel and iron. Phys. Rev. B 1997, 55, 8201–8206. [Google Scholar] [CrossRef]
  48. Weaver, J.H.; Colavita, E.; Lynch, D.W.; Rosei, R. Low-energy interband absorption in bcc Fe and hcp Co. Phys. Rev. B 1979, 19, 3850–3856. [Google Scholar] [CrossRef] [Green Version]
  49. Shvarev, K.M.; Gushchin, V.S.; Baum, B.A. Effect of Temperature on the Optical Properties of Iron. High Temp. 1978, 16, 441–446. [Google Scholar]
  50. Seban, R.A. The Emissivity of Transition Metals in the Infrared. J. Heat Transf. 1965, 87, 173. [Google Scholar] [CrossRef]
  51. Gushchin, V.S.; Shvarev, K.M.; Baum, B.A.; Gel’d, P.V. Influence of composition on optical properties and electronic characteristics of Fe-Ni alloys at high temperatures. Sov. Phys. J. 1978, 21, 882–885. [Google Scholar] [CrossRef]
  52. Weaver, J.H.; Krafka, C.; Lynch, D.W.; Koch, E.E. Optical Properties of Metals, Pt. 1: The Transition Metals; Fachinformationszentrum Energie, Physik, Mathematik: Karlsruhe, Germany, 1981. [Google Scholar]
  53. Moravec, T.J.; Rife, J.C.; Dexter, R.N. Optical constants of nickel, iron, and nickel-iron alloys in the vacuum ultraviolet. Phys. Rev. B 1976, 13, 3297–3306. [Google Scholar] [CrossRef]
  54. Lynch, D.W.; Hunter, W.R. An Introduction to the Data for Several Metals. In Handbook of Optical Constants of Solids II.; Palik, E.D., Ed.; Academic Press: San Diego, CA, USA, 1998; pp. 341–420. ISBN 0-12-544422-2. [Google Scholar]
  55. Weaver, J.H.; Krafka, C.; Lynch, D.W.; Koch, E.E. Optical Properties of Metals. Pt. 2: Noble Metals, Aluminium, Scandium, Yttrium, the Nalthanides and the Actinides (0.1 Hv 500 ev); Fachinformationszentrum Energie, Physik, Mathematik: Karlsruhe, Germany, 1981. [Google Scholar]
  56. Bennett, H.E.; Silver, M.; Ashley, E.J. Infrared Reflectance of Aluminum Evaporated in Ultra-High Vacuum. J. Opt. Soc. Am. 1963, 53, 1089. [Google Scholar] [CrossRef]
  57. Endriz, J.G.; Spicer, W.E. Study of Aluminum Films. I. Optical Studies of Reflectance Drops and Surface Oscillations on Controlled-Roughness Films. Phys. Rev. B 1971, 4, 4144–4159. [Google Scholar] [CrossRef]
  58. Shvarev, K.M.; Gushchin, V.S.; Baum, B.A.; Gel’d, V.P. Optical Constants of Iron Alloys with Carbon in the Temperature Interval 20–1600 °C. High Temp. 1979, 17, 57–61. [Google Scholar]
  59. DIN Deutsches Institut für Normung e., V. Grundlagen der Meßtechnik b—Teil 3: Auswertung von Messungen Einer Einzelnen Meßgröße, Meßunsicherheit; Beuth Verlag GmbH: Berlin, Germany, 1996; (DIN 1319-3:1996-05). [Google Scholar]
  60. Rakić, A.D.; Djurišić, A.B.; Elazar, J.M.; Majewski, M.L. Optical properties of metallic films for vertical-cavity optoelectronic devices. Appl. Opt. 1998, 37, 5271. [Google Scholar] [CrossRef] [PubMed]
  61. Dausinger, F.; Shen, J. Energy Coupling Efficiency in Laser Surface Treatment. ISIJ Int. 1993, 33, 925–933. [Google Scholar] [CrossRef] [Green Version]
  62. Gámez, B.; Ocaña, J.L. A theoretical method for the calculation of frequency- and temperature-dependent interaction constants applicable to the predictive assessment of laser materials processing. J. Phys. D Appl. Phys. 2000, 33, 305–312. [Google Scholar] [CrossRef]
  63. Decker, D.L.; Hodgkin, V.A. Wavelength and Temperature Dependence of the Absolute Reflectance of Metals at Visible and Infrared Wavelengths. In Laser Induced Damage in Optical Materials 1980, Proceedings of the Twelfth Symposium on Optical Materials for High Power Lasers, Boulder, CO, USA, 30 September–1 October 1980; Bennett, H.E., Ed.; American Society for Testing & Materials: West Conshohocken, PA, USA, 1981; pp. 190–200. ISBN 978-0-8031-4500-9. [Google Scholar]
  64. Minissale, M.; Pardanaud, C.; Bisson, R.; Gallais, L. The temperature dependence of optical properties of tungsten in the visible and near-infrared domains: An experimental and theoretical study. J. Phys. D Appl. Phys. 2017, 50, 455601. [Google Scholar] [CrossRef] [Green Version]
  65. Arnold, G.S. Absorptivity of several metals at 10.6 μm: Empirical expressions for the temperature dependence computed from Drude theory. Appl. Opt. 1984, 23, 1434. [Google Scholar] [CrossRef] [PubMed]
  66. Schillé, J.-P.; Guo, Z.; Saunders, N.; Miodownik, A.P. Modeling Phase Transformations and Material Properties Critical to Processing Simulation of Steels. Mater. Manuf. Processes 2011, 26, 137–143. [Google Scholar] [CrossRef]
  67. Hirano, K.; Fabbro, R.; Muller, M. Experimental determination of temperature threshold for melt surface deformation during laser interaction on iron at atmospheric pressure. J. Phys. D Appl. Phys. 2011, 44, 435402. [Google Scholar] [CrossRef] [Green Version]
  68. Kawahito, Y.; Matsumoto, N.; Abe, Y.; Katayama, S. Laser absorption characteristics in high-power fibre laser welding of stainless steel. Weld. Int. 2013, 27, 129–135. [Google Scholar] [CrossRef]
  69. Segall, B. Fermi Surface and Energy Bands of Copper. Phys. Rev. 1962, 125, 109–122. [Google Scholar] [CrossRef]
  70. Graf, T.; Berger, P.; Weber, R.; Hügel, H.; Heider, A.; Stritt, P. Analytical expressions for the threshold of deep-penetration laser welding. Laser Phys. Lett. 2015, 12, 56002. [Google Scholar] [CrossRef]
  71. Arata, Y.; Maruo, H.; Miyamoto, I. Application of Laser Material Processing—Heat Flow in Laser Hardening; IIW Doc. IV-241-78, IIW Doc. 212-436-78; International Inst. of Welding: Genoa, Italy, 1978. [Google Scholar]
  72. Price, D.J. The temperature variation of the emissivity of metals in the near infra-red. Proc. Phys. Soc. 1947, 59, 131–138. [Google Scholar] [CrossRef]
  73. Ronchi, C.; Hiernaut, J.P.; Hyland, G.J. Emissivity X Points in Solid and Liquid Refractory Transition Metals. Metrologia 1992, 29, 261–271. [Google Scholar] [CrossRef]
  74. Cagran, C.; Pottlacher, G.; Rink, M.; Bauer, W. Spectral Emissivities and Emissivity X-Points of Pure Molybdenum and Tungsten. Int. J. Thermophys 2005, 26, 1001–1015. [Google Scholar] [CrossRef]
  75. Rosei, R.; Lynch, D.W. Thermomodulation Spectra of Al, Au, and Cu. Phys. Rev. B 1972, 5, 3883–3894. [Google Scholar] [CrossRef] [Green Version]
  76. Stubbs, C.M.; Prideaux, E.B.R. A Spectro-Photometric Comparison of the Emissivity of Solid and Liquid Gold at High Temperatures with that of a Full Radiator. Proc. R. Soc. A Math. Phys. Eng. Sci. 1912, 87, 451–465. [Google Scholar] [CrossRef]
  77. Lund, H.; Ward, L. The Spectral Emissivities of Iron, Nickel and Cobalt. Proc. Phys. Soc. B 1952, 65, 535–540. [Google Scholar] [CrossRef]
  78. Bergström, D. The Absorption of Laser Light by Rough Metal Surfaces. Ph.D. Thesis, Luleå University of Technology, Luleå, Sweden, 2008. [Google Scholar]
  79. Hummel, M.; Schöler, C.; Gillner, A. Metallographic Comparison for Laser Welding of Cu-ETP and CuSn6 with Laser Beam Sources of 515 nm and 1030 nm Wavelength. In Enhanced Material, Parts Optimization and Process Intensification; Reisgen, U., Drummer, D., Marschall, H., Eds.; Springer International Publishing: Cham, Switzerland, 2021; pp. 14–28. ISBN 978-3-030-70331-8. [Google Scholar]
  80. Schöler, C.; Nießen, M.; Schulz, W. Numerical Investigation of Keyhole Depth Formation in Micro Welding of Copper with 1030 nm and 515 nm Laser Radiation. In Enhanced Material, Parts Optimization and Process Intensification; Reisgen, U., Drummer, D., Marschall, H., Eds.; Springer International Publishing: Cham, Switzerland, 2021; pp. 29–39. ISBN 978-3-030-70331-8. [Google Scholar]
  81. Schöler, C.; Nießen, M.; Hummel, M.; Olowinsky, A.; Gillner, A.; Schulz, W. Modeling and simulation of laser micro welding. In Proceedings of the Lasers in Manufacturing Conference 2019, Munich, Germany, 24–27 June 2019; Reisgen, U., Schmidt, M., Zäh, M.F., Rethmeier, M., Eds.; German Scientific Laser Society (WLT e.V.): Munich, Germany, 2019. [Google Scholar]
  82. Mann, V.; Hugger, F.; Roth, S.; Schmidt, M. Influence of Temperature and Wavelength on Optical Behavior of Copper Alloys. AMM 2014, 655, 89–94. [Google Scholar] [CrossRef]
  83. Hess, A.; Heider, A.; Schuster, R.; Weber, R.; Graf, T. Benefits from combining laser beams with different wavelengths (green and IR) for copper welding. In Proceedings of the 29th International Congress on Applications of Lasers & Electro-Optics (ICALEO), Anaheim, CA, USA, 26–30 September 2010; Laser Institute of America, Ed.; Laser Institute of America: Orlando, FL, USA, 2010; pp. 540–546, ISBN 978-0-912035-61-1. [Google Scholar]
  84. Blom, A.; Dunias, P.; van Engen, P.; Hoving, W.; de Kramer, J. Process spread reduction of laser microspot welding of thin copper parts using real-time control. In Photon Processing in Microelectronics and Photonics II, Proceedings of the High-Power Lasers and Applications, San Jose, CA, USA, 25 January 2003; Pique, A., Sugioka, K., Herman, P.R., Fieret, J., Bachmann, F.G., Dubowski, J.J., Hoving, W., Washio, K., Geohegan, D.B., Traeger, F., et al., Eds.; SPIE: Bellingham, WA, USA, 2003; p. 493. [Google Scholar]
  85. Amorosi, S. Laser micro-spot welding of copper by real-time process monitoring. Ph.D. Thesis, École polytechnique fédérale de Lausanne, Lausanne, Switzerland, 2004. [Google Scholar]
  86. Hummel, M.; Külkens, M.; Schöler, C.; Schulz, W.; Gillner, A. In situ X-ray tomography investigations on laser welding of copper with 515 and 1030 nm laser beam sources. J. Manuf. Processes 2021, 67, 170–176. [Google Scholar] [CrossRef]
  87. Kaiser, E.; Huber, R.; Stolzenburg, C.; Killi, A. Sputter-free and Uniform Laser Welding of Electric or Electronical Copper Contacts with a Green Laser. In Proceedings of the 8th International Conference on Photonic Technologies LANE 2014, Fürth, Germany, 8–11 September 2014; Schmidt, M., Vollertsen, F., Merklein, M., Eds.; Bayerisches Laserzentrum GmbH: Erlangen, Germany, 2014. [Google Scholar]
  88. Ramsayer, R.M.; Engler, S.; Schmitz, G. New approaches for highly productive laser welding of copper materials. In Proceedings of the 1st International Electric Drives Production Conference (EDPC), Nürnberg, Germany, 28–29 September 2011; Institute of Electrical and Electronics Engineers, IEEE: Piscataway, NJ, USA, 2011; pp. 69–73, ISBN 978-1-4577-1370-5. [Google Scholar]
  89. Dold, E.-M.; Kaiser, E.; Klausmann, K.; Pricking, S.; Zaske, S.; Brockmann, R. High-performance welding of copper with green multi-kW continuous wave disk lasers. In High-Power Laser Materials Processing: Applications, Diagnostics, and Systems VIII, Proceedings of the SPIE 2019, San Francisco, CA, USA, 2–7 February 2019; Kaierle, S., Heinemann, S.W., Eds.; SPIE: Bellingham, WA, USA, 2019; Volume 10911, p. 28. ISBN 9781510624641. [Google Scholar]
  90. Ly, S.; Rubenchik, A.M.; Khairallah, S.A.; Guss, G.; Matthews, M.J. Metal vapor micro-jet controls material redistribution in laser powder bed fusion additive manufacturing. Sci. Rep. 2017, 7, 4085. [Google Scholar] [CrossRef] [PubMed]
  91. Khairallah, S.A.; Anderson, A.T.; Rubenchik, A.; King, W.E. Laser powder-bed fusion additive manufacturing: Physics of complex melt flow and formation mechanisms of pores, spatter, and denudation zones. Acta Mater. 2016, 108, 36–45. [Google Scholar] [CrossRef] [Green Version]
  92. Leung, C.L.A.; Marussi, S.; Towrie, M.; del Val Garcia, J.; Atwood, R.C.; Bodey, A.J.; Jones, J.R.; Withers, P.J.; Lee, P.D. Laser-matter interactions in additive manufacturing of stainless steel SS316L and 13-93 bioactive glass revealed by in situ X-ray imaging. Addit. Manuf. 2018, 24, 647–657. [Google Scholar] [CrossRef]
  93. Matthews, M.J.; Guss, G.; Khairallah, S.A.; Rubenchik, A.M.; Depond, P.J.; King, W.E. Denudation of metal powder layers in laser powder bed fusion processes. Acta Mater. 2016, 114, 33–42. [Google Scholar] [CrossRef] [Green Version]
  94. Bidare, P.; Bitharas, I.; Ward, R.M.; Attallah, M.M.; Moore, A.J. Fluid and particle dynamics in laser powder bed fusion. Acta Mater. 2018, 142, 107–120. [Google Scholar] [CrossRef]
  95. Finuf, M.; Fritz, R.; Boese, E.; Zediker, M. Metal 3d printing using high brightness blue laser systems. In High-Power Diode Laser Technology XX, Proceedings of the SPIE LASE 2022, San Francisco, CA, USA, 22–27 January 2022; Zediker, M.S., Zucker, E.P., Eds.; SPIE: Bellingham, WA, USA, 2022; Volume 11983, p. 30. ISBN 9781510648371. [Google Scholar]
  96. Wagenblast, P.; Myrell, A.; Thielmann, M.; Scherbaum, T.; Coupek, D. Additive manufacturing with green disk lasers. In Laser 3D Manufacturing VII, Proceedings of the SPIE LASE 2020, San Francisco, CA, USA, 1–6 February 2020; Helvajian, H., Gu, B., Chen, H., Eds.; SPIE: Bellingham, WA, USA, 2020; Volume 11271, p. 18. ISBN 9781510633056. [Google Scholar]
  97. Hussein, A.E.; Diwakar, P.K.; Harilal, S.S.; Hassanein, A. The role of laser wavelength on plasma generation and expansion of ablation plumes in air. J. Appl. Phys. 2013, 113, 143305. [Google Scholar] [CrossRef]
  98. Weikert, M. Oberflächenstrukturieren Mit Ultrakurzen Laserpulsen; Herbert Utz Verlag: München, Germany, 2006; ISBN 3-8316-0573-4. [Google Scholar]
Figure 1. Schematic and photographic views of the used experimental setup: (a) schematic front view of the setup. The beam of the processing laser (visualized red) impinges on the specimen from the top. The welding process is monitored using a high-speed camera. To ensure sufficient illumination, an additional, defocused IR illumination laser (visualized blue) at λ = 808   nm is used. (b) Photograph of the experimental setup.
Metals 12 01118 g001
Figure 2. Absorptivity of solid (solid line) and liquid copper (dashed line) measured at room temperature and at 1873 K. The vertical blue, green and red lines indicate the wavelengths of commercial high-power blue, green and IR beam sources at 450   nm , 515   nm and 1030   nm , respectively, as a guide to the eye. The vertical black dash-dotted line indicates the X-point at ~ 575   nm . For the data of solid copper, the measurement accuracy is not explicitly given in the source.
Metals 12 01118 g002
Figure 3. Minimum (dashed line) and maximum (solid line) specific energy per unit mass of copper for heat-conduction welding of copper calculated with Equations (1) and (2). The specific energies increase with wavelength, due to the decreasing absorptivity values shown in Figure 2. The resulting theoretical process window is indicated by the gray area. The vertical blue, green and red lines indicate the wavelengths of commercial high-power blue, green and IR beam sources at 450   nm , 515   nm and 1030   nm , respectively, as a guide to the eye.
Metals 12 01118 g003
Figure 4. The process stability criterion (PSC), defined as the relative size of the theoretical process window Δ E rel ( λ ) for heat-conduction welding of copper. The vertical blue, green and red lines indicate the wavelengths of commercial blue, green and IR beam sources at 450   nm , 515   nm and 1030   nm , respectively, as a guide to the eye. The vertical black dotted line indicates the X-point at ~ 575   nm .
Metals 12 01118 g004
Figure 5. Absorptivity of iron (a) and aluminum (b) in the solid (solid lines) and liquid state (dashed lines). The vertical blue, green and red lines indicate the wavelengths of commercial blue, green and IR beam sources at 450   nm , 515   nm and 1030   nm , respectively, as a guide to the eye. The vertical black dotted lines indicate the X-points at ~ 1 . 55   µ m and ~ 950   nm . Please note the varying scaling. For the data of solid aluminum, the measurement accuracy is not explicitly given in the source.
Metals 12 01118 g005
Figure 6. Process stability criterion of iron (a) and aluminum (b). The vertical blue, green and red lines indicate the wavelengths of commercial blue, green and IR beam sources at 450   nm , 515   nm and 1030   nm , respectively, as a guide to the eye. The vertical black dotted lines indicate the X-points at ~ 1 . 55   µ m and ~ 950   nm . Please note the varying scaling.
Metals 12 01118 g006
Figure 7. Ratio of the process stability criterion (PSC) over the phase change ratio (PCR) for the experimentally investigated metals copper, iron and aluminum and the two beam sources in the green ( λ = 515   nm ) and IR ( λ = 1030   nm ) wavelength regime. The grey indicates the range of the mean value of the ratio and its standard deviation ( PSC PCR = 0 . 178   ±   0 . 024 ) .
Metals 12 01118 g007
Table 1. Heat-up time spans until melting and evaporation is reached for copper. The laser powers were chosen such that the spot welds featured equal mean welding depths.
Green   ( λ = 515   nm ) IR
( λ = 1030   nm )
Laser power969 W2986 W
Time span until the onset of melting0.03 ms ± 0.01 ms0.17 ms ± 0.03 ms
Time span until the onset of evaporation0.50 ms ± 0.03 ms1.27 ms ± 0.12 ms
Process stability criterion (PSC) value2.950.62
Table 2. Heat-up time spans until melting and evaporation is reached for iron and aluminum. The laser powers were chosen such that the spot welds featured equal mean-welding depths.
IronAluminum
Green
( λ = 515   nm )
IR
( λ = 1030   nm )
Green
( λ = 515   nm )
IR ( λ = 1030   nm )
Laser power360 W467 W1049 W1636 W
Time span until the onset of melting0.06 ms ± 0.01 ms 0.10 ms ± 0.01 ms0.02 ms ± 0.01 ms0.09 ms ± 0.01 ms
Time span until the onset of evaporation0.47 ms ± 0.07 ms 0.95 ms ± 0.02 ms0.74 ms ± 0.06 ms2.34 ms ± 0.28 ms
Process stability criterion (PSC) value1.301.285.883.39
Publisher’s Note: MDPI stays neutral with regard to jurisdictional claims in published maps and institutional affiliations.

