Article

Study of Thermodynamic for Low-Reactive CaO-BaO-Al2O3-SiO2-CaF2-Li2O Mold Flux Based on the Model of Ion and Molecular Coexistence Theory

College of Materials Science and Engineering, Chongqing University, Chongqing 400044, China
*
Authors to whom correspondence should be addressed.
Metals 2022, 12(7), 1099; https://doi.org/10.3390/met12071099
Submission received: 17 May 2022 / Revised: 20 June 2022 / Accepted: 23 June 2022 / Published: 27 June 2022
(This article belongs to the Special Issue Thermodynamics and Kinetics in Metallurgical Processes)

Abstract

:
A thermodynamic model was proposed to calculate the activity of components in low-reactive CaO-BaO-Al2O3-SiO2-CaF2-Li2O mold flux, which was chosen to improve the castability of high Al steel, based on the ion and molecular coexistence theory. The model was indirectly validated, and the effects of the mass ratio of Al2O3/SiO2, contents of CaF2 and Li2O on the reactivity of components were discussed. The results reveal that the reactivity of mold flux attenuated with the increase in the mass ratio of Al2O3/SiO2. The decrease in reactivity was insignificant as the mass ratio was over 3.5. The steel–slag reaction experiment confirmed that the reactivity of mold flux is weakened when the content of SiO2 below 8 wt%. The reactivity of mold flux increased nearly linearly with the increase in CaF2 content, indicating that the proportion of CaF2 should be kept to a minimum in the flux. In addition, the compositional regions involving around 6 wt% Li2O should be avoided to develop low-reactive mold flux.

Graphical Abstract

1. Introduction

Advanced high-strength steels with high content of aluminum have attracted much attention in the automobile industry owing to low density, high ductility, and strength for the sake of passenger safety and environmental friendliness [1,2,3]. However, aluminum in molten steel ([Al]) is prone to react with silicon dioxide in traditional CaO-SiO2-based mold flux ((SiO2)), resulting in sharply varied content of SiO2 and Al2O3. The compositional variation of the mold flux leads to an increase in melting temperature and viscosity, consequently deteriorating its performances, such as heat transfer and lubrication [4,5,6,7]. Therefore, it is essential to develop a specified mold flux having low reactivity with high-Mn, high-Al molten steel [8,9]. Taking the reaction between [Al] and (SiO2) for example:
4[Al] + 3(SiO2) → 2(Al2O3) + 3[Si]
Δ G = Δ G θ + R T ln a ( Al 2 O 3 ) 2 a [ Si ] 3 a ( SiO 2 ) 3 a [ Al ] 4
where Δ G , Δ G θ , R, T, ai are the reaction Gibbs free energy change, standard reaction Gibbs free energy change, gas constant (8.314 J/(mol·K)), temperature, and activity of component i, respectively. Thus, for a certain steel, the activities of various components in mold flux are crucial parameters to determine the extent of reaction at the steel–slag interface. Currently, the application of thermodynamic software is a preferred approach to predict the activities of components in mold flux. However, the thermodynamic software has limited scope because of the lack of some databases. In order to make up for the shortcomings of the thermodynamic software, the ion and molecular coexistence theory (IMCT) was proposed by Chuiko. N.M. in 1960s [10], which could predict the activity of each component of multi-component flux system. When using IMCT, the activity of each component in the flux can be expressed by the mass action concentration [10]. The accuracy to predict activities of components has been confirmed for flux melts, such as FeO-Fe2O3-SiO2 [10], CaO-SiO2-Al2O3-MgO [10], Na2O-SiO2 [10], NiO-MgO [11], CaO–Al2O3–Ce2O3 [12], and CaO-SiO2-Al2O3-FeO-CaF2-La2O3-Nb2O5-TiO2 [13]. Our previous studies [14] indicated that the flux system of CaO-BaO-Al2O3-SiO2-CaF2-Li2O as a low-reactive flux system is expected to be applied for continuous casting of high-Mn high-Al steel. To deeply understand during the contact of steel and flux, the obtainment of activity data in flux melts is urgent. In this study, a thermodynamic model is established to calculate the activity of the components in CaO-BaO-Al2O3-SiO2-CaF2-Li2O mold flux based on IMCT (Ion and molecular coexistence theory) at 1773 K. In addition, the steel–slag contact experiment was conducted to verify the accuracy of the prediction. The effects of mass ratio of Al2O3/SiO2 and content of CaF2 and Li2O were discussed.

2. Methodology

2.1. Structural Units and Mass Action Concentration

IMCT assumed that structural units of molten flux consisted of simple ions, simple and complex molecules. The simple ions participate in the formation of complex molecules in the form of ion couples, and each pair of cation and anion occupies one structural unit. For CaO-BaO-Al2O3-SiO2-CaF2-Li2O system, Ca2+, Ba2+, Li+, F, and O2− as simple ions, and SiO2 and Al2O3 as simple molecules existed. On the basis of ternary phase diagrams of CaO-SiO2-Al2O3, BaO-SiO2-Al2O3, CaO-Al2O3-CaF2, CaO-SiO2-CaF2, and Al2O3-SiO2-Li2O, and binary phase diagrams of CaO-SiO2, CaO-Al2O3, BaO-SiO2, BaO-Al2O3, Li2O-SiO2, and Li2O-Al2O3 [15,16,17], there are 33 major species of complex molecules that form within the temperature range of 1673–1823 K. The structural units and corresponding mole numbers are listed in Table 1. According to IMCT, free Me+/Me2+ and F/O2− remain independent, whereas ion couples (Me2+ + O2−) occupy two structural units and (2Me+ + O2−) or (Me2+ + 2F) occupy three structural units (where Me2+ refers to Ca2+ or Ba2+ and Me+ refers to Li+). For the flux with six kinds of components, the ion couples include (Ca2+ + O2−), (Ba2+ + O2−), (2Li+ + O2−), and (Ca2+ + 2F). Thus, the total mole number of structural units can be expressed as follows:
n i = 2 n CaO + 2 n BaO + n Al 2 O 3 + n SiO 2 + 3 n CaF 2 + 3 n Li 2 O + n 7 + + n 39
where ni is the mole number of structural units for product i.
The mass action concentration of the 39 items in Table 1 are denoted as N1, N2, N3, …, and N39, respectively. Ni is calculated using Equation (4):
N i = n i n i
As complex molecules are derived from simple ion couples and molecules by chemical reactions, the mass action concentration of the complex molecules can be expressed by their corresponding reaction equilibrium constant (Ki) and the values of N1, N2, N3, N4, N5, and N6. Ki can be obtained by:
K i = exp ( Δ G i θ R T )

2.2. Calculation of Standard Gibbs Free Energy for Complex Molecules

To calculate the standard Gibbs free energy change ( Δ G T θ ) for the formation of complex molecule by ion couples and simple molecules, the reactants and products are considered to be in dissolution state. For example, the formation of mMeO·nSiO2 proceeds by the following way:
m ( Me 2 + + O 2 ) + n ( SiO 2 ) ( m MeO · n SiO 2 )         Δ G solution θ
where m and n are positive integers and Δ G solution θ is the standard Gibbs free energy change in dissolution state. However, obtaining Δ G solution θ data under such condition is often difficult. In contrast, if the reaction occurs in solid state, as shown in Equation (7), the standard Gibbs free energy change, Δ G solid θ , is easier to acquire.
m ( Me 2 + + O 2 ) ( s ) + n ( SiO 2 ) ( s ) ( m MeO · n SiO 2 ) ( s )         Δ G solid θ
It is well known that the dissolution of a certain component into flux melts can be divided into two steps. The first step involves melting the component from solid to liquid state, Δ fus G i θ . The second step involves further dissolution into flux melts, Δ sol G i θ . The changes of the standard Gibbs free energy for the above steps are equal, that is Δ fus G i θ = Δ sol G i θ [18,19]. Therefore, the following relation can be obtained:
Δ G solution θ = Δ G solid θ + Δ fus G i θ + Δ sol G i θ = Δ G solid θ
Generally, Δ G T θ could be expressed a function of temperature [20] by:
Δ G T θ = Δ H 298 K θ T Δ Φ T
Δ H 298 K θ = ( n i Δ H i , 298 K θ ) product ( n j Δ H j , 298 K θ ) reactant
Δ Φ T = ( n i Φ i , T ) product ( n j Φ j , T ) reactant
where, nj is the stoichiometric number of reactant j; Δ H 298 K θ is the standard enthalpy change of reaction at 298 K; Δ Φ T is the standard Gibbs function change of reaction at T; Δ G T θ in the form of Δ G T θ = A + B T for these reactions are listed in Table 2.

2.3. Mass Action Concentration for Structural Units and Ion Couples

The initial mole contents of CaO, BaO, Al2O3, SiO2, CaF2, and Li2O are denoted as a1, a2, a3, a4, a5, and a6, respectively. Based on the principle of mass conservation:
a 1   =   ( 0.5 N 1   +   N 7   +   2 N 8   +   3 N 9   +   3 N 10   +   N 11   +   N 12   +   N 13   +   3 N 14   +   12 N 15   +   3 N 28   +   4 N 29   +   2 N 30   +   N 31   +   N 32   +   2 N 33   +   3 N 35   +   3 N 36   +   11 N 37 ) n i
a 2   =   ( 0.5 N 2   +   N 16   +   N 17   +   2 N 18   +   2 N 19   +   N 20   +   N 21   +   3 N 22   +   N 28 + 2 N 29   +   N 30   +   3 N 31   +   N 34 ) n i  
a 3   =   ( N 3   +   N 11   +   2 N 12   +   6 N 13   +   N 14   +   7 N 15   +   N 20   +   6 N 21   +   N 22   +   3 N 23   +   N 27   +   4 N 30   +   N 31   +   N 32   +   N 33   +   N 34   +   3 N 36   +   7 N 37   +   N 38   +   N 39 ) n i  
a 4   =   ( N 4   +   N 7   +   N 8   +   N 9   +   2 N 10   +   N 16   +   2 N 17   +   N 18   +   3 N 19   +   2 N 23   +   N 24   +   2 N 25   +   N 26   +   2 N 28   +   3 N 29   +   2 N 32   +   N 33   +   2 N 34   +   2 N 35   +   2 N 38   +   4 N 39 ) n i  
a 5   =   ( 1 / 3 N 5   +   N 35   +   N 36   +   N 37 ) n i  
a 6   =   ( 1 / 3 N 6   +   N 24   +   N 25   +   2 N 26   +   N 27   +   N 38   +   N 39 ) n i  
To solve Equations (12)–(17), Matlab software was subsequently used for further calculations, and the unique solutions of N1, N2, N3, N4, N5, and N6 were obtained. Thus, the activity calculation model for CaO-BaO-Al2O3-SiO2-CaF2-Li2O mold flux system could be developed.

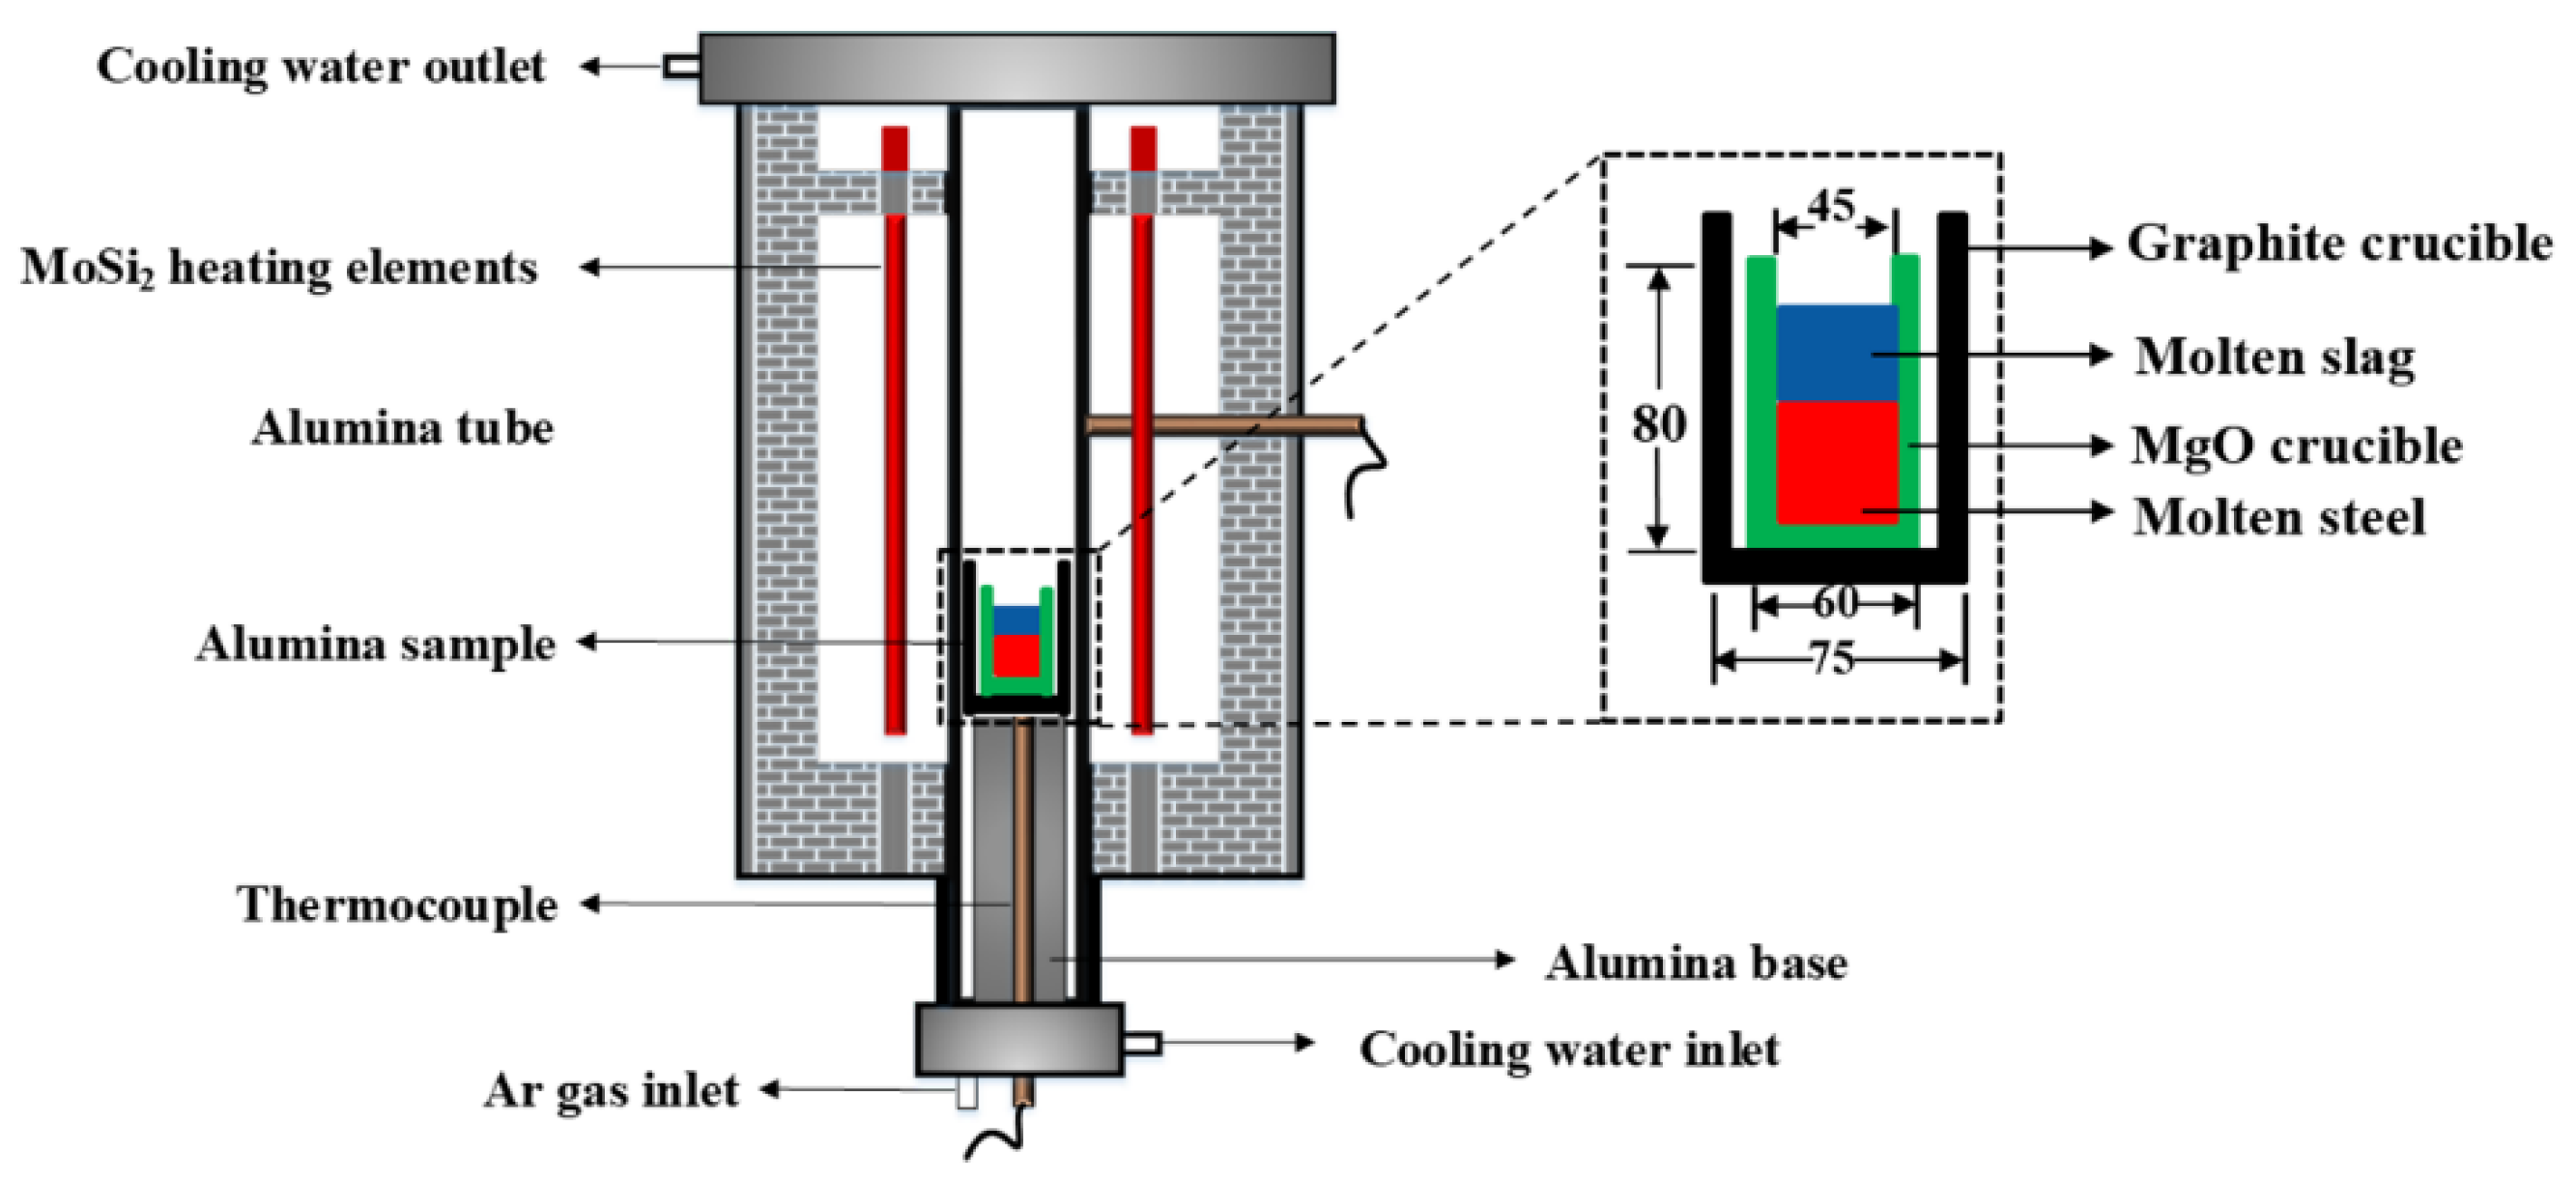
2.4. Steel–Slag Contact Experiment
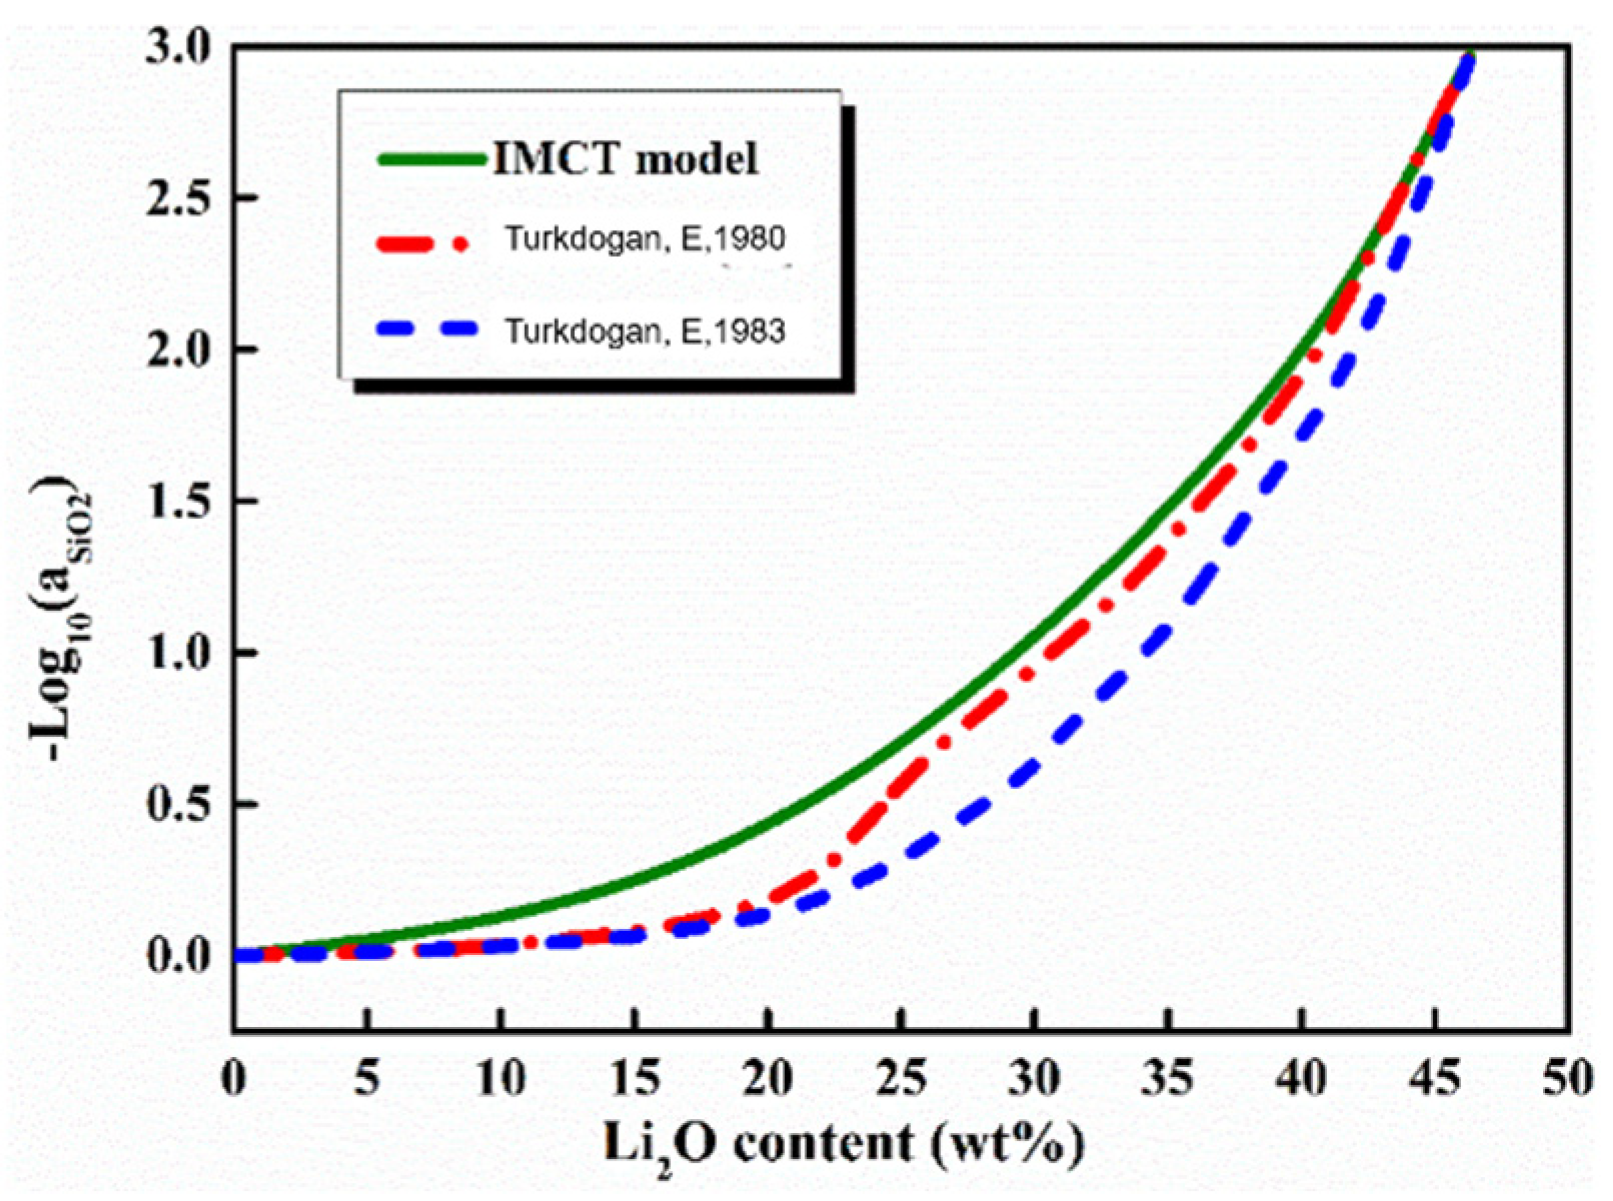
The schematic of the apparatus to conduct steel–slag contact experiment is shown in Figure 1. The compositions of mold flux and steel are listed in Table 3. Total content of Al2O3 and SiO2 in the flux is designed to be constant as 27 wt%. The content of Al in steel is 1.49 wt%, which belongs to grades of high-Mn, high-Al steels. Before the contact experiment, 80 g of each mold flux was prepared using chemically pure reagents, and pre-melted in a silica-molybdenum furnace at 1573 K for compositional homogeneity. After cooling, the mold flux was ground into fine powder. For each run, approximately 320 g of steel sample was placed in a MgO crucible and heated. Then, the molten steel was maintained isothermally at 1773 K for 20 min. Subsequently, 80 g of pre-melted flux was dispensed onto the top surface of the molten steel, at which moment was recorded as the start time of steel–slag reaction. To avoid the effect of oxygen, the contact experiments were conducted under Ar atmosphere at a flow rate of 1 L/min. After the reaction time reached 12 min, the MgO crucible with molten steel and flux was taken out and cooled at room temperature. The compositions of mold flux before and after contact experiment were analyzed by the methods of ICP-OES (ICAP 6300 Duo made by Thermo Scientific IRIS Intrepid II, MA, USA) and XRF (ARL Perform X made by Thermo Fisher).

3. Model Validation

To validate the accuracy of established model to predict the activity of various components in flux melts, the comparisons between the prediction by the current study and the calculation by Factsage and the literature [17,25,26,27,28] were made on the activity of the reactive component, SiO2. The flux melts were CaO-Al2O3-SiO2-CaF2, CaO-BaO-Al2O3-SiO2, and Li2O-SiO2, respectively. It should be noted that the accuracy of the current model was indirectly validated, and all components in Table 3 were taken into consideration. At present, Factsage is a popular thermodynamic software to calculate the activity for simple flux systems with 2–4 components. However, as the data of BaO and CaF2 belong to two separate databases, the activities of the components in the CaO-Al2O3-SiO2-CaF2 and CaO -Al2O3-SiO2-BaO systems were validated, respectively. Rey [27] and Charles [28] have obtained the activity data of SiO2 in Li2O-SiO2 binary system with the SRS model (sub-regular solution model).

CaO-Al2O3-SiO2-BaO and CaO-Al2O3-SiO2-CaF2

Table 4 summarizes the compositions of the CaO-Al2O3-SiO2-BaO and the CaO-Al2O3-SiO2-CaF2 quaternary flux systems and the corresponding activity of SiO2. The deviation (ΔX) for the difference between IMCT model and Factsage was calculated by Equation (18), 0.5% to 24.2% for CaO-Al2O3-SiO2-BaO melt, and 0.2% to 11.0% for CaO-Al2O3-SiO2-CaF2 melt. The close agreement indicates that the IMCT model is reliable for quaternary flux system.
Δ X = | k i , c a l k i , f i t | | k i , f i t | × 100 %
where N represents the number of the samples; ki,cal is the value calculated from Factsage; ki,fit is the fitted value derived from the relationship between calculated values of Factsage and IMCT model.
Due to the lack of measured activities for Li2O-SiO2 binary system, the calculated activity of (SiO2) by the IMCT model was compared with those estimated by SRS model [27,28], as shown in Figure 2. When the Li2O content was below 20 wt%, the values of SiO2 activity predicted by SRS model were slightly higher than those predicted by the current study. When the Li2O content was higher than 25%, the values of SiO2 activity predicted by the IMCT model agreed more closely with those predicted by Ref. [27]. The comparison in Figure 2 indicated that the IMCT model has acceptable credibility to predict the SiO2 activity in melts containing Li2O.
In summary, the reliability of the established thermodynamic model based on IMCT was indirectly confirmed by separately validating three flux systems that contained all six interested components in Table 3.

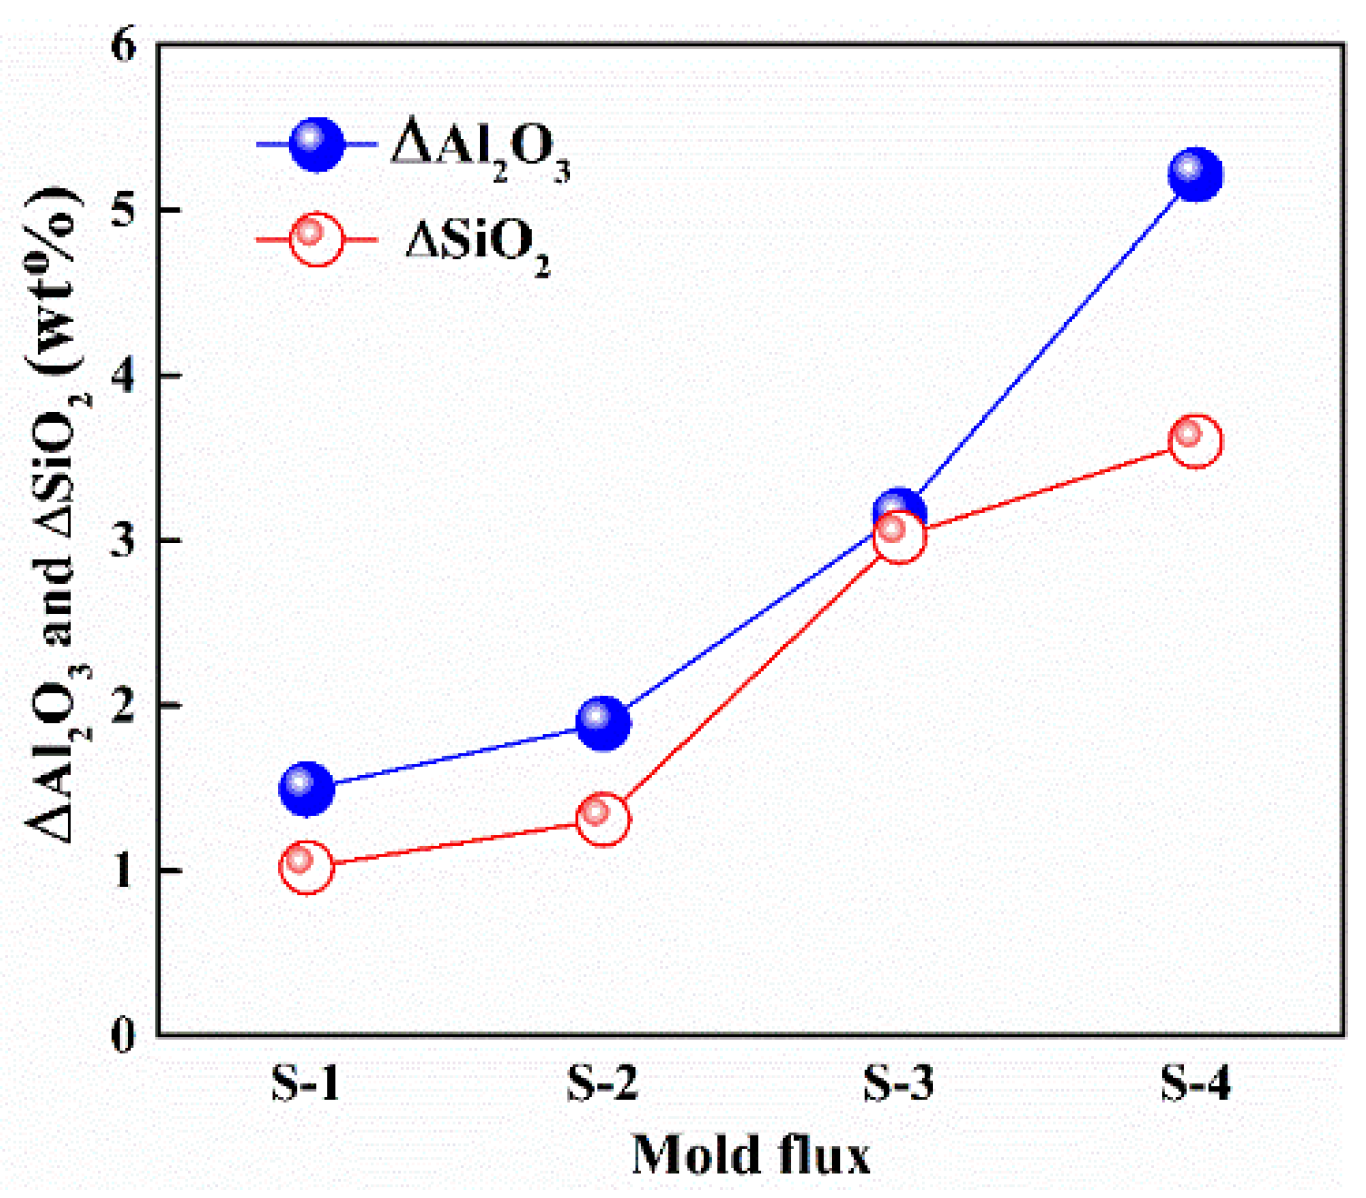
4. Contact Experiment of Steel-Slag Reaction

The compositions of mold fluxes before and after the contact experiment are listed in Table 5. It is clearly shown that as the initial content of SiO2 increased from 6.07% to 12.18%, the reduced content of SiO2 after the contact experiment also increased from 1.02% to 3.60%. Because high content of SiO2 favors the reaction between [Al] and (SiO2) at the steel–slag interface, the oxidized Al2O3 dissolves into flux and the reduced Si enters into the steel pool. As the duration time of 12 min was short, the content of typical volatile components (Li2O and F) attenuated slightly (less than 1%). The detection of MgO was caused by the erosion of MgO crucible at a high temperature. Figure 3 shows the variation of SiO2 and Al2O3 in the mold flux before and after contact experiments. When the content of SiO2 in mold flux was no more than 8%, the increment of Al2O3 (ΔAl2O3) was approximately 7.1%, and the decrement of SiO2 (ΔSiO2) was approximately 16.8%. As soon as the content of SiO2 rose to 10% and even higher, ΔAl2O3 changed obviously from 18.4% to more than 34.2%, and ΔSiO2 reached 30%. The variation of ΔAl2O3 and ΔSiO2 indicated clearly that critical content of components may play a part in determining the extent of steel–slag reaction. Some references reported that the steel–slag reaction did not occur once the content of (SiO2) was less than 7 wt% [4] or in the range of 5–10 wt% [9] for conventional CaO-Al2O3-based flux.

5. Effect of Different Factors

Equation (1) can be expressed in the form of Equation (19):
Δ G = Δ G θ + R T ln a [ Si ] 3 a [ Al ] 4 + Δ G react θ
Δ G r e a c t θ = R T l n a ( A l 2 O 3 ) 2 a ( S i O 2 ) 3
where Δ G react θ denotes the Gibbs free energy change involving the activities of (SiO2) and (Al2O3) in mold flux, and is a parameter characterizing the reactivity of mold flux.

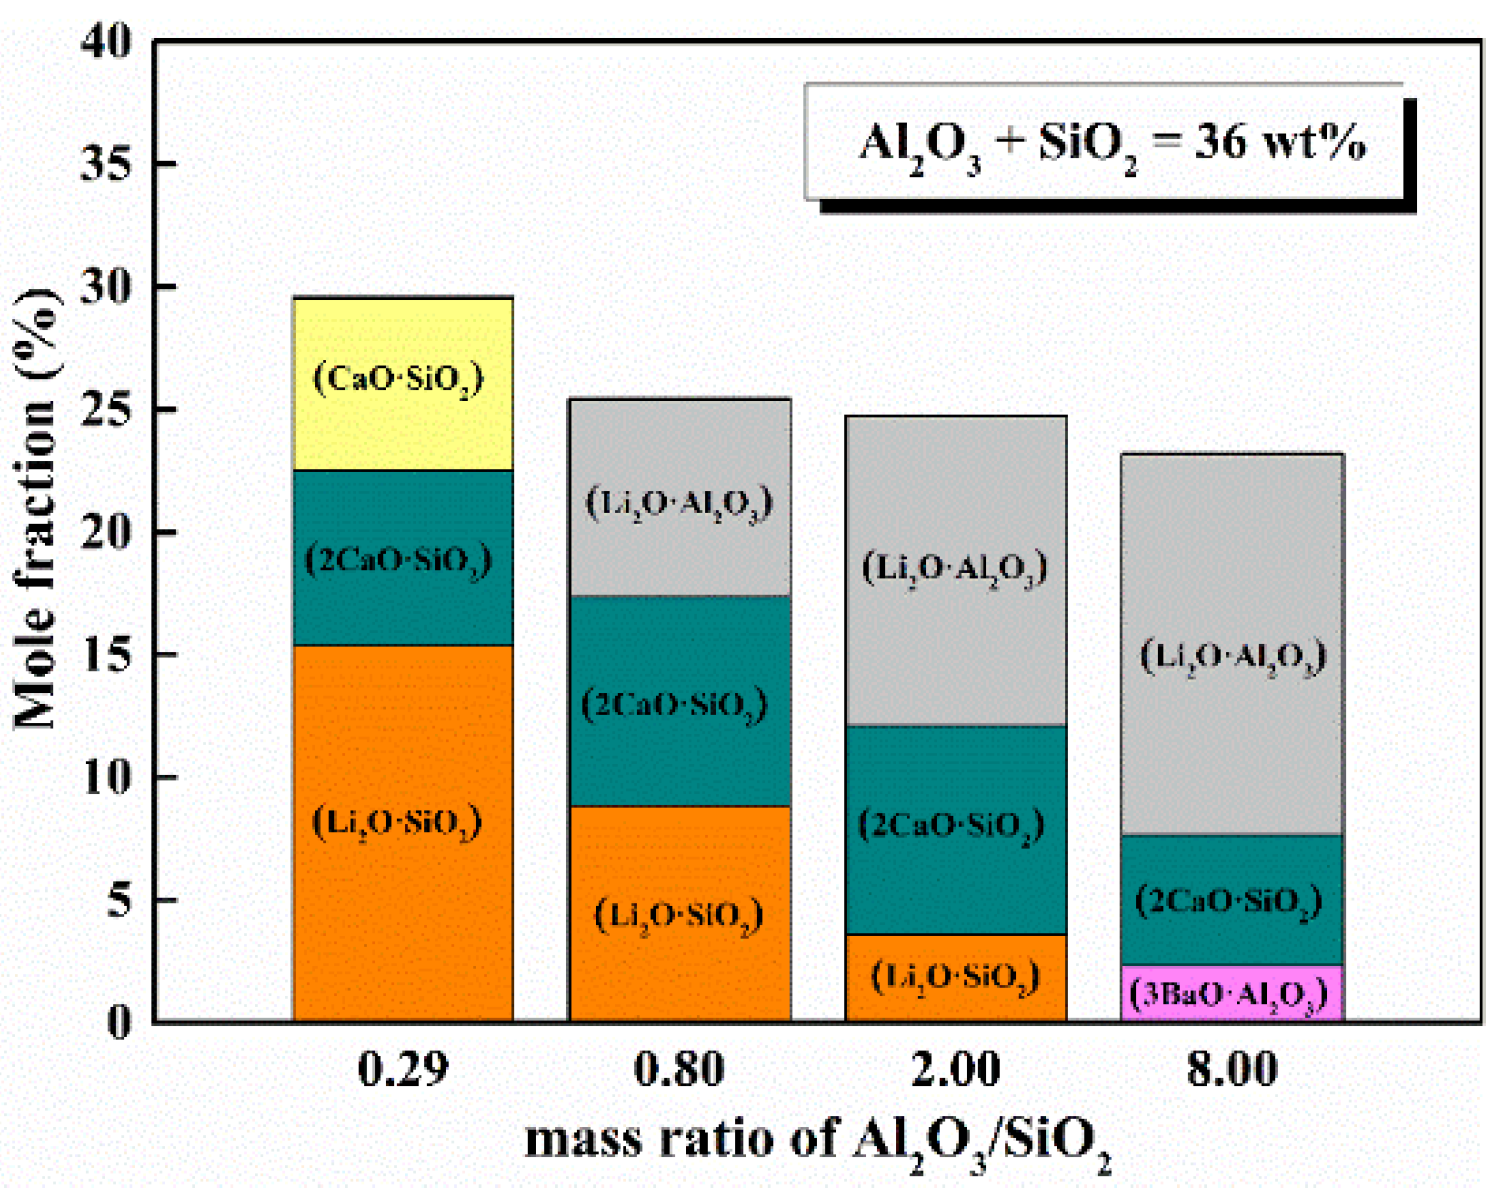
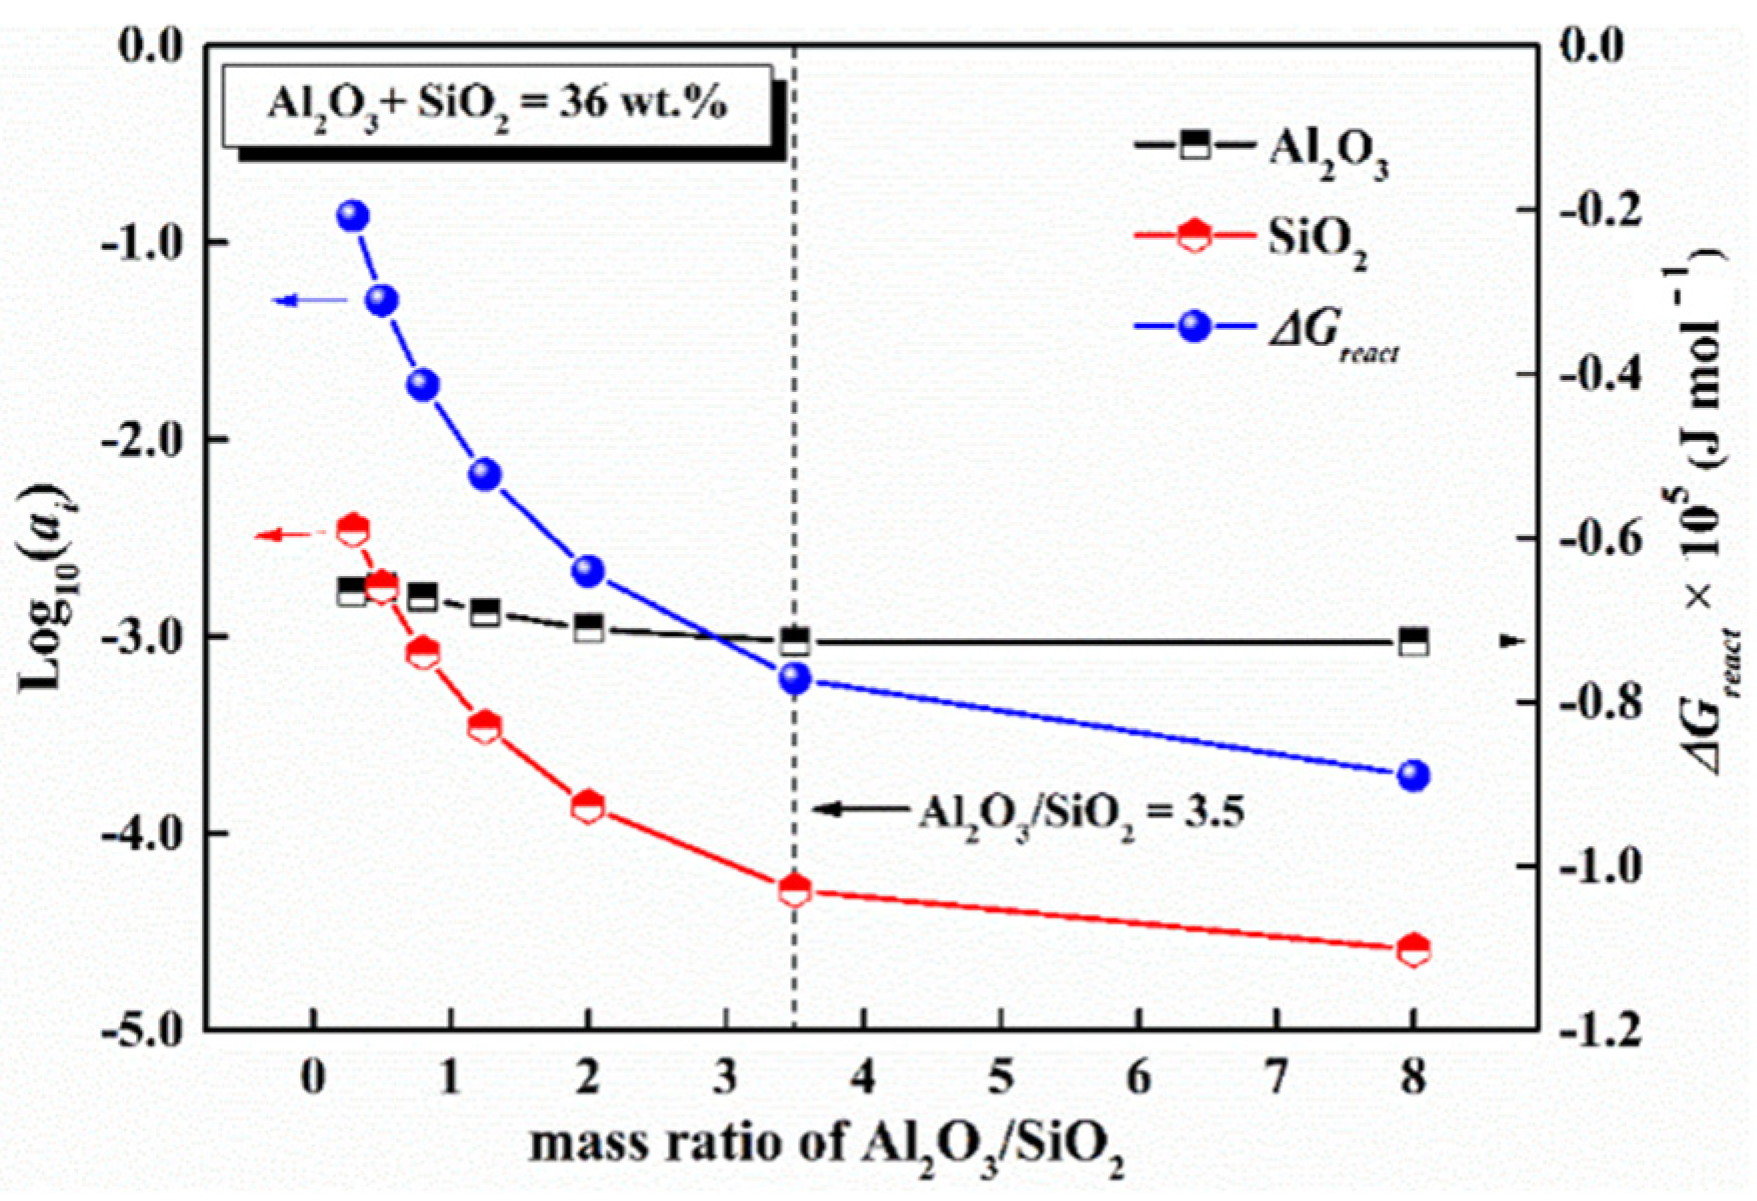
5.1. Mass Ratio of Al2O3/SiO2

When the CaO-SiO2-based flux is applied to cast high-Mn, high-Al steel, the content of (SiO2) decreases and that of (Al2O3) increases continuously during casting, resulting in changes in the composition of flux and the deterioration of physical properties of flux. Change in the flux composition is mainly related to the substitution of SiO2 with Al2O3, that is, the change of Al2O3/SiO2 ratio. In the present study, a promising flux for casting high-Mn, high-Al steel was selected as the original flux [29] and SiO2 was gradually replaced with Al2O3 (the Al2O3/SiO2 ratio ranges from 0.29 to 8.00) to investigate variations in the activities of (SiO2) and (Al2O3) and the reactivity of mold flux. The contents of the other components in the original flux are listed in Table 6. Figure 4 shows that with the increase in mass ratio of Al2O3/SiO2 from 0.29 to 8.0, the activity of (SiO2) first decreased rapidly, and then decreased slowly when the mass ratio of the Al2O3/SiO2 was beyond 3.5, and the activity of (Al2O3) changed slightly. Meanwhile, the decrease in the reactivity of flux was similar to that trend of (SiO2). Figure 4 also demonstrates that increasing the mass ratio of Al2O3/SiO2 could effectively weaken the reactivity of flux contacting steel with high content of [Al]. Although with further increase above 3.5, the effect on weakening the reactivity of mold flux was extremely limited, indicating that the reactivity of flux approached to the minimum. Therefore, for this six-component flux system, the mass ratio of Al2O3/SiO2 of 3.5 can be regarded as the critical value, below which the reactivity of mold flux is prominent and the reaction between [Al] and (SiO2) at the steel–slag interface occurs easily.
Figure 5 shows the mole fraction of complex molecules that rank the top three in amount as a function of the mass ratio of Al2O3/SiO2. The top three were all silicates, when the content of Al2O3 was low and the ratio was 0.29. As the mass ratio of Al2O3/SiO2 increased from 0.29 to 8.0, the total mole fraction of silicates decreased sharply, and aluminates (Li2O·Al2O3, and 3BaO·Al2O3) became the main units whose mole fraction reached 17.8%. The increase in the proportion of aluminate-type complex molecules also attributed to the relative stable activity of (Al2O3) with the increase in the mass ratio of Al2O3/SiO2 in Figure 4. The variation of silicates and aluminates demonstrates that the flux system gradually transformed from CaO-SiO2-based to CaO-Al2O3-based mold flux.

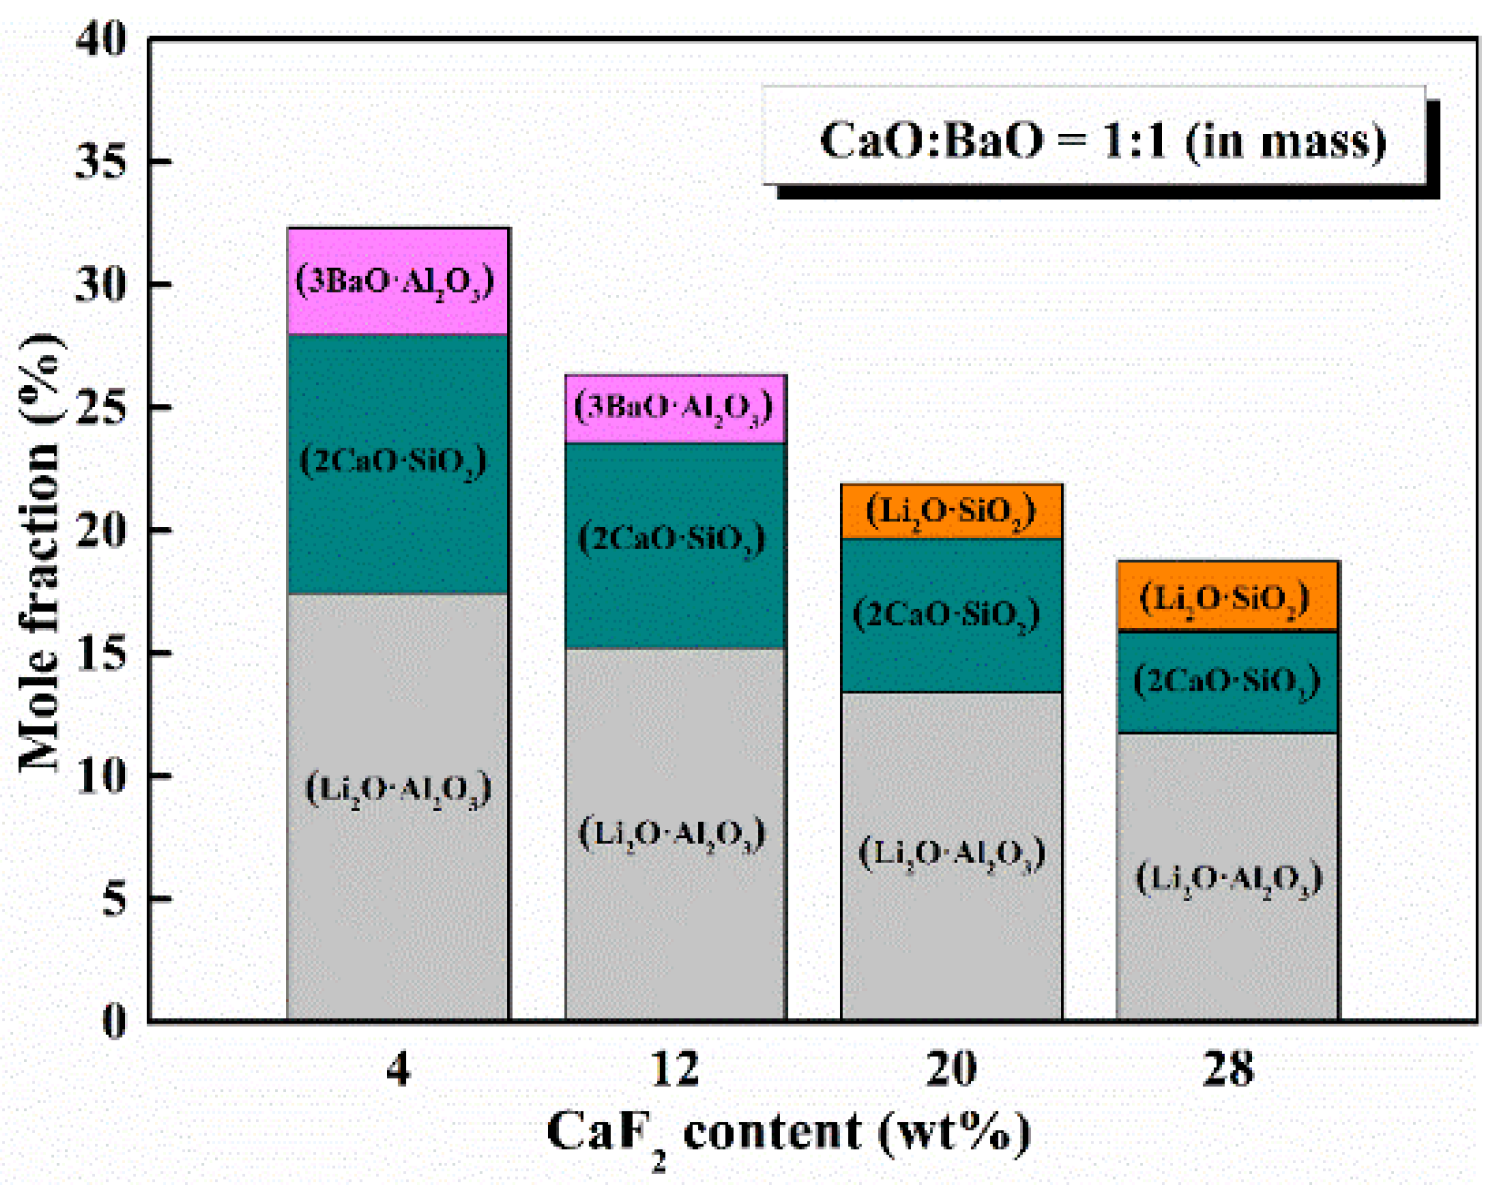
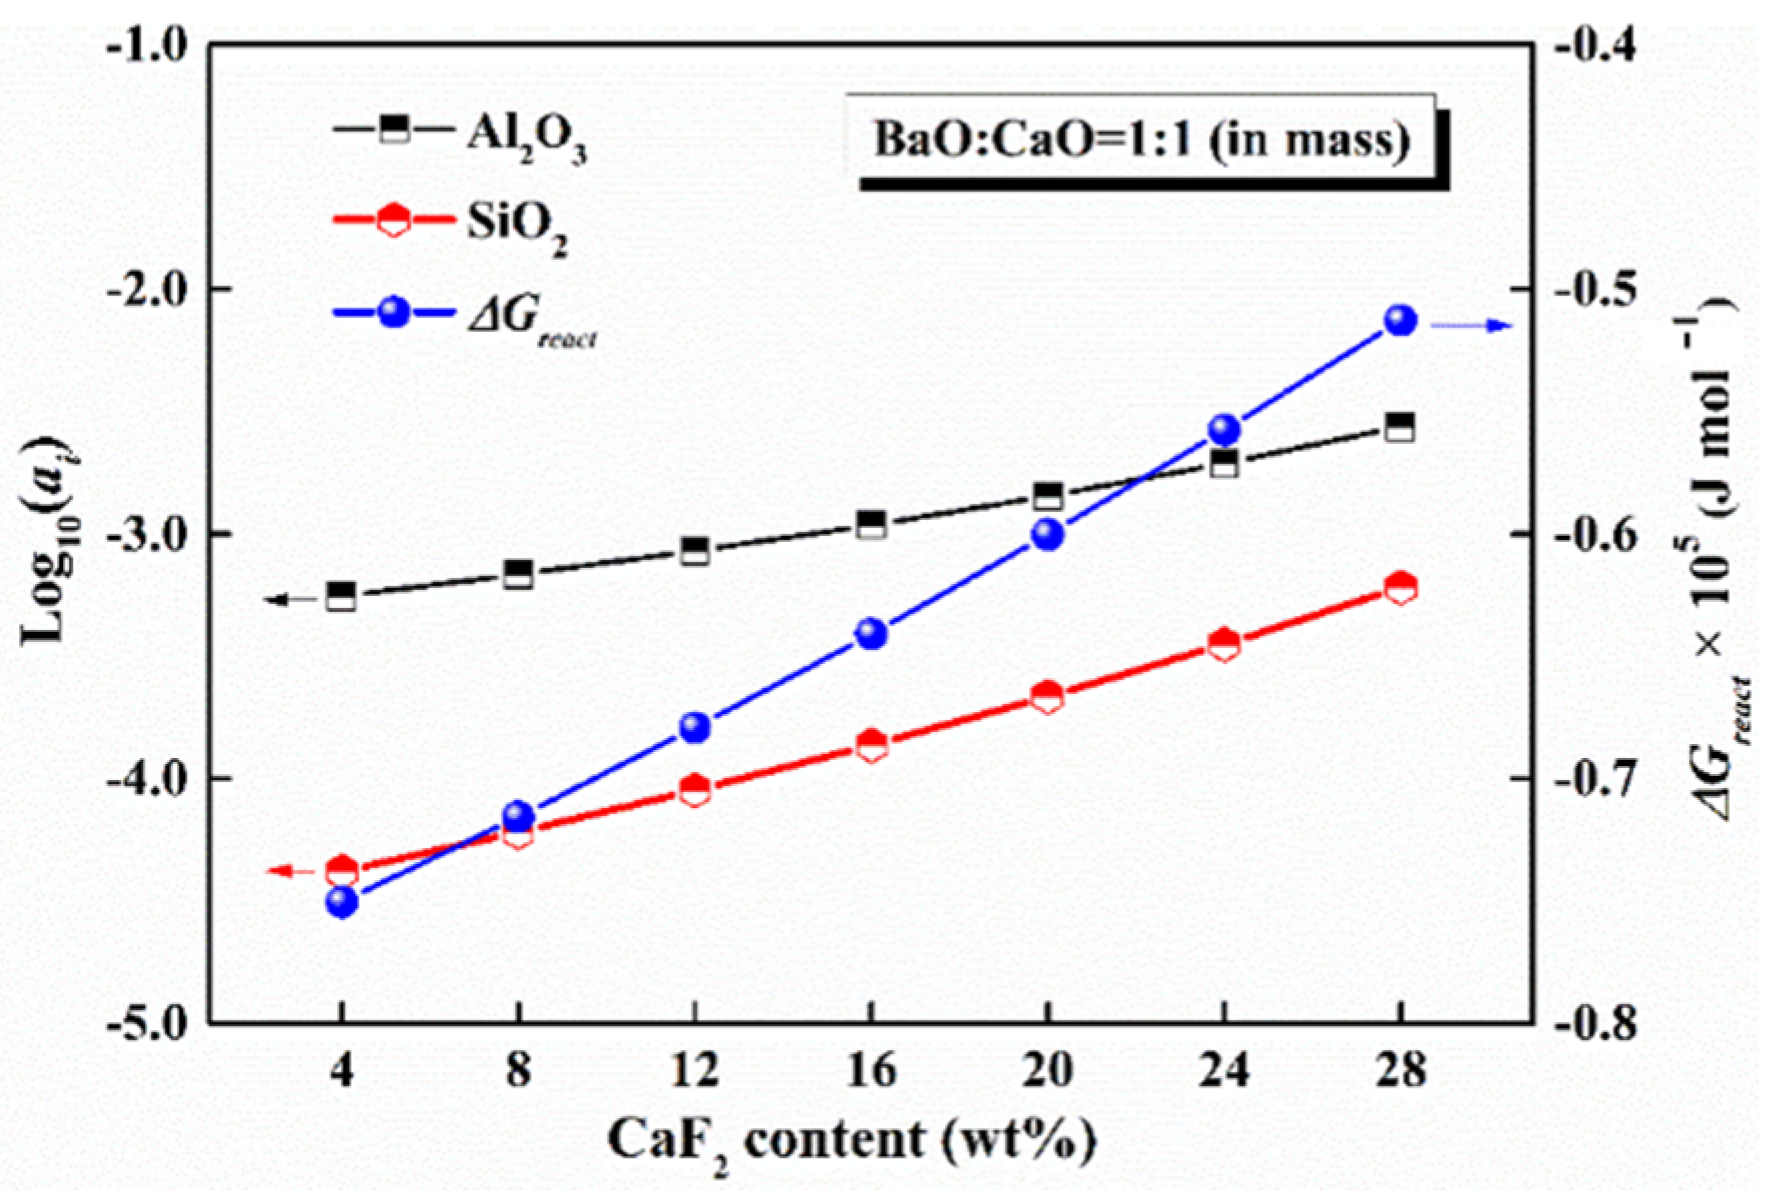
5.2. Content of CaF2

CaF2 is a common fluxing agent that can greatly reduce the viscosity of flux. Moreover, it can form cuspidine (3CaO·2SiO2·CaF2) combining with CaO and SiO2 and favor decreasing the horizontal heat transfer between the solidify strand and mold. The content of F in commercial flux typically ranges from 2 to 14 wt% [30], corresponding to a CaF2 content range of 4–28 wt%. Figure 6 shows the effect of CaF2 content on the activities of (SiO2) and (Al2O3) and the reactivity of mold flux. The increased activities of (SiO2) and (Al2O3) and the reactivity of flux indicated that the reaction between [Al] and (SiO2) was enhanced with the addition of CaF2. The decreased viscosity with CaF2 addition is expected to intensify the kinetic condition of the steel–slag reaction. Hence, there is a need to keep the content of CaF2 as low as possible, while ensuring appropriate lubrication and heat transfer of mold flux. Figure 7 shows the top three complex molecules with different contents of CaF2. For the current flux system with fixed contents of 24 wt% Al2O3 and 12 wt% SiO2, the main structure units were Li2O·Al2O3 and 2CaO·SiO2, while both of their contents attenuated gradually with increased content of CaF2 from 4 wt% to 28 wt%. The decreased content of silicates and aluminates was consistent with the predicted increased activities of simple molecule (Al2O3 and SiO2), indicating that the number of free SiO2 and Al2O3 was enhanced with increased addition of CaF2.

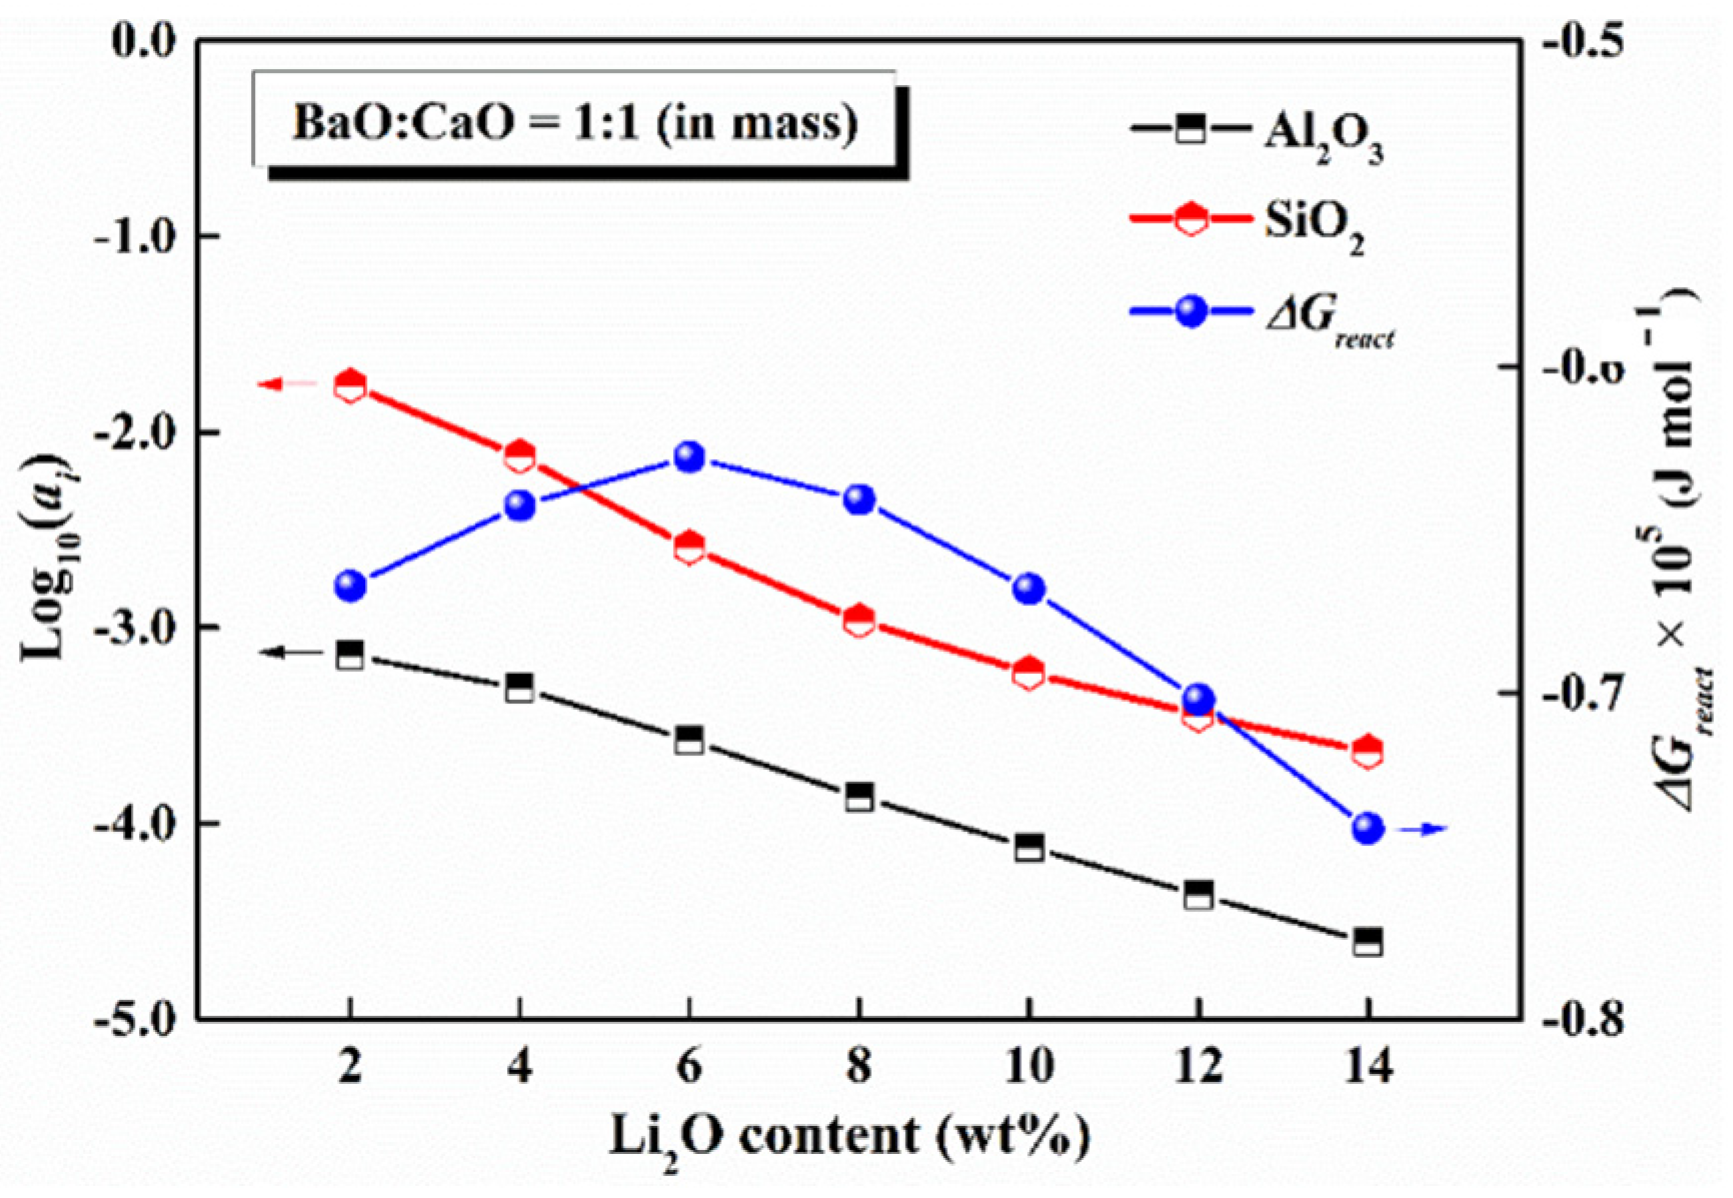
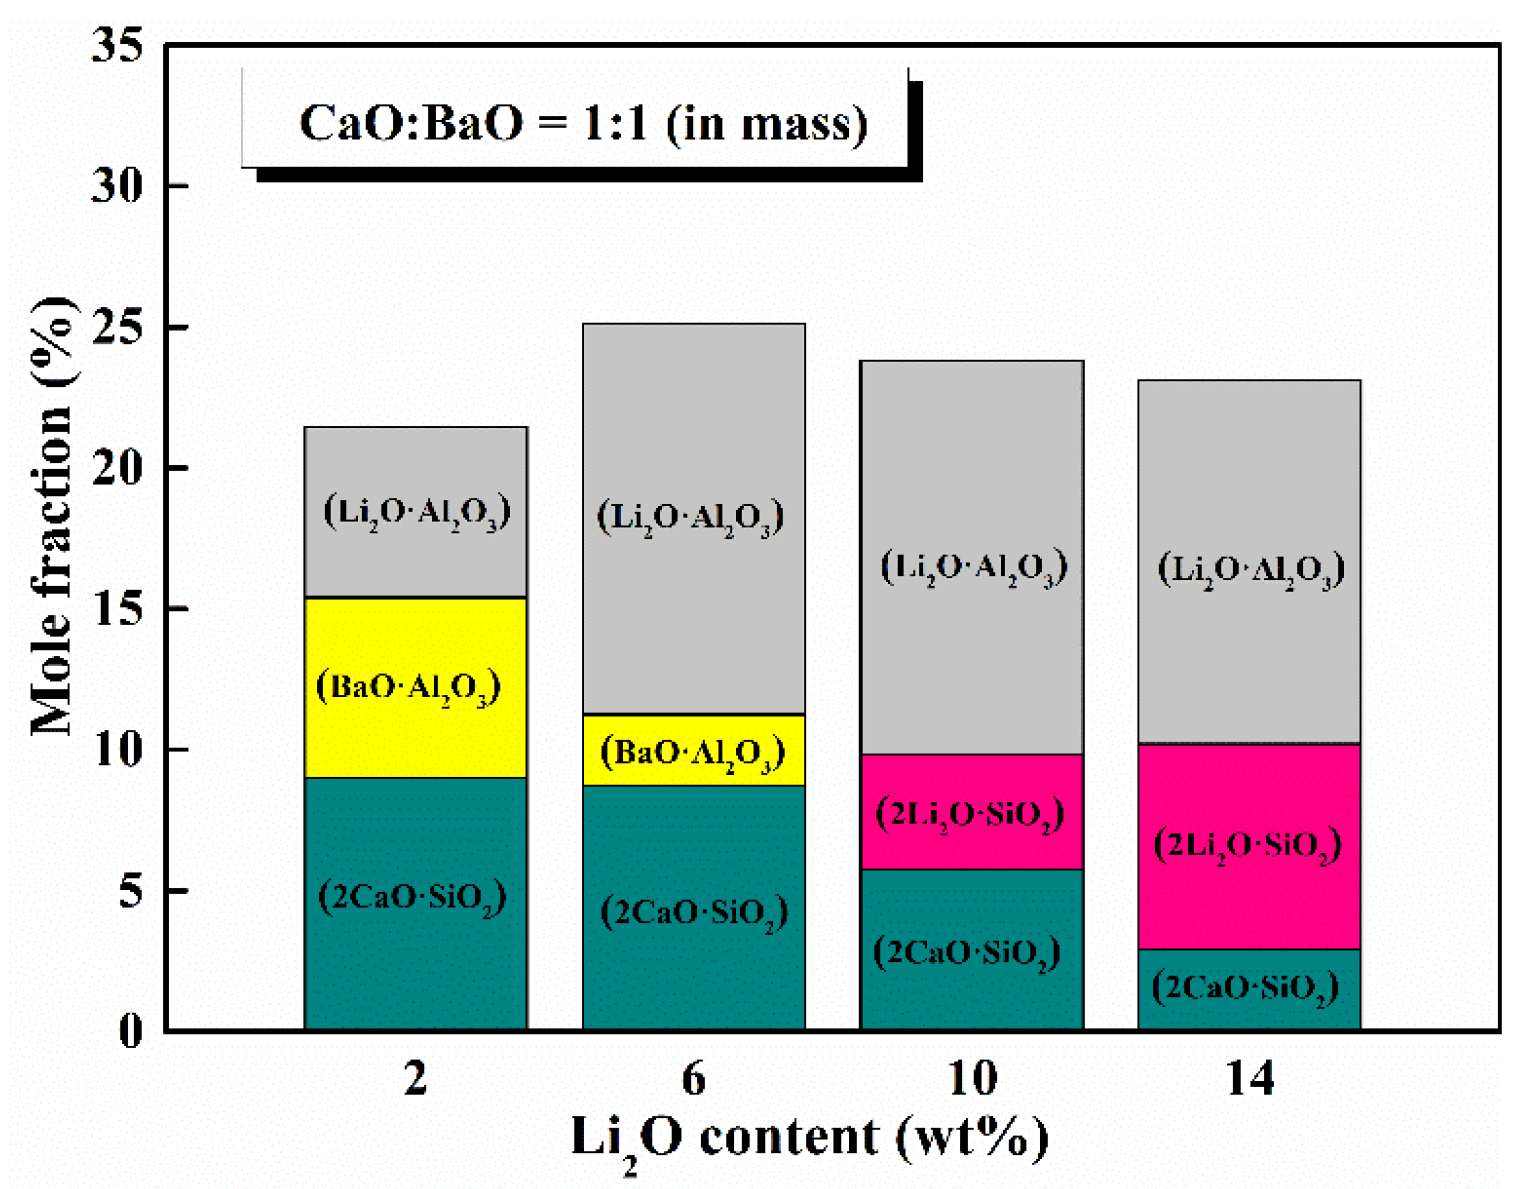
5.3. Content of Li2O

It is well known that the common fluxing agents, Na2O and B2O3, can react with [Al], whereas Li2O does not participate in the steel–slag reaction, and is able to reduce the melting temperature and viscosity of mold flux [31]. Thus, Li2O is a promising fluxing agent for designing low-reactivity flux. Figure 8 shows the effect of Li2O content. The activities of (SiO2) and (Al2O3) and the reactivity of mold flux decreased gradually, which indicated that the reactivity between [Al] and (SiO2) was weakened. As the content of Li2O increased from 2 wt% to 14 wt%, the reactivity of flux increased first and then decreased with a maximum at 6 wt%, indicating the compositional region around 6 wt% Li2O should be avoided in the development of low-reactivity flux. Figure 9 lists the top three complex molecules. The increased addition of Li2O made the mole fraction of silicate and aluminate containing Li2O be enlarged obviously, and the mole fraction of (2CaO·SiO2) and (BaO·Al2O3) decreased gradually.

6. Conclusions

A thermodynamic model to predict the activities of components in low-reactive CaO-BaO-Al2O3-SiO2-CaF2-Li2O mold flux was established based on IMCT. The conclusions can be summarized as follows:
  • The results calculated by IMCT model are good accordance to the experiment results and Factsage calculation. The thermodynamic model based on IMCT could predict the activity of each component in the low-reactive CaO-BaO-Al2O3-SiO2-CaF2-Li2O mold flux accurately and has good reliability.
  • With the increase in mass ratio of Al2O3/SiO2, the decreases in the activity of SiO2 and the reactivity of mold flux had a turning point when the ratio of Al2O3/SiO2 was 3.5, where the content of SiO2 was 8 wt%.
  • The activities of SiO2 and Al2O3 and the reactivity of mold flux increased continuously with an increase in the content of CaF2, which is unfavorable for developing low-reactivity mold flux. However, to avoid compromising other physical properties, the CaF2 should be kept to a minimum.
  • The activities of SiO2 and Al2O3 decreased with an increase in Li2O content, whereas the reactivity of mold flux had a maximum with 6 wt% Li2O content, indicating that the compositional regions involving around 6 wt% Li2O content should be avoided to design the low-reactive flux system.

Author Contributions

Conceptualization, M.Z. and G.L.; methodology, M.Z. and Z.L.; software, M.Z. and Z.L.; validation, Q.W. and S.H. All authors have read and agreed to the published version of the manuscript.

Funding

This research was funded by the National Natural Science Foundation of China (Grant Nos. 52074054, U20A20270, 51804057 and 51874057).

Institutional Review Board Statement

Not applicable.

Informed Consent Statement

Not applicable.

Data Availability Statement

Not applicable.

Conflicts of Interest

The authors declare no conflict of interest.

References

  1. Grässel, O.; Krüger, L.; Frommeyer, G.; Meyer, L.W. High strength Fe-Mn-(Al-Si) Trip/Twip steels development-properties-application. Int. J. Plast. 2000, 16, 1391–1409. [Google Scholar] [CrossRef]
  2. Gutiérrez-Urrutia, I.; Raabe, D. Multistage strain hardening through dislocation substructure and twinning in a high strength and ductile weight-reduced Fe–Mn–Al–C steel. Acta Mater. 2012, 60, 5791–5802. [Google Scholar] [CrossRef]
  3. Bouaziz, O.; Zurob, H.; Huang, M.X. Driving Force and Logic of Development of Advanced High Strength Steels for Automotive Applications. Steel Res. Int. 2013, 84, 937–947. [Google Scholar] [CrossRef]
  4. Fu, X.; Wen, G.H.; Liu, Q.; Tang, P.; Li, J.; Li, W. Development and evaluation of CaO–SiO2 based mould fluxes for casting high aluminum TRIP steel. Steel Res. Int. 2015, 86, 110–120. [Google Scholar] [CrossRef]
  5. Fu, X.; Wen, G.H.; Tang, P.; Ma, F.J.; Wang, H. Characteristics of heat flux through slag film of mold slag used for high Al-TRIP steel casting. J. Iron Steel Res. Int. 2010, 17, 11–16. [Google Scholar]
  6. Wu, T.; He, S.P.; Zhu, L.L.; Wang, Q. Study on Reaction Performances and Applications of Mold Flux for High-Aluminum Steel. Mater. Trans. 2016, 57, 58–63. [Google Scholar] [CrossRef] [Green Version]
  7. Ji, C.X.; Yang, C.; Zhi, Z.; Tian, Z.H.; Zhao, C.L.; Zhu, G.S. Continuous casting of high-Al steel in shougang jingtang steel works. J. Iron Steel Res. Int. 2015, 22, 53–56. [Google Scholar] [CrossRef]
  8. He, S.P.; Li, Z.R.; Chen, Z.; Wu, T.; Wang, Q. Review of mold fluxes for continuous casting of high-alloy (Al, Mn, Ti) steels. Steel Res. Int. 2019, 90, 1800424. [Google Scholar] [CrossRef] [Green Version]
  9. Wang, W.L.; Lu, B.X.; Xiao, D. A Review of Mold Flux Development for the Casting of High-Al Steels. Metall. Mater. Trans. B 2016, 47, 384–389. [Google Scholar] [CrossRef]
  10. Zhang, J.; Wang, P. The widespread applicability of the mass action law to metallurgical melts and organic solutions. Calphad 2001, 25, 343–354. [Google Scholar] [CrossRef]
  11. Wu, C.C.; Cheng, G.G.; Long, H. Calculating model of action concentration of slag systems containing Ce2O3. Zhongguo Youse Jinshu Xuebao/Chin. J. Nonferrous Met. 2013, 23, 2999–3005. [Google Scholar]
  12. Zhang, B.; Jiang, M.F.; Qi, J.; Liu, C.J. Activity Calculation Model for a Slag System Consisting of CaO-SiO2-Al2O3-FeO-CaF2-La2O3-Nb2O5-TiO2. J. Northeast. Univ. Nat. Sci. 2011, 32, 524–528. [Google Scholar]
  13. Duan, S.C.; Li, C.; Guo, X.L.; Guo, H.J.; Guo, J.; Yang, W.S. A thermodynamic model for calculating manganese distribution ratio between CaO-SiO2-MgO-FeO-MnO-Al2O3-TiO2-CaF2 ironmaking slags and carbon saturated hot metal based on the IMCT. Ironmak. Steelmak. 2018, 45, 655–664. [Google Scholar] [CrossRef]
  14. Wu, T.; Wang, Q.; He, S.P.; Xu, J.F.; Long, X.; Lu, Y.J. Study on properties of alumina-based mould fluxes for high-Al steel slab casting. Steel Res. Int. 2012, 83, 1194–1202. [Google Scholar] [CrossRef]
  15. Levin, E.; McMurdie, H. Phase Diagrams for Ceramists; The American Ceramic Society: Westerville, OH, USA, 1975. [Google Scholar]
  16. Shukla, A.; Jung, I.-H.; Decterov, S.A.; Pelton, A.D. Thermodynamic evaluation and optimization of the BaO-SiO2 and BaO-CaO-SiO2 systems. Calphad 2018, 61, 140–147. [Google Scholar] [CrossRef]
  17. Allibert, M. Slag Atlas; Verein Deutscher Eisenhüttenleute: Dusseldorf, Germany, 1995; p. 616. [Google Scholar]
  18. Yang, X.M.; Jiao, J.S.; Ding, R.C.; Shi, C.B.; Guo, H.J. A thermodynamic model for calculating sulphur distribution ratio between CaO-SiO2-MgO-Al2O3 ironmaking slags and carbon saturated hot metal based on the ion and molecule coexistence theory. ISIJ Int. 2009, 49, 1828–1837. [Google Scholar] [CrossRef] [Green Version]
  19. Wei, S. Thermodynamics of Metallurgical Processes; Series Book of Modern Metallurgy; Shanghai Scientific & Technical Publishers: Shanghai, China, 1980; 52p. [Google Scholar]
  20. Ye, D.L.; Hu, J. Practical Inorganic Thermodynamic Data Handbook; Metallurgical Industry Press: Beijing, China, 2002; 561p. [Google Scholar]
  21. Yang, X.M.; Duan, J.P.; Shi, C.B.; Zhang, M.; Zhang, Y.L.; Wang, J.C. A thermodynamic model of phosphorus distribution ratio between CaO-SiO2-MgO-FeO-Fe2O3-MnO-Al2O3-P2O5 slags and molten steel during a top–bottom combined blown converter steelmaking process based on the ion and molecule coexistence theory. Metall. Mater. Trans. B 2011, 42, 738–770. [Google Scholar] [CrossRef]
  22. Shukla, A. Development of a Critically Evaluated Thermodynamic Database for the Systems Containing Alkaline-Earth Oxides; École Polytechnique de Montréal: Montreal, QC, Canada, 2012. [Google Scholar]
  23. Yang, X.M.; Shi, C.B.; Zhang, M.; Duan, J.P.; Zhang, J. A thermodynamic model of phosphate capacity for CaO-SiO2-MgO-FeO-Fe2O3-MnO-Al2O3-P2O5 slags equilibrated with molten steel during a top–bottom combined blown converter steelmaking process based on the ion and molecule coexistence theory. Metall. Mater. Trans. B 2011, 42, 951–977. [Google Scholar] [CrossRef]
  24. Duan, S.C.; Guo, X.L.; Guo, H.J. A manganese distribution prediction model for CaO-SiO2-FeO-MgO-MnO-Al2O3 slags based on IMCT. Ironmak. Steelmak. 2017, 44, 168–184. [Google Scholar] [CrossRef]
  25. Gzieo, A.; Jowsa, J. Activity of SiO2 in slags CaO–SiO2–Al2O3–CaF2. Arch. Hut. 1984, 29, 319–331. [Google Scholar]
  26. Gao, J.X.; Wen, G.H.; Huang, T.; Bai, B.W.; Tang, P.; Liu, Q. Effect of slag-steel reaction on the structure and viscosity of CaO-SiO2-based mold flux during high-Al steel casting. J. Non-Cryst. Solids 2016, 452, 119–124. [Google Scholar] [CrossRef]
  27. Rey, M. Discuss the thermodynamic activity of silica and of oxides in silicate melts. Discuss. Faraday Soc. 1948, 4, 257–265. [Google Scholar] [CrossRef]
  28. Charles, R. Activities in Li2O-, Na2O-, and K2O-SiO2 Solutions. J. Am. Ceram. Soc. 1967, 50, 631–641. [Google Scholar] [CrossRef]
  29. Li, Z.R.; You, X.C.; Li, M.; Wang, Q.Q.; He, S.P.; Wang, Q. Effect of substituting CaO with BaO and CaO/Al2O3 ratio on the viscosity of CaO–BaO–Al2O3–CaF2–Li2O mold flux system. Metals 2019, 9, 142. [Google Scholar] [CrossRef] [Green Version]
  30. Mills, K.C.; Däcker, C.Å. The Casting Powders Book; Springer: Berlin, Germany, 2017. [Google Scholar]
  31. Li, G.J.; Du, D.X.; Chi, J.H. Role of Li2O in the mold powder. Iron Steel Vanadium Titan. 1996, 17, 15–18. [Google Scholar]
Figure 1. Schematic of apparatus for the steel–slag reaction.
Metals 12 01099 g001
Figure 2. Activities of SiO2 estimated by the IMCT model and sub-regular solution model for Li2O-SiO2 binary system.
Metals 12 01099 g002
Figure 3. Variations of Al2O3 and SiO2 before and after steel–slag reaction.
Metals 12 01099 g003
Figure 4. Effect of mass ratio of Al2O3/SiO2 on the activities of Al2O3 and SiO2 and the reactivity of mold flux.
Metals 12 01099 g004
Figure 5. Mole fraction of the top three complex molecules as a function of mass ratio of Al2O3/SiO2.
Metals 12 01099 g005
Figure 6. Effect of CaF2 content on the activities of Al2O3 and SiO2 and the reactivity of mold flux.
Metals 12 01099 g006
Figure 7. Mole fraction of the top three complex molecules as a function of CaF2 content.
Metals 12 01099 g007
Figure 8. Effect of Li2O content on the activities of Al2O3 and SiO2 and the reactivity of mold flux.
Metals 12 01099 g008
Figure 9. Mole fraction of the top three complex molecules as a function of Li2O content.
Metals 12 01099 g009
Table 1. Mole number and mass action concentration of the structural units.
ItemsStructural UnitsMole NumberMass Action Concentration
Ion couples(Ca2+ + O2−) n 1 = 2 n CaO N 1 = n 1 / n i
(Ba2+ + O2−) n 2 = 2 n BaO N 2 = n 2 / n i
(Ca2+ + 2F) n 5 = 3 n CaF 2 N 5 = n 5 / n i
(2Li+ + O2−) n 6 = 3 n Li 2 O N 6 = n 6 / n i
Simple moleculesAl2O3 n 3 N 3 = n 3 / n i
SiO2 n 4 N 4 = n 4 / n i
Complex moleculesCaO·SiO2 n 7 N 7 = n 7 / n i
2CaO·SiO2 n 8 N 8 = n 8 / n i
3CaO·SiO2 n 9 N 9 = n 9 / n i
3CaO·2SiO2 n 10 N 10 = n 10 / n i
CaO·Al2O3 n 11 N 11 = n 11 / n i
CaO·2Al2O3 n 12 N 12 = n 12 / n i
CaO·6Al2O3 n 13 N 13 = n 13 / n i
3CaO·Al2O3 n 14 N 14 = n 14 / n i
12CaO·7Al2O3 n 15 N 15 = n 15 / n i
BaO·SiO2 n 16 N 16 = n 16 / n i
BaO·2SiO2 n 17 N 17 = n 17 / n i
2BaO·SiO2 n 18 N 18 = n 18 / n i
2BaO·3SiO2 n 19 N 19 = n 19 / n i
BaO·Al2O3 n 20 N 20 = n 20 / n i
BaO·6Al2O3 n 21 N 21 = n 21 / n i
3BaO·Al2O3 n 22 N 22 = n 22 / n i
3Al2O3·2SiO2 n 23 N 23 = n 23 / n i
Li2O·SiO2 n 24 N 24 = n 24 / n i
Li2O·2SiO2 n 25 N 25 = n 25 / n i
2Li2O·SiO2 n 26 N 26 = n 26 / n i
Li2O·Al2O3 n 27 N 27 = n 27 / n i
BaO·3CaO·2SiO2 n 28 N 28 = n 28 / n i
2BaO·4CaO·3SiO2 n 29 N 29 = n 29 / n i
BaO·2CaO·4Al2O3 n 30 N 30 = n 30 / n i
3BaO·CaO·Al2O3 n 31 N 31 = n 31 / n i
CaO·Al2O3·2SiO2 n 32 N 32 = n 32 / n i
2CaO·Al2O3·SiO2 n 33 N 33 = n 33 / n i
BaO·Al2O3·2SiO2 n 34 N 34 = n 34 / n i
3CaO·2SiO2·CaF2 n 35 N 35 = n 35 / n i
3CaO·3Al2O3·CaF2 n 36 N 36 = n 36 / n i
11CaO·7Al2O3·CaF2 n 37 N 37 = n 37 / n i
Li2O·Al2O3·2SiO2 n 38 N 38 = n 38 / n i
Li2O·Al2O3·4SiO2 n 39 N 39 = n 39 / n i
Table 2. Reaction formulas for the formation of complex molecules.
Reaction Δ G T Θ KiNiRef.
(Ca2+ + O2−) + (SiO2)→(CaO·SiO2)−92,500 + 1.25T K 7 = N 7 N 1 N 4 N 7 = K 7 N 1 N 4 [10]
2(Ca2+ + O2−) + (SiO2)→(2CaO·SiO2)−102,090 − 24.267T K 8 = N 8 N 1 2 N 4 N 8 = K 8 N 1 2 N 4 [21]
3(Ca2+ + O2−) + (SiO2)→(3CaO·SiO2)−118,826 − 6.694T K 9 = N 9 N 1 3 N 4 N 9 = K 9 N 1 3 N 4 [21]
3(Ca2+ + O2−) + 2(SiO2)→(3CaO·2SiO2)−236,814 + 9.623T K 10 = N 10 N 1 3 N 4 2 N 10 = K 10 N 1 3 N 4 2 [21]
(Ca2+ + O2−) + (Al2O3)→(CaO·Al2O3)59,413 − 59.413T K 11 = N 11 N 1 N 3 N 11 = K 11 N 1 N 3 [21]
(Ca2+ + O2−) + 2(Al2O3)→(CaO·2Al2O3)−16,736 − 25.522T K 12 = N 12 N 1 N 3 2 N 12 = K 11 N 1 N 3 2 [21]
(Ca2+ + O2−) + 6(Al2O3)→(CaO·6Al2O3)−22,594 − 31.798T K 13 = N 13 N 1 N 3 6 N 13 = K 13 N 1 N 3 6 [21]
3(Ca2+ + O2−) + (Al2O3)→(3CaO·Al2O3)−21,757 − 29.288T K 14 = N 14 N 1 3 N 3 N 14 = K 14 N 1 3 N 3 [21]
12(Ca2+ + O2−) + 7(Al2O3)→(12CaO·7Al2O3)617,977 − 612.119 T K 15 = N 15 N 1 12 N 3 7 N 15 = K 15 N 1 12 N 3 7 [21]
(Ba2+ + O2−) + (SiO2)→(BaO·SiO2)−154,238 − 2.926T K 16 = N 16 N 2 N 4 N 16 = K 16 N 2 N 4 [22]
(Ba2+ + O2−) + 2(SiO2)→(BaO·2SiO2)−169,365 + 1.496T K 17 = N 17 N 2 N 4 2 N 17 = K 17 N 2 N 4 2 [22]
2(Ba2+ + O2−) + (SiO2)→(2BaO·SiO2)−264,183 − 3.395T K 18 = N 18 N 2 2 N 4 N 18 = K 18 N 2 2 N 4 [22]
2(Ba2+ + O2−) + 3(SiO2)→(2BaO·3SiO2)−337,580 + 7.039T K 19 = N 19 N 2 2 N 4 3 N 19 = K 19 N 2 2 N 4 3 [22]
(Ba2+ + O2−) + (Al2O3)→(BaO·Al2O3)−99,760 − 25.413T K 20 = N 20 N 2 N 3 N 20 = K 20 N 2 N 3 [22]
(Ba2+ + O2−) + 6(Al2O3)→(BaO·6Al2O3)−126,813 − 24.293T K 21 = N 21 N 2 N 3 6 N 21 = K 21 N 2 N 3 6 [22]
3(Ba2+ + O2−) + (Al2O3)→(3BaO·Al2O3)−187,633 − 37.528T K 22 = N 22 N 2 3 N 3 N 22 = K 22 N 2 3 N 3 [23]
3(Al2O3) + 2(SiO2)→(3Al2O3·2SiO2)−4354 − 10.467T K 23 = N 23 N 3 3 N 4 2 N 23 = K 23 N 3 3 N 4 2 [22]
(2Li+ + O2−) + (SiO2)→(Li2O·SiO2)−143,757 + 3.796T K 24 = N 24 N 6 N 4 N 24 = K 24 N 6 N 4 [22]
(2Li+ + O2−) + 2(SiO2)→(Li2O·2SiO2)−145,174 − 1.372T K 25 = N 25 N 6 N 4 2 N 25 = K 25 N 6 N 4 2 [22]
2(2Li+ + O2−) + (SiO2)→(2Li2O·SiO2)−230,237 + 15.442T K 26 = N 26 N 6 2 N 4 N 26 = K 26 N 6 2 N 4 [22]
(2Li+ + O2−) + (Al2O3)→(Li2O·Al2O3)−106,327 − 16.567T K 27 = N 27 N 6 N 3 N 27 = K 27 N 6 N 3 [22]
(Ba2+ + O2−) + 3(Ca2+ + O2−) + 2(SiO2)→(BaO·3CaO·2SiO2)−376,298 + 8.751T K 28 = N 28 N 2 N 1 3 N 4 2 N 28 = K 28 N 2 N 1 3 N 4 2 [22]
2(Ba2+ + O2−) + 4(Ca2+ + O2−) + 3(SiO2)→(2BaO·4CaO·3SiO2)−533,550 + 269.292T K 29 = N 29 N 2 2 N 1 4 N 4 3 N 29 = K 29 N 2 2 N 1 4 N 4 3 [22]
(Ba2+ + O2−) + 2(Ca2+ + O2−) + 4(Al2O3)→(BaO·2CaO·4Al2O3)−157,255 − 85.113T K 30 = N 30 N 2 N 1 2 N 3 4 N 30 = K 30 N 2 N 1 2 N 3 4 [22]
3(Ba2+ + O2−) + (Ca2+ + O2−) + (Al2O3)→(3BaO·CaO·Al2O3)−139,905 − 42.192T K 31 = N 31 N 2 3 N 1 N 3 N 31 = K 31 N 2 3 N 1 N 3 [22]
(Ca2+ + O2−) + (Al2O3) + 2(SiO2)→(CaO·Al2O3·2SiO2)−4184 − 73.638T K 32 = N 32 N 1 N 3 N 4 2 N 32 = K 32 N 1 N 3 N 4 2 [23,24]
2(Ca2+ + O2−) + (Al2O3) + (SiO2)→(2CaO·Al2O3·SiO2)−116,315 − 38.911T K 33 = N 33 N 1 2 N 3 N 4 N 33 = K 33 N 1 2 N 3 N 4 [23,24]
(Ba2+ + O2−) + (Al2O3) + 2(SiO2)→(BaO·Al2O3·2SiO2)−198,791 − 38.497T K 34 = N 34 N 2 N 3 N 4 2 N 34 = K 34 N 2 N 3 N 4 2 [22]
3(Ca2+ + O2−) + 2(SiO2) + (Ca2+ + 2F)→(3CaO·2SiO2·CaF2)−255,180 − 8.20T K 35 = N 35 N 1 3 N 4 2 N 5 N 35 = K 35 N 1 3 N 4 2 N 5 [23,24]
3(Ca2+ + O2−) + 3(Al2O3) + (Ca2+ + 2F)→(3CaO·3Al2O3·CaF2)−44,492 − 73.15T K 36 = N 36 N 1 3 N 3 3 N 5 N 36 = K 36 N 1 3 N 3 3 N 5 [23,24]
11(Ca2+ + O2−) + 7(Al2O3) + (Ca2+ + 2F)→(11CaO·7Al2O3·CaF2)−228,760 − 155.8T K 37 = N 37 N 1 11 N 3 7 N 5 N 37 = K 37 N 1 11 N 3 7 N 5 [23,24]
(2Li+ + O2−) + (Al2O3) + 2(SiO2)→(Li2O·Al2O3·2SiO2)−136,270 − 37.516T K 38 = N 38 N 6 N 3 N 4 2 N 38 = K 38 N 6 N 3 N 4 2 [19]
(2Li+ + O2−) + (Al2O3) + 4(SiO2)→(Li2O·Al2O3·4SiO2)−128,739 − 48.253T K 39 = N 39 N 6 N 3 N 4 4 N 39 = K 39 N 6 N 3 N 4 4 [19]
Table 3. Initial composition of mold fluxes and steel for the contact experiment (wt%).
CaOBaOAl2O3SiO2FLi2O
FluxesS-136.52421684.5
S-236.52419884.5
S-336.524171084.5
S-436.524151284.5
SteelCAlMnSiSFe
0.171.4922.70.220.02Bal.
Table 4. Composition of the CaO-Al2O3-SiO2-BaO/CaF2 quaternary flux system (wt%) and activity of SiO2.
CaOBaOAl2O3SiO2CaF2ki,calki,fitΔX
CaO-Al2O3-SiO2-BaO203010400−0.670−0.8840.242
204010300−1.241−1.5490.199
205010200−2.378−2.2340.064
303010300−1.494−1.7110.127
402010300−1.763−1.9430.093
501010300−2.093−2.4110.132
502020100−4.632−4.6530.005
402030100−3.983−4.0490.016
302040100−2.851−3.3830.157
CaO-Al2O3-SiO2-CaF236016408−0.969−1.0060.037
40016368−1.297−1.2940.002
40022308−1.734−1.6230.068
40034188−2.552−2.6270.029
40040128−2.879−3.2360.110
36084016−0.876−0.8460.035
40083616−1.188−1.1110.069
400143016−1.729−1.5290.131
400261816−2.731−2.7950.023
400321216−3.106−3.3020.059
Table 5. Composition of mold flux before and after steel–slag reaction (wt%).
Mold FluxBefore/AfterCaOBaO *Al2O3SiO2FLi2OMgO
S-1Initial36.7024.0020.826.078.004.080.00
Final35.2023.0022.315.057.603.782.55
S-2Initial36.4124.0019.128.216.904.120.00
Final35.8023.0021.016.906.803.812.46
S-3Initial36.2324.0017.0910.117.204.050.00
Final35.1023.0020.247.097.003.352.32
S-4Initial36.1524.0015.2412.187.004.070.00
Final33.7123.0020.458.586.803.742.89
* The BaO content is the analytical reference value.
Table 6. Composition of various flux systems for investigating the effect of components on the activities of Al2O3 and SiO2 (wt%).
VariableCaOBaOAl2O3SiO2CaF2Li2OSumInterval
Al2O3, SiO220208–3228–41681004
CaF2CaO:BaO = 1:124124–2881004
Li2OCaO:BaO = 1:12412162–141002
Publisher’s Note: MDPI stays neutral with regard to jurisdictional claims in published maps and institutional affiliations.

