3. Text Correction
There was an error in the original article. Data and Expressions provided by Hyundai Steel, which are not intended to be disclosed, were included in the text.
A correction has been made to Section 2, Paragraph 4: The hot stamping test of T-type parts was performed using the machined sheet blank as shown in Figure 2. The hot stamping die was installed and operated on a 200-ton hydraulic servo press (model: KOMATSU H1F200) with speed profile control. Figure 3 shows the press equipment and the installed die for the hot stamping test of the T-type part. A cooling channel for water cooling was installed in the die to suppress the temperature rise of the die due to repeated contact with the heated blank.
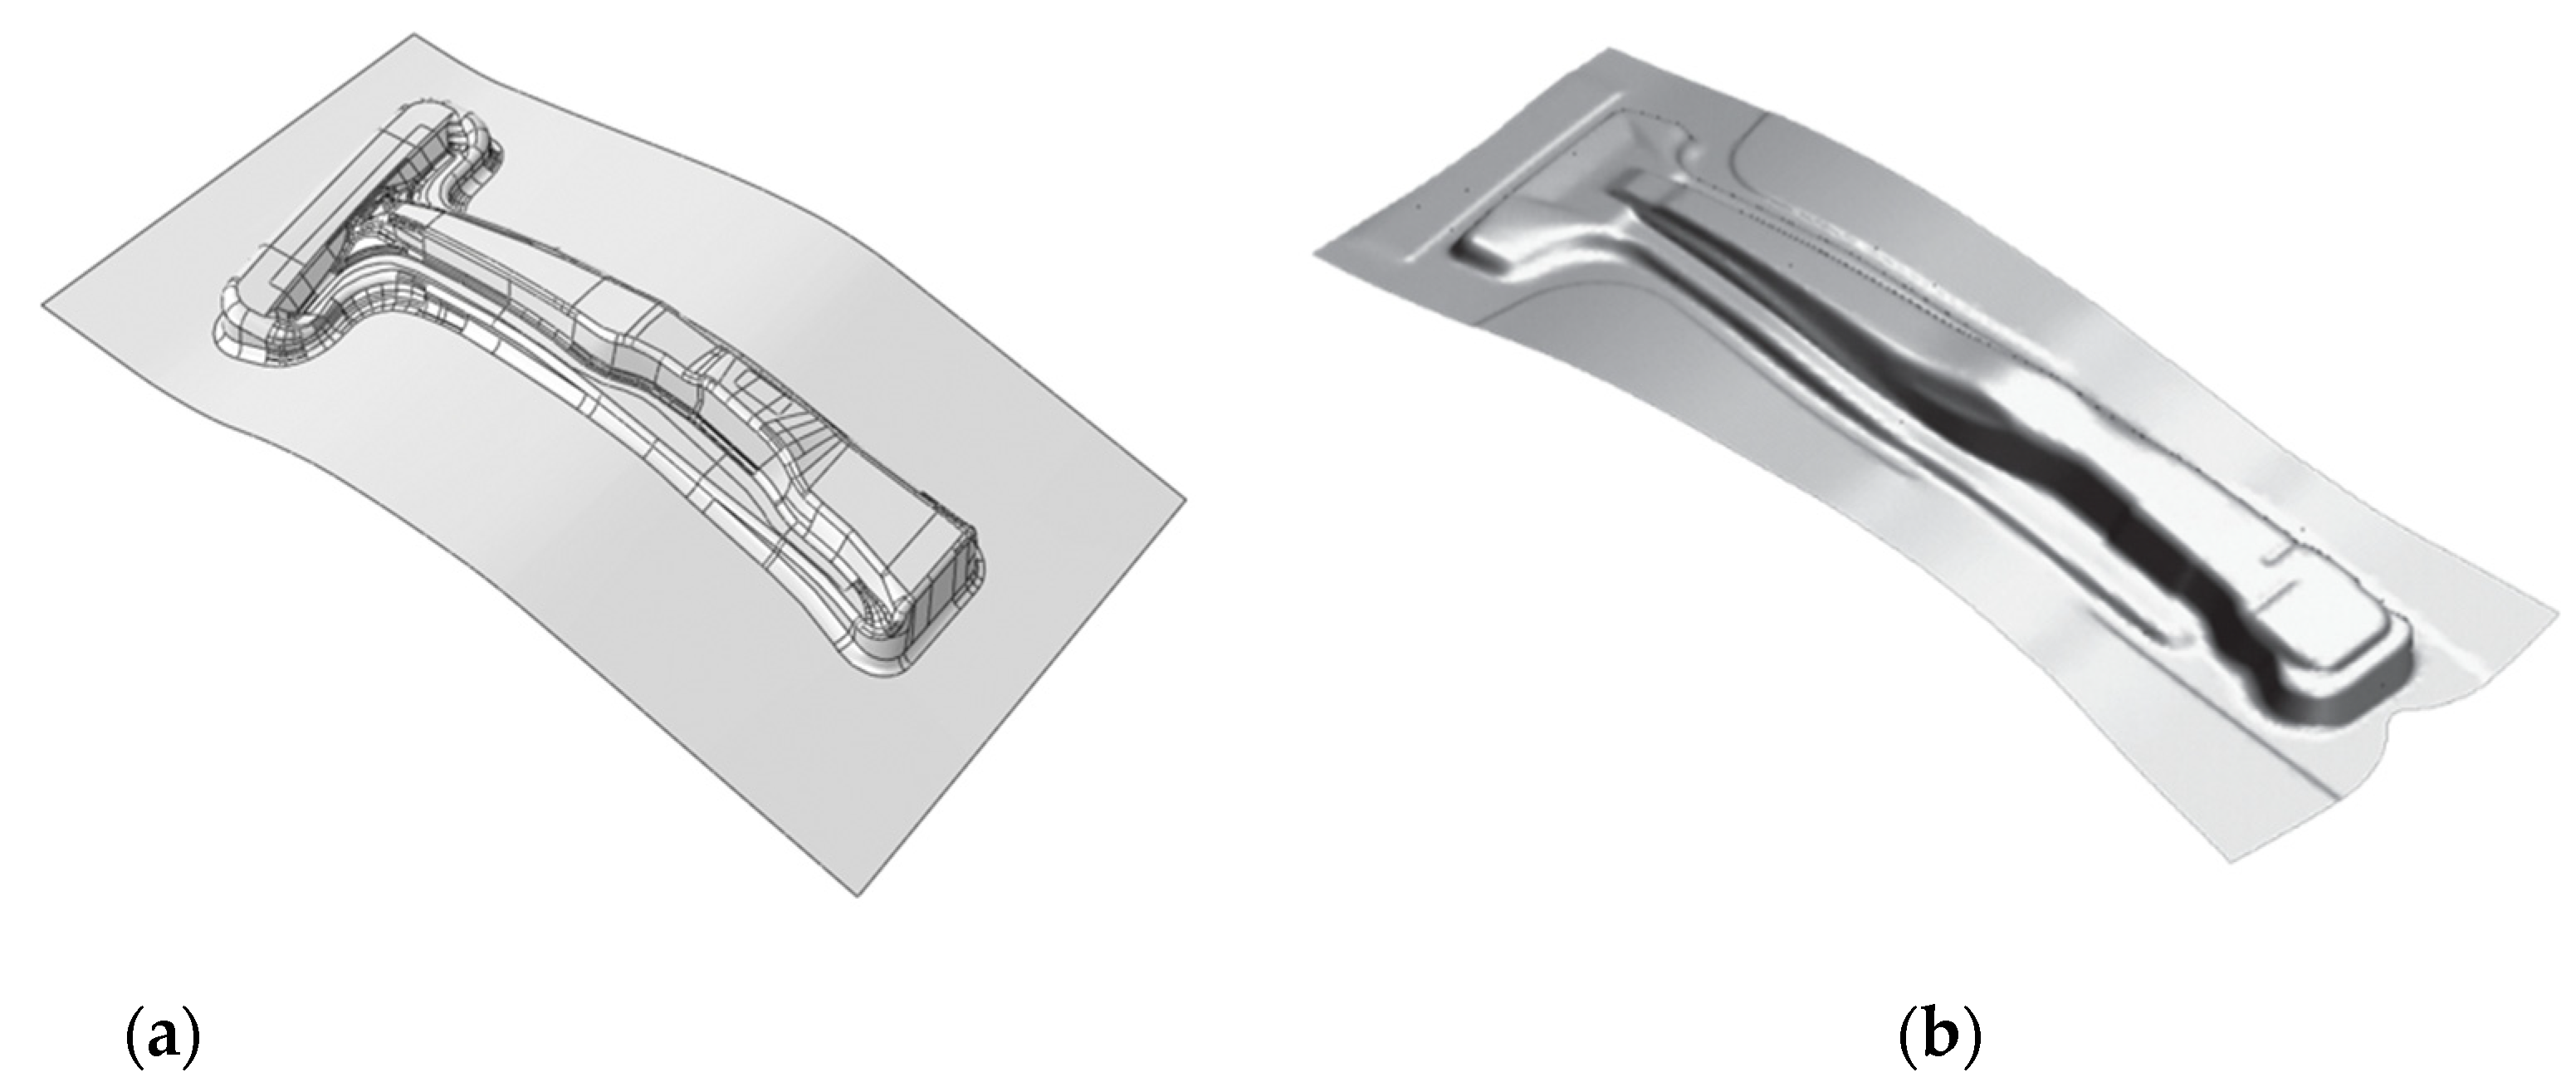
A correction has been made to Section 3, Paragraph 2: The B-pillar part model used in this study was based on the benchmark model provided by Numisheet 2008, as shown in
Figure 7.
A correction has been made to Section 3, Paragraph 7:
Table 3 shows the fixed variable values of the processes and materials used in the B-pillar hot stamping analysis. Considering the mass production process, the press speed was assumed to be 250 mm/s, and the quenching time was assumed to be 30 s, the point at which the change in the martensite phase ratio almost disappeared. Process variables such as die pad force and holder force were assumed by referring to data from the actual mass production process. The maximum value of the forming force of the die provided by the press equipment was 10 MN, and the actual forming force required for the die during the forming process is variable depending on the instantaneous deformation and work hardening of the sheet blank.
A correction has been made to Section 3, Paragraph 11: The flow stress of the material at 700 °C was experimentally measured under three strain-rate conditions of 0.006, 0.011, and 0.017/s. Based on the rate power law approximation of at high temperatures, the value of strain-rate sensitivity was estimated to be about 0.16. For 850, 900, and 950, which we assumed as the initial temperature of the sheet for B-pillar forming analysis, this value became a reference.
A correction has been made to Section 3, Paragraph 13: Among the process and material variables, the initial thickness of the sheet is useful for examining problems that arise when the manufactured sheet is smaller than the standard dimension or when a sheet thinner than the original thickness is used. If the thickness of the sheet is larger than the original thickness of 1.95 mm in the given die clearance conditions, problems may occur due to excessive compression due to contact with the die. Therefore, 1.8, 1.95, and 2.1 mm, which are smaller than or equal to 1.95 mm, were selected as the test values.
Table 4 shows the values of the process and material variables investigated in this study.
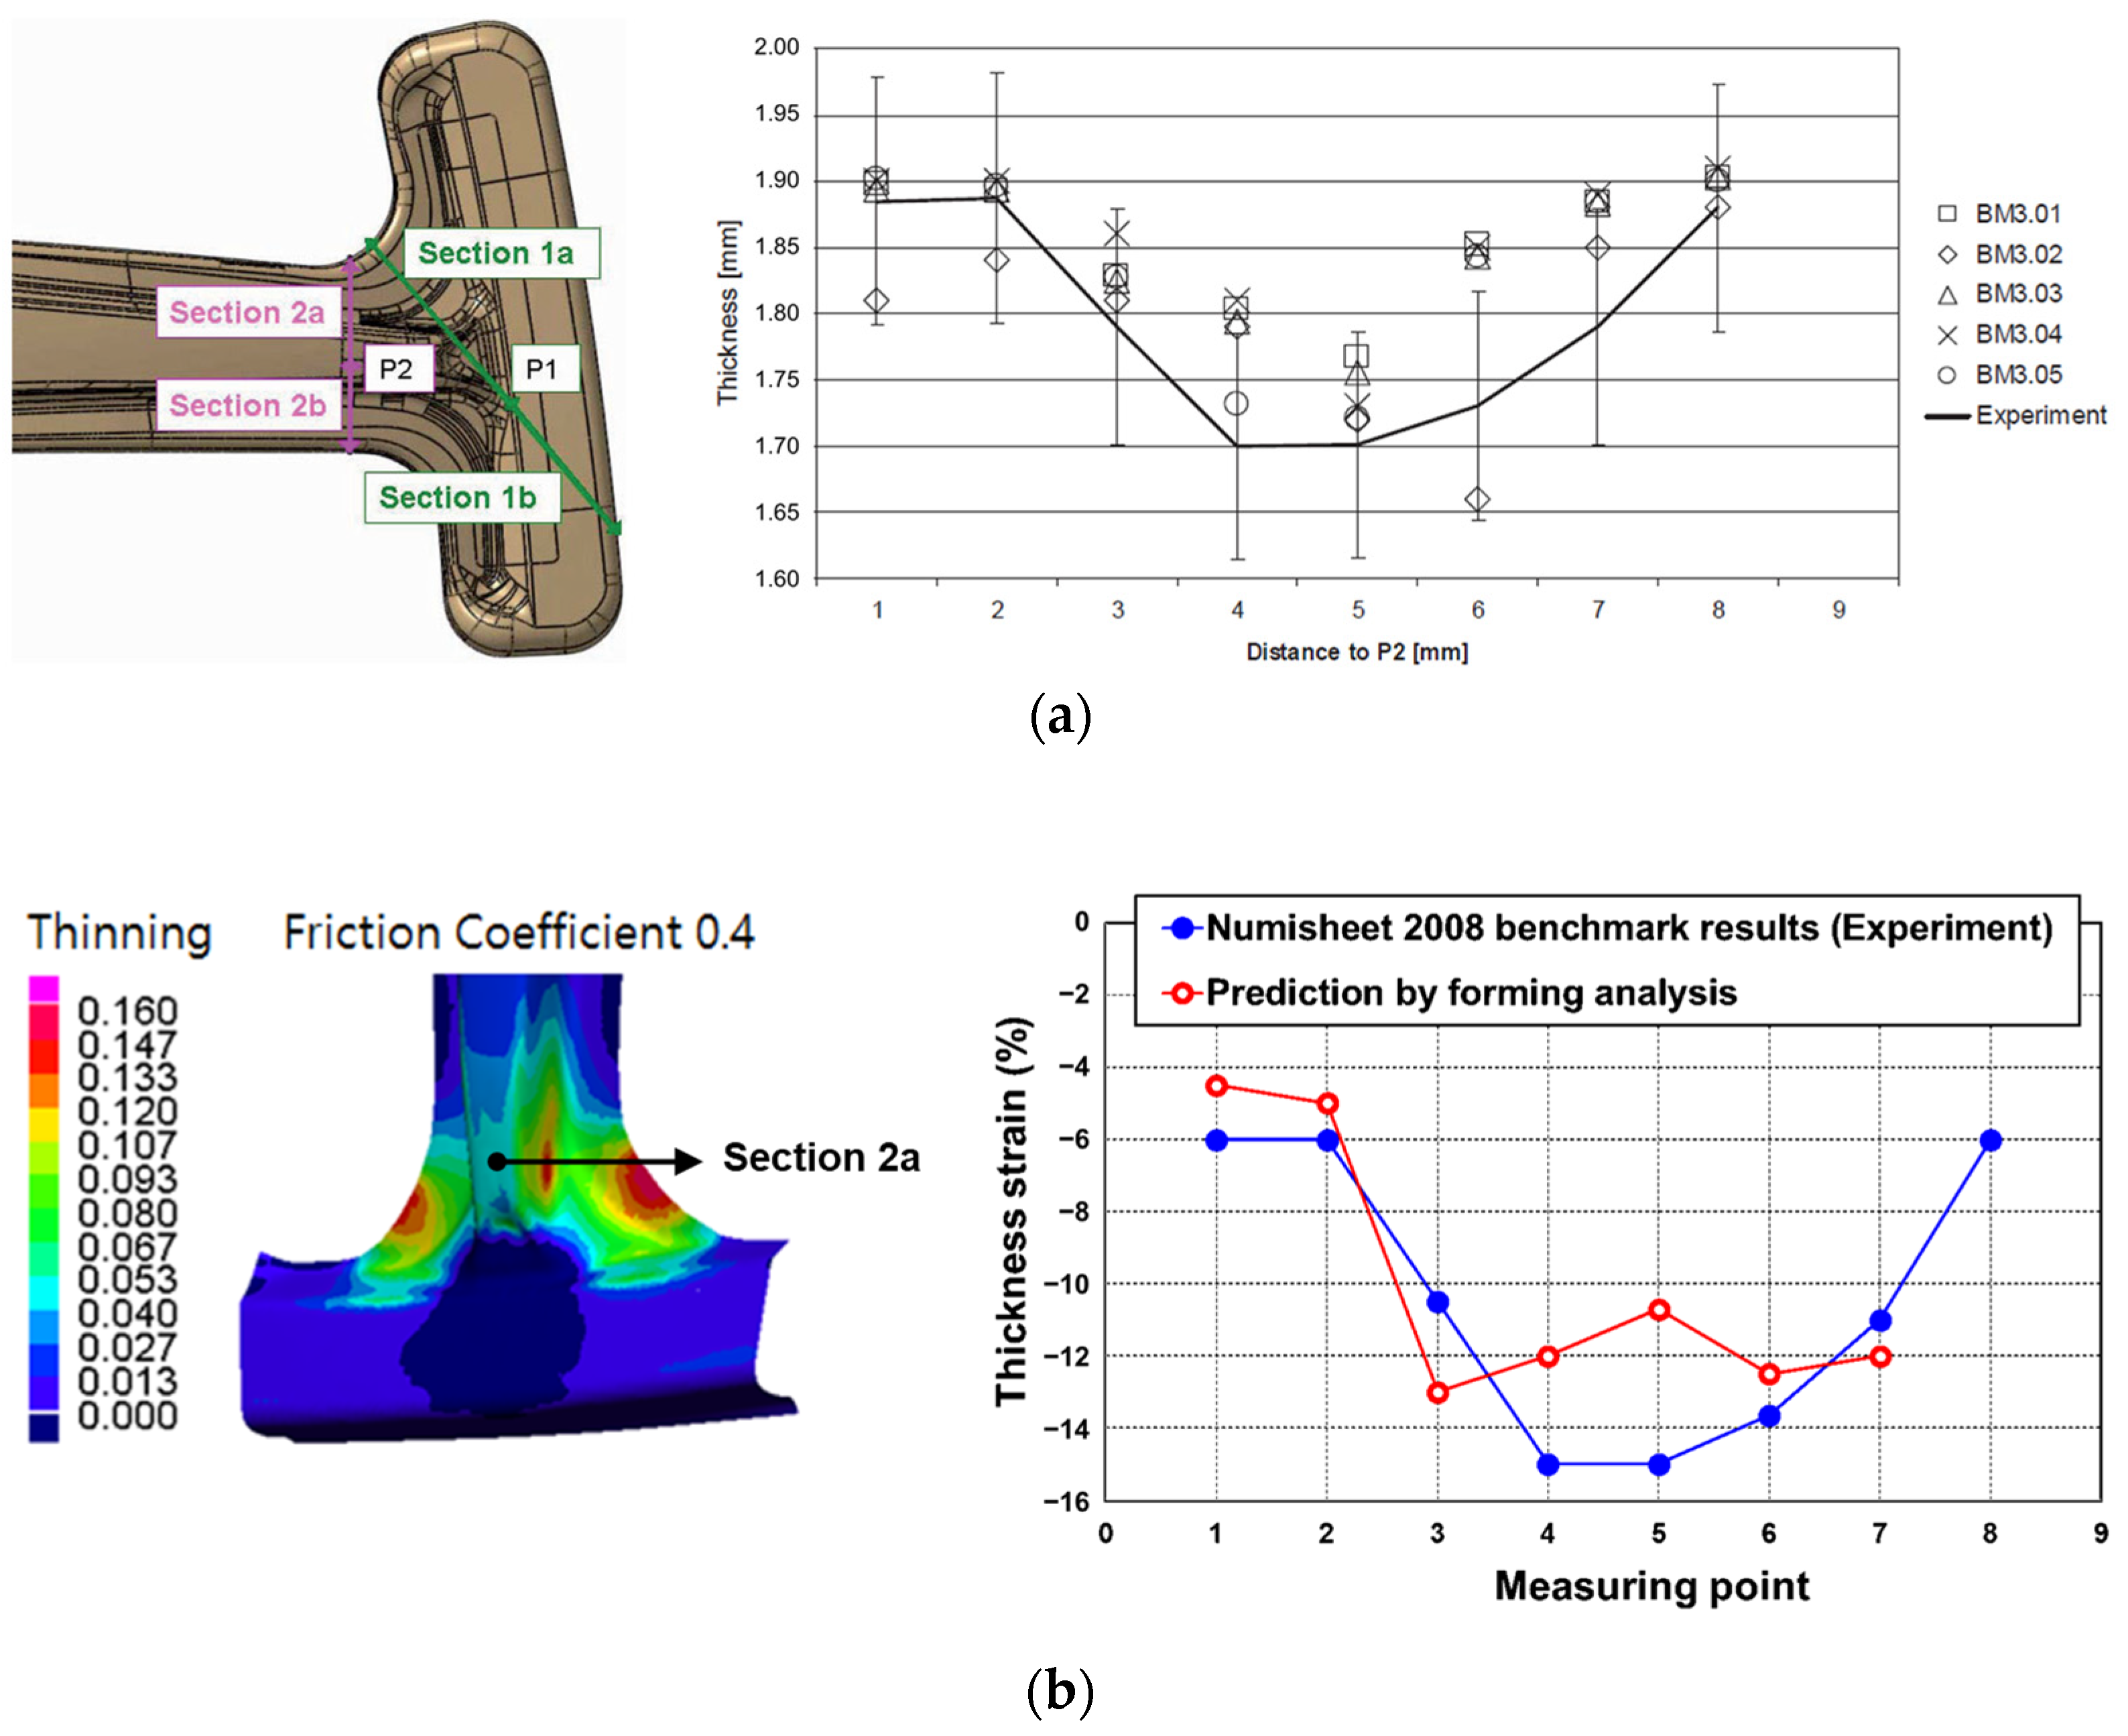
A correction has been made to Section 3, Paragraph 14: In order to evaluate the reliability of the forming analysis, the measured values of the thickness strain in Section 2a of the B-pillar presented in the Numisheet 2008 benchmark results were compared with the values predicted based on the forming analysis shown in
Figure 10. Comparing the results of the thickness strain, the measured value and the predicted value seemed to be similar to each other. Considering the complexity of the actual automotive parts, since the difference between the actual product measurement and the forming analysis prediction is acceptable, it was considered reasonable to evaluate the effect of process and material variables based on the forming analysis result.
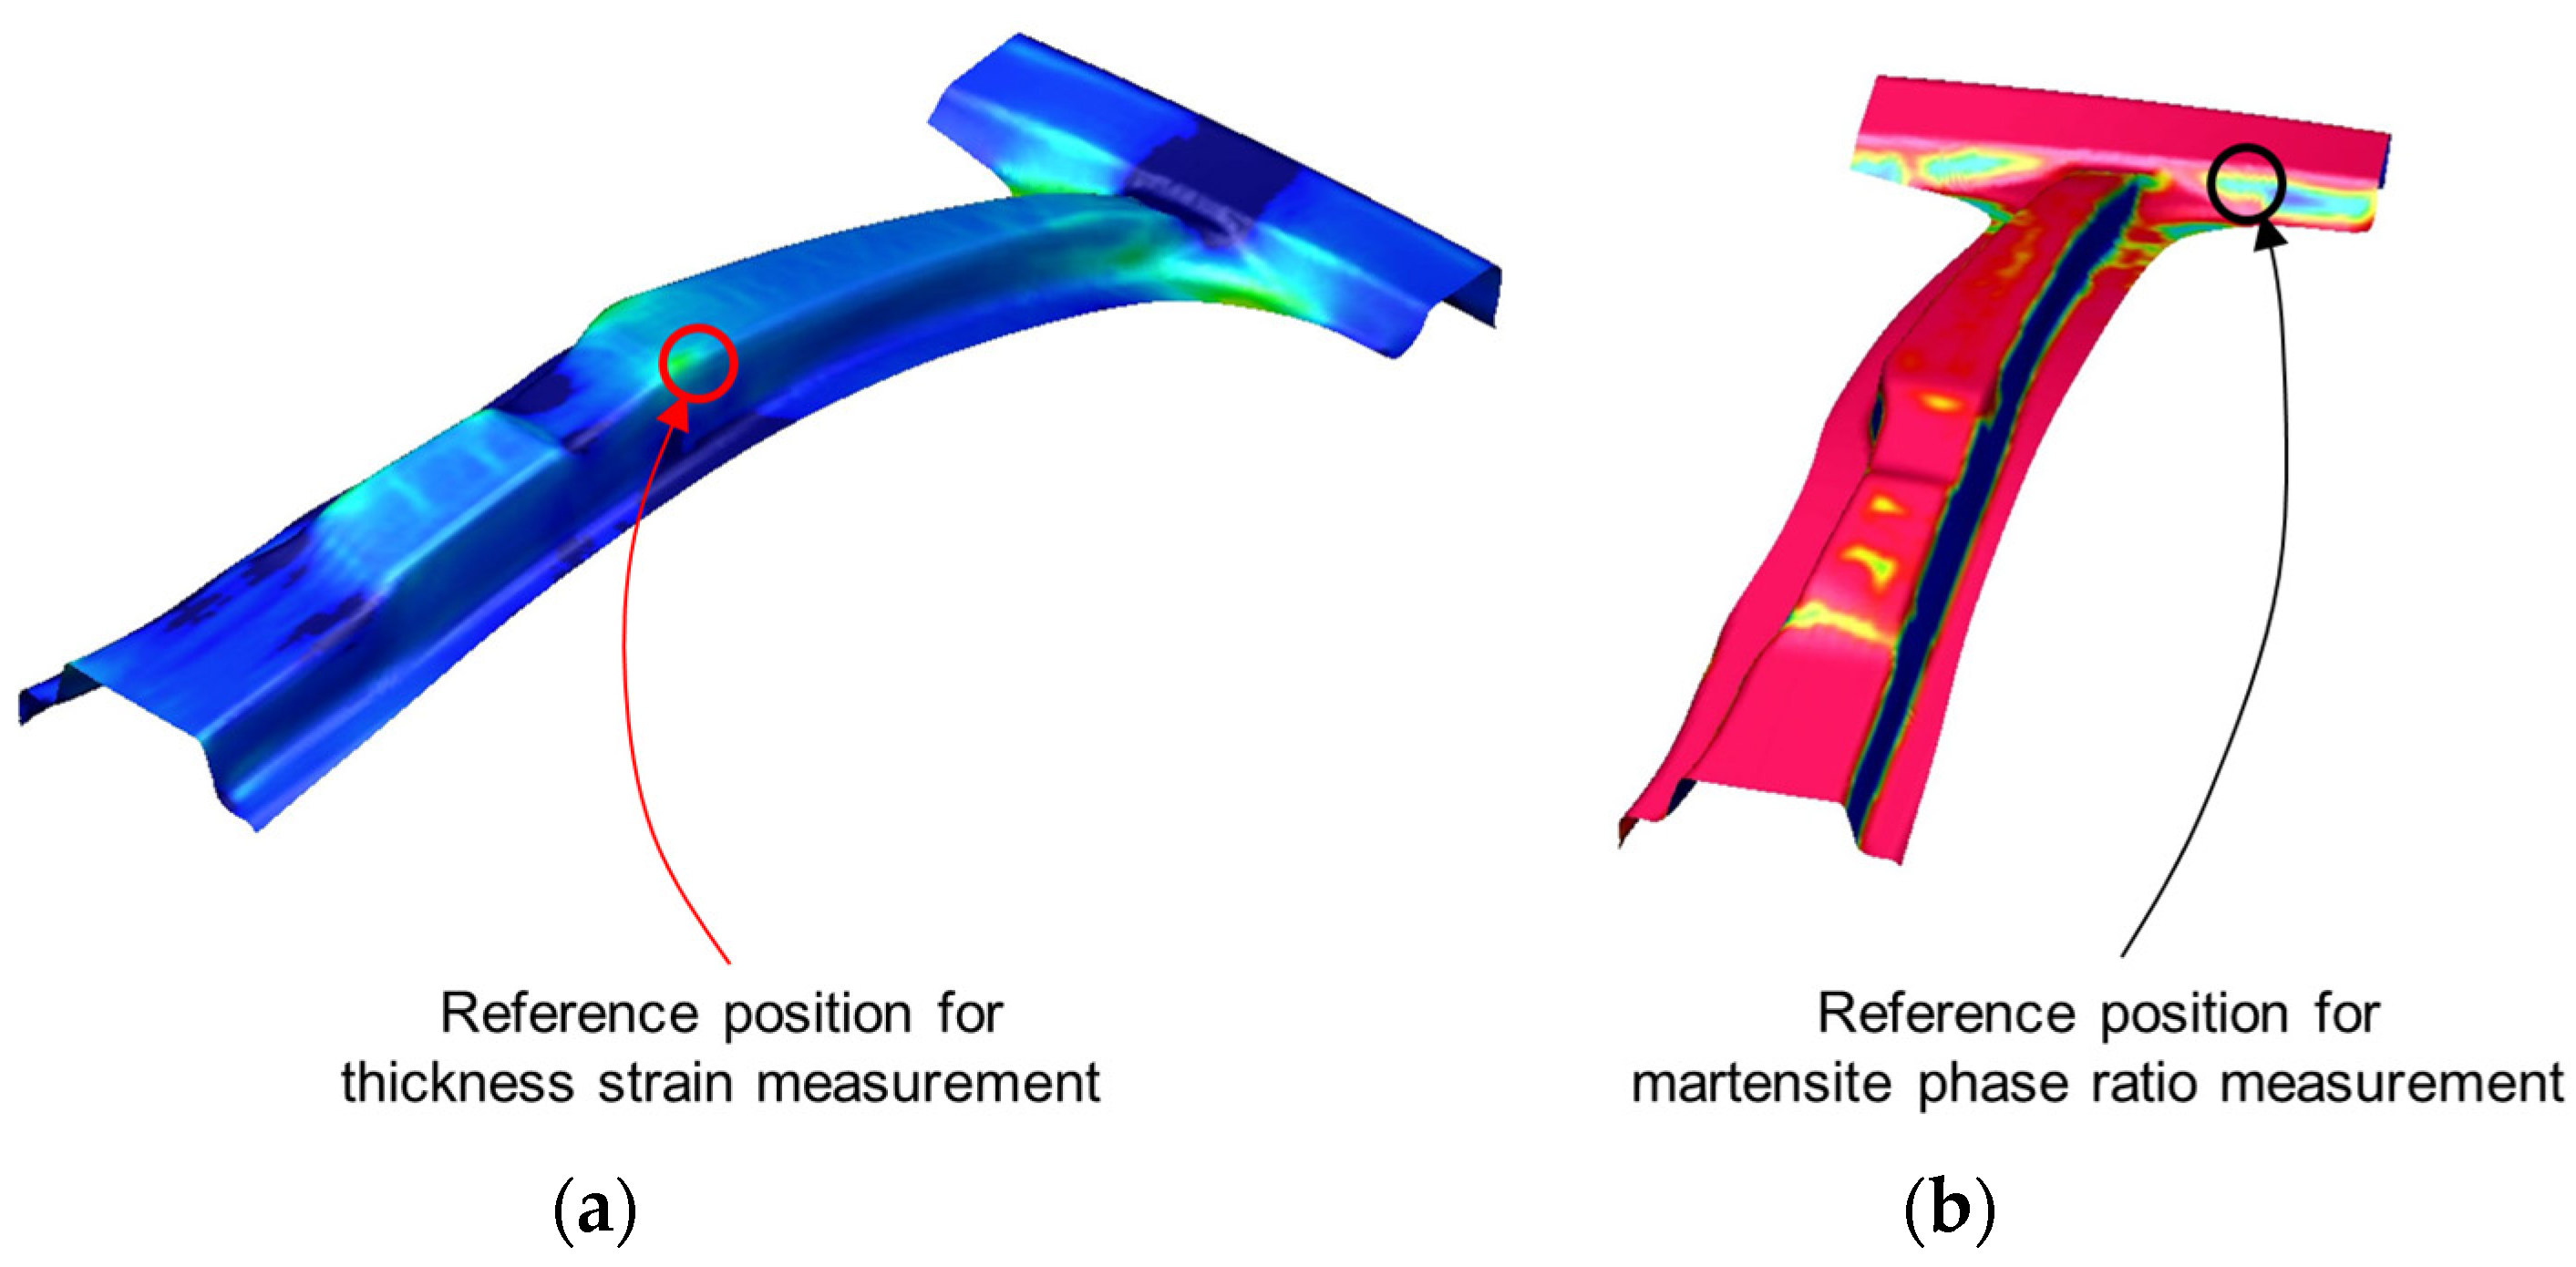
A correction has been made to Section 3, Paragraph 15: For the thickness strain of the sheet blank, a location where the deformation of the blank is large was selected. For the martensite phase ratio, a position where the martensite phase transformation does not sufficiently occur when contact with the die is insufficient in the hot stamping process was selected [10]. The final locations selected for measurement of the thickness strain and the martensite phase ratio are shown in
Figure 11.
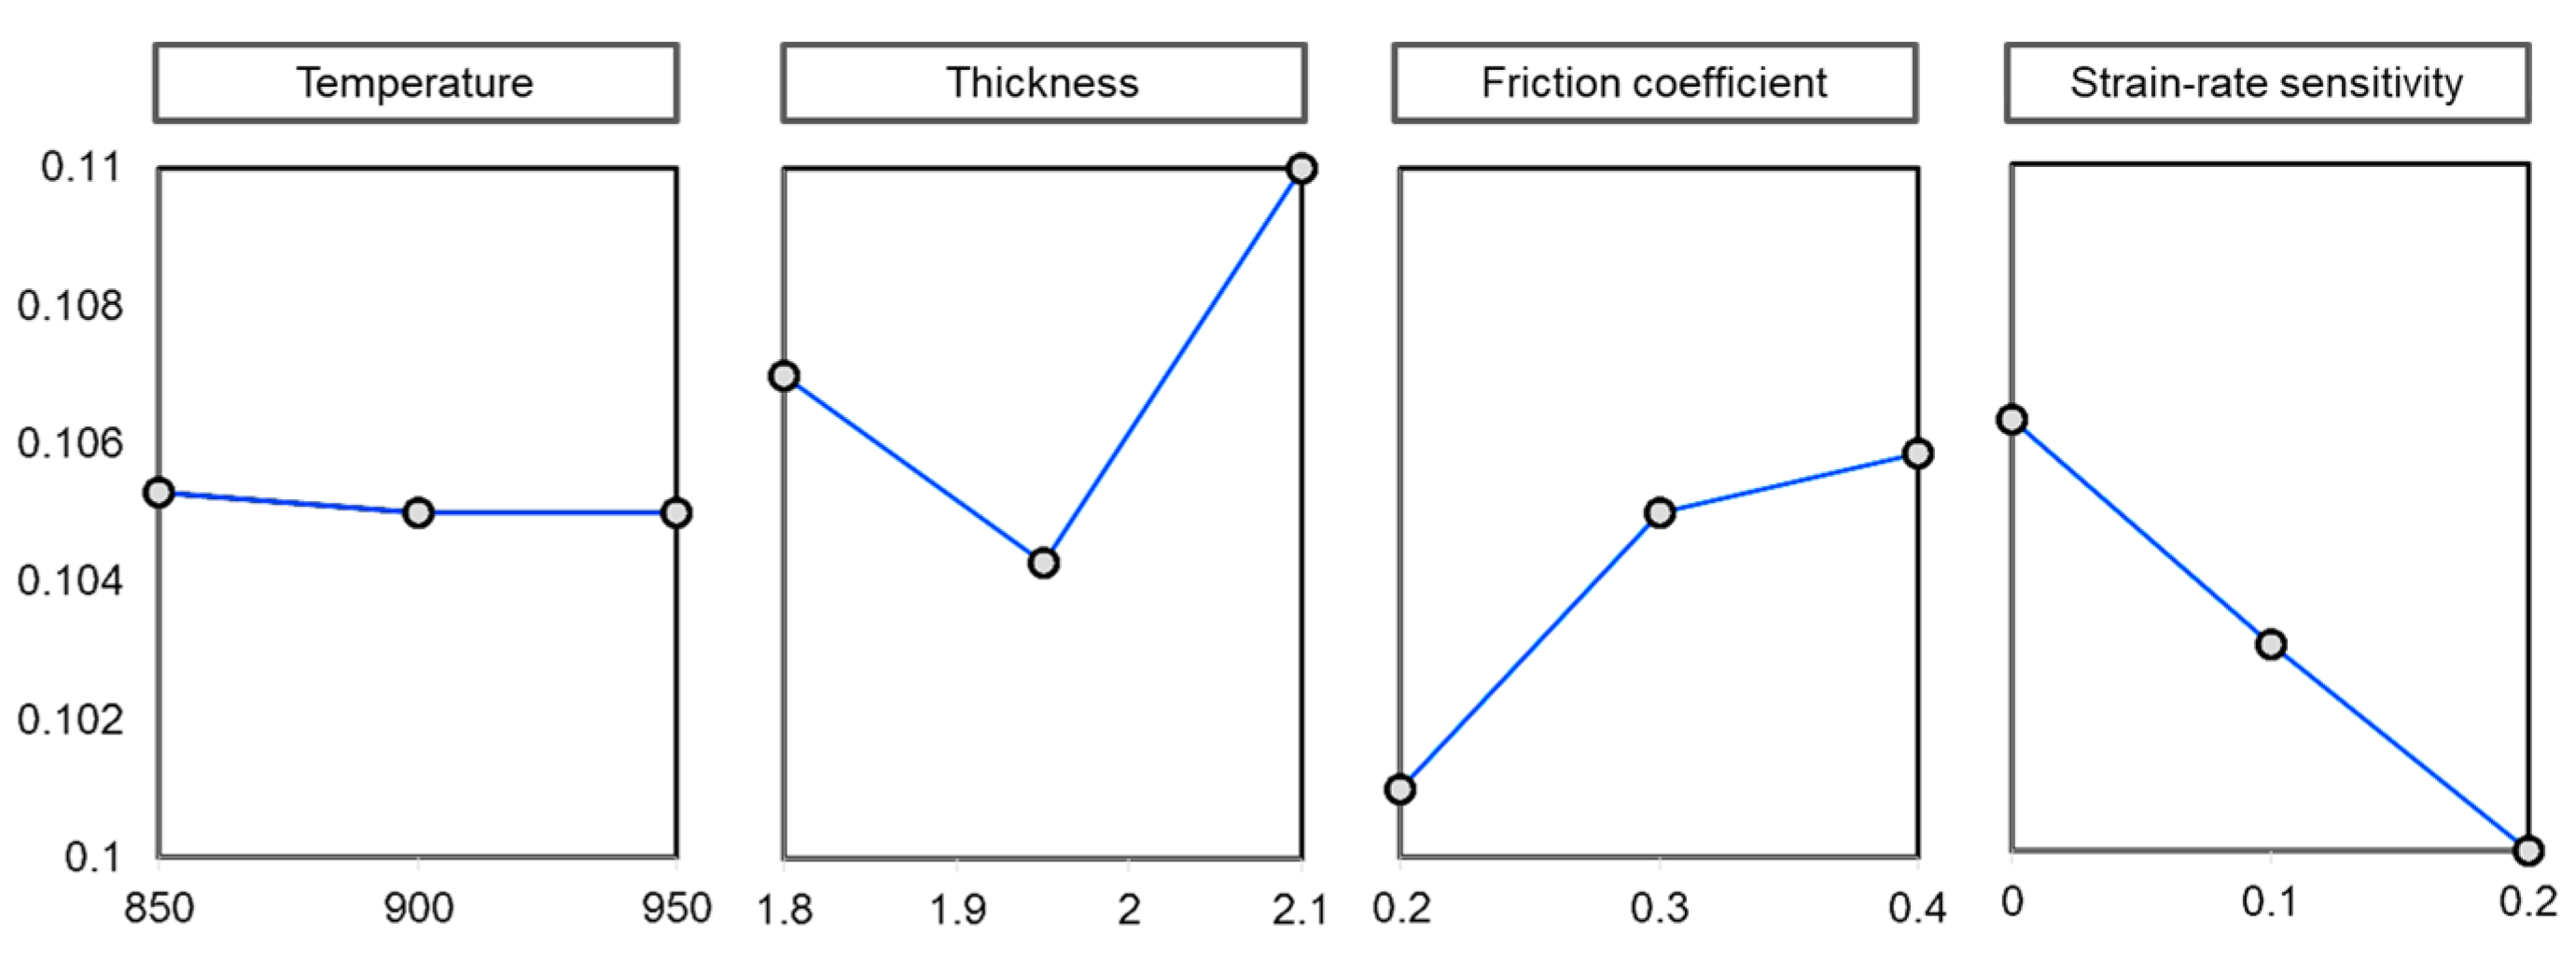
A correction has been made to Section 4.1, Paragraph 1: From
Figure 12, it can be seen that as the initial temperature of the sheet increases, the thickness strain decreases very slightly. That is, if the fracture is dependent on the thickness strain, higher temperatures appear to be slightly more beneficial in delaying the fracture.
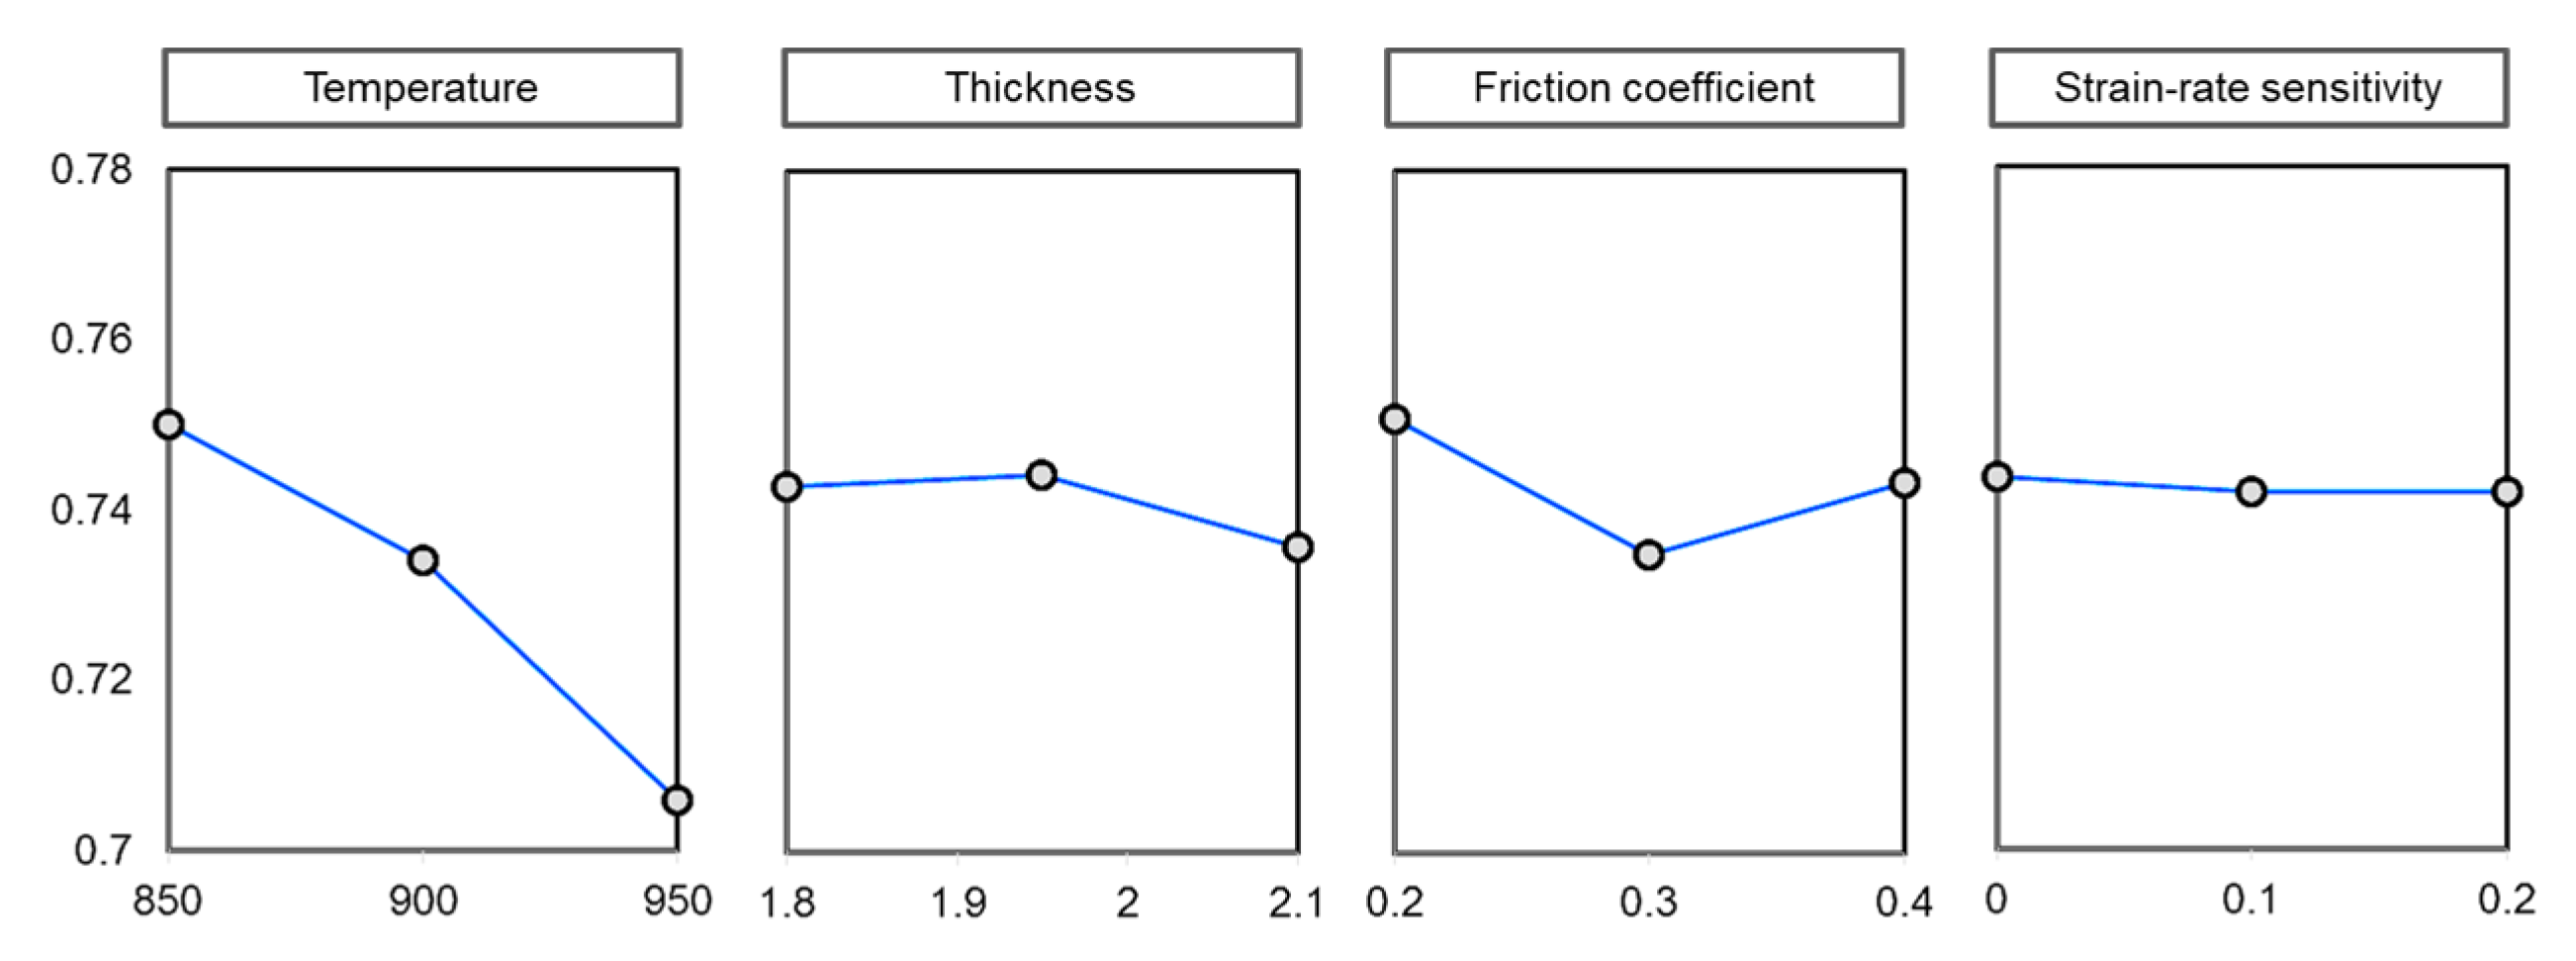
A correction has been made to Section 4.1, Paragraph 3: From
Figure 13, it can be seen that the martensite phase ratio tends to decrease as the initial temperature of the sheet increases. As a result, it was predicted that the highest martensite phase ratio could be obtained at 850 °C.
A correction has been made to Section 4.1, Paragraph 5: After the sheet is heated to a specified temperature in the furnace, some degree of cooling may occur for a period of time due to transport and waiting until hot stamping starts. Therefore, at the start of hot stamping, the temperature may be slightly lower than that mentioned in previous studies. Considering the fact that the initial temperature of sheet defined in this study means the temperature at which hot stamping starts, it can be seen that the 850 °C predicted as the optimal temperature based on the martensite phase ratio and the optimal temperature range (800–850 °C) of the previous study correspond with each other.
A correction has been made to Section 4.2, Paragraph 1: The effect of the initial thickness of the sheet on the thickness strain seems to be slightly complicated. In this case, the thickness strain of the sheet was measured instead of the fracture of the sheet. Even if the thickness strain of the sheet is the same, the actual probability of fracture may be different if the temperature of the material is different. Specifically, from the test results of the previous T-type part, it could be seen that in the case of a thick sheet, the fracture occurred at a larger drawing depth. As the result of the T-type test, the thick sheet blank has a larger heat capacity than the thin sheet blank, so cooling can proceed slowly. Thus, if the temperature of the sheet blank, which is heated to the same initial temperature and then undergoes the stamping and die quenching processes, is compared at a certain point in the process, the temperature may be higher in a thick sheet than in a thin sheet. As already mentioned in the effect of the initial temperature of the sheet, when the temperature of sheet blank is higher, the fracture drawing depth in the T-type test is larger.
A correction has been made to Section 4.2, Paragraph 3: Additionally, it seems that the martensite phase ratio decreases as the initial thickness of the sheet blank increases. The clearance of the stamping die was set to 1.95 mm in consideration of the thickness of the sheet blank. Since the thickness of the sheet decreases due to the stretching of the sheet during forming, a clearance of 1.95 mm does not interfere with the normal forming process. At this time, if the initial thickness of the sheet blank is reduced, the contact area or contact surface pressure between the stamping die and the sheet blank decreases in the forming process, which may reduce the die quenching effect. This can cause a decrease in the martensite phase ratio. However, as mentioned in the analysis of the T-type test results, the thinner the sheet, the lower the heat capacity of the sheet, which may increase the cooling rate during the stamping or die quenching process. This can cause an increase in the martensite phase ratio. That is, when the thickness of the sheet blank decreases, these two opposite effects can occur. From the results in
Figure 13, it is predicted that the martensite phase ratio will slightly increase when the thickness of the sheet blank is smaller than 1.95 mm. That is, in the thickness range of 1.8–2.1 mm, it can be inferred that the increase in the cooling rate due to the decrease in the thickness is superior to the decrease in the die quenching effect due to the decrease in the contact area or the contact surface pressure. However, the values of the martensite phase ratio for the thicknesses of 1.8 mm and 2.1 mm are 0.743 and 0.736, respectively, and there was no significant difference.
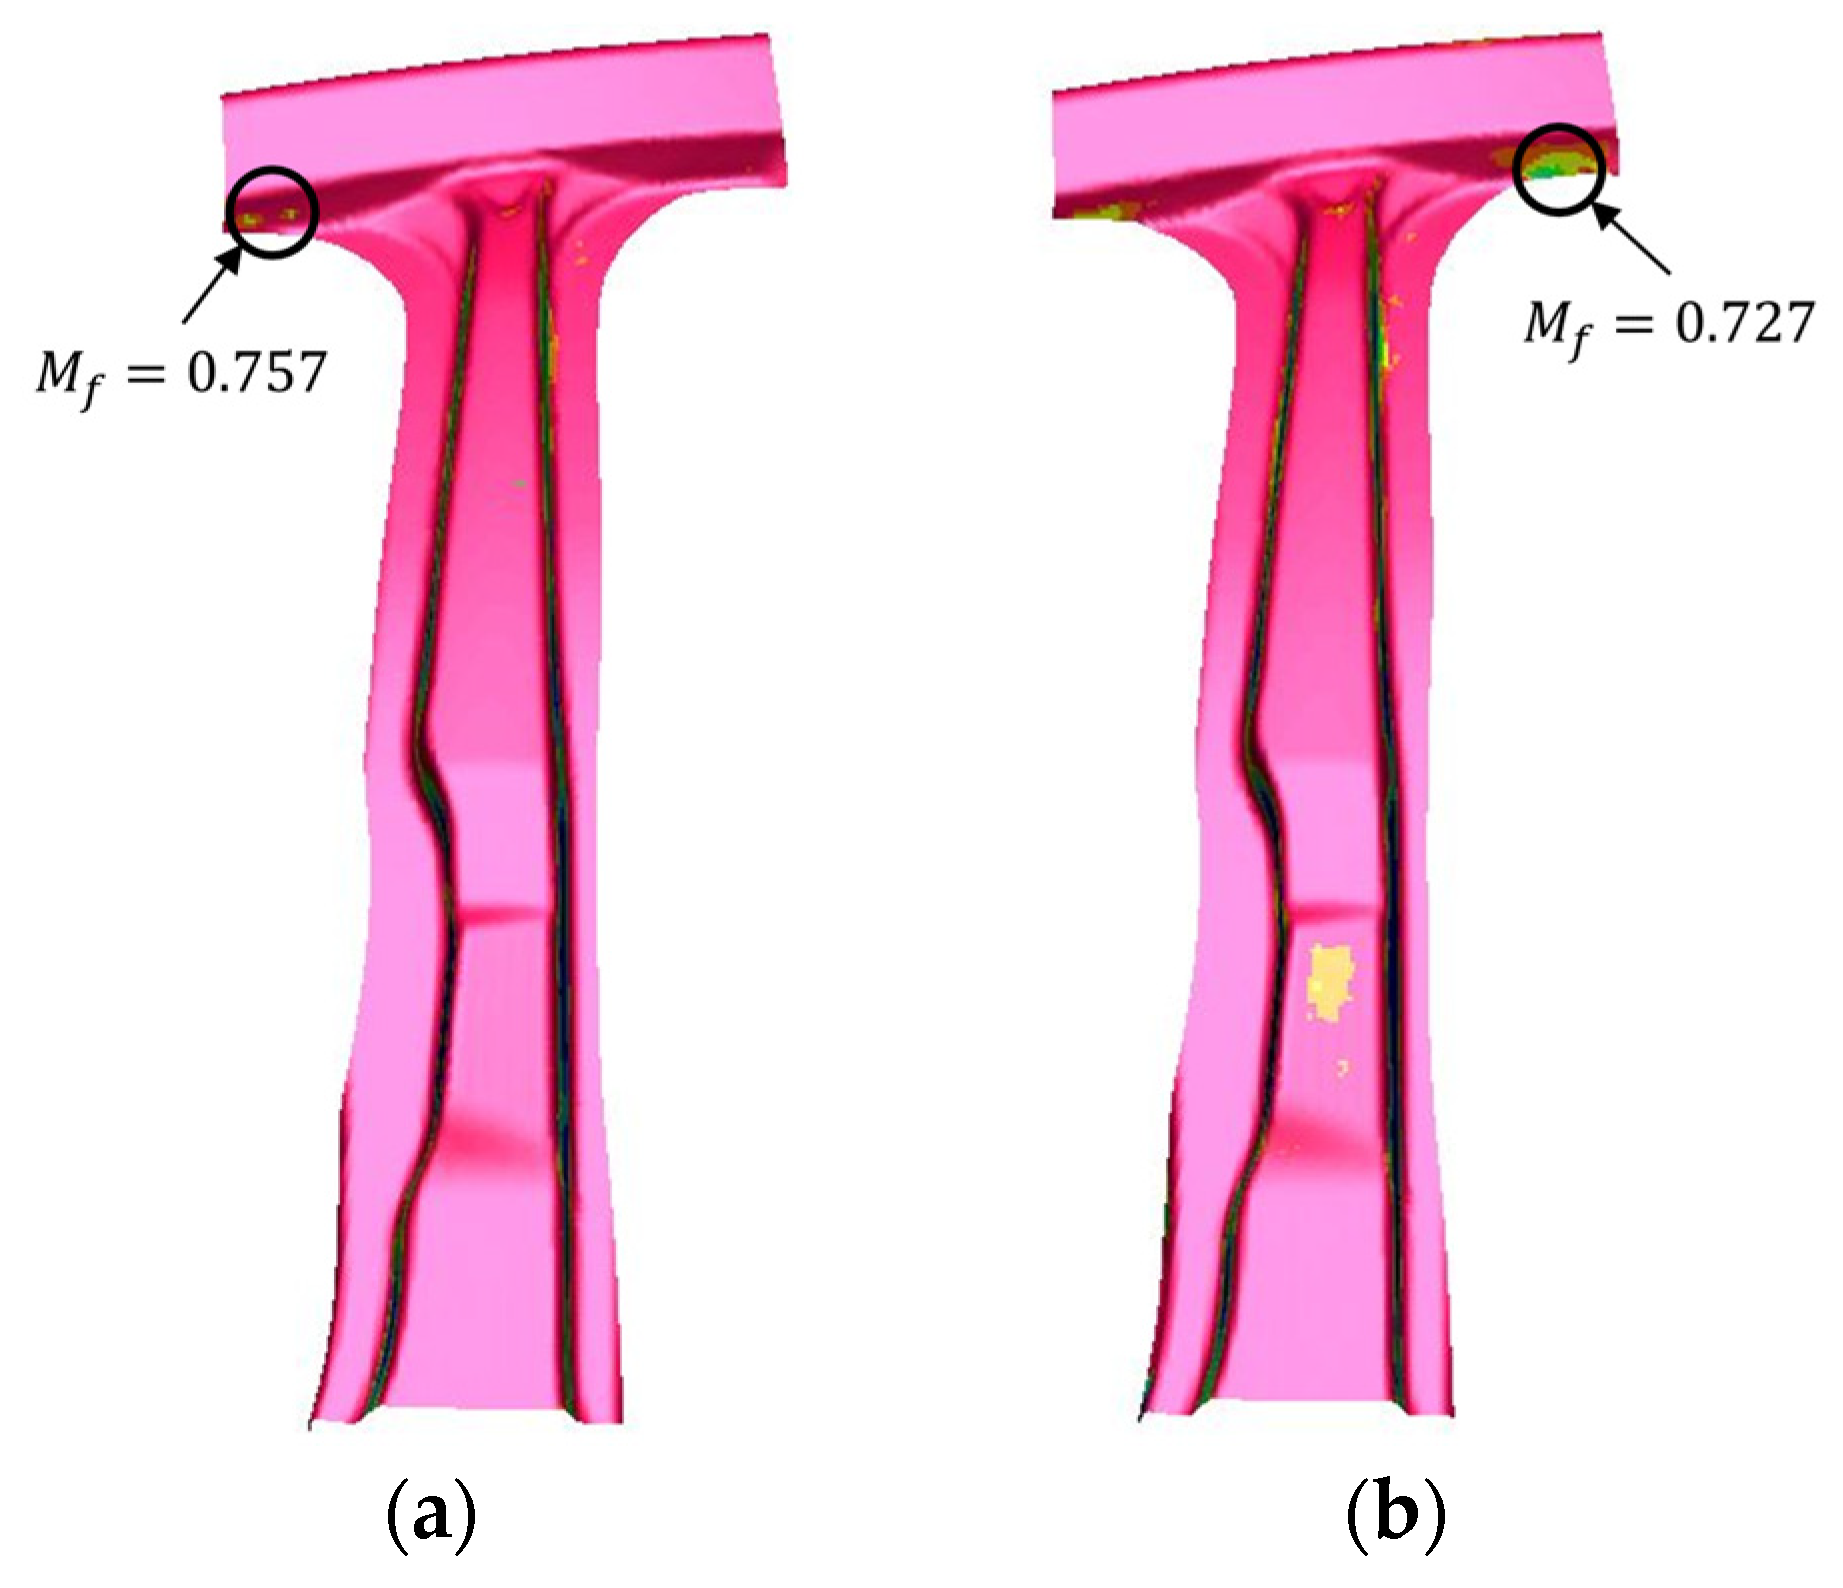
A correction has been made to Section 4.2, Paragraph 4: When the martensite phase ratio was measured at all positions of the B-pillar part, it was found that the position with the minimum martensite phase ratio changed slightly according to the change in the thickness of the sheet blank. For two B-pillar parts formed using sheet blanks of two thicknesses, 1.8 mm and 2.1 mm, the position and minimum value of the martensite phase ratio at the moment of 30 s after stamping and die quenching were compared in
Figure 14. Although the difference is insignificant, it can be seen that the minimum value of the martensite phase ratio on the entire area of the part is slightly larger for the part from thickness of 1.8 mm than for the part from thickness of 2.1 mm.
A correction has been made to Section 4.3, Paragraph 4: On the other hand, unlike the large effect on the thickness strain, the effect of the friction coefficient on the martensite phase ratio was found to be small.
A correction has been made to Acknowledgments: We would like to acknowledge Hyundai Steel for financial support for this investigation.
The authors apologize for any inconvenience caused and state that the scientific conclusions are unaffected. The original article has been updated.


