
Modeling of Diffusion-Controlled Crystallization Kinetics in Al-Cu-Zr Metallic Glass


Abstract
:1. Introduction
2. Modeling Methodology
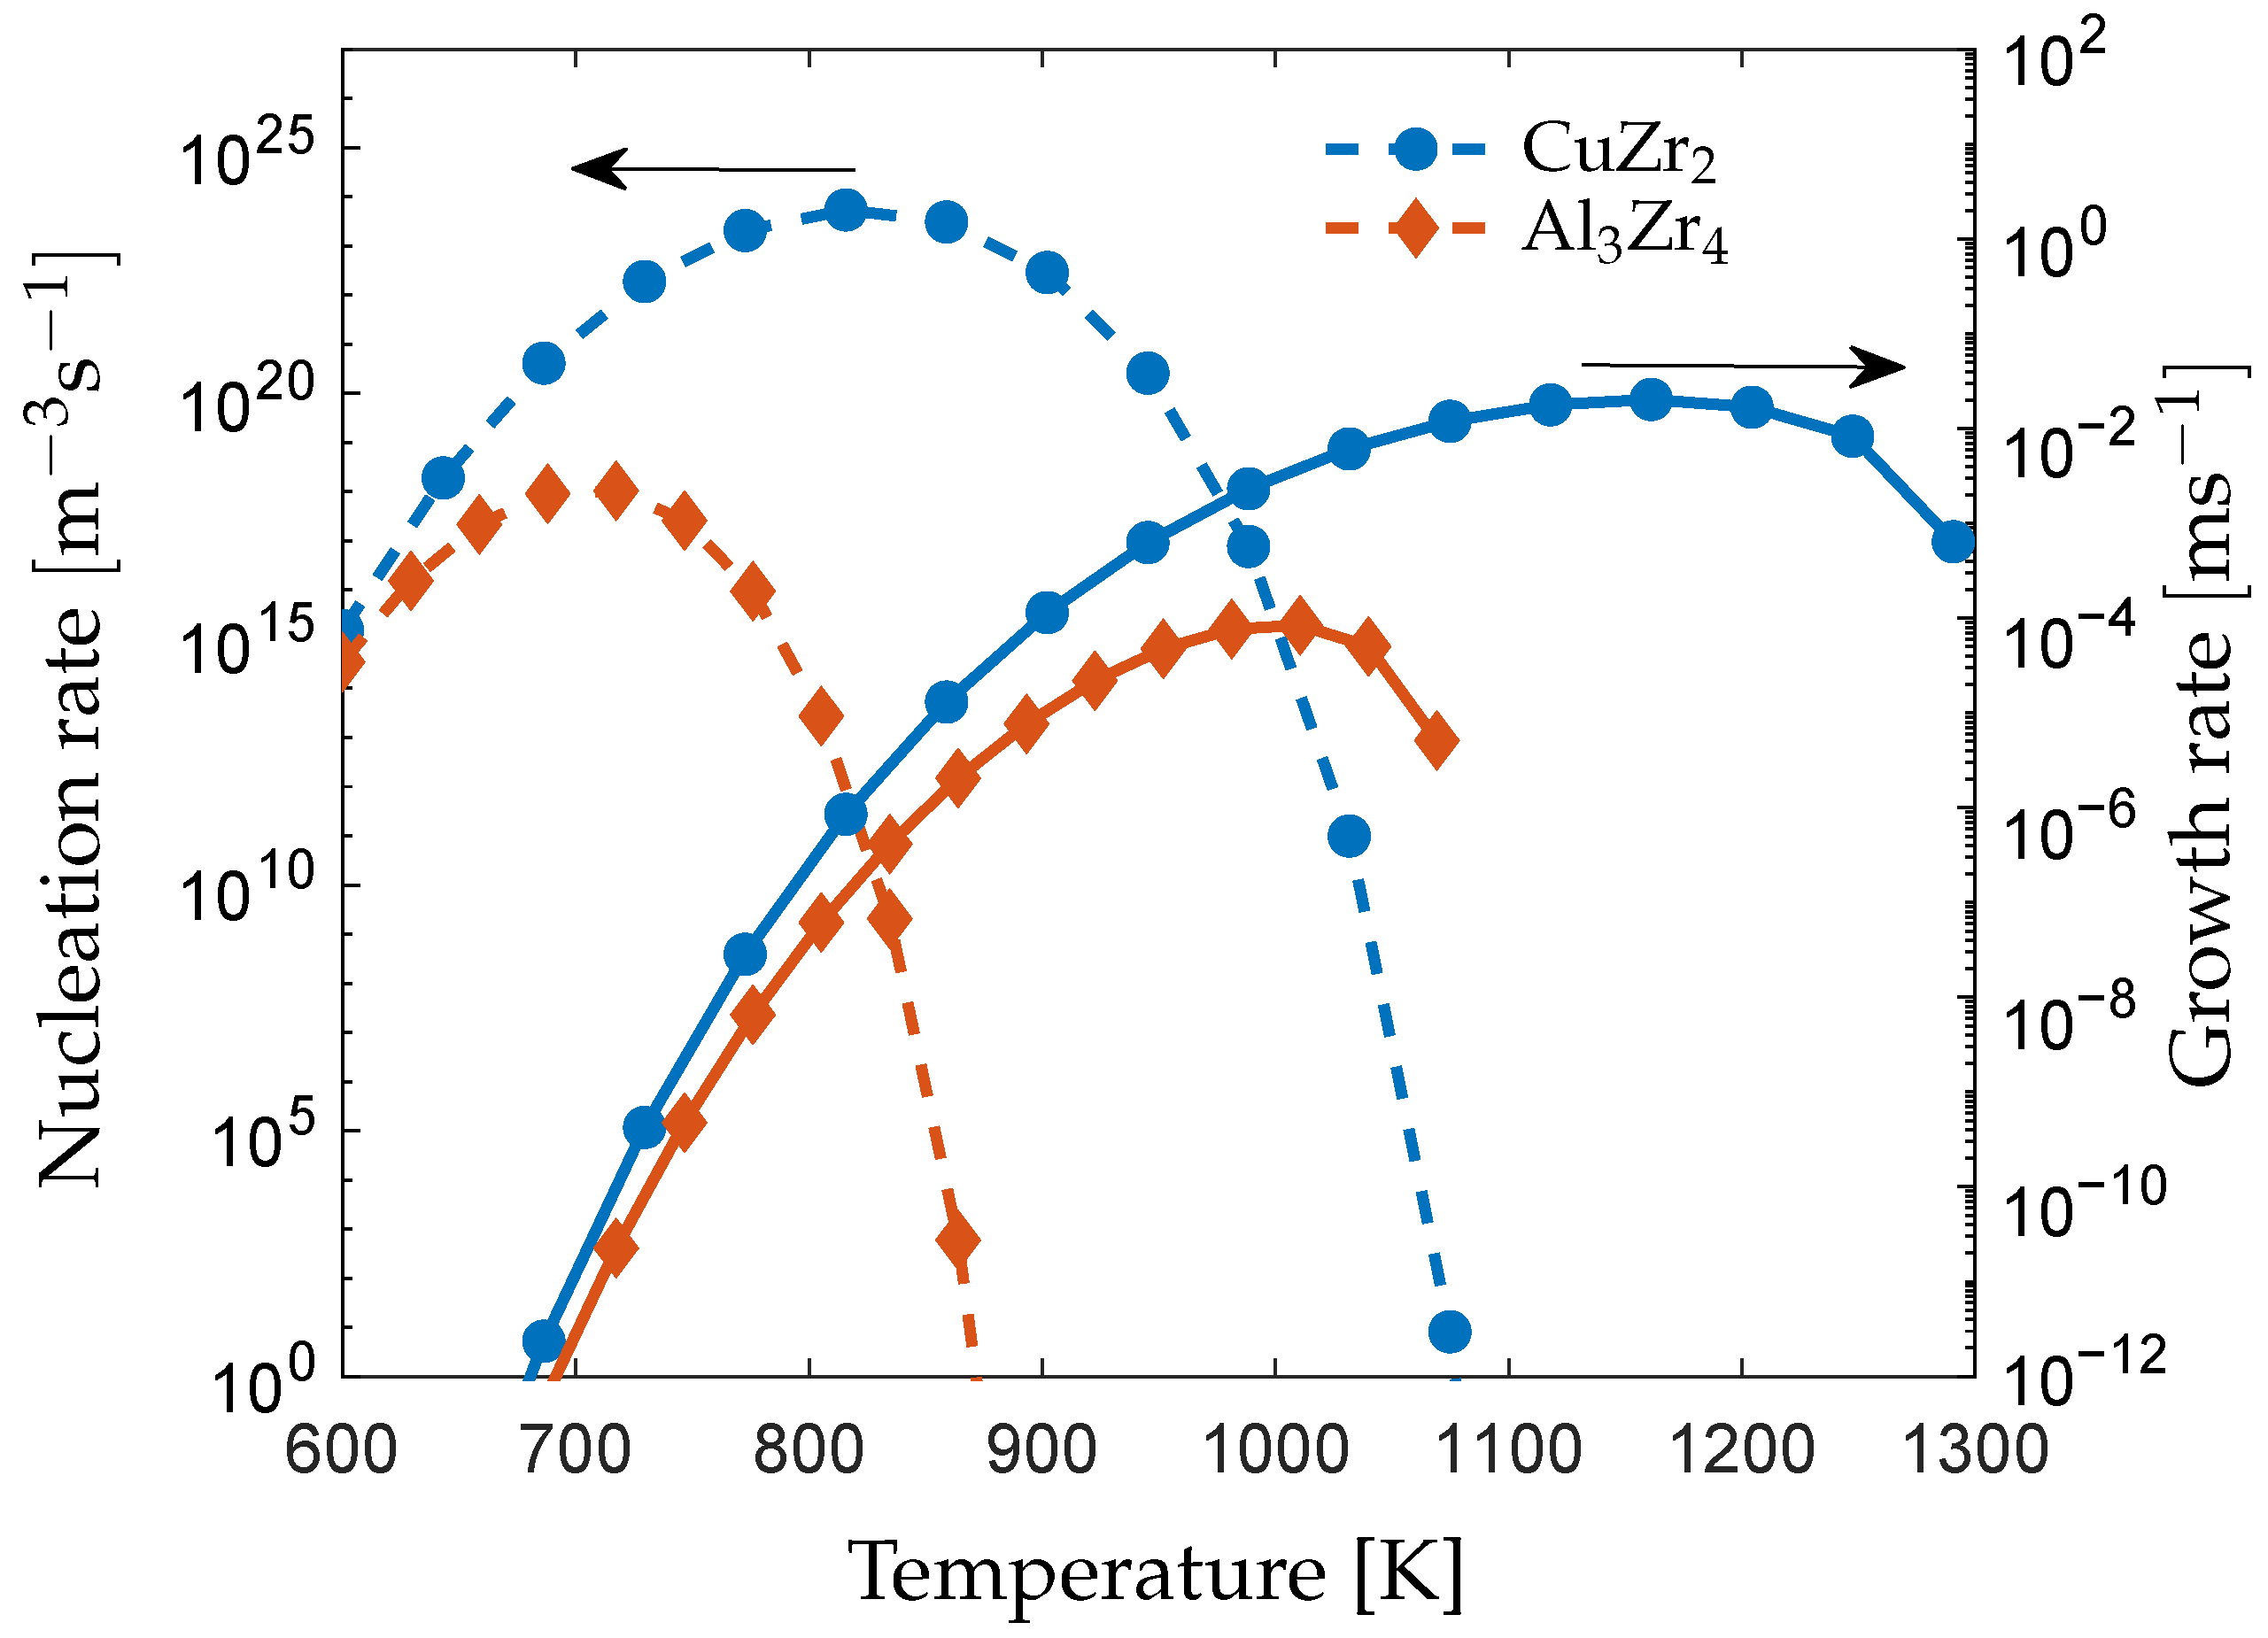
2.1. Nucleation
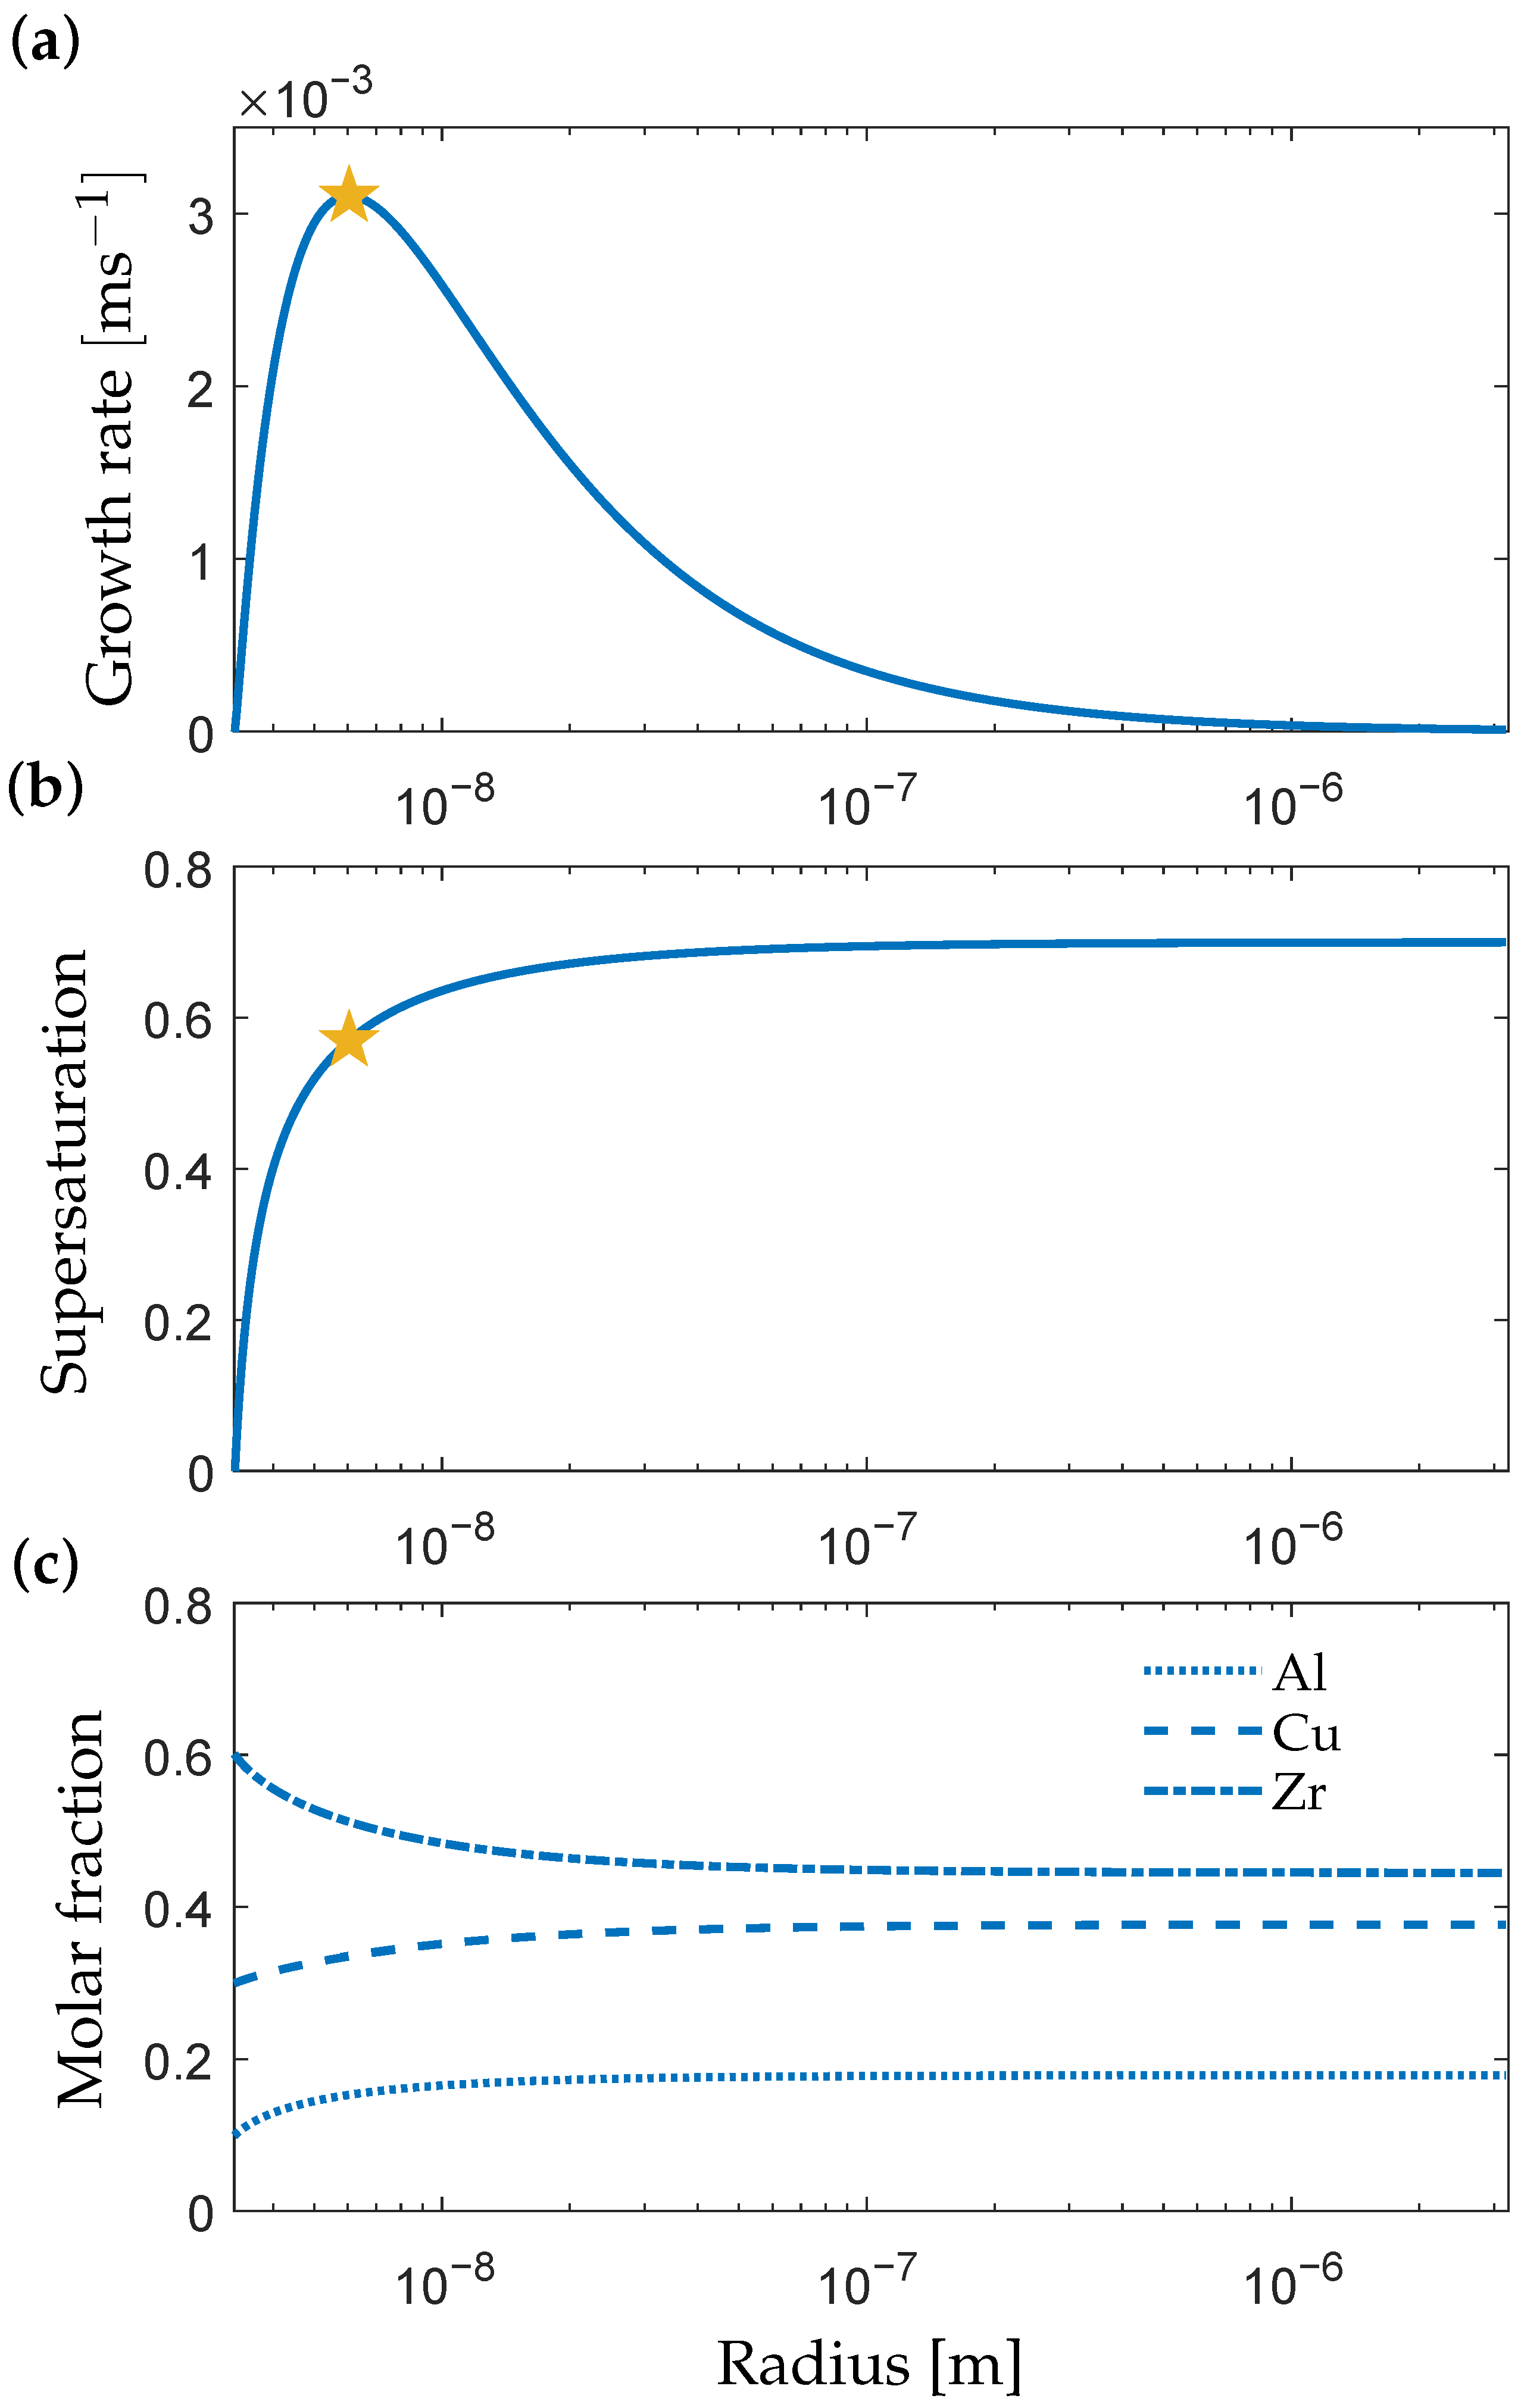
2.2. Growth
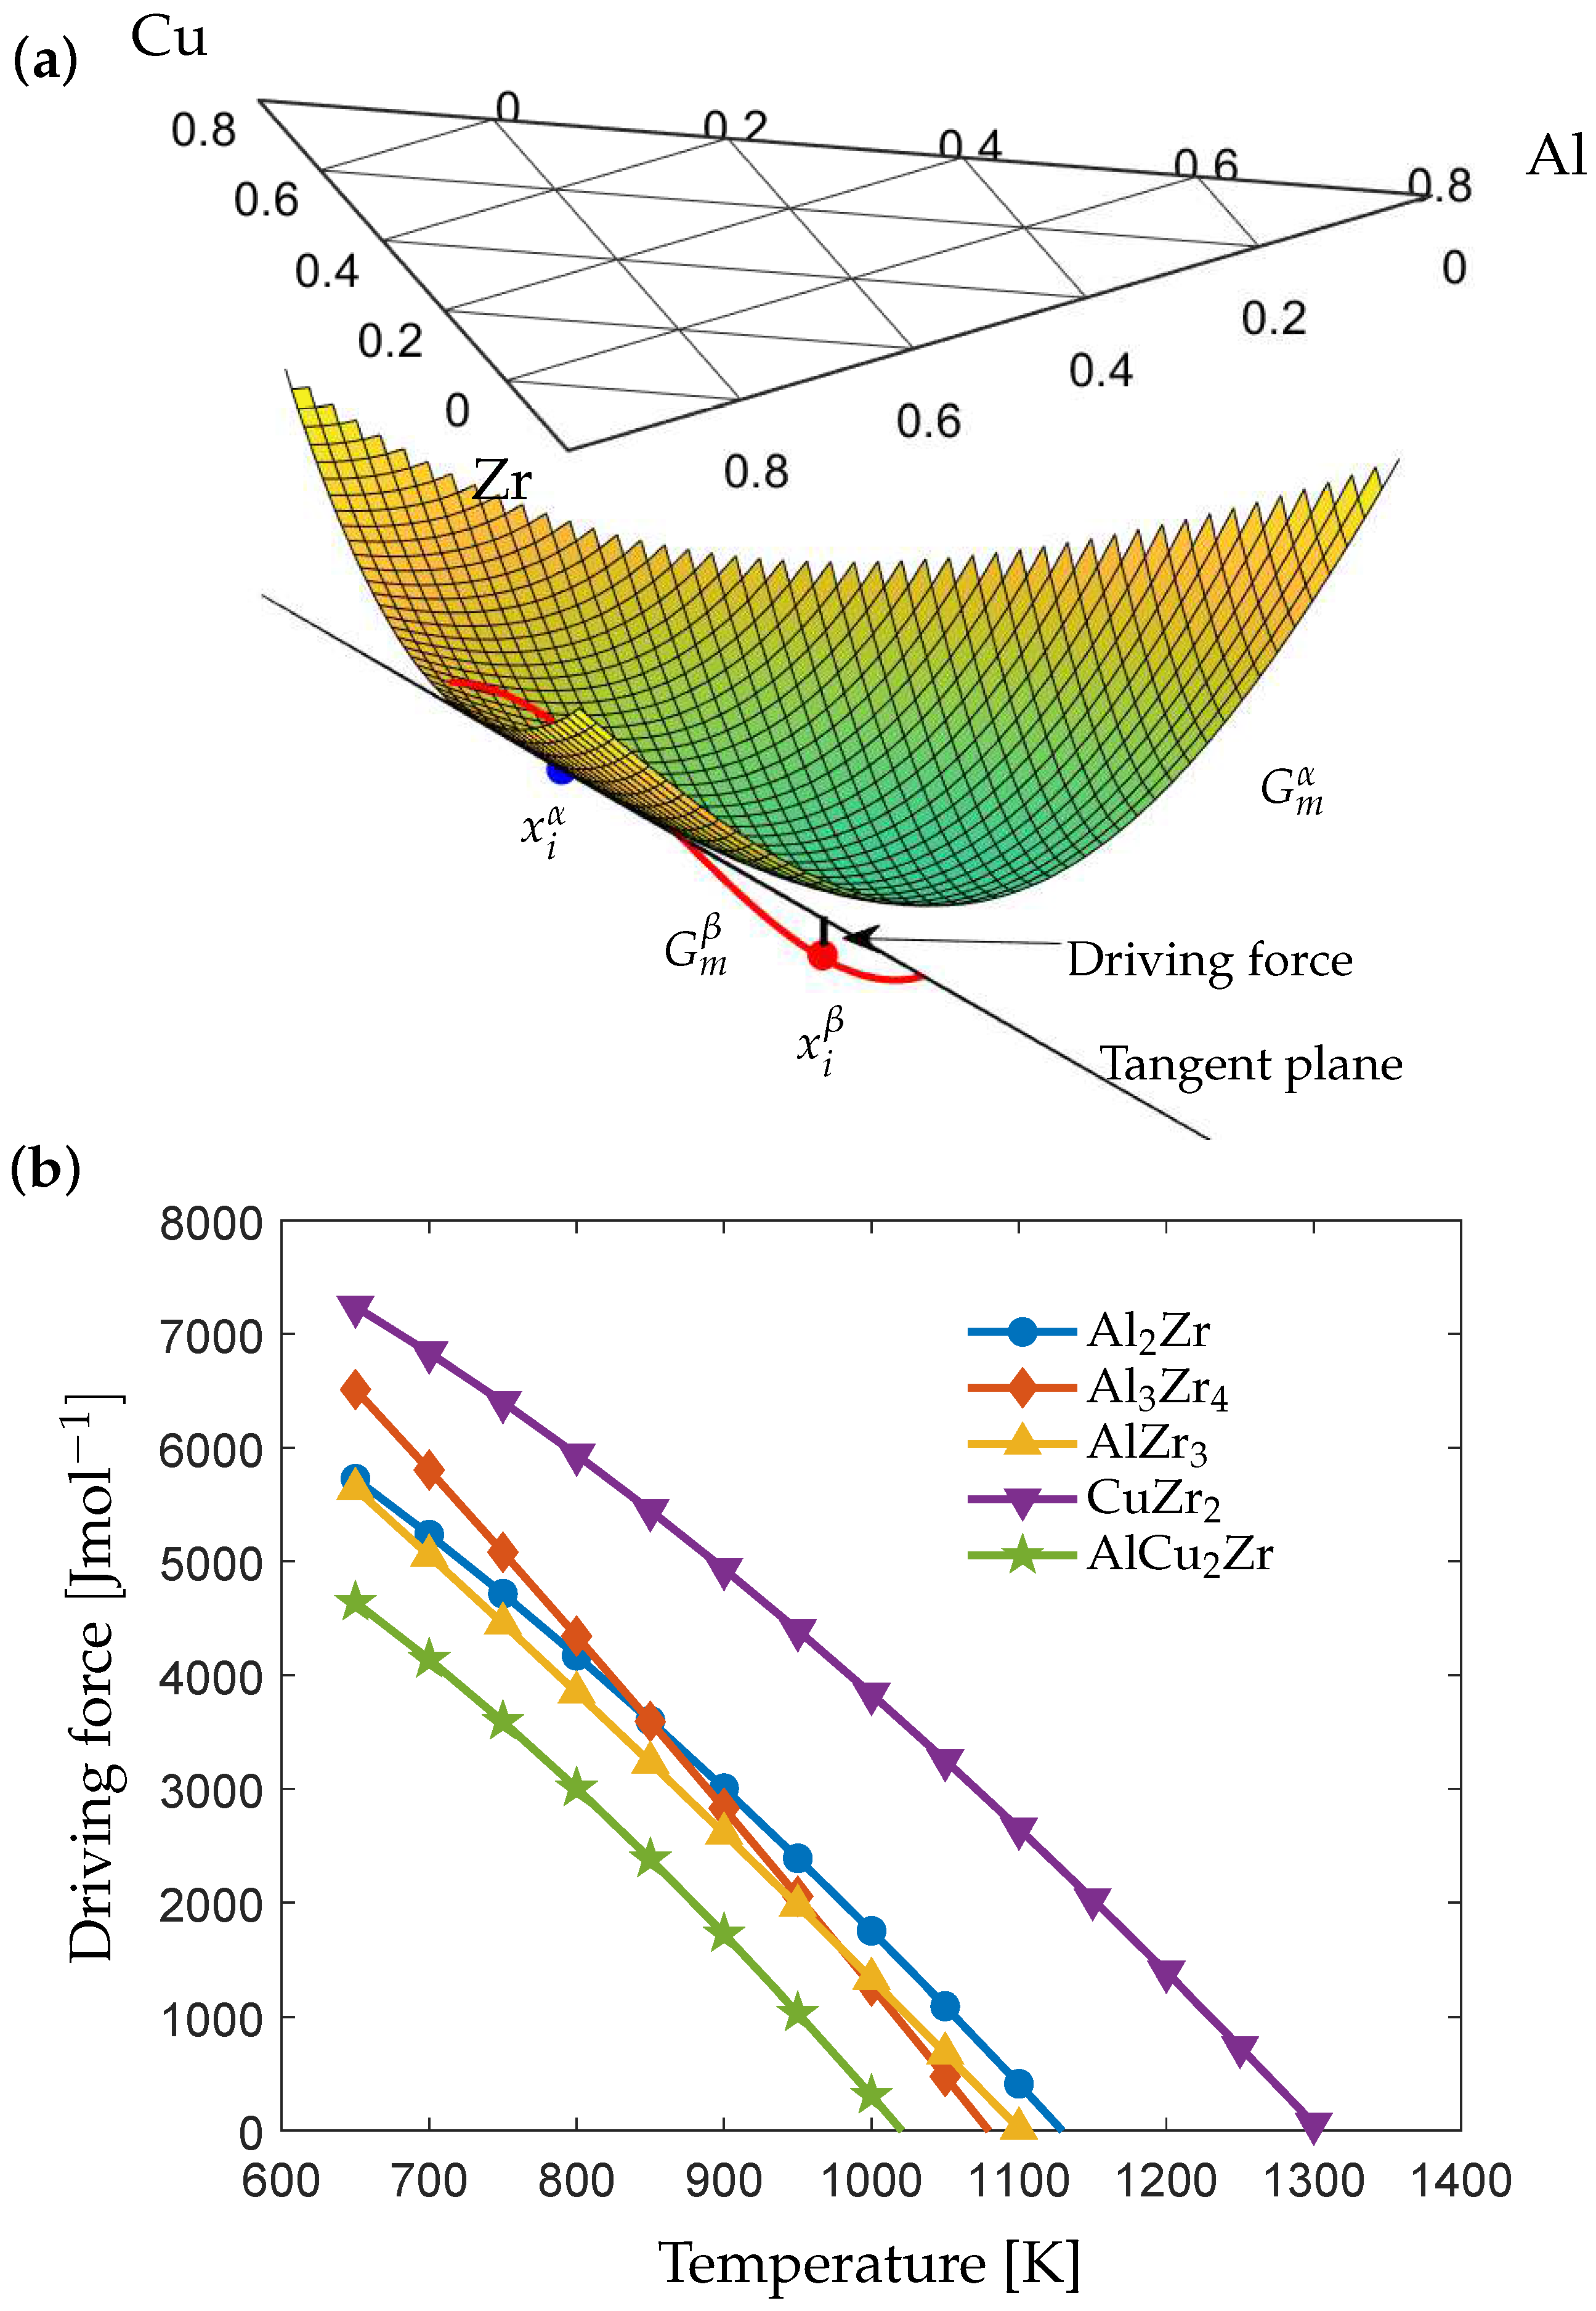
2.3. Thermodynamics
Interfacial Energy
2.4. Numerical Scheme
3. Results and Discussions
3.1. Nucleation and Growth Rates
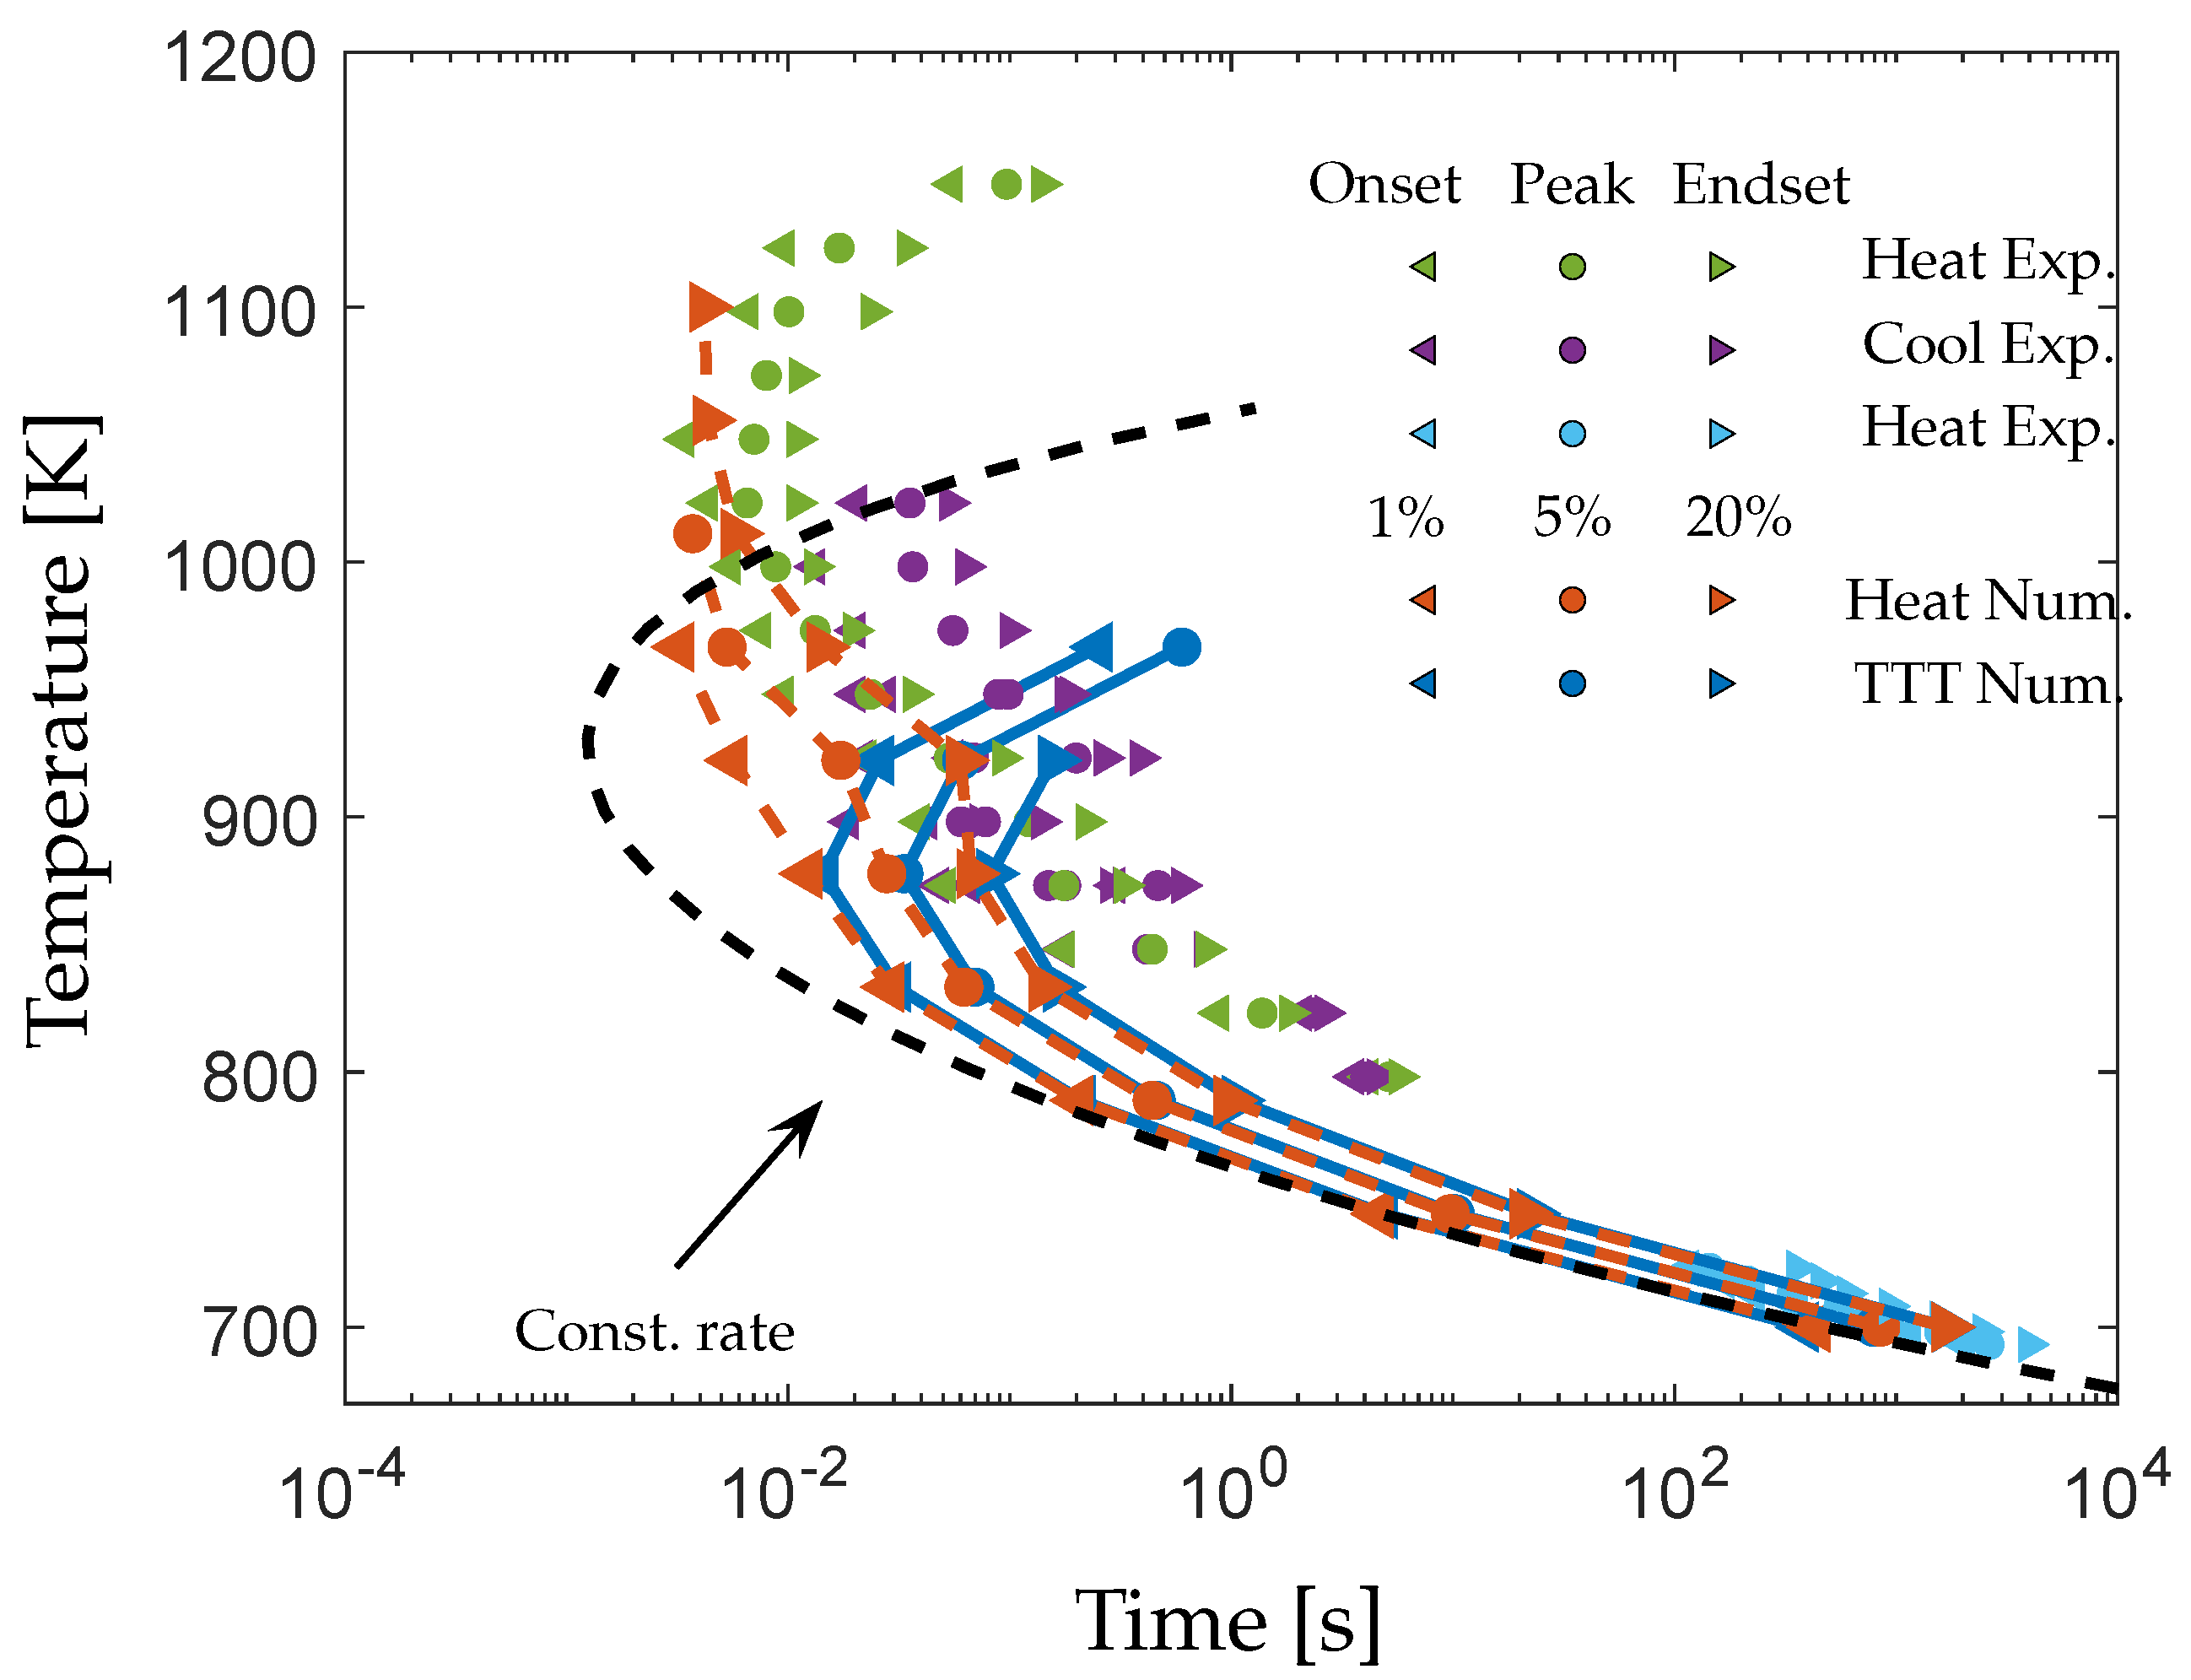
3.2. Predicted Transformation Diagrams
4. Conclusions
Author Contributions
Funding
Institutional Review Board Statement
Informed Consent Statement
Data Availability Statement
Conflicts of Interest
Abbreviations
| MG | Metallic glass |
| CALPHAD | Computer Coupling of Phase Diagrams and Thermochemistry |
| CNT | Classical nucleation theory |
| TTT | Time temperature transformation |
| CHT | Continuous heating transformation |
| CCT | Continuous cooling transformation |
| NKW | Numerical Kampmann–Wagner |
| DSC | Differential scanning calorimetry |
References
- Suryanarayana, C.; Inoue, A. Bulk Metallic Glasses, 1st ed.; CRC Press: Boca Raton, FL, USA, 2011. [Google Scholar]
- Qiao, J.; Jia, H.; Liaw, P.K. Metallic glass matrix composites. Mater. Sci. Eng. R Rep. 2016, 100, 1–69. [Google Scholar] [CrossRef] [Green Version]
- Gheiratmand, T.; Hosseini, H.R. Finemet nanocrystalline soft magnetic alloy: Investigation of glass forming ability, crystallization mechanism, production techniques, magnetic softness and the effect of replacing the main constituents by other elements. J. Magn. Magn. Mater. 2016, 408, 177–192. [Google Scholar] [CrossRef]
- Li, F.C.; Liu, T.; Zhang, J.Y.; Shuang, S.; Wang, Q.; Wang, A.D.; Wang, J.G.; Yang, Y. Amorphous–nanocrystalline alloys: Fabrication, properties, and applications. Mater. Today Adv. 2019, 4, 100027. [Google Scholar] [CrossRef]
- Inoue, A.; Fan, C.; Saida, J.; Zhang, T. High-strength Zr-based bulk amorphous alloys containing nanocrystalline and nanoquasicrystalline particles. Sci. Technol. Adv. Mater. 2000, 1, 73–86. [Google Scholar] [CrossRef]
- Zhang, Q.S.; Zhang, W.; Xie, G.Q.; Louzguine-Luzgin, D.V.; Inoue, A. Stable flowing of localized shear bands in soft bulk metallic glasses. Acta Mater. 2010, 58, 904–909. [Google Scholar] [CrossRef]
- Uhlmann, D.R. A Kinetic Treatment of Glass Formation. J. Non-Cryst. Solids 1972, 7, 337–348. [Google Scholar] [CrossRef]
- Morris, D.G. Glass formation and crystallisation in NiSiB alloys-I. Glass formation-test of the “avoidance of crystallisation” approach. Acta Metall. 1983, 31, 1479–1489. [Google Scholar] [CrossRef]
- Gránásy, L. Quantitative analysis of the classical nucleation theory on glass- forming alloys. J. Non-Cryst. Solids 1993, 158, 514–518. [Google Scholar] [CrossRef]
- Thompson, C.V.; Spaepen, F. On the approximation of the free energy change on crystallization. Acta Metall. 1979, 27, 1855–1859. [Google Scholar] [CrossRef]
- Ge, L.; Hui, X.; Wang, E.R.; Chen, G.L.; Arroyave, R.; Liu, Z.K. Prediction of the glass forming ability in Cu-Zr binary and Cu-Zr-Ti ternary alloys. Intermetallics 2008, 16, 27–33. [Google Scholar] [CrossRef]
- Yang, W.; Liu, F.; Liu, H.; Wang, H.F.; Chen, Z.; Yang, G.C. Glass forming ability in Cu – Zr binary alloy: Effect of nucleation mode. J. Alloys Compd. 2009, 484, 702–707. [Google Scholar] [CrossRef]
- Tanner, L.E.; Ray, R. Metallic glass formation and properties in Zr and Ti alloyed with Be-I the binary Zr-Be and Ti-Be systems. Acta Metall. 1979, 27, 1727–1747. [Google Scholar] [CrossRef]
- Masuhr, A.; Waniuk, T.A.; Busch, R.; Johnson, W.L. Time Scales for Viscous Flow, Atomic Transport, and Crystallization in the Liquid and Supercooled Liquid States of Zr41.2Ti13.8Cu12.5Ni10.0Be22.5. Phys. Rev. Lett. 1988, 61, 2291–2293. [Google Scholar]
- Ericsson, A.; Pacheco, V.; Sahlberg, M.; Lindwall, J.; Hallberg, H.; Fisk, M. Transient nucleation in selective laser melting of Zr-based bulk metallic glass. Mater. Des. 2020, 195, 108958. [Google Scholar] [CrossRef]
- Köster, U.; Herold, U. Crystallization of metallic glasses. In Glassy Metals 1; Springer: Berlin/Heidelberg, Germany, 1981; pp. 225–259. [Google Scholar] [CrossRef]
- Inoue, A.; Kawase, D.; Tsai, A.P. Stability and transformation to crystalline phases of amorphous Zr-Al-Cu alloys with significant supercooled liquid region. Mater. Sci. Eng. A 1994, 178, 255–263. [Google Scholar] [CrossRef]
- Hono, K.; Zhang, Y.; Tsai, A.P.; Inoue, A.; Sakurai, T. Solute partitioning in partially crystallized Al-Ni-Cu(-Cu) metallic glass. Scr. Metall. 1995, 32, 191–196. [Google Scholar] [CrossRef]
- Pekarskaya, E.; Löffler, J.F.; Johnson, W.L. Microstructural studies of crystallization of a Zr-based bulk metallic glass. Acta Mater. 2003, 51, 4045–4057. [Google Scholar] [CrossRef]
- Fan, C.; Yue, X.; Inoue, A.; Liu, C.T.; Shen, X.; Liaw, P.K. Recent topics on the structure and crystallization of al-based glassy alloys. Mater. Res. 2019, 22, 1–15. [Google Scholar] [CrossRef] [Green Version]
- Zhang, L.; Xiao, H.; Li, S.; Xu, L.; Zhao, B.; Zhai, Q.; Gao, Y. Revealing the crystallization kinetics and phase transitions in Mg65Zn30Ca5 metallic glass by nanocalorimetry. J. Alloys Compd. 2021, 899, 163353. [Google Scholar] [CrossRef]
- Baricco, M.; Palumbo, M. Thermodynamic and kinetic modelling of primary crystallisation in amorphous alloys. J. Metastable Nanocrystalline Mater. 2004, 20–21, 415–424. [Google Scholar] [CrossRef]
- Palumbo, M.; Baricco, M. Modelling of primary bcc-Fe crystal growth in a Fe85B15 amorphous alloy. Acta Mater. 2005, 53, 2231–2239. [Google Scholar] [CrossRef]
- Nestler, B.; Danilov, D.; Bracchi, A.; Huang, Y.L.; Niermann, T.; Seibt, M.; Schneider, S. A metallic glass composite: Phase-field simulations and experimental analysis of microstructure evolution. Mater. Sci. Eng. A 2007, 452–453, 8–14. [Google Scholar] [CrossRef]
- Chen, Q.; Jeppsson, J.; Ågren, J. Analytical treatment of diffusion during precipitate growth in multicomponent systems. Acta Mater. 2008, 56, 1890–1896. [Google Scholar] [CrossRef]
- Myhr, O.R.; Grong, O. Modelling of non-isothermal transformations in alloys containing a particle distribution. Acta Mater. 2000, 48, 1605–1615. [Google Scholar] [CrossRef]
- Zhou, C.; Guo, C.; Li, C.; Du, Z. Thermodynamic assessment of the phase equilibria and prediction of glass-forming ability of the Al–Cu–Zr system. J. Non-Cryst. Solids 2017, 461, 47–60. [Google Scholar] [CrossRef]
- Kelton, K.F.; Greer, A. Nucleation in Condensed Matter: Applications in Materials and Biology, 1st ed.; Pergamon: Oxford, UK, 2010. [Google Scholar] [CrossRef]
- Rheingans, B.; Mittemeijer, E.J. Modelling precipitation kinetics: Evaluation of the thermodynamics of nucleation and growth. Calphad Comput. Coupling Phase Diagr. Thermochem. 2015, 50, 49–58. [Google Scholar] [CrossRef]
- Philippe, T.; Bonvalet, M.; Blavette, D. Kinetic theory of diffusion-limited nucleation. J. Chem. Phys. 2016, 144, 204501. [Google Scholar] [CrossRef]
- Einstein, A. Über die von der molekularkinetischen Theorie der Wärme geforderte Bewegung von in ruhenden Flüssigkeiten suspendierten Teilchen. Ann. Phys. 1905, 322, 549–560. [Google Scholar] [CrossRef] [Green Version]
- Blodgett, M.E.; Egami, T.; Nussinov, Z.; Kelton, K.F. Proposal for universality in the viscosity of metallic liquids. Sci. Rep. 2015, 5, 1–8. [Google Scholar] [CrossRef] [Green Version]
- Hembree, W. High Temperature Rheology of Zr-Based Bulk Metallic Glass Forming Liquids. Doctorial Thesis, Universität des Saarlandes, Saarbrücken, Germany, 2015. [Google Scholar]
- Kozeschnik, E. Modeling Solid-State Precipitation; Momentum Press: New York, NY, USA, 2012. [Google Scholar] [CrossRef]
- Dinsdale, A.T. Sgte data for pure elements. Calphad 1991, 15, 317–425. [Google Scholar] [CrossRef]
- Palumbo, M.; Battezzati, L. Thermodynamics and kinetics of metallic amorphous phases in the framework of the CALPHAD approach. Calphad Comput. Coupling Phase Diagr. Thermochem. 2008, 32, 295–314. [Google Scholar] [CrossRef]
- Lukas, H.L.; Fries, S.G.; Sundman, B. Computational Thermodynamics: The Calphad Method; Cambridge University Press: New York, NY, USA, 2007. [Google Scholar] [CrossRef]
- Du, Q.; Poole, W.J.; Wells, M.A. A mathematical model coupled to CALPHAD to predict precipitation kinetics for multicomponent aluminum alloys. Acta Mater. 2012, 60, 3830–3839. [Google Scholar] [CrossRef]
- Turnbull, D. Correlation of Liquid-Solid Interfacial Energies Calculated from Supercooling of Small Droplets. J. Chem. Phys. 1950, 18, 769. [Google Scholar] [CrossRef]
- Gránásy, L.; Tóth, G.I.; Warren, J.A.; Podmaniczky, F.; Tegze, G.; Rátkai, L.; Pusztai, T. Phase-field modeling of crystal nucleation in undercooled liquids—A review. Prog. Mater. Sci. 2019, 106, 100569. [Google Scholar] [CrossRef]
- Tolman, R.C. The effect of droplet size on surface tension. J. Chem. Phys. 1949, 17, 333–337. [Google Scholar] [CrossRef] [Green Version]
- Kampmann, R.; Wagner, R. Decomposition of Alloys: The Early Stages. (Chapter Kinetics of Precipitation in Metastable Binary Alloys—Theory and Application to Cu-1.9 at % and Ni-14 at% Al). 1984. Available online: https://www.sciencedirect.com/science/article/pii/B9780080316512500185?via%3Dihub (accessed on 15 May 2022).
- Perez, M.; Dumont, M.; Acevedo-Reyes, D. Implementation of classical nucleation and growth theories for precipitation. Acta Mater. 2008, 56, 2119–2132. [Google Scholar] [CrossRef]
- Heraeus AMLOY Technologies. Material datasheet: AMLOY-ZR01. Available online: https://www.heraeus.com/media/media/group/media_group/products/amorphous_metals/datasheets_1/Datasheet_AMLOY-ZR01~2.pdf (accessed on 15 May 2022).
- Pacheco, V.; Karlsson, D.; Marattukalam, J.J.; Stolpe, M.; Hjörvarsson, B.; Jansson, U.; Sahlberg, M. Thermal stability and crystallization of a Zr-based metallic glass produced by suction casting and selective laser melting. J. Alloys Compd. 2020, 825, 153995. [Google Scholar] [CrossRef]
- Ericsson, A.; Pacheco, V.; Marattukalam, J.J.; Dalgliesh, R.M.; Rennie, A.R.; Fisk, M.; Sahlberg, M. Crystallization of a Zr-based metallic glass produced by laser powder bed fusion and suction casting. J.-Non-Cryst. Solids 2021, 571, 120891. [Google Scholar] [CrossRef]
- Sohrabi, N.; Schawe, J.E.; Jhabvala, J.; Löffler, J.F.; Logé, R.E. Critical crystallization properties of an industrial-grade Zr-based metallic glass used in additive manufacturing. Scr. Mater. 2021, 199, 113861. [Google Scholar] [CrossRef]
- Sohrabi, N.; Jhabvala, J.; Log, R.E. Additive Manufacturing of Bulk Metallic Glasses—Process, Challenges and Properties: A Review. Metals 2021, 11, 1279. [Google Scholar] [CrossRef]
- Best, J.P.; Evenson, Z.; Yang, F.; Dippel, A.C.; Stolpe, M.; Gutowski, O.; Hasib, M.T.; Li, X.; Kruzic, J.J. Structural periodicity in laser additive manufactured Zr-based bulk metallic glass. Appl. Phys. Lett. 2019, 115, 031902. [Google Scholar] [CrossRef]
- Wang, Q.; Wang, L.M.; Ma, M.Z.; Binder, S.; Volkmann, T.; Herlach, D.M.; Wang, J.S.; Xue, Q.G.; Tian, Y.J.; Liu, R.P. Diffusion-controlled crystal growth in deeply undercooled melt on approaching the glass transition. Phys. Rev. B-Condens. Matter Mater. Phys. 2011, 83. [Google Scholar] [CrossRef] [Green Version]
- Ericsson, A.; Fisk, M.; Hallberg, H. Modeling of nucleation and growth in glass-forming alloys using a combination of classical and phase-field theory. Comput. Mater. Sci. 2019, 165, 167–179. [Google Scholar] [CrossRef]
- Kelton, K.F.; Greer, A. Transient nucleation effects in glass formation. J. Non-Cryst. Solids 1986, 79, 295–309. [Google Scholar] [CrossRef]
- Ouyang, D.; Zhang, P.; Zhang, C.; Liu, L. Understanding of crystallization behaviors in laser 3D printing of bulk metallic glasses. Appl. Mater. Today 2021, 23, 100988. [Google Scholar] [CrossRef]
- Lin, X.; Johnson, W.; Rhim, W. Effect of Oxygen Impurity on Crystallization of an Undercooled Bulk Glass Forming Zr-Ti-Cu-Ni-Al Alloy. Mater. Trans. 1997, 38, 473–477. [Google Scholar] [CrossRef] [Green Version]
- Liu, C.T.; Chisholm, M.F.; Miller, M.K. Oxygen impurity and microalloying effect in a Zr-based bulk metallic glass alloy. Intermetallics 2002, 10, 1105–1112. [Google Scholar] [CrossRef]
- Jonas, I.; Hembree, W.; Yang, F.; Busch, R.; Meyer, A. Industrial grade versus scientific pure: Influence on melt properties. Appl. Phys. Lett. 2018, 112, 1–5. [Google Scholar] [CrossRef] [Green Version]
- Schawe, J.E.; Löffler, J.F. Existence of multiple critical cooling rates which generate different types of monolithic metallic glass. Nat. Commun. 2019, 10, 1–10. [Google Scholar] [CrossRef]


| Exp. [47] | Comp. | Comp. | Comp. | Comp. | |
|---|---|---|---|---|---|
| Cooling | |||||
| Heating | 422 |
| Comp. | Comp. | Comp. | Comp. |
|---|---|---|---|
| 124 | |||
| 176 |
Publisher’s Note: MDPI stays neutral with regard to jurisdictional claims in published maps and institutional affiliations. |
© 2022 by the authors. Licensee MDPI, Basel, Switzerland. This article is an open access article distributed under the terms and conditions of the Creative Commons Attribution (CC BY) license (https://creativecommons.org/licenses/by/4.0/).
Share and Cite
Ericsson, A.; Fisk, M. Modeling of Diffusion-Controlled Crystallization Kinetics in Al-Cu-Zr Metallic Glass. Metals 2022, 12, 867. https://doi.org/10.3390/met12050867
Ericsson A, Fisk M. Modeling of Diffusion-Controlled Crystallization Kinetics in Al-Cu-Zr Metallic Glass. Metals. 2022; 12(5):867. https://doi.org/10.3390/met12050867
Chicago/Turabian StyleEricsson, Anders, and Martin Fisk. 2022. "Modeling of Diffusion-Controlled Crystallization Kinetics in Al-Cu-Zr Metallic Glass" Metals 12, no. 5: 867. https://doi.org/10.3390/met12050867
APA StyleEricsson, A., & Fisk, M. (2022). Modeling of Diffusion-Controlled Crystallization Kinetics in Al-Cu-Zr Metallic Glass. Metals, 12(5), 867. https://doi.org/10.3390/met12050867