Article

Crystallization Kinetics of Hypo, Hyper and Eutectic Ni–Nb Glassy Alloys

by
Laura Esmeralda Mendoza
1,
José Manuel Hernández
1,
José Gonzalo González
1,
Emilio Orgaz
2,
Octavio Lozada
3 and
Ignacio Alejandro Figueroa
1,*
1
Instituto de Investigaciones en Materiales, Universidad Nacional Autónoma de México (UNAM), Circuito Exterior s/n, Cd. Universitaria, Ciudad de México 04510, Mexico
2
Departamento de Física y Química Teórica, Facultad de Química, Universidad Nacional Autónoma de México (UNAM), Circuito Exterior s/n, Cd. Universitaria, Ciudad de México 04510, Mexico
3
Facultad de Ingeniería, Universidad Panamericana, Augusto Rodin 498, Ciudad de México 03920, Mexico
*
Author to whom correspondence should be addressed.
Metals 2022, 12(5), 808; https://doi.org/10.3390/met12050808
Submission received: 17 March 2022 / Revised: 3 May 2022 / Accepted: 4 May 2022 / Published: 7 May 2022

Abstract

:
This study presents the thermal and kinetic behavior of Ni58.5Nb41.5, Ni59.5Nb40.5, and Ni60.5Nb39.5 binary glassy alloys. The alloys ingots were obtained through an electric arc furnace and the ribbons using the melt-spinning technique at two different wheel speeds, 8 and 25 m/s. The non-isothermal study was carried out by means of Differential Scanning Calorimetry (DSC) at five different heating rates: 12.5, 15, 17.5, 20, and 22.5 K/min. X-ray Diffraction (XRD) analysis showed a fully glassy phase for all ribbons for all compositions. For both wheel speeds, the ribbons with higher Nb content were significantly thinner than those with less content. The activation energies were calculated from the Kissinger method, showing the tendency Ep1>Ex1>Eg, where Ep1, Ex and Eg denote the activation energies of first peak temperature, the first crystallization onset and glass transition, respectively. The Flynn–Wall–Ozawa model displayed a close correlation with heating rates, ribbon thicknesses, and composition. The Nb content enhanced the glassy stability since the activation energy required for crystallization increased at higher Nb concentrations.

1. Introduction

Ni-based metallic glasses have received significant attention due to scientific and technological potential since the first successful synthesis of glassy phase in binary alloys such as the Ni–Nb system [1]. The physical and chemical properties of the Ni–Nb system are diversified and increased when obtained in form of glassy ribbons, which improve their magnetic properties such as ferromagnetism (either extremely soft or moderately hard magnetism) and can therefore be used as materials for engineering applications, i.e., micro-geared motors and pressure sensors [2,3].
The formation of Ni–Nb metallic glasses depends on the chemical composition (30–60 at.%Nb), shape (ribbons, rods, tubes), and dimensions (thickness, diameter) [4]. These types of alloys, like other metallic glasses, do not exhibit an atomic medium- and long-range order and thus provide high thermal stability, high compressive strength, relatively good plasticity, and high corrosion resistance properties [5].
The glass-forming ability (GFA) is an important descriptor to obtaining Ni–Nb metallic glasses [6]. The GFA is the ability of an alloy melt to generate a glassy phase due to rapid solidification; there is significant interest in identifying thermal parameters that lead to the formation of metallic glass, combining the stability of the liquid phase with the resistance of the glassy phase to crystallization [7,8,9]. The formation of metallic glasses was based on the following empirical rules [10]: (1) multicomponent systems, (2) difference in atomic radii greater than 12%, (3) negative heat of mixing, and (4) deep eutectic; this rule is based on the Trg criterion is defined as Trg = Tg/Tl and is the ratio of the glass transition temperature to the melting temperature [11]. However, some Cu–Hf [12], Cu–Zr [13], and Ni–Nb [14] binary alloys are the exception to these rules since they can produce a fully glassy phase. In Ni–Nb metallic glasses, this was attributed to chemical and thermodynamic factors, i.e., the radii of Ni = 1.25 Å and Nb = 1.47 Å, and mixing energy of −143 kJ/mol [15]. Therefore, the diffusion of the atoms becomes slower during the crystallization process, so the nucleation and crystallization are suppressed [16]. It has been reported that the crystallization process, with a poly–tetrahedral interatomic arrangement in the glassy state. Here, the bond-angle distributions result from the radii and chemical order difference, producing an icosahedral-like distribution [17].
Most of the research carried out on the Ni–Nb system presents compositions that are close to the eutectic point, i.e., NixNb100−x (x = 59.5, 60.5, 61 and 62.5 at.%) in order to obtain metallic glasses in the form ribbons, rods, powders and coatings [18,19,20,21,22]. The study of these alloys was limited to production, solidification, and vitrification and a comprehensive GFA investigation directed towards the thermal behavior, i.e., where similar thermal parameter values were reported, i.e., Tg = 870–890 K, Tx1 = 910–940, Tp1 = 920–960, ΔTx = 23–40, Trg = ~0.58, γ = ~0.4 [23,24] were the characteristic temperatures are denoted by Tg is the glass transition temperature, Tx1 is the first onset crystallization temperature, the second crystallization temperature is Tx2, the super-cooled liquid region (ΔTx = Tx1 − Tg) and crystallization peaks Tp1, Tp2 and Tp3.
Moreover, the crystallization process (two or three steps) [25,26], elucidation of crystalline phases (Ni3Nb and Ni6Nb7) at the first peak of crystallization of the alloys [27], and atomic distributions and structure [28,29] were also assessed. This binary alloy presents particularities in the crystallization process, such as those studied by Lesz et al.; the thermal parameters in rods and ribbons of Ni62Nb38 composition showed similar Tg, Trg and γ values for both geometries. Despite the importance of the Ni–Nb glassy alloy system, the crystallization kinetics of any alloy system and the crystallization kinetics of any alloys have not been reported.
The crystallization kinetic analysis enables calculation of the activation energy (Ea) in different stages of crystallization as Tg, Tx1, Tp1, and their associated activation energies, i.e., Eg, Ex1, Ep1. Differential scanning calorimetry (DSC) is typically employed to carry out this study; this technique also helps determine the glassy alloys thermal data, i.e., crystallization time, phase transformations temperatures, and heat flow absorbed or released with them [30]. Several experimental procedures have been developed to calculate activation energies in order to investigate chemical and physical transformations, such as crystallization [31]. Among them, the Kissinger methods consists of carrying out a series of experiments where small amounts of samples are subjected to different heating rates. The exothermic peak is taken as a constant conversion point for measuring each heating rate [32,33].
As mentioned above, the crystallization kinetic study of Ni–Nb alloys in the eutectic zone, i.e., between 26.5 and 50 (Nb at.%) with different ribbon thicknesses, has not been previously reported. Therefore, this work aims to kinetically analyze Ni58.5Nb41.5, Ni59.5Nb40.5, and Ni60.5Nb39.5 hypo, hyper and eutectic alloys and assess the effect of material thickness and composition on the crystallization behavior. In addition, the energy required to carry out the glass transition and crystallization process (Eg, Ep, and Ex) through Kissinger and Flynn–Wall–Ozawa models was also assessed.

2. Materials and Methods

Binary alloy ingots with nominal compositions of Ni58.5Nb41.5 (hypereutectic), Ni59.5Nb40.5 (eutectic), and Ni60.5Nb39.5 (hypoeutectic) (at.%) were prepared by arc melting (Edmund Bühler GmbH, Bodelshausen, Germany), with pure Ni (99.98%) and Nb (99.95%) elements under an argon (Ar) atmosphere. The ingots were remelted five times to achieve a homogeneous composition. The weight loss of each ingot was less than 0.2% during the alloying process. The glassy alloys ribbons were produced by a melt-spinner (Edmund Bühler GmbH, Bodelshausen, Germany), which consists of continuous casting of the liquid alloys on the surface of a rotating copper wheel under a helium (He) atmosphere. The casting conditions included two tangential speeds, i.e., 8 and 25 m/s, with an injection pressure of 0.3 bar. The diameter of the quartz crucible nozzle was 0.8 mm. The distance between the nozzle and copper wheel was 5 mm. The crystalline phases of the ingots and the glassy phase of the ribbons (shiny surface) were examined by X-ray diffraction (XRD) using a Rigaku Ultima IV diffractometer (Rigaku, Tokyo, Japan), model Ultima IV with CuKα radiation. In Ar flow, the thermal stability of the glassy alloys was investigated using a Differential Scanning Calorimeter SDT Q600 (TA Instruments, New Castle, DE, USA). Non-isothermal DSC conditions were used, with five heating rates: 12.5, 15, 17.5, 20, and 22.5 K/min. Three experiments for each sample were carried out for statistical purposes.

3. Results

3.1. Structural Characterization

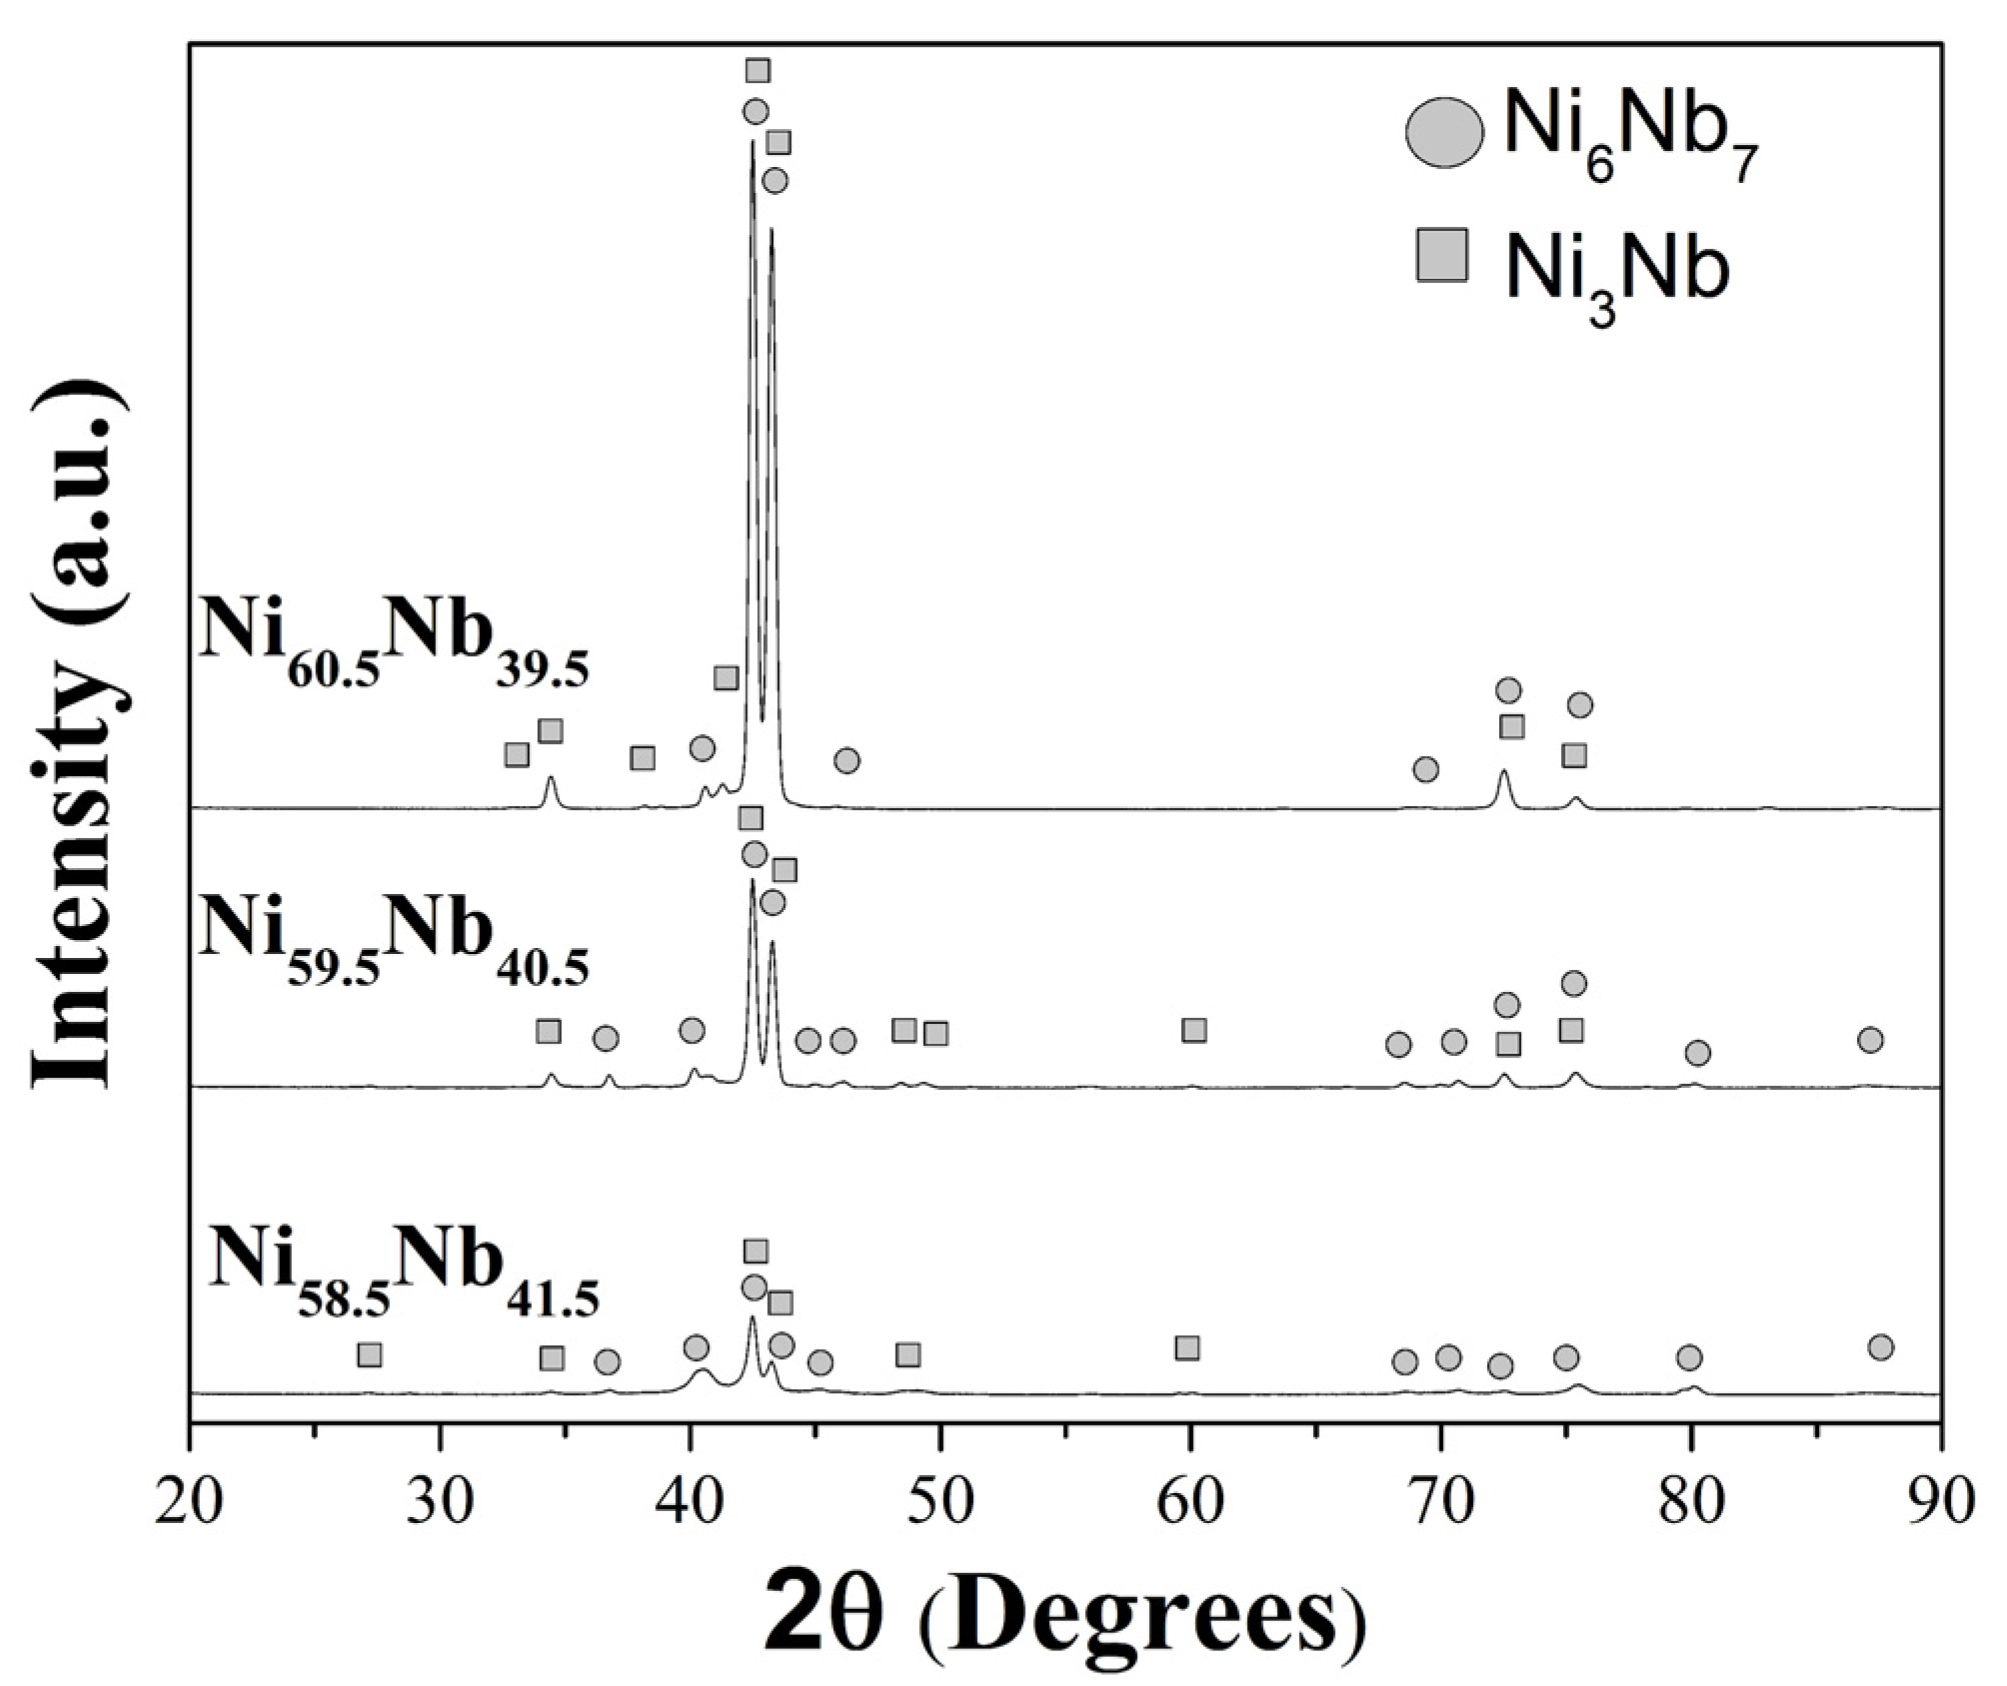
3.1.1. Ingots Ni58.5Nb41.5, Ni59.5Nb40.5, and Ni60.5Nb39.5 Alloys

The XRD patterns of Ni58.5Nb41.5, Ni59.5Nb40.5, and Ni60.5Nb39.5 alloys ingots (1 cm diameter) are shown in Figure 1 the crystalline Ni6Nb7 and Ni3Nb phases were identified by comparison with a data base (JCPDS 04-004-3644 and 04-012-8012, respectively). These phases agreed well with those reported for the present alloys [34]. Furthermore, the eutectic reaction of Ni59.5Nb40.5 alloy revealed distinct peaks associated with both phases, representing this reaction when cooling, i.e., L→ Ni3Nb + Ni6Nb7 [35]. It can be observed that for the Ni–Nb alloy system, with a small variation in composition (1 at.% Nb) a significant change in crystal growth of phases it was evident. On the other hand, the Ni60.5Nb39.5 alloy showed more peaks associated with the Ni3Nb orthorhombic phase. These results proved the chemical homogeneity of the alloys, as when studying alloys with small chemical composition differences (>1 at.%), the chemical homogeneity of the ingot is critical for the analysis. XRF analyses were also carried out to support this argument, giving a global composition (at.%) of Ni = 59.56% and Nb = 40.44% (eutectic), Ni = 60.54% Nb = 39.46% (hypoeutectic) and Ni = 58.58% and Nb = 41.42% (hypereutectic). The observed small differences between the nominal, and experimental compositions are in the sensibility limit of the equipment, thus hypo, hyper and eutectic compositions were obtained.

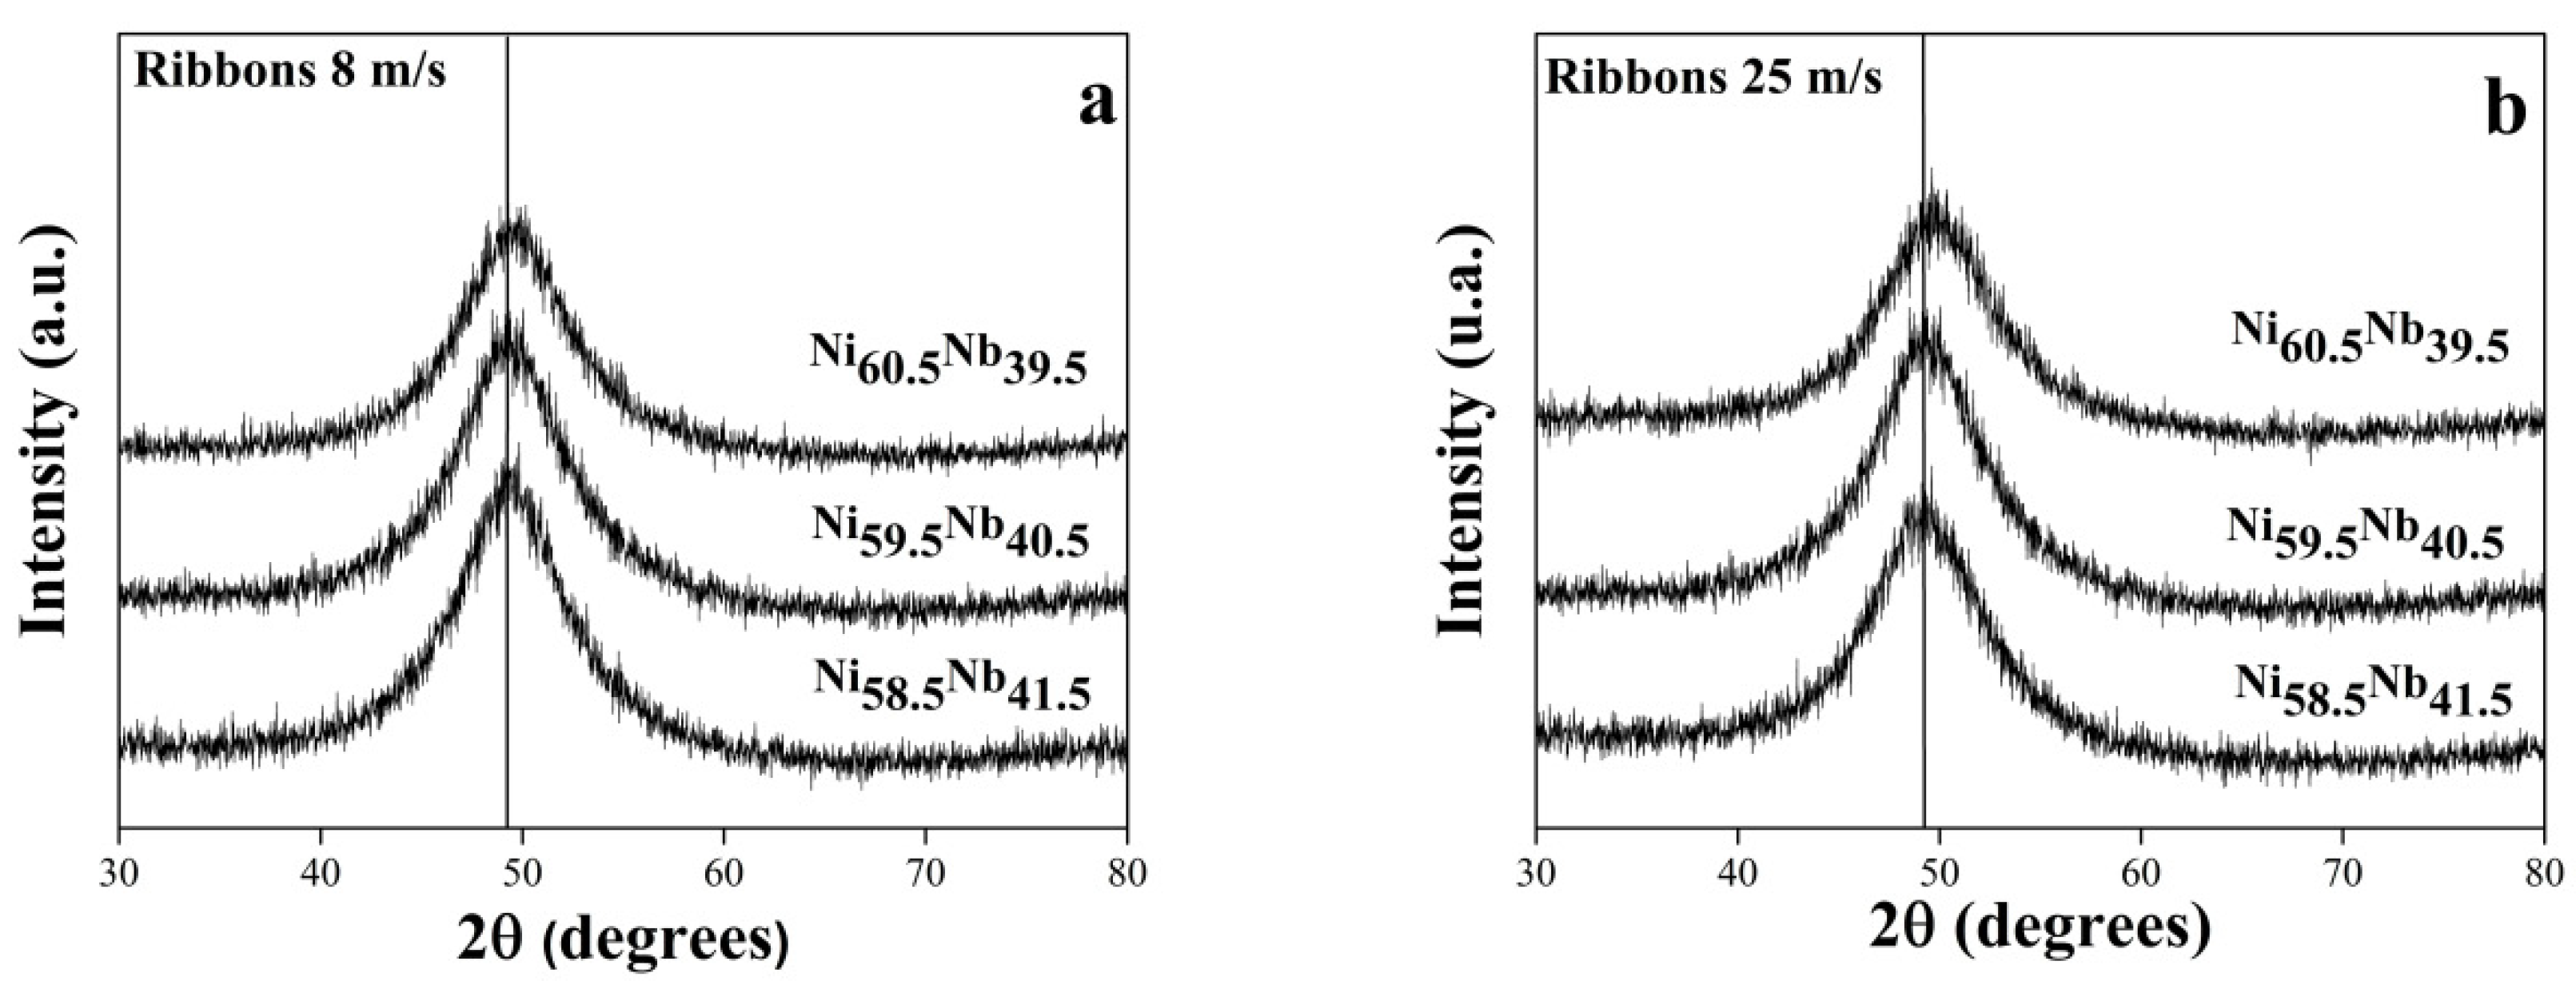
3.1.2. Ribbons Cast at 8 m/s and 25 m/s

The XRD patterns of 105, 130, and 140 μm ribbon thickness of the Ni58.5Nb41.5, Ni59.5Nb40.5, and Ni60.5Nb39.5 alloys (8 m/s) are shown in Figure 2a; the XRD patterns of these ribbons exhibited only one broad diffused peak without any diffraction peaks related to any crystalline phase. This confirms the formation of a fully glassy phase for each alloy composition ribbon. In addition, the slight shift of the peak maxima to the right was observed, indicating a cell contraction resulting from the drop of the amount of Nb in the alloys, attributed to the difference in atomic radii. Figure 2b shows the XRD patterns of 45, 50, and 60 μm thickness of Ni58.5Nb41.5, Ni59.5Nb40.5, and Ni60.5Nb39.5 alloys cast at 25 m/s, respectively. This figure also exhibits only one broad peak, with an observed cell contraction, also attributed to the amount of Nb in the investigated alloys. However, the shift for this casting condition was more evident, attributed to the higher cooling rate.

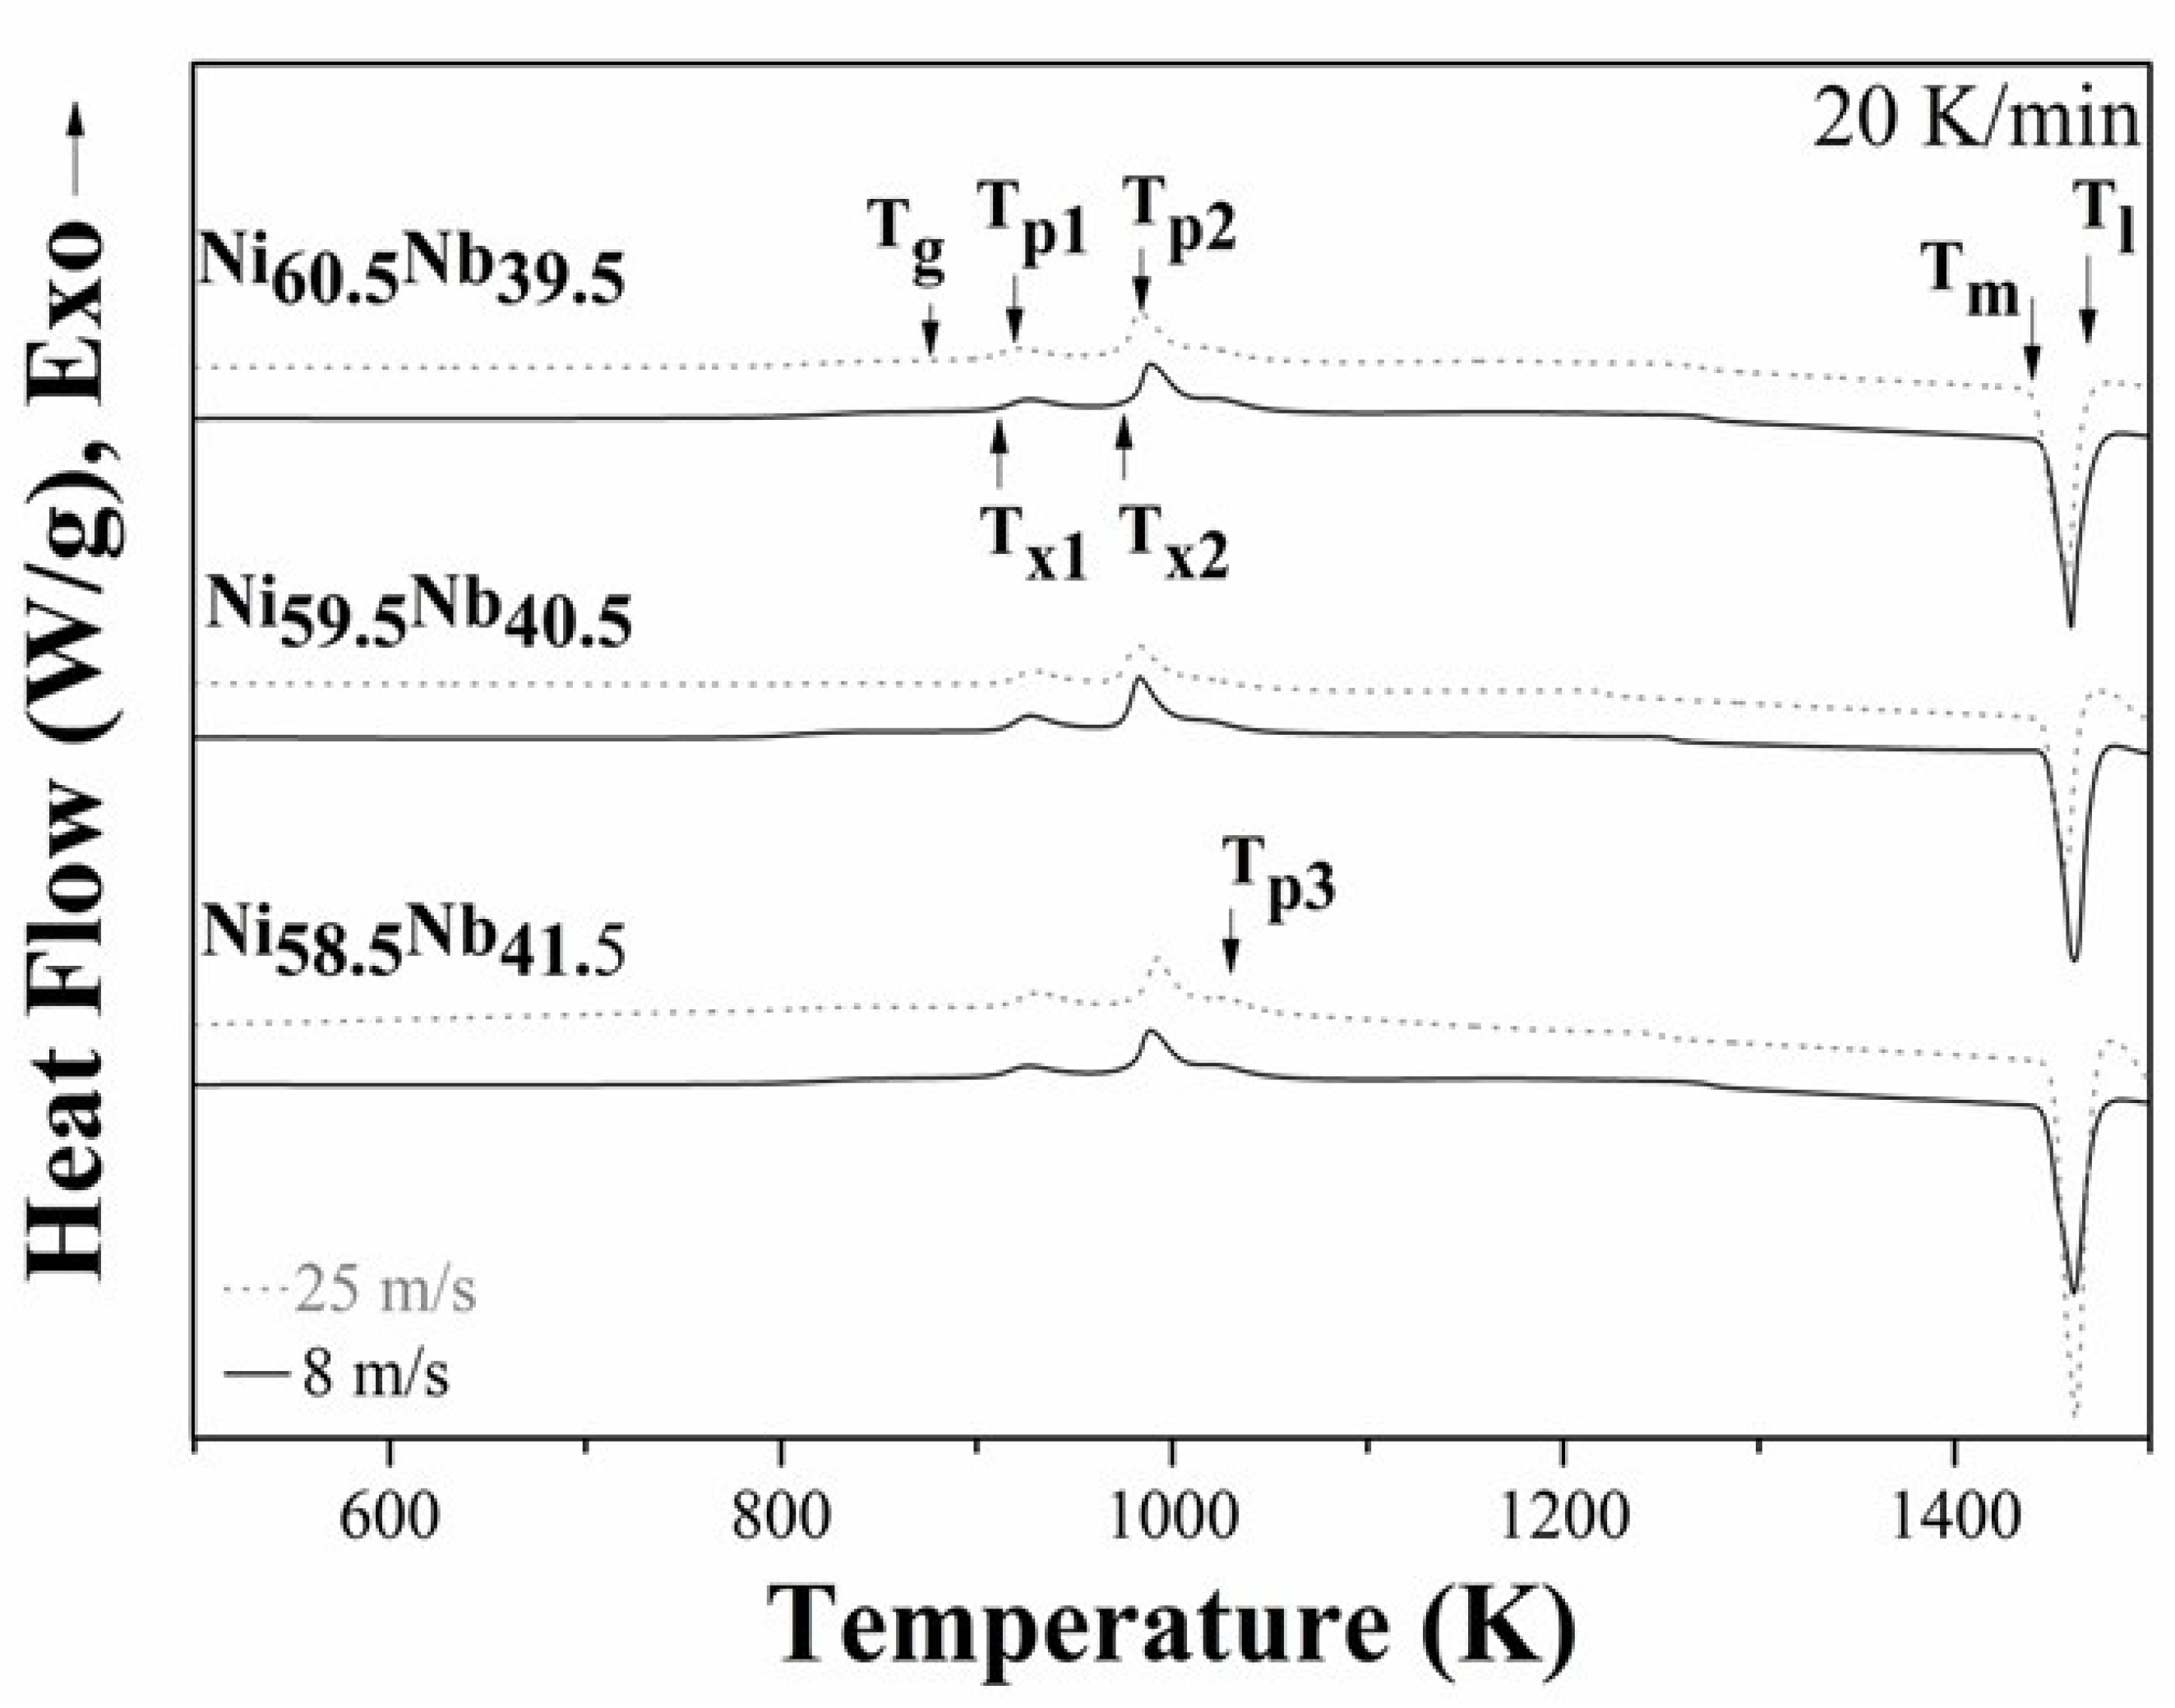
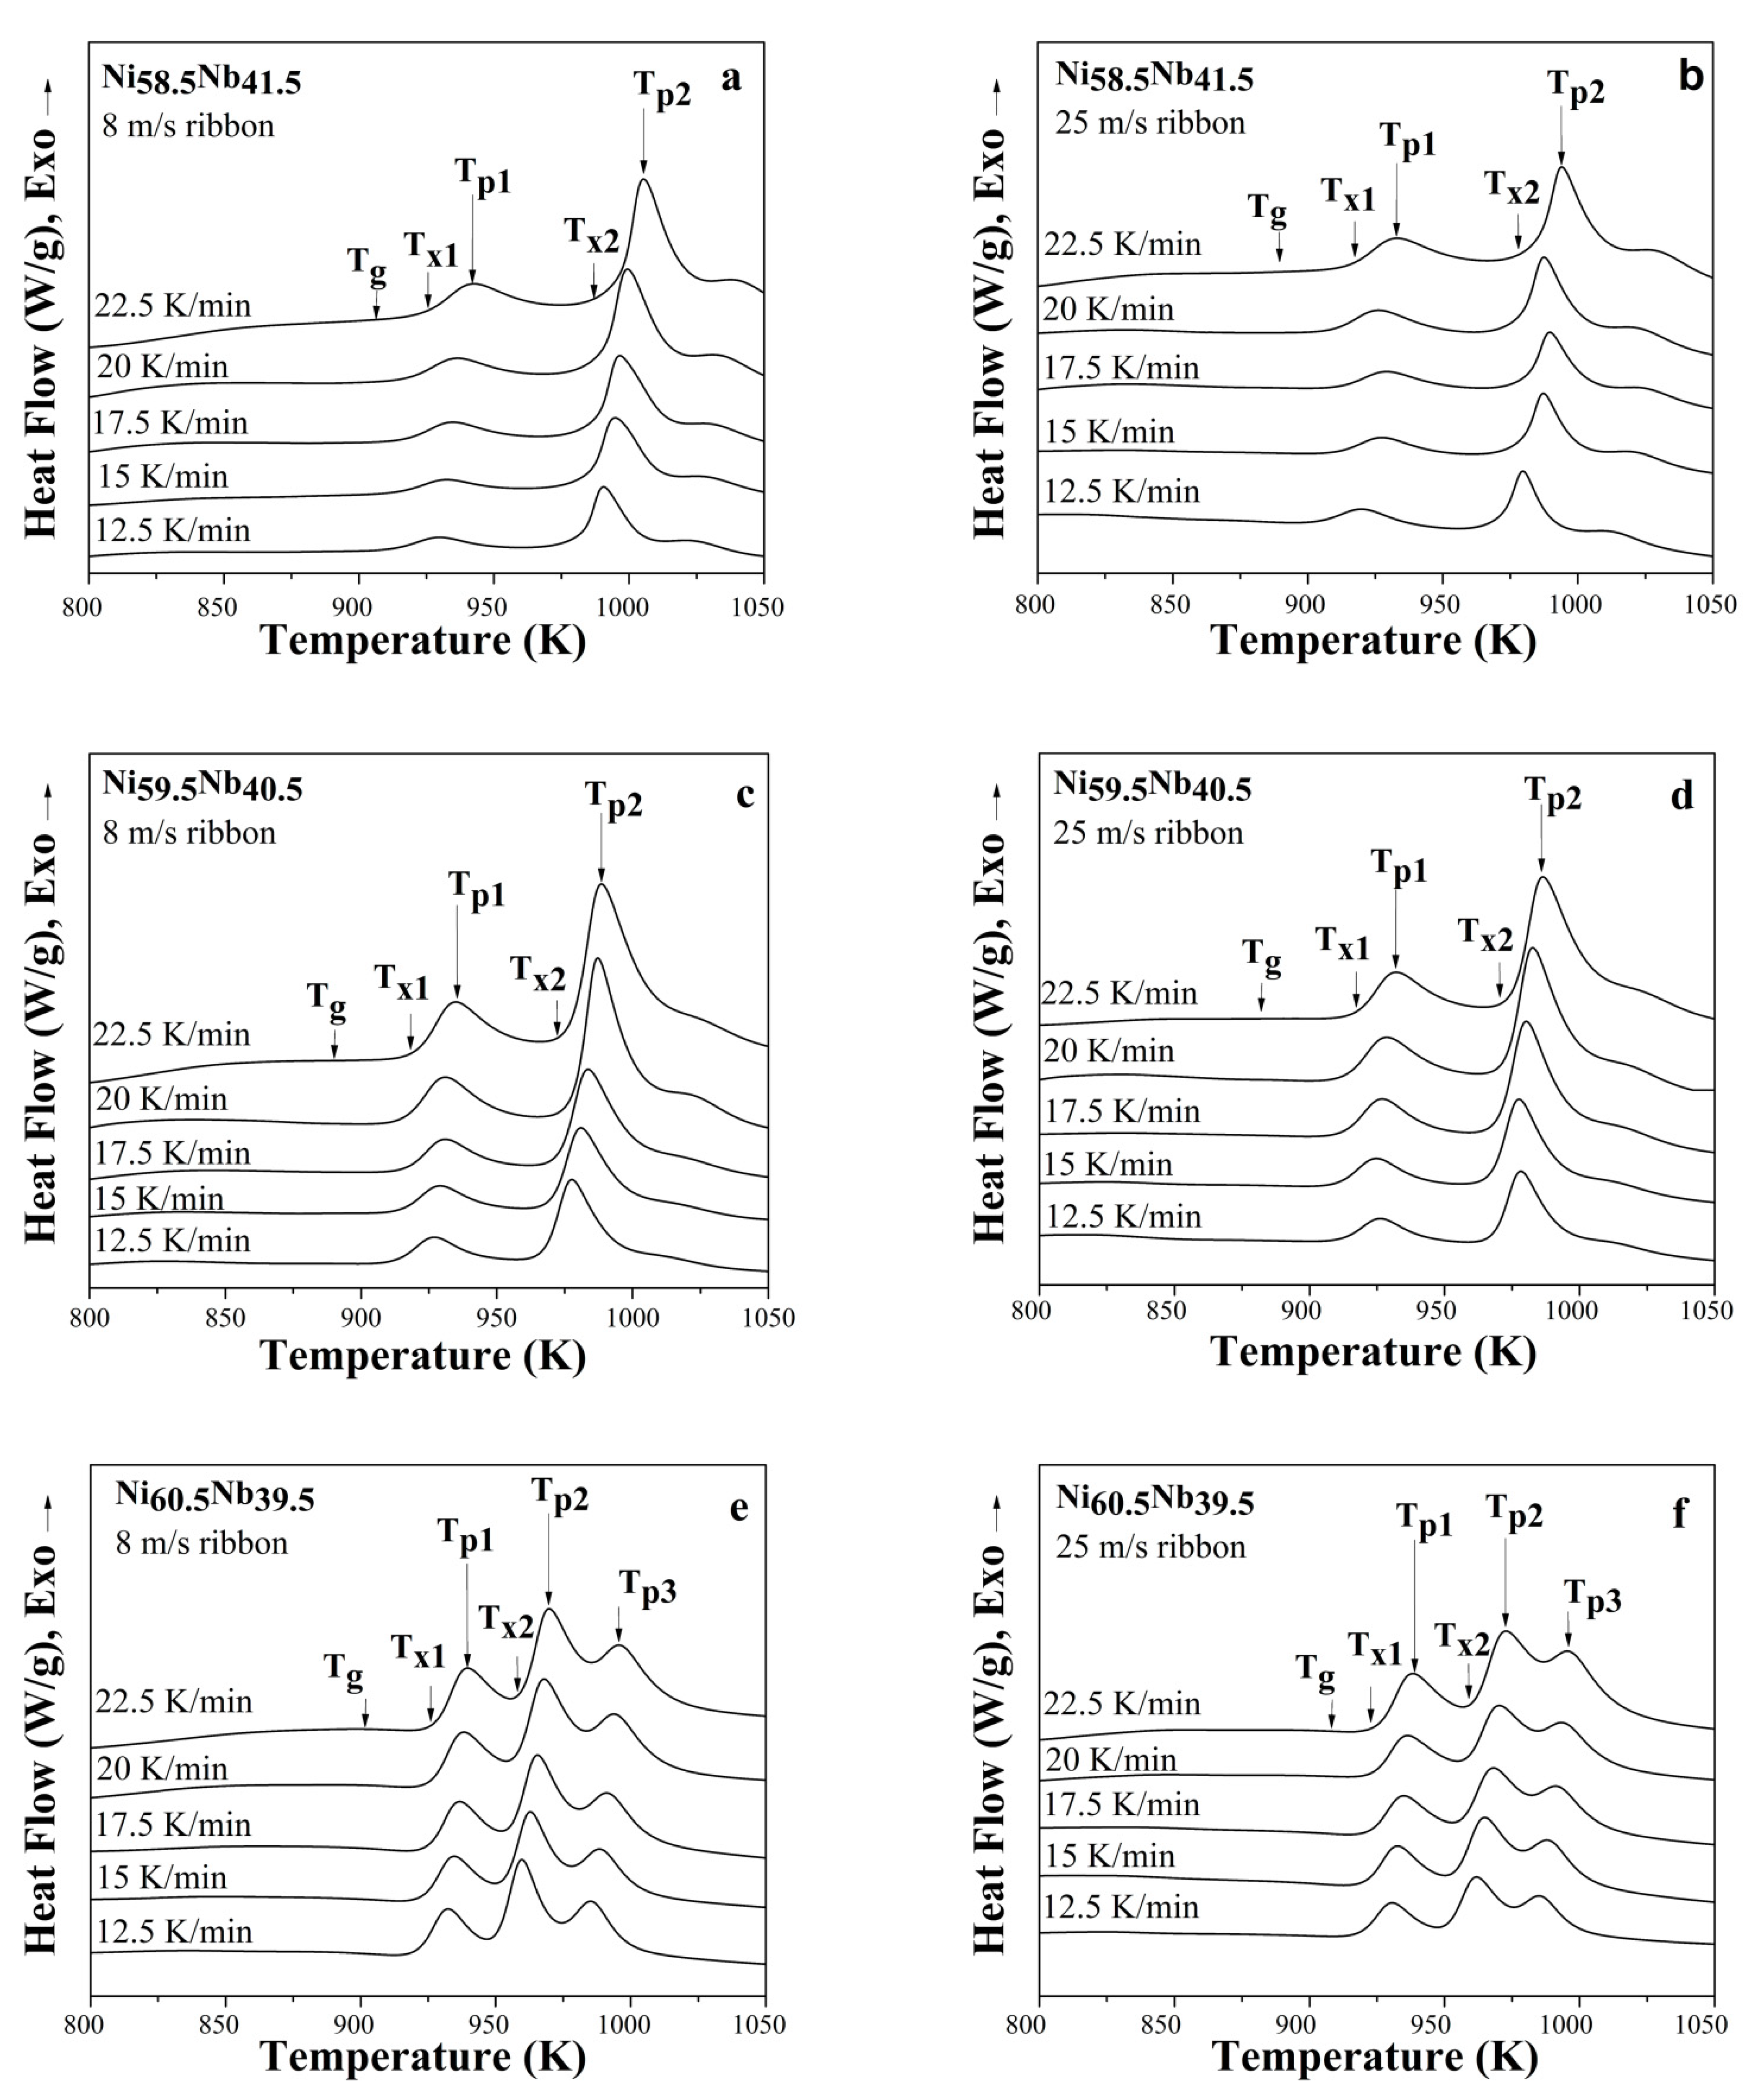
3.2. Thermal Characterization

Figure 3 shows the non-isothermal analysis, at a heating rate of 20 K/min, for the 8 and 25 m/s cast ribbons. All ribbon thicknesses were fully vitreous. The GFA could be explained in terms of the “Post-Mortem” thermal criteria for glass formation, i.e., the reduced glass transition temperature, Trg. This parameter is considered an indicator of a good glass former, as it considers nucleation kinetics and viscosity. Values of Trg ranging from 0.4 to 0.7 indicate that the homogeneous nucleation has been suppressed, and therefore there are conditions of forming a fully glassy phase [36]. Another parameter to consider for evaluating glass formation and stability is γ, which considers Tg, Tx, and Tl to predict glass formation and is defined as γ = Tx/Tg + Tl, whose ideal value is 0.5 [37]. As mentioned above, Figure 3 shows the non-isothermal analysis curves for Ni58.5Nb41.5, Ni59.5Nb40.5, and Ni60.5Nb39.5 glassy alloys and their calculated thermal parameters, i.e., Tg, Tx1, Tx2, ΔTx = Tx1 − Tg, Tp1, Tp2 and Tp3.

3.2.1. Hypereutectic Ni58.5Nb41.5 Alloy

Figure 4 shows the thermograms for cast ribbons at heating rates of 12.5, 15, 17.5, 20, 22.5 K/min; a summary of the obtained values is shown in Table 1 and Table 2. The characteristic temperatures of the 105 μm ribbon are shown in Figure 4a, a shift to the right of the thermogram due to the heating rates was observed. The glass transition temperature (Tg) changed from 884 K to 896 K, for 12.5 K/min and 22.5 K/min, respectively. The onset crystallization temperature (Tx1) from 902 to 910 K. The exothermic peaks showed a displacement from Tp1 = 923 to 929 K and Tp2= 990 to 1005 K and ΔTx = 14 to 18 K. Similarly, the thermograms for 45 μm ribbon are shown in Figure 4b. The temperatures obtained for this composition were from Tg = 885 (12.5 K/min) to 896 K (K/min). The change from Tx1 904 to 911 K, Tp1 from 921 to 927 K and Tp2 from 980 to 994 K. The magnitude of ΔTx= 15 to 19 K, in both ribbons was the smallest values for all studied alloys. On the other hand, the temperatures associated with the 45 μm ribbon showed the same shift of the signals to the right but less marked, associated with the thickness of the ribbons, as other parameters were kept constant, i.e., composition, heating rates, atmosphere, etc.
The crystallization in this Ni58.5Nb41.5 hyper eutectic alloy composition of both ribbon thicknesses was characterized for the presence of two exothermic peaks, indicating that the crystallization process was carried out in two steps. Furthermore, the thickness and thermal behavior of the Ni58.5Nb41.5 glassy alloy was also attributed to Nb content, i.e., type of metallic bonds, atomic radii, and d-electrons of transition metals.

3.2.2. Eutectic Ni59.5Nb40.5 Alloy

The thermal analysis of 130 μm glassy ribbons for the Ni59.5Nb40.5 eutectic composition is shown in Figure 4c, their thermal parameters are summarized in Table 1. Similar behavior was also observed, i.e., the values of the calculated thermal shifted to the right of thermogram, for instance: from 876 to 890 K in Tg, Tx1 from 911 to 920 K in, Tp1 from 924 to 931 K in and Tp2 from 977 to 991 K (for 12.5 K/min and 22.5 K/min, respectively). For this alloy composition, the magnitude of ΔTx was 30 to 35 K, being the highest value of the studied alloy compositions. Figure 4d shows the glassy ribbons thermograms with a thickness of 50 μm ribbons. Here, a slight shift to the right of thermograms was also observed; however, this shift occurred at slightly lower temperatures (Tg= 872 to 884 K. The Tx1= 913–921 K. The Tp1 = 927–34 K and Tp2 = 979–989 K). The crystallization behavior for this alloy was also carried out in two steps, for both glassy ribbon thicknesses (130 and 50 μm). This result is consistent with the nature of the eutectic composition (Ni59.5Nb40.5). According to the phase diagram, after heating from the glassy phase, the nucleation of Ni6Nb7 and Ni3Nb phases is likely.

3.2.3. Hypoeutectic Ni59.5Nb40.5 Alloy

Figure 4e shows the thermogram curves of the 140 μm Ni60.5Nb39.5 hypoeutectic alloy ribbon. This composition also showed the same behavior as the previous hyper and eutectic glassy ribbons. The temperatures also shifted from 887 to 902 K in Tg, 920–929 K in Tx1. On the contrary to the hyper and eutectic alloys, three crystallization peak temperatures were observed. The crystallization peaks temperatures were Tp1= 929–936 K, Tp2 = 960–970 K, and Tp3 = 977–988 K (for 12.5 K/min and 22.5 K/min, respectively), the magnitude of ΔTx was 26 to 28 K (Table 1). Figure 4f shows the thermograms for thinner ribbons (60 μm). For the heating rates used in the study, the Tg values were 893 to 907 K, Tx1 = 918 to 926 K observing three crystallization peak temperatures, Tp1 = 930 to 937 K, Tp2 = 986 to 997 K and Tp3 = 995 to 1012 K and ΔTx = 19 to 25 K (Table 2). The thermal parameters’ correlation on the heating rates was evident, as they shifted progressively to a higher value. The Ni60.5Nb39.5 alloy exhibited three exothermic peaks, implying a more complex crystallization process than hyper and eutectic glassy alloys. Additionally, with the thickness of the ribbon, the temperature associated to the third peak, attached to Tp2, occurred in a lagged fashion. It is important to point out that this peak was produced at even 1 at.% Nb difference, being possibly attributed to the more disordered glassy structure.

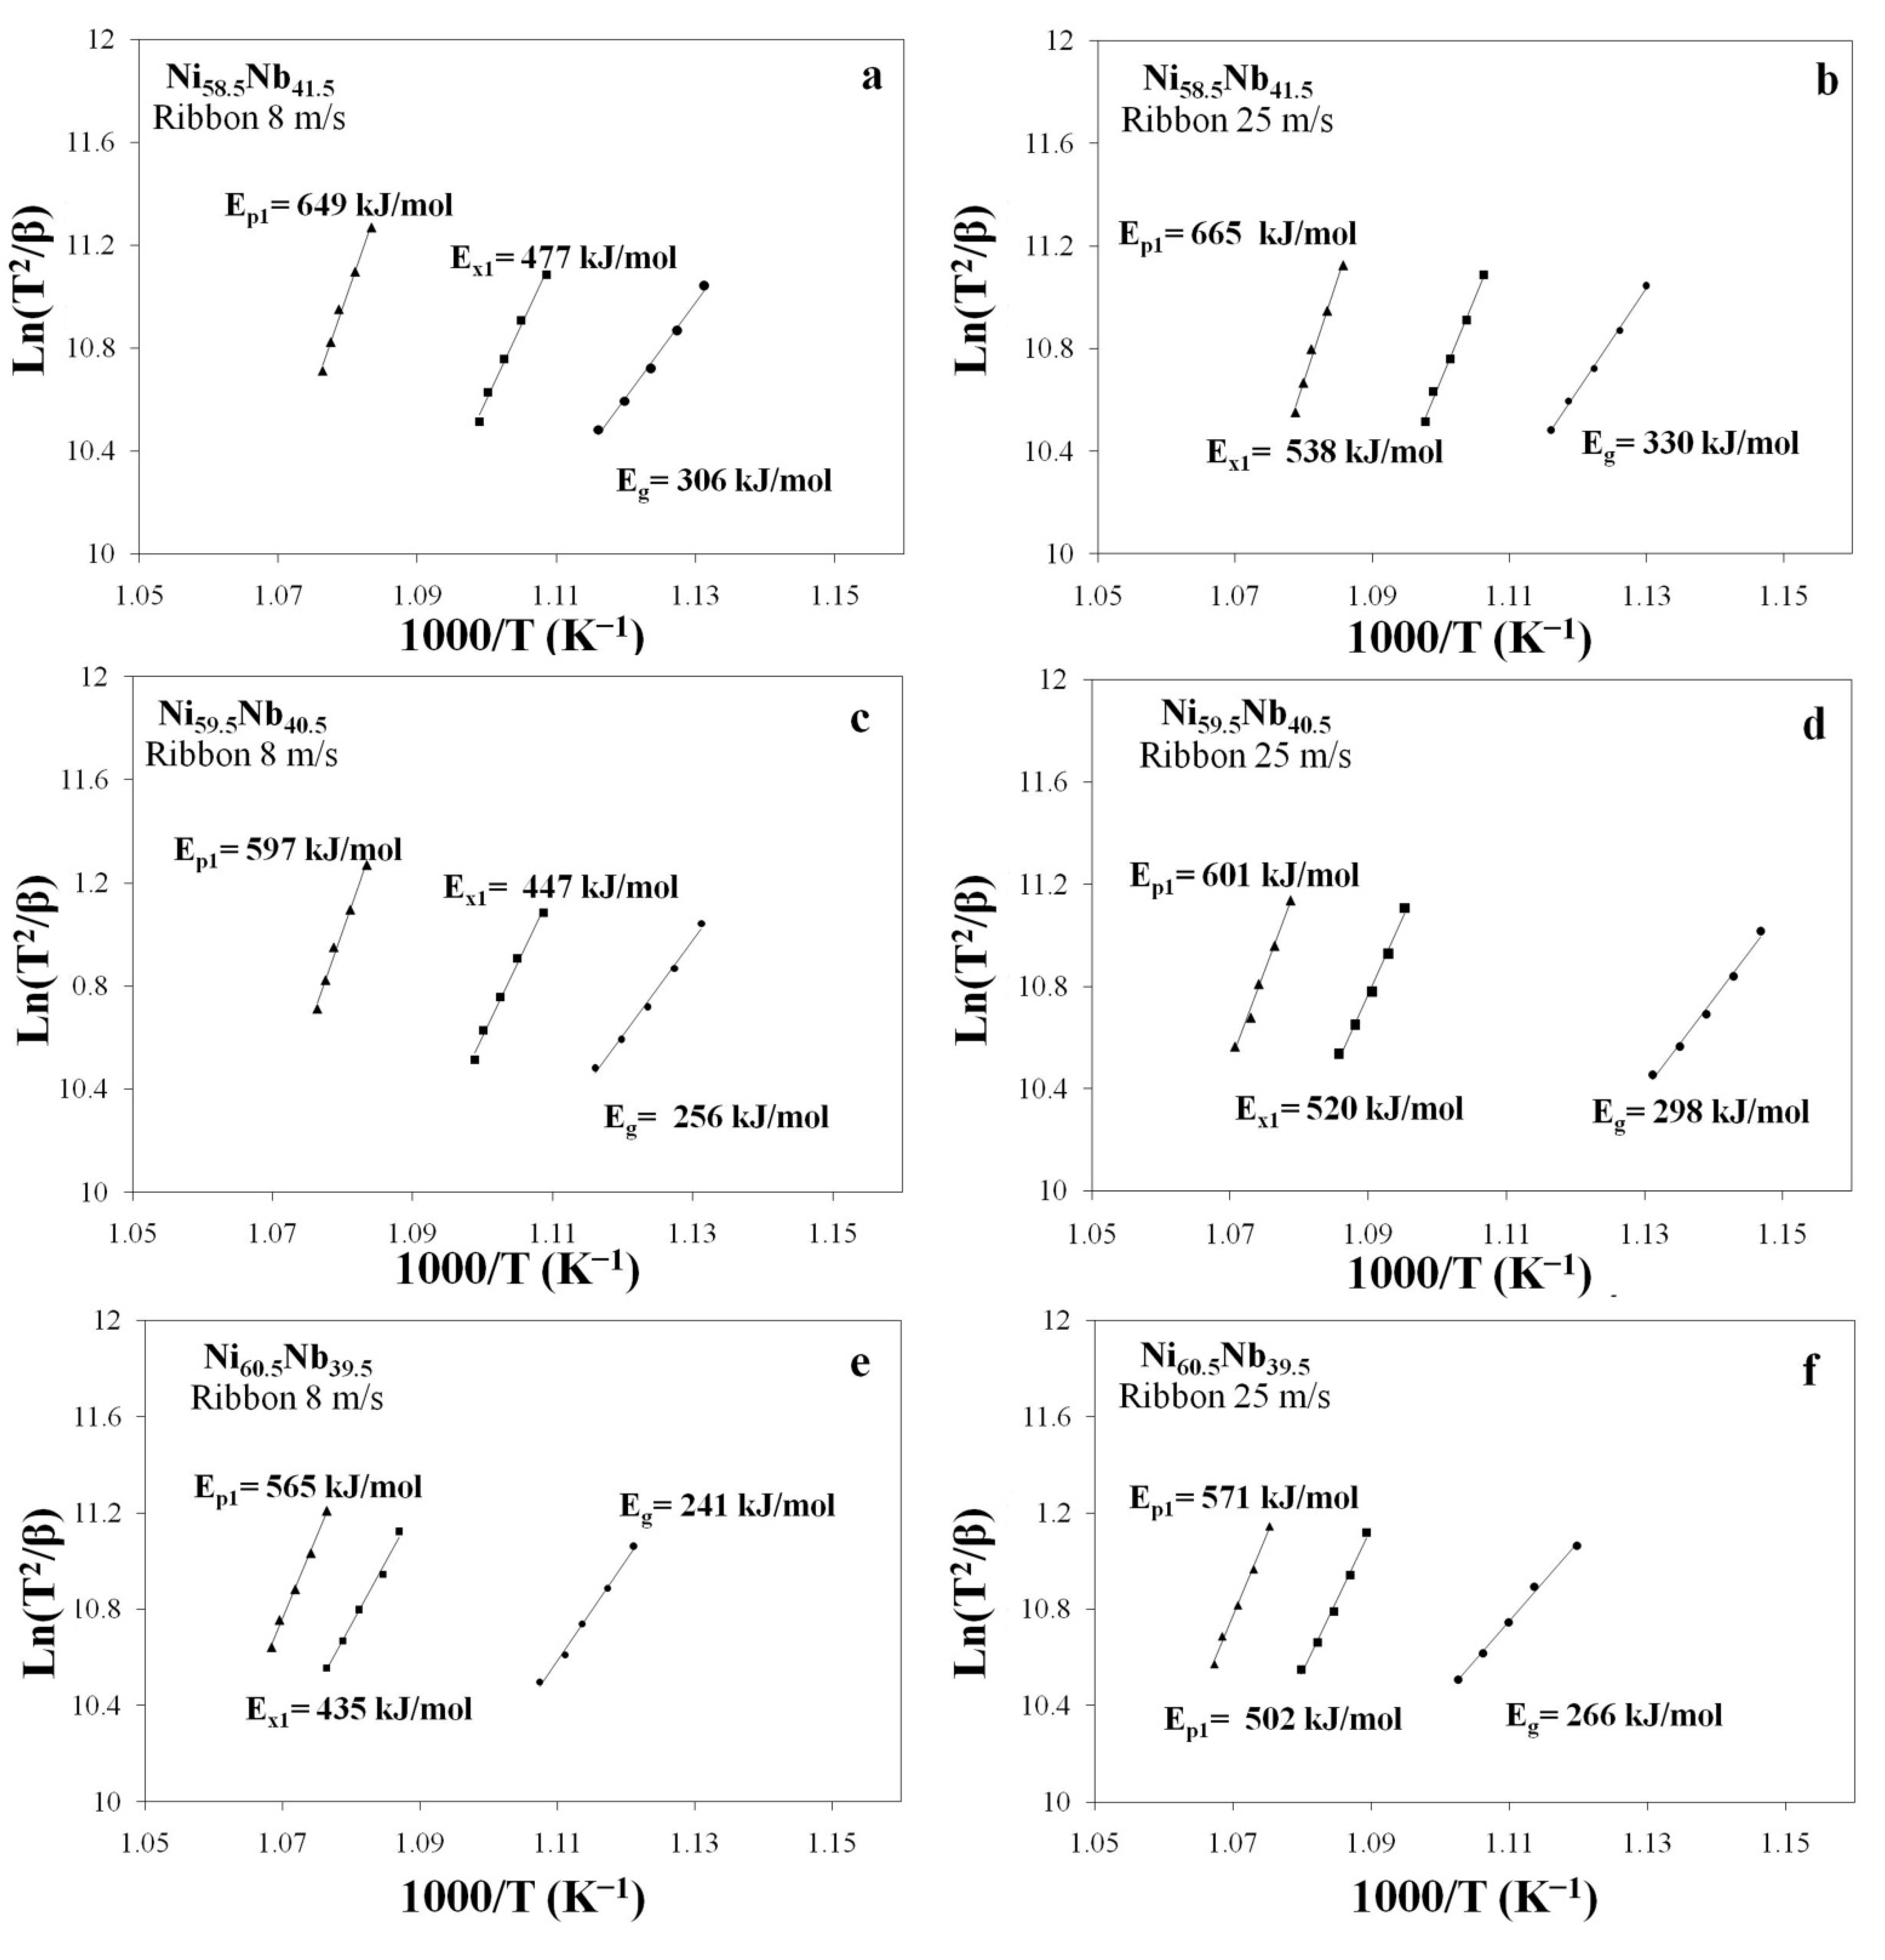
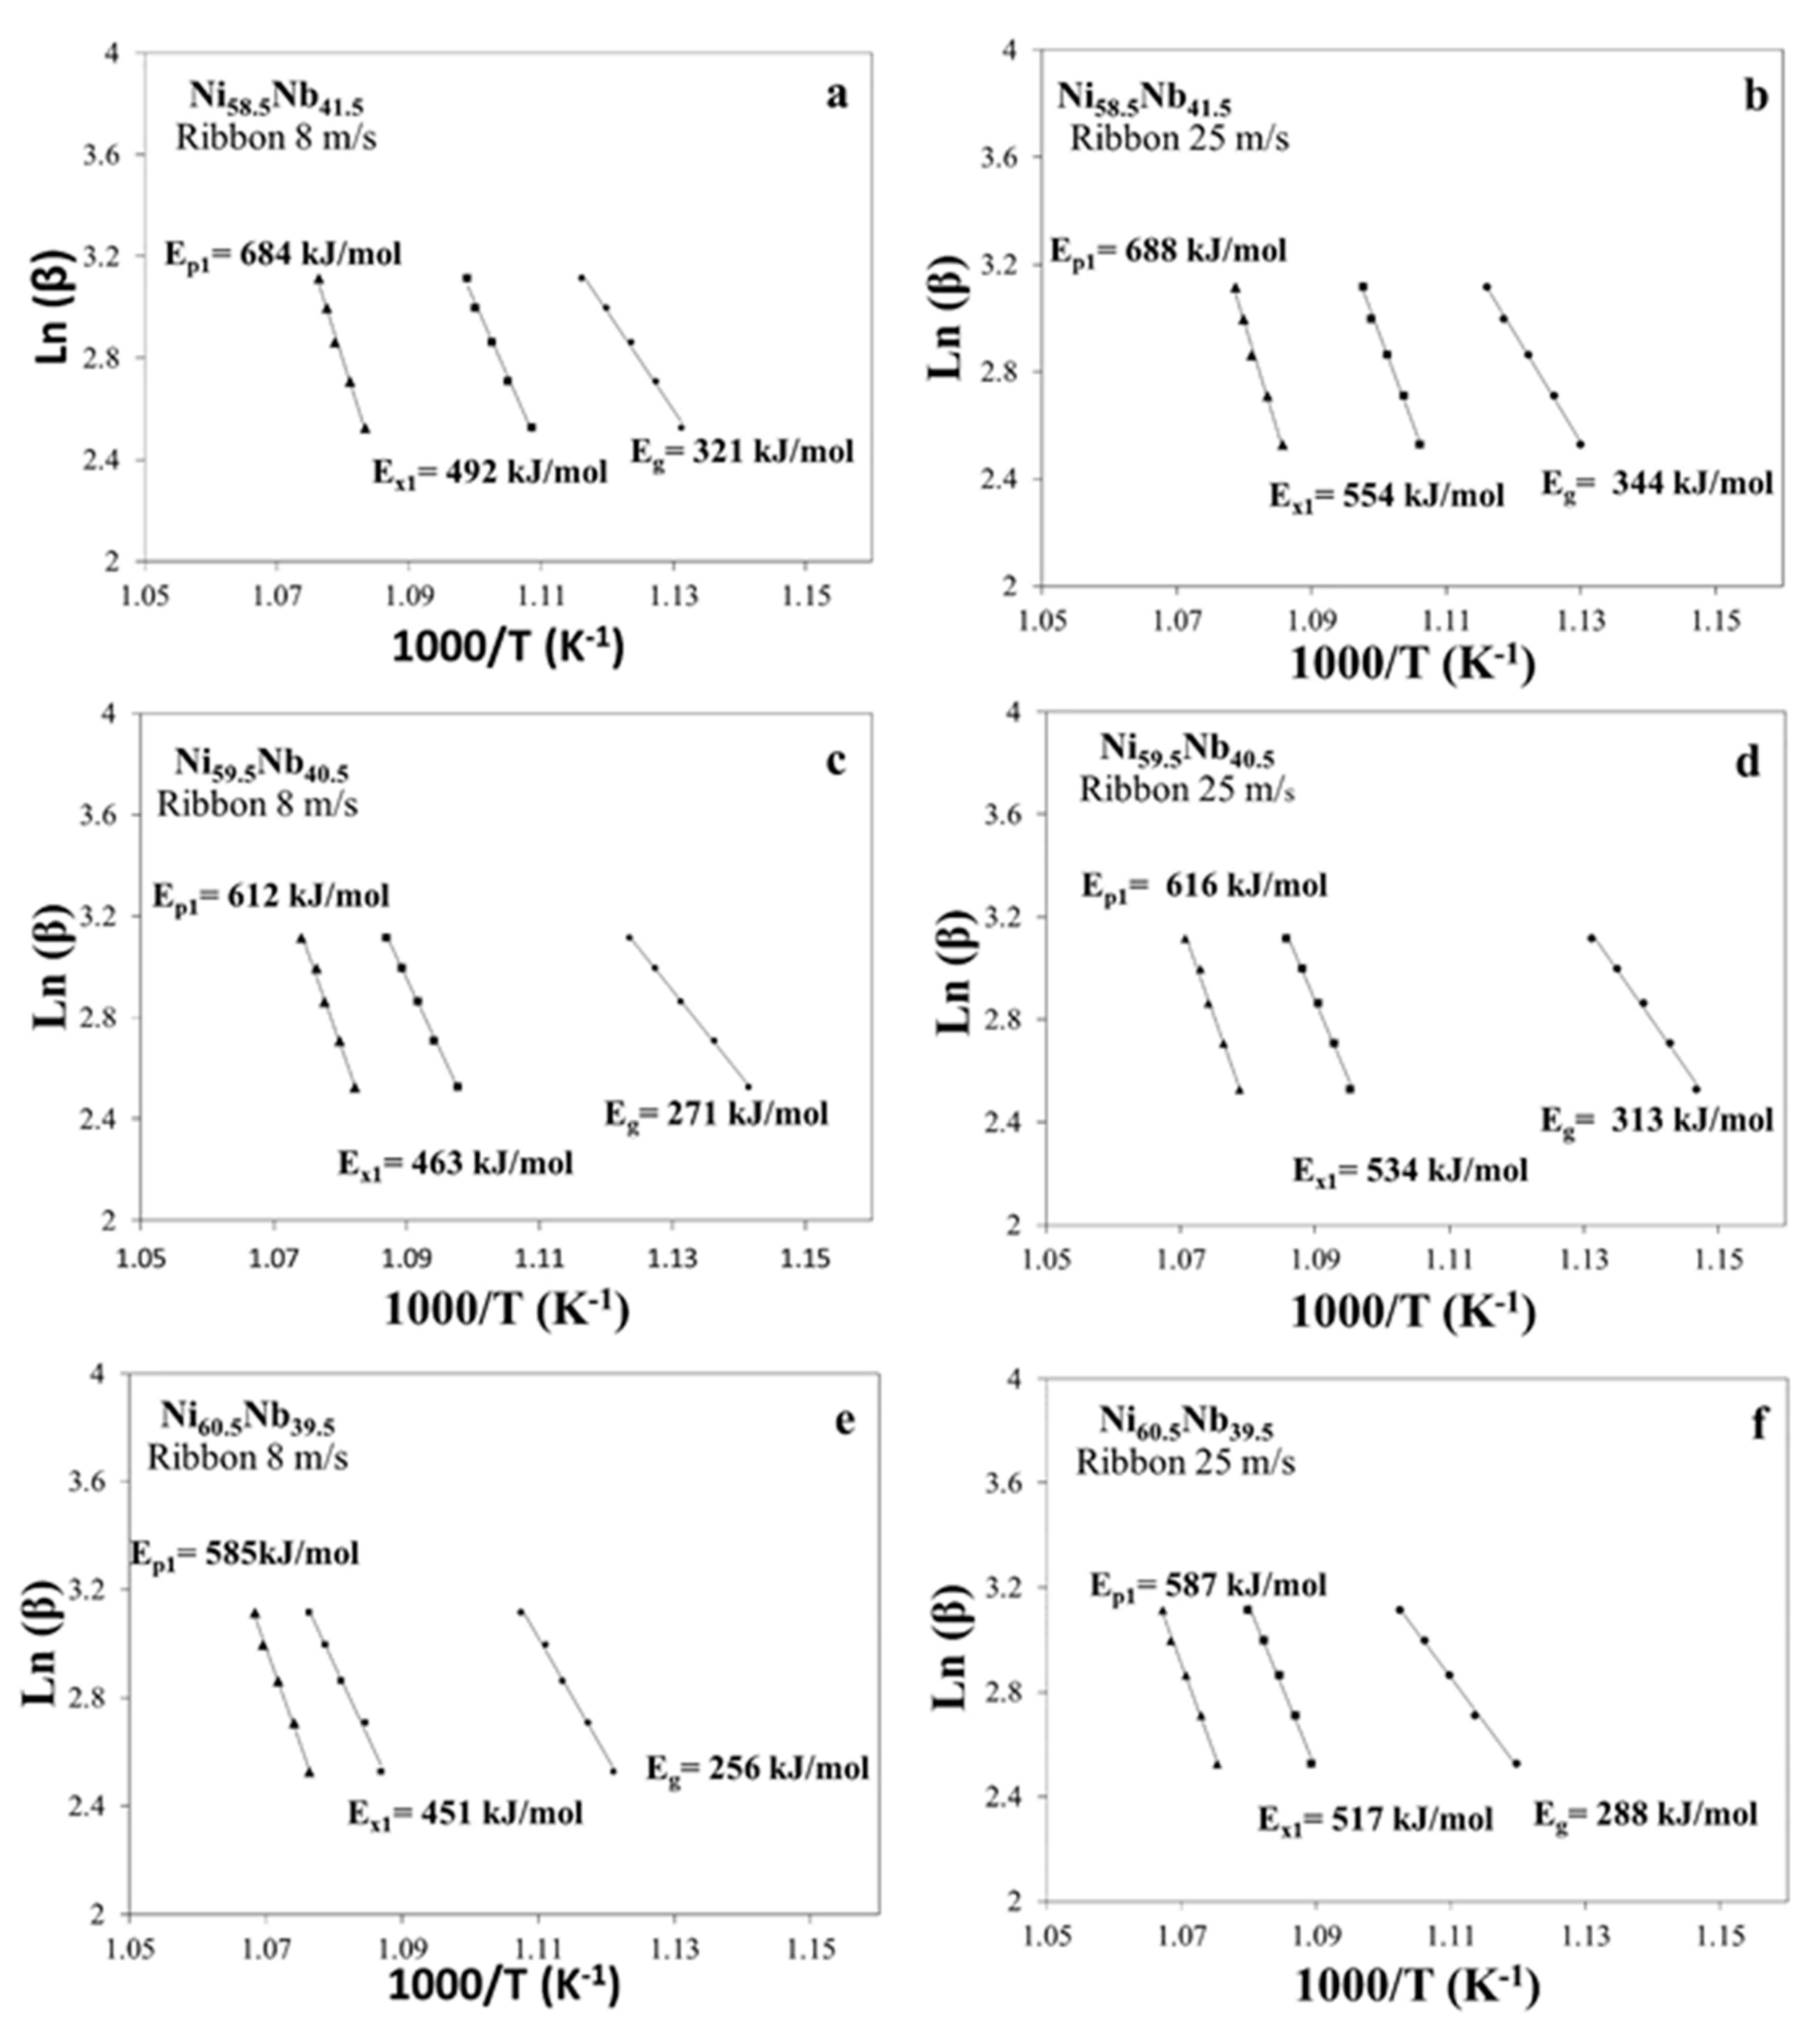
3.3. Iso-Conversional Kinetics

The thermal analysis results were processed through the iso-conversional methods or models, e.g., Kissinger [32] and Flynn–Wall–Ozawa [38]. The obtained data effectively elucidate the crystallization reactions behavior carried out during the heating process, i.e., consecutive reaction steps or a combination with the viscosity variation [39].

3.3.1. Kissinger Method for Ribbons Cast at 8 and 25 m/s

The Kissinger method can be applied for a number of other thermally activated events, i.e., precipitation, crystallization, etc. The Kissinger method can be expressed using the following equation [33].
L n β T 2 = E a R T + c o n s t a n t
where β is heating rate, T is the characteristic temperature at the specific heating rate (Tg, Tx1 and Tp1), Ea is the activation energy, R is the universal gas constant.
Figure 5a–f, shows the Kissinger plots for ribbons cast at 8 m/s and 25 m/s. The data from the slopes of the straight lines in the plots and the activation energy values are shown in Table 3. The activation energies were calculated for the hyper, hypo and eutectic alloy compositions using the Kissinger method. The energies calculated were the activation energy of the glass transition, activation energy of the first crystallization onset, and first peak temperature (Eg, Ex1, Ep1, respectively). In general terms, the results obtained for the calculated activation energies exhibited the following order: Ea(Ni58.5Nb41.5) > Ea(Ni59.5Nb40.5) > Ea(Ni60.5Nb39.5). The magnitude of Eg for the 25 m/s ribbons varied from 330 kJ/mol (hypereutectic alloy) to 266 kJ/mol (hypoeutectic alloy), confirming that the rearrangement of the atoms required less energy to carry out the transition from a glassy to a crystallized alloy, i.e., nucleation and grain growth. The activation energies for Ex1 and Ep1 are reduced when decreasing the Nb content; for instance, for the 25 m/s ribbons, the calculated values from the hyper to hypoeutectic alloys ranged from Ex1 = 554 kJ/mol to 517 K/mol and Ep1 from 688 to 587 kJ/mol. The activation energies calculated with the Kissinger method in this investigation are close to those reported by Collins et al. [40], where Ep1 = 628 kJ/mol (30–40 μm) and Pratten et al. [41] where Ep1 = 600 kJ/mol (50 μm) for ribbons of Ni60Nb40 alloy composition. These activation energy tendency values were also observed for the thicker ribbons. It was confirmed that in these types of alloys, with complex crystallization systems, more energy is required to grow the Ni3Nb and Ni6Nb7 phases than the activation energy of nucleation Ex1 of the same phases. Therefore, it was observed that the most stable alloy had the highest amount of Nb (hypereutectic alloy). In terms of thickness, the alloy ribbons cast at higher wheel speed showed the highest activation energies and, therefore, they are more stable, as more energy will be required to form a crystallized phase.

3.3.2. Kissinger Method for Ribbons Cast at 8 and 25 m/s

Another accepted model to describe the crystallization kinetics in metallic glasses is the Flyn–Wall–Ozawa (FWO) model. This model has also been used to calculate the activation energy of the crystallization process. The FWO model shows the dependence of ln (β) vs. 1000/T and calculates the activation energy (Ea). The model is represented in following equation [42].
l n ( β ) = E a R T + c o n s t a n t
where β is the heating rate, T is the characteristic temperature at the specific heating rate (Tg, Tx1 and Tp1), Ea is the activation energy, R is the universal gas constant.
Figure 6a–f, shows the FWO plots for cast ribbons at 8 m/s and 25 m/s. The activation energies values are summarized in Table 4. The activation energy (Ea) was calculated from ln(β) vs. 1/T of the FWO model. These results indicated that the activation energy (Eg, Ex1, and Ep1) decreased as a function of Nb content; for instance: for the Ni58.5Nb41.5 alloy (ribbon 25 m/s), Ep1 was 554 kJ/mol and for Ni60.5Nb39.5 Ep1 was 517 kJ/mol. In terms of ribbon thicknesses, the activation energies (Eg, Ex1, and Ep1) increased as the tangential Cu wheel speed raised (thinner ribbons). The Kissinger and FWO models confirmed that a lower energy Eg (endothermic peak) is required to carry out the glass transition, rearranging the atoms before the glassy alloy crystallization (first order phase transformation). On the other hand, the behavior of the Ex for the first stage of crystallization (exothermic peaks) showed smaller values than for Ep. Therefore, the nucleation of Ni6Nb7 and Ni3Nb crystalline phases requires less energy than that needed for grain growth. The values obtained through the FWO model showed that the activation energies are slightly higher than those calculated from the Kissinger method, being attributed to the normalization generated by T2 included in Equation (1). Furthermore, as the FWO model is an approximation method, deducted for complex crystallization systems, it has an error between 1 and 4% with respect to the Doyle approximation [38].

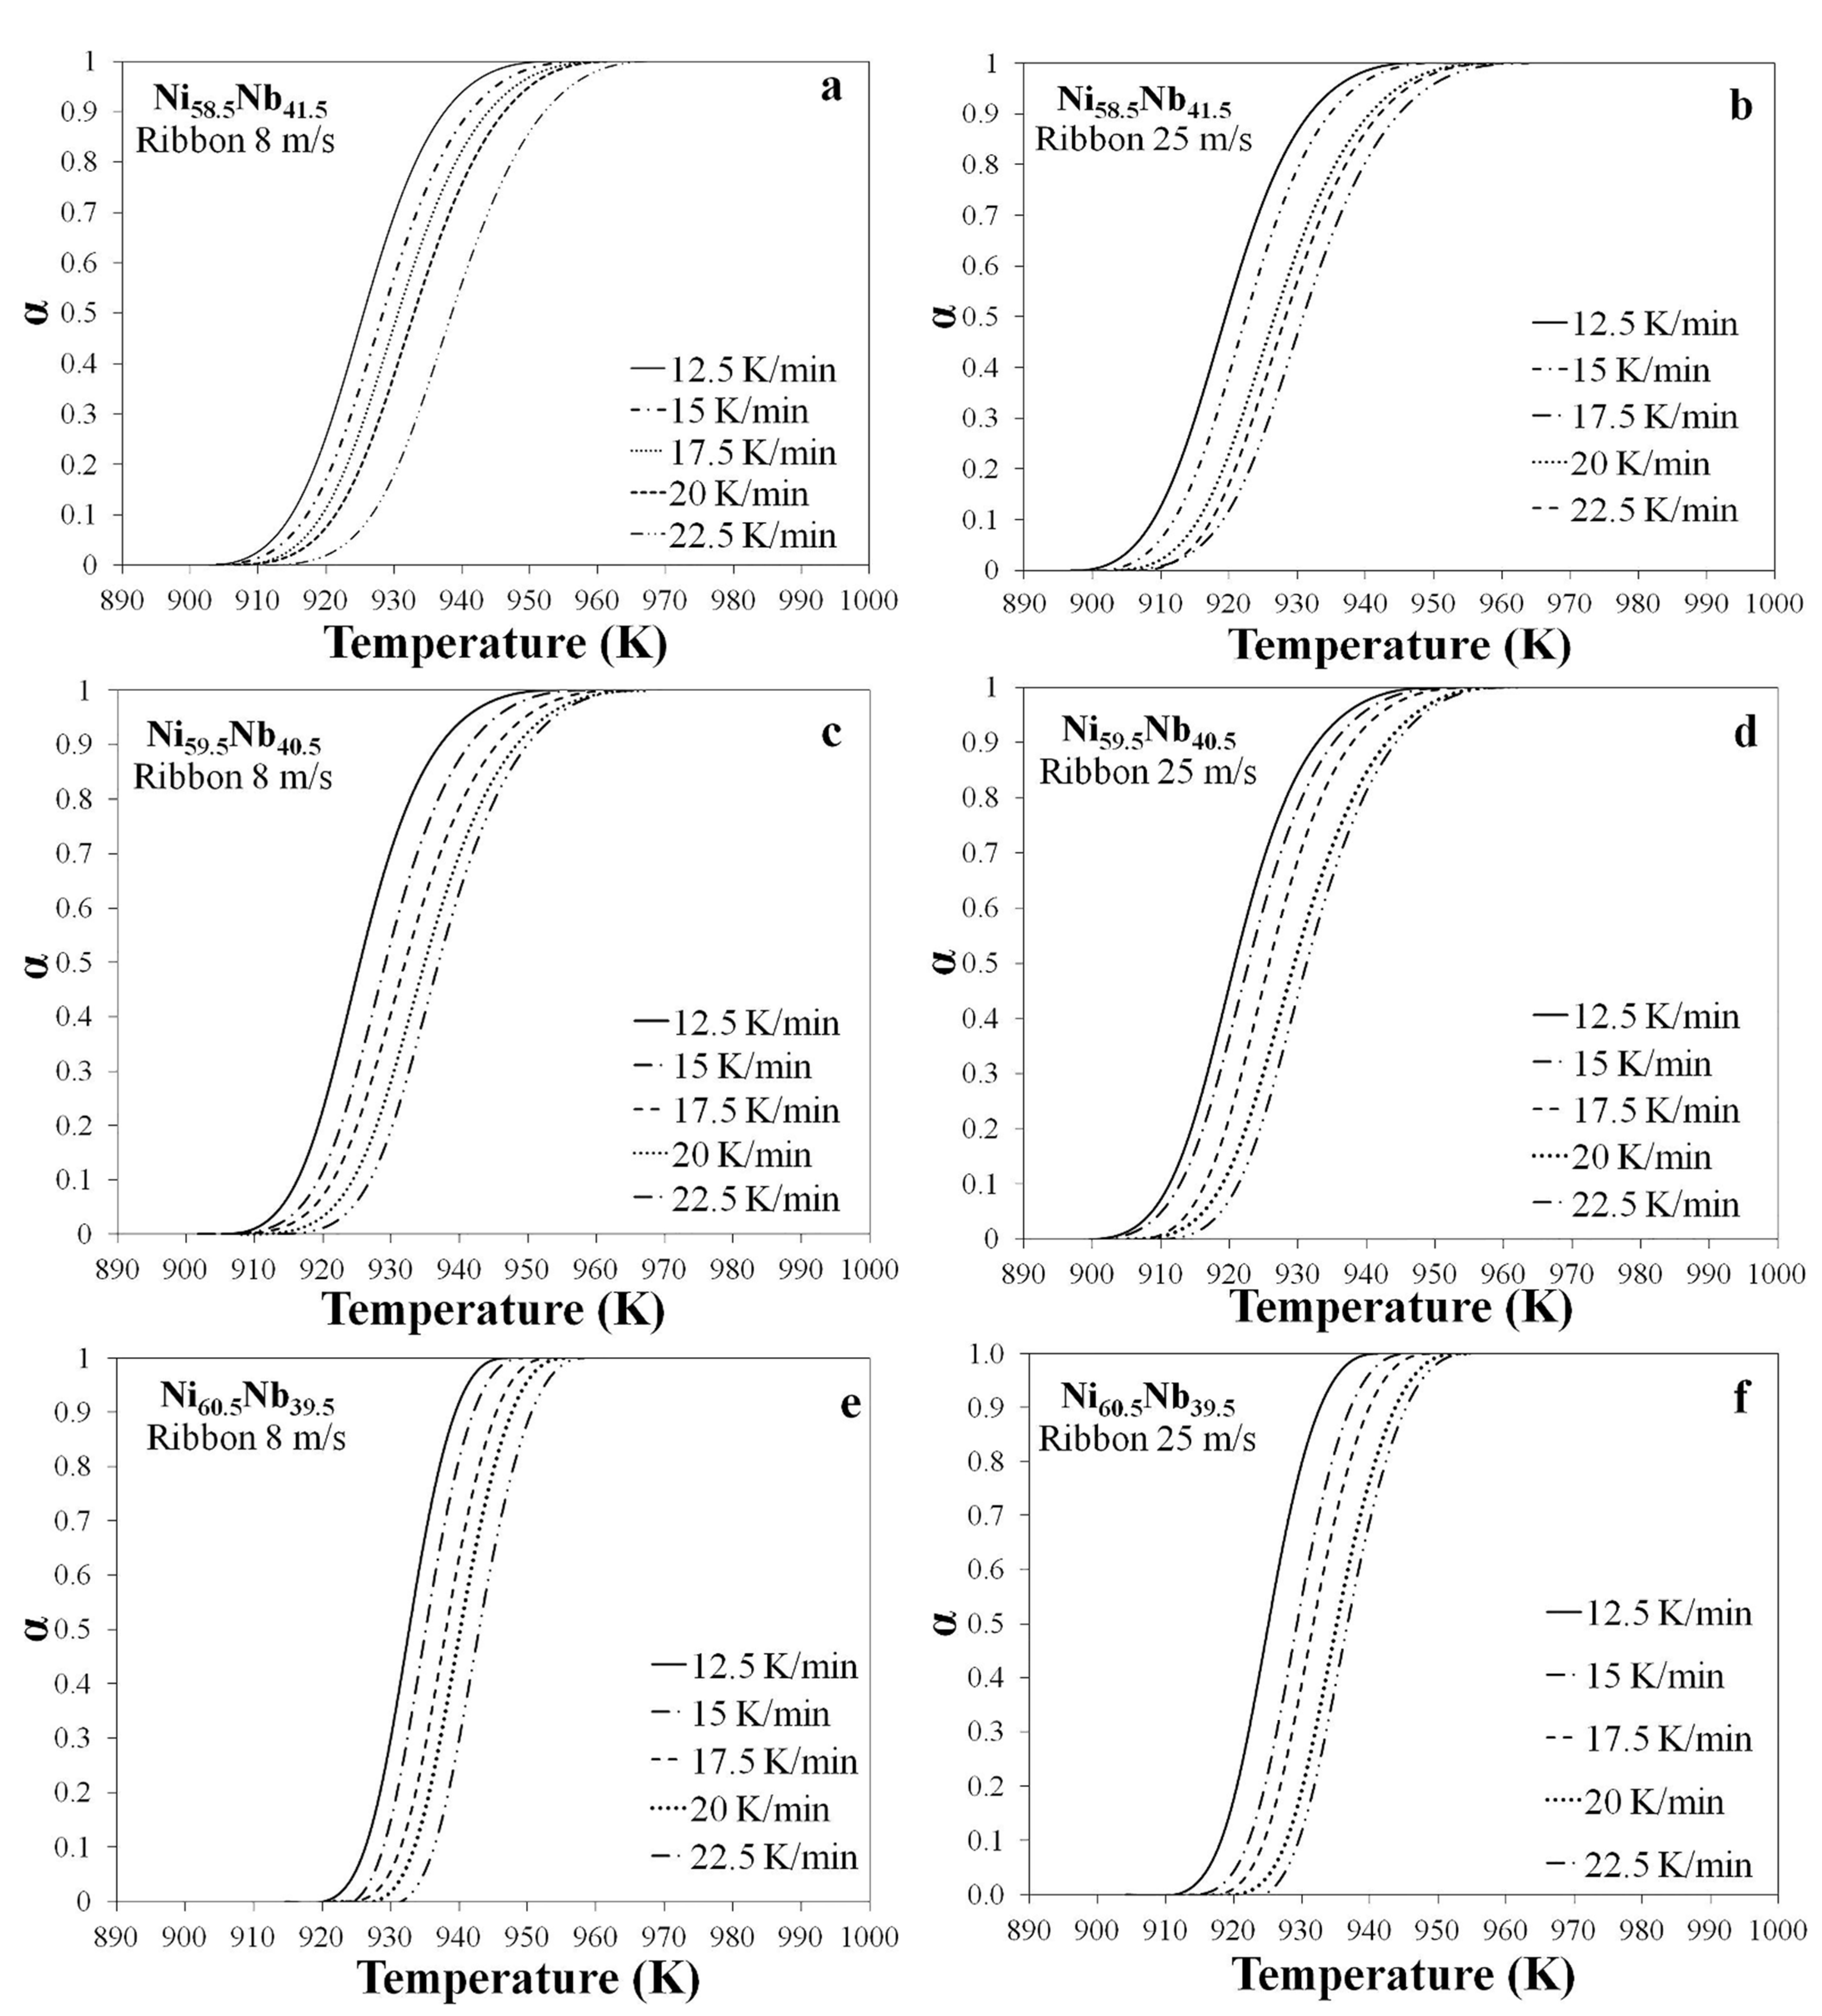
3.4. Crystallization Fraction

As is well known, the crystallization volume fraction is directly proportional to the fractional area of the exothermic heat flow peak area. Therefore, the crystallization fraction, α, was determined by the equation “α = AT/A”, where AT is the fraction area of crystallization peak between the onset of crystallization time (t0) and time t A is the total area of the exothermic crystallization peak. Figure 7a–f shows the correlation of α vs. temperature for the Ni58.5Nb41.5, Ni59.5Nb40.5, and Ni60.5Nb39.5 alloy ribbons cast at 8 m/s and 25 m/s. Here, the crystallization process displayed three stages: (1) slow nucleation for α < 0.1, (2) a stable crystallization reaction when temperature increased (grain grow), i.e., 0.1 < α < 0.9, and (3) a slow crystallization reaction when α > 0.9. The apparent crystallization fraction showed an α displacement to the right as a function of the heating rates. All curves showed the characteristic sigmoid behavior, i.e., the curves become steeper at higher heating rates. Eventually, the glassy samples will transform from a metastable to a stable state. In other words, the sigmoid shape of the curve indicates a slow phase transformation process at the early and late crystallization stages (α < 0.2 and α > 0.8). The initial part of the crystallization process could be attributed to the relatively high activation energy involved in the crystallization process. When the activation energy decreased, the transformation rate increased. The curve separations could be related to energy accumulation, i.e., the curve will be displaced even further to the right at a higher heating rate. At a low heating rate, the crystal nucleus size would be larger than at higher rating rates.

4. Conclusions

It has been experimentally demonstrated that the hypo, hyper and eutectic alloys showed a fully glassy phase in both ribbon thicknesses. A heating rate dependence of Trg and γ was observed. In all cases, these thermal parameters shifted progressively to a higher value. The magnitude of Trg = ~0.60 and γ = ~0.40 showed similar behavior in all studied alloys. In terms of thermal stability, the non-isothermal study revealed that the crystallization process takes place in two steps at Nb concentrations of 41.5 and 40.5 at.%. However, at Nb = 39.5% a third crystallization peak was observed, indicating a more complex crystallization process. These results proved that the alloy with the highest amount of Nb (hypereutectic alloy) required less temperature to crystallize. Thickness also played an important role, as the ribbons cast at higher wheel speed showed the highest activation energy, indicating that more energy will be required to form crystallized phases. In addition, with the Nb additions, the thermal stability increased, suppressing the nucleation and grain growth. This could be an indicative that, at least for this alloy, the probability of forming a bulk metallic glass is high. The activation energy (Eg, Ex1, and Ep1) is a function of Nb content. The Ni58.5Nb41.5 alloy showed the highest activation energies values in both thicknesses. This study also showed that the highest thermal stability demonstrated with the Kissinger method and Flynn–Wall–Ozawa models corresponded to alloys with high Nb content. These models also confirmed that less energy Eg (endothermic peak) is required to carry out the glass transition. Finally, the nucleation of Ni6Nb7 and Ni3Nb crystalline phases required less energy than grain growth.

Author Contributions

Conceptualization, L.E.M. and I.A.F.; methodology, E.O. and L.E.M.; software, L.E.M. and J.M.H.; investigation, L.E.M. and I.A.F.; resources, I.A.F. and J.G.G.; writing—original draft preparation, L.E.M., I.A.F., J.G.G. and O.L.; writing—review and editing, I.A.F. and O.L.; supervision, J.G.G., I.A.F. and E.O.; project administration, I.A.F. and E.O.; funding acquisition, I.A.F. and J.G.G. All authors have read and agreed to the published version of the manuscript.

Funding

This research was funded by UNAM-DGAPA-PAPIIT, grant number IN102422. G.G. acknowledges UNAM-DGAPA-PASPA the funding for the sabbatical year.

Data Availability Statement

Acknowledgments

A. Tejeda, R. Reyes, L. Bazan, J. Romero, C. Flores Morales, A. Bobadilla, G. A. Lara-Rodríguez, A. López-Vivas, A. Pompa, A. Ortega, K. E. Reyes, E. Hernández, F. García and C. Ramos are also acknowledged for their valuable technical support.

Conflicts of Interest

The authors declare no conflict of interest. The funders had no role in the design of the study; in the collection, analyses, or interpretation of data; in the writing of the manuscript, or in the decision to publish the results.

References

  1. Oreshkin, A.; Mantesevich, V.; Savinov, S.; Oreshkin, S.; Panov, V.; Maslova, N.; Louzguine-Louzgin, D. Direct visualization of Ni-Nb metallic glasses surface: From initial nucleation to full crystallization. J. Appl. Phys. Lett. 2012, 101, 181601. [Google Scholar] [CrossRef]
  2. Krimer, Y.; Aronhime, N.; Ohodnicki, P.; McHenry, M.E. Prediction of good glass forming ability in amorphous soft magnetic alloys by thermocalc simulation with experimental validation. J. Alloys Compd. 2020, 814, 152294. [Google Scholar] [CrossRef]
  3. Zhang, C.; Ji, X.; Wang, J.; Lu, L.; Yang, Z.; Lyu, P.; Guan, Q.; Cai, J. Amorphization and nano-crystallization of Ni-Nb coating on GH3039 alloys by high current pulsed electron beam. Nanomaterials 2021, 11, 347. [Google Scholar] [CrossRef] [PubMed]
  4. Nagase, T.; Ueda, M.; Umakoshi, Y. Preparation of Ni-Nb-based metallic glass wires by arc-melt-type melt-extraction method. J. Alloys Compd. 2009, 485, 304–312. [Google Scholar] [CrossRef]
  5. Arai, K.; Zhang, W.; Jia, F.; Inoue, A. Synthesis and thermal stability of new Ni-based bulk glassy alloy with excellent mechanical properties. Mater. Trans. 2006, 17, 2358–2362. [Google Scholar] [CrossRef] [Green Version]
  6. Lee, M.; Bae, D.; Kim, W.; Kim, D. Ni-based refractory bulk amorphous alloys with high thermal stability. Mater. Trans. 2003, 4, 2084–2087. [Google Scholar] [CrossRef] [Green Version]
  7. Suryanarayana, C.; Seki, I.; Inoue, A. A critical analysis of the Glass-forming ability of alloys. J. Non-Cryst. Solids. 2009, 355, 355–360. [Google Scholar] [CrossRef]
  8. Li, J.H.; Dai, Y.; Cui, Y.Y.; Liu, B.X. Atomistic theory for predicting the binary metallic glass formation. Mater. Sci. Eng. R. 2011, 72, 1–28. [Google Scholar] [CrossRef]
  9. Amini, N.; Pries, J.; Cheng, Y.; Persch, C.; Wutting, M.; Stolpe, M.; Wei, S. Thermodynamics and kinetics of glassy and liquid phase-change materials. Mater. Sci. Semicond. Process. 2021, 135, 106094. [Google Scholar] [CrossRef]
  10. Takeuchi, A.; Inoue, A. Classification of bulk metallic glasses by atomic size difference, heat of mixing and period constituent elements and its application to characterization of the main alloying element. Mater. Trans. 2005, 46, 2817–2829. [Google Scholar] [CrossRef] [Green Version]
  11. Kalb, J.; Spaaepen, F. Caloric measurements of phase transformatios in thin films of amorphous Te alloys used for optical data storage. J. Appl. Phys. 2003, 93, 2389. [Google Scholar] [CrossRef]
  12. Lozada-Flores, O.; Figueroa, I.A.; Lara, G.A.; Gonzalez, G.; Borja-Soto, C.; Verduzco, J.A. Crystallization kinetics of Cu55Hf45 glassy alloy. J. Non-Cryst. Solids. 2017, 460, 1–5. [Google Scholar] [CrossRef]
  13. Jiang, Y.H.; Li, D.; Liu, F.; Liang, S.H. Crystallization kinetics of Cu33Zr67 amorphous alloy during cooling annealing. Mater. Lett. 2016, 181, 292–295. [Google Scholar] [CrossRef]
  14. Mukherjee, S.; Zhou, Z.; Johnson, W.L.; Rhim, W.K. Thermophysical properties of Ni-Nb and Ni-Nb-Sn Bulk metallic glass-forming melts by containerless electrostatic levitation processing. J. Non-Cryst. Solids. 2004, 337, 21–28. [Google Scholar] [CrossRef]
  15. Zhu, Z.; Zhang, H.; Pan, D.; Sun, W.; Hu, Z. Fabrication of Binary Ni-Nb bulk Metallic Glass with High strength and compressive plasticity. Adv. Eng. Mater. 2006, 8, 953–957. [Google Scholar] [CrossRef]
  16. Reddy, K.V.; Pal, S. Contribution of Nb towards enhancement of glass forming ability and plasticity of Ni-Nb binary metallic glass. J. Non-Cryst. Solids. 2017, 471, 243–250. [Google Scholar] [CrossRef]
  17. Kreuch, G.; Hafner, J. Concentration dependence of the local order in amorphous Ni-Nb alloys. J. Non-Cryst. Solids. 1995, 189, 227–241. [Google Scholar] [CrossRef]
  18. Leonhardt, M.; Löser, W.; Lindenkreuz, H.G. Solidification kinetics and phase formation of undercooled eutectic Ni-Nb melts. Acta Mater. 1999, 47, 2961–2968. [Google Scholar] [CrossRef]
  19. Xia, L.; Li, W.H.; Fang, S.S.; Wei, B.C.; Dong, Y.D. Binary Ni-Nb bulk metallic glasses. J. Appl. Phys. 2006, 99, 026103. [Google Scholar] [CrossRef] [Green Version]
  20. Nowosielski, R.; Januszka, A.; Pilarczyk, W. Glass forming ability of binary Ni60+xNb40−x (x = 0; 1; 2) alloys. J. Achiev. Mater. Manuf. Eng. 2010, 42, 73–80. [Google Scholar]
  21. Lesz, S.; Dercz, G. Study on crystallization phenomenon and thermal stability of binary Ni-Nb amorphous alloy. J. Therm. Anal. Cal. 2016, 126, 19–26. [Google Scholar] [CrossRef] [Green Version]
  22. Oreshkin, A.I.; Mantsevich, V.N.; Savinov, S.V.; Oreshkin, S.I.; Panov, V.I.; Yavari, A.R.; Miracle, D.B.; Louzguine-Luzgin, D.V. In situ visualization of Ni-Nb bulk metallic glasses phase transition. Acta Mater. 2018, 61, 5216–5222. [Google Scholar] [CrossRef] [Green Version]
  23. Chang, H.J.; Park, E.S.; Jung, Y.S.; Kim, M.K.; Kim, D.H. The effect of Zr addition in glass forming ability of Ni-Nb alloy system. J. Alloys Compd. 2007, 434–435, 156–159. [Google Scholar] [CrossRef]
  24. Santos, F.S.; Kiminami, C.S.; Bolfarini, C.; de Oliveira, M.F.; Botta, W.J. Evaluation of glass forming ability in the Ni-Nb-Zr alloy system by the topological instability (λ) criterion. J. Alloys Compd. 2010, 495, 313–315. [Google Scholar] [CrossRef]
  25. Zhang, P.; Wang, Z.; Perepezco, J.H.; Voyles, P.M. Vitrification, crystallization, and atomic structure of deformed and quenched Ni60Nb40 metallic glass. J. Non-Cryst. Solids. 2018, 491, 133–140. [Google Scholar] [CrossRef]
  26. Enayati, M.H. Crystallization behavior of Ni-Nb amorphous alloys. Sci. Iranica. 2002, 9, 157–161. [Google Scholar]
  27. Afonso, C.R.M.; Martinez-Orozco, K.; Amigó, V.; Della, C.A.; Spinelli, J.; Kiminami, C.S. Characterization, corrotion resistance and hardness of rapidly solidified Ni-Nb alloys. J. Alloys Compd. 2020, 829, 154529. [Google Scholar] [CrossRef]
  28. Yuan, C.C.; Yang, Y.F.; Xi, X.K. Atomic and electronic structure of Ni-Nb metallic glasses. J. Appl. Phys. 2013, 114, 213511. [Google Scholar] [CrossRef]
  29. Xu, T.D.; Wang, X.D.; Zhang, H.; Cao, Q.P.; Zhang, D.X.; Jiang, J.Z. Structural evolution and atomic dynamics in Ni-Nb metallic glasses: A molecular dynamics study. J. Chem. Phys. 2017, 147, 144503. [Google Scholar] [CrossRef]
  30. Vazquez, J.; Villares, P.; Jiménez-Garay, R. A theoretical method for deducing the evolution with time of the fraction crystallized and obtaining the kinetic parameters by DSC, using non-isothermal techniques. J. Alloys Compd. 1997, 257, 259–265. [Google Scholar] [CrossRef]
  31. Kissinger, H.E. Reaction Kinetics in Differential Thermal Analysis. Anal. Chem. 1957, 29, 1702–1706. [Google Scholar] [CrossRef]
  32. Sánchez-Jiménez, P.E.; Criado, J.M.; Pérez-Maqueda, L.A. Kissinger Kinetic Analysis of Data Obtained Under Different Heating Schedules. J. Therm. Anal. Cal. 2008, 94, 427–432. [Google Scholar] [CrossRef] [Green Version]
  33. Khond, A.; Adil, S.; Guruvidyatrh, K.; Murty, B.; Majumdar, B.; Bhatt, J.; Srvastav, A. Kinetics and phase formation during crystallization of Hf64Cu18Ni18 amorphous alloy. Phase Transit. 2021, 94, 110–121. [Google Scholar] [CrossRef]
  34. ICDD. International Center for Difraction Data ICDD. Available online: http://www.icdd.com/ (accessed on 21 February 2022).
  35. Massalski, T. Binary Alloy Phase Diagrams, 2nd ed.; American Society for Metals: Russell Township: Geauga County, OH, USA, 1986; pp. 1681–1682. [Google Scholar]
  36. Turnbull, D. Metastable Structures in Metallurgy. Metall. Mater. Trans. A. 1980, 12A, 695–708. [Google Scholar]
  37. Lu, Z.P.; Liu, C.T. A new glass-forming ability criterion for bulk metallic glasses. Acta Mater. 2002, 50, 3501–3512. [Google Scholar] [CrossRef]
  38. Opfermann, J.; Kaisersberger, E. An advantageus variant of the Ozawa-Flynn-Wall analysis. Thermochim. Acta. 1992, 203, 167–175. [Google Scholar] [CrossRef]
  39. Han, X.; Ding, F.; Qin, Y.; Wu, D.; Xing, H.; Shi, Y.; Song, K.; Cao, C. Compositional dependence of crystallization kinetics in Zr-Ni-Al metallic glasses. Vacuum 2018, 151, 30–38. [Google Scholar] [CrossRef]
  40. Collins, L.E.; Grant, N.J.; Vander, J.B. Crystallization of amorphous Ni60Nb40. J. Mater. Sci. 1983, 18, 804–814. [Google Scholar] [CrossRef]
  41. Pratten, N.A.; Scott, M.G. Satability of some metalloid-free metallic glasses. Scr. Metall 1977, 12, 2. [Google Scholar]
  42. Starink, M.J. The determination of activation energy from linear heating rateexperiments: A comparision of the accuracy of isoconversión methods. Thermochim. Acta. 2003, 404, 163–176. [Google Scholar] [CrossRef] [Green Version]
Figure 1. XRD patterns of ingots Ni58.5Nb41.5, Ni59.5Nb40.5, and Ni60.5Nb39.5 alloys.
Metals 12 00808 g001
Figure 2. (a,b). XRD patterns of ribbons cast at 8 and 25 m/s for the Ni58.5Nb41.5, Ni59.5Nb40.5 and Ni60.5Nb39.5 alloys.
Metals 12 00808 g002
Figure 3. DSC curves of Ni58.5Nb41.5, Ni59.5Nb40.5, and Ni60.5Nb39.5 ribbons at a heating rate of 20 K/min.
Metals 12 00808 g003
Figure 4. (af). DSC curves of Ni58.5Nb41.5, Ni59.5Nb40.5, and Ni60.5Nb39.5 alloy ribbons cast at 8 and 25 m/s.
Metals 12 00808 g004
Figure 5. (af). Kissinger plots of Ln (β/T2) vs. 1000/T (T = Tg, Tx1 and Tp1) from 8 m/s (a,c,e) and 25 m/s (b,d,f) ribbons of Ni58.5Nb41.5, Ni59.5Nb40.5 and Ni60.5Nb39.5 alloys.
Metals 12 00808 g005
Figure 6. (af). Flynn–Wall–Ozawa calculated with Ln (β/T2) vs. 1000/T (T= Tg, Tx1 and Tp1) for 8 m/s (a,c,e) and 25 m/s (b,d,f) cast ribbons for the Ni58.5Nb41.5, Ni59.5Nb40.5, and Ni60.5Nb39.5 alloys.
Metals 12 00808 g006
Figure 7. (af). Plots α vs. Nb%, from 8 m/s and 25 m/s ribbons of Ni58.5Nb41.5, Ni59.5Nb40.5 and Ni60.5Nb39.5 alloys.
Metals 12 00808 g007
Table 1. Thermal parameters of Ni58.5Nb41.5, Ni59.5Nb40.5, and Ni60.5Nb39.5 ribbons cast at 8 m/s.
AlloyHeating Rate
(K/min)
Tg
(K)
Tx1
(K)
Tp1
(K)
Tx2
(K)
Tp2
(K)
Tp3
(K)
ΔTx
(K)
Tm
(K)
Tl
(K)
TrgγThickness
(μm)
Ni58.5Nb41.512.5884902923982990---18144714720.600.39105
15887905925985995---180.600.39
17.5890907927988999---170.600.39
208939099289911002---160.610.39
22.58969109299931005---140.610.39
Ni59.5Nb40.512.5876911924969977---35144514720.600.39130
15880914926972981---340.600.39
17.5884916928974985---320.600.39
20887918929976988---310.600.39
22.5890920931978991---300.600.39
Ni60.5Nb39.512.588792092995196097728144914740.600.39140
15891922931954963980270.600.39
17.5895925933956965983270.610.39
20899927935958968986270.610.39
22.5902929936960970988260.610.39
Table 2. Thermal parameters of Ni58.5Nb41.5, Ni59.5Nb40.5, and Ni60.5Nb39.5 ribbons cast at 25 m/s.
AlloyHeating Rate
(K/min)
Tg
(K)
Tx1
(K)
Tp1
(K)
Tx2
(K)
Tp2
(K)
Tp3
(K)
ΔTx
(K)
Tm
(K)
Tl
(K)
TrgγThickness
(μm)
Ni58.5Nb41.512.5
15
17.5
20
22.5
885
888
891
894
896
904
906
908
910
911
921
923
925
926
927
969
977
979
975
982
980
987
990
987
994
---
---
---
---
---
19
18
17
16
15
145014710.60
0.60
0.60
0.61
0.61
0.38
0.38
0.38
0.38
0.38
45
Ni59.5Nb40.512.5
15
17.5
20
22.5
872
875
878
881
884
913
915
917
919
921
927
929
931
932
934
968
972
967
972
978
979
982
977
982
989
---
---
---
---
---
41
40
39
38
37
144714660.60
0.60
0.60
0.60
0.60
0.39
0.39
0.39
0.39
0.39
50
Ni60.5Nb39.512.5
15
17.5
20
22.5
893
898
901
904
907
918
920
922
924
926
930
932
934
936
937
962
964
967
970
972
986
988
992
994
997
995
997
1003
1007
1012
25
22
21
20
19
145014690.61
0.61
0.61
0.61
0.61
0.39
0.39
0.39
0.39
0.39
60
Table 3. Activation energies Eg, Ex1 and Ep1 for the crystallization of Ni58.5Nb41.5, Ni59.5Nb40.5 and Ni60.5Nb39.5 glassy ribbons cast at 8 and 25 m/s (Kissinger method).
AlloyRibbon
(m/s)
EgEx1Ep1
(kJ/mol)
Ni58.5Nb41.58306477649
25330538665
Ni59.5Nb40.58256447597
25298520601
Ni60.5Nb39.58241435565
25266502571
Table 4. Activation energies Eg, Ex1, and Ep1 for 8 and 25 m/s cast ribbons for the Ni58.5Nb41.5, Ni59.5Nb40.5, and Ni60.5Nb39.5 alloys (FWO model).
AlloyRibbon
(m/s)
EgEx1Ep1
(kJ/mol)
Ni58.5Nb41.58321492684
25344554688
Ni59.5Nb40.58271463612
25313534616
Ni60.5Nb39.58256451585
25288517587
Publisher’s Note: MDPI stays neutral with regard to jurisdictional claims in published maps and institutional affiliations.

