Article

Evolution of Microstructure and Hardness of the Nitrided Zone during Plasma Nitriding of High-Alloy Tool Steel

1
Materials and Surface Engineering Group, Institute of Materials Science and Engineering, Chemnitz University of Technology, D-09107 Chemnitz, Germany
2
Institute for Surface Technology, University of Technology Braunschweig, D-38108 Braunschweig, Germany
*
Author to whom correspondence should be addressed.
Metals 2022, 12(5), 866; https://doi.org/10.3390/met12050866
Submission received: 15 March 2022 / Revised: 4 May 2022 / Accepted: 6 May 2022 / Published: 19 May 2022

Abstract

:
Plasma nitriding is widely used in various industrial applications to improve surface hardness and wear properties. Especially for tool steels, it is also used to improve the support and adhesion of diamond-like carbon (DLC) coatings. The properties of the nitrided zone produced by plasma nitriding are influenced by the applied process parameter, in particular temperature and time. However, for high-alloy tool steels, a deeper understanding of the underlying diffusion processes of the nitrogen and the interaction with the existing microstructure, as well as the effects on the case depth is still lacking. Therefore, in this study, specimens of high-alloy tool steel X153CrMoV12 were plasma nitrided at varying temperatures (480 °C, 520 °C, 560 °C) and treatment times (2 h, 4 h, 16 h). The resulting nitrided zones were investigated by optical and scanning electron microscopy (OM and SEM), depth-dependent glow discharge optical emission spectroscopy (GDOES), X-ray diffraction (XRD), and hardness measurements to characterize their microstructure, chemical composition, and hardness depending on the process parameters. The distribution of carbides (M7C3), e.g., chromium carbides, affects the diffusion of the nitrogen and the layer growth. An increase of temperature and duration leads to an increased layer thickness. The composition of the compound layer is, e.g., influenced by the process parameters: ε nitrides (Fe2–3N) occurred preferentially at lower temperatures, while γ nitrides (Fe4N) appeared mostly at higher temperatures. In order to investigate the influence of the carbides of the high-alloy tool steel on the nitriding process, a new methodology was developed by means of finite element analysis (FE), which makes it possible to analyze this influence on the development of the nitrogen concentration profile. This methodology makes it possible for the first time to map the heterogeneous nitrogen evolution and distribution.

1. Introduction

Nitriding is a well-established thermochemical surface treatment to improve the surface properties of steels. Classically, it is used to increase corrosion resistance by the formation of nitriding layers and to enhance the wear properties by significantly increasing the surface hardness [1,2,3,4]. The most commonly used nitriding techniques are salt bath nitriding, gas nitriding, and plasma nitriding. In comparison to salt bath and gas nitriding, the main advantage of plasma nitriding is the variability in the process control for adjusting the properties of the nitrided zone [5,6,7,8]. During plasma nitriding, molecular nitrogen is dissociated and activated by a plasma in a nitrogen–hydrogen atmosphere, which enables the diffusion of nitrogen into the material surface [9]. This nitrogen can generate a nitrided zone consisting of a compound layer (CL) on the surface and beneath a diffusion layer (DL) that grows into the material. The compound layer consists of ε and γ nitrides [7,10,11,12,13]. In contrast to the CL, which mainly consists of iron nitrides, the DL is characterized by an incomplete transformation of the base material and consists of nitride precipitations, mainly of the nitride forming alloying elements (e.g., Cr, Mo, Al, Ti), and dissolved nitrogen. The resulting nitride phases are characterized by a strongly increased hardness and brittleness, where the mechanical properties are different for the several nitrides [14].
As already mentioned, the properties of the nitride zone are strongly influenced by the applied process parameters during plasma nitriding and the chemical composition of the steel. The most important process parameters are the process temperature and the process duration, as well as the composition of the gas mixture. For example, the formation of a compound layer can be prevented by an appropriate gas composition. The process temperature affects the layer growth and the structure of the CL and DL. With increasing temperature, the resulting layer thickness of the CL and DL increases due to accelerated nitrogen diffusion at higher temperatures [15,16,17,18]. Furthermore, at lower process temperatures (400 °C–500 °C), the volume fraction of ε -nitrides within the compound layer predominates, but with increasing process temperature, the content of γ -nitrides becomes more dominant. The decrease in hardness at the material surface with increasing temperature is caused by the declining content of ε -nitride [19,20,21]. With increasing nitriding time/duration, in turn, the amount of nitrogen in the process atmosphere increases, allowing more nitrides to be formed [19,22]. Therefore, the nitrided zone thickness and micro hardness are enhanced. Further the volume fraction of ε -nitrides at the CL decreases, while the fraction of γ -nitrides increases [17,20,22]. Independent of the process temperature and duration, it is also possible to increase nitride formation based on the gas mixture by increasing the proportion of N2 so that more nitrogen is available for diffusion [17]. In addition to the process parameters, the material composition exerts a significant influence on the layer formation and the resulting properties [23,24]. This is illustrated by a prediction tool (developed in collaboration between the FraunhoferInstitute for Surface Engineering and Thin Films (IST) and the Institute of Materials Science and Engineering at Chemnitz University of Technology (IWW)) [25], which calculates different hardness curves for different steels as a function of temperature, treatment time, and nitrogen content. For example, chromium contributes to a significant increase in hardness by the formation of chromium nitrides in near-surface areas. Furthermore, alloying elements hinder the diffusion of nitrogen, which reduces the nitriding depth. The additional alloying elements bind nitrogen by forming different nitride precipitations, e.g., Cr, Mo, Ti, and Al nitrides, which thereby decrease the amount of diffusible species [26,27]. Other elements do not form nitrides and, yet, massively inhibit the diffusion of nitrogen, such as nickel [
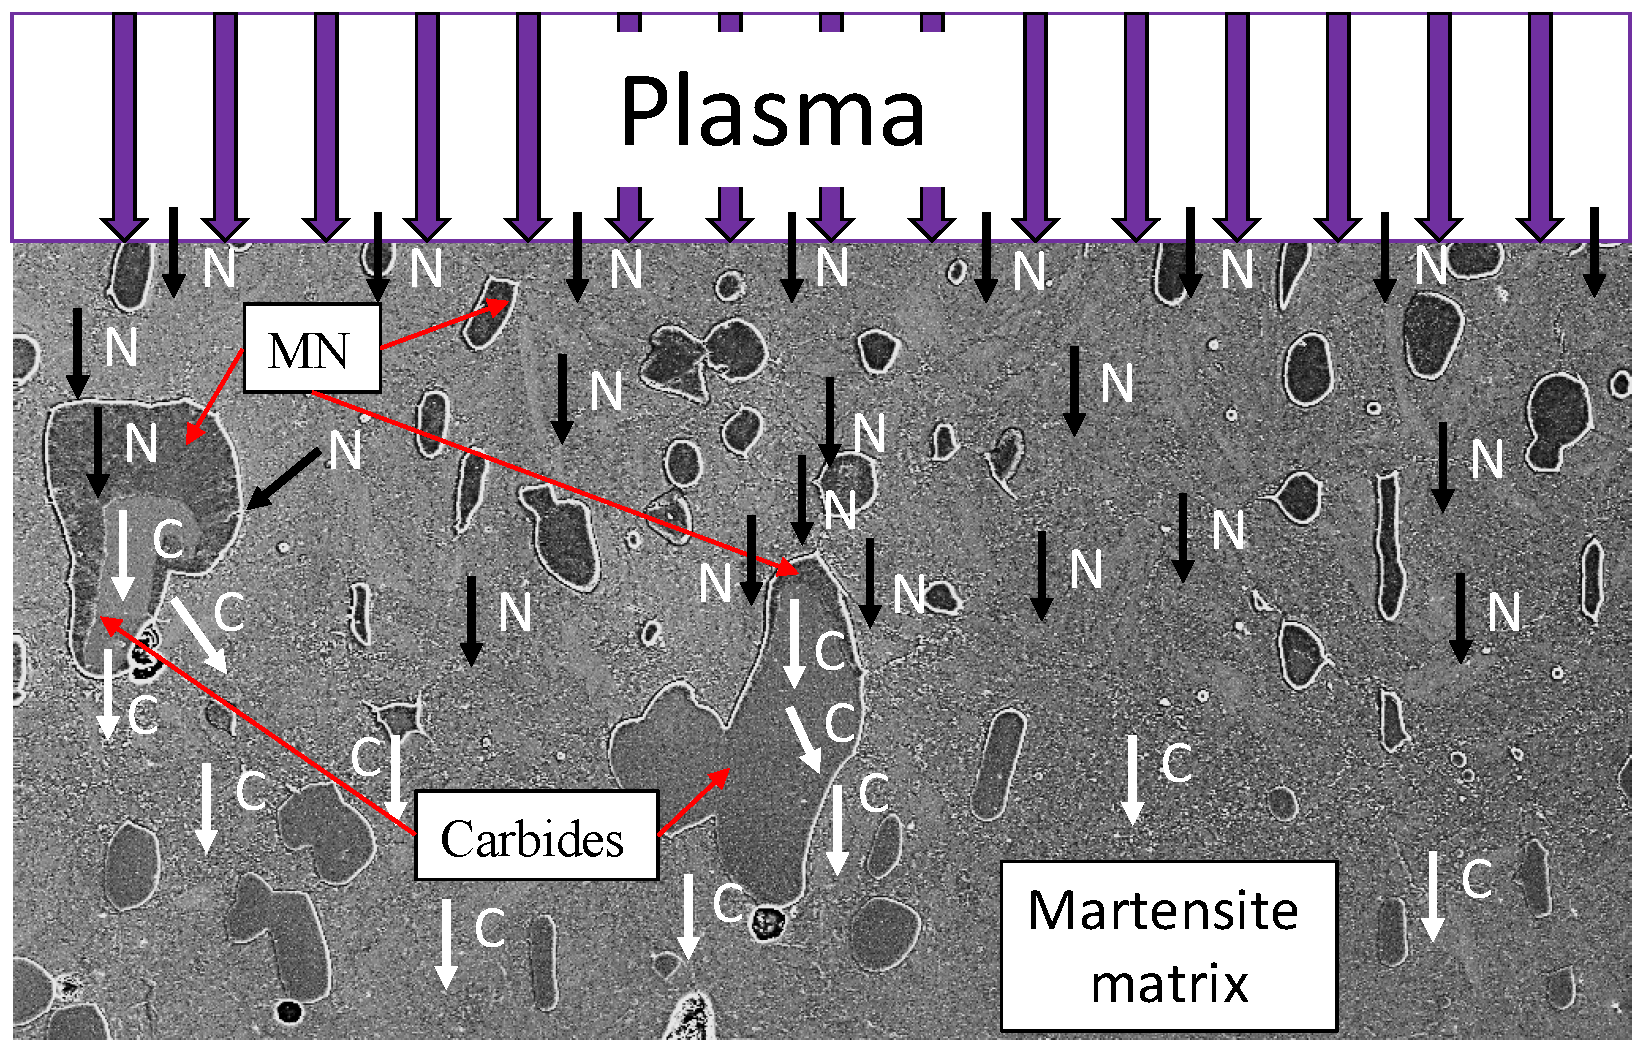
27]. In high-alloy tool steels, large primary carbides often occur in addition to the finely-dispersed precipitates. These primary carbides are also affected by the nitriding process. Garzón et al. [28] investigated the role of primary chromium carbides (M7C3) during plasma nitriding of the tool steel AISI D2. They observed the dissolution of chromium carbides and a subsequent diffusion-controlled local precipitation of chromium nitrides (CrN or generally as metal nitride (MN)). The evolution of atomic partitioning during this phase transformation was shown in [28] in a schematic model; compare Figure 1. This illustrates that the carbides and MN influence the nitrogen diffusion. In [28], it was reported that MN formation with low carbon dissolution, as well as negligible accumulation of nitrogen inside the M7C3 carbides has been observed.
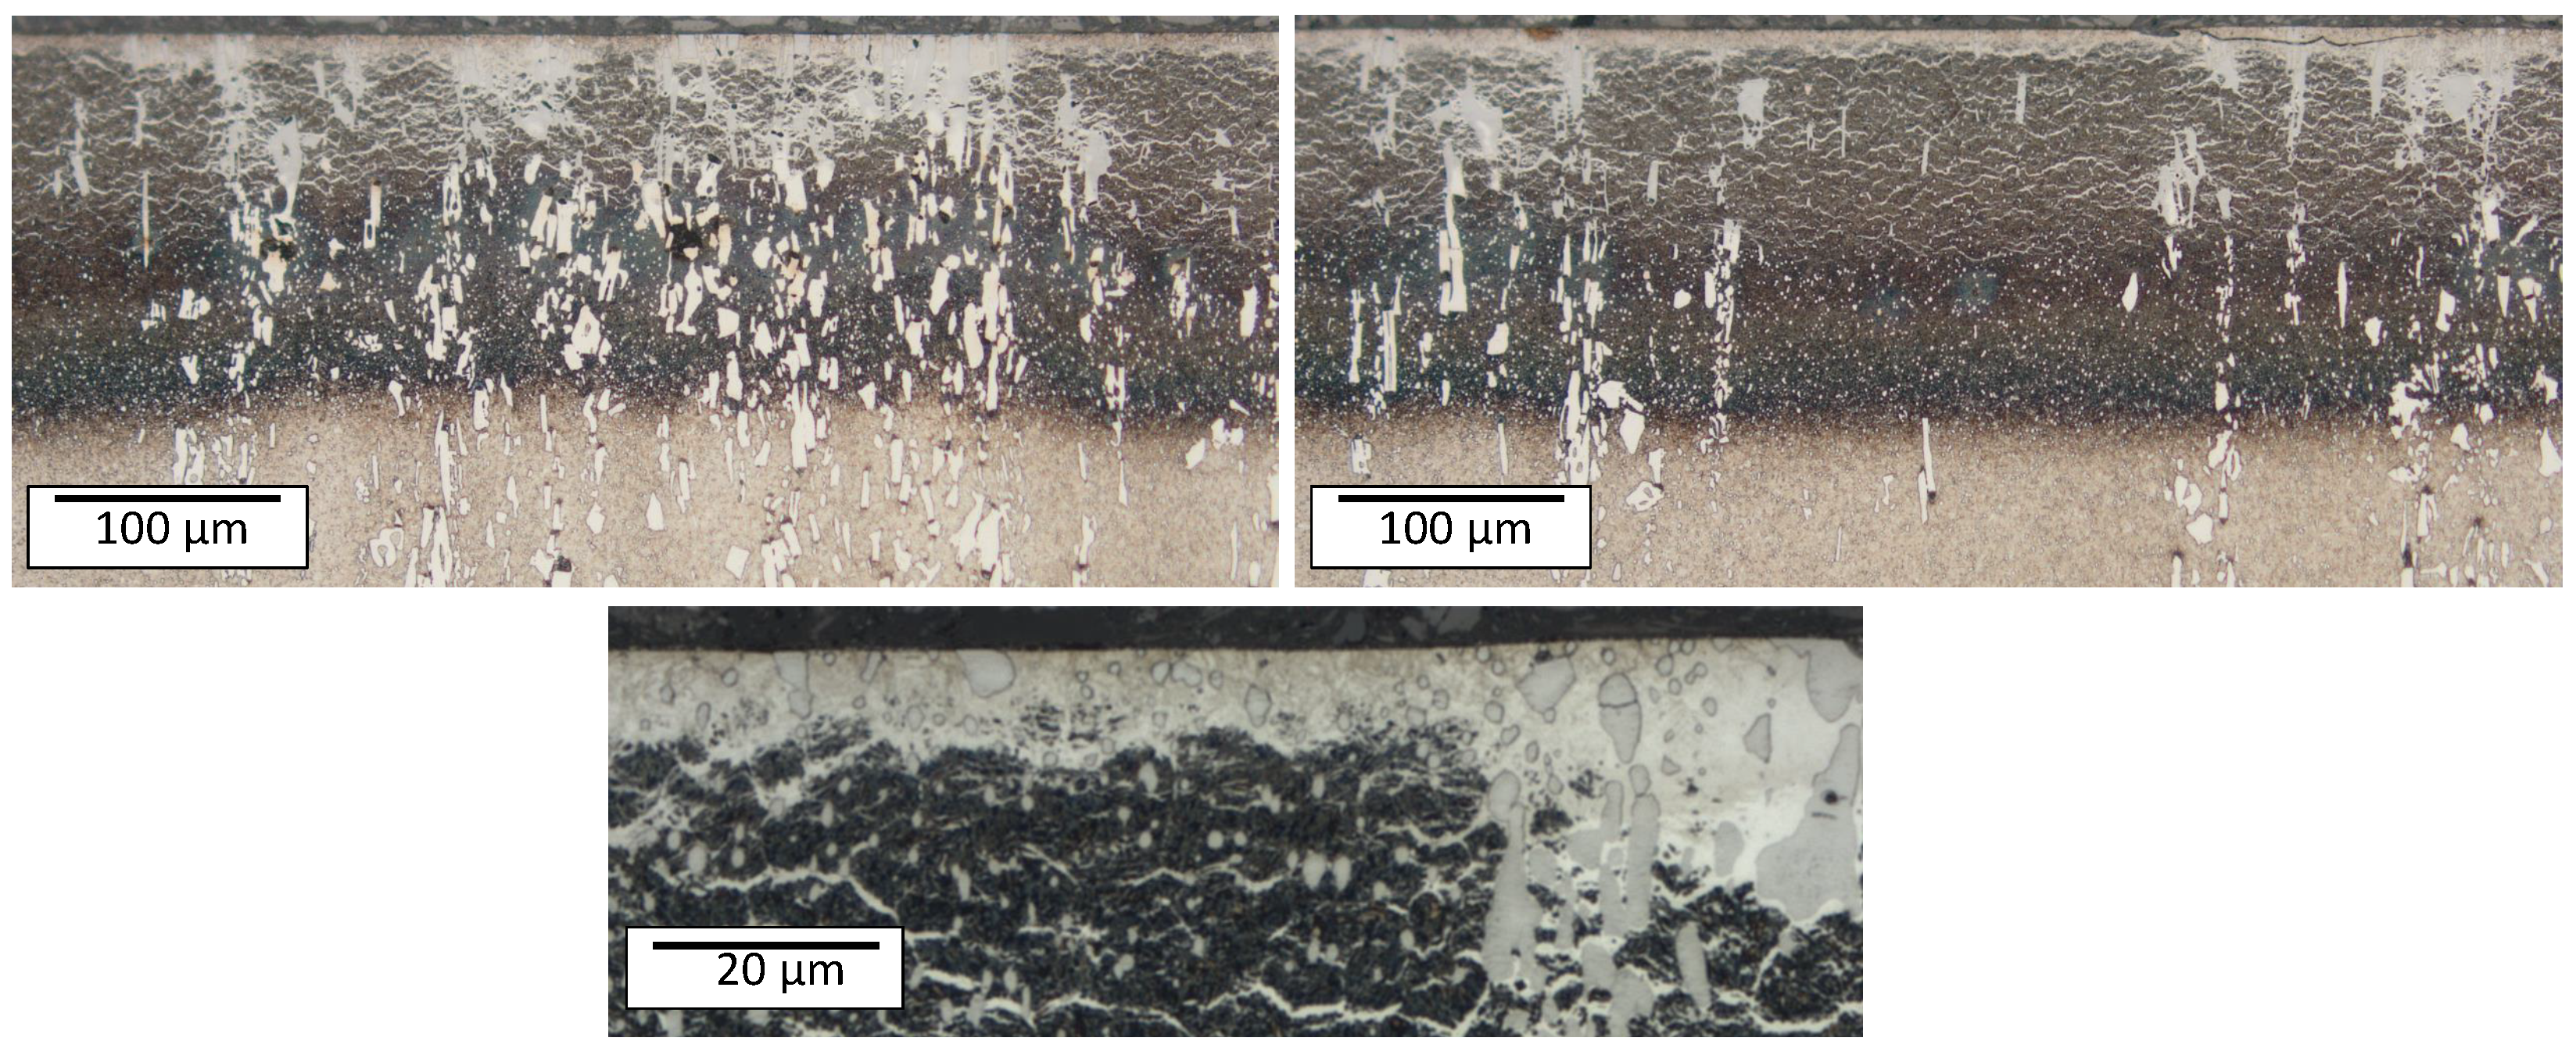
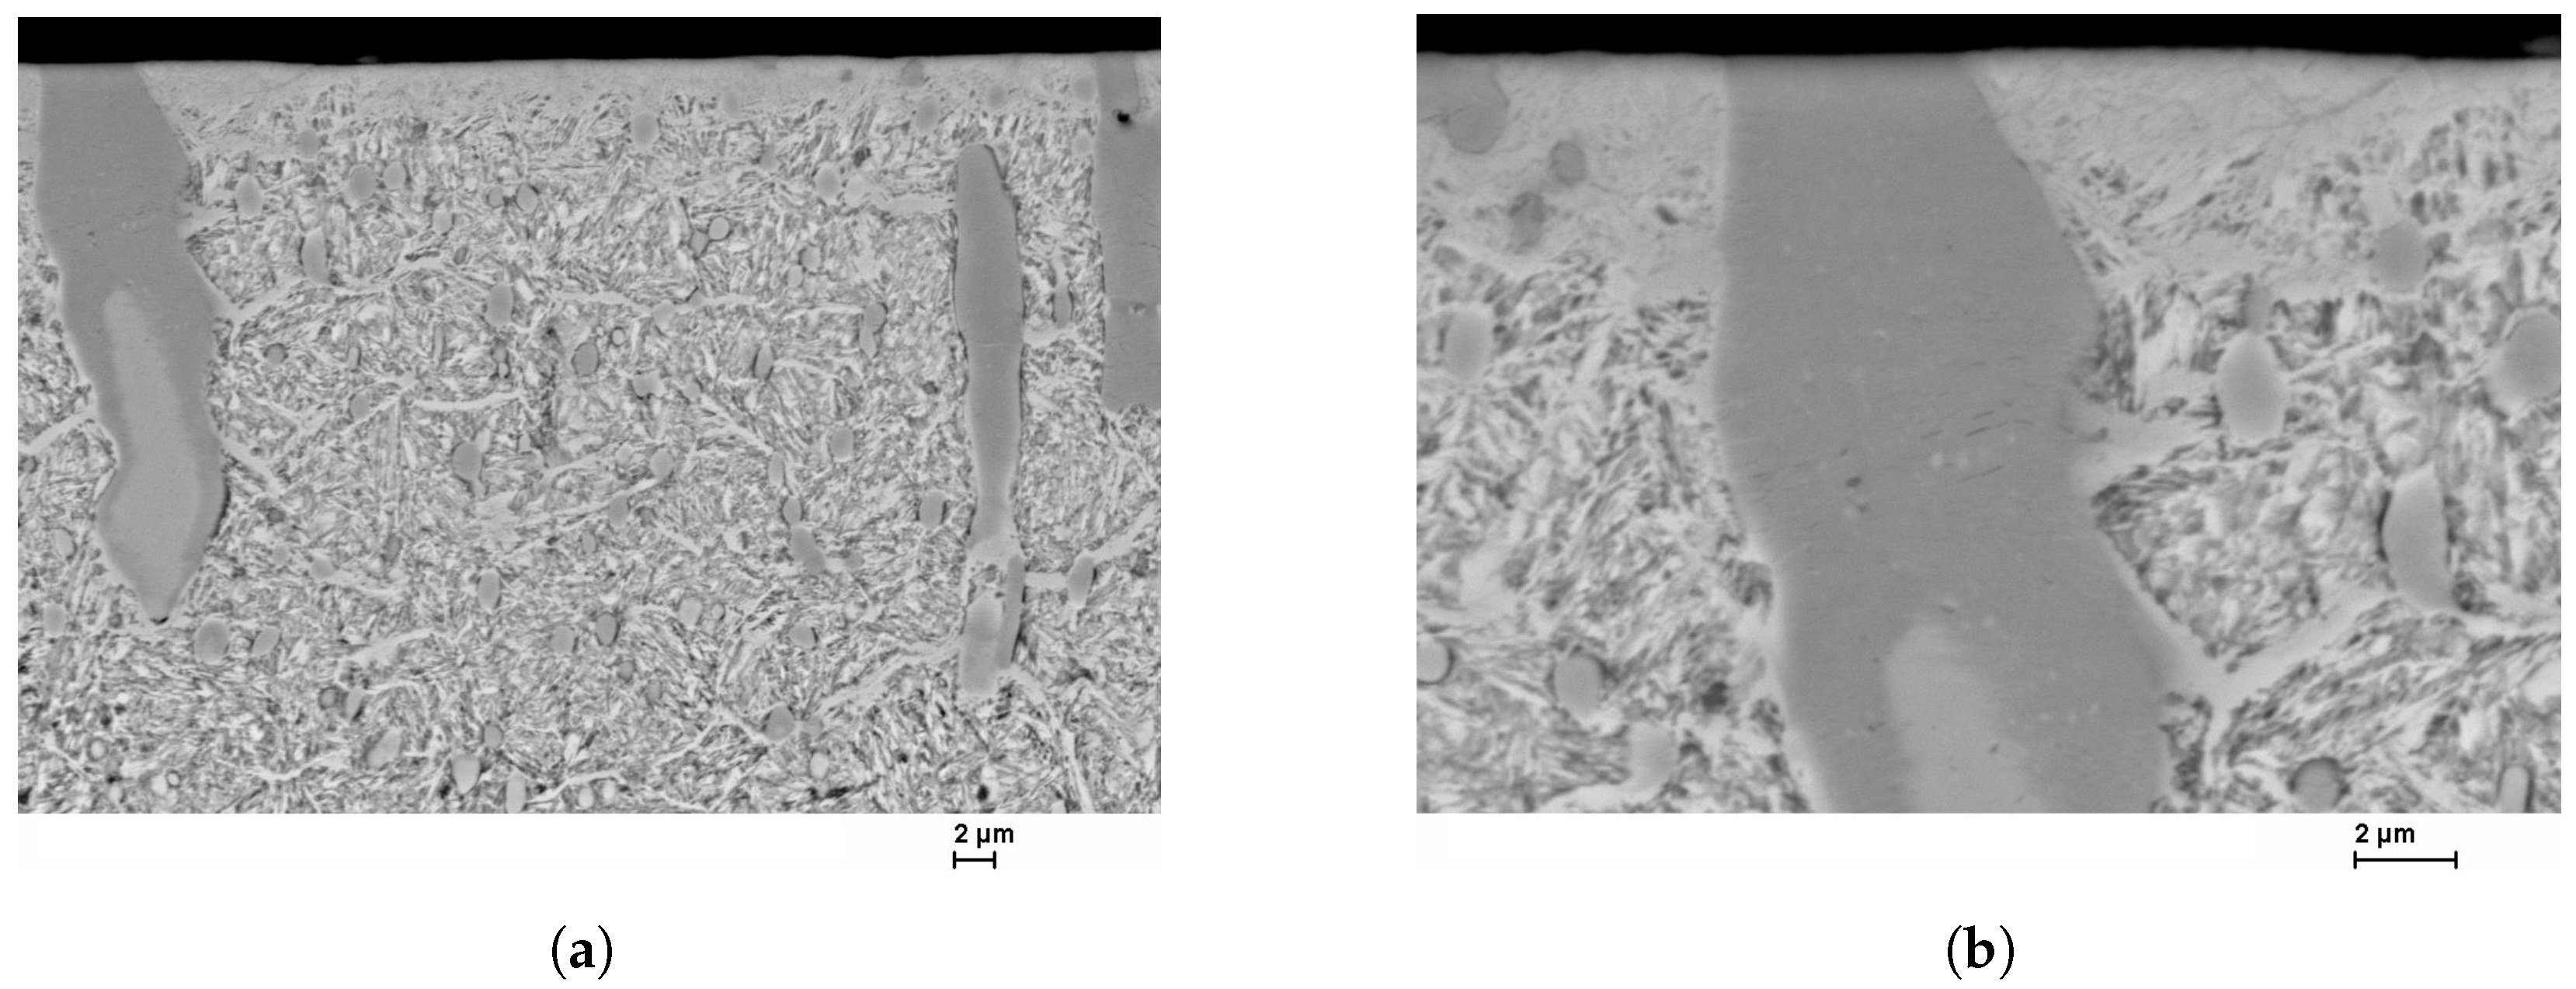
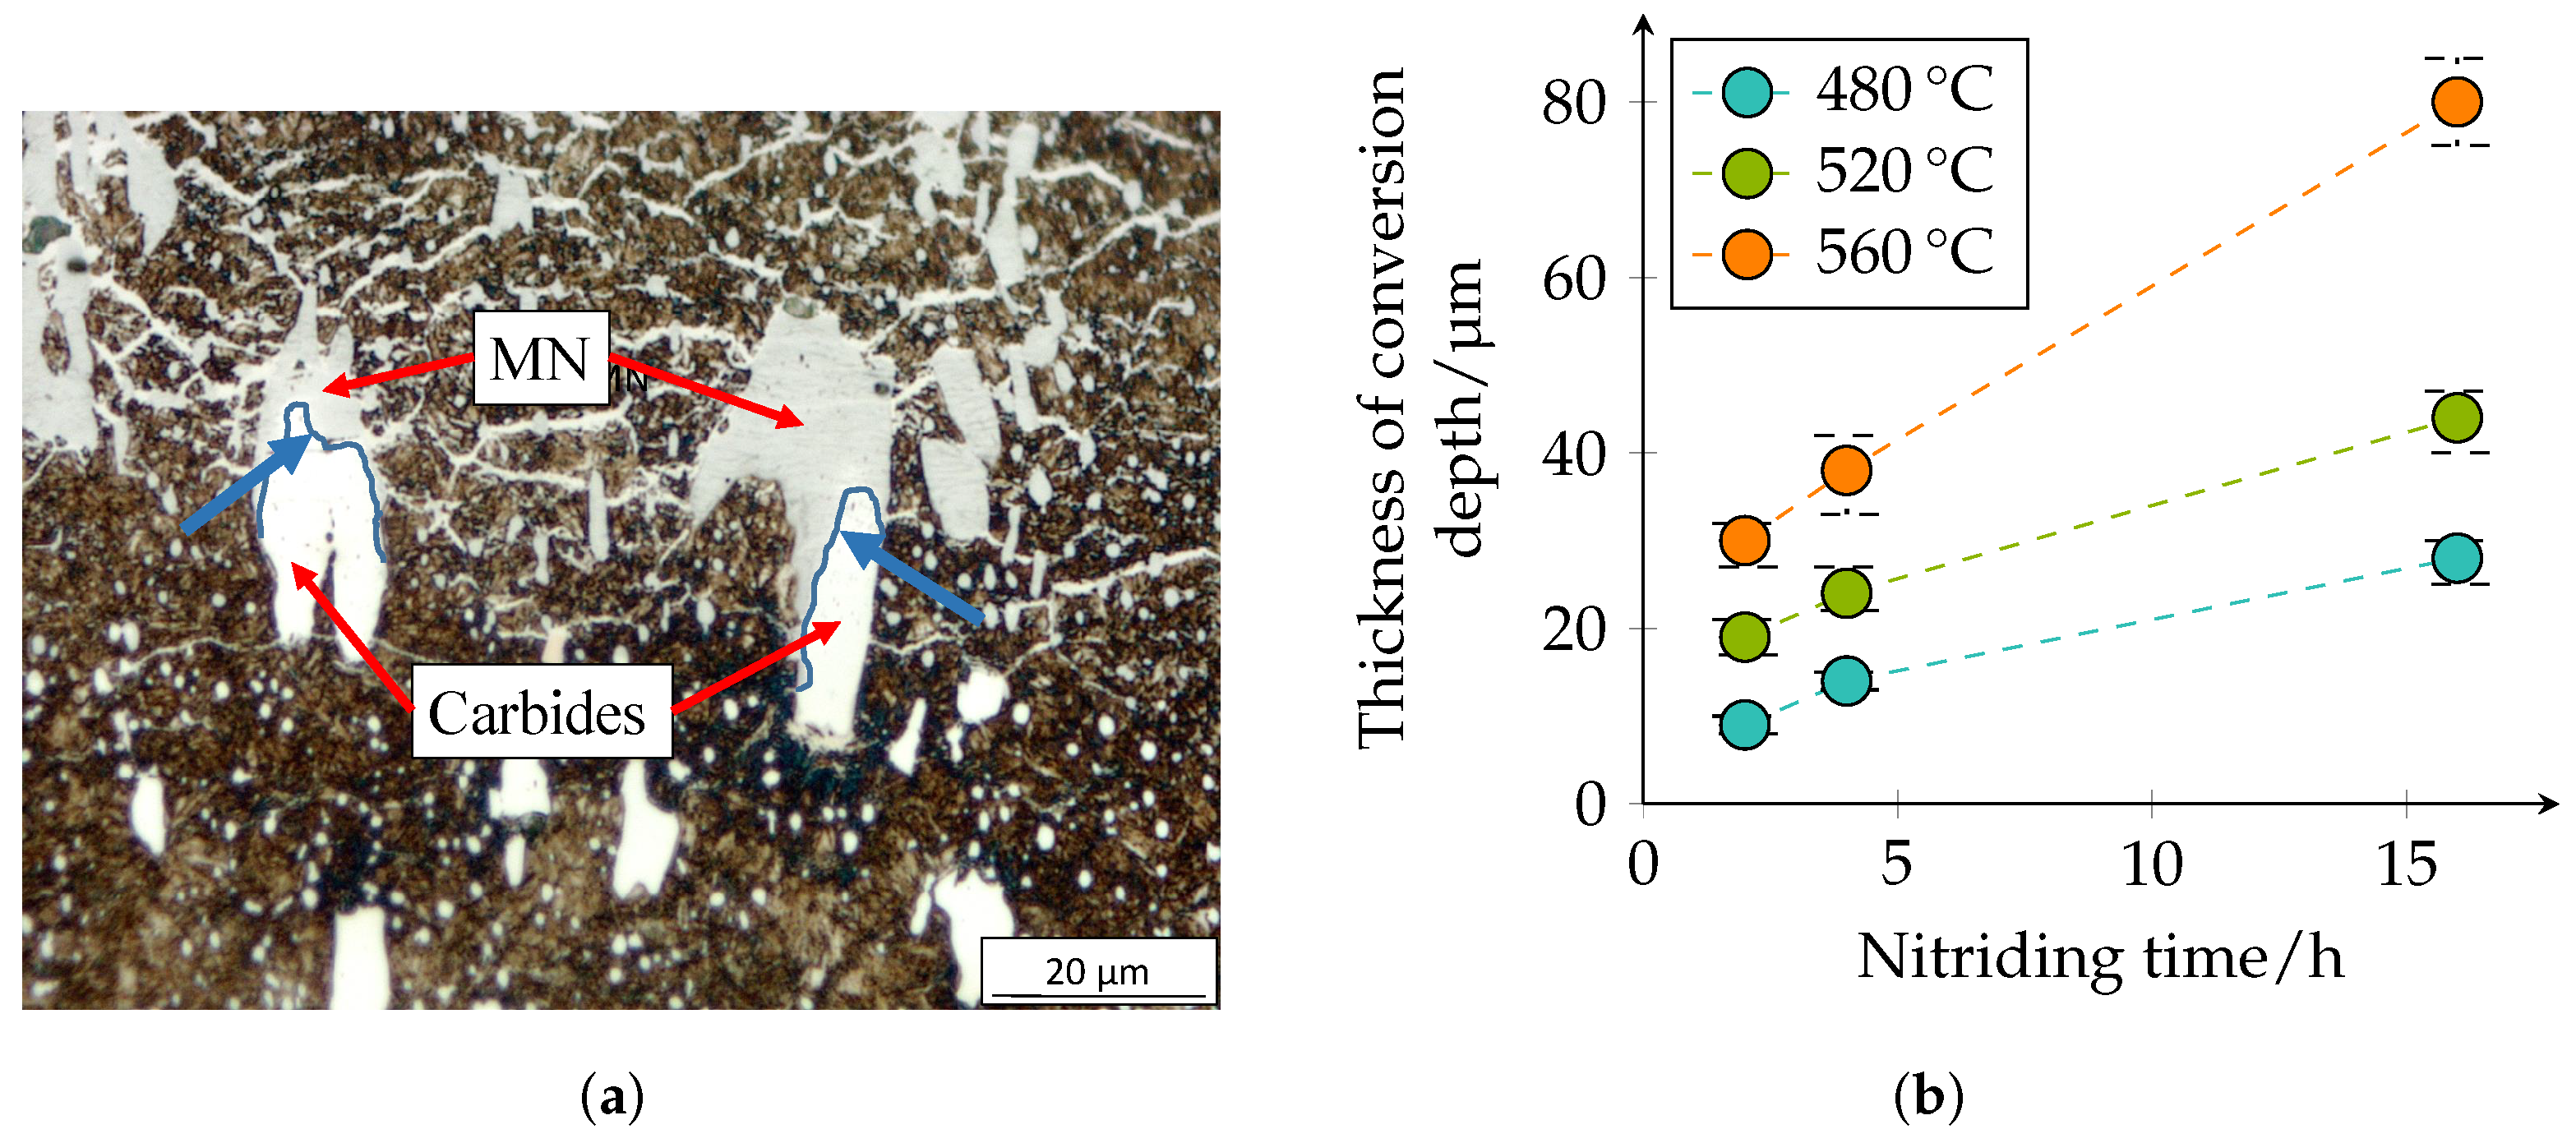
The influence of the microstructure and in particular of the primary carbides becomes very clear in a comparison between an area with and without large primary carbides of the high-alloy tool steel X153CrMoV12; see Figure 2. The compound and diffusion layer thicknesses are recognizably heterogeneous.
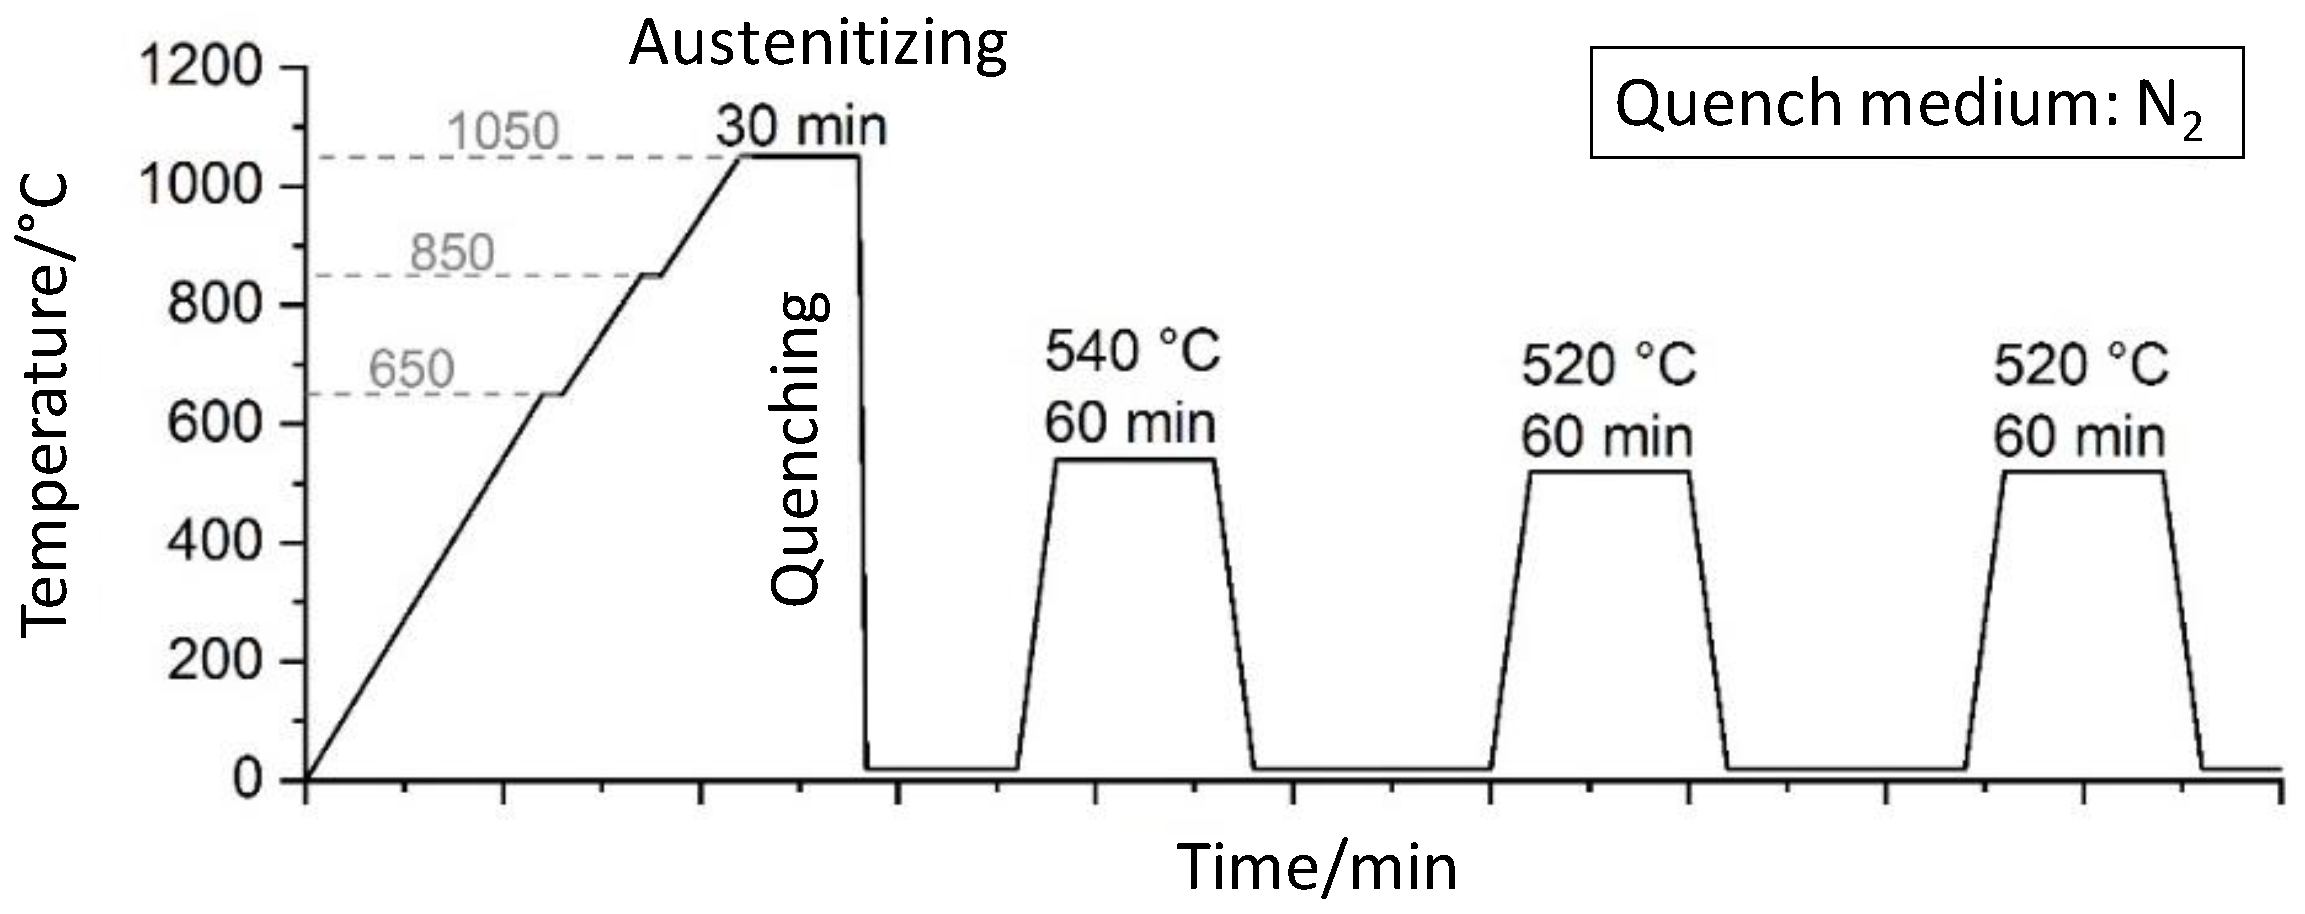
In plasma nitriding, the parameters are adjustable in a wide range, but the resulting diffusion process, especially for high-alloy tool steels, is still relatively unexplored. However, in order to be able to selectively adjust the hardness and the layer properties, more in-depth knowledge of the diffusion process of N and the interactions of carbides and nitrides is required. Therefore, a detailed study of the relevant process parameters temperature and duration was conducted on the high-alloy tool steel X153CrMoV12 (corresponding to AISI D2), which tends to form chromium carbides. Furthermore, an FE model for a qualitative analysis of the influence of chromium carbides on the nitrogen diffusion and nitride formation is developed. This FE model can be used to understand the underlying diffusion mechanisms and to tailor the nitrided zone for specific technical applications. In particular, the interactions during the diffusion processes between the matrix, compound layer, and chromium carbides can be taken into account for the first time using FEM.

2. Materials and Methods

2.1. Material

Plasma nitriding treatments were performed on the high-alloy tool steel X153CrMoV12. The chemical composition of the steel was measured by means of optical emission spectroscopy (OES) (SPECTROMAXx, SPECTRO Analytical Instruments GmbH, Kleve, Germany) according to DIN EN ISO 4957:2018-11 by HQM Induserv GmbH, Chemnitz, Germany. The results are given in Table 1.

2.2. Pre-Treatments

The cylindrical samples with a diameter of 35 mm and a height of 4 mm were heat treated to ensure comparability between all test samples. A schematic illustration of the conducted heat treatment is shown in Figure 3. The heat treatment selected is typical for this high-alloy tool steel to achieve high resistance against abrasive and adhesive wear, as well as high hardness combined with good toughness [29]. Three-stage tempering is typical to obtain the target hardness for X153CrMoV12 specified by the industry. In addition, the described heat treatment proved to be suitable for a subsequent plasma nitriding treatment in preliminary tests. After heat treatment, the surface hardness was determined to be 714 ± 7 HV10. Prior to the plasma nitriding process, the sample surfaces were ground and polished.

2.3. Plasma Nitriding Process

The plasma nitriding treatments were carried out using a self-assembled laboratory system. The experimental plant (hot-wall reactor, cylindrical chamber with a volume of 0.108   m 3 ) includes a control system from PlaTec (PlaTec GmbH, Cappeln, Germany) and a DC pulse physical vapor deposition (PVD) plasma generator from TRUMPF Hüttinger (TRUMPF Hüttinger GmbH & Co. KG, Freiburg im Breisgau, Germany). To determine the influence of temperature and time on the microstructural development of the tool steel, plasma nitriding was performed at 480 °C, 520 °C, and 560 °C for 2 h, 4 h, and 16 h, respectively. The gas mixture composition was not varied in the present work. It should be noted that the composition of the gas can have a significant influence on the plasma nitriding result. For example, low nitrogen contents may prevent the formation of the compound layer. In contrast, at high nitrogen contents, the formation of the compound layer is forced. The detailed nitriding parameters are summarized in Table 2.

2.4. Microstructural Characterization

After plasma nitriding treatment, the samples were prepared using standard metallographic techniques. The ground and polished cross-sections were etched with a solution based on HNO3 and C2H5OH (2%-Nital). At first, the nitriding depth and, thus, the thickness of compound layer (CL) and diffusion layer (DL) were analyzed by an optical microscope Olympus GX51 equipped with an SC50 camera (Olympus, Shinjuku, Japan). In addition, the depth of carbide-to-nitride conversion is visible by optical microscopy. For each state, the transformation depth of up to five carbides was measured starting from the surface to the visible carbide-to-nitride transformation limit. In order to specify the compound layer more precisely, images were taken at higher magnifications using scanning electron microscopy Zeiss Leo 1455VP. An accelerating voltage of 25 kV and a working distance (WD) of 12 mm were used. The detector used is the backscattered electron detector (BSD). The microstructure investigations were carried out on embedded and prepared (separated, ground, and polished) cross-section samples etched with the etchant Nital (2% nitric acid). Further investigations to quantify the phases were carried out using a D8 Discover (Bruker AXS, Billerica, MA, USA) diffractometer (Bragg-Brentano geometry) with Co-K α radiation. Thereby, the 2Θ range was 10°–130° and the step size 0.02°. The measuring times were 7.1 s/step or 9.5 s/step using the 1D detector, resulting in an effective measuring time of 1363.2 s/step and 1824 s/step. The tube parameters were 40 kV and 40 mA. The phases were quantified using the Rietveld method. PDF-2 2014 was used as the phase database. Note that the penetration depth was a few microns depending on 2Θ and can therefore be greater than the compound layer thickness.

2.5. Mechanical Testing

Mechanical testing includes the determination of the nitriding depth using the Vickers hardness ( HV 0.5 ). For the Vickers hardness measurements, an automatic hardness tester (KB 250 BVRZ, KB Prüftechnik GmbH, Hochdorf-Assenheim, Germany) was used. The test load was 4.9 N according to [30]. The Y-distance between the indents was 5 μm from 25 μm to 125 μm and 10 μm above 125 μm; see Figure 4. Useable hardness indents could be determined beginning from approximately a 30 μm to 35 μm distance from the surface. The first indent at 25 μm was too close to the edge and led to very different results. The core hardness was determined from a 1 mm distance from the plasma-nitrided surface based on 31 hardness measurements by averaging. Note that the selected hardness method ( HV 0.5 ) is not suitable for determining the hardness in the compound layer due to the size of the indentations.

2.6. Depth-Dependent Glow Discharge Optical Emission Spectroscopy

To analyze the chemical composition, the high-resolution optical emission spectrometer Spectruma GDA750 was used. This makes it possible to determine the element concentration distribution as a function of depth. For the application, a cathode with a Ø 2.5 mm, steel calibration samples (certified reference standards), 800 V voltage, and 800 s measuring time were used. A depth of up to approximately 60 μm could be achieved.

2.7. Simulation of the Plasma Nitriding Process Using FEM

The modeling and simulation of the plasma nitriding process was performed with the help of software DEFORM™-2D/3D V12.0 (SP2.1) (Scientific Forming Technologies Corporation, Columbus, OH, USA). A 2D model was generated to consider nitrogen diffusion in the matrix, as well as the role of the carbides during the nitriding process. This 2D model is based on micrographs of the high-alloy tool steel X153CrMoV12; see Figure 5. In Figure 5a, a representative micrograph with the decolored partition of the matrix phase (grey) and the colored phase of chromium carbides (red) is shown. The chromium carbides are not distributed randomly, but are primarily present in clusters and often stretched parallel to the y-axis. This is due to the manufacturing process. The material is a rod material; the larger (ledeburitic) chromium carbides are not dissolved during the heat treatment, so that the rolling direction is maintained. Such typical phase partitions were transferred into a mesh of the 2D model in DEFORM™ using a MATLAB script (MathWorks®, Natick, MA, USA); see representative Figure 5b. This mesh consists of 7910 nodes and 7707 square elements. It is refined twice in the area close to the surface.
For the calculation of the diffusion processes, following [31], the diffusion model based on the Laplace equation (see Equation (1)) was used.
A t = X D A X with A = Atom content and D = Diffusion coefficient
The presented model was used to simulate plasma nitriding at constant temperature (example 520 °C) and a duration of 2 h, 4 h, and 16 h. A detailed mathematic description and calculations of the used models and equations can be found in [32,33,34]. The presented parameters of the diffusion coefficients and solubility limits were taken from the literature [33,34,35,36] as a first approximation and were used to demonstrate the potential of the new method to consider carbides in the simulation of plasma nitriding of high-alloy tool steels.
The respective solubility limits of the phases ε , γ and α from [33,36] and of the carbides/nitrides [35] are shown in Table 3. According to [33], the nitrogen concentration in equilibrium at the boundary of the phase α with the γ -nitride can be described by Equation (2). Based on this equation, Equation (3) for calculating the atomic content was determined.
N α / γ / wt . % = 12.3 e x p 4176 T
N α / γ / at . % = 48.5 e x p 4169 T
It should be noted that the solubility limits for the phases ε , γ , and α apply to pure iron and should be understood as an approximation. Due to convergence problems, the solubility limit of carbides/nitrides N M N / M 7 C 3 was set from 22.7 at.% to 25 at.% in the numerical calculation of the diffusion processes. As the boundary condition, the atomic content at the surface N S was set to 11.14 wt.% based on [33] and approximately the maximum values of the GDOES investigations at 520 °C, which corresponds to approximately 33.33 at.%. This corresponds to the stoichiometric ratio of ζ-nitride (Fe2N).
Constant diffusion coefficients of nitrogen (N) of the phases, γ , and ε (see Table 4) were obtained with Equation (4)–(6) according to [33] and (7)–(9) according to [34]. These values were used as a first approximation for the initial simulation run. It should be taken into account that the parameters from the literature are often determined for pure iron. Further adjustment of the diffusion coefficients due to the alloying elements dissolved in iron is therefore required in further work.
D N ϵ / m 2 / s = 2.1 · 10 8 e x p 93,517   J / mol R T
D N γ / m 2 / s = 1.7 · 10 9 e x p 64,000   J / mol R T
D N α / m 2 / s = 6.6 · 10 7 e x p 77,900   J / mol R T
D N ϵ / m 2 / s = 0.227 · 10 4 e x p 147,600   J / mol R T
D N γ / m 2 / s = e x p 73,274   J / mol R T 18.775
D N α / m 2 / s = 4.67 · 10 8 e x p 75,150   J / mol R T
By considering the carbides in the microstructure, it is possible to map their influence on the diffusion behavior. From the investigations, it can be deduced that diffusion in the region of the carbides appears to proceed more slowly, since some of these have not yet been transformed in the interior, although the diffusion front has already reached deeper regions of the matrix. In the region of the carbide boundaries, on the other hand, diffusion seems to be faster, possibly due to grain boundary diffusion. However, these boundaries have not yet been taken into account in the model. To show the influence of the carbides, the diffusion coefficients of the carbides and nitrides were varied. The values of the diffusion coefficients were chosen to account for the slower diffusion of nitrogen in the carbides and converted nitrides, i.e., D N c a r b i d e = 1.0 × 10 8 and D N n i t r i d e = 5.0 × 10 10 .

3. Results and Discussion

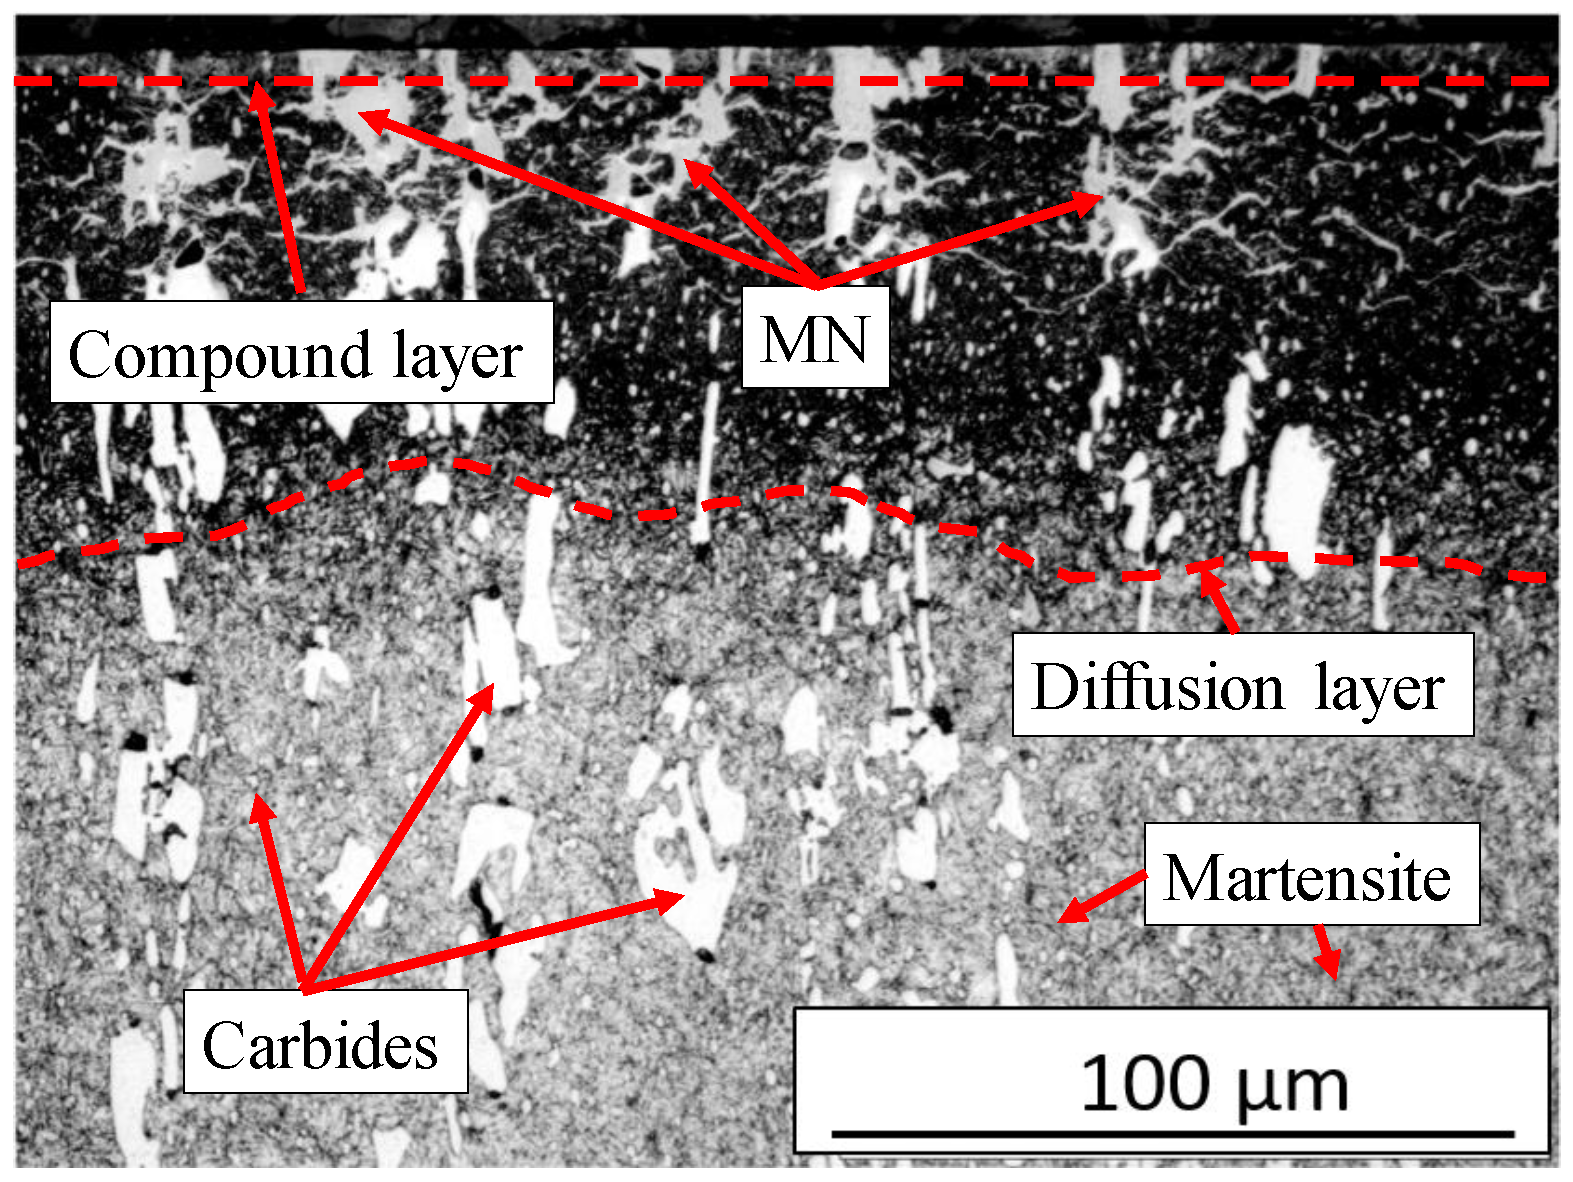
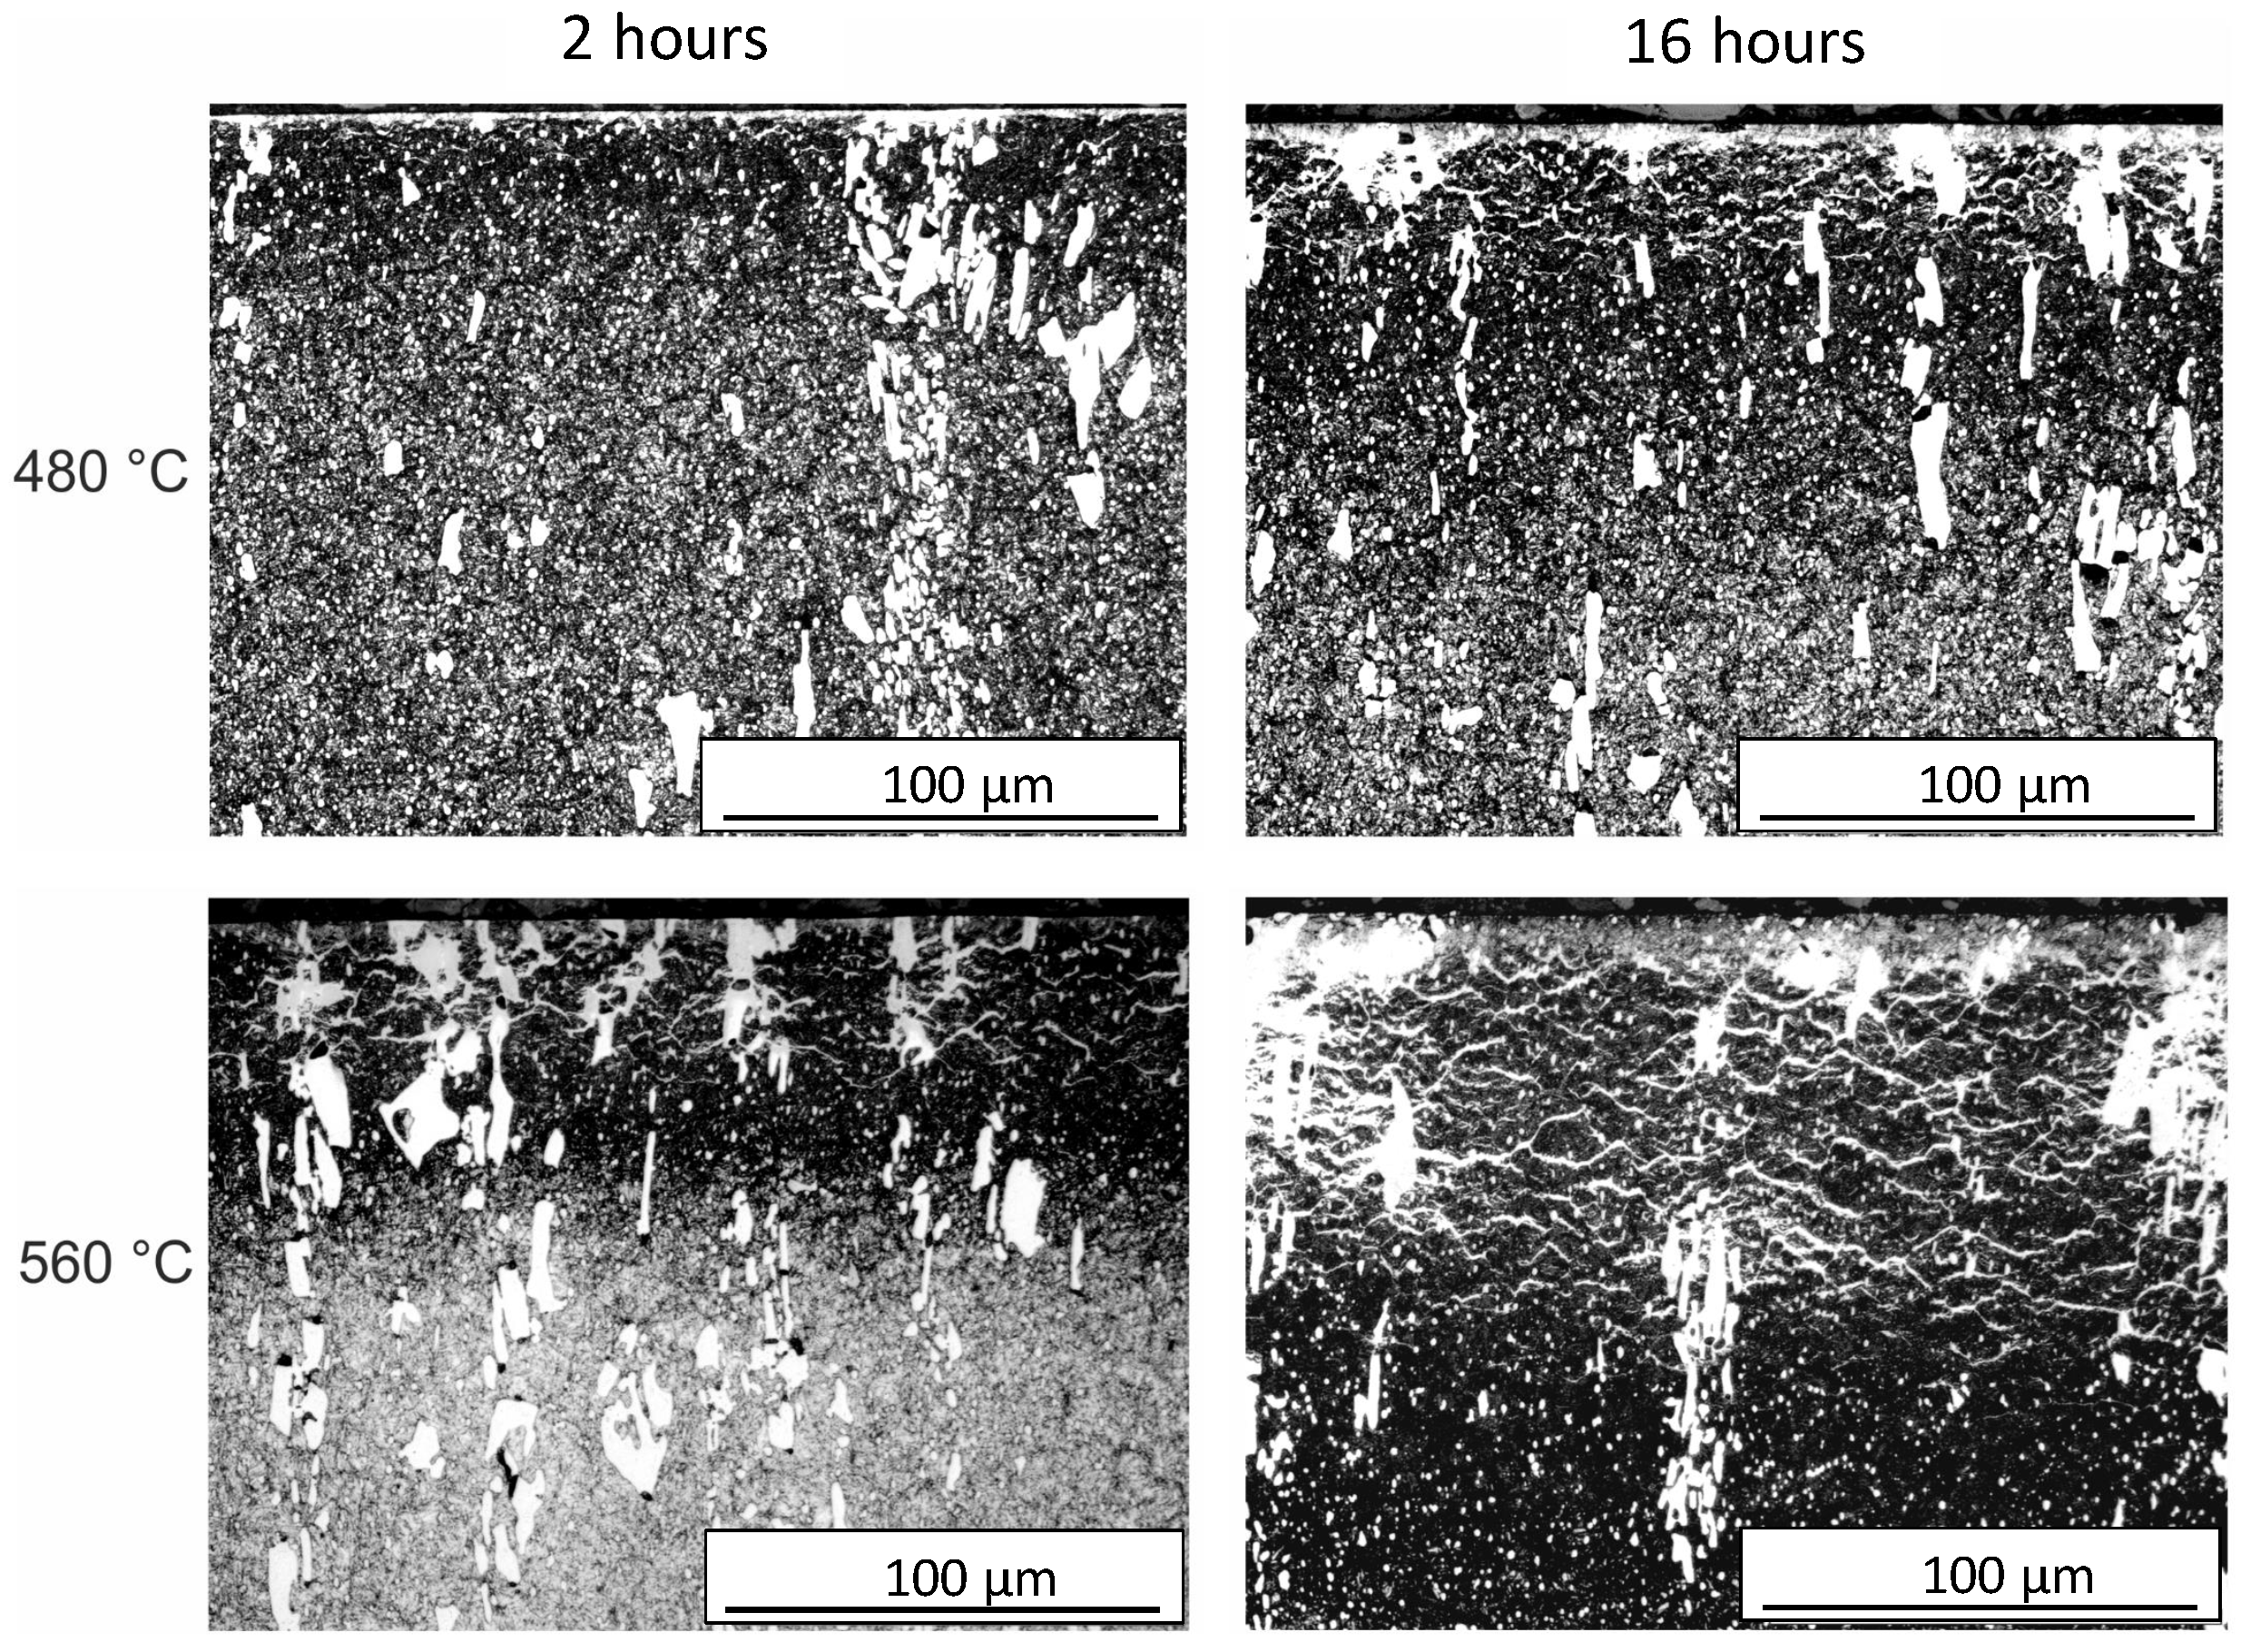
Figure 6 illustrates the typical phases after plasma nitriding. The compound layer (CL) on the surface, the metal nitrides (MNs), and the diffusion layer (DL) can be seen. The heterogeneous course of the diffusion layer is obvious. The initial microstructure consisting of tempered martensite/ferrite and carbides is recognizable in the lower area. The microstructure obtained after plasma nitriding at different temperatures and times is shown in Figure 7. It can be seen that with increasing plasma nitriding temperature and duration, the layer thicknesses increase. At the same time, a network is increasingly formed, which is referred to as a cementite network in [37,38] and is formed by carbon displacement due to nitrogen diffusion. These precipitations of a second phase take place mainly at the end of the strongly nitrided region towards the sample core, and this corresponds to the area where carbon enrichment is present [28]. According to [27], especially at higher carbon and chromium contents, part of the carbon accumulates in front of the diffusion front. In addition, depending on the alloy composition of the base metal and the nitriding conditions, the majority of the carbon released by nitride formation diffuses towards the surface due to the strong decarburizing effect of the nitriding medium and the higher diffusion velocities caused by the lattice distortion [27]. It should be noted that the epsilon compound layers inhibit effective decarburization due to the low diffusion velocity of the carbon, so that the carbon in the diffusion layer precipitates in a stress-induced manner as cementite parallel to the surface at the grain boundaries [27]. The SEM images in Figure 8 confirm and illustrate the heterogeneous behavior of the diffusion of nitrogen in a high-alloy tool steel. The layer near the surface is the compound layer (CL); the needled structure of the martensite and the nitrides are visible below. It is noticeable that the layer thickness of the CL is not homogeneous. The carbide interrupts the CL at the surface. Inside the carbide, the dark discoloration (according to [28] MN) is noticeable, which almost surrounds the carbide in the interior. Some carbides are also completely converted to MN.
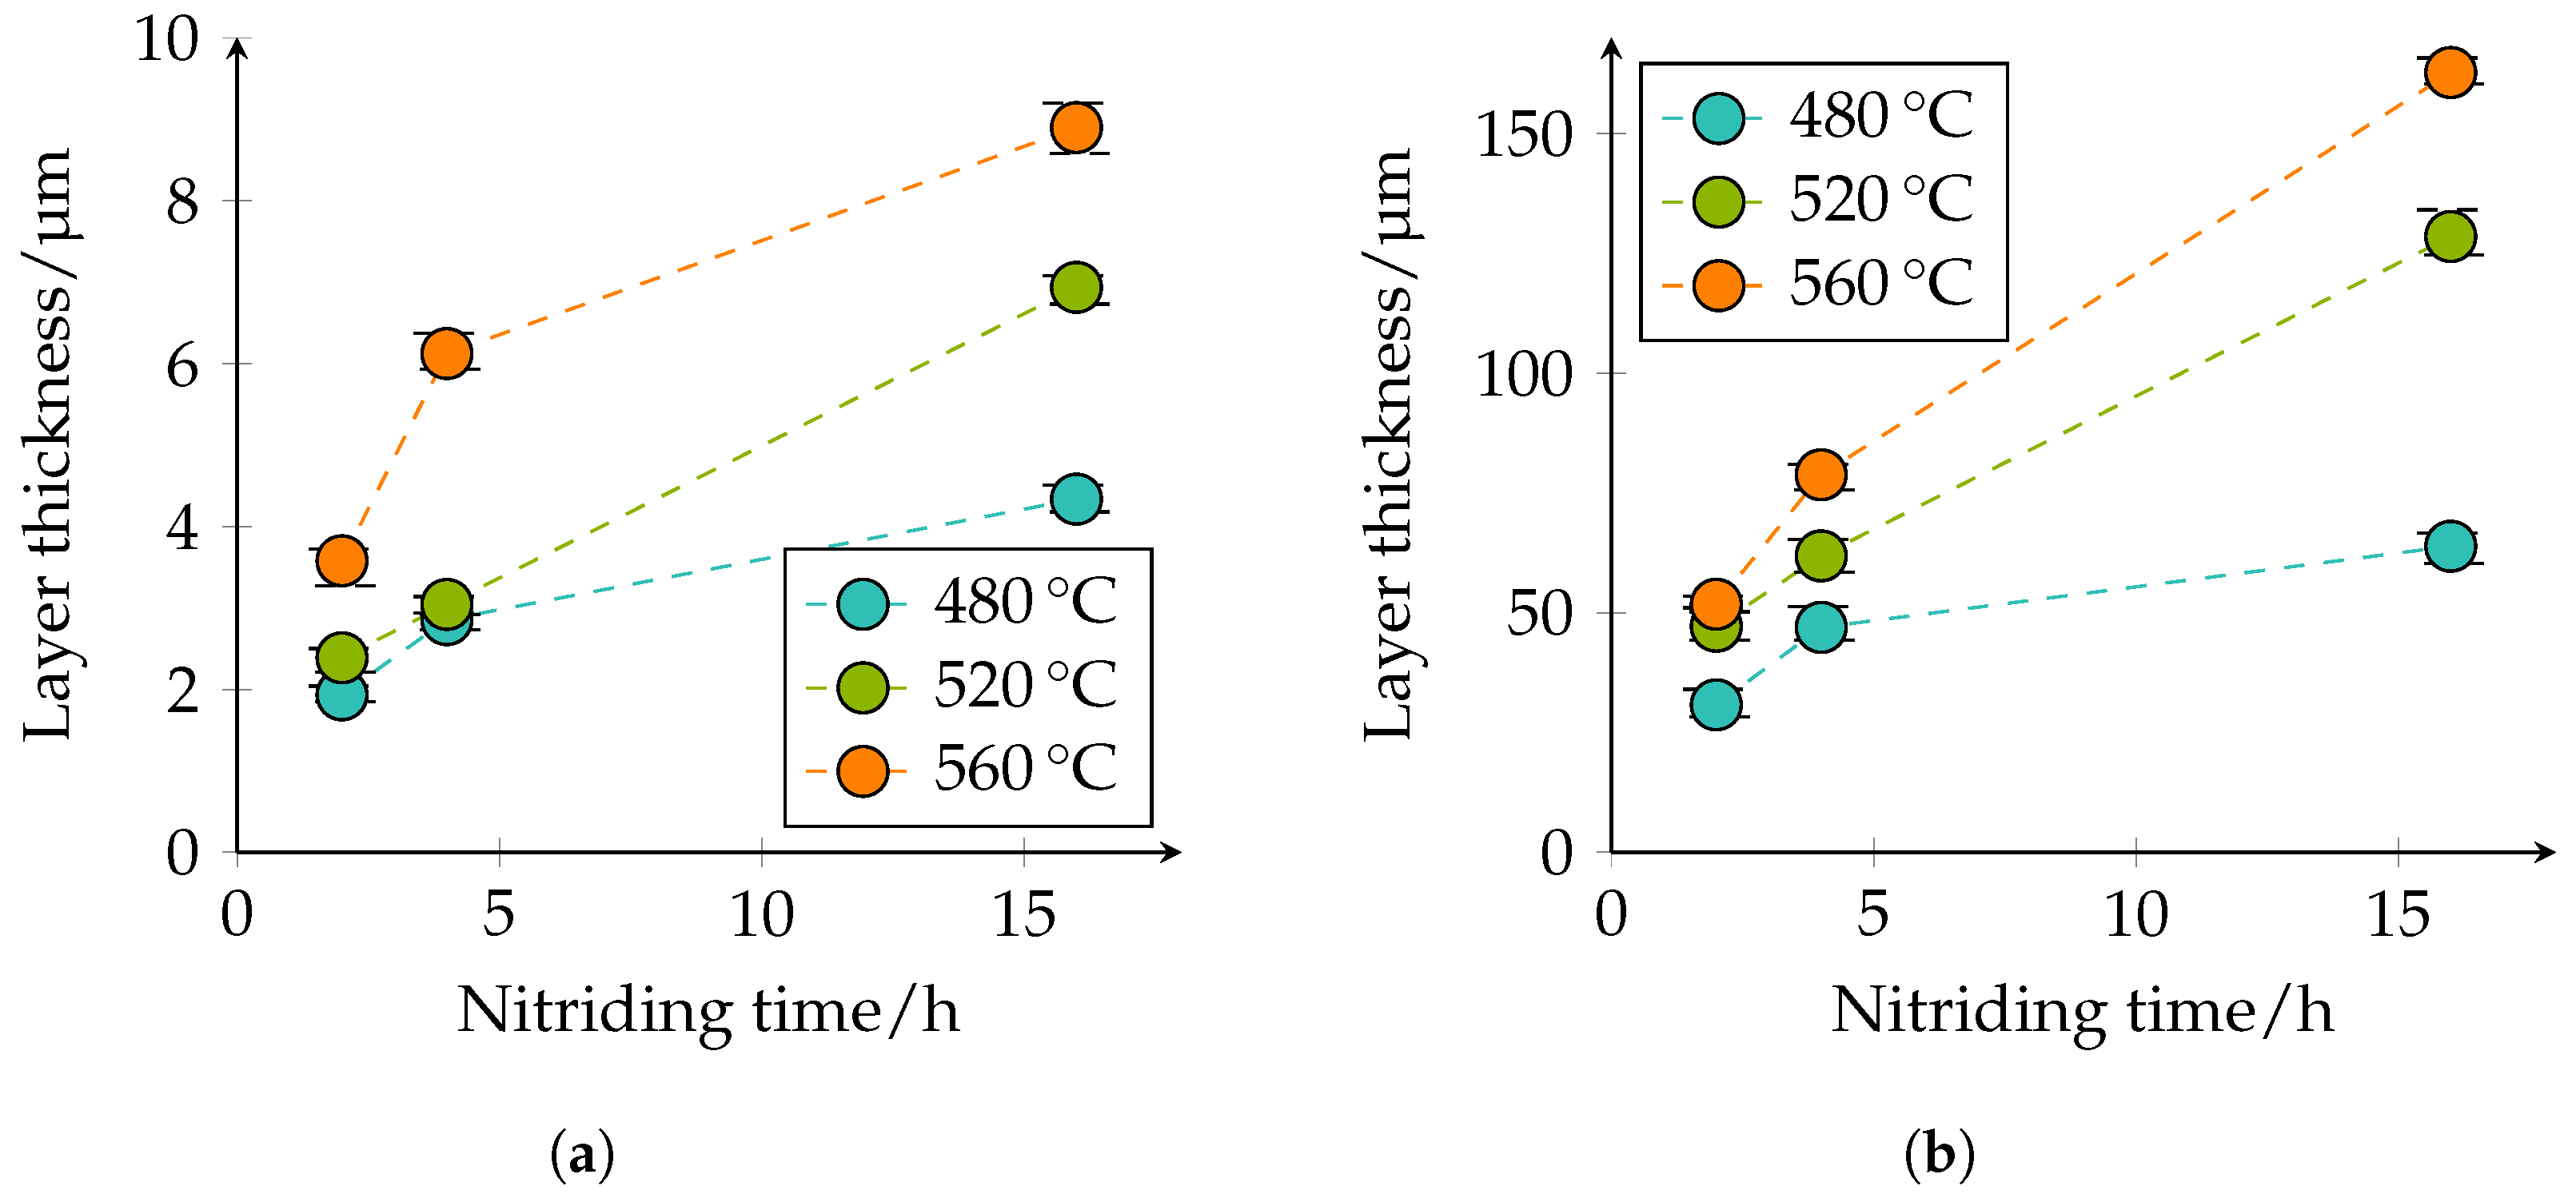
The thickness of the CL and DL, as well as the depth of transformation of carbides into nitrides were quantitatively determined in the optical microscopy images. The quantitative microscopic analysis confirmed the qualitative statements that with increasing temperature and duration, the layer thicknesses of the CL and DL increase; compare Figure 9. Figure 9a shows that the CL thickness at 480 °C and 2 h nitriding time is approximately 1.9 μm, at a nitriding time of 4 h approximately 2.9 μm, and at a nitriding time of 16 h approximately 4.3 μm. At 520 °C and 2 h nitriding time, the CL thickness is approximately 2.4 μm, at a nitriding time of 4 h approximately 3 μm, and at a nitriding time of 16 h approximately 6.9 μm. With a further increase of the plasma nitriding temperature to 560 °C and a nitriding duration of 2 h, the CL thicknesses of approximately 3.6 μm, at a nitriding time of 4 h approximately 6.1 μm, and with a nitriding duration of 16 h of approximately 8.9 μm; are achieved. A similar behavior can also be seen for the DL in Figure 9b. At 480 °C and 2 h nitriding time, the layer thickness is approximately 31 μm, at 4 h approximately 47 μm, and at 16 h approximately 64 μm. At a plasma nitriding treatment of 520 °C and 2 h nitriding time, a layer thickness of approximately 47 μm, at 4 h approximately 62 μm, and at 16 h approximately 129 μm was observed. At 560 °C, the layer thicknesses increase further. Thus, a nitriding time of 2 h approximately 52 μm, at 4 h approximately 79 μm, and at 16 h approximately 163 μm DL thickness is present. The specified values of the different thicknesses of the compound and diffusion layers are additionally given in 
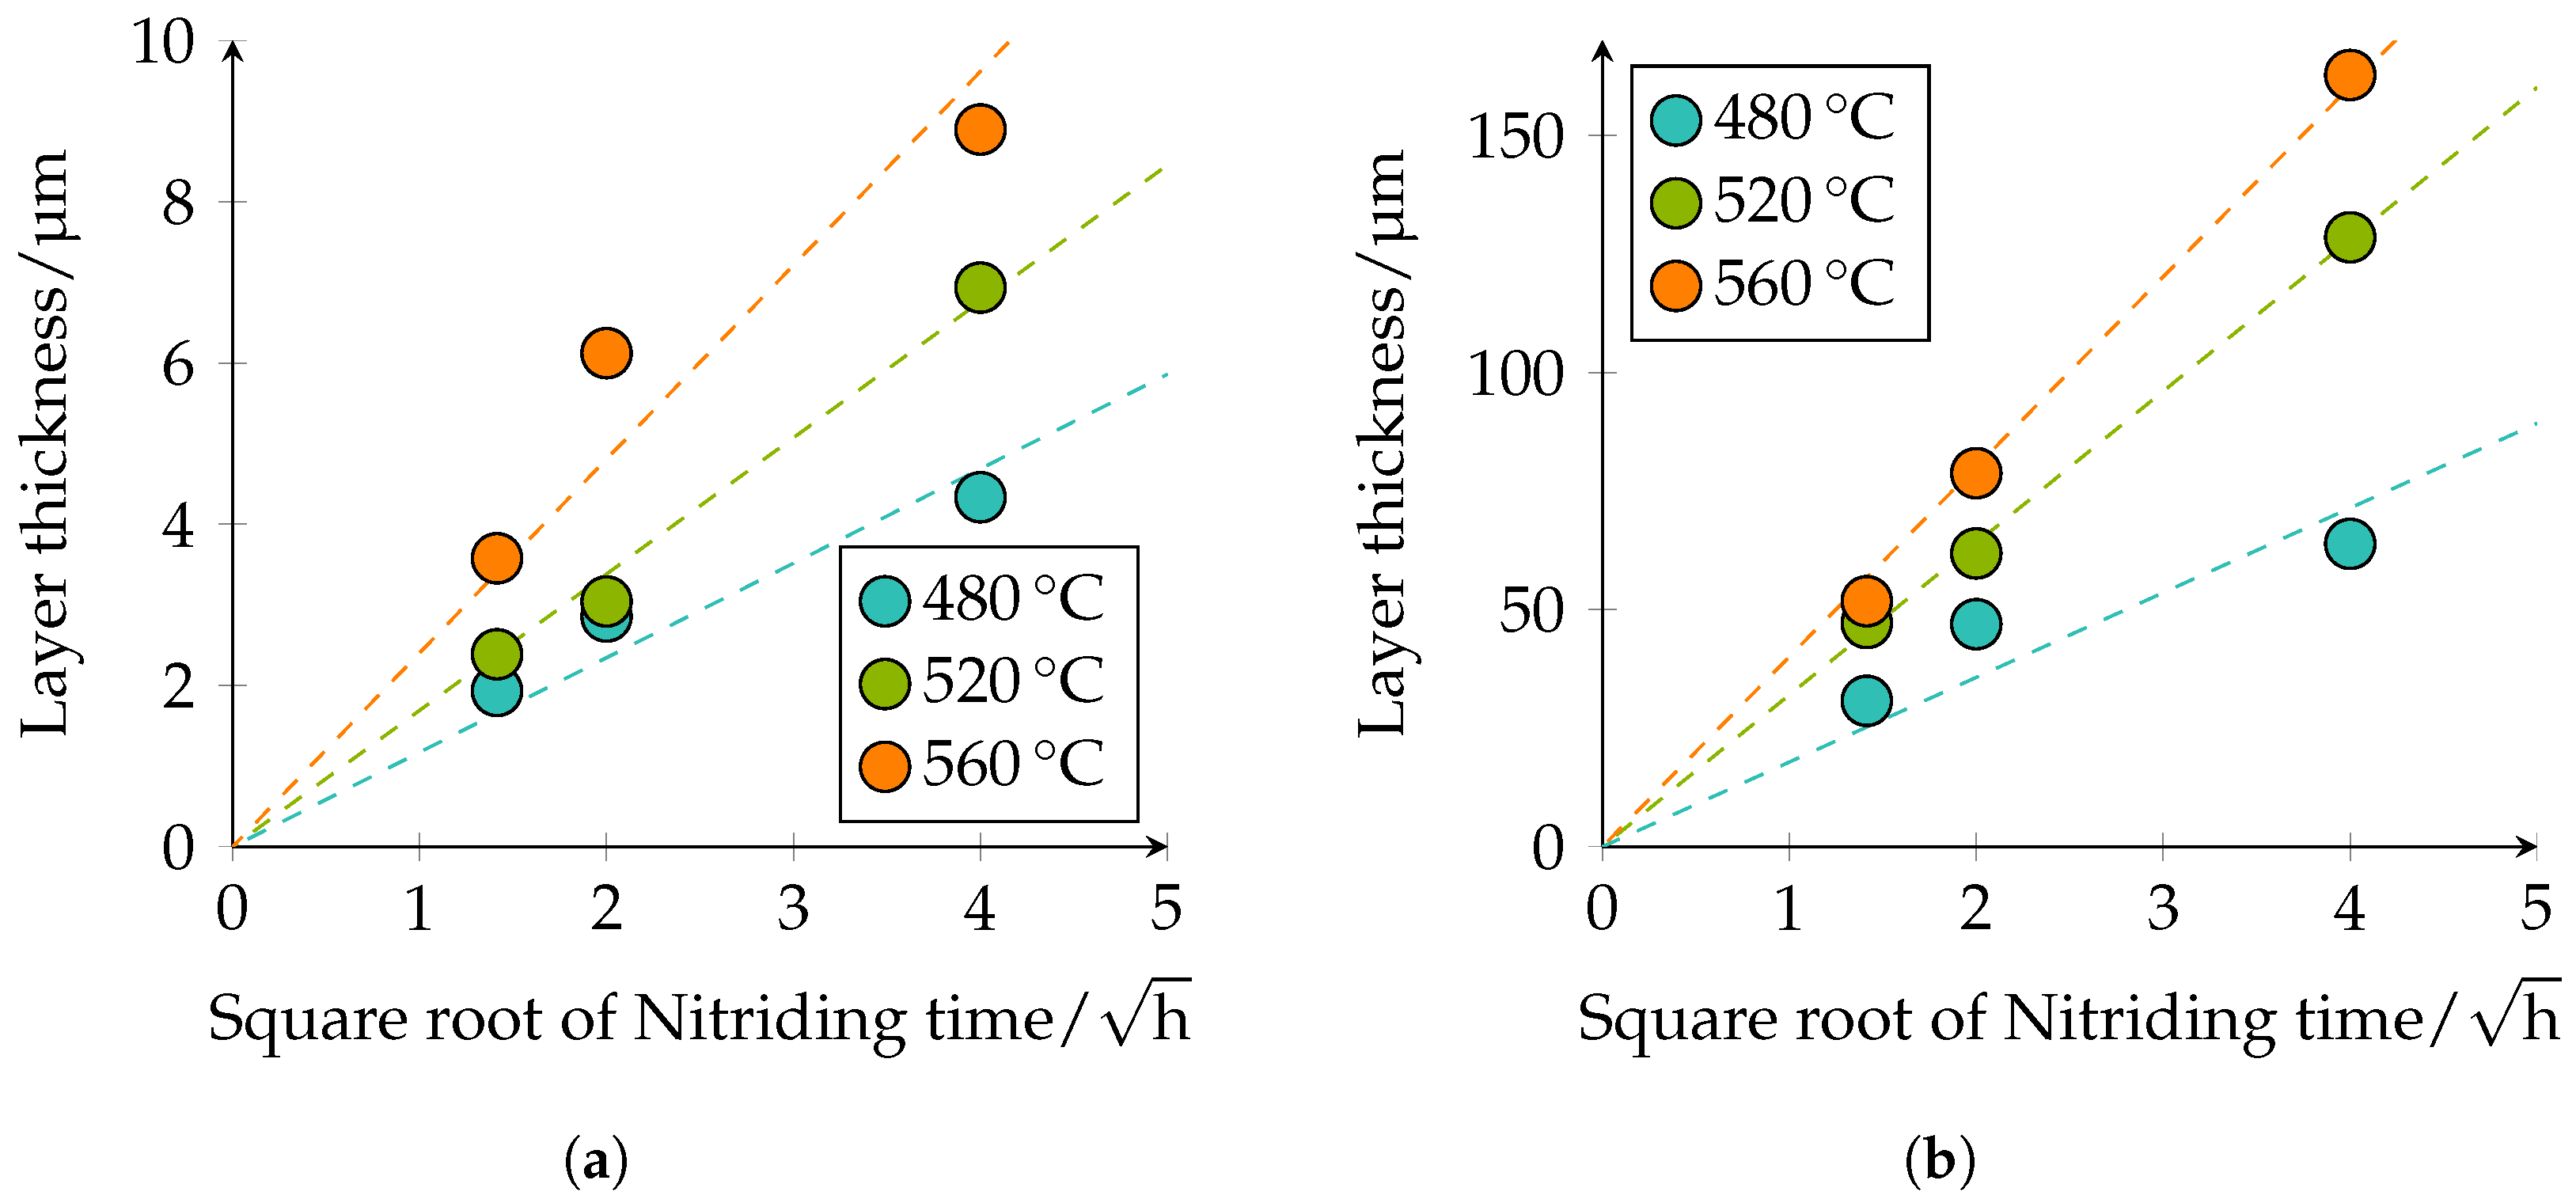
Table 5. The observed behavior corresponds to the square root of the time law; see Figure 10.
The conversion depth of the carbides/nitrides is shown in Figure 11 and presents the same tendencies. It can be seen that the transformation of the carbides is not homogeneous; see Figure 11a. Inside the carbides, nitrogen diffusion seems to be slower, but at the edges of the carbides or at the interface between carbide and matrix, they seem to transform faster. This was also observed in [28].
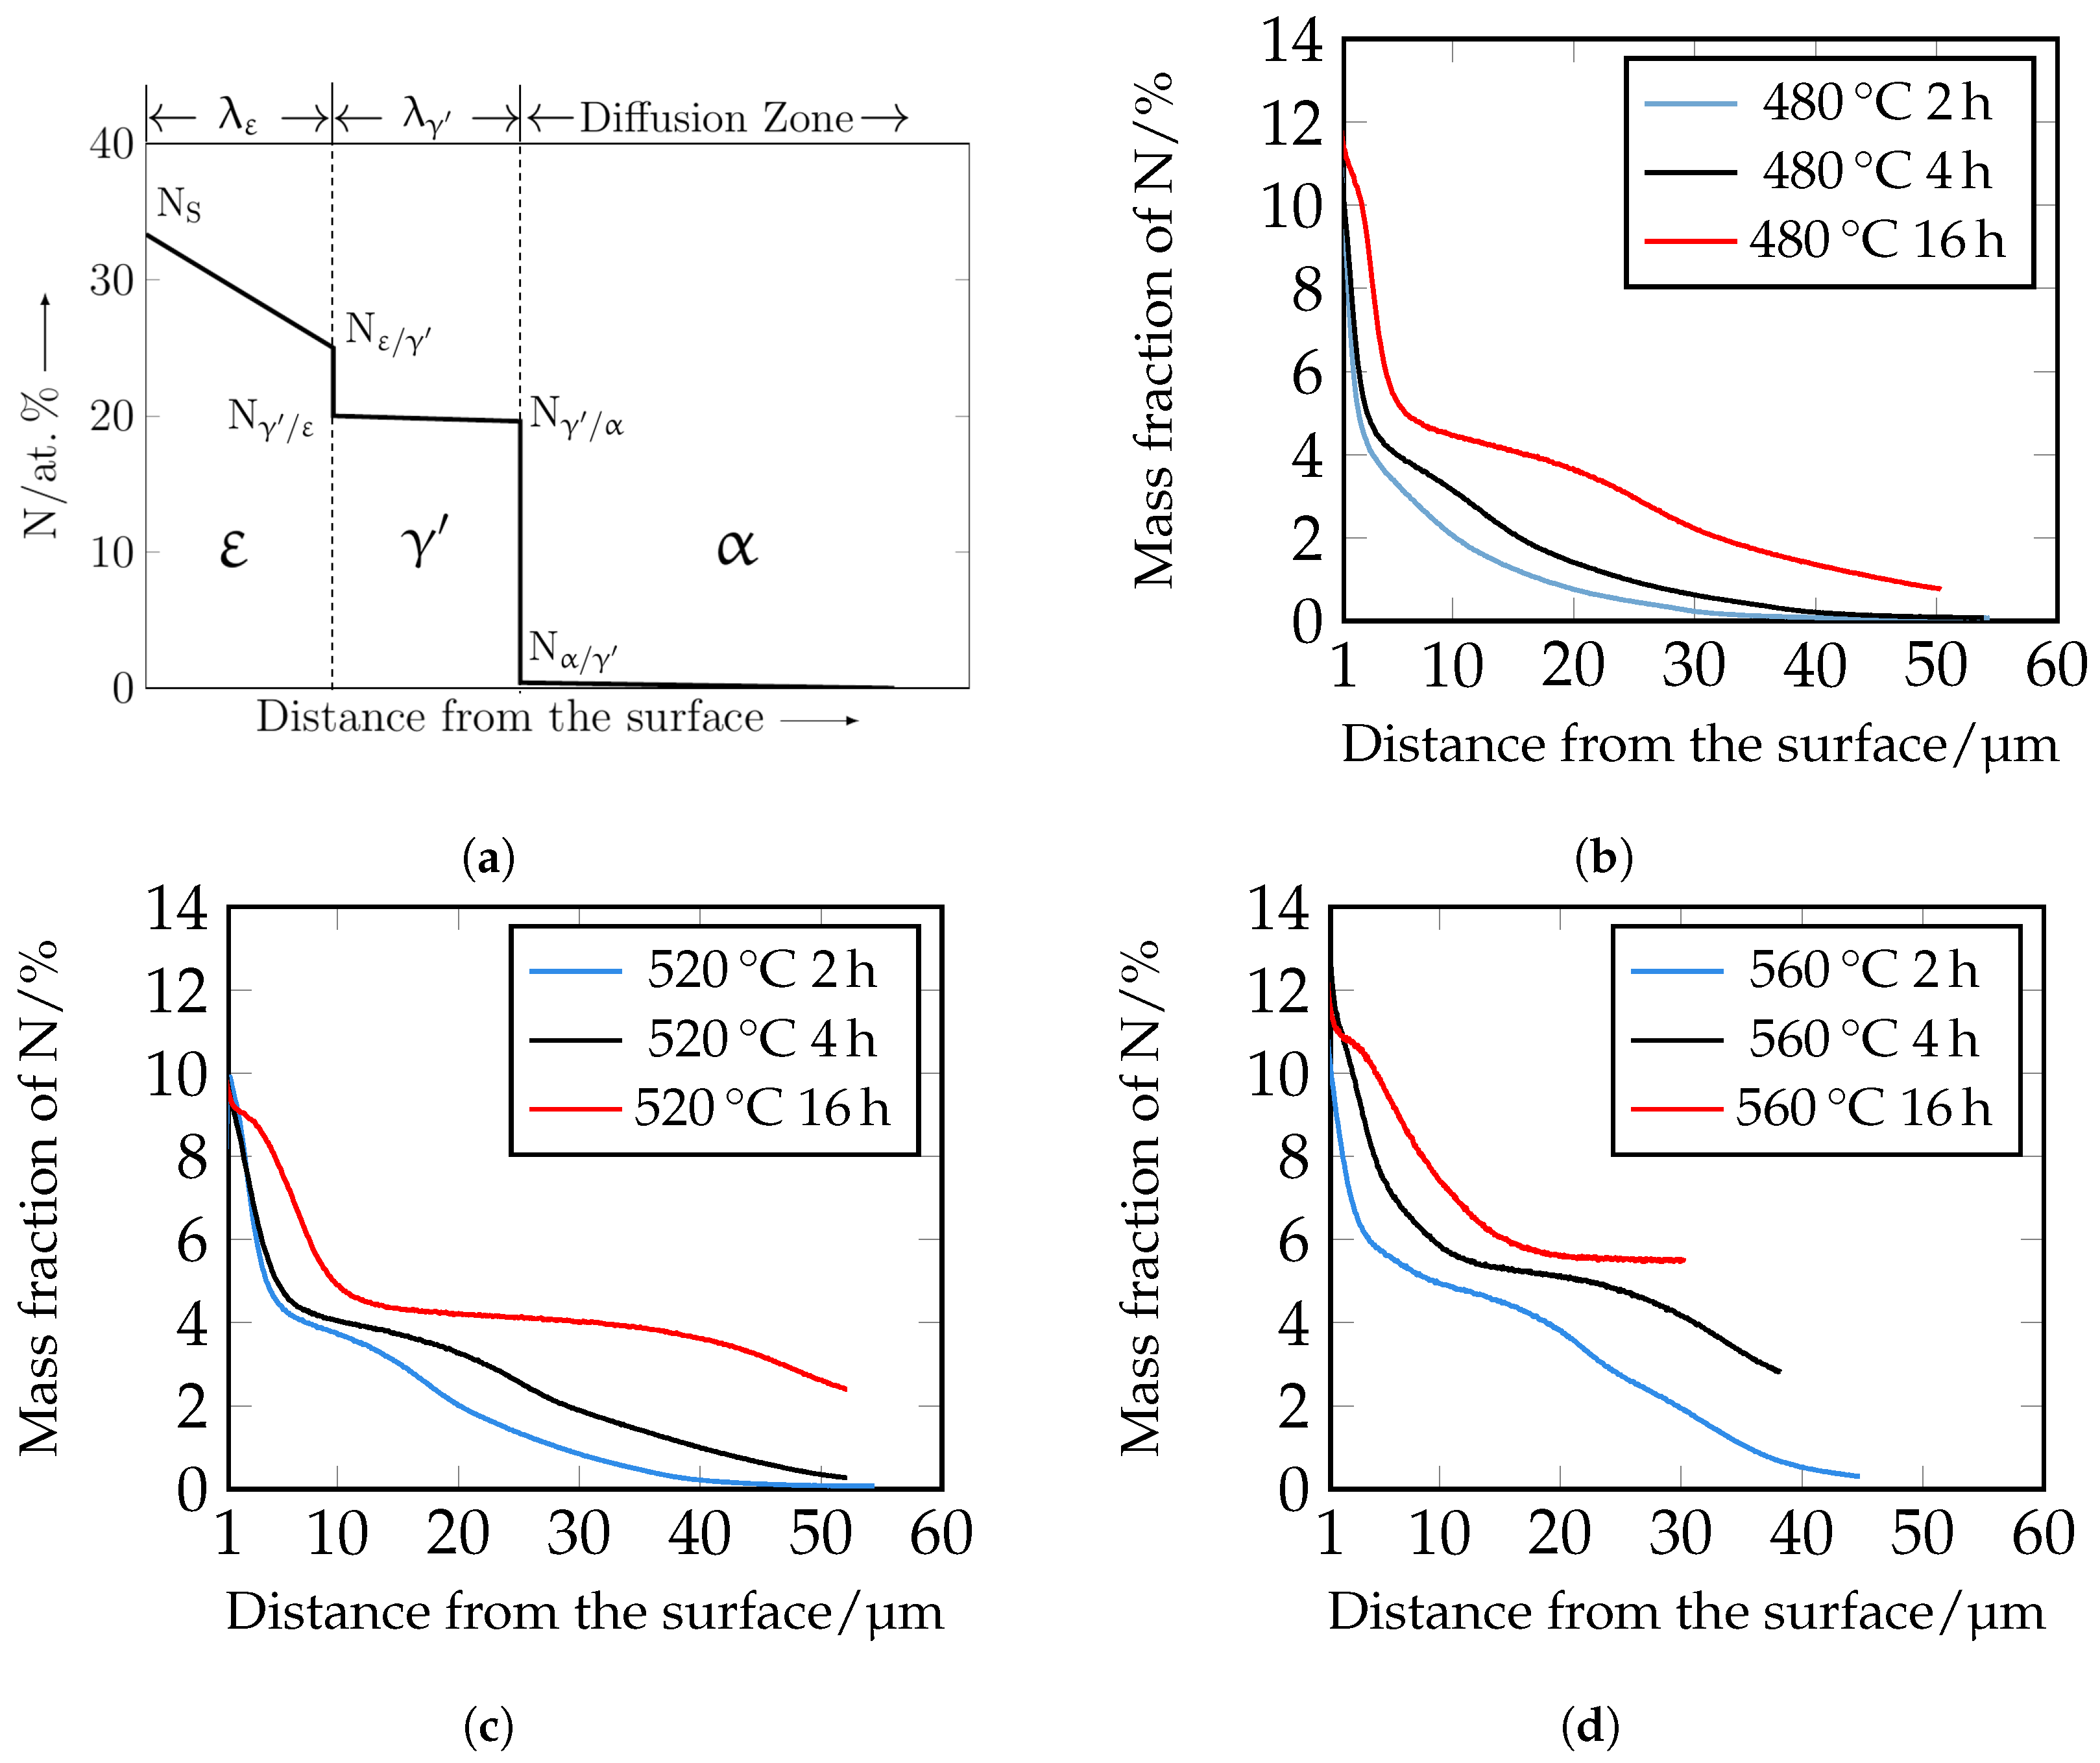
The nitrogen courses determined by means of GDOES are shown in Figure 12. For a better understanding, the assignment of the individual phases ε , γ , and α is also shown schematically. It should be noted that the GDOES measurement is macroscopic, and therefore, the heterogeneous nitrogen concentration profile, which is partly present due to the carbides, is averaged in the results. The nitrogen curves show that with increasing time and temperature, the nitrogen content increases as a function of depth. The experimental nitrogen courses determined by GDOES serve as a comparison of the numerically calculated nitrogen concentration profiles.
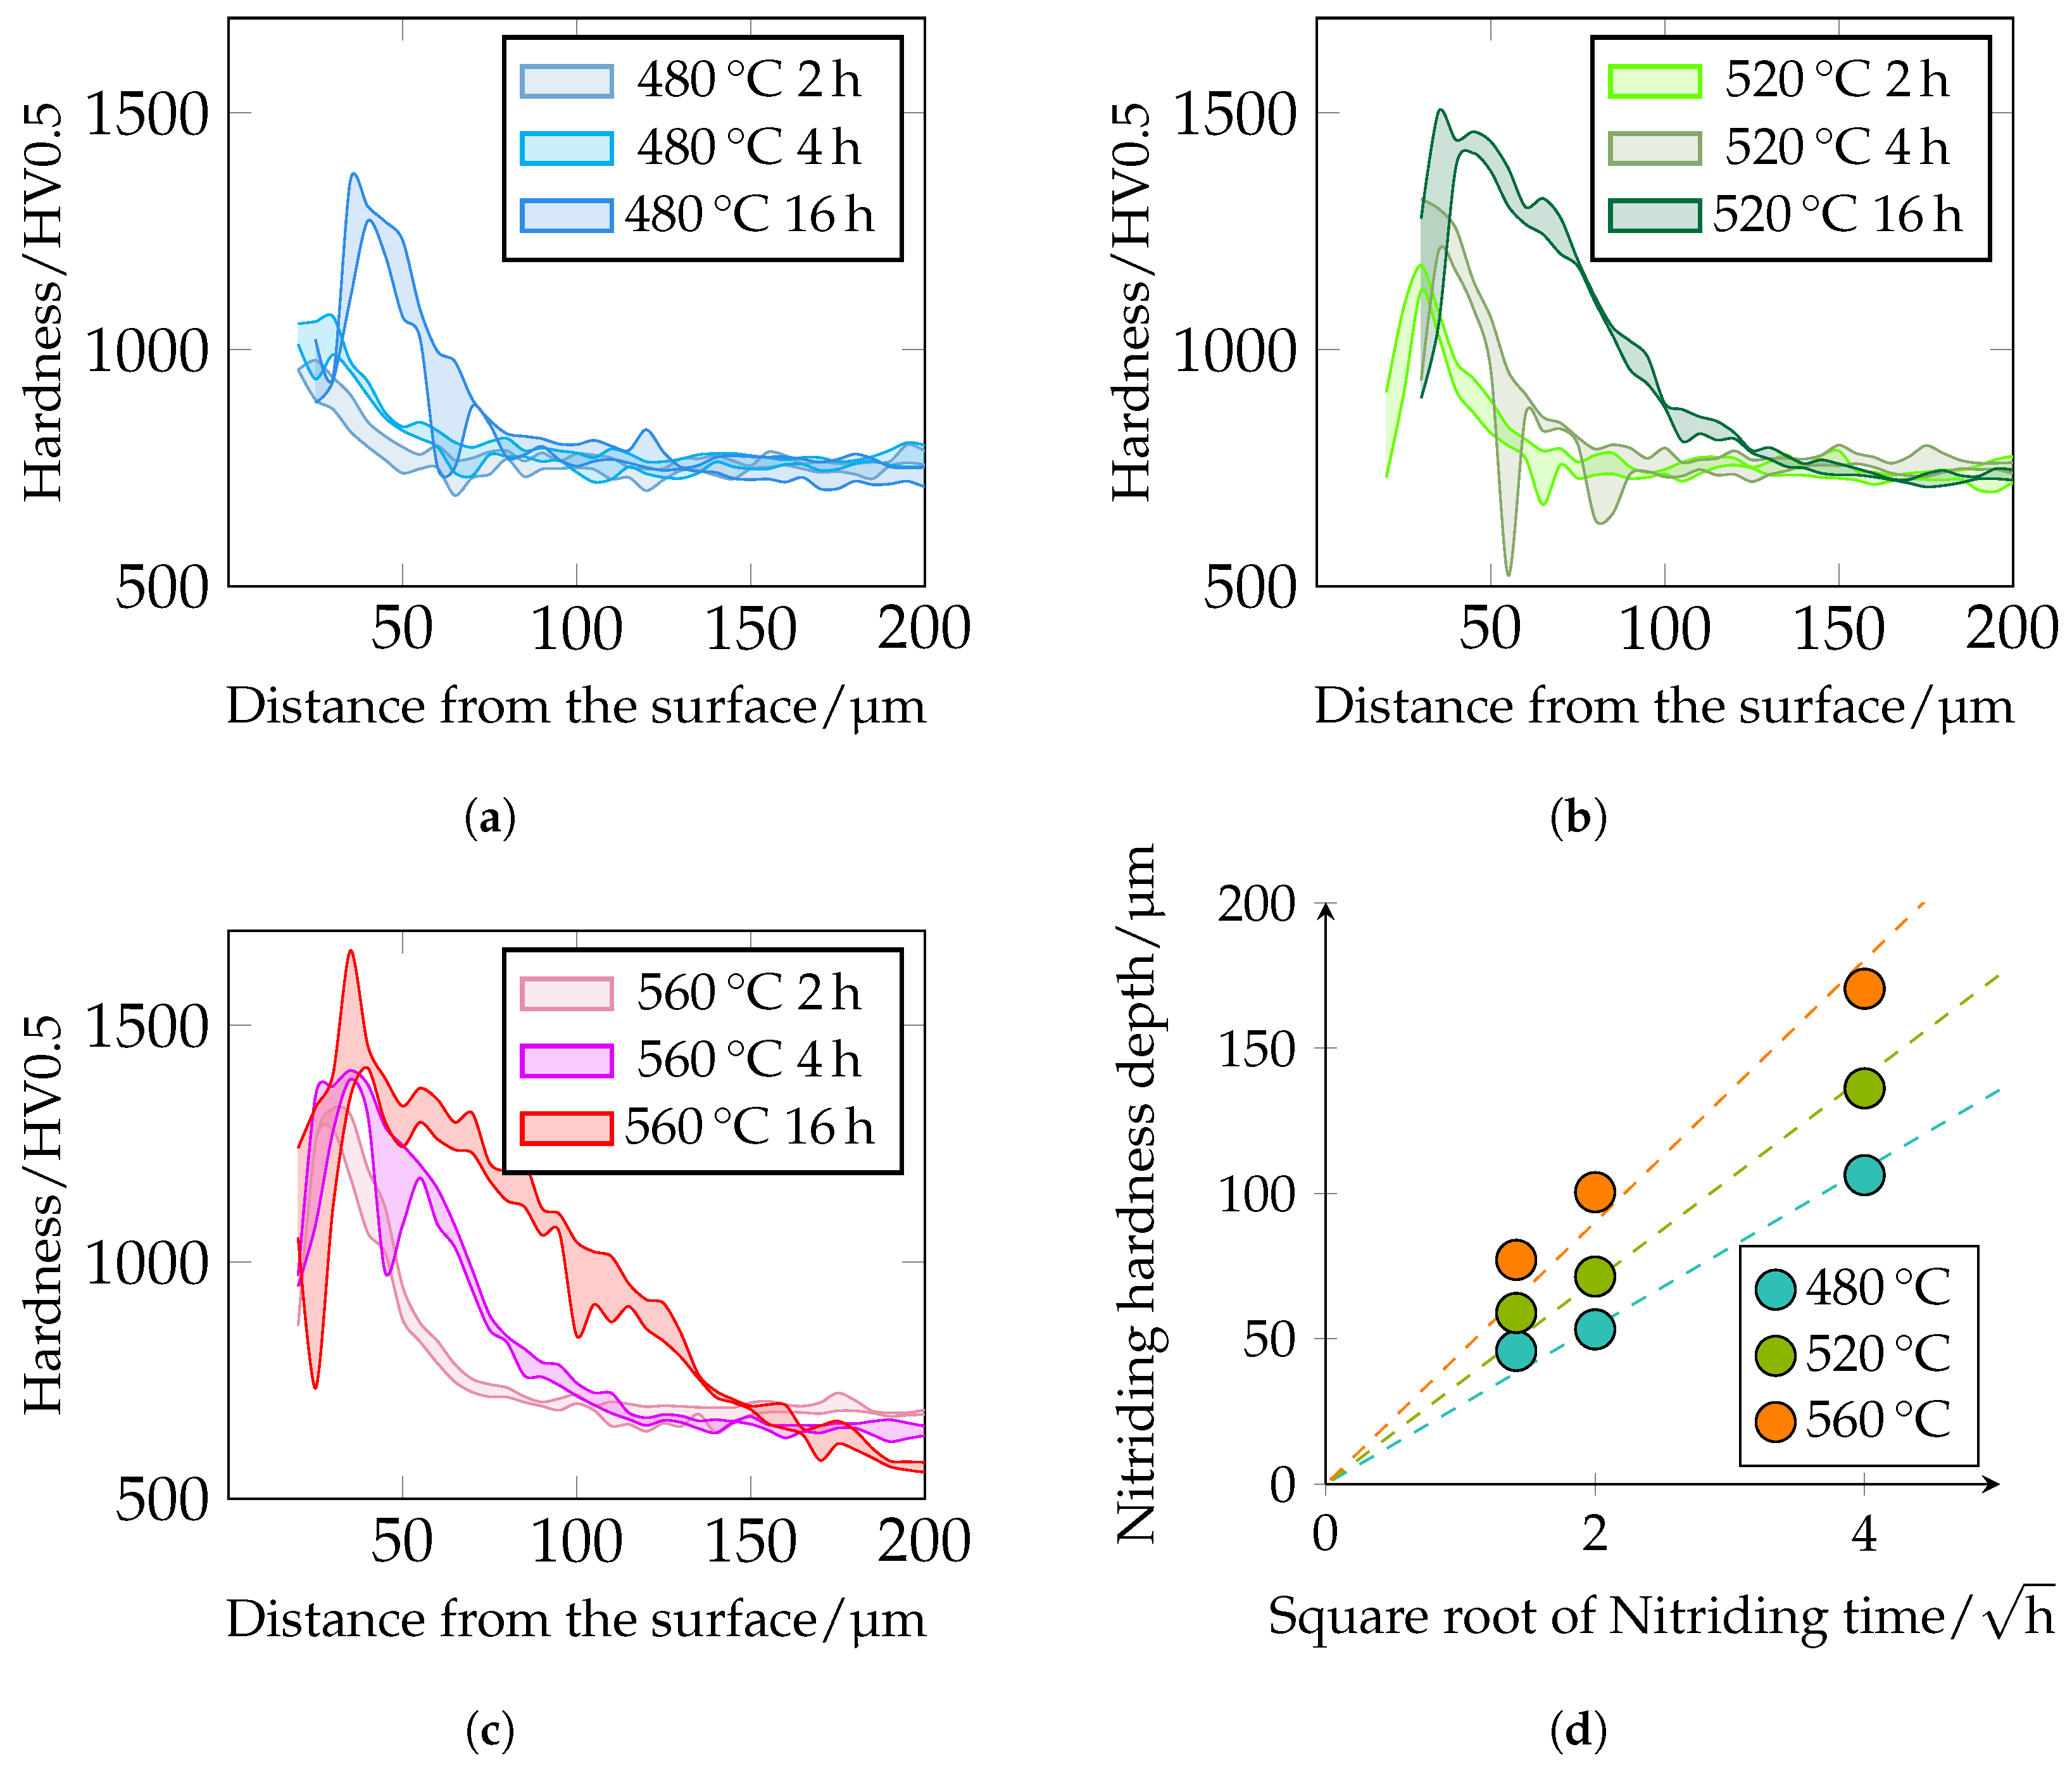
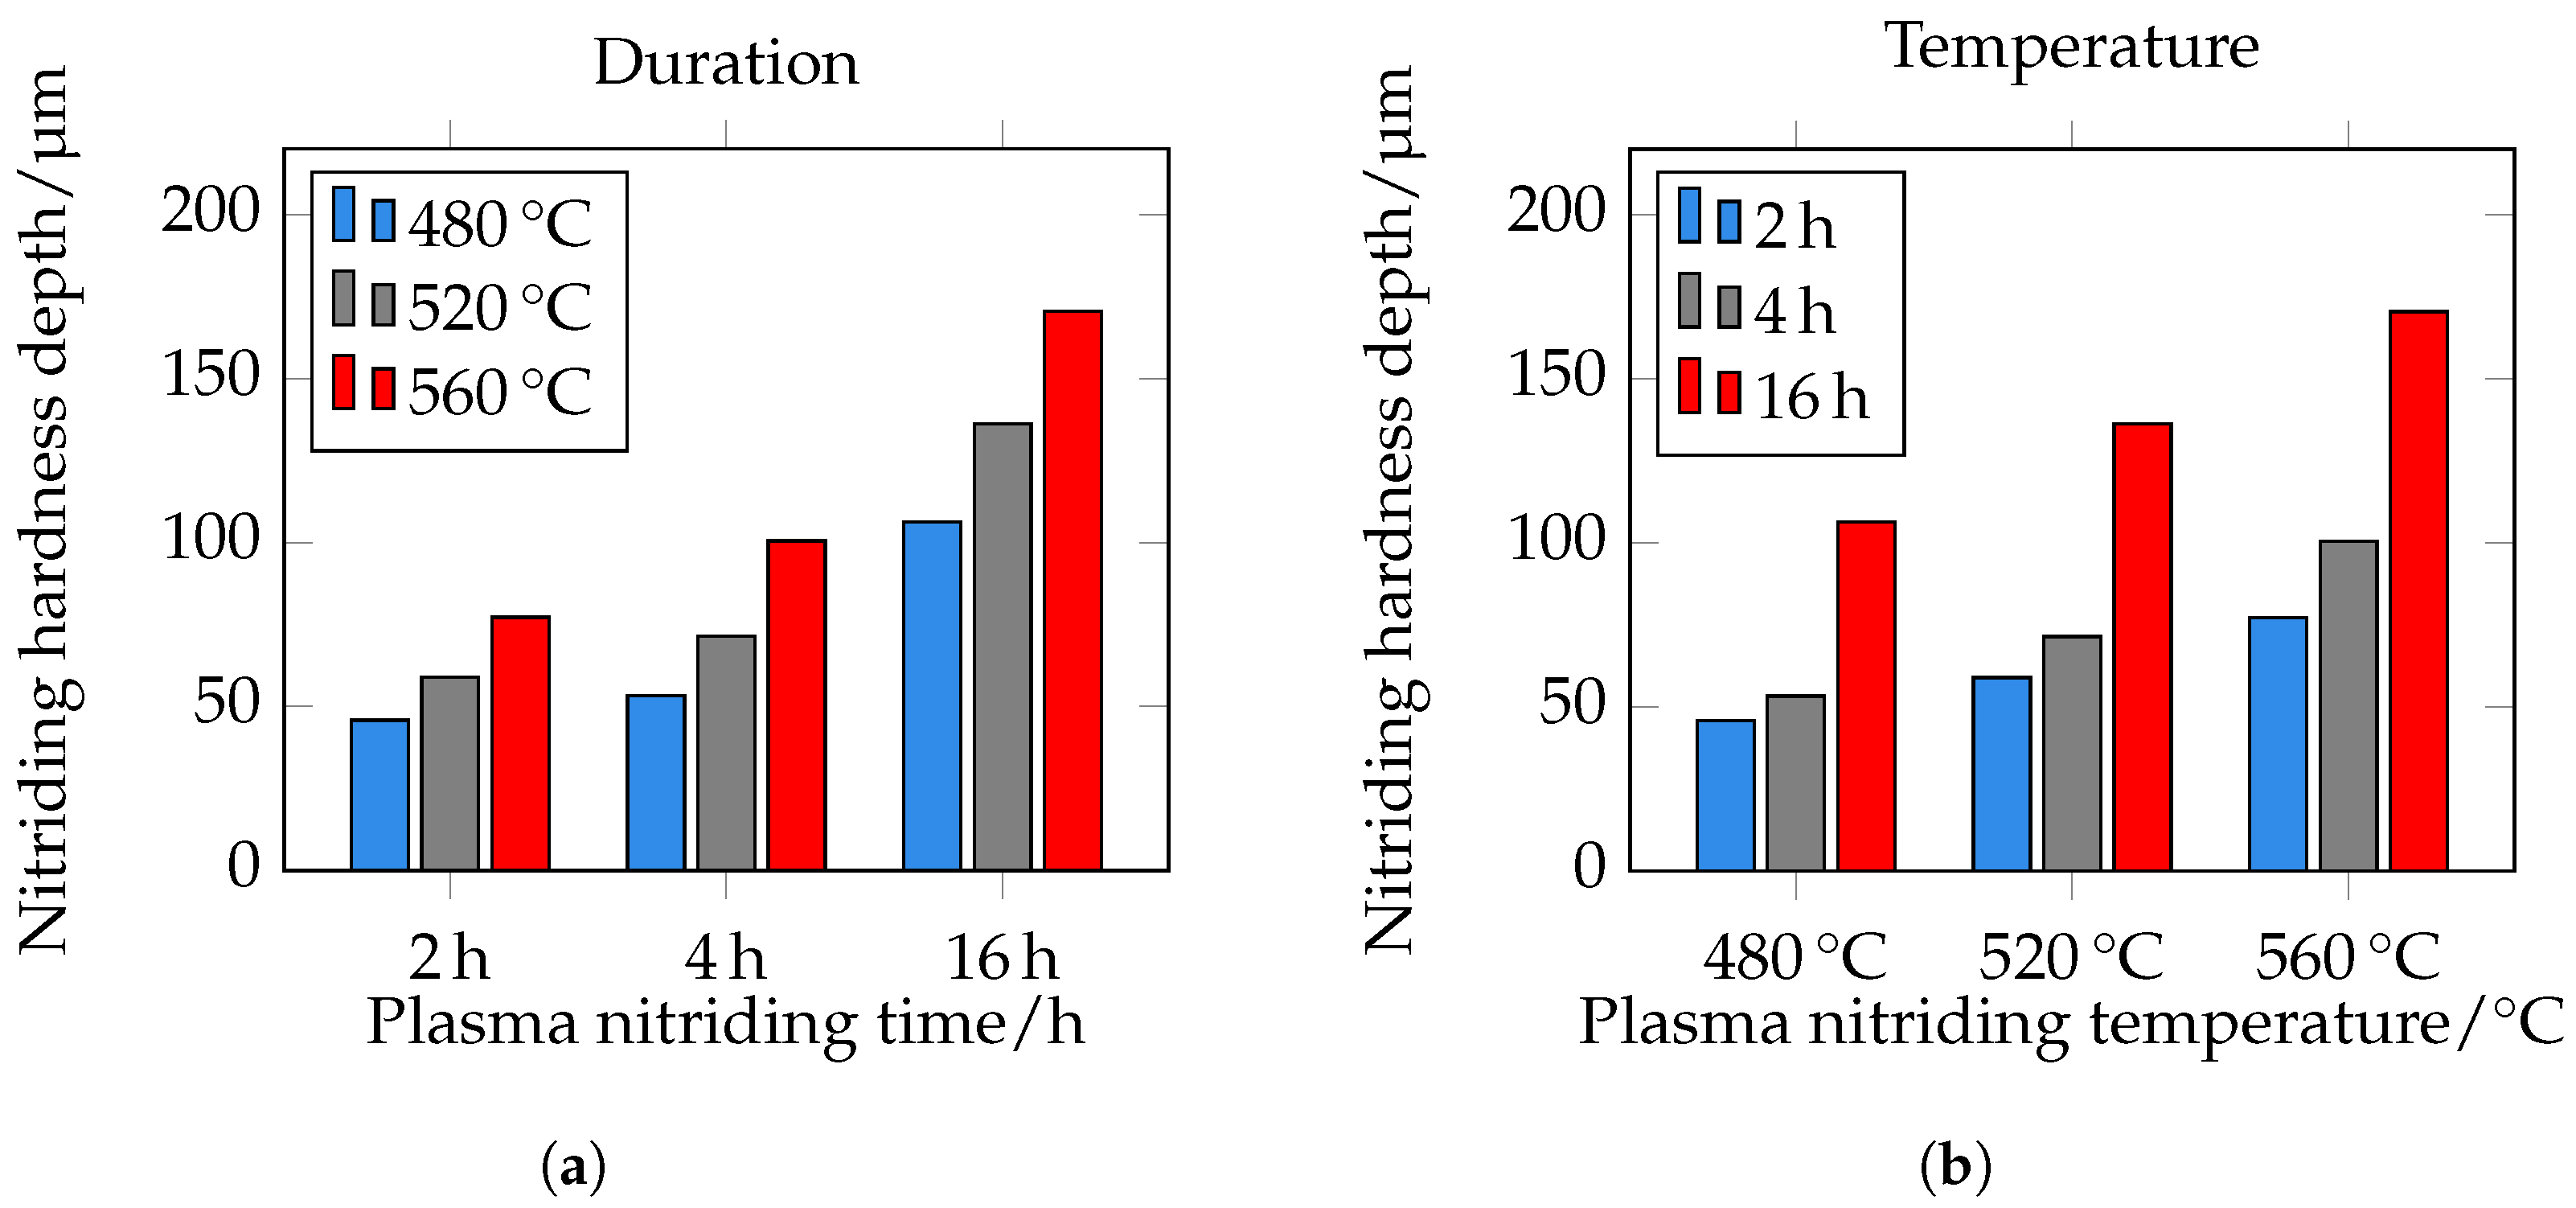
The different hardness profiles and nitriding depths (NHDs) are shown in Figure 13. It can be seen that hardness and nitriding depth increase with increasing plasma nitriding temperature and duration. This correlates very well with the metallographically determined layer thicknesses of the DL. With increasing nitriding time at constant temperature, the maximum hardness increases. It should be noted that the first indentations in the near-edge area are too close to the surface when measuring hardness with HV 0.5 ; see Section 2.5. The observed drop in the near-edge area may be due to this circumstance. Further analyses using microhardness and nanoindentation are required in further work. The maximum hardness of the hardness curves is approximately 980 HV 0.5 at 480 °C and 2 h and increases to 1360 HV 0.5 at 480 °C and 16 h. At 520 °C, a maximum hardness of approximately 1180 HV 0.5 can be observed at 2 h and at 16 h a maximum hardness of 1500 HV 0.5 . At 560 °C and 2 h nitriding time, a maximum hardness of approximately 1325 HV 0.5 and at 16 h of approximately 1660 HV 0.5 is present. The hardness of 1660 HV 0.5 seems a bit too high. Possibly, large primary carbides were hit during the measurement, which influenced the result. Further maximum hardnesses are 1400 HV 0.5 –1450 HV 0.5 . The NHD was defined as the vertical distance from the surface to the point where the hardness corresponds to the core hardness +50 HV 0.5 (limit hardness). As expected, the nitriding depth also correlates with the root-time law. The nitriding depth at 480 °C and 2 h is approximately 45 μm, at 4 h approximately 55 μm, and at 16 h approximately 105 μm. At 520 °C and 2 h, it is approximately 60 μm, at 4 h approximately 70 μm, and at 16 h approximately 135 μm. At a temperature of 560 °C and a treatment time of 2 h, the nitriding hardness depth is approximately 75 μm, at 4 h 100 μm, and at 16 h 170 μm. The NHD is shown in Figure 13d and Figure 14. Please note that the core hardness varies due to the tempering effects during plasma nitriding; see Table 6.
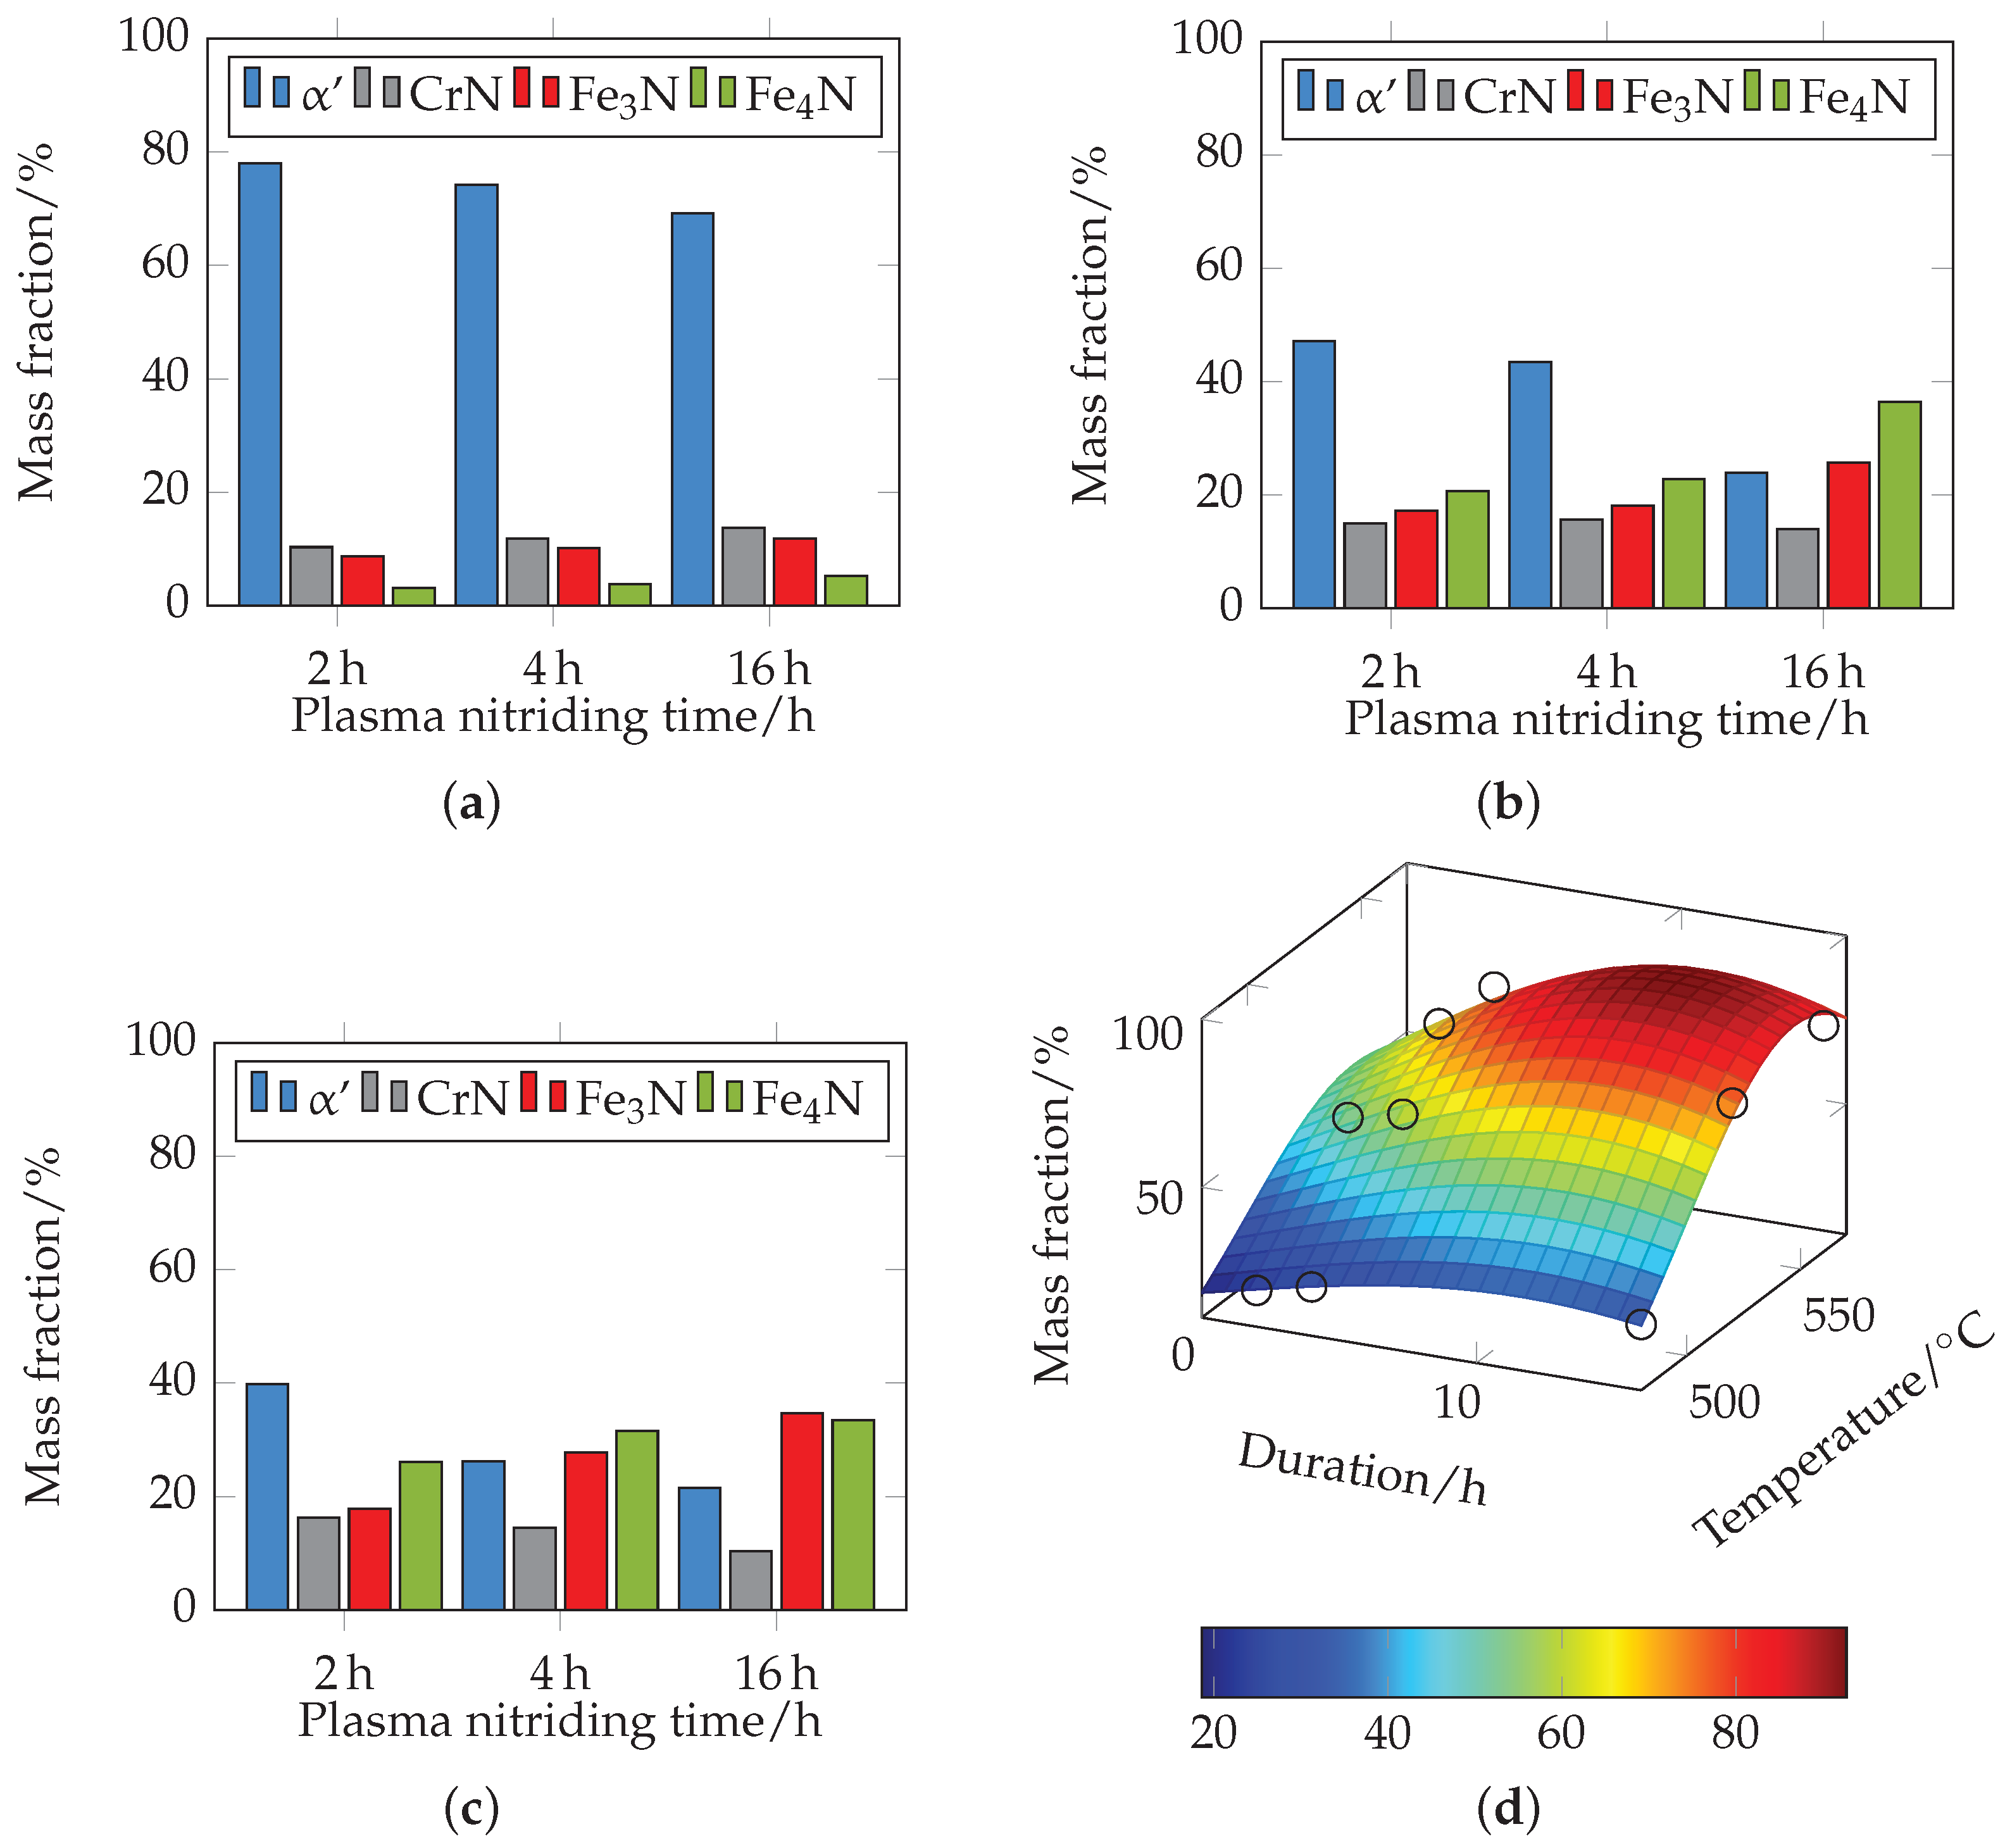
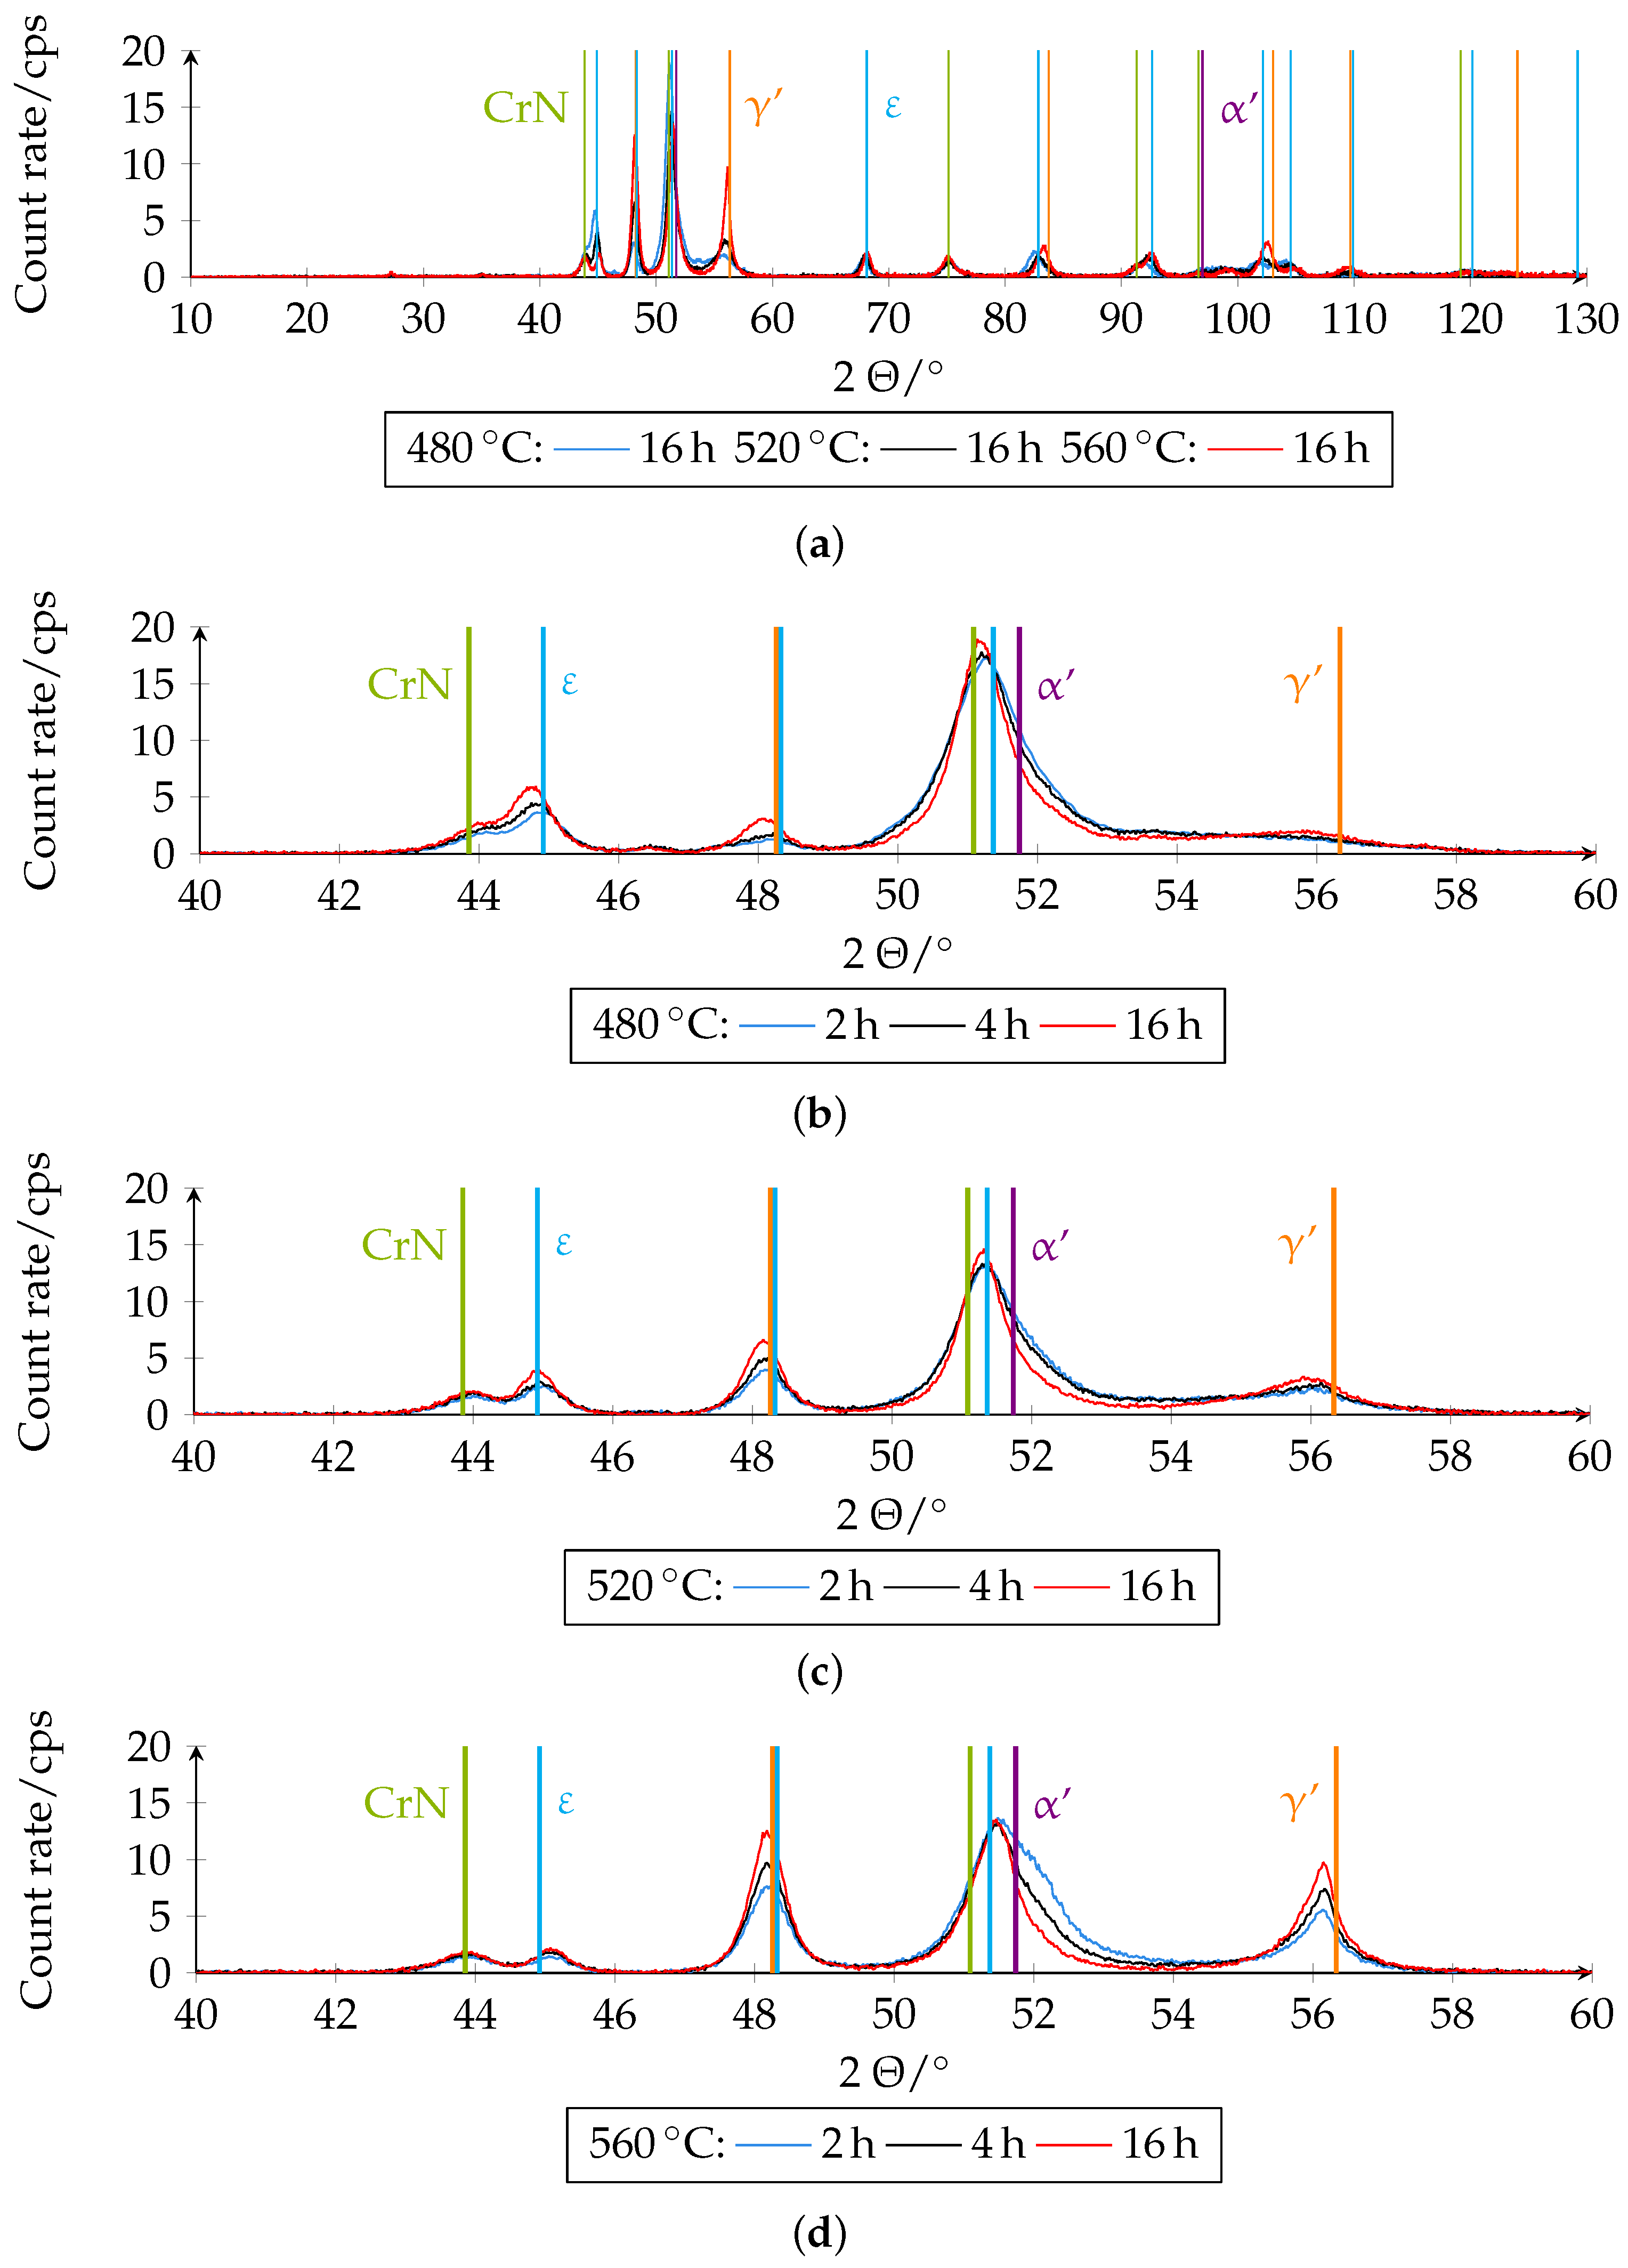
Figure 15 shows the different XRD diffractograms on which the quantitative analysis was based. The phase fractions of the boundary layer of the differently plasma-nitrided samples determined quantitatively by XRD can be seen in Figure 16. Figure 16a shows the mass contents for different plasma nitriding durations at 480 °C. The mass fractions of ferrite (α)/martensite ( α ) decrease with increasing duration from approximately 78% at 2 h to approximately 69% at 16 h, and the fractions of ε , γ and CrN increase slightly. At 520 °C (see Figure 16b), a further significant decrease in the mass content of ferrite (α)/martensite ( α ) from 47% at 2 h to 24% at 16 h can be seen compared to 480 °C. The proportions of ε and γ increase accordingly, with the proportion of γ predominating. The proportions of CrN remain almost constant. At 560 °C (see Figure 16c), a further decrease in the mass content of ferrite (α)/martensite ( α ) from 40% at 2 h to 21.5% at 16 h can be observed. Here, too, the proportions of ε and γ increase accordingly. The proportion of ε increases from 18% at 2 h nitriding time to 35% at 16 h nitriding time and the proportion of γ from 26% at 2 h nitriding time to 33.5% at 16 h nitriding time. The proportions of CrN decrease slightly with increasing duration. At 560 °C, there is a higher mass fraction of ε than at the other temperatures investigated. Figure 16d shows the approximated 3D plot of the sum of the mass fractions of ε , γ and CrN. Since the mass fraction of m α / α = 100% m i with i = F e 3 N , F e 4 N , and C r N , the fraction of ferrite (α)/martensite ( α ) can be interpreted inversely to the plotted curve. It can be clearly seen that the proportion of nitride phases increases with increasing temperature and nitriding time, and the proportion of ferrite (α)/martensite ( α ) decreases accordingly. This correlates with the previous results. The XRD measurements record a certain measurement volume. With increasing nitriding temperature and duration, the compound layer thickness increases so that the proportions of the initial microstructure decrease. It should be noted that the changed composition can thus possibly be attributed to a higher layer thickness. The local mass fractions of the compound layer therefore do not necessarily have to be changed.
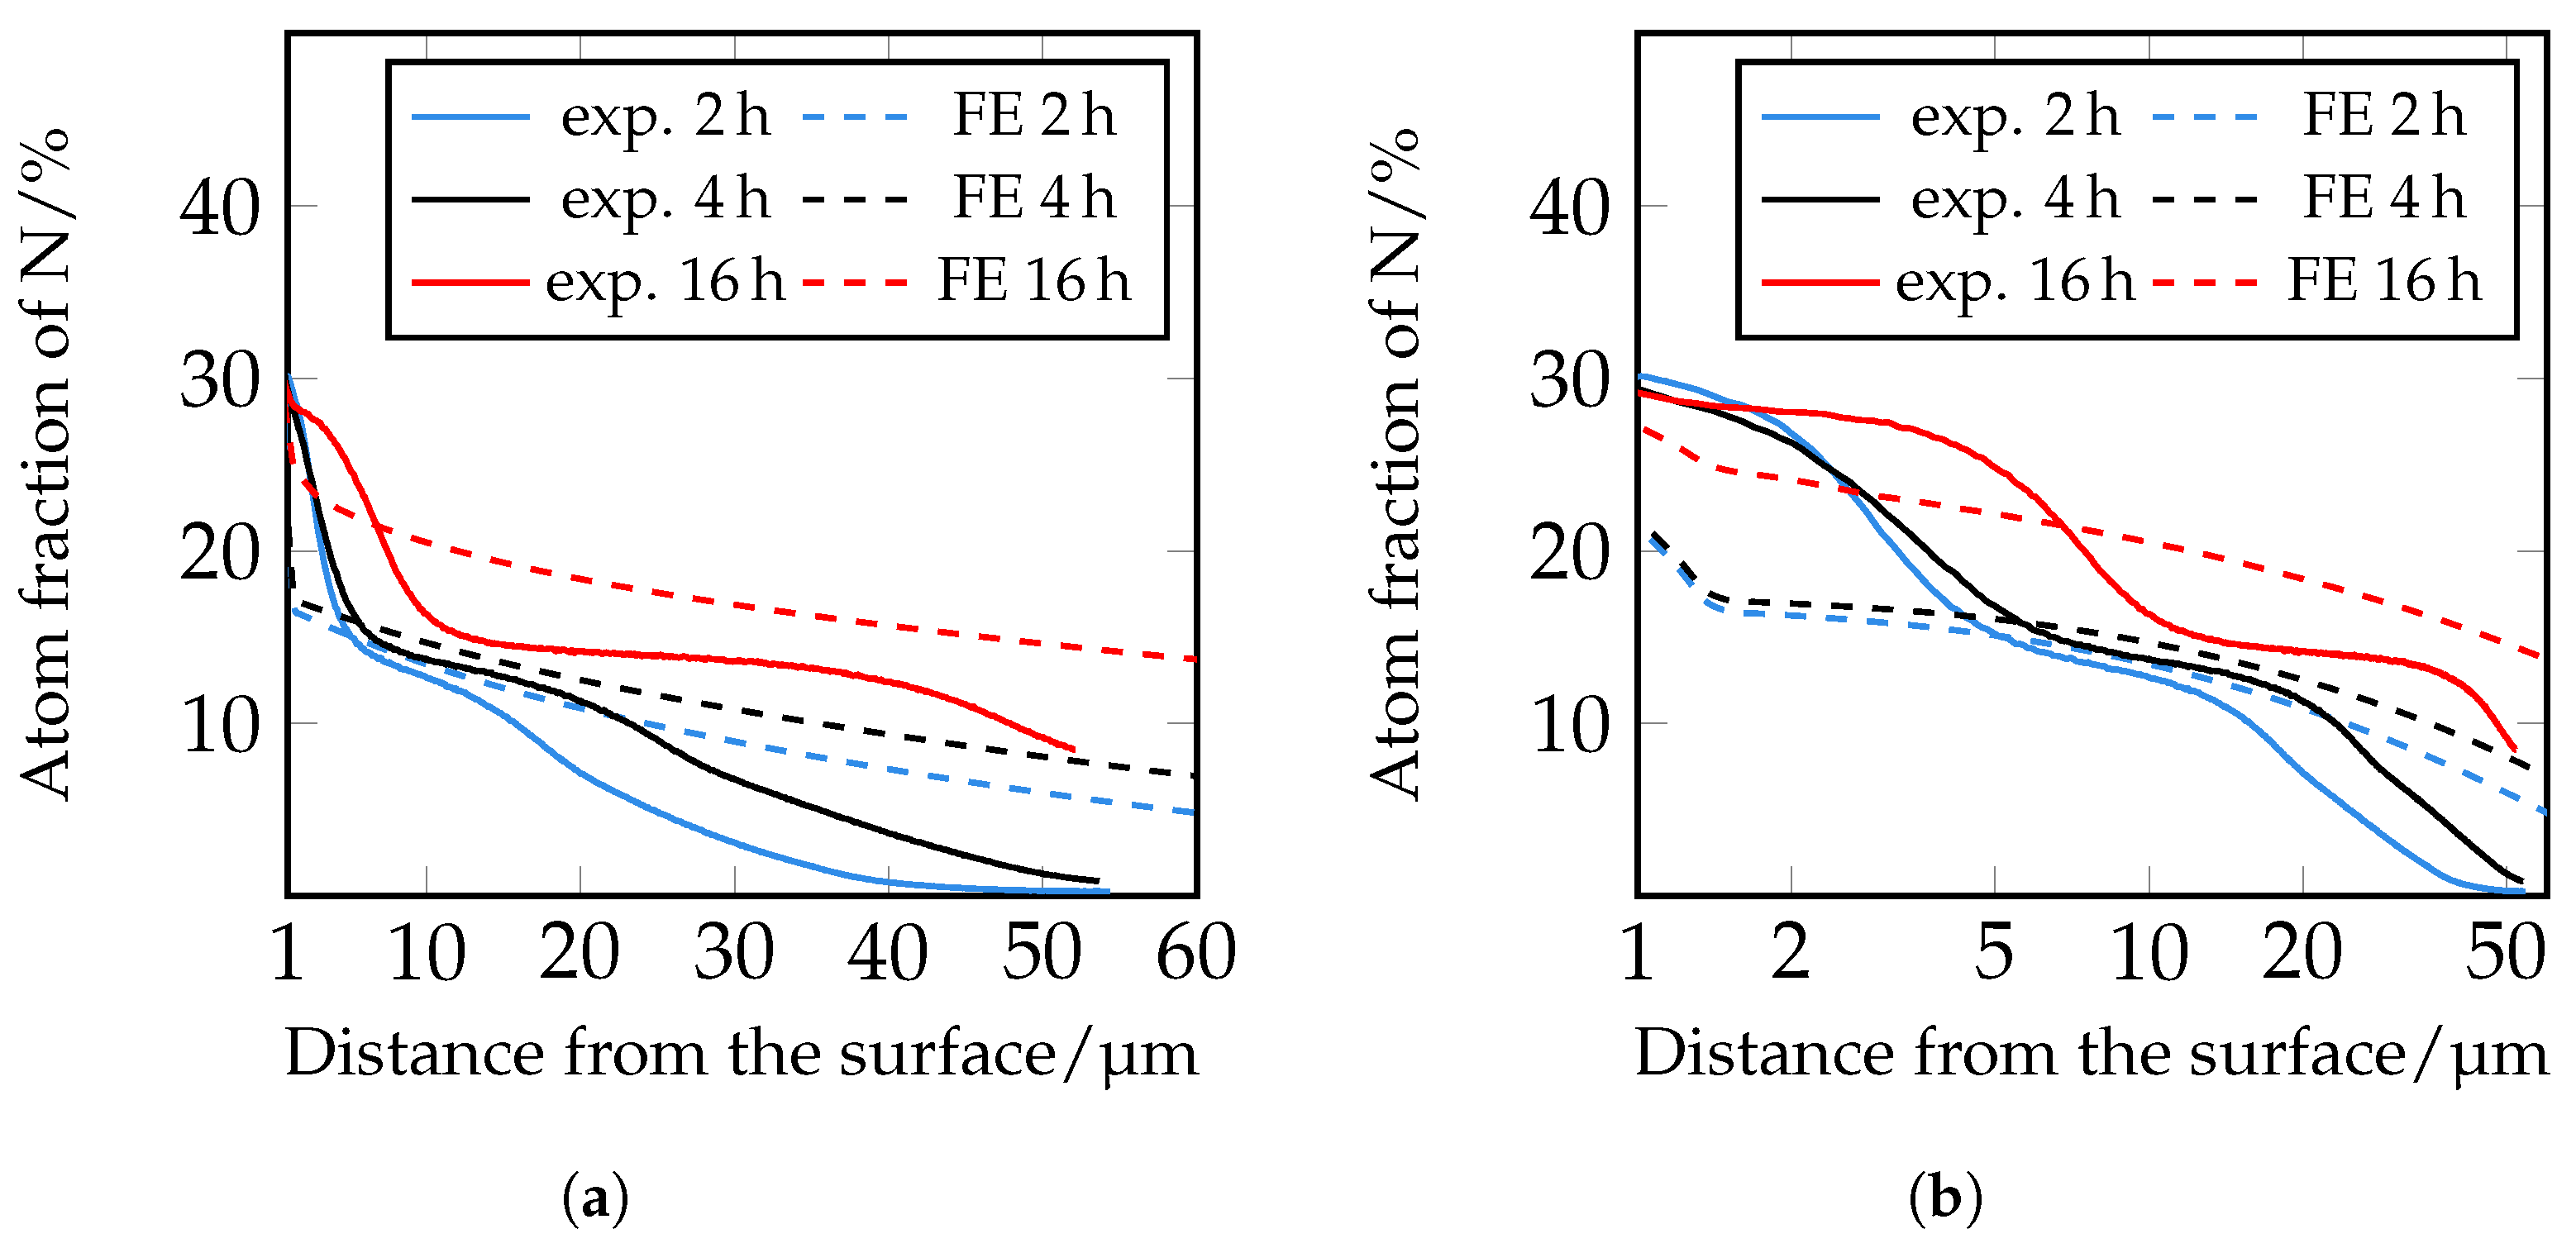
In the following paragraph, the results of the FE simulations are presented and compared with the experimental results. More detailed work on the microstructure simulations will be published in further studies. The diffusion coefficients were calculated as described in Section 2.7. They were at first calculated according to [33,34] and iteratively adjusted in a further step. The results of the FE simulations of the nitrogen distribution after plasma nitriding at 520 °C for 2 h, 4 h, and 16 h with varied diffusion coefficients DN ε , DN γ , DN, DNCarbide, and DNNitride and the comparison with the experimentally determined nitrogen concentration profiles are shown in Figure 17, Figure 18 and Figure 19.
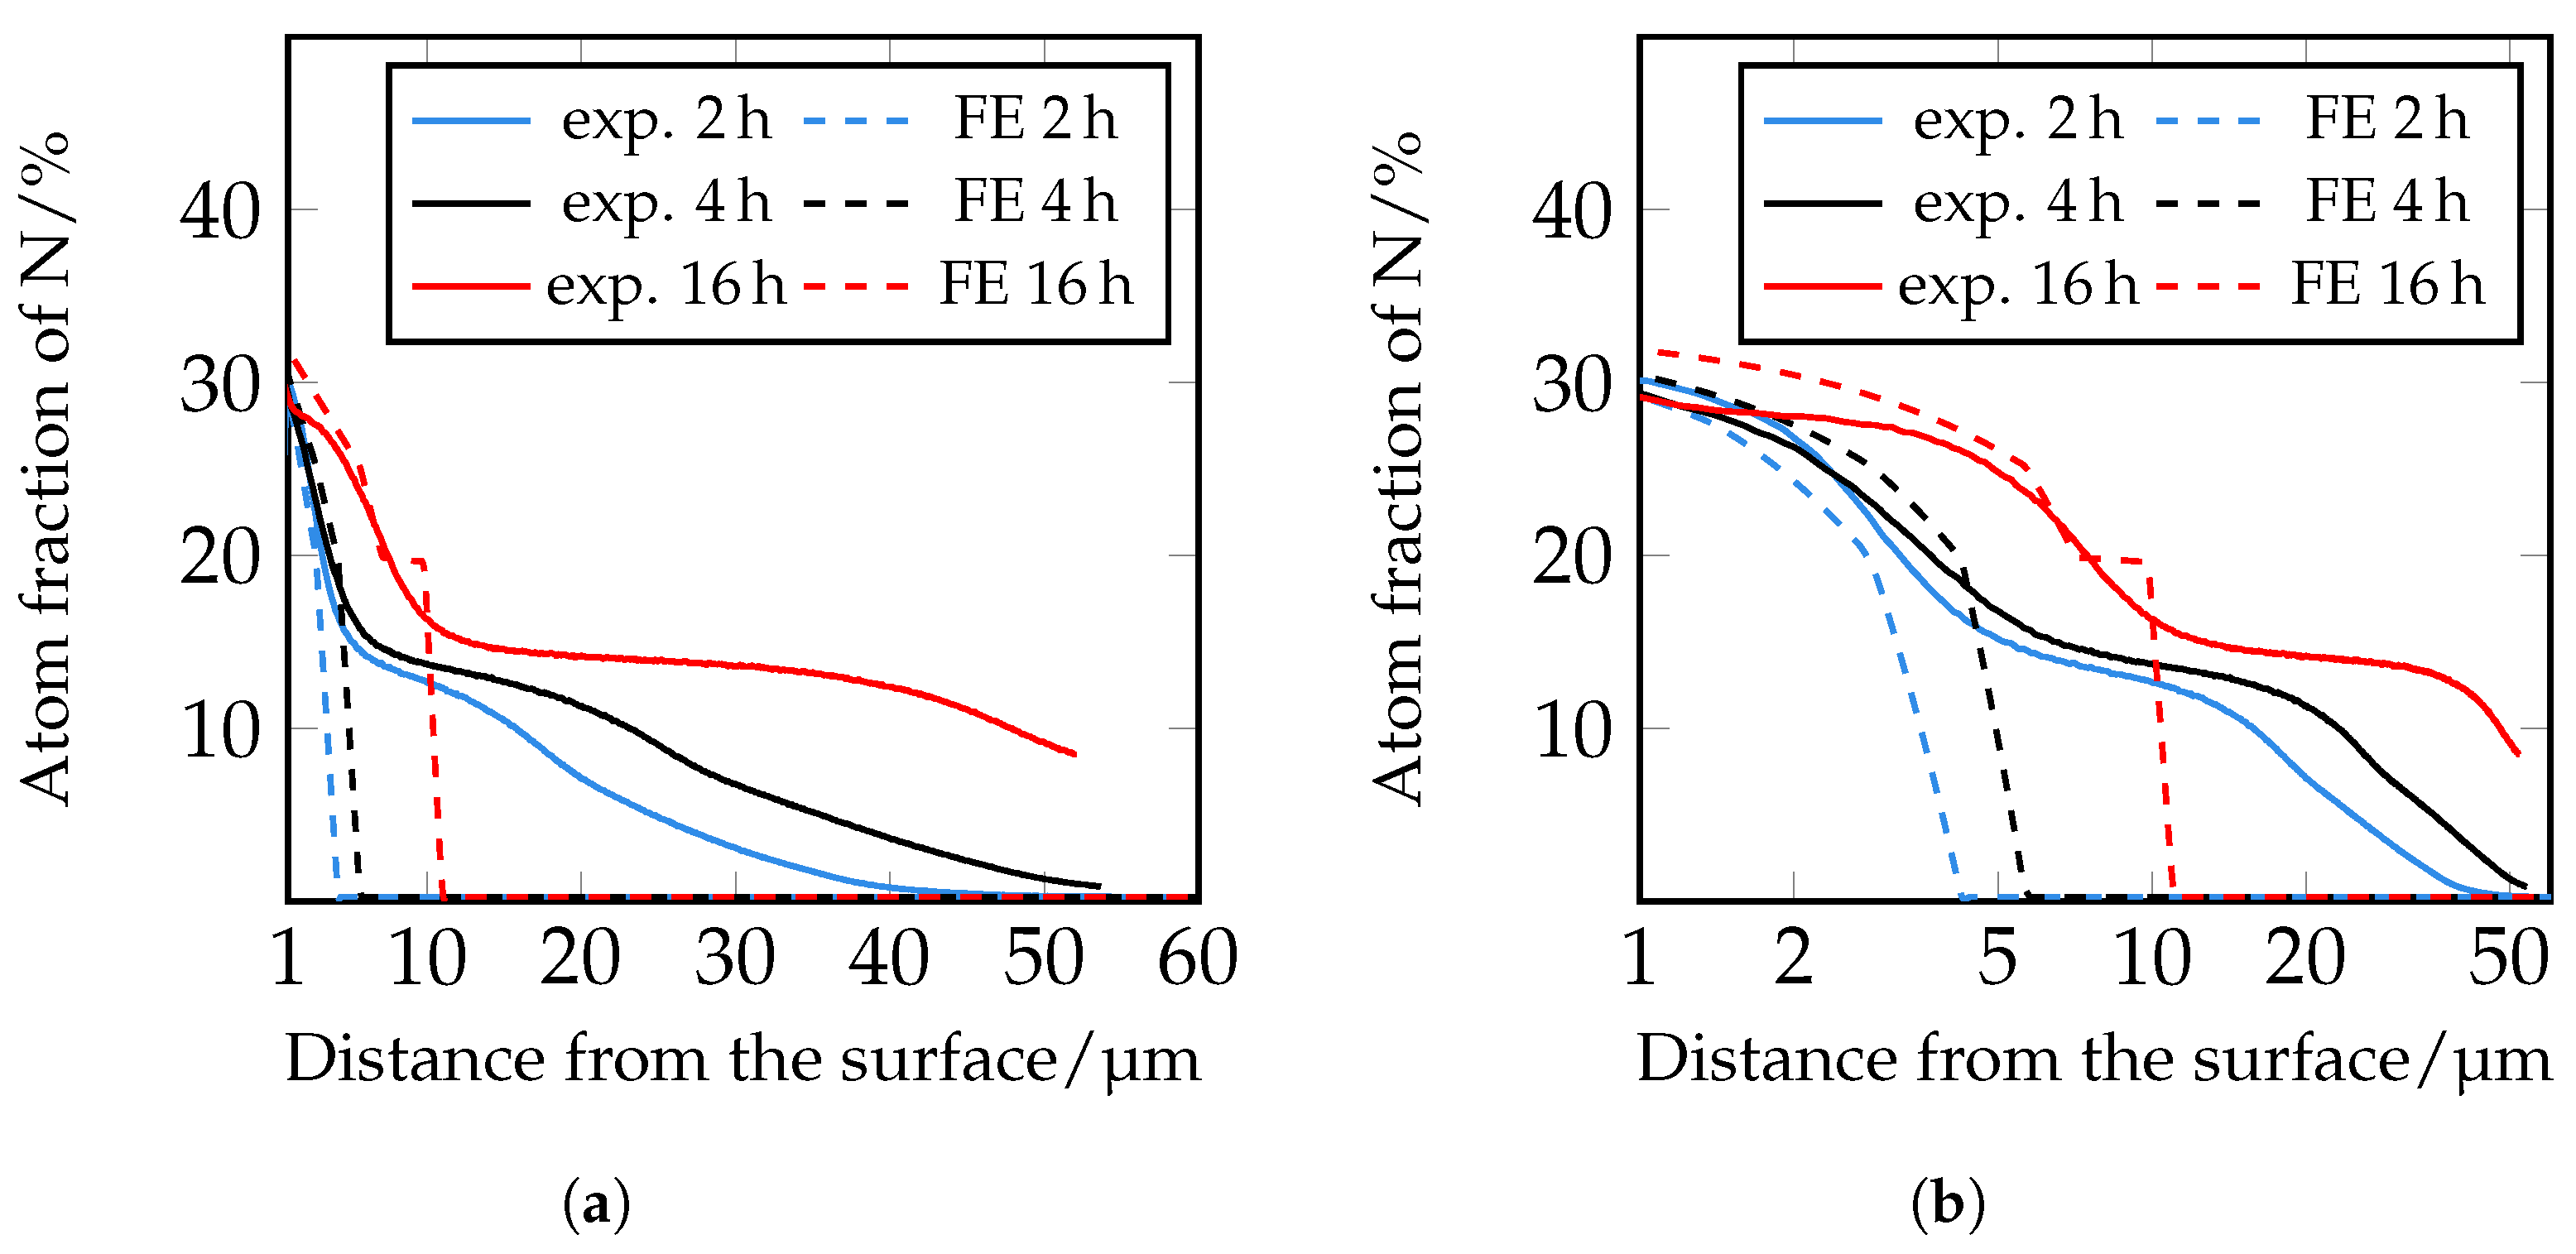
The simulation of the nitrogen depth profiles with the different diffusion coefficients according to [33,34] show deviations from the experimentally determined nitrogen depth profiles. The calculated nitrogen course based on the diffusion coefficients according to [33] shows a good agreement in the near-surface range of the nitrogen courses up to approximately 5 μm. In the further calculated course, the decrease of the nitrogen content is too steep, so that there is no good correlation with the experimentally determined values. The diffusion coefficients according to [34] show greater deviations in the course in the front area of the nitrogen concentration profiles than the nitrogen courses determined with the coefficients according to [33]. In deeper areas, on the other hand, there is better agreement. It should be noted that the diffusion coefficients used were determined for pure iron. Further reasons for the deviation are to be seen in the fact that according to [39], diffusion coefficients for γ and ε nitrides, which are determined during plasma nitriding, are problematic, since during plasma nitriding, as the nitrogen diffuses, inwards a part of the surface is sputtered away at the same time. Furthermore, according to [39], it should be noted that when applying a certain diffusion coefficient, the corresponding model used to evaluate the diffusion coefficient should be taken into account.
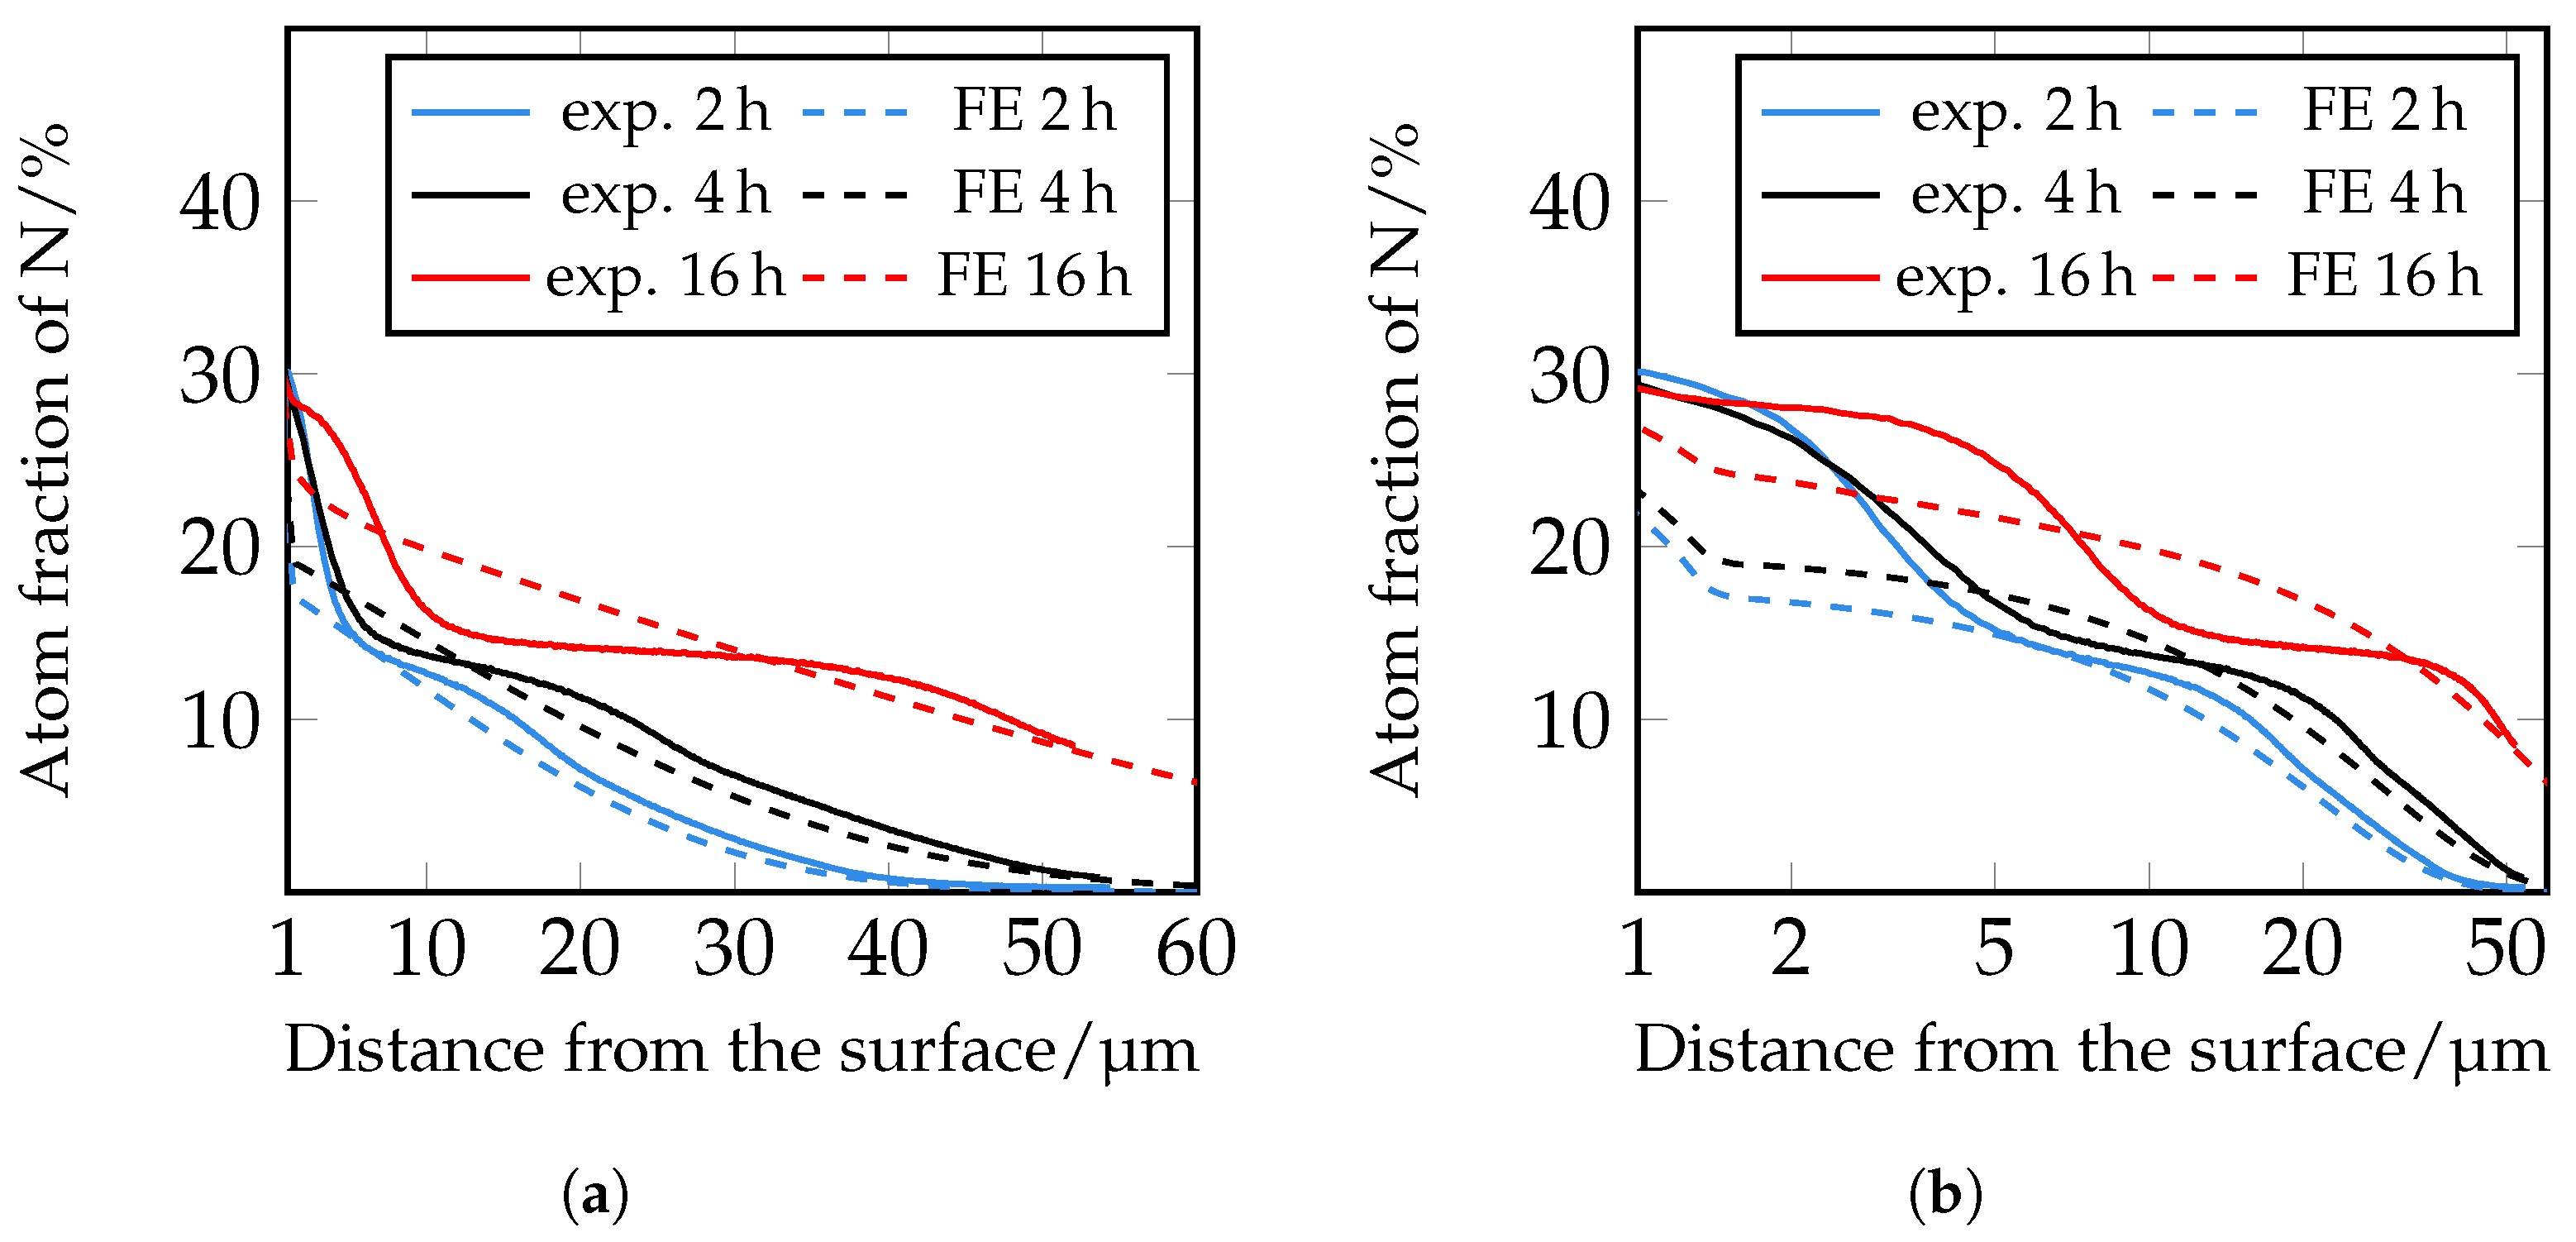
Therefore, in a following step, an iterative adjustment of the diffusion coefficients was carried out; see Figure 19. Here, too, there are still deviations in the area close to the surface, but from approximately 5 μm onwards, the closest agreement between the experimentally determined and numerically simulated concentration profiles of all diffusion coefficients used so far can be seen. However, it is clear that a further adjustment of the diffusion coefficients and also of the solubility limits seems to be necessary. Since the closest agreement is found for the iteratively adjusted diffusion coefficients, which are listed in Table 7, this model was further used to show the influence of the carbides. 
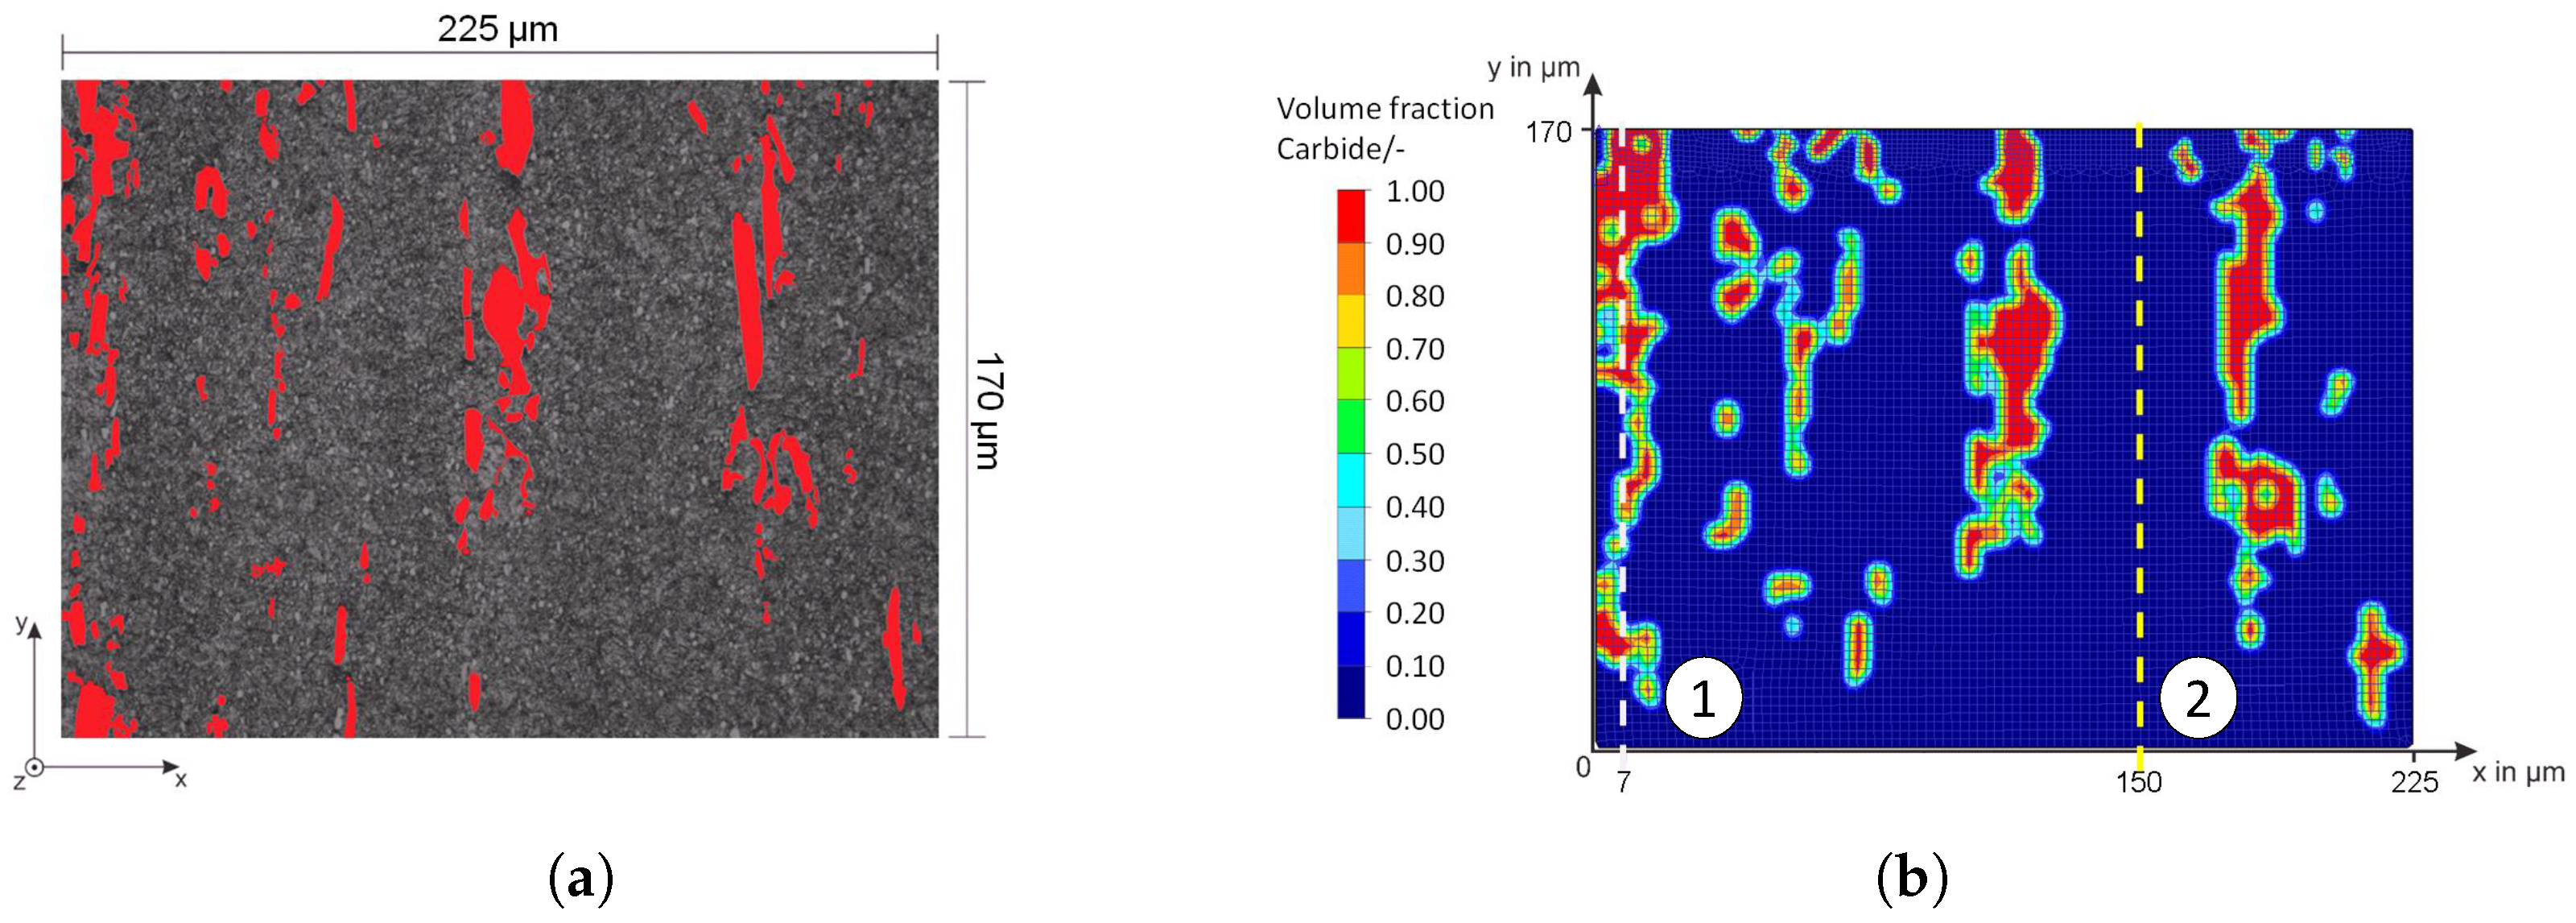
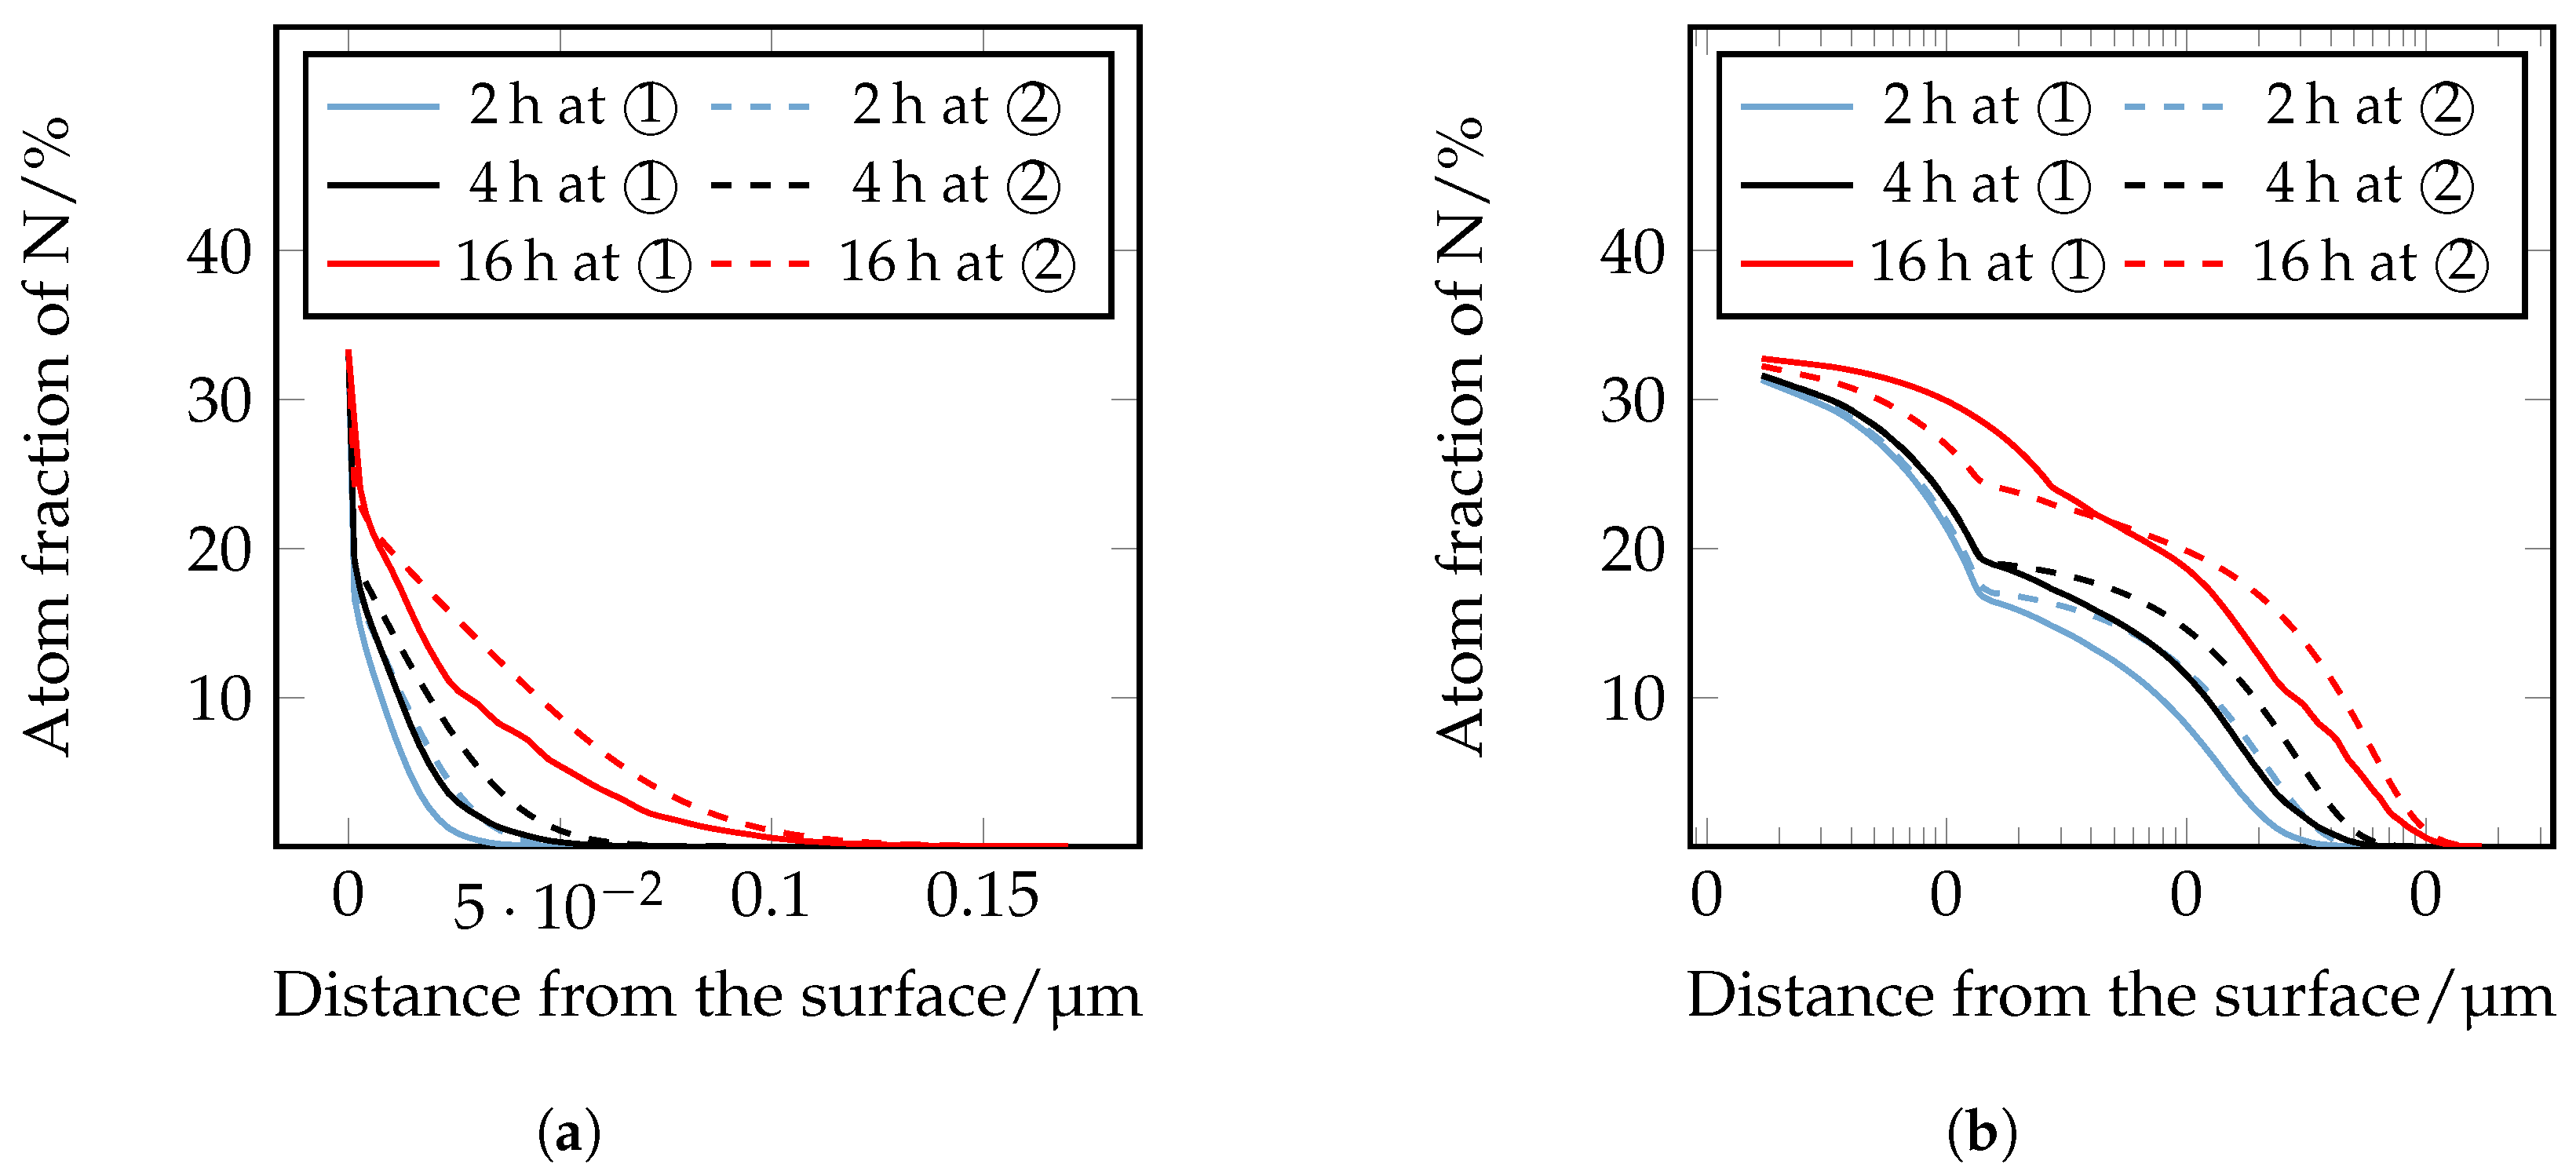
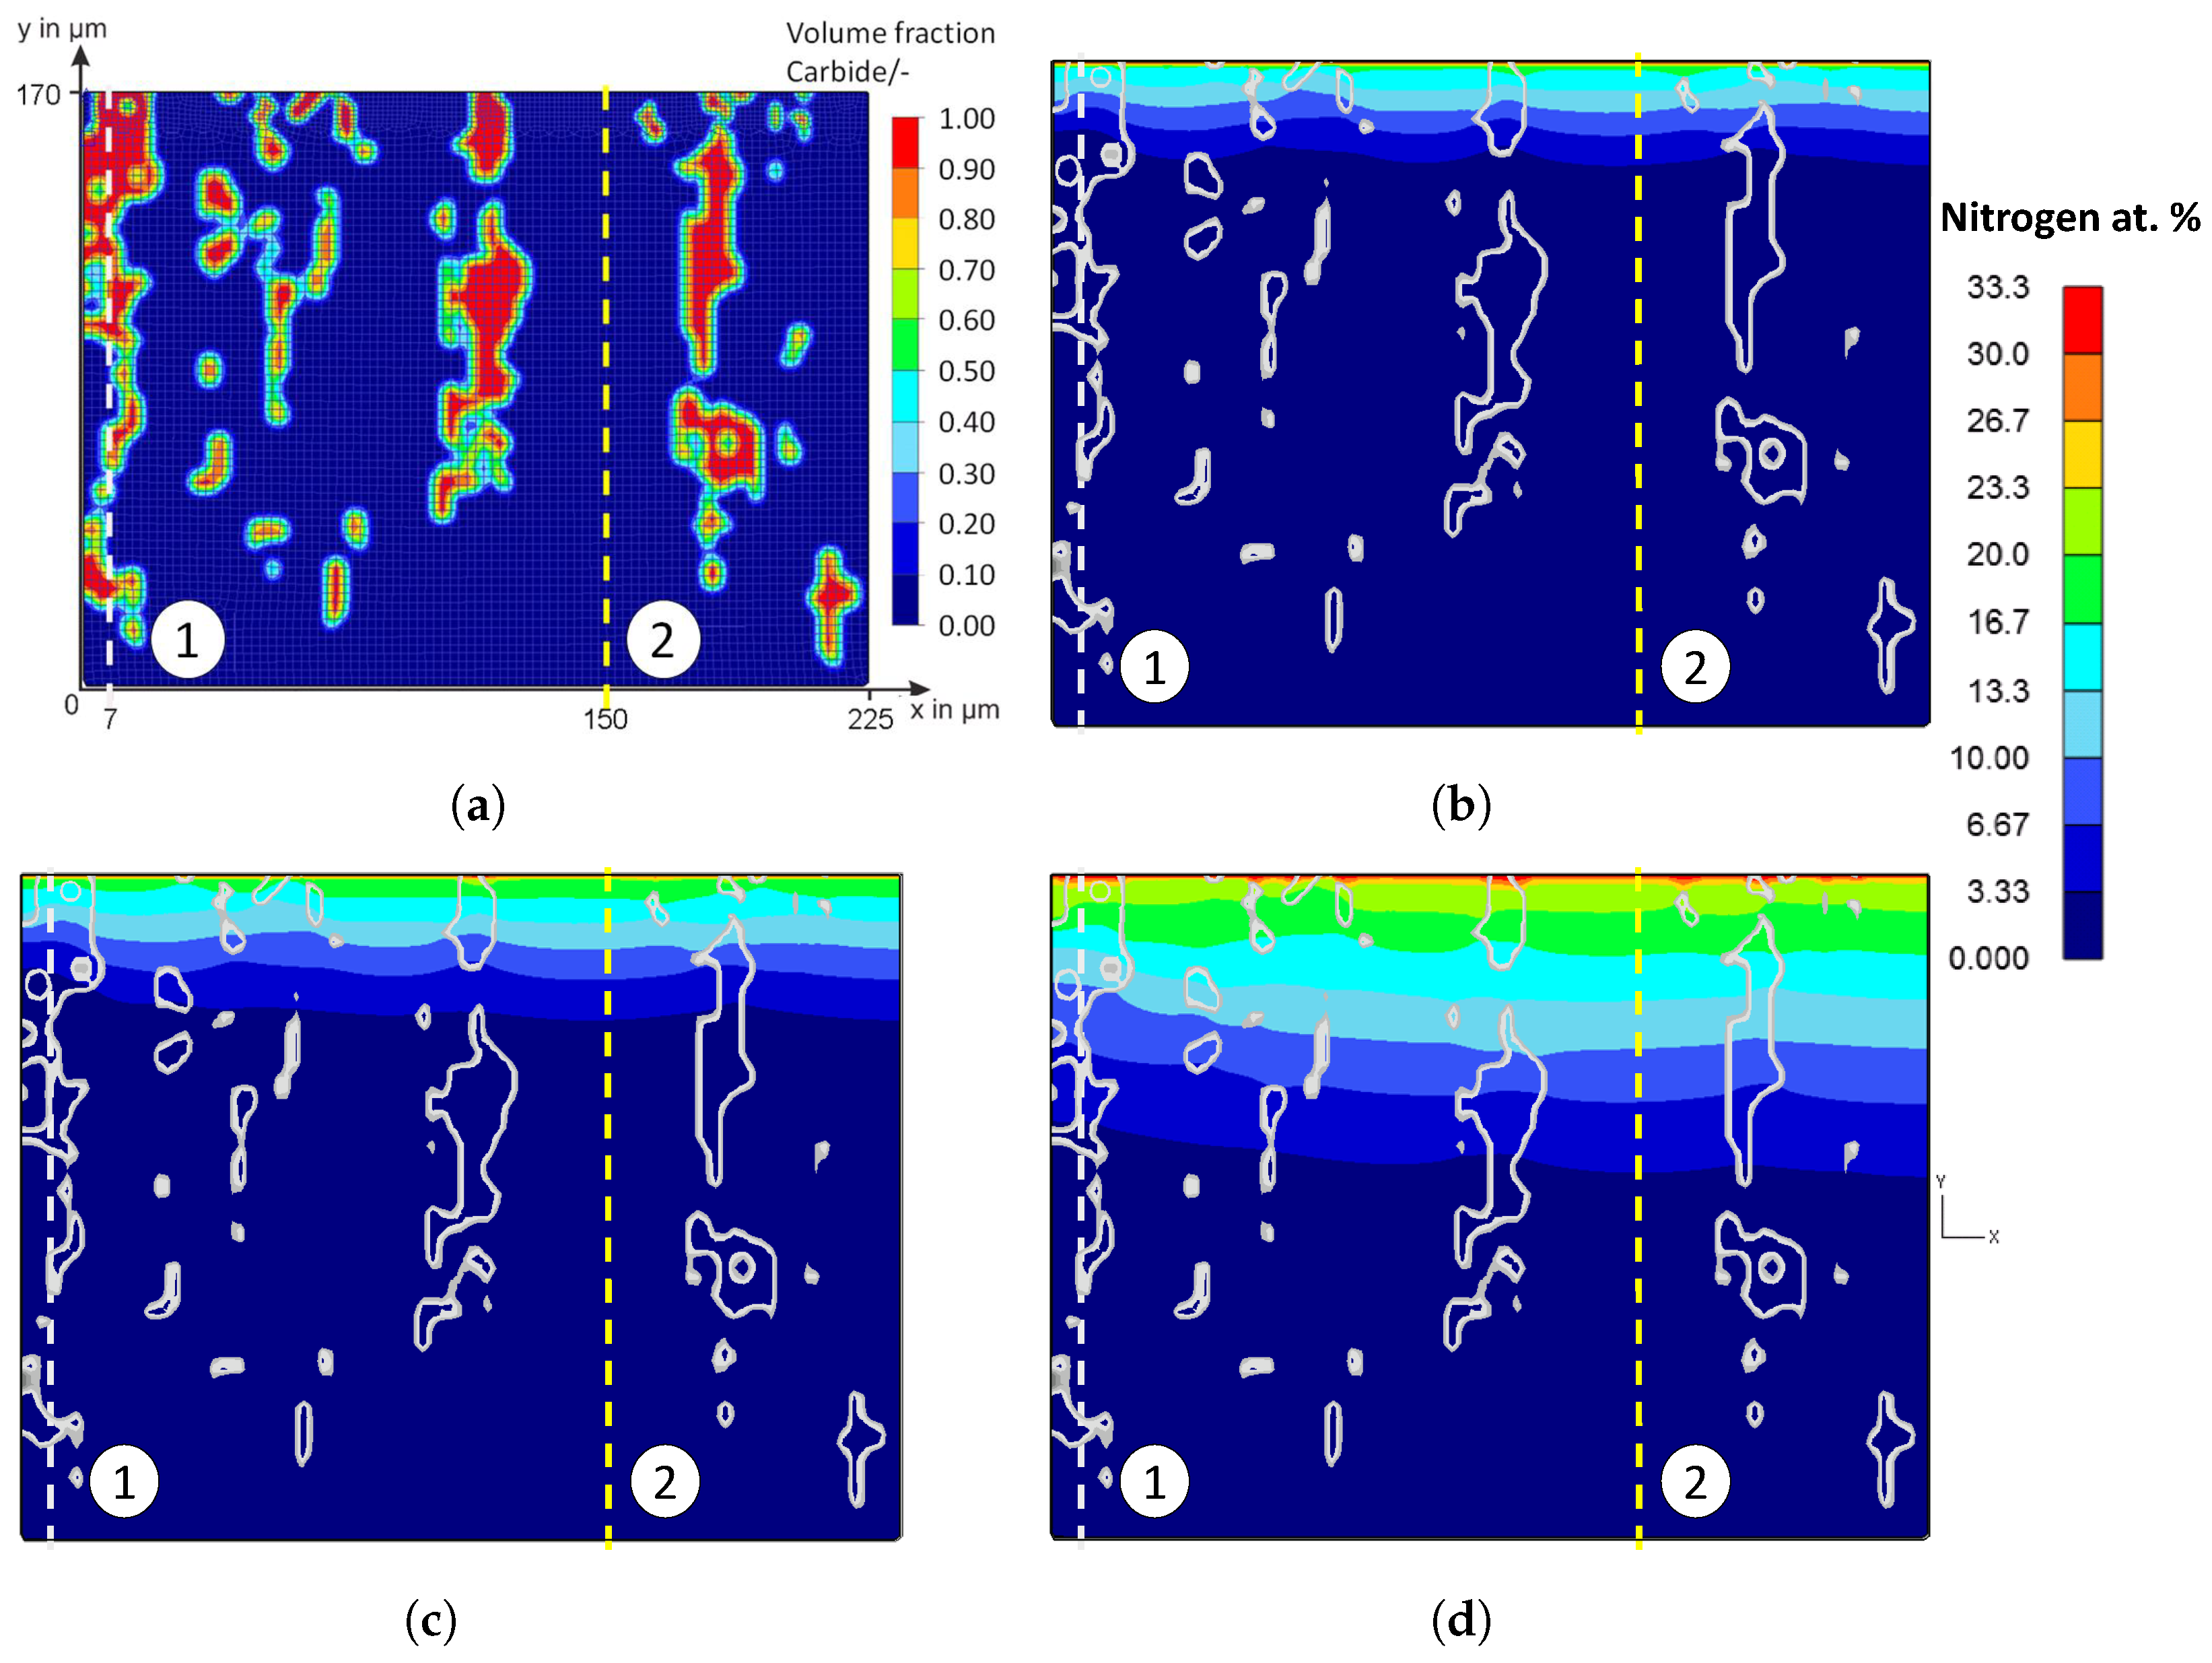
Figure 20 shows the false color images of the nitrogen concentration profile of the microstructure of the iteratively adjusted different diffusion coefficients and in consideration of D N C a r b i d e and D N N i t r i d e , which are listed in Table 7. In addition, a comparison of the calculated nitrogen concentration profiles in carbide-rich (7 μm) and carbide-poor (150 μm) areas after different plasma nitriding durations is shown in Figure 21.
Based on the FE simulations, the following trends can be derived:
In carbide-rich areas (here in the example at 7 μm), carbides (M7C3) and nitrides (MNs) influence the nitrogen diffusion. There, the nitrogen-poorer areas are clearly visible at the position of the carbides/nitrides. It can be seen that the lower diffusion coefficient noticeably inhibits nitrogen diffusion. In the area of the carbides/nitrides, nitrogen diffusion is inhibited both within the carbides/nitrides and in the peripheral areas of the carbides/nitrides. Therefore, the local diffusion coefficient in the carbides and nitrides can affect the nitrogen diffusion of a high-alloy tool steel, thus affecting the thickness of the diffusion layer and, theoretically, other local properties such as hardness. In the carbide-poor areas (here in the example at 150 μm), the nitrogen can penetrate deeper. Note, however, that grain boundary diffusion was not taken into account in the simulation. This illustrates the influence of the carbides and shows the possibilities of the new approach for considering the microstructure in the numerical calculation of diffusion processes using the FEM; compare Figure 2 and Figure 7 to Figure 8. By implementing further material data in the material models, it will be possible in future work to have a more realistic account of the different volume changes in the respective microstructural components/phases and the residual stresses that occur, for instance, by taking them into account. In the context of this work, the possibilities of the FE method were first presented, taking into account the carbides of the high-alloy tool steels. The further experimental validation will take place in future work.

4. Conclusions

The following conclusions can be drawn from the results presented:
1.
Plasma nitriding increases the hardness in the near-surface area. However, depending on the initial condition, the plasma nitriding can also result in tempering effects that influence the core hardness. Depending on the heat treatment and, in particular, the tempering treatments carried out prior to plasma nitriding, plasma nitriding at a temperature higher than the tempering temperature leads to a drop in core hardness with increasing plasma nitriding time.
2.
The CL depth and the DL depth increase with increasing plasma nitriding temperature and duration within the investigated parameter range. These well-known correlations from the literature could be confirmed by microscopic examinations and hardness measurements.
3.
The carbides (M7C3) present in the investigated high-alloy tool steel X153CrMoV12 convert into MNs during plasma nitriding. The depth of this transformation increases with the increasing temperature and duration of the plasma nitriding process.
4.
With increasing temperature and nitriding time, the proportion of nitride phases increases and the proportion of ferrite/martensite decreases accordingly with the increasing compound layer thickness.
5.
A new method for describing the diffusion behavior during plasma nitriding was presented, taking into account the conversion of carbides into MNs. Thereby, the microstructure is transferred to the FE mesh. In a first step, the influence of the carbides (M7C3) and nitrides (MNs) on the nitrogen distribution was shown by varying the respective diffusion coefficients. This enabled the consideration of a heterogeneous microstructure and the mapping of a heterogeneous diffusion process. This was demonstrated using the example of X153CrMOV12.
6.
The diffusion coefficients and solubility limits from the literature, especially for pure iron, can only be transferred to high-alloy tool steels to a limited extent.
7.
The presented method has the potential to determine the diffusion coefficients of the matrix, carbides, and nitrides by inverse parameter identification by comparing the simulation with real experimental results, such as the compound layer thickness, the diffusion layer thickness, or the depth of the conversion layers. In future work, these parameters will be varied, validated, and compared with further experimental results.
From the results, it can be concluded that, by further adapting the introduced FEM model and simulation approach, an accurate and microstructure-related calculation of nitriding results in high-alloy tool steel surfaces is possible. However, a further refinement of the model and adjustment of the material parameters, such as the diffusion coefficients, with respect to the true steel microstructure are necessary to receive the highest-possible accuracy. Further development in this direction is the content of current work.

Author Contributions

Conceptualization, P.L. and T.B.; methodology, P.L.; software, P.L. and T.B.; validation, P.L. and T.B.; investigation, P.L., T.B., L.-M.R. and C.K.; resources, G.B. and T.L.; writing—original draft preparation, P.L.; writing—review and editing, P.L., T.B., L.-M.R., C.K., T.G. and T.L.; visualization, P.L.; supervision, T.G., G.B. and T.L.; funding acquisition, C.K., P.L., G.B. and T.L. All authors have read and agreed to the published version of the manuscript.

Funding

This work was supported by the German Research Foundation (Deutsche Forschungsgemeinschaft–DFG) within the project “Adhesion-optimized DLC coatings through conditioning of the steel surfaces by plasma nitriding” (“Haftungsoptimierte DLC-Schichten durch Konditionierung der Stahloberflächen mittels Plasmanitrieren”) (Project Number 422219047). The publication of this article was funded by Chemnitz University of Technology and by the Deutsche Forschungsgemeinschaft (DFG, German Research Foundation)—491193532.

Institutional Review Board Statement

Not applicable.

Informed Consent Statement

Not applicable.

Data Availability Statement

Not applicable.

Acknowledgments

The authors gratefully acknowledge the support of the DFG.

Conflicts of Interest

The authors declare no conflict of interest.

Abbreviations

The following abbreviations are used in this manuscript:
CLCompound layer
DLDiffusion layer
DLCDiamond-like carbon
FEMFinite element method
SEMScanning electron microscopy
XRDX-ray diffraction analysis

References

  1. Spies, H.-J.; Winkler, H.P. Zum Korrosionsverhalten von Nitridschichten auf Eisenwerkstoffen. IFL-MITT 1985, 24, 101–103. [Google Scholar]
  2. Hoffmann, F.; Bujak, I.; Mayr, P.; Loffelbein, B.; Gienau, M.; Habig, K.-H. Verschleißwiderstand nitrierter und nitrocarburierter Stähle. HTM Härterei-Techn. Mitt. 1997, 52, 376–386. [Google Scholar] [CrossRef]
  3. Wach, P.; Michalski, J.; Burdyński, K.; Ciski, A. Anticorrosion nitrided layers on unalloyed and alloyed steels. IOP Conf. Ser. Mater. Sci. Eng. 2017, 179, 012069. [Google Scholar] [CrossRef] [Green Version]
  4. Nouveau, A.; Steyer, P.; Ram Mohan Rao, K.; Lagadrillere, D. Plasma nitriding of 90CrMoV8 tool steel for the enhancement of hardness and corrosion resistance. Surf. Coat. Technol. 2011, 205, 4514–4520. [Google Scholar] [CrossRef] [Green Version]
  5. Liedtke, D. Wärmebehandlung von Eisenwerkstoffen; Expert-Verlag: Renningen, Germany, 2014. [Google Scholar]
  6. Pessin, M.A.; Tier, M.D.; Strohaecker, T.R.; Bloyce, A.; Sun, Y.; Bell, T. The effects of plasma nitriding process parameters on the wear characteristics of AISI M2 tool steel. Tribol. Lett. 2000, 8, 223–228. [Google Scholar] [CrossRef]
  7. Paschke, H.; Weber, M.; Braeuer, G.; Yilkiran, T.; Behrens, B.A.; Brand, H. Optimized plasma nitriding processes for efficient wear reduction of forging dies. Arch. Civ. Mech. Eng. 2012, 12, 407–412. [Google Scholar] [CrossRef]
  8. Jeong, B.Y.; Kim, M.H. Effects of the process parameters on the layer formation behavior of plasma nitrided steels. Surf. Coat. Technol. 2001, 141, 182–186. [Google Scholar] [CrossRef]
  9. Blasek, G.; Bräuer, G. Vakuum Plasma Technologien; 1. Aufl.; Leuze: Bad Saulgau, Germany, 2010. [Google Scholar]
  10. Hoffmann, R.; Mittemeijer, E.J.; Somers, M.A.J. Verbindungsschichtbildung beim Nitrieren und Nitrocarburieren. HTM 1996, 51, 162–169. [Google Scholar] [CrossRef]
  11. Karamiş, M.B. Some effects of the plasma nitriding process on layer properties. Thin Solid Films 1992, 217, 38–47. [Google Scholar] [CrossRef]
  12. Cieslik, J.; Jacquet, P.; Tlili, B.; Mulin, H. Decrease of Compound Layer Thickness Obtained in Plasma Nitriding of Alloyed Steels by Diffusion Stage. J. Mater. Sci. Eng. A 2011, 1, 974–980. [Google Scholar]
  13. Gonzalez-Carmona, J.M.; Mondragon-Rodriguez, G.C.; Galvan-Chaire, J.E.; Gomez-Ovalle, A.E.; Caceres-Diaz, L.A.; Gonzalez-Hernandez, J.; Alvarado-Orozco, J.M. Plasma-Assisted Nitriding of M2 Tool Steel: An Experimental and Theoretical Approach. arXiv 2018, arXiv:1810.06593. [Google Scholar]
  14. Spies, H.-J. Einfluss des Gasnitrierens auf die Eigenschaften der Randschicht von Eisenwerk-stoffen. Freiberg. Forschungsh. B 1986, 249, 8–21. [Google Scholar]
  15. Mahboubi, F.; Abdolvahabi, K. The effect of temperature on plasma nitriding behavior of DIN 1.6959 low alloy steel. Vacuum 2006, 81, 239–243. [Google Scholar] [CrossRef]
  16. Pinedo, C.E.; Monteiro, W.A. Surface hardening by plasma nitriding on high chromium alloy steel. J. Mater. Sci. Lett. 2001, 20, 147–150. [Google Scholar] [CrossRef]
  17. Shen, H.; Wang, L. Influence of temperature and duration on the nitriding behavior of 40Cr low alloy steel in mixture of NH3 and N2. Surf. Coat. Technol. 2019, 378, 124953. [Google Scholar] [CrossRef]
  18. Ahangarani, S.; Mahboubi, F.; Sabour, A.R. Effects of various nitriding parameters on active screen plasma nitriding behavior of a low-alloy steel. Vacuum 2006, 80, 1032–1037. [Google Scholar] [CrossRef]
  19. Karimzadeh, S.; Mahboubi, F.; Daviran, G. Plasma Nitriding Behavior of DIN 1.2344 Hot Work Tool Steel. Iran. J. Mater. Sci. Eng. 2020, 17, 1–9. [Google Scholar] [CrossRef]
  20. Zdravecká, E.; Slota, J.; Solfronk, P.; Kolnerová, M. Evaluation of the Effect of Different Plasma-Nitriding Parameters on the Properties of Low-Alloy Steel. J. Mater. Eng. Perform. 2017, 26, 3588–3596. [Google Scholar] [CrossRef]
  21. Fontes, M.A.; Pereira, R.G.; Fernandes, F.A.P.; Casteletti, L.C.; De Paula Nascente, P.A. Characterization of plasma nitrided layers produced on sintered iron. J. Mater. Res. Technol. 2014, 3, 210–216. [Google Scholar] [CrossRef] [Green Version]
  22. Wang, L.; Ji, S.; Sun, J. Effect of nitriding time on the nitrided layer of AISI 304 austenitic stainless steel. Surf. Coat. Technol. 2006, 200, 5067–5070. [Google Scholar] [CrossRef]
  23. Pribbenow, J.; Mejauschek, M.; Landgraf, P.; Grund, T.; Bräuer, G.; Lampke, T. Neural network for prediction of hardness profiles for steel alloys after plasma nitriding. IOP Conf. Ser. Mater. Sci. Eng. 2019, 480, 012019. [Google Scholar] [CrossRef]
  24. Paschke, H.; Nienhaus, A.; Brunotte, K.; Petersen, T.; Siegmund, M.; Lippold, L.; Weber, M.; Mejauschek, M.; Landgraf, P.; Bräuer, G.; et al. Adapted diffusion processes for effective forging dies. AIP Conf. Proc. 2018, 1960, 040016. [Google Scholar] [CrossRef]
  25. Prediction Nitriding Tool, Professur Werkstoff-und Oberflächentechnik—TU Chemnitz. Available online: https://malachit.wsk.tu-chemnitz.de/webapps/home/session.html?app=NitridingTool (accessed on 11 March 2021).
  26. Borisyuk, Y.V.; Oreshnikova, N.M.; Pisarev, A.A. Low-Temperature Plasma Nitriding of Low- and High-Chromium Steels. Bull. Russ. Acad. Sci. Phys. 2020, 84, 736–741. [Google Scholar] [CrossRef]
  27. Liedtke, D. Wärmebehandlung von Eisenwerkstoffen II, 7th ed.; Expert-Verlag: Tübingen, Germany, 2018. [Google Scholar]
  28. Garzón, C.M.; Franco, A.R.; Tschiptschin, A.P. Thermodynamic analysis of M7C3 carbide dissolution during plasma nitriding of an AISI D2 tool steel. ISIJ Int. 2017, 57, 737–745. [Google Scholar] [CrossRef] [Green Version]
  29. Dörrenberg Edelstahl 1.2379 X153CrMoV12. Available online: http://www.dorrenberg.es/download/aceros/DOE/1.2379_deu.pdf (accessed on 12 March 2021).
  30. DIN 50190 Teil 3; Härtetiefe wärmebehandelter Teile, Ermittlung der Nitrierhärtetiefe, Hardness Depth of Heat-Treated Parts, Determination of the Effective Depth of Hardening after Nitriding. Beuth: Berlin, Germany, 1979. [CrossRef]
  31. Scientific Forming Technologies Corporation. DEFORM-2D-3D Manual; Scientific Forming Technologies Corporation: Columbus, OH, USA, 2020. [Google Scholar]
  32. Triwiyanto, A.; Zainuddin, A.; Abidin, K.A.Z.; Billah, M.A.; Hussain, P. Mathematical modeling of nitride layer growth of low temperature gas and plasma nitriding of AISI 316L. In Proceedings of the ICPER 2014—4th International Conference on Production, Energy and Reliability, Kuala Lumpur, Malaysia, 3–5 June 2014; Volume 13. [Google Scholar] [CrossRef] [Green Version]
  33. Hosseini, S.R.; Ashrafizadeh, F.; Kermanpur, A. Calculation and experimantation of the compound layer thickness in gas and plasma nitriding of iron. Iran J. Sci. Technol. B 2010, 34, 553–566. [Google Scholar]
  34. Keddam, M. Surface modification of the pure iron by the pulse plasma nitriding: Application of a kinetic model. Mater. Sci. Eng. A 2007, 462, 169–173. [Google Scholar] [CrossRef]
  35. Januszewicz, B.; Wołowiec, E.; Kula, P. The role of carbides in formation of surface layer on steel X153CrMoV12 due to low-pressure nitriding (vacuum nitriding). Met. Sci. Heat Treat. 2015, 57, 32–35. [Google Scholar] [CrossRef]
  36. Villars, P.; Hiroaki, O. Fe-N Binary Phase Diagram 0–40 at.% N: Datasheet from PAULING FILE Multinaries Edition; Springer: Berlin/Heidelberg, Germany; Material Phases Data System (MPDS): Vitznau, Switzerland; National Institute for Materials Science (NIMS): Tsukuba, Japan, 2012. Available online: https://materials.springer.com/isp/phase-diagram/docs/c_0901055 (accessed on 22 February 2022).
  37. Leroy, C.; Michel, H.; Gantois, M. Transformation of (Cr,M)7C3-type carbides during nitriding of chromium alloyed steels. J. Mater. Sci. 1986, 2, 346–3474. [Google Scholar] [CrossRef]
  38. Kim, K.-H.; Lee, W.-B.; Kim, T.-H.; Son, S.-W. Microstructure and Fracture Toughness of Nitrided D2 Steels Using Potential-Controlled Nitriding. Metals 2022, 12, 139. [Google Scholar] [CrossRef]
  39. Somers, M.A.J.; Mittemeijer, E.J. Layer-growth kinetics on gaseous nitriding of pure iron: Evaluation of diffusion coefficients for nitrogen in iron nitrides. Metall. Mater. Trans. A 1995, 26, 57–74. [Google Scholar] [CrossRef]
Figure 1. Schematic model of in situ precipitation of MN nitrides on M7C3 carbides during plasma nitriding of the X153CrMoV12 tool steel, adapted from [28].
Metals 12 00866 g001
Figure 2. The heterogeneous pattern of the diffusion layer and the compound layer of the tool steel X153CrMoV12 illustrates the influence of the microstructure on the diffusion processes. In the carbide-rich area (top-left image), the diffusion zone appears to extend less in depth compared to the carbide-poor area (top-right image). The compound layer is also influenced by the carbides (bottom image).
Metals 12 00866 g002
Figure 3. Schematic illustration of the conducted heat treatment. The austenitizing was performed at 1050 °C for 30 min with small holding steps at 650 °C and 850 °C. After quenching with N2 to room temperature, three tempering stages followed to obtain the aspired microstructure.
Metals 12 00866 g003
Figure 4. (a) Pattern of the hardness indents and (b) optical image of the hardness impressions. The distance in the X-direction was 110 μm and in the case of the samples plasma nitrided at 560 °C 150 μm. The value 110 μm corresponds to 3 times the diameter of a hardness of approximately 690 HV 0.5 , and 150 μm corresponds to 3 times the diameter of a hardness of approximately 371 HV 0.5 . The value of 550 HV 0.5 was assumed to be the minimum hardness that could occur. The first indent was set at a distance of approximately 25 μm. From the 1st to the 21st indent (125 μm), the distance in the Y-direction was 5 μm. From the 22nd hardness indent on, the distance in the Y-direction was set to 10 μm.
Metals 12 00866 g004
Figure 5. 2D model based on micrographs of the high-alloy tool steel X153CrMoV12. (a) Micrograph of X153CrMoV12 with characteristic chromium carbides (red) in the ferrite (α)/martensite ( α ) matrix (grey). The binary color scheme allows the differentiation between the specific phases and the coupling to the 2D model in DEFORM™. (b) The coupled mesh with volume fractions of the chromium carbides in the matrix. Carbide-rich areas are at place ➀ (7 μm), and carbide-poor areas are at place ➁ (150 μm).
Metals 12 00866 g005
Figure 6. Assignment of the different phases.
Metals 12 00866 g006
Figure 7. Optical microscopy images of X153CrMoV12 after plasma nitriding at different temperatures and times. The bright layer near the surface indicates the CL, and the darker area marks the DL. The increase in layer thickness is clearly visible with increasing temperature and time.
Metals 12 00866 g007
Figure 8. Scanning electron microscopy (SEM) images of X153CrMoV12 after plasma nitriding at 560 °C and a duration of 2 h with different magnifications. In (a) partially transformed carbides/nitrides are visible in the martensitic matrix. (b) shows a detailed view of the carbide/nitride at a higher magnification. These images illustrate the heterogeneous behavior of nitrogen diffusion in a high-alloy tool steel due to the heterogeneous microstructure.
Metals 12 00866 g008
Figure 9. Thickness of compound and diffusion layers depending on the temperature and duration of plasma nitriding measured in the optical microscopy images. (a) Thickness of the compound layer (CL). (b) Thickness of the diffusion layer (DL).
Metals 12 00866 g009
Figure 10. Thickness of the respective compound and diffusion layers depending on the temperature versus the square root of the plasma nitriding time. The linear regressions without onset are added to clarify the relationship of the layer thickness as a function of the root-time law. (a) Thickness of the compound layer (CL). (b) Thickness of the diffusion layer (DL).
Metals 12 00866 g010
Figure 11. Thickness of the conversion depth of the carbides/nitrides depending on the temperature and duration of plasma nitriding measured light-optically. (a) Conversion depth of the carbides/nitrides measured light-optically. Blue arrows mark exemplarily the measuring points. (b) Thickness of the conversion depth of the carbides/nitrides.
Metals 12 00866 g011
Figure 12. (a) Schematic representation of the theoretical nitrogen distribution of the layers that can form on the surface of nitrided iron based on the phase equilibrium diagram Fe-N, data from [33]. Concentration profiles of nitrogen plasma nitrided with different durations (b) at 520 °C, (c) at 480 °C and (d) at 560 °C.
Metals 12 00866 g012
Figure 13. (ac) are the nitriding hardness depth curves in HV 0.5 depending on the temperature and duration of plasma nitriding. The scatter band shows the minimum and maximum hardness values interpolated to the respective equal distances. Note the drop near the surface may be due to edge effects. (d) shows the nitriding hardness depth (NHD) depending on the temperature and duration of plasma nitriding. (a) Hardness measurement of samples plasma nitrided at 480 °C with different durations. (b) Hardness measurement of samples plasma nitrided at 520 °C with different durations. (c) Hardness measurement of samples plasma nitrided at 560 °C with different durations. (d) Nitriding hardness depth (NHD) depending on the temperature and duration of plasma nitriding. The linear regressions without onset are added to clarify the relationship of the layer thickness as a function of the root-time law.
Metals 12 00866 g013
Figure 14. (a,b) shows the nitriding hardness depth (NHD) depending on the temperature and duration of plasma nitriding. The temperature increase seems to lead to a linear increase in the nitriding hardness depth. Increasing the nitriding time, on the other hand, seems to lead to a parabolic increase in the nitriding hardness depth. It should be noted, however, that the durations were not increased linearly, but quadratically. (a) Nitriding hardness depth (NHD) depending on the duration and temperature of plasma nitriding. (b) Nitriding hardness depth (NHD) depending on the temperature and duration of plasma nitriding.
Metals 12 00866 g014
Figure 15. (a) shows an example of the diffractograms from 10°–130° for the different plasma nitriding temperatures at 16 h plasma nitriding time. For a better overview, Figures (bd) each show a section of the diffractogram from 40°–60° of samples plasma nitrided at different temperatures with different durations. (a) Section of diffractogram from 10° to 130° of samples plasma nitrided at different temperatures and with a duration of 16 h. (b) Section of diffractogram from 40° to 60° of samples plasma nitrided at 480 °C. (c) Section of diffractogram from 40° to 60° of samples plasma nitrided at 520 °C. (d) Section of diffractogram from 40 ° to 60 ° of samples plasma nitrided at 560 °C.
Metals 12 00866 g015
Figure 16. (ad) show the mass fractions of the different phases of the high-alloy tool steel X153CrMoV12 plasma nitrided at different temperatures and durations determined by XRD. (a) Mass fractions of the different phases of the high-alloy tool steel X153CrMoV12 plasma nitrided at 480 °C determined by XRD. (b) Mass fractions of the different phases of the high-alloy tool steel X153CrMoV12 plasma nitrided at 520 °C determined by XRD. (c) Mass fractions of the different phases of the high-alloy tool steel X153CrMoV12 plasma nitrided at 560 °C determined by XRD. (d) Approximated 3D plot of the sum of the mass fractions of the phases CrN, Fe3N, Fe4N of the high-alloy tool steel X153CrMoV12 plasma nitrided at different temperatures and durations determined by XRD.
Metals 12 00866 g016
Figure 17. Comparison of experimentally determined and numerically simulated concentration profiles of nitrogen plasma nitrided at 520 °C with different durations. Diffusion coefficients in mm 2 / s data from [33]: D N α = 4.887 × 10 6 , D N γ = 1.036 × 10 7 , D N ϵ = 1.456 × 10 8 . (a) Linear scale. (b) Logarithmic scale.
Metals 12 00866 g017
Figure 18. Comparison of experimentally determined and numerically simulated concentration profiles of nitrogen plasma nitrided at 520 °C with different durations. Diffusion coefficients in mm 2 / s based on data from [34]: D N α = 5.248 × 10 7 , D N γ = 1.05 × 10 7 , D N ϵ = 4.317 × 10 9 . (a) Linear scale. (b) Logarithmic scale.
Metals 12 00866 g018
Figure 19. Comparison of experimentally determined and numerically simulated concentration profiles of nitrogen plasma nitrided at 520 °C with different durations. Diffusion coefficients in mm 2 / s iteratively adjusted: D N α = 2 × 10 8 , D N γ = 4 × 10 8 , D N ϵ = 2 × 10 9 . (a) Linear scale. (b) Logarithmic scale.
Metals 12 00866 g019
Figure 20. Simulation results of nitrogen diffusion in X153CrMoV12 tool steel during plasma nitriding. By taking the microstructure into account, here using the example of carbides, the heterogeneous nitrogen concentration profile is recognizable. (a) Carbide-rich areas at place ➀ (7 μm) and carbide-poor areas at place ➁ (150 μm). (b) Nitriding profile after 2 h. (c) Nitriding profile after 4 h. (d) Nitriding profile after 16 h.
Metals 12 00866 g020
Figure 21. Comparison of the simulated nitrogen concentration profile in carbide-rich areas at place ➀ (7 μm) and carbide-poor areas at place ➁ (150 μm). (a) Linear scale. (b) Logarithmic scale.
Metals 12 00866 g021
Table 1. Chemical composition of the high-alloy tool steel X153CrMoV12 determined by OES.
ElementCSiMnCrMoVFe
Mass fractions/%1.580.550.3611.740.990.74balance
Table 2. Plasma nitriding parameters.
Temperature/°CTime/hVoltage/VPulse-Pause Ratio/ μsPressure/PaGas Mixture N2/H2/%
480, 520, 5602, 4, 16500100/50030080/20
Table 3. Solubility limits at approximately 520 °C, data from [33,35,36]. These were converted from wt.% to at.%.
PhaseSolubility Limits Nitrogen in at.%
StartEnd
α-Fe → γ [33] N α / γ = 0.25 N γ / α = 19.6
γ ε [33] N γ / ϵ = 20 N ϵ / γ = 25
M7C3 →MN [35] N M 7 C 3 / M N = 0.35 N M N / M 7 C 3 = 22.7
Table 4. Overview of the specific phases for the FE model and the corresponding diffusion coefficients of N in iron nitrides and the α-Fe phase with R = 8.32 J /(mol · K), data from [33,34] for 520 °C.
Source D N α / mm 2 / s D N γ / mm 2 / s D N ϵ / mm 2 / s
[33]4.887 × 10 6 1.036 × 10 7 1.456 × 10 8
[34] 5.248 × 10 7 1.050 × 10 7 4.317 × 10 9
Table 5. Layer thicknesses of the compound and diffusion layers.
Duration in Hours2416
Nitriding Process Temperature in °CLayer TypeThickness in μm
480CL1.92.94.3
DL314764
520CL2.436.9
DL4762129
560CL3.66.18.9
DL5279163
Table 6. Determined average core hardness in HV 0.5 depending on the temperature and duration of plasma nitriding. The mean value, the minimum, and the maximum are given. The core hardness varies due to tempering effects during plasma nitriding.
Temperature in °C480520560
Duration in HourHardness in HV0.5
2 752 32 + 38 748 36 + 51 701 56 + 47
4 760 36 + 26 756 29 + 39 677 26 + 27
16 743 53 + 34 704 36 + 35 582 39 + 53
Table 7. Iteratively adjusted diffusion coefficients in mm 2 / s of N in iron nitrides and the α-Fe phase for 520 °C.
D N α D N γ D N ϵ D N Carbide D N Nitride
2 × 10 8 4 × 10 8 2 × 10 9 1.0 × 10 8 5.0 × 10 10
Publisher’s Note: MDPI stays neutral with regard to jurisdictional claims in published maps and institutional affiliations.

