Article

Evaluation of Fracture Strain for Cold Drawn Thin-Walled Steel Tubes via Small Round-Bar Tensile Test

1
Advanced Mechanical and Electronic System Research Center, Faculty of Engineering, Tottori University, 4-101 Koyama-Cho-Minami, Tottori 680-8552, Japan
2
Material and Mechanical Research Laboratory, Tottori Institute of Industrial Technology, 1247 Kusaka, Yonago 689-3552, Japan
3
Division of Materials and Manufacturing Science, Osaka University, 1-1 Yamadaoka, Suita 565-0871, Japan
*
Author to whom correspondence should be addressed.
Metals 2022, 12(5), 776; https://doi.org/10.3390/met12050776
Submission received: 7 April 2022 / Revised: 19 April 2022 / Accepted: 28 April 2022 / Published: 30 April 2022
(This article belongs to the Special Issue Innovative Mechanical Processing Technology of Metals)

Abstract

:
The evaluation of tube burring formability is a crucial task for finding a suitable material for tube-based automobile parts. The local strain at the ductile fracture site (fracture strain) should be evaluated for this purpose. Moreover, a cold-drawn steel tube has a strong anisotropic shaped microstructure and possibly causes anisotropic fracture strain behavior. Based on this background, the study evaluated the axial and hoop directional fracture strains of cold-drawn steel tubes using the small round-bar tensile specimen. The burnished surface ratio on the pierced surface was also investigated for possibility estimation of in-line formability inspection. As a result, three tubes are presented with inferior, nearly the same, and superior hoop directional fracture strains compared with the axial strains, where exceeding 40% deterioration in the hoop direction occurs by a combination of grain elongation and carbide aggregation. The scanning electron micrographs suggest that the microvoid growth and linkage percolated thorough carbides on the elongated grain boundaries. For the piercing test, the 30% fracture strain deterioration resulted in a 4% decrease in the burnished surface ratio on the pierced surface. This result suggested that the estimation of the pierced surface can detect material defects before the actual tube-burring process.

1. Introduction

Branched thin-walled steel tubes are mandatory parts for vehicle suspension systems. As Teramae et al. [1] exemplified, the burring of a pierced hole is effective, given the low cost and cycle time for the branch forming. Such tube burring processes are now widely prevalent among manufacturers of tube-based automobile parts.
The main task during the tube burring process is the suppression of fractures on the pierced hole edge. Pierced hole edges present ample deterioration of ductility by work-hardening with the piercing process comparing with the machined hole ductility. This problem is remarkable in sheet burring for high strength steels, and several solutions to this challenge have been proposed. As reviewed by Takahasi [2], steel industries have developed high strength steel sheets with high burring formability. The forming processes for high burring formability have also been developed, e.g., piercing with humped bottom punch [3], piercing with low-angled roof head punch [4], coining on pierced surface [5], among others. In recent years, forming of steel tubes have also been placed in a similar situation, because the recent steel tubes have been highly strengthened [6]. Actually, the problem of pierced hole edge fracture has also become severe for the tube burring process in manufactures, whereas we were unable to find publications related to steel tube burring like steel sheet cases.
The study focuses on the evaluation of material properties for steel tube burring. The target material is a cold-drawn narrow (40.6 mm outside diameter) and a thin-walled (1.8 mm thickness) steel tube. Manufacturers now demand information on the burring formability before mass production begins, but currently, only strength and elongation are available for the industrial use of steel tubes. For the sheet burring process, the total elongation of steel sheets does not represent burring formability [7]; thus, the hole expansion ratio was standardized in ISO 16630:2017 to evaluate the ductility of the pierced hole edge. However, a hole-expanding test for a steel tube is difficult, owing to its small curvature around the pierced hole. The hole-expanding test conducted before the steel sheet is wound to form a tube might conquer this difficulty. Influence of the tube forming process from sheet metals to the mechanical properties are key factors for accurate evaluation in such preliminary evaluation of formability. Actual steel tubes undergo the following processes to cause a change in the mechanical properties from the state of steel sheets: Firstly, steel sheets are wound and welded to roughly form the steel tube shape [8]. The effect of this process is most likely small because of the consistency of work-hardening behavior between sheet and tube type of specimen [9,10]. After that, these roughly shaped steel tubes are cold-drawn for shape correction, which causes a remarkable anisotropy of yield surface [11] and high residual stress [12]. Then, as the further process, many tubes are annealed after being cold-drawn in order to diminish these negative effects of tube forming. As a consequence of the complicated process of forming the tubes from sheet metals, the mechanical properties of the steel tubes are unpredictable from those of steel sheets. Therefore, for tube burring formability evaluations, we must develop a method to substitute the hole-expanding test.
Actual pierced holes almost always fracture without necking. Indeed, uniform elongation present negative correlation to the hole expansion ratio [13]. Up to now, literature has reported that the ductile fracture criterion evaluated from uniaxial tension and other mechanical tests can predict the formability of sheet metal burring [14,15,16]. For tube metals, the ductile fracture criteria were evaluated by a tension-compression-bulging test for tube metals. For instance, Kim et al. [17] evaluated Oyane’s ductile fracture criteria [18] of steel tubes by conducting the tube bulging test. Similar to other studies using bulging tests, Aue-u-Lan et al. [19] evaluated the maximum thinning, that is, the fracture strain, before material failure; Magrinho et al. [20] evaluated fracture strain with a variety of stress triaxiality, assuming the plane stress condition; Hashemi et al. [21] derived Marciniak and Kuczynski’s fracture criteria [22] from the parameters for anisotropic yield criterion and work-hardening law; Chen et al. [23] combined tension-tension and tension-compression tests with the bulging test to evaluate a wide region of strain-based FLD.
Whereas bulging tests give a variety of ductile fracture criteria, as mentioned above, it does not apply to our specific task on steel tubes because the welded parts of the candidate steel tubes were frequently fractured in the bulging test. The remaining candidate mechanical tests are the tube bending and tensile test, which are common methods in the evaluation of thick-walled steel pipes. The former method, pipe bending, is mainly used for the evaluation of surface cracking criterion [24,25]. However, taking into account the large fracture-strain on the thin wall, the steel tubes must collapse before their ductile fracture occurs. Therefore, the tensile test is more promising. In the case of thick-walled steel pipes, round bars are cut from the steel pipes in the axial and hoop directions; e.g., Oh et al. [26] identified ductile fracture parameters of the Gurson–Tverggard–Needleman model [27] by this method. Additional Charpy tests provided more accurate fracture criteria than in the cases that only make use of the tensile specimens [28,29].
The difficulty for the application of round-bar tensile tests to thin-walled steel tubes is how to design and cut the specimens. In this study, we present an approach to use a small round-bar specimen to conquer these difficulties. This method has already been developed for thin steel sheets [30,31] and has been applied, for this study, to thin-walled steel tubes. The advantage of our study is the evaluation of fracture-strain in the hoop direction, and the reduction of specimen size and ingenious cutting method has enabled this tensile test. As mentioned above, cold-drawing causes anisotropy of mechanical properties. Therefore, both fracture-strains in the axial and hoop directions must be evaluated because cracking in the burring process occurs at the weakest point of the pierced surface.
The study presents the fracture-strain evaluations for three-types of steel tubes, and their various tendencies of fracture-strain anisotropy were clarified. The three steel tube types demonstrated hoop-directional fracture-strains that are inferior, almost the same, and superior to the fracture-strains in the axial direction. This is the first time such fracture behaviors in cold-drawn thin-walled steel tubes have been clarified. The tendency of such fracture strain behavior was discussed with a microstructural view.
Furthermore, the relation between fracture-strains and pierced surface shapes were investigated. The materials were cut with ductile fracture occurring during the piercing process. The pierced shape must differ from the values of fracture strain and leads to easy formability estimation during manufacturing. Cutting small round-bars incurs high costs and requires a lot of time, and the observation of pierced surfaces is easy and cost-effective. The possibility of such quality checks was considered by referring to the fracture-strain evaluations of the three steel tube types.

2. Materials and Methods

2.1. Materials

Commercial electric-resistance-welded and cold-drawn steel tubes with 1.8 mm wall thickness and 40.6 mm external diameter were used for this study. The tubes were annealed to remove residual stress, where the appearance of the steel tube is shown in Figure 1. Three types of steel tubes—tubes A, B, and C—were evaluated. Table 1 presents the mechanical properties measured by the tube tensile test, using the Japanese Industrial Standards (JIS) 11 type specimen standardized by JIS Z 2241 (2011). From Table 1, tube A provides the lowest tensile strength of the three tubes, but the elongation is superior to that of tube B. Tube B gives a higher tensile strength than that of tube A, but the elongation is inferior to that of tube A. Tube C gives superior tensile strength and elongation. Indeed, tube C presents almost the same tensile strength as that of tube B and almost the same elongation as that of tube A.
As listed in Table 1, steel grades for tubes A and B are SAE1017 and E275 (EN chemical designation), respectively. The steel for tube C is the hyper burring type for automobile, which is not standardized. Chemical components and microstructure types of the three steel tubes are also listed in Table 2. The microstructure type of tubes A and B are ferrite-carbide, and that of tube C is bainitic ferrite. The electron backscatter diffraction clarified these microstructure types (figures are not shown). Tube A includes the highest carbon content of the three tubes, that is, it contains the highest volume fraction of carbides.
Nital-etched microstructures of the three tubes are shown in Figure 2. The microstructures of the three steel tubes are elongated along the axial direction. In addition, the microstructures observed on the axis-thickness surfaces (Figure 2(a1,b1,c1)) present elongated grains along the axial direction, but those observed on the hoop-thickness surfaces (Figure 2(a2,b2,c2)) present isotropic shaped grains. The grains in tube B are the coarsest of the three, and those in tubes A and B are almost of the same size. The carbides exist on the grain boundaries in tubes A and B.

2.2. Specimen for Tensile Test

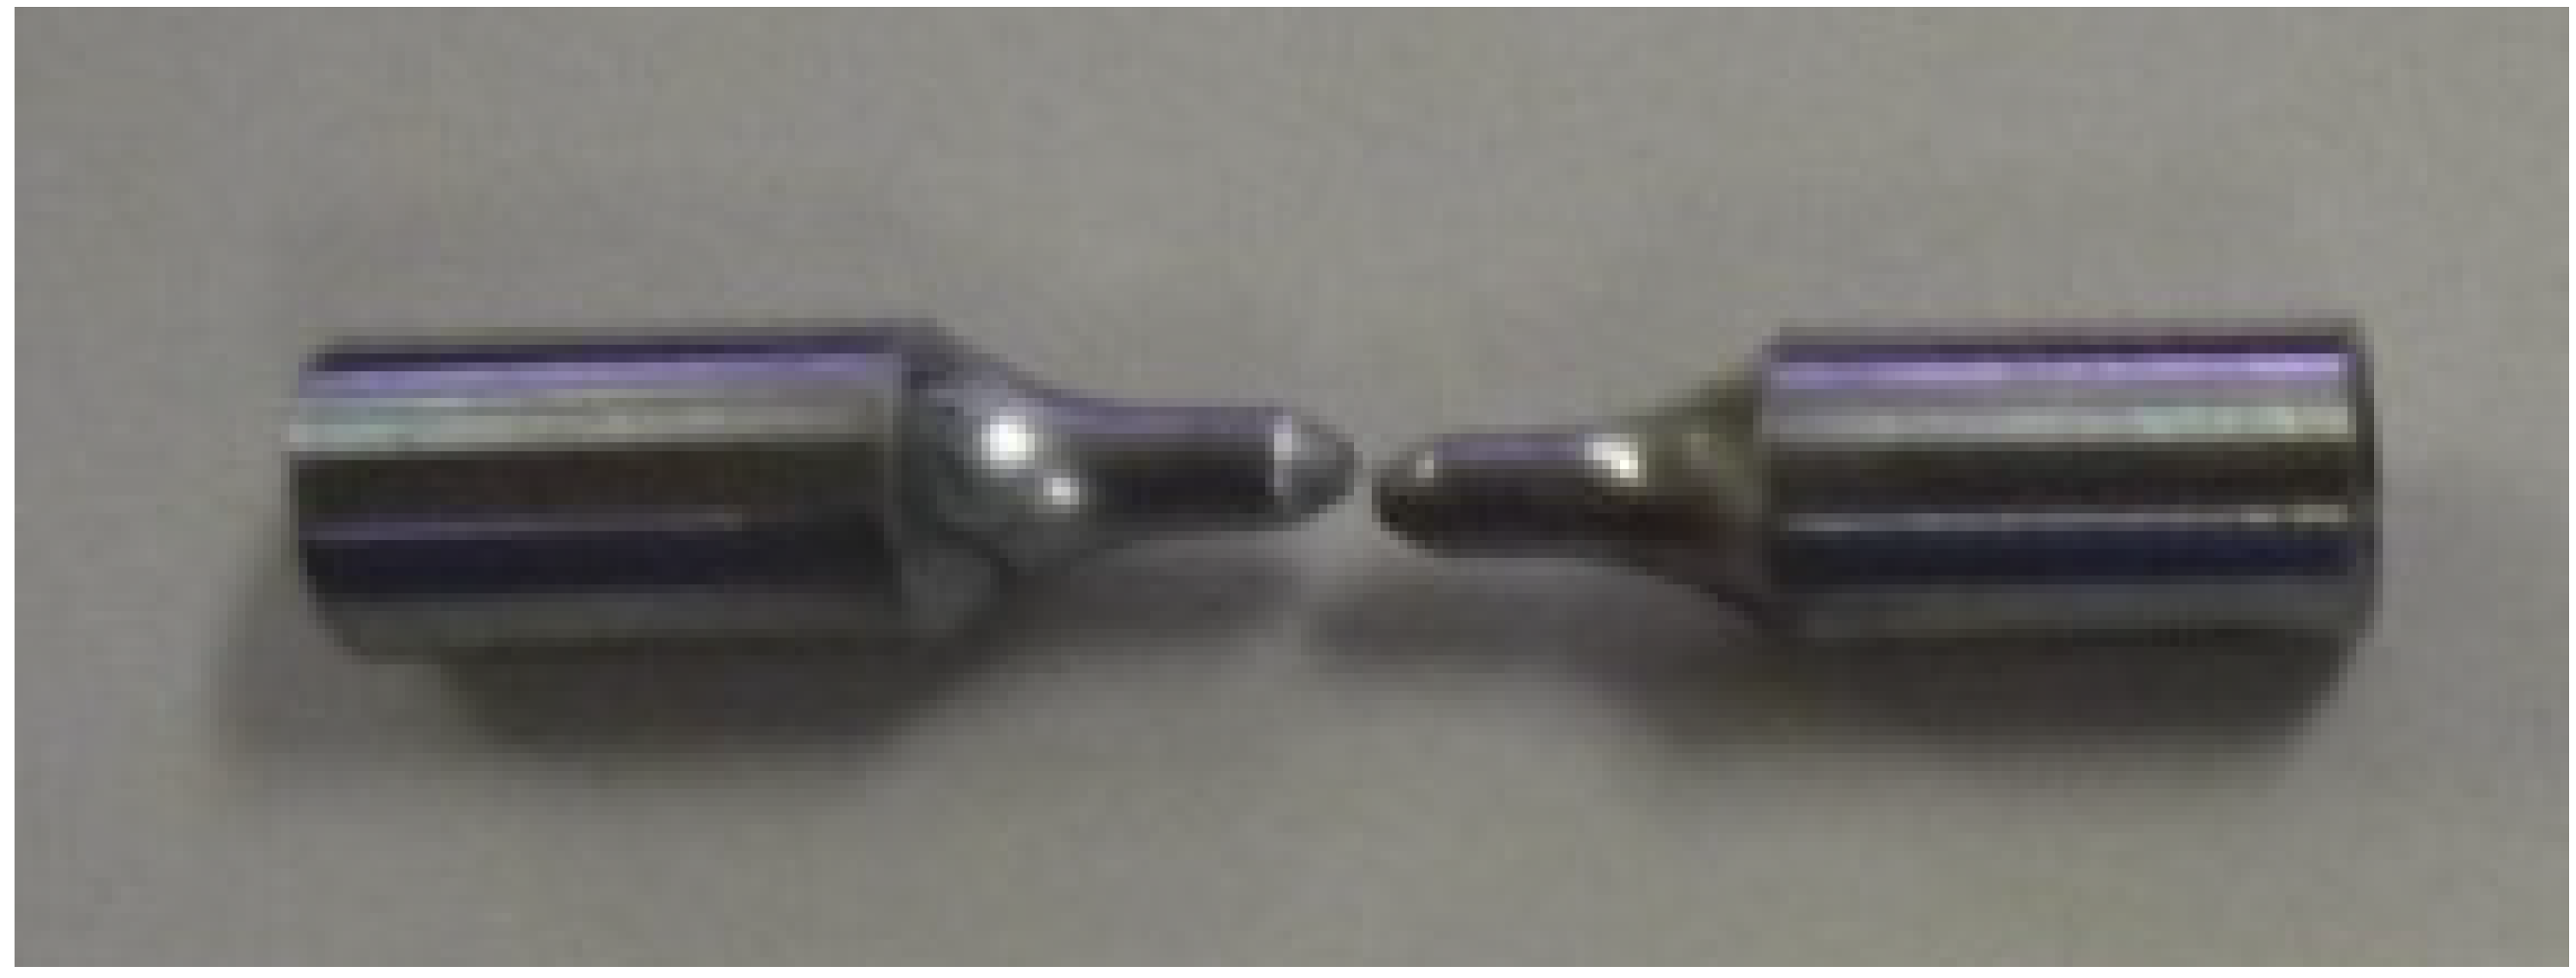
The small round-bar specimens, whose shape is shown in Figure 3, were used for this study. The diameter of the central cross-section is 1.0 mm. Both shoulders of the specimen increase to 2.5 mm in diameter. Specimen housings hook the shoulders in the tensile test machine. The length of the parallel part was designed to be only 2.0 mm to ensure that necking occurs in the center of the parallel part, as exemplified in Figure 4. This type of specimen was already used for the evaluation of work-hardening and fracture strains of thin steel sheets [30,31].
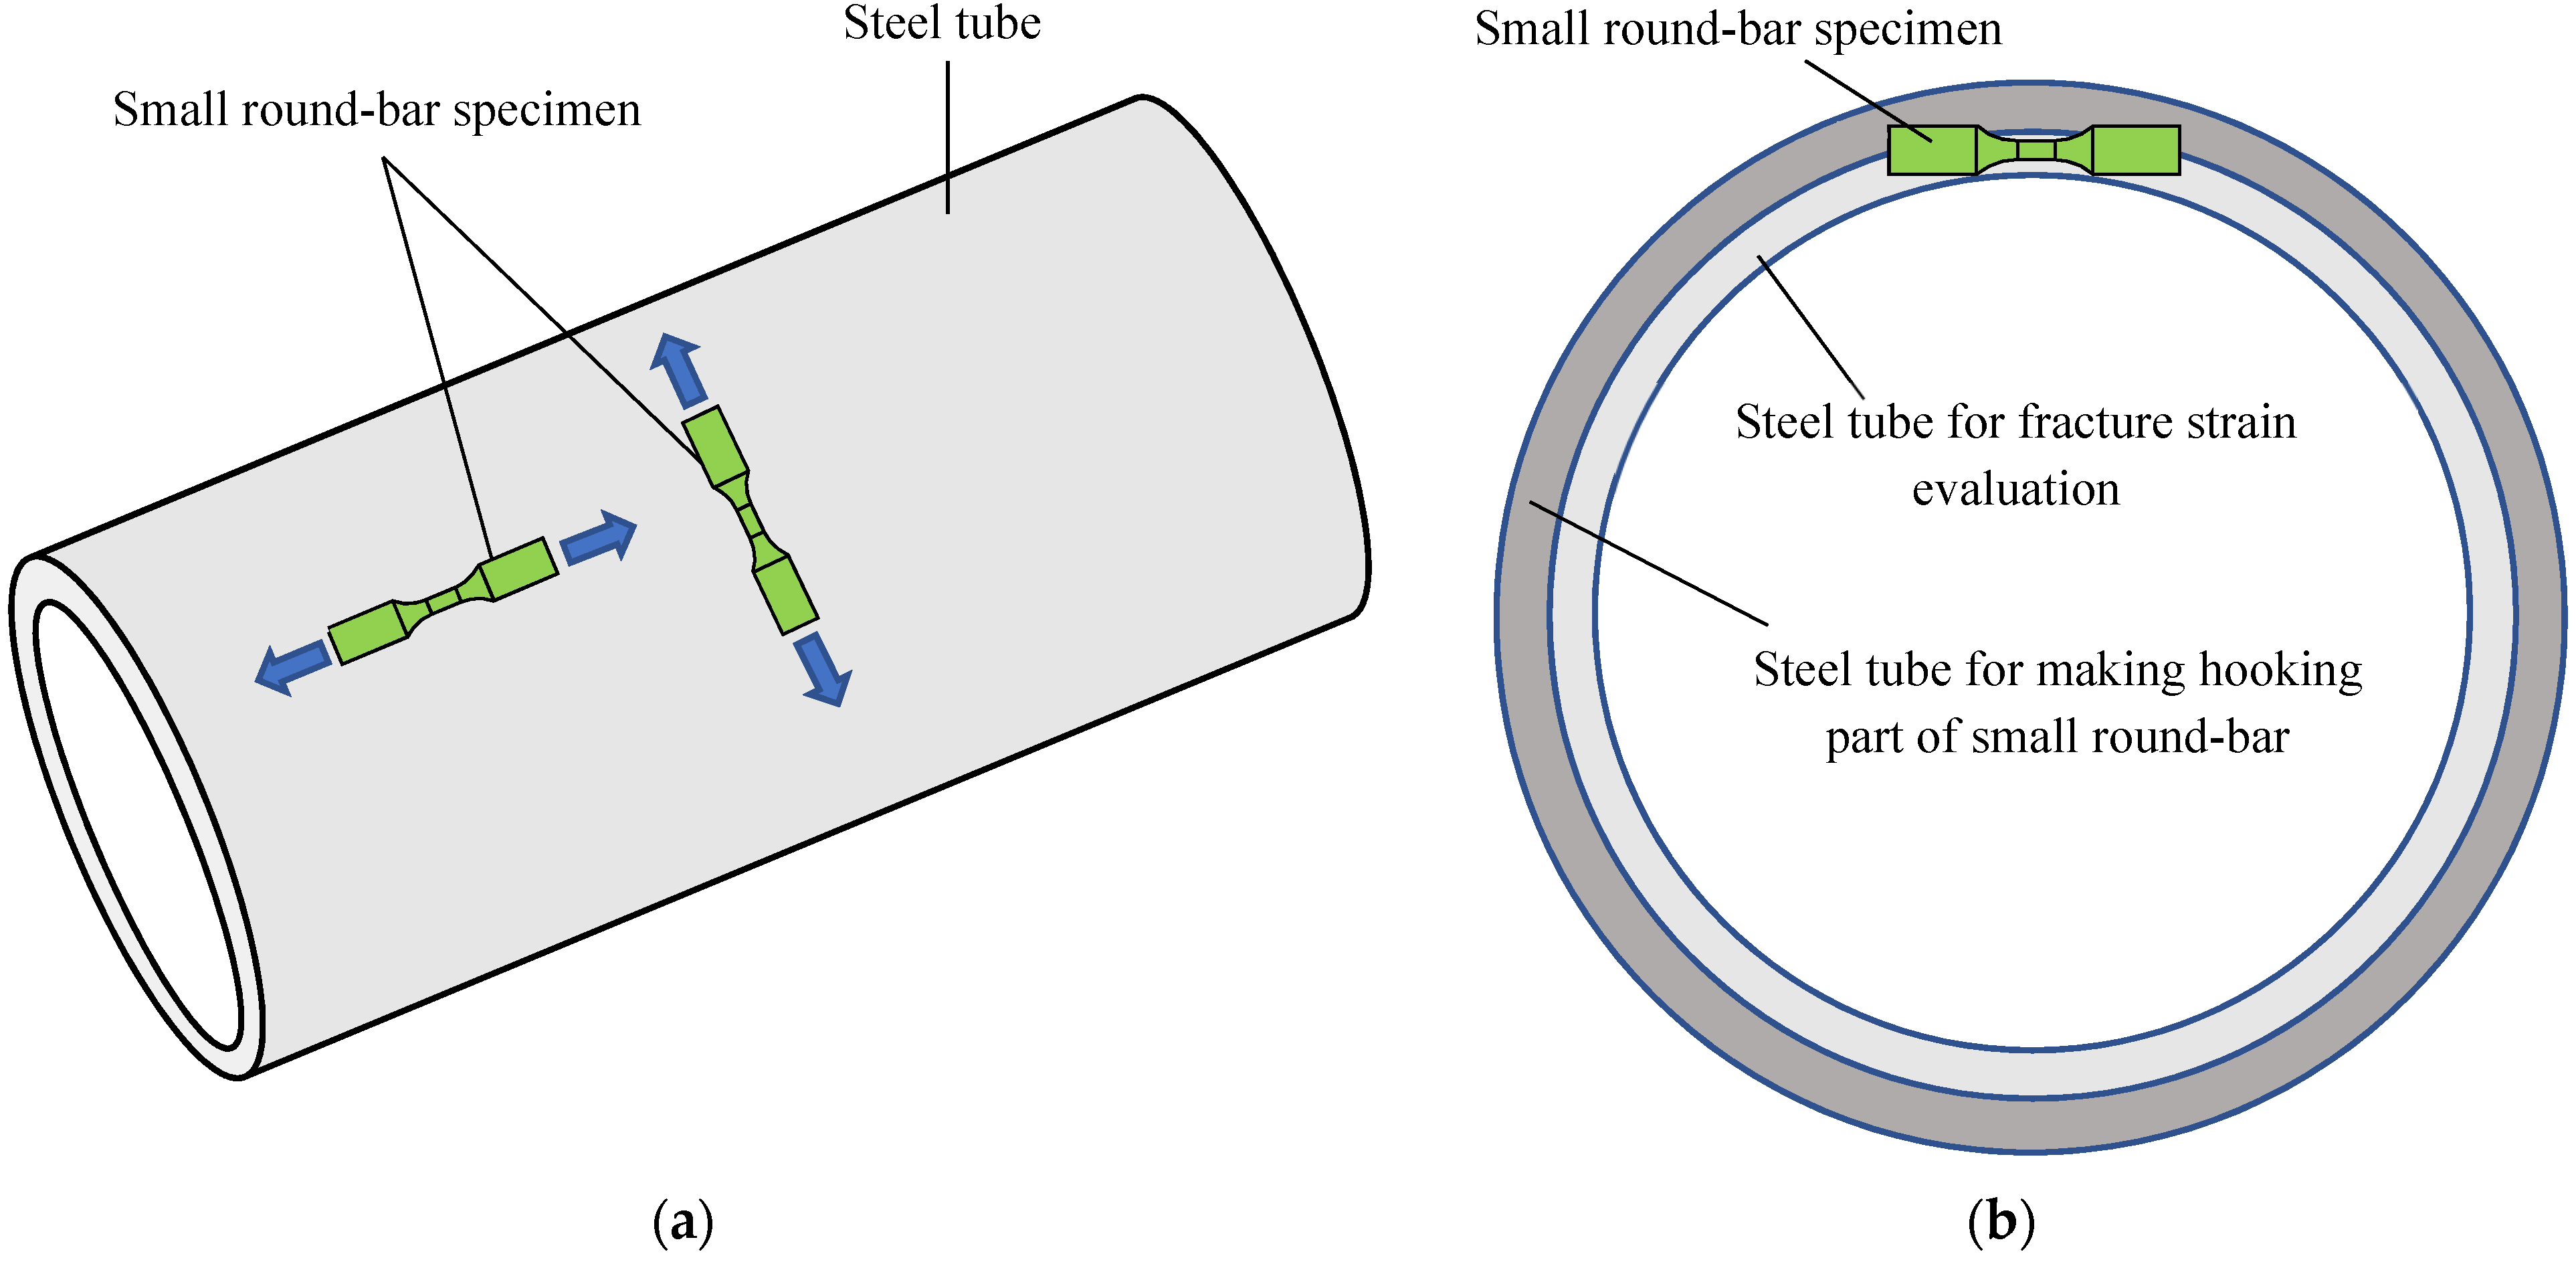
The specimens were cut from three steel tubes by machining so that the tensile direction corresponds to the axial and hoop directions, as shown in Figure 5a. The specimens were polished by emery paper after the machining. Hereafter, we refer to them as axial and hoop specimens. The axial specimen can be cut from the steel tubes, whereas the hooking part remains in the shape of a tube. However, the hoop specimen sticks out from the steel tube to form defective shoulders for specimen hooking. To solve this problem, the dummy tube was laminated using electron beam welding for the properly rounded shoulder shape of the hoop specimen, as shown in Figure 5b. Thus, the hoop specimen shoulders include welded parts, whereas the central cross-section did not. From our previous trial [30], the welding effect was small for this type of specimen.

2.3. Tensile Test

The compact tensile test machine, made by Miyakojima-seisakusyo Corporation Ltd. (Osaka, Japan), was used in this study. An external view of this machine is shown in Figure 6. The shoulders and thick parts of the specimens were fit into the specimen housings, and both sides of the specimen’s shoulders were hooked for specimen tension. The tensile force was measured through a load cell. To evaluate cross-sectional reduction ratio, which represents the true strain, the LED projection of the two-dimensional optical micrometer, TM006, made by Keyence Corp. (Osaka, Japan), measures specimen shape in real-time during the tensile tests.
The following section details the strain evaluation during the tensile tests. For the small-round bar specimen, the measurement of specimen elongation is difficult. The displacement of the specimen housing does not correspond with the specimen elongation because of the slippage between the shoulders and the housing. Attaching an extensometer to a tensile specimen, which is commonly used for tensile tests, is not possible for such a small specimen, as shown in Figure 3. Therefore, we measured the history of the specimen’s minimum diameter, d m , in the tensile test. The two-dimensional (2D) optical micrometer mentioned above provided the projection of the specimen in the tensile test, and the minimum diameter can be evaluated from this projection.
To evaluate true strain ε ¯ , we calculated the cross-sectional reduction ratio ρ using the minimum measured diameter d m as follows:
ρ = 2 ln ( d i n i d m ) ,
where d i n i denotes the initial diameter of the specimen. We can regard ε ¯ ρ when the volume and cross-sectional aspect ratio in the tensile deformation are constant, but the materials in this study presented strong anisotropy. Thus, ρ was found to deviate from the actual ε ¯ , and the values were used as a reference for the consideration of work-hardening.
The fracture strain ε ¯ f was also calculated as the ρ at the final fracture. For accurate evaluation including the anisotropic cross-sectional shape, we measured the actual fracture surface area A f using the scanning electron microscope (SEM) image. The ε ¯ f s were calculated from the following equation:
ε ¯ f = ln ( A i n i A f ) ,
where A i n i was the initial cross-sectional area calculated from d i n i . Whereas this type of ε ¯ f evaluation is also available for sheet type tensile specimen [32], round-bar specimen and SEM observation enabled accurate evaluation because of the simple fracture surface shape.
From the errors of the real time cross-sectional area measurement by the material anisotropy, we evaluated the nominal stress s from the measured force F using the following equation:
s = F A i n i
As reported in a previous study [33], the fracture strain ε ¯ f represented the hole-expansion ratio from 590 to 1180 MPa for class steels. For this reason, only small, smooth round-bar specimens were analyzed in this study, although a notched-bar tensile specimen would provide the ductile fracture locus in the space of the stress triaxiality.

2.4. Piercing Test

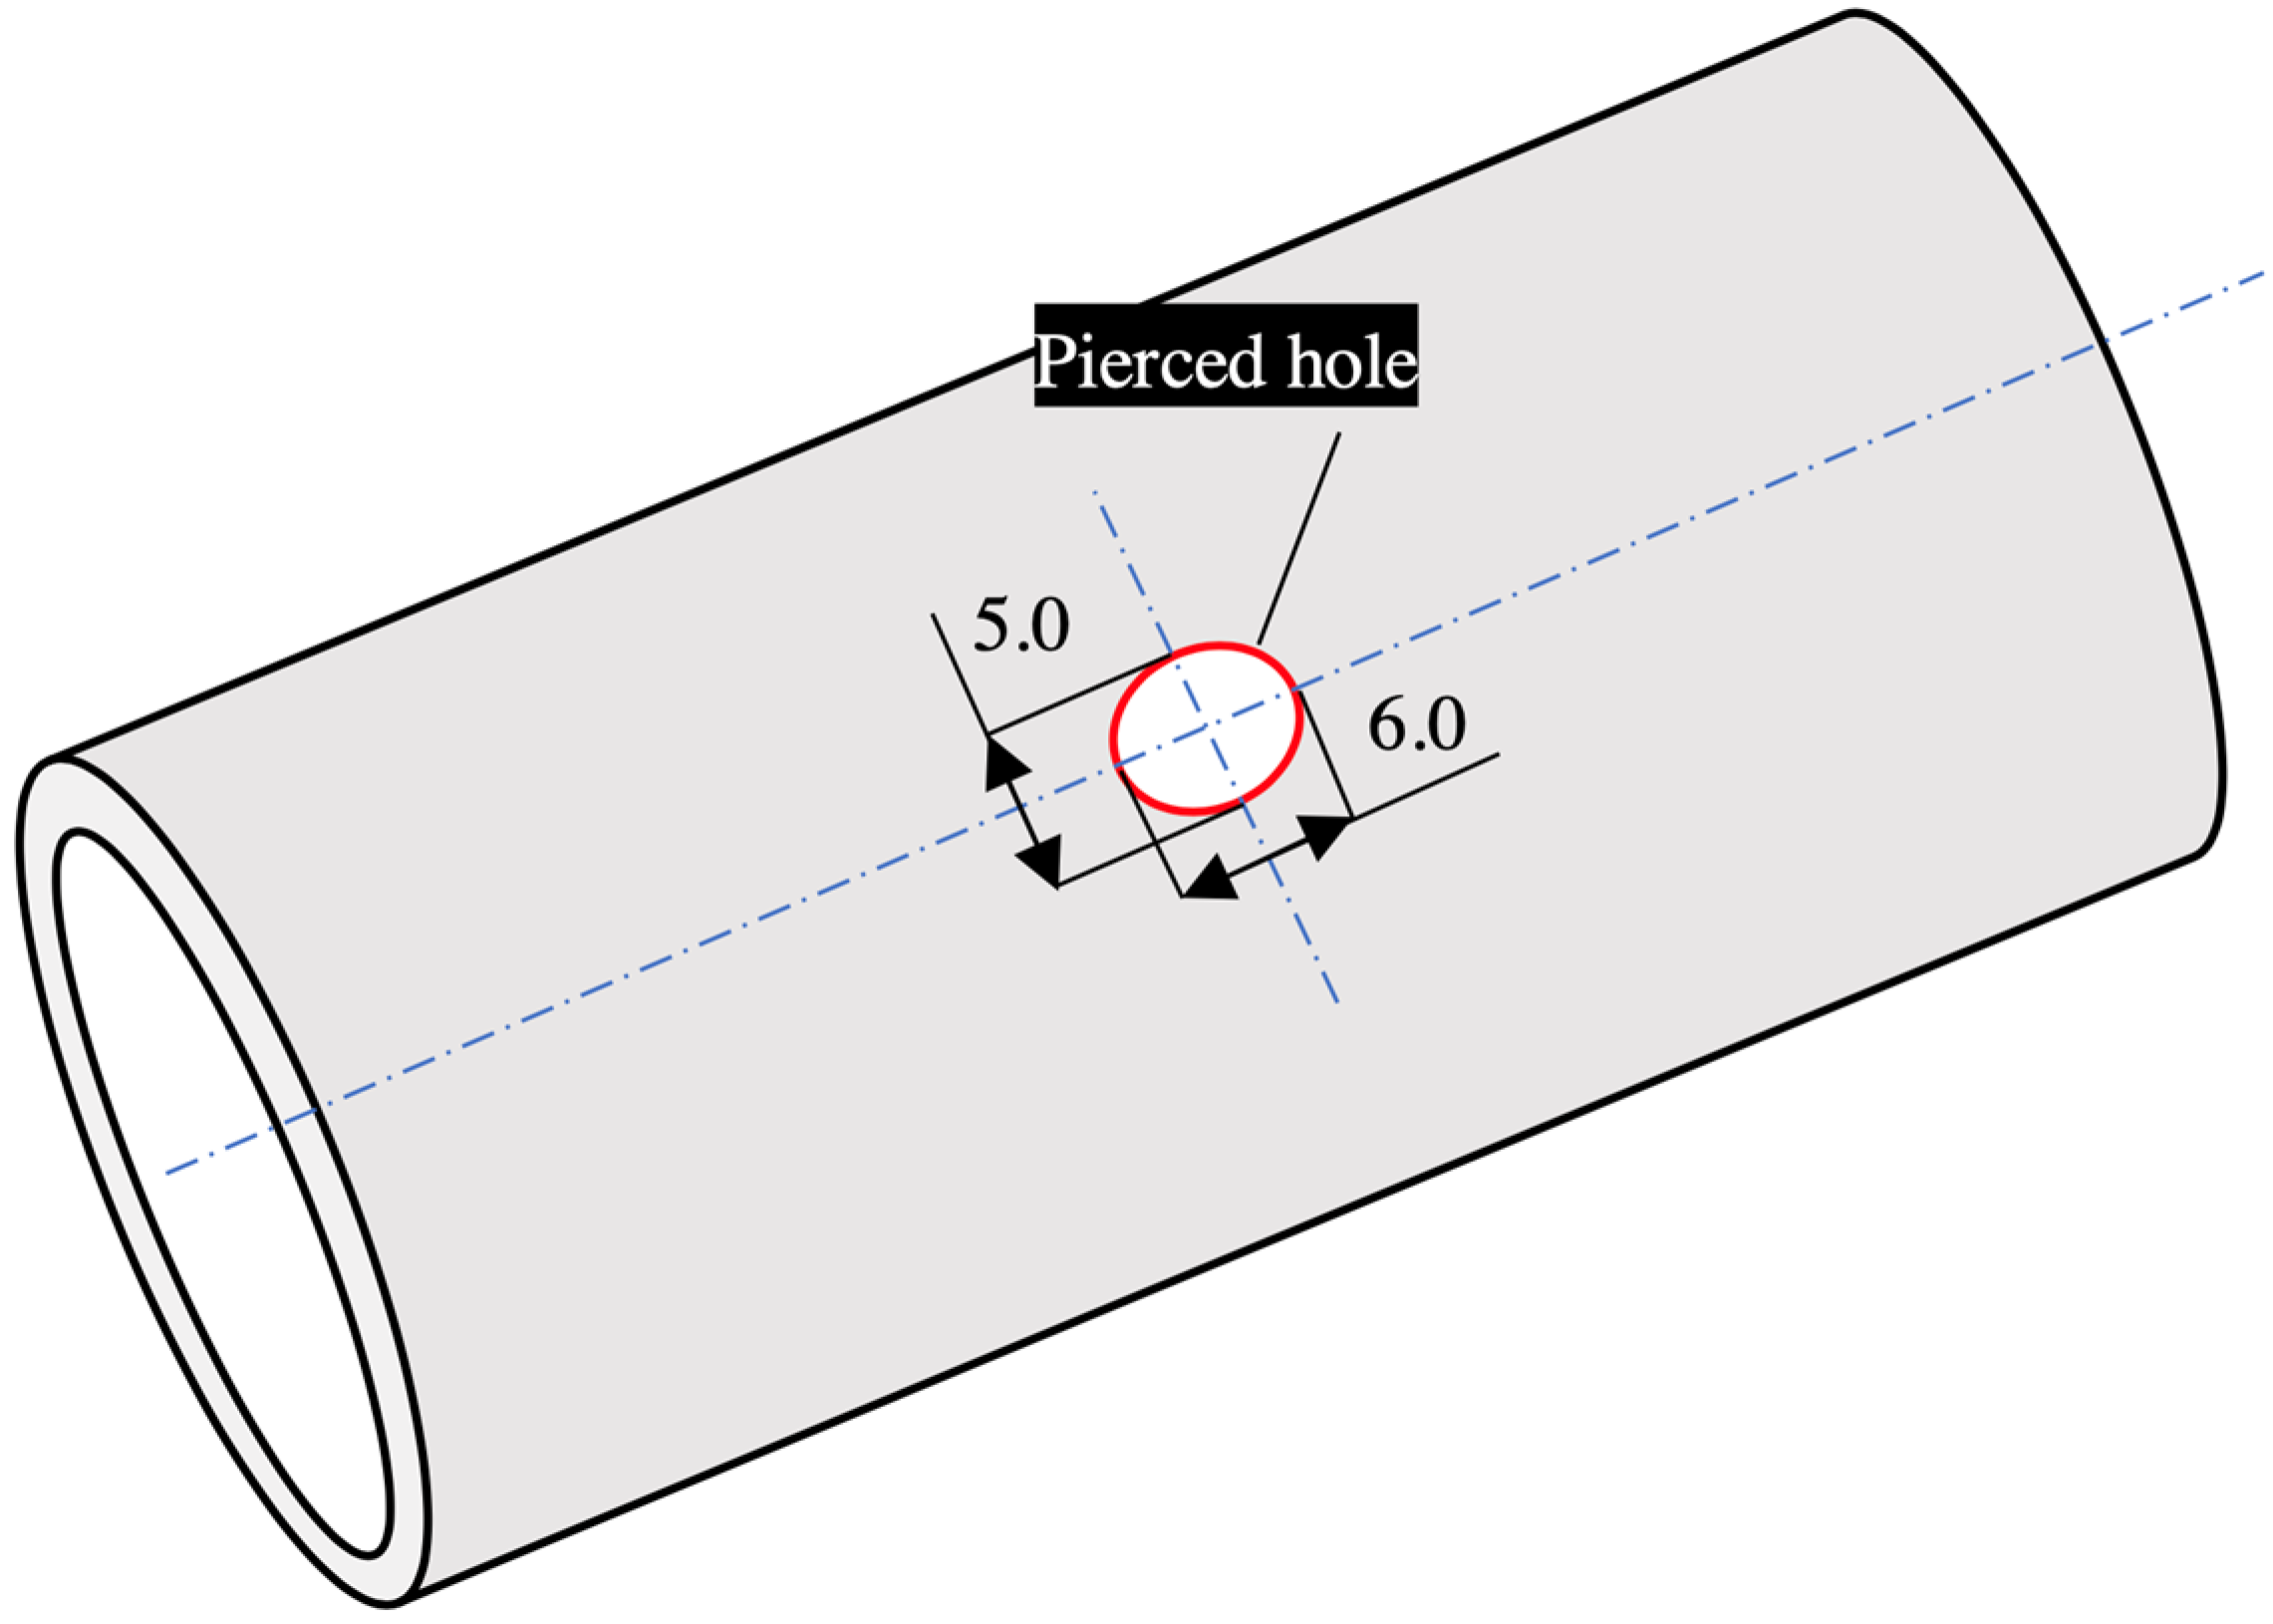
The piercings were done on the tubes’ surface, and the shape of the pierced hole was an ellipse with a minor axis of 5.0 mm and a major axis of 6.0 mm. The major axis of the pierced ellipse corresponded with the tube’s axis. The punch bottom was flat, and the die surface was curved so that it adjusted to the tube’s inner side shape. The clearance between punch and die was 15.3% of the tube’s thickness. The schematic image of this piercing condition is shown in Figure 7.
The above piercing condition was the same as the actual process. The shape of the ellipse was set so that the burring height becomes uniform at the whole circumference. In sheet metal forming, piercing with clearance exceeding the 10% thickness gives a superior hole-expansion ratio to those with other clearances [33]. Thus, 15–20% thickness of the clearances has been applied to actual processes.
For tribological conditions, the piercings were conducted without lubricant.

3. Results

3.1. Nominal Stress Andcross-Sectional Reduction Curves for Small Round-Bar Tensile Test

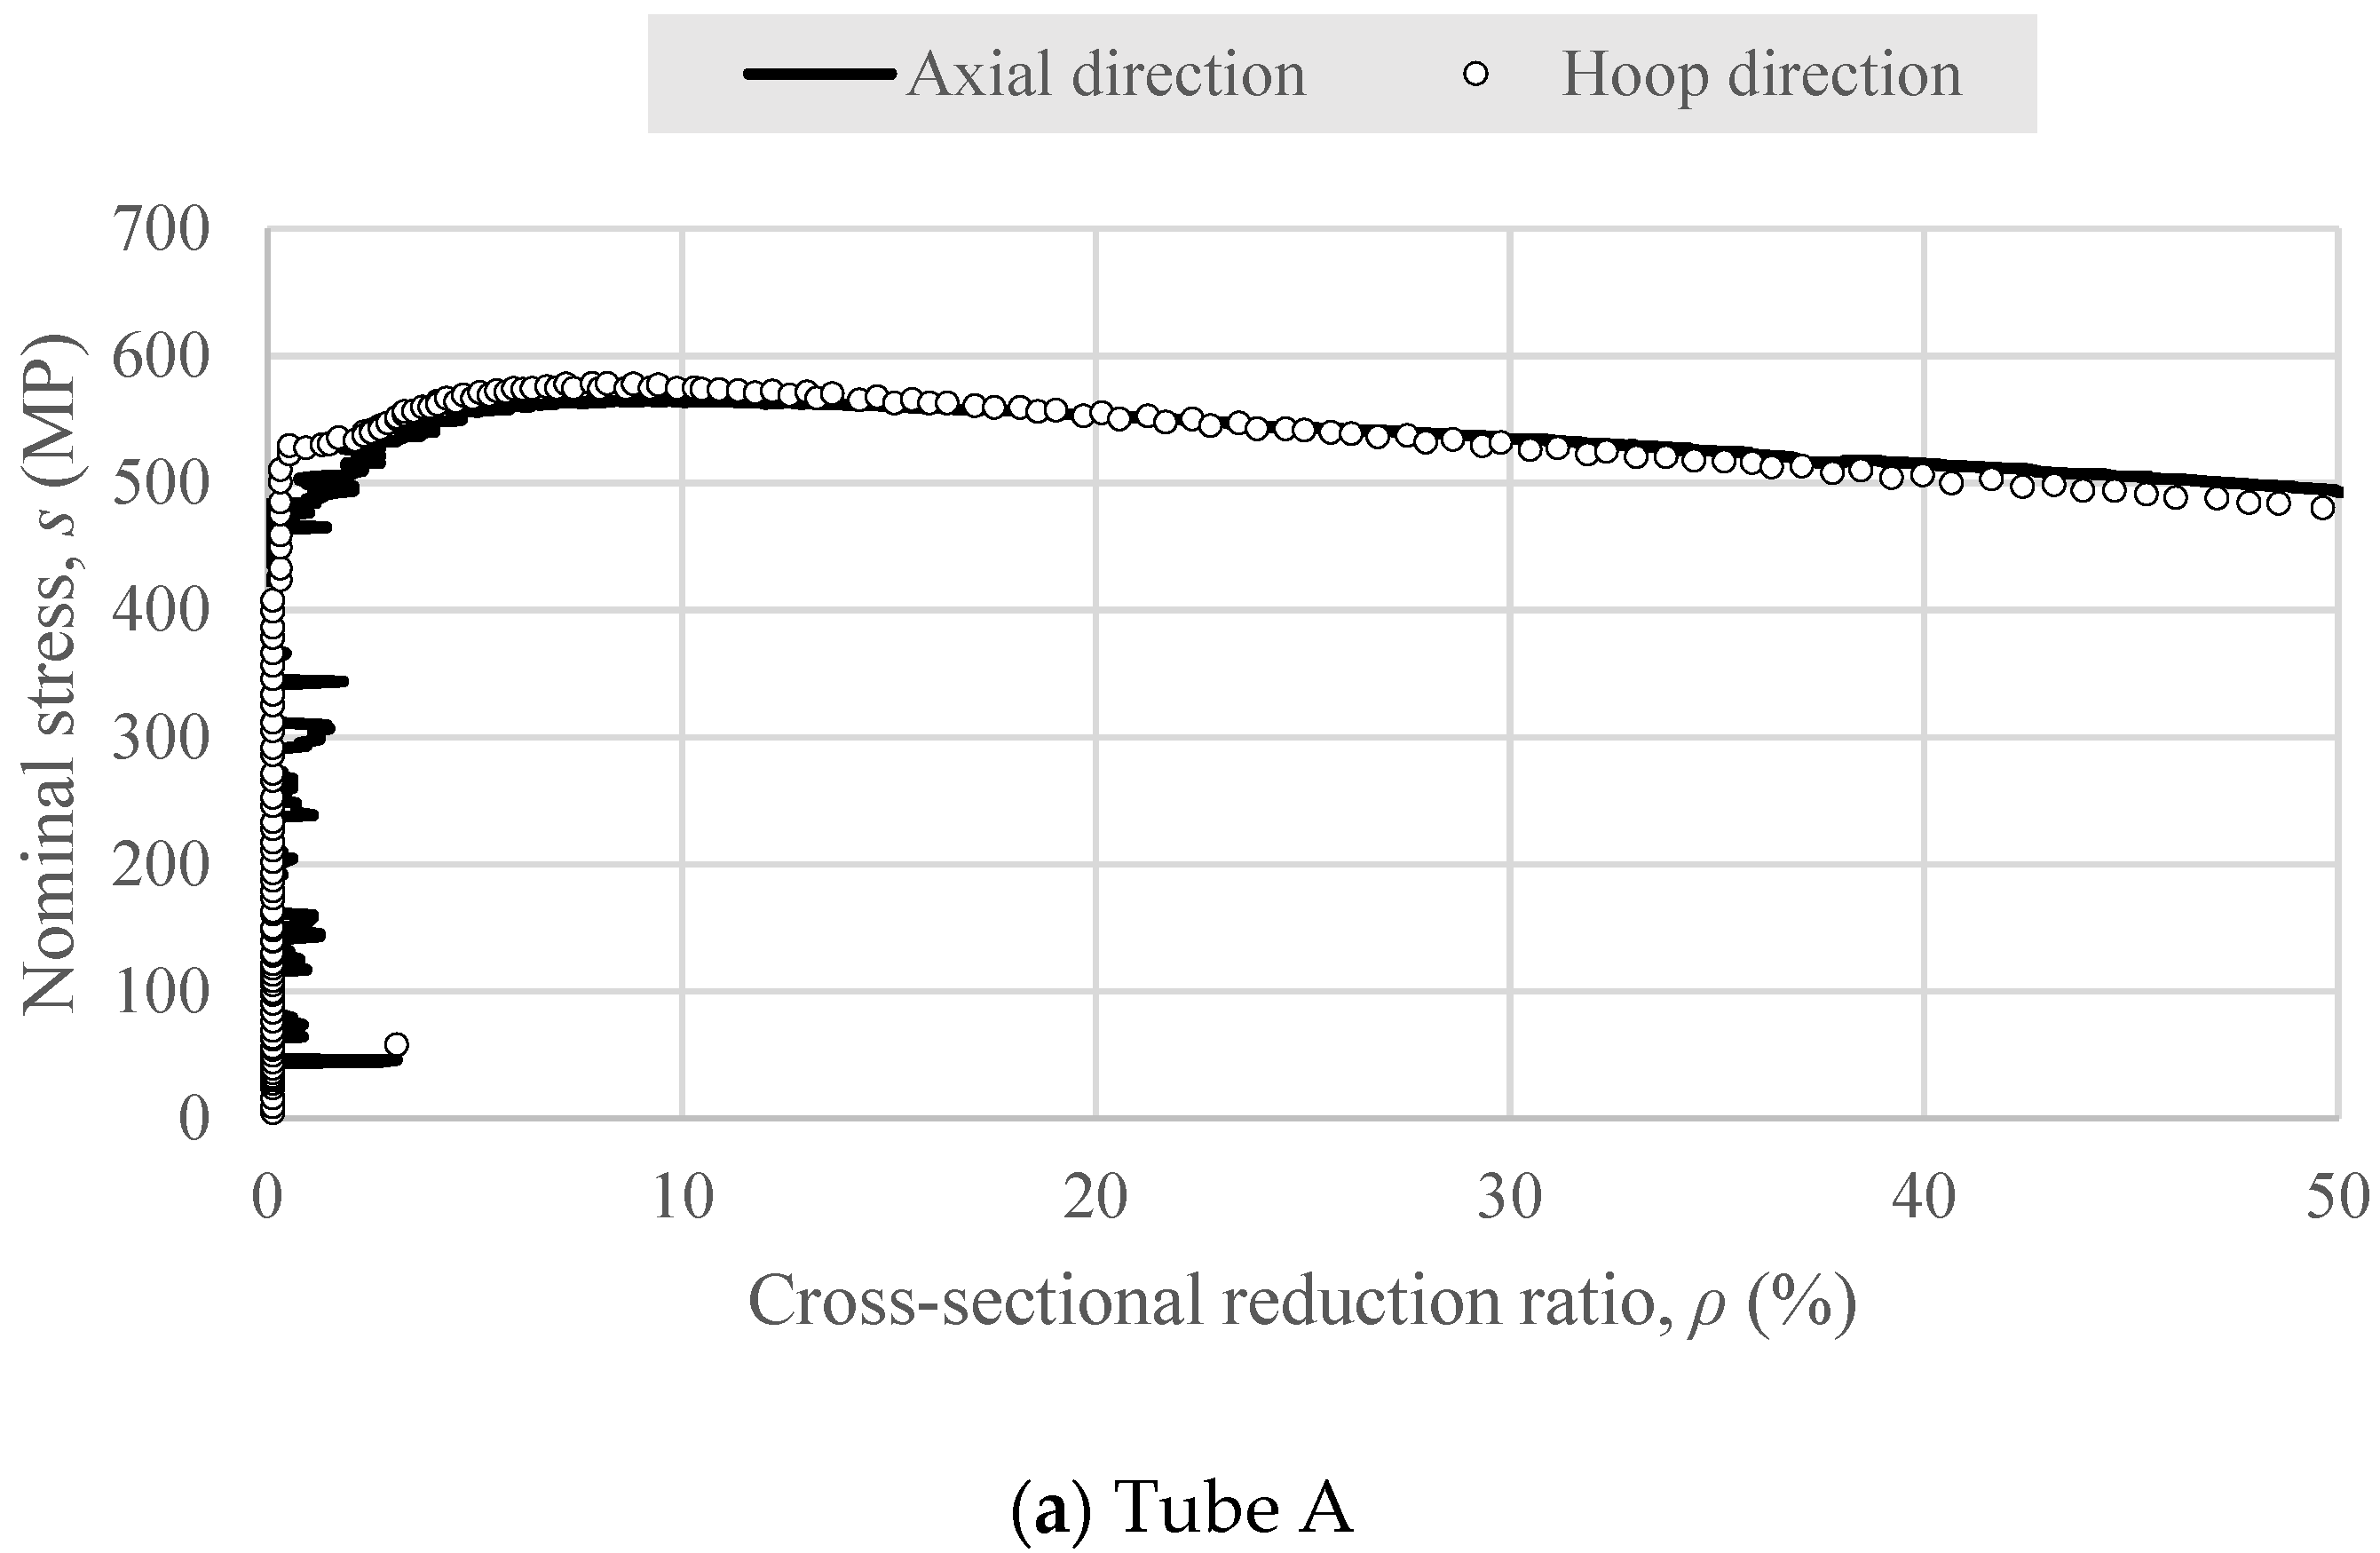
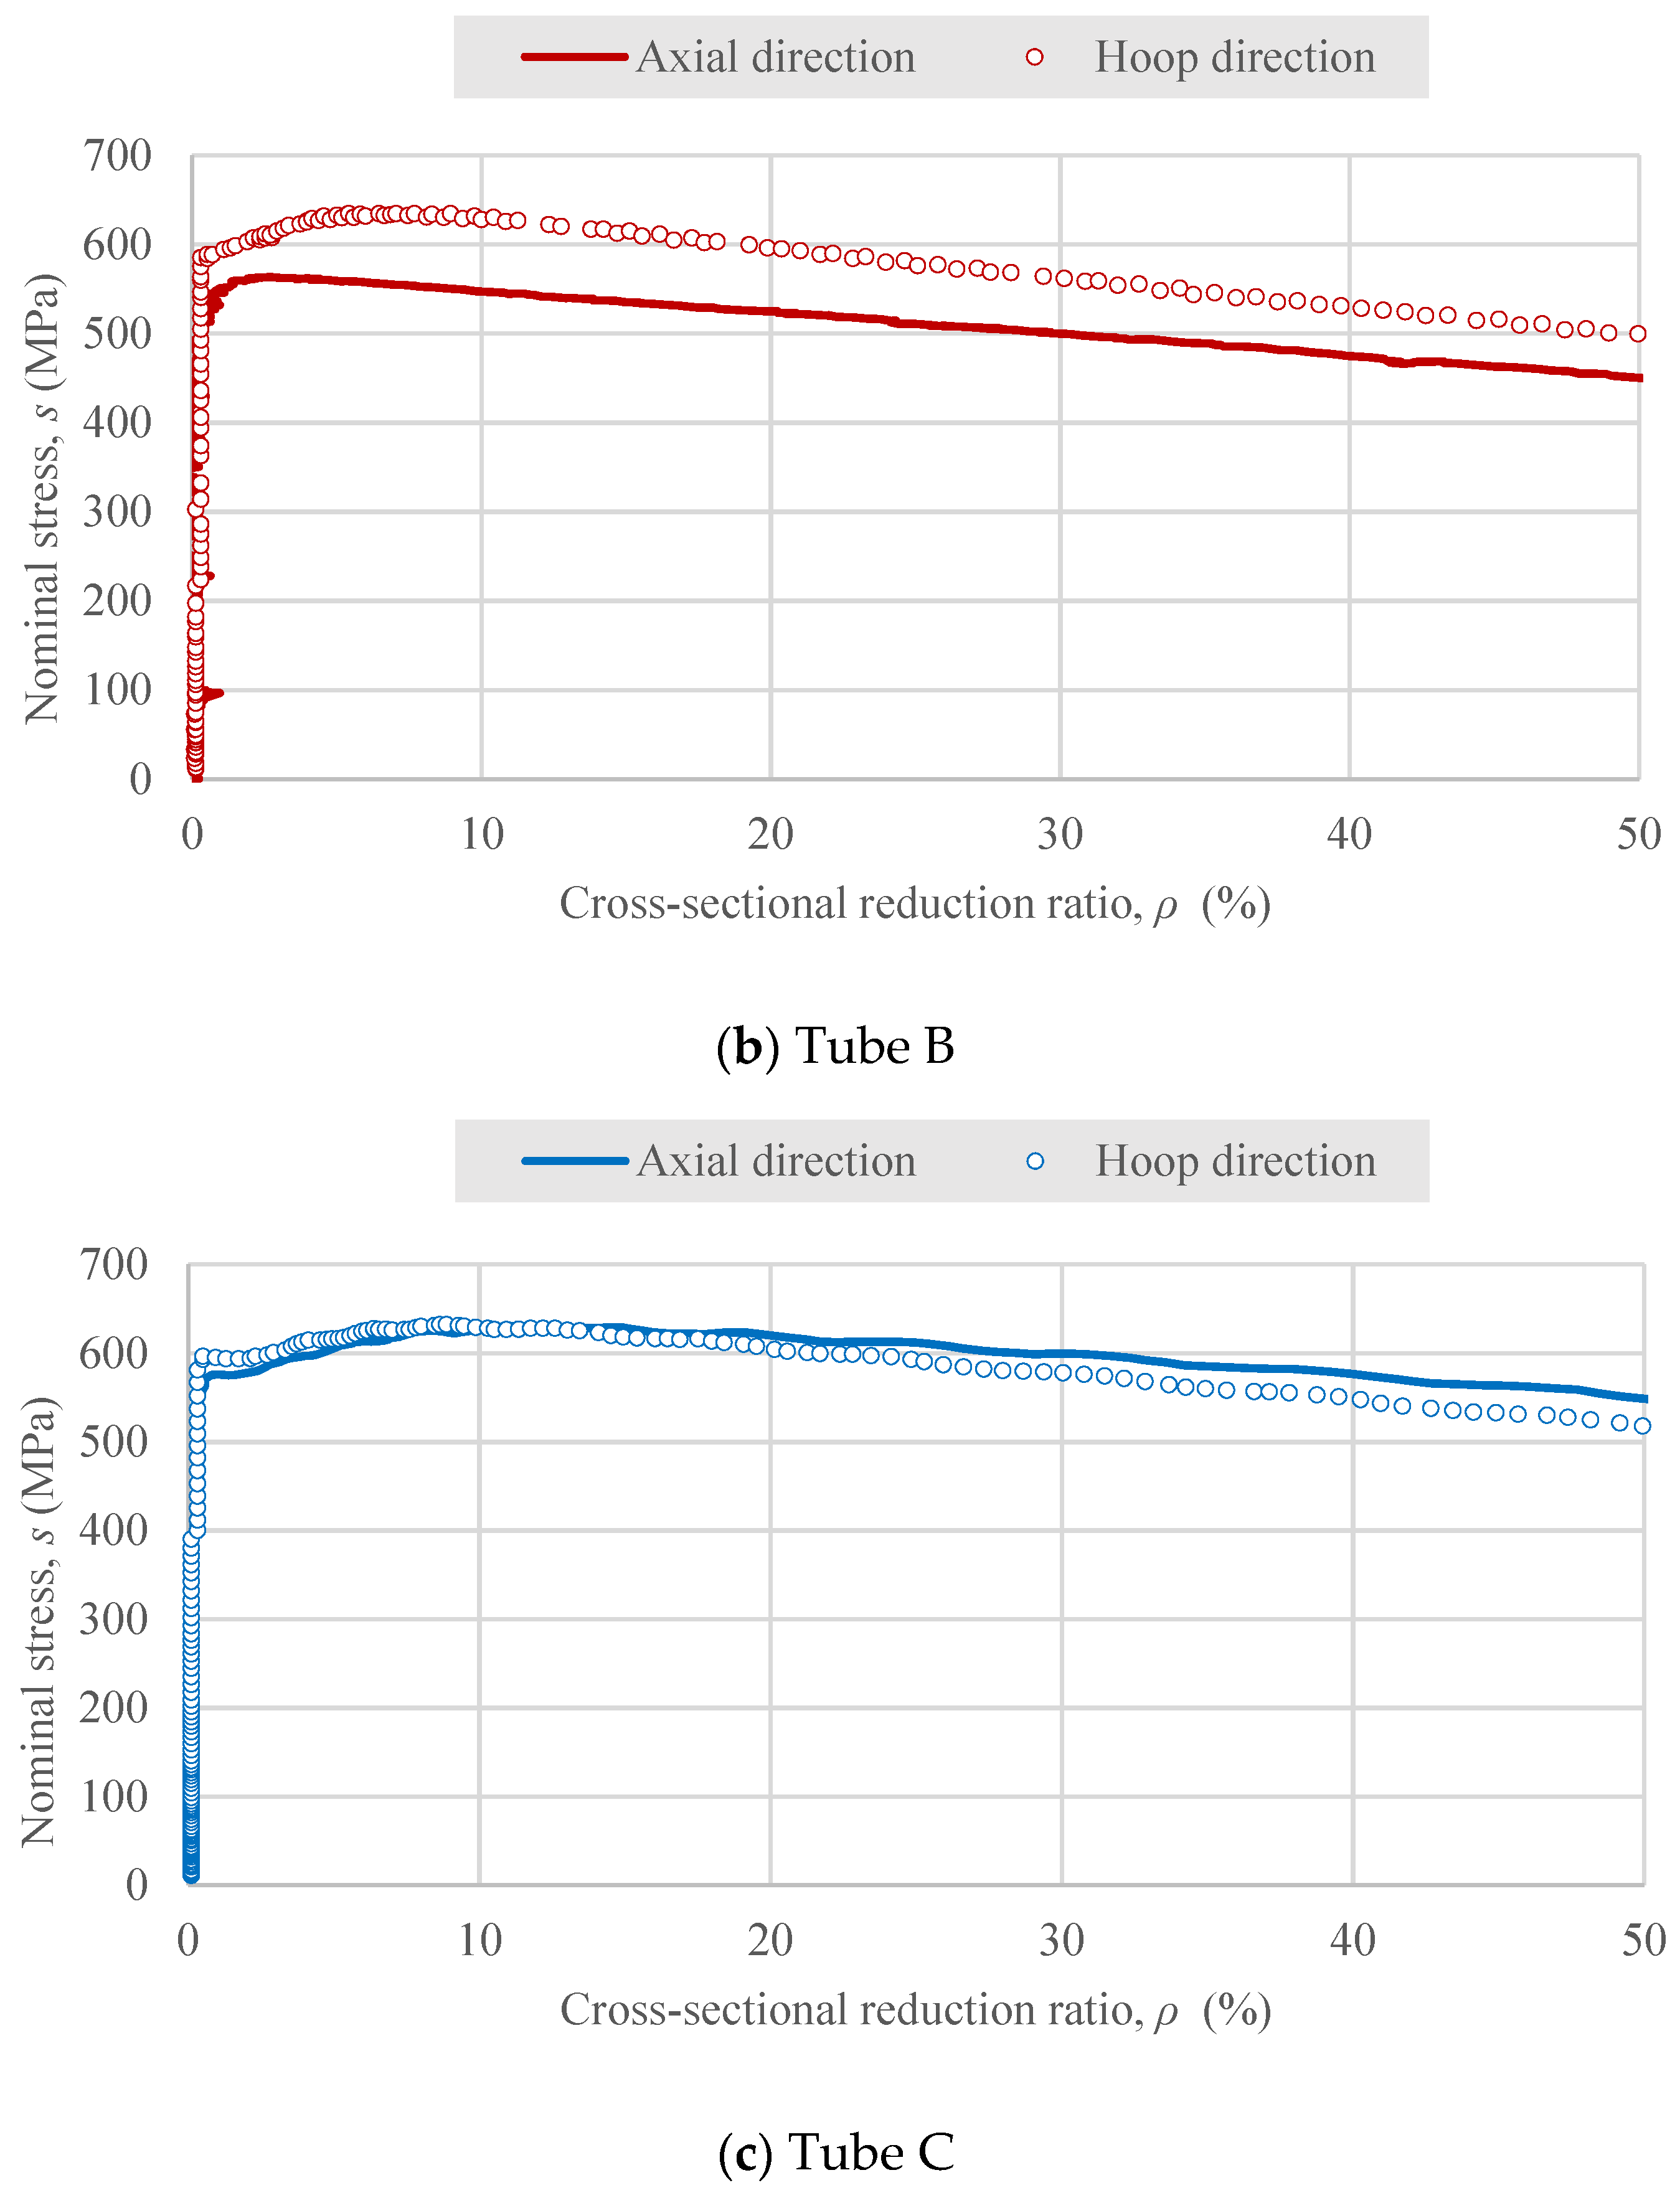
The nominal stress s and cross-sectional reduction ratio curves ρ are shown in Figure 8. For readability, Figure 8a–c only show the values of ρ between 0% and 50%. In tubes A and C (Figure 8a,c) the axial and hoop directional tensile strengths were similar. In tube B (Figure 8b), the tensile strength in the hoop direction was remarkably higher than that in the axial direction. For the initial yield stress, all of the tubes presented a higher s in the hoop direction than in the axial direction.
Compared with the tube tensile test in Table 1, tube A presents higher tensile strength by approximately 50 MPa in both directions. The initial yield stress in the axial direction shows nearly the same value as that in the tube tensile test. Tube B presents lower axial tensile strength by approximately 30 MPa than that in the tube tensile test. The initial yield stresses of the tube B in the axial direction are nearly the same as that of the tube tensile test. For tube C, the tensile strength and initial yield stress are higher than those in the tube tensile test by approximately 30 MPa.

3.2. Fracture Strains for Small Round-Bar Tensile Test

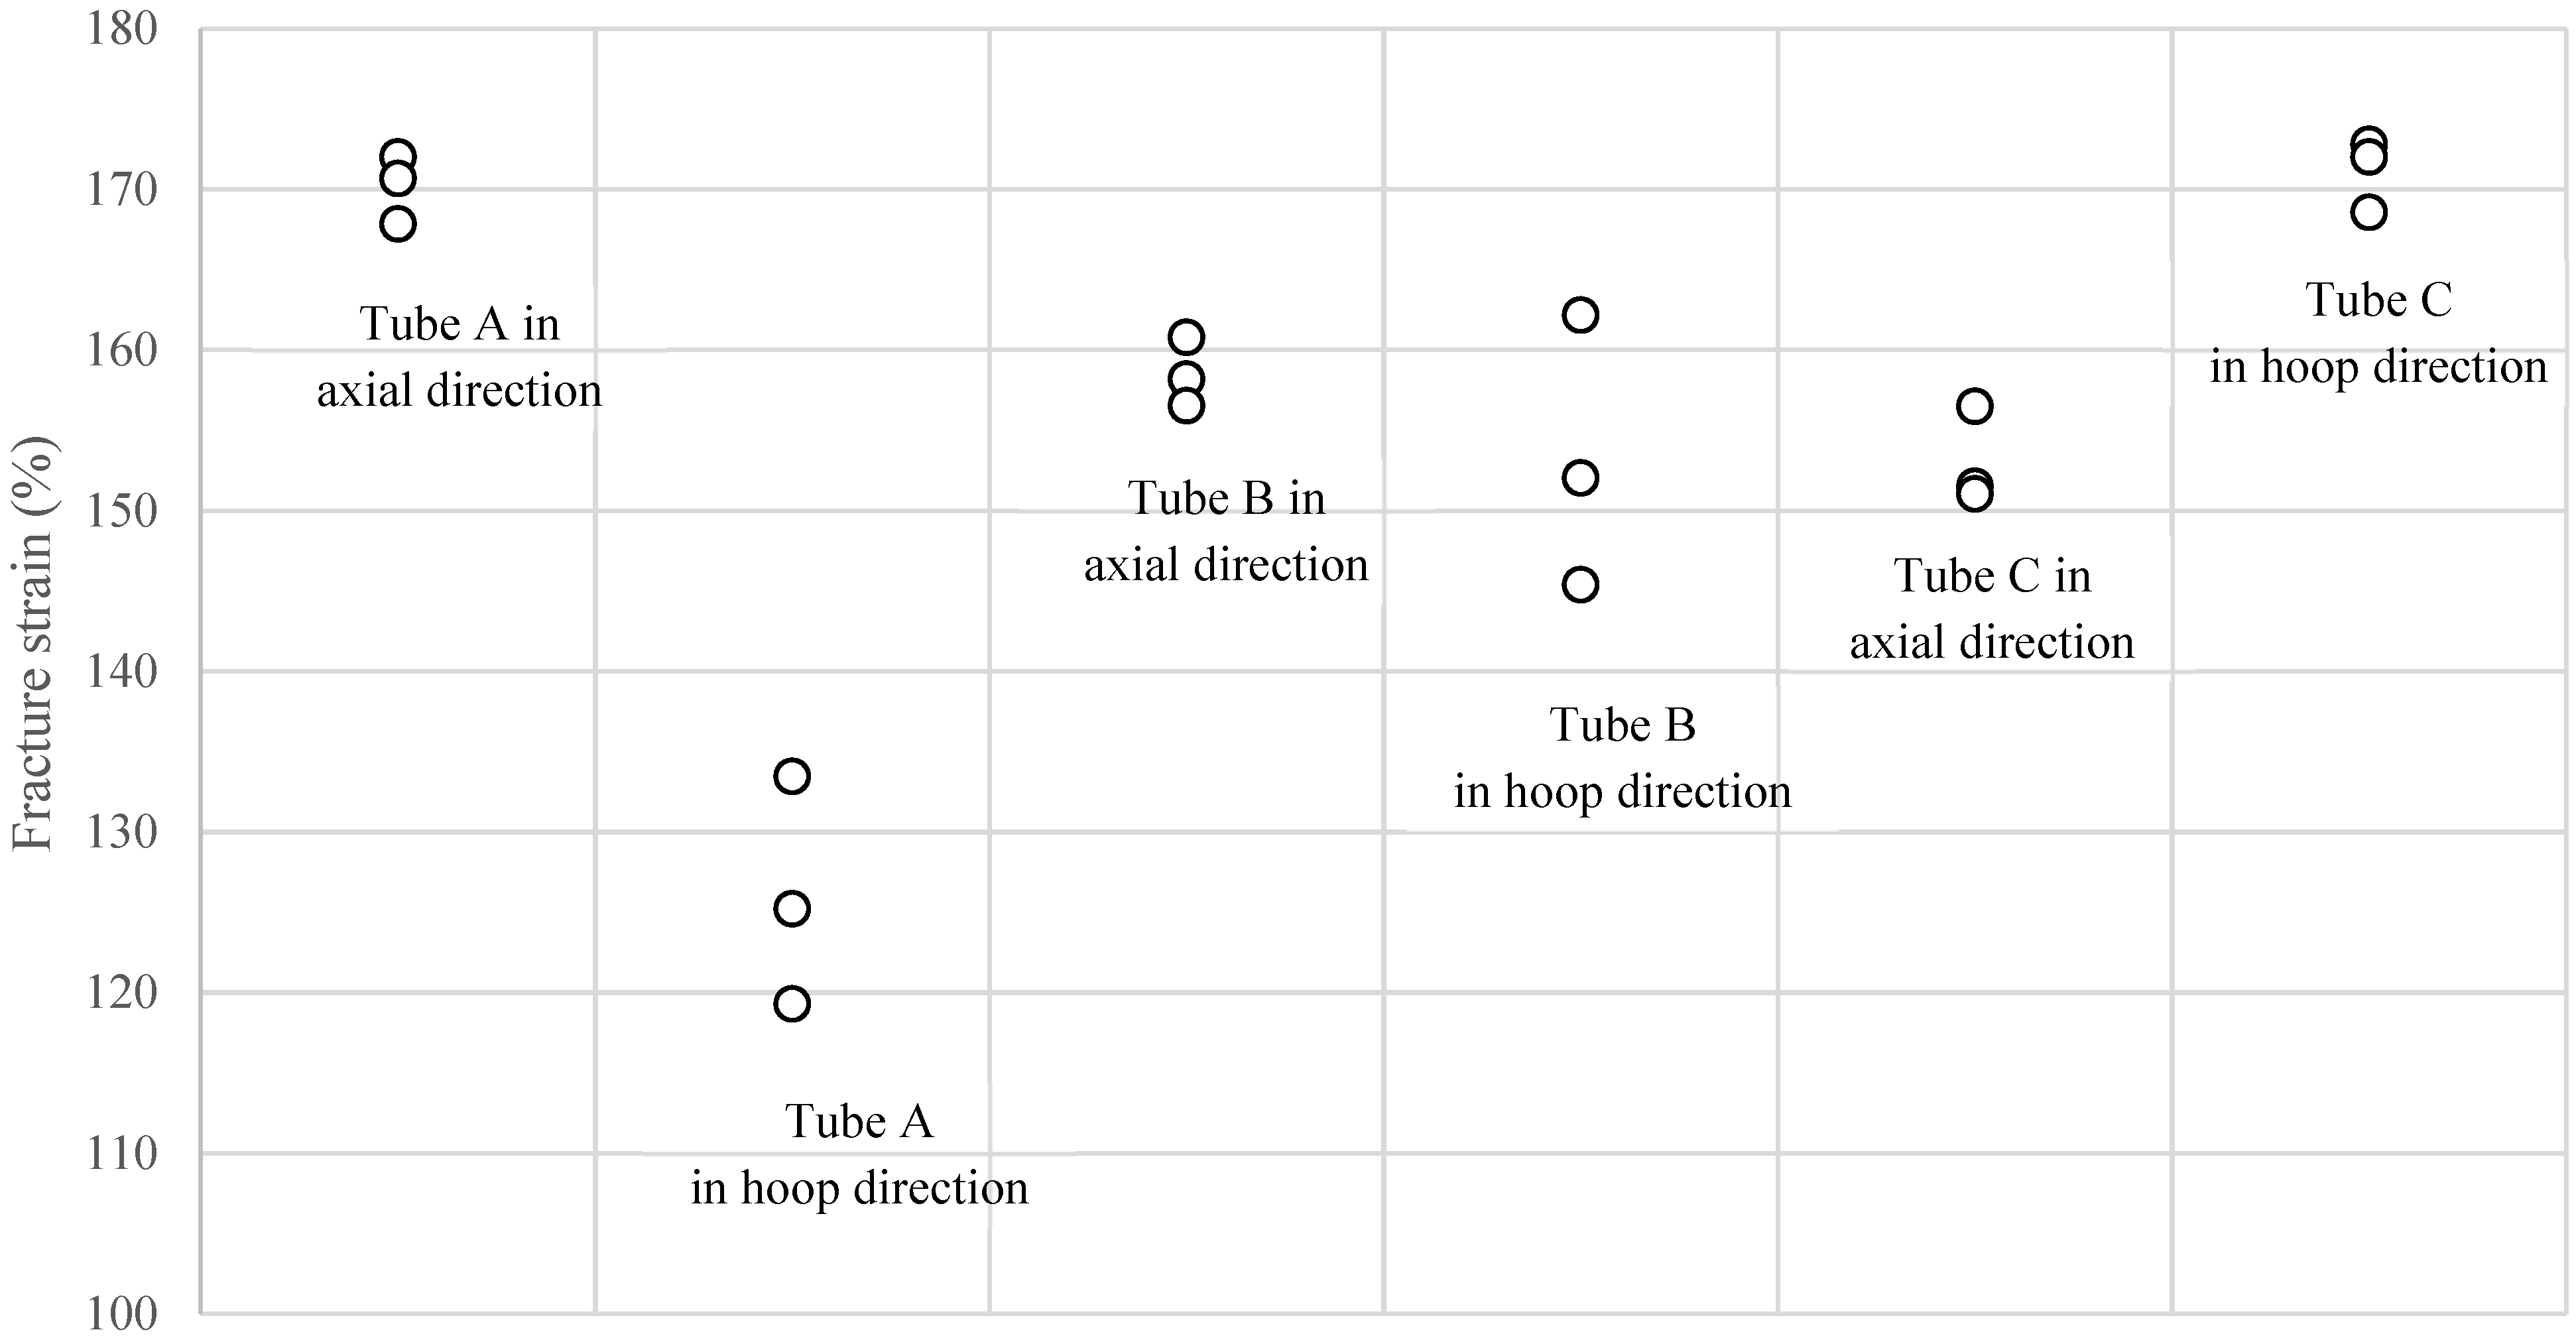
The fracture strains ε ¯ f of the three steel tubes are shown in Figure 9. Tube A presents notable anisotropy of the ε ¯ f s in the axial and hoop directions. The axial ε ¯ f is approximately 170%, however the hoop ε ¯ f deteriorated to approximately 120–135%. The ε ¯ f s of tube B did not show remarkable differences in both directions, which ranged between 140 and 165% and were lower than the axial ε ¯ f of tube A but higher than the hoop ε ¯ f of tube A. For tube C, the tendency of the ε ¯ f s is the opposite to that of tube A. The axial ε ¯ f is nearly the same with both directional ε ¯ f s of tube B, however the hoop ε ¯ f is the same as the axial ε ¯ f of tube A. Therefore, tube C shows the highest ε ¯ f values of the three tubes in the two directions.
The SEM images of the fracture surfaces are shown in Figure 10. We can confirm that the shape of the fracture surface (specimen cross sections at the fracture) were ellipsoids, except those of tubes A and B in the hoop direction. The minor axes of these ellipsoids corresponded with the tube thickness.
From Figure 10, dimples covered the fracture surfaces of all the tubes in both directions. Additionally, it should be noted that the banding concavities normal to the tube thickness appeared on the fracture surface of tube A in the hoop direction, where the ε ¯ f is the lowest among all the tubes in both directions. The fracture surface of tube A in the axial direction and tube C in the hoop direction also show irregular dimpled surfaces, which were caused by sharp and non-banded concavities.

3.3. Piercing Test

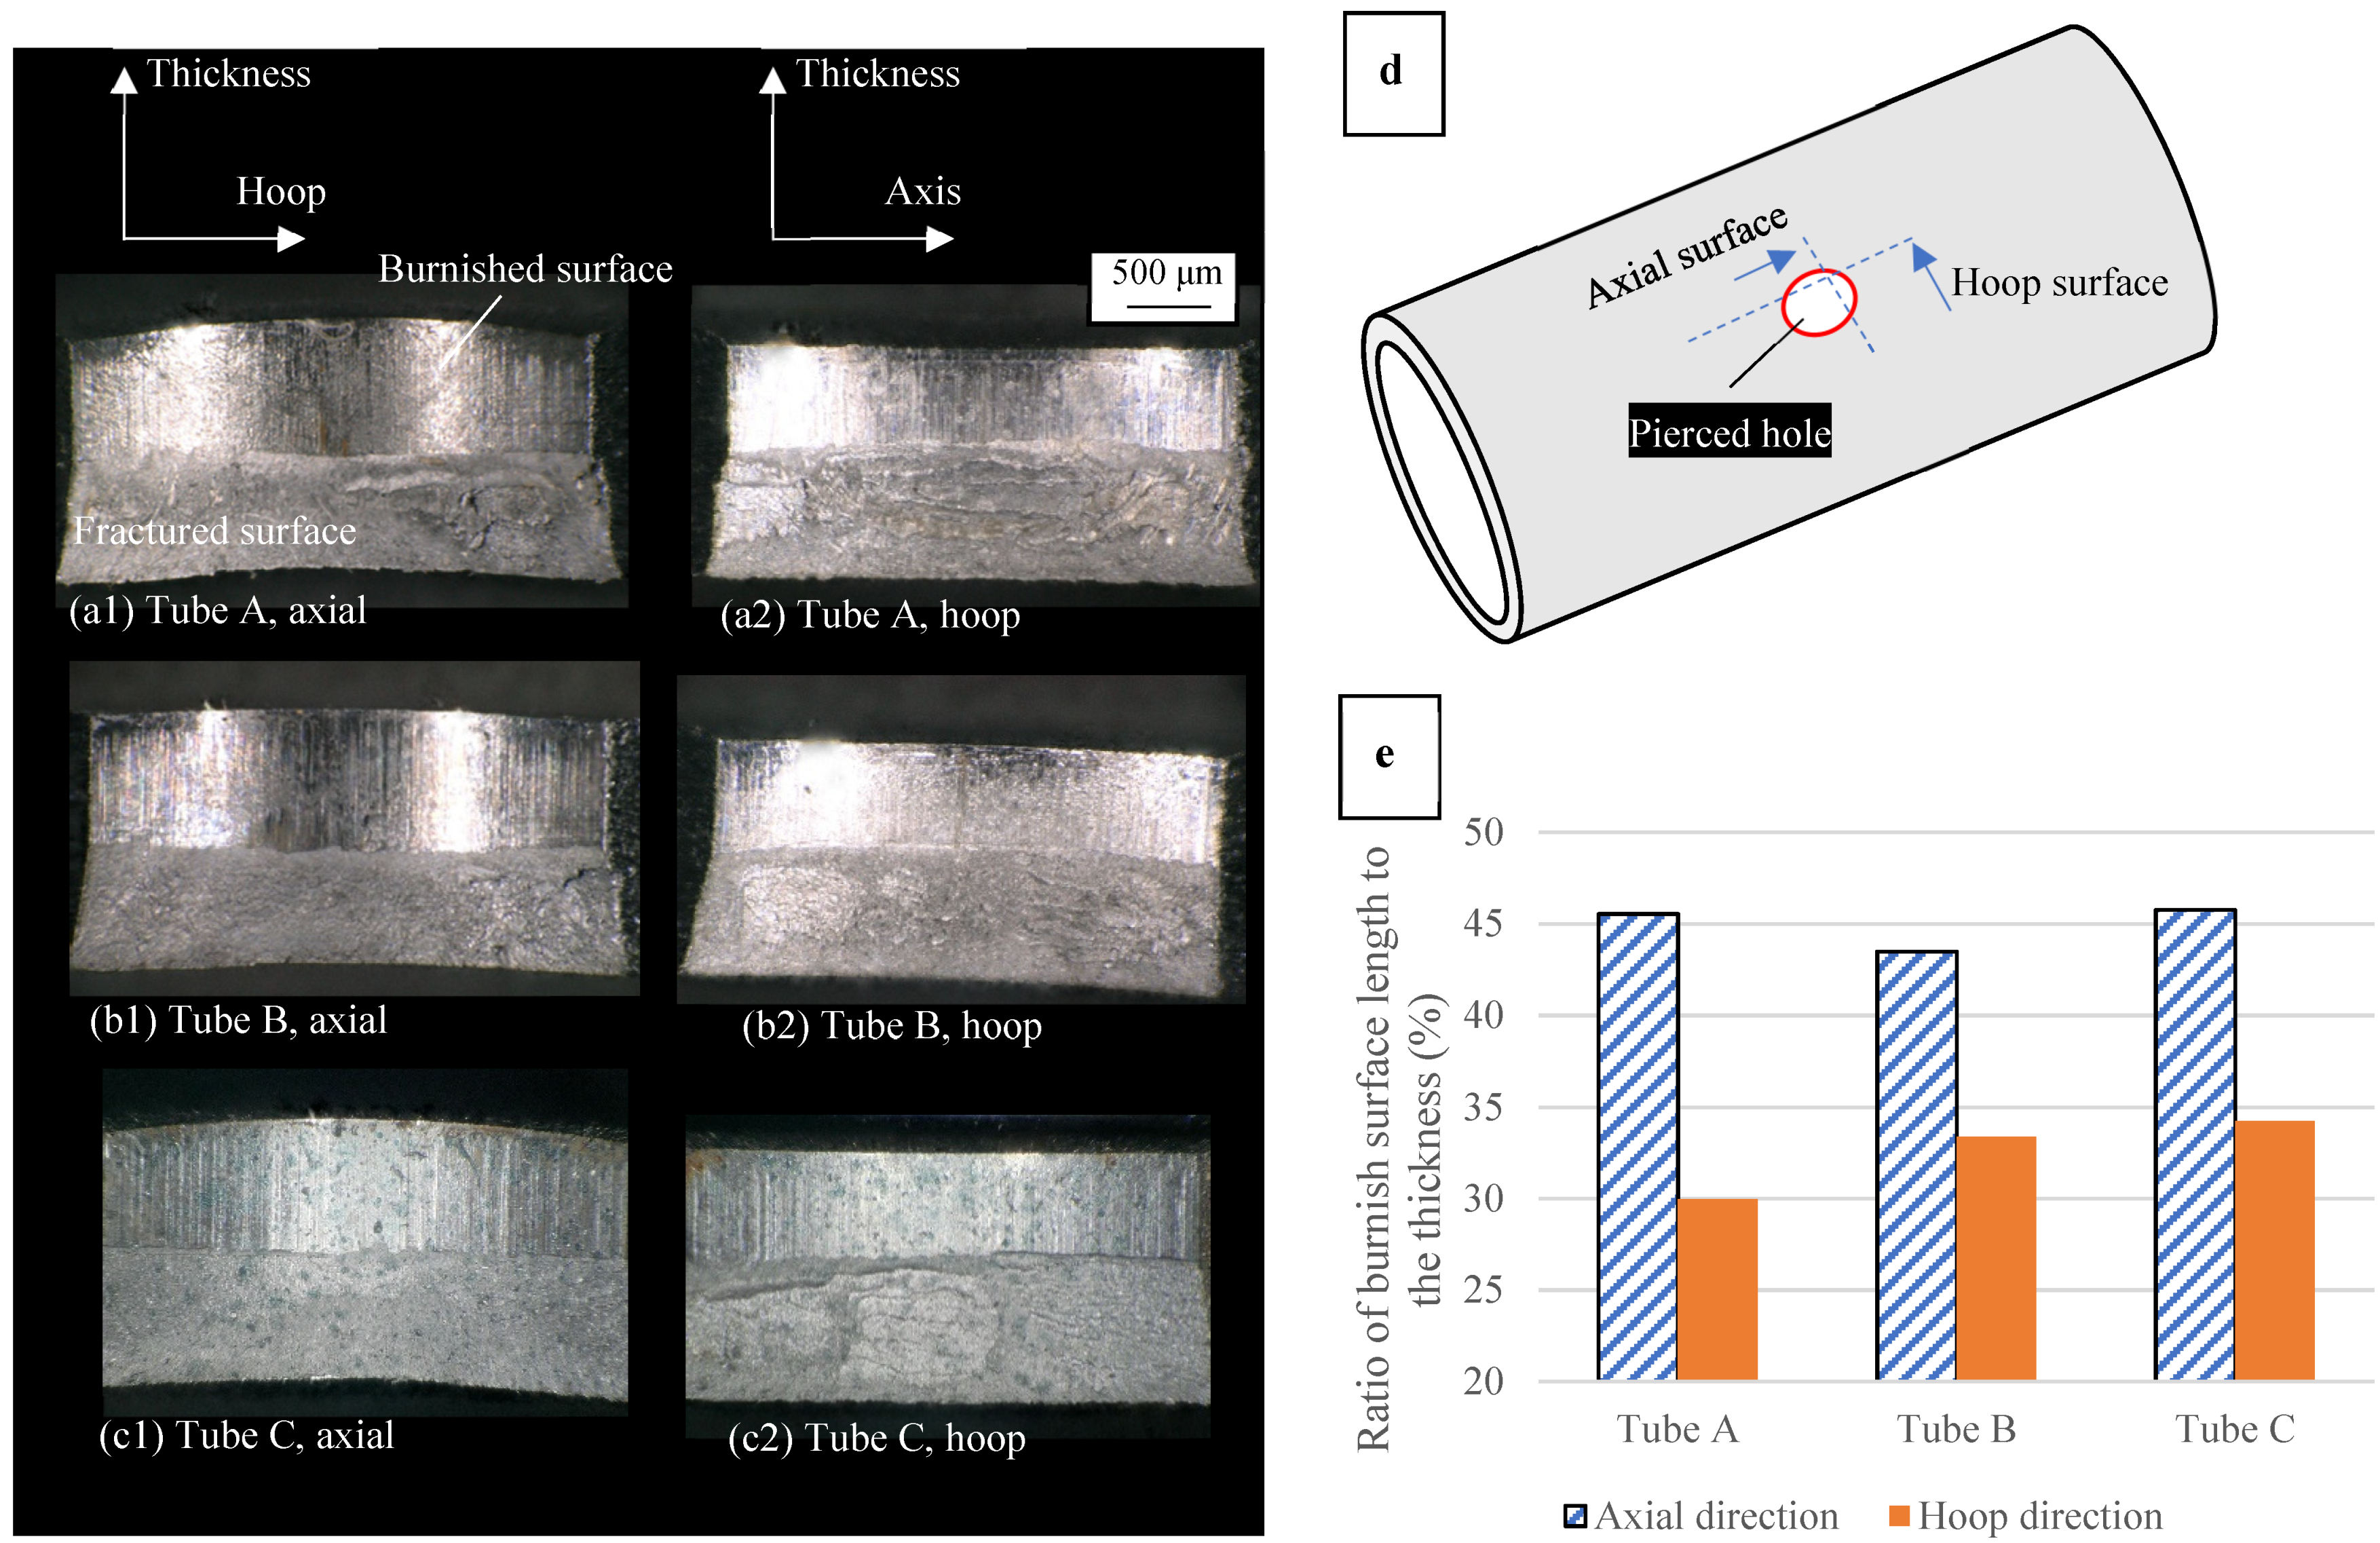
Figure 11 shows the pierced surface images (Figure 11(a1–c2)) and ratios of the burnished surface length in the tube thickness direction (Figure 11e) to the thickness of the tube. The images in the axial and hoop directions are shown, respectively, where Figure 11d defines the surface directions. From Figure 11e, the burnished surface ratios in the axial direction are larger than those in the hoop direction among all the tubes. The differences in the burnished surface ratios were very small. The maximum values of these differences are in the hoop directions between tubes A and C, which resulted in a 4% higher burnished surface of tube C than that of tube A in the hoop direction. For the axial surfaces, the difference in the burnished ratio was approximately 1%, among the three tubes.
Notably, the hoop surface in tube A presents the same type of bandings as those on the fracture surface of the tensile specimen (Figure 10(a2)) from Figure 11(a2).

4. Discussion

4.1. Work-Hardening

In the axial direction, the initial yield stresses and tensile strengths evaluated by the small round-bar tensile tests were similar to the tube tensile test. Taking into account the differences in specimen shape from the tube tension, the small round-bar tensile test successfully measured the nominal stresses of the tubes. The ellipsoidal fracture surfaces of tubes A (hoop direction) and C (both directions) shown in Figure 10(a1,c1,c2) caused evaluation errors of cross-sectional reduction ratio ρ , as mentioned in Section 2.3. The aspect ratios of the fracture surfaces were 78% for tube A in the hoop direction, and 78% and 88% for tube C in each direction. Thus, the actual strains ε ¯   ( ρ ) were lower than the evaluations in these cases.
The difference in the flow stresses to the tensile directions is as discussed in a microstructural view below. As shown in Figure 2, the grains of the tubes are elongated across the axial direction by the cold drawing process. As Serrano et al. [34] reported, such elongated grains do not affect the initial yield stresses and tensile strengths for other types of steel in the elongated and orthogonal directions. The results do not agree with those in this study, where the yield stresses in the hoop direction, i.e., orthogonal direction to the grain elongation, were higher than those in the axial directions. The microstructures in tubes A and B include hard carbide; thus, they are not simple single-phase materials. However, even for heterogeneous microstructures, including hard-phase, hard-phase elongation decreases orthogonal yield stress and does not change orthogonal tensile strength [35]. This result also does not agree with the results of this study. Therefore, microstructure anisotropy seems not to affect the flow stresses in the steel tubes directly.
The cold-drawn process most likely caused the higher flow stresses in the hoop direction. While the steel tubes were annealed after the cold-drawn process as mentioned in Section 2.1, the effect on the work-hardening was most likely remaining. For hoop directional tensile tests, this remaining effect acts as the orthogonal abrupt strain path change because of the cold-drawn imposed axial strain on the steel tubes. Such orthogonal abrupt strain path changes in the tensile test induced higher yield stresses than those without the path changes [36,37,38].
The above strain path change effect seems to depend on the tube type. Tube B presented an increase in the uniform elongation in the hoop direction. Thus, the work hardening behavior is completely different with and without strain path change. The microstructure of tube B most likely includes some factors to remarkably increase the flow stresses. Such different work hardening behavior induces more strain partitioning on the axial pierced-surface in the burring process. This effect suppresses the burring fracture at the hoop pierced-surface when the weakest site for fracture is the hoop pierced-surface. At this moment, we are unable to discern the microstructural factors that induce such a high non-proportional hardening effect for tube B, the analysis of which forms the future aim for our studies.

4.2. Fracture Strains

Interesting results were evaluated as a consequence of the fracture strains ε ¯ f . The anisotropy of the ε ¯ f s varied with the tube types. Tube A presented an inferior ε ¯ f in the hoop direction, tube B presented nearly the same ε ¯ f in both directions, and tube C presented a superior ε ¯ f in the hoop direction.
As reported by Serrano et al. [34], the ε ¯ f s presented remarkable deterioration in the orthogonal tension to the grain elongation. The ε ¯ f s for tube A agree with this result, but those for the other tubes do not agree with it. This study clarified this behavior for cold drawn thin steel tubes.
Taking into account the 0.4~0.6 stress triaxiality in the burring fracture [14], the stress-triaxiality at the necked part of the small round-bar tensile specimen was high [31]. Nevertheless, we can suppose that the estimation of the ε ¯ f superiority (inferiority) is also available at the region of the stress triaxiality in the burring fracture, because the inferior-to-superior relationship in most low carbon steels does not change in the wide stress triaxiality region [39]. Actually, the ε ¯ f s were strongly consistent with the hole expansion ratios of the wide strength range of steel sheets [33].
For the scattering of evaluations, it was lower than those in the hole-expanding test, which presented 20~30% range of scattering for the average hole-expanding ratio [4]. Scattering in the fracture test is an unavoidable problem, and we regarded it as compoundable scattering in our evaluation.
Further on the topic of ε ¯ f evaluation, in tube A, the carbides aggregated at the grain boundaries, which induced the deterioration of the fracture strain in the hoop direction. From Table 1, the carbon contents in tube A are the highest of those of the three tubes. This implies that the volume fraction of the carbides in tube A is the highest. These carbides aggregated at the grain boundaries most likely induced microvoid nucleation, growth, and coalescence through elongated grains from the specimen edge to edge, which was expressed as a banding structure on the fracture surface.
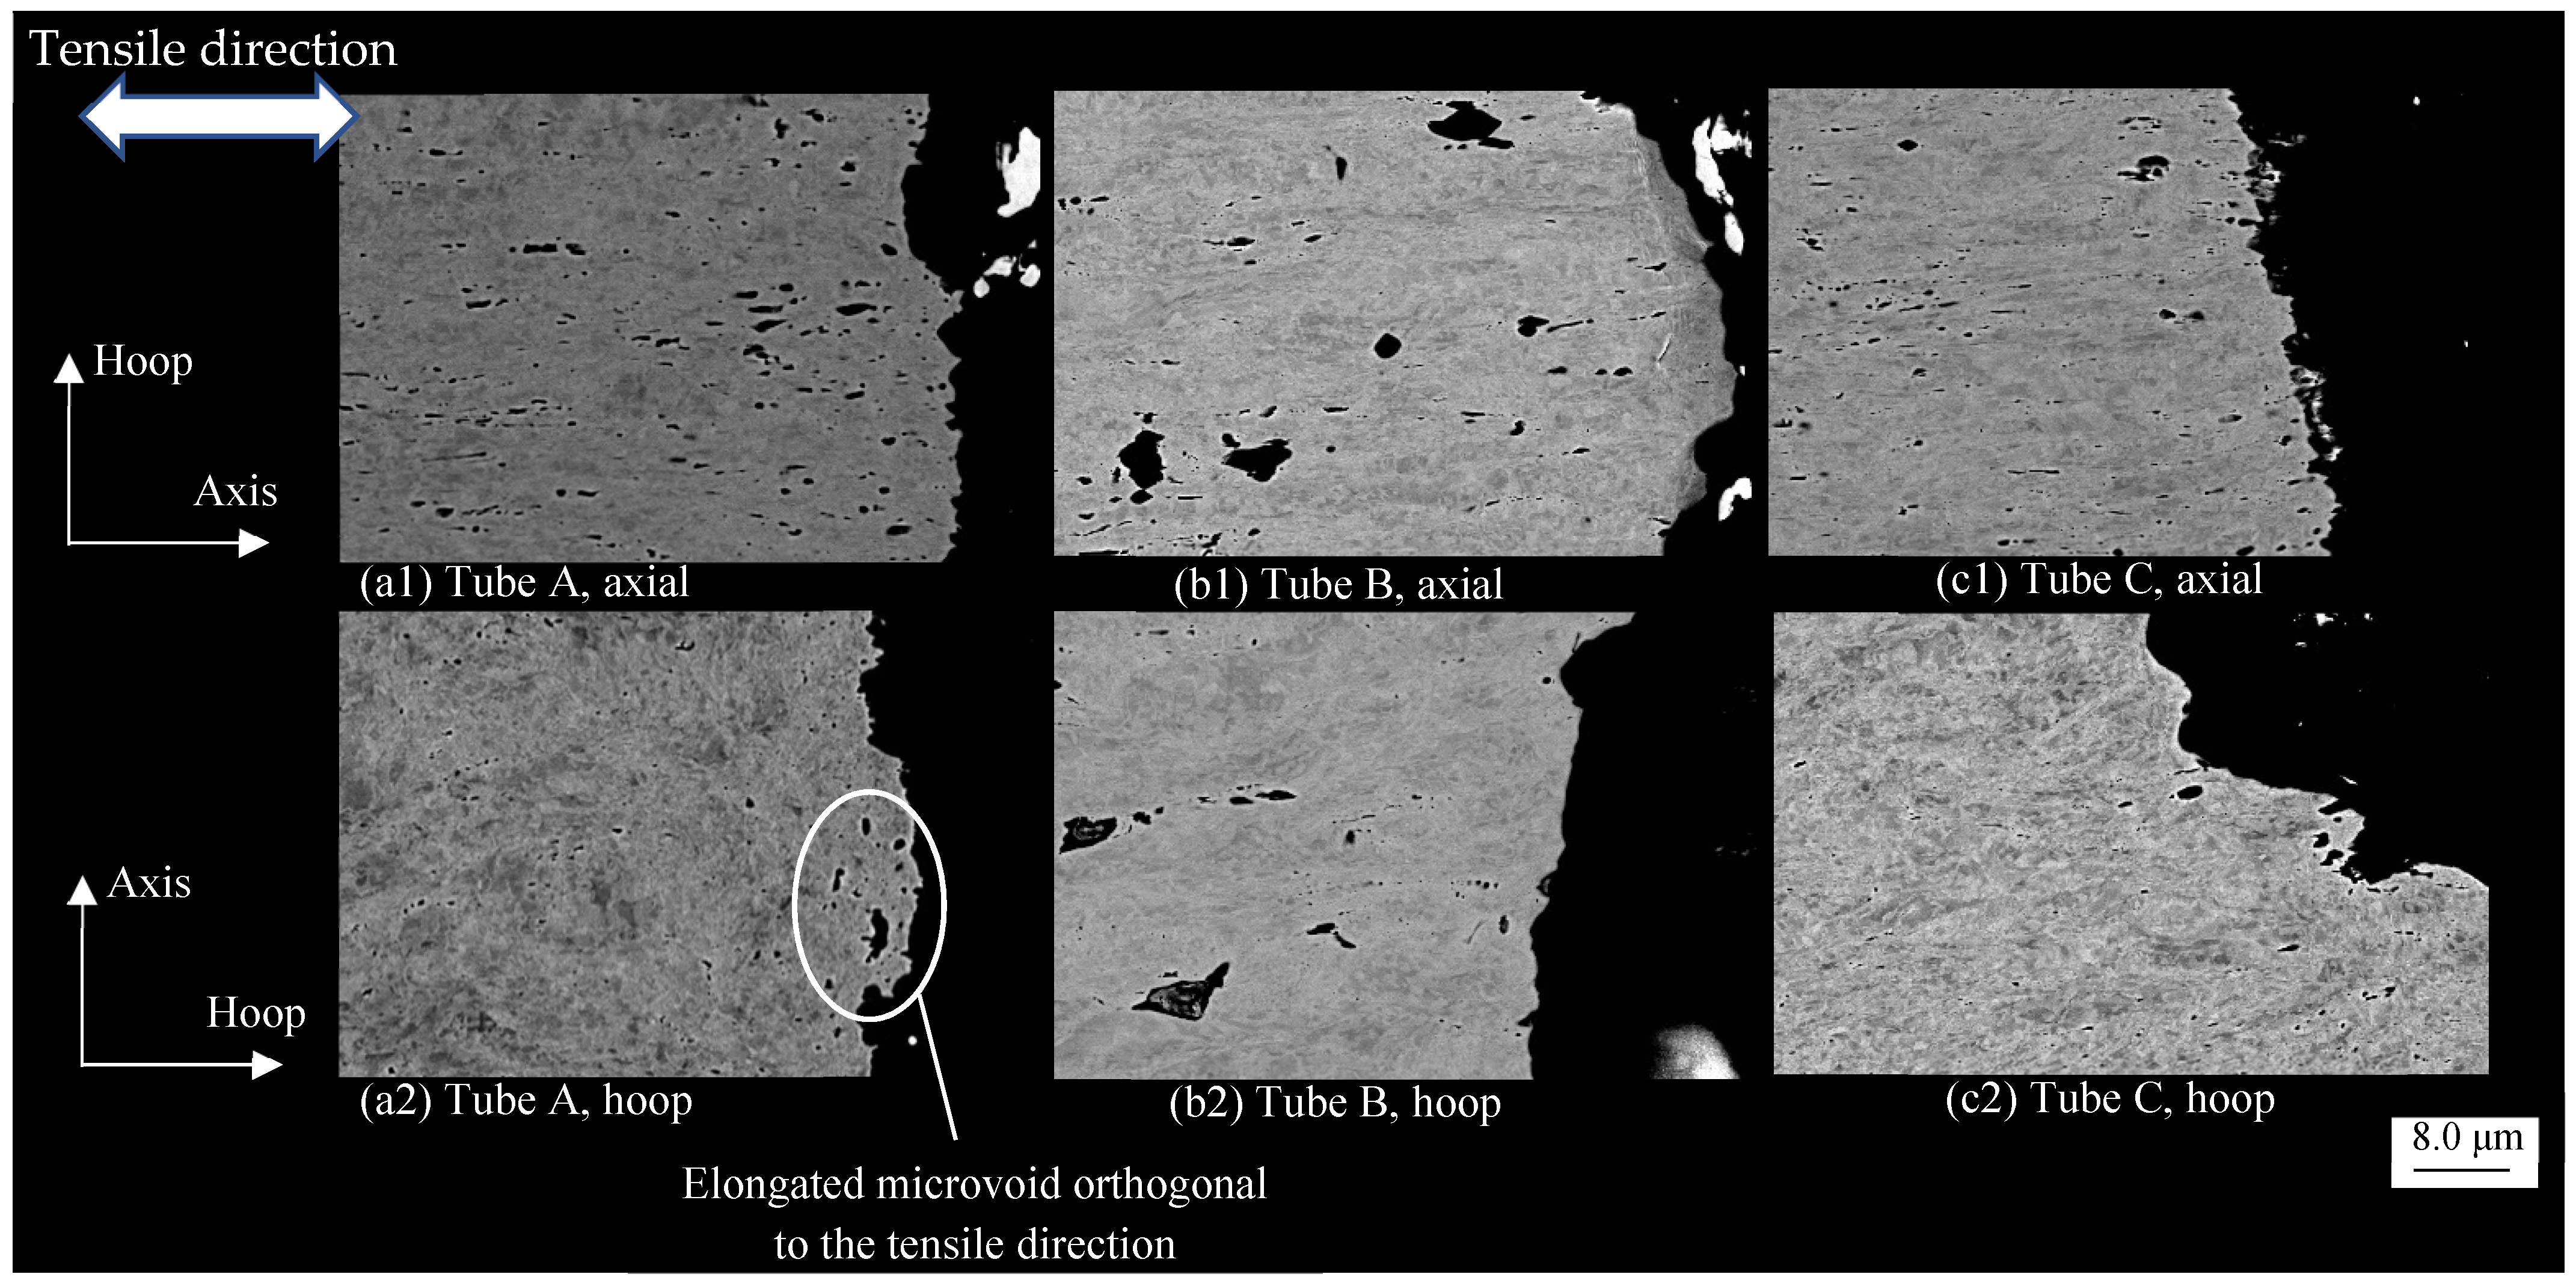
SEM images of the specimen cross-section around the fracture surface support this consideration (see Figure 12). Except for tube A in the hoop direction (Figure 12(a2)), the microvoids were elongated along the tensile direction. This microvoid elongation occurs due to the microcracks opening along the tensile direction [40]. In contrast, the microvoid in the tube A of the hoop directional tension presents elongation orthogonal to the tensile direction, where this microvoid growth or linkage direction accelerates specimen fracture. Microvoid elongation along the tensile direction was rarely seen in the hoop directional fracture surface of the tube A.
This irregular behavior of microvoid elongation in the hoop directional tension of the tube A is caused by carbides aggregated on the elongated grain boundaries. From Figure 2, the tube A presented the axially elongated grain boundaries and carbide aggregations. The microcracks percolated through these aggregated carbides and were expressed as elongated microvoids, orthogonal to the tensile direction in the hoop directional tension of the tube A. Tube A contains the largest volume fraction of carbides owing to the highest carbon component of the three tubes (see Table 2). Tube B also presented carbide aggregation from Figure 2(b1,b2), but its extent is relatively small. Consequently, a combination of the elongated grain and carbide aggregation on the grain boundaries induces a remarkable decrease in the hoop directional ε ¯ f .
Currently, for tube C, it is uncertain why the superior ε ¯ f was evaluated in the hoop direction. Similar behavior has not been evaluated in previous reports. In our opinion, the material damage in the cold-drawn process possibly induced such irregular anisotropy of the ε ¯ f s. The relationship between tensile direction and microstructure morphology decides the sites of microvoid generation [41]. If some microstructural sites were damaged during the cold-drawing, these damages subsequently grow in the axial tension direction, because the relationship of the tensile direction and microstructure is the same as that in the cold-drawing process. On the other hand, the damage generated in the cold-drawing process does not affect the newly generated damage in the hoop directional tension because the deformation direction was different from that in the cold-drawn process. This assumption will be verified in our future studies.

4.3. Possibility of Easy Formability Check by Piercing Test

The piercing test detected the remarkable lower ε ¯ f in the hoop directional tension for tube A. The burnished surface ratio, shown in Figure 11e, shows the lower value of tube A in the hoop direction than those of the other tubes. In the piercing process, the burnished surface is formed by plastic deformation. Thus, the large burnished surface implies high ε ¯ f of the materials. Additionally, Figure 11(a2) shows the same type of bandings on the fracture surface for tube A in the hoop direction. These bandings also imply ε ¯ f deterioration in the hoop directional tension. The axial fracture surface also presented the bandings, but to a much lesser extent, when compared with those on the hoop directional fracture surface.
Despite the successful detection of the above, the application of the piercing tests was limited to the cases of large ε ¯ f differences. In our study, the difference of the ε ¯ f s in the hoop direction was approximately 30% between tubes A and B, while the burnished surface ratio differs by only 4%. The difference of the burnished surface ratio is very small for the tube types in each direction.
This small difference is caused by the crack’s propagation from the axial surface to the hoop surface side. In the piercing tests, the axial surface was formed before that of the hoop surface because the flathead punch first contacted the superior convex portion of the tubes. Therefore, the crack nucleation on the axial surface occurred earlier than that on the hoop surface. Then, the cracks nucleated on the axial surface and propagated to the hoop surface side to induce high stress-triaxiality; and accelerated the crack nucleation on the hoop surface to become an obstacle for the expression of the ε ¯ f difference for the tube type in the hoop direction. Indeed, the burnished surface ratio on the hoop surface was much smaller than that on the axial surface.
The piercing test can be improved so that axial and hoop surfaces are formed at the same time by adjusting the punch head shape to the tube surface. This improvement will provide a more accentuated difference to the burnished surface ratio in the hoop direction, and it would be effective for preliminary formability estimation for burring.

5. Summary

The study evaluated the fracture strains of cold-drawn and heat-treated steel tubes of 1.8 mm thickness. Preliminary estimation for tube-burring formability has been determined, and the fracture strains represent this phenomenon. The tensile test with the small round bar, whose diameter is 1.0 mm, was done for the fracture strain evaluation in both the axial and hoop directions for three types of steel tubes.
The results are as follows:
(i)
The flow stresses in the hoop direction were higher than those in the axial direction. One steel tube presented higher tensile strength in the hoop direction, but others presented almost the same tensile strength for the tensile direction. The abrupt strain-path changes from the cold-drawn process caused such a behavior;
(ii)
The anisotropy of the fracture strains varied with the tube types. Inferior, nearly the same, and superior hoop directional fracture strains were presented using one tube each and compared to the axial strains. The tube exceeding 40% deterioration was presented for the hoop directional fracture strain;
(iii)
The remarkable fracture strain deterioration in the hoop direction occurred by a combination of grain elongation and carbide aggregation on grain boundaries. SEM images suggest that the microvoid growth and linkage percolated thorough carbides on elongated grain boundaries.
Further, an attempt was made to use the piercing test to estimate the fracture strain. The low fracture strain was expected to result in a low burnished surface ratio, that is, a high fracture surface ratio on the pierced surface. The test could successfully detect the remarkable low fracture strain as the low burnished surface ratio, but the difference was small. Thus, the application of the piercing test was limited to the cases for large fracture strain differences.
The study clarified the above fracture strain behavior for the cold-draw and heat-treated thin-walled steel tubes. We believe that the results can be applied to material selection or preliminary identification of material defects for the actual tube-burring process. Some uncertainties remained about the mechanism of fracture strain anisotropy. The case of superior hoop directional fracture strain is an especially attractive topic for mechanism analysis because of the microstructures. We will clarify this phenomenon in a future study.

Author Contributions

Conceptualization, methodology, validation, writing—original draft preparation, T.M. (Takashi Matsuno); methodology, T.M. (Tomoko Matsuda); supervision, H.S. and M.O. All authors have read and agreed to the published version of the manuscript.

Funding

This research received no external funding.

Institutional Review Board Statement

Not applicable.

Informed Consent Statement

Not applicable.

Data Availability Statement

Not applicable.

Acknowledgments

We gratefully acknowledge the work of past member of Tottori University laboratory; Iori Sanou.

Conflicts of Interest

The authors declare no conflict of interest.

References

  1. Teramae, T.; Manabe, K.; Ueno, K.; Nakamura, K.; Takeda, H. Effect of material properties on deformation behavior in incremental tube-burring process using a bar tool. J. Mater. Processing Technol. 2007, 191, 24–29. [Google Scholar] [CrossRef]
  2. Takahashi, M. Development of high strength steels for automobiles. Nippon. Steel Tech. Rep. 2003, 88, 2–7. Available online: https://www.nipponsteel.com/en/tech/report/nsc/pdf/n8802.pdf (accessed on 19 April 2022).
  3. Takahashi, Y.; Kawano, O.; Horioka, S.; Ushioda, K. Improvement of Stretch Flangeability of High-Tensile-Strength Steel Sheets by Piercing under Tension Using Humped Bottom Punch; SAE Technical Paper; Article No. 2013-01-0609; SAE International: Warrendale, PA, USA, 2013. [Google Scholar] [CrossRef]
  4. Matsuno, T.; Sato, K.; Okamoto, R.; Mizumura, M.; Suehiro, M. Synergy Effect of shear angle and anisotropic material ductility on hole-expansion ratio of high-strength steels. J. Mater. Processing Technol. 2016, 230, 167–176. [Google Scholar] [CrossRef]
  5. Mori, K.I.; Abe, Y.; Suzui, Y. Improvement of stretch flangeability of ultra high strength steel sheet by smoothing of sheared edge. J. Mater. Processing Technol. 2010, 210, 653–659. [Google Scholar] [CrossRef]
  6. Toyoda, S.; Suzuki, K.; Sato, A. High strength steel tubes for automotive suspension parts—High strength steel tubes with excellent formability and forming technology for light weight automobiles. JFE Tech. Rep. 2004, 4, 28–32. [Google Scholar]
  7. Takahashi, M.; Kawano, O.; Hayashida, T.; Okamoto, R.; Taniguchi, H. High strength hot-rolled steel sheets for automobiles. Nippon. Steel Tech. Rep. 2003, 88, 8–12. Available online: https://www.nipponsteel.com/en/tech/report/nsc/pdf/n8803.pdf (accessed on 19 April 2022).
  8. Masamura, K.; Nagahama, Y. Manufacturing processes and products of steel pipes and tubes in JFE Steel. JFE Tech. Rep. 2006, 7, 1–6. [Google Scholar]
  9. Yoshida, K.; Kuwabara, T. Effect of strain hardening behavior on forming limit stresses of steel tube subjected to nonproportional loading paths. Int. J. Plast. 2007, 23, 1260–1284. [Google Scholar] [CrossRef]
  10. Kuwabara, T.; Sugawara, F. Multiaxial tube expansion test method for measurement of sheet metal deformation behavior under biaxial tension for a large strain range. Int. J. Plast. 2013, 45, 103–118. [Google Scholar] [CrossRef]
  11. Kim, K.H. Evolution of anisotropy during twisting of cold drawn tubes. J. Mech. Phys. Solids 1992, 40, 127–139. [Google Scholar] [CrossRef]
  12. Sawamiphakdi, K.; Lahoti, G.D.; Kropp, P.K. Simulation of a tube drawing process by the finite element method. J. Mater. Processing Technol. 1991, 27, 179–190. [Google Scholar] [CrossRef]
  13. Comstock, R.J.; Scherrer, D.K.; Adamczyk, R.D. Hole expansion in a variety of sheet steels. J. Mater. Eng. Perform. 2006, 15, 675–683. [Google Scholar] [CrossRef]
  14. Park, S.; Jung, J.; Kim, K.I.; Kim, H.; Kim, S.I.; Oh, K.H.; Han, H.N. Practical microstructure-informed dual-scale simulation for predicting hole expansion failure of hyper-burring steel. Int. J. Mech. Sci. 2019, 156, 297–311. [Google Scholar] [CrossRef]
  15. Achineethongkham, K.; Uthaisangsuk, V. Analysis of forming limit behaviour of high strength steels under non-linear strain paths using a micromechanics damage modelling. Int. J. Mech. Sci. 2020, 183, MS105828. [Google Scholar] [CrossRef]
  16. Paul, S.K.; Mukherjee, M.; Kundu, S.; Chandra, S. Prediction of hole expansion ratio for automotive grade steels. Comp. Mater. Sci. 2014, 89, 189–197. [Google Scholar] [CrossRef]
  17. Kim, J.; Kang, S.J.; Kang, B.S. A prediction of bursting failure in tube hydroforming processes based on ductile fracture criterion. Int. J. Adv. Manuf. Technol. 2003, 22, 357–362. [Google Scholar] [CrossRef]
  18. Oyane, M.; Sato, T.; Okimoto, K.; Shima, S. Criteria for ductile fracture and their applications. J. Mech. Work. Technol. 1980, 4, 65–81. [Google Scholar] [CrossRef]
  19. Aue-u-Lan, Y.; Ngaile, G.; Altan, T. Optimizing tube hydroforming using process simulation and experimental verification. J. Mater. Processing Technol. 2004, 146, 137–143. [Google Scholar] [CrossRef]
  20. Magrinho, J.P.; Silva, M.B.; Centeno, G.; Moedas, F.; Vallellano, C.; Martins, P.A.F. On the determination of forming limits in thin-walled tubes. Int. J. Mech. Sci. 2019, 155, 381–391. [Google Scholar] [CrossRef]
  21. Hashemi, R.; Assempour, A.; Abad, E.M.K. Implementation of the forming limit stress diagram to obtain suitable load path in tube hydroforming considering M-K model. Mater. Des. 2009, 30, 3545–3553. [Google Scholar] [CrossRef]
  22. Marciniak, Z.; Kuczyński, K. Limit strains in the processes of stretch-forming sheet metal. Int. J. Mech. Sci. 1967, 9, 613–620. [Google Scholar] [CrossRef]
  23. Chen, X.; Li, S.; Yu, Z.; Lin, Z. Study on experimental approaches of forming limit curve for tube hydroforming. Int. J. Adv. Manuf. Technol. 2012, 61, 87–100. [Google Scholar] [CrossRef]
  24. Kim, J.H.; Kim, N.H.; Kim, Y.J.; Hasegawa, K.; Miyazaki, K. Ductile fracture simulation of 304 stainless steel pipes with two circumferential surface cracks. Fatigue Fract. Eng. Mater. Struct. 2013, 36, 1067–1080. [Google Scholar] [CrossRef]
  25. Miyazaki, K.; Nebu, A.; Ishiwata, M.; Hasegawa, K. Fracture strength and behavior of carbon steel pipes with local wall thinning subjected to cyclic bending load. Nucl. Eng. Des. 2002, 214, 127–136. [Google Scholar] [CrossRef]
  26. Oh, C.K.; Kim, Y.J.; Baek, J.H.; Kim, Y.P.; Kim, W. A phenomenological model of ductile fracture for API X65 steel. Int. J. Mech. Sci. 2007, 49, 1399–1412. [Google Scholar] [CrossRef]
  27. Tvergaard, V.; Needleman, A. Analysis of the cup-cone fracture in a round tensile bar. Acta Metall. 1984, 32, 157–169. [Google Scholar] [CrossRef]
  28. Tanguy, B.; Luu, T.T.; Perrin, G.; Pineau, A.; Besson, J. Plastic and damage behaviour of a high strength X100 pipeline steel: Experiments and modelling. Int. J. Press. Vessel. Pip. 2008, 85, 322–335. [Google Scholar] [CrossRef]
  29. Cao, Y.; Zhen, Y.; Song, M.; Yi, H.; Li, F.; Li, X. Determination of Johnson-Cook parameters and evaluation of Charpy impact test performance for X80 pipeline steel. Int. J. Mech. Sci. 2020, 179, MS105627. [Google Scholar] [CrossRef]
  30. Matsuno, T.; Shoji, H.; Ohata, M. Fracture-strain measurement of steel sheets under high hydrostatic pressure. Procedia Manuf. 2018, 15, 869–876. [Google Scholar] [CrossRef]
  31. Matsuno, T.; Hojo, T.; Watanabe, I.; Shiro, A.; Shobu, T.; Kajiwara, K. Tensile deformation behavior of TRIP-aided bainitic ferrite steel in the post-necking strain region. Sci. Technol. Adv. Mater. Methods 2021, 1, 56–74. [Google Scholar] [CrossRef]
  32. Abedini, A.; Narayanan, A.; Butcher, C. An investigation into the characterization of the hardening response of sheet metals using tensile and shear tests with surface strain measurement. Forces Mech. 2022, 7, 100090. [Google Scholar] [CrossRef]
  33. Matsuno, T. Effect of mechanical properties of steel and piercing method on hole expansion formability of high tensile strength steel sheets. SOKEIZAI 2012, 53, 2–7. (In Japanese) [Google Scholar]
  34. Serrano, M.; Hernández-Mayoral, M.; García-Junceda, A. Microstructural anisotropy effect on the mechanical properties of a 14Cr ODS steel. J. Nucle Mater. 2012, 428, 103–109. [Google Scholar] [CrossRef]
  35. Matsuno, T.; Yoshioka, T.; Watanabe, I.; Alves, L. Three-dimensional finite element analysis of representative volume elements for characterizing the effects of martensite elongation and banding on tensile strength of ferrite–martensite dual-phase steels. Int. J. Mech. Sci. 2019, 163, MS105133. [Google Scholar] [CrossRef]
  36. Vincze, G.; Barlat, F.; Rauch, E.F.; Tomé, C.N.; Butuc, M.C.; Grácio, J.J. Experiments and modeling of low carbon steel sheet subjected to double strain path changes. Metall. Mater. Trans. A 2013, 44, 4475–4479. [Google Scholar] [CrossRef] [Green Version]
  37. Bong, H.J.; Lee, J.; Lee, M.G.; Kim, D. Identification of mechanical responses of steel sheets under non-proportional loadings using dislocation-density based crystal plasticity model. Int. J. Mech. Sci. 2019, 155, 461–474. [Google Scholar] [CrossRef]
  38. Wi, M.S.; Lee, S.Y.; Kim, J.H.; Kim, J.M.; Barlat, F. Experimental and theoretical plasticity analyses of steel materials deformed under a nonlinear strain path. Int. J. Mech. Sci. 2020, 182, MS105770. [Google Scholar] [CrossRef]
  39. Lewandowski, J.J.; Lowhaphandu, P. Effects of hydrostatic pressure on mechanical behaviour and deformation processing of materials. Int. Mater. Rev. 1998, 43, 145–187. [Google Scholar] [CrossRef]
  40. Azuma, M.; Goutianos, S.; Hansen, N.; Winther, G.; Huang, X. Effect of hardness of martensite and ferrite on void formation in dual phase steel. Mater. Sci. Technol. 2012, 28, 1092–1100. [Google Scholar] [CrossRef]
  41. Matsuno, T.; Maeda, D.; Shutoh, H.; Uenishi, A.; Suehiro, M. Effect of martensite volume fraction on void formation leading to ductile fracture in dual phase steels. ISIJ Int. 2014, 54, 938–944. [Google Scholar] [CrossRef] [Green Version]
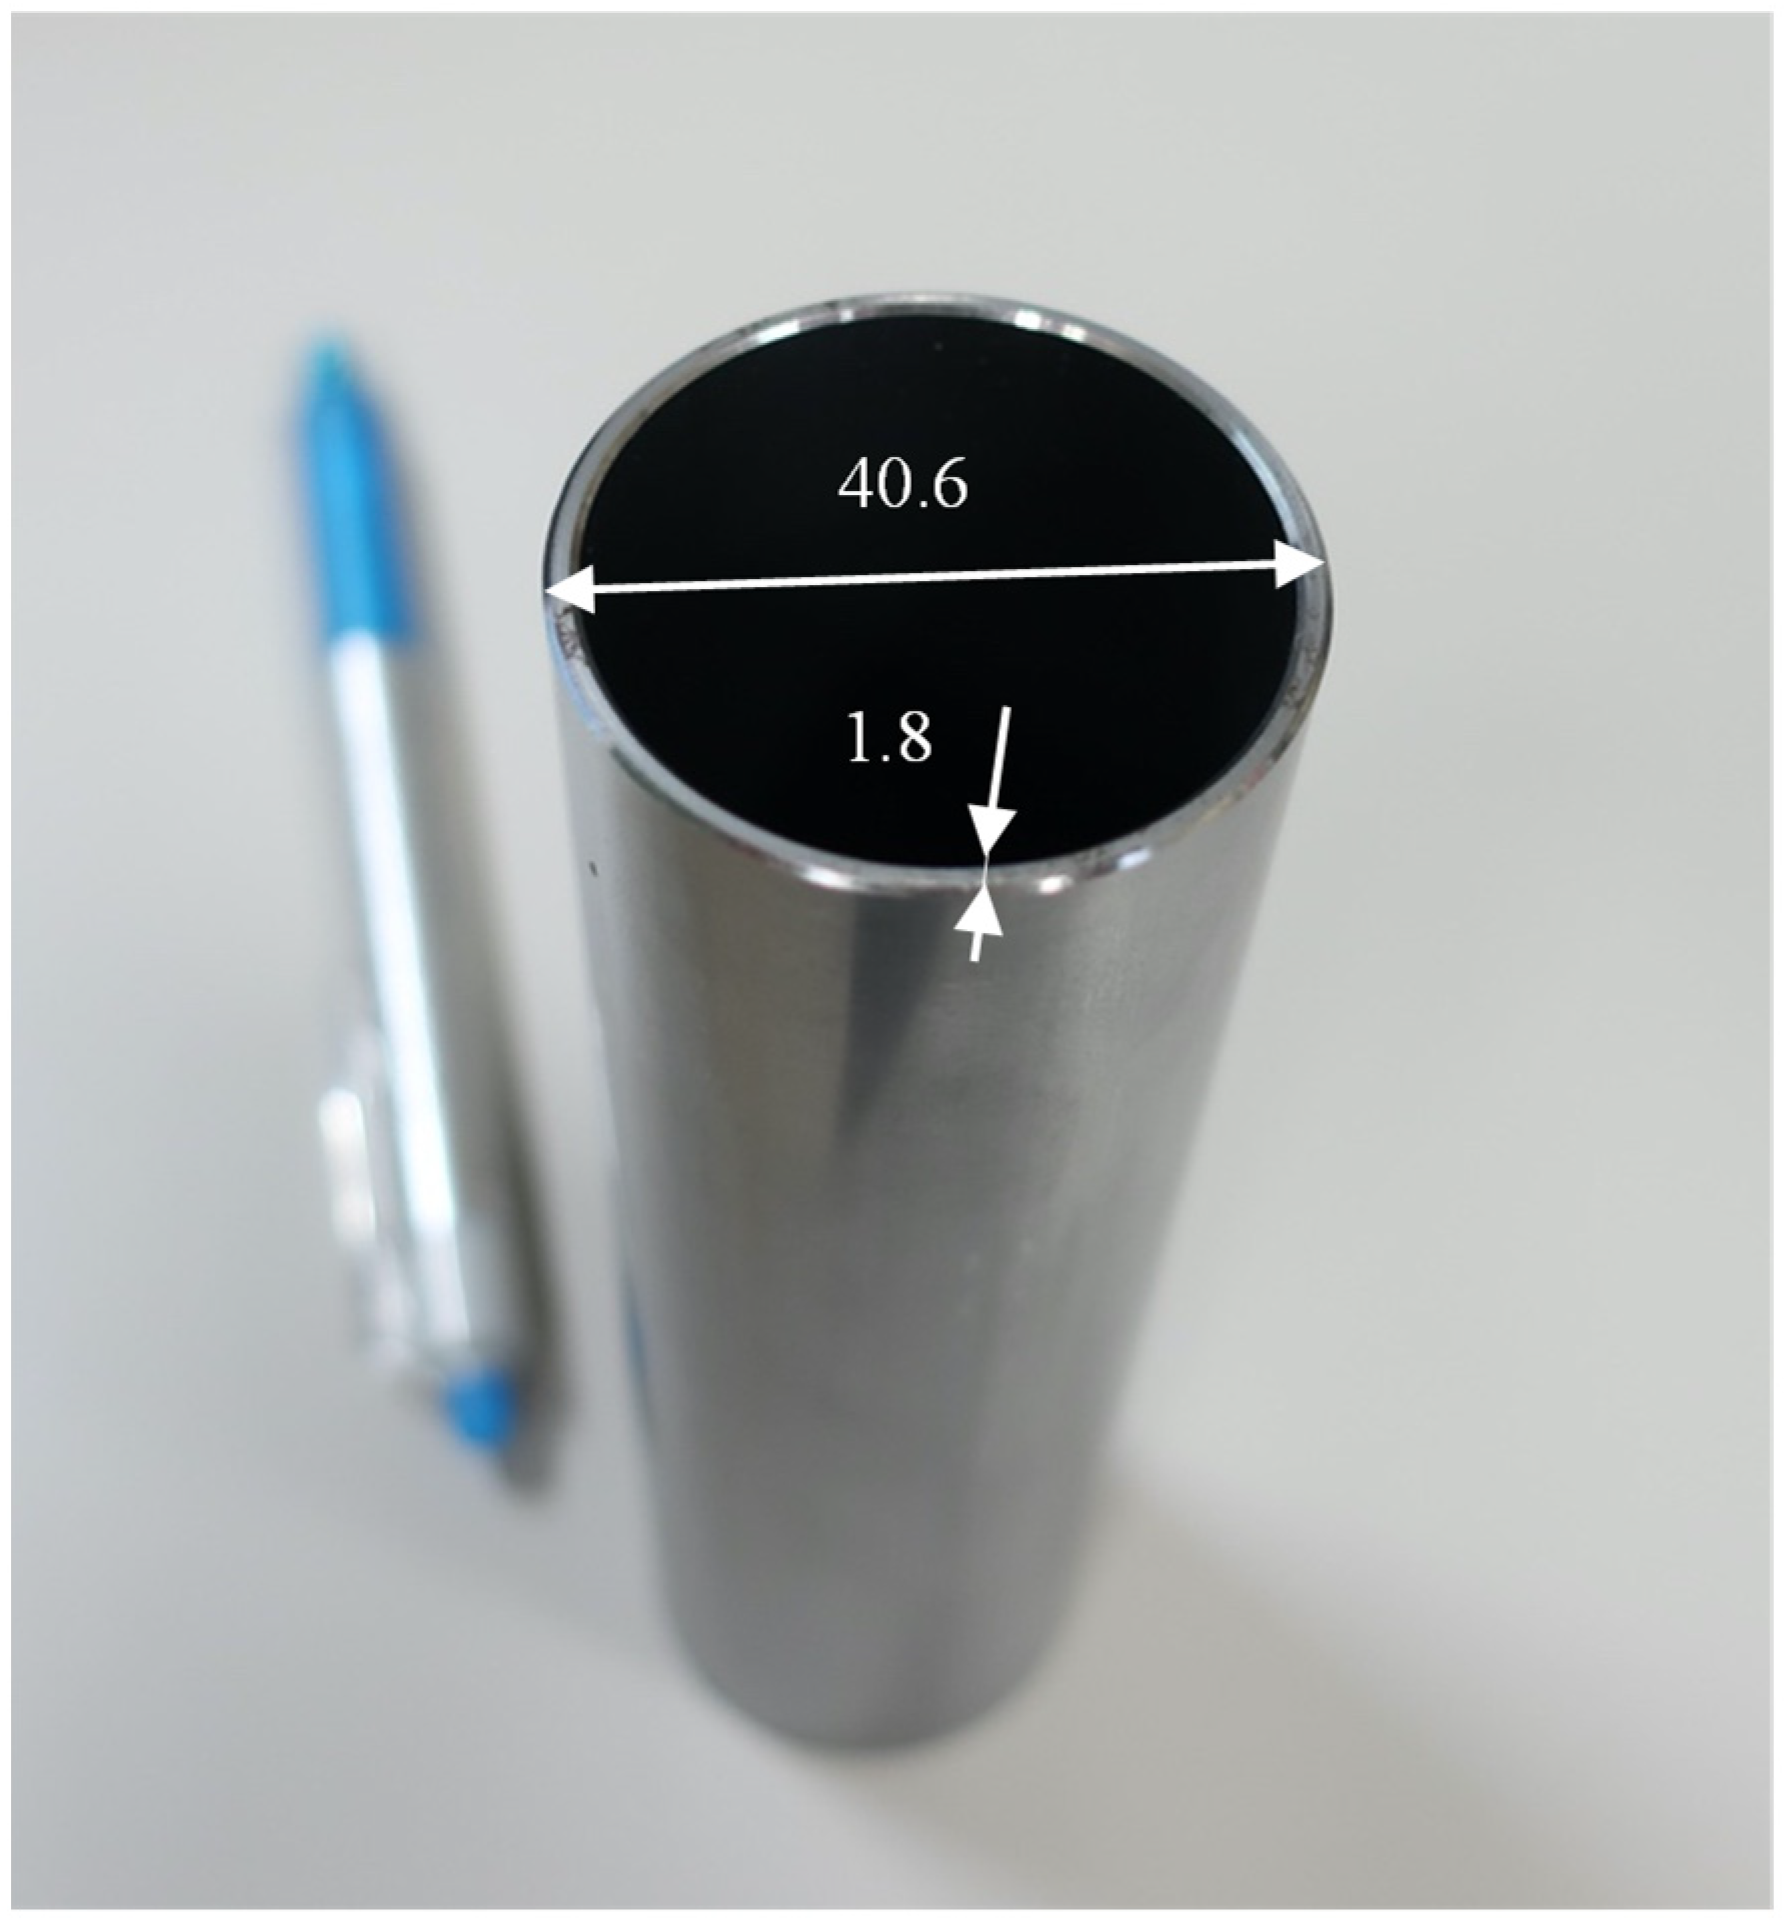
Figure 1. Steel tube appearance. Dimensions are in mm.
Metals 12 00776 g001
Figure 2. Nital-etched micro-structures of the steel tubes. (a1,a2) The axis-thickness and hoop-thickness surfaces of tube A. (b1,b2) The axis-thickness and hoop-thickness surfaces of tube B. (c1,c2) The axis-thickness and hoop-thickness surfaces of tube C.
Metals 12 00776 g002aMetals 12 00776 g002b
Figure 3. Small round-bar specimen for tensile tests. Dimensions are in mm.
Metals 12 00776 g003
Figure 4. Image of necked and fractured small round-bar specimen after the tensile test.
Metals 12 00776 g004
Figure 5. Schematic images of specimen cutting from steel tubes. (a) The relation between the steel tube and small round-bar specimen directions. (b) The hoop-directional small round-bar specimens that were cut from the steel tubes.
Metals 12 00776 g005
Figure 6. Tensile test machine for the small round-bar specimen.
Metals 12 00776 g006
Figure 7. Schematic image of piercing hole shape on the steel tubes. Dimensions are in mm.
Metals 12 00776 g007
Figure 8. Nominal stress vs. cross-sectional reduction ratio curves evaluated by using the small round-bar specimens.
Metals 12 00776 g008aMetals 12 00776 g008b
Figure 9. Fracture strain derived from the fracture surface area.
Metals 12 00776 g009
Figure 10. Fracture surface of the small round-bar specimen after tensile tests.
Metals 12 00776 g010
Figure 11. Pierced surface in each direction of the steel tubes. The figures (a1c2) present the front face images of pierced surface in each direction. The figure (d) denotes the surface directions for (a1c2). The figure (e) presents ratios of burnished surface lengths to the wall thickness. The values are evaluated from (a1c2).
Metals 12 00776 g011
Figure 12. SEM images of the tensile specimen cross-section around the fracture surface.
Metals 12 00776 g012
Table 1. Material properties of the steel tubes evaluated using tube-type tensile specimen (JIS 11) standardized by JIS Z 2241.
MaterialYield Stress
(MPa)
Tensile Strength
(MPa)
Elongation
(%)
Tube A44951133.0
Tube B51158318.2
Tube C54359332.0
Table 2. Material types and chemical components of the steel tubes (mass%).
MaterialSteel GradeMicrostructureCSiMnpS
Tube ASAE1017Ferrite-carbide0.170.070.450.0230.003
Tube BE275Ferrite-carbide0.060.1951.140.0080.002
Tube C-Bainitic ferrite0.060.11.290.0120.002
Publisher’s Note: MDPI stays neutral with regard to jurisdictional claims in published maps and institutional affiliations.