Article

Evaluation of Circumferential Mechanical Properties of Tubular Material by Flaring Test

1
School of Mechanical Engineering and Automation, Northeastern University, Shenyang 110819, China
2
Department of Mechanical Engineering, Tokyo Metropolitan University, 1-1 Minami-Osawa, Hachioji-shi 1920394, Tokyo, Japan
*
Authors to whom correspondence should be addressed.
Metals 2022, 12(5), 764; https://doi.org/10.3390/met12050764
Submission received: 20 March 2022 / Revised: 18 April 2022 / Accepted: 28 April 2022 / Published: 29 April 2022

Abstract

:
The investigation into the circumferential mechanical properties of tubular materials has been receiving increasing attention, since the tube hydroforming process has been used in the tubular materials forming field, because the circumferential mechanical properties have a significant effect on the hydroformability of the tubular materials. In the present study, a method for evaluation of the circumferential mechanical properties of the tubular materials with the flaring test was proposed. The expressions for the yield stress, strain hardening coefficient and exponent values of the tube were successfully derived based on the geometrical and mechanical relationships in the tube flaring test. To verify the reliability of this method, the calculated results of the yield stress, strain hardening coefficient and exponent values, obtained from the newly proposed method, were compared to the ones obtained with the conventional tensile tests. It was found that the method proposed in the current study is reliable, with high accuracy. The method is appropriate to evaluate the circumferential mechanical properties of the tubular materials.

1. Introduction

Tube hydroforming technology has been widely used for forming lightweight or complicated components in the automotive industry and aerospace industry, etc. [1,2,3,4,5]. To obtain the perfect hollow components with the hydroforming process, the appropriate loading path is required. The circumferential mechanical properties of tubular materials have a significant influence on the deformation behavior of the tubular materials during the hydroforming process. Hence, to establish an appropriate hydroforming process with suitable loading path, investigations into the circumferential mechanical properties of the tubular materials are needed. As one of the most simple and popular tube-end-forming processes, the tube flaring process has already been widely used to evaluate the hydroformability of tubular material and manufacture the products, such as revolution vessels, connection between tubes, etc. [6,7,8,9,10]. Pushing a conical tool into a tube, which is axially immovably supported at its bottom, or pushing a tube in its axial direction on a spatially fixed conical tool to expand the end of the tubular material is understood as tube flaring [11,12]. As one of the evaluation means of circumferential mechanical properties and formability of the tubular materials, the tube flaring test features many advantages compared to other methods, since it is easy to implement and has high accuracy because of its simple equipment and process. Many research reports have focused on the tube flaring test. The main factors that influence the deformation behavior of the tube during the flaring tests with the conical tools [13], the analytical expressions of relationships of the flaring ratio and strain rate of the tube end with the stroke and velocity of the conical tools in the tube flaring process [12] and the analytical expressions for determining the stress and strain fields, as well as the force required for driving the expansion [14], have been reported in previous research. The stress and strain state of the conical blanks during the flaring test with a rigid punch was also studied [15,16]. The effect of the conical tool angle on the flaring limit of the micro tube in the flaring test was investigated by Mirzai et al., and the results showed that the flaring limit increases with the increase in the conical tool angle [17]. To obtain the relationship between the flaring limit and hydroformability, Manabe et al. investigated the strain correlations of the steel tubes in the flaring tests and in the various bulge tests [7]. The results show that the flaring test is feasible to evaluate the hydroformability of the tubes, and with the same conical tool, the tube that has a higher flaring limit shows better hydroformability. The authors of this study also successfully evaluated the hydroformability and studied the deformation behavior and the effect of conical tool vertex angle on the flaring limit of the TRIP seamless steel tubes with the flaring test [6].
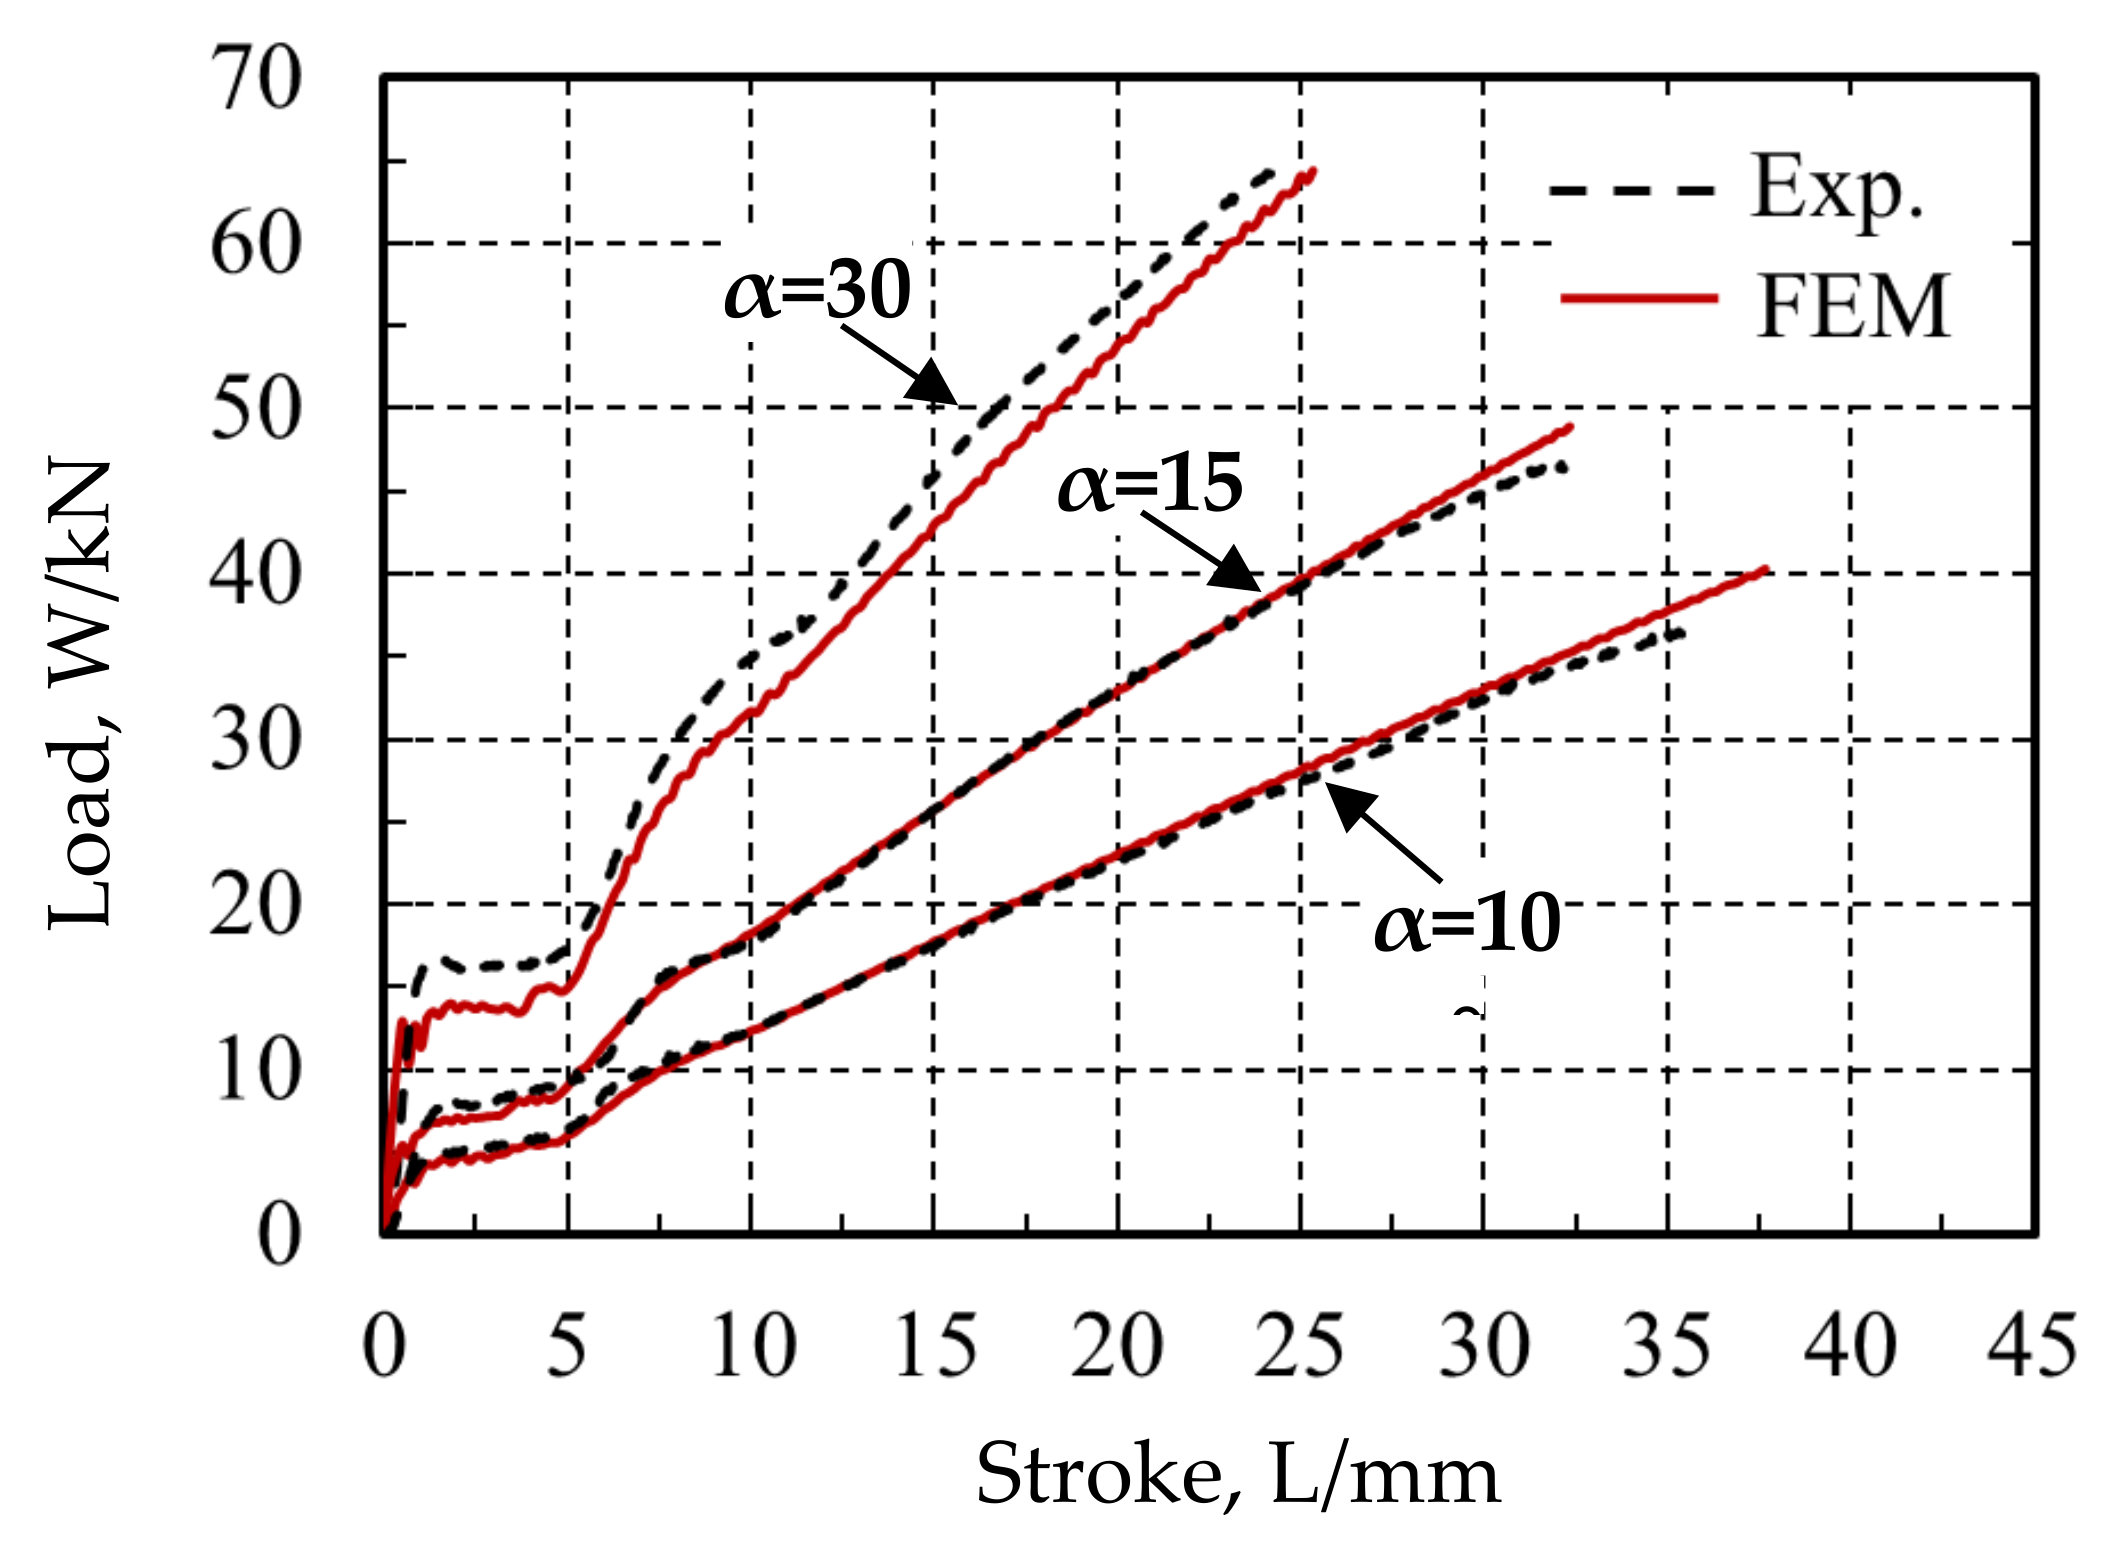
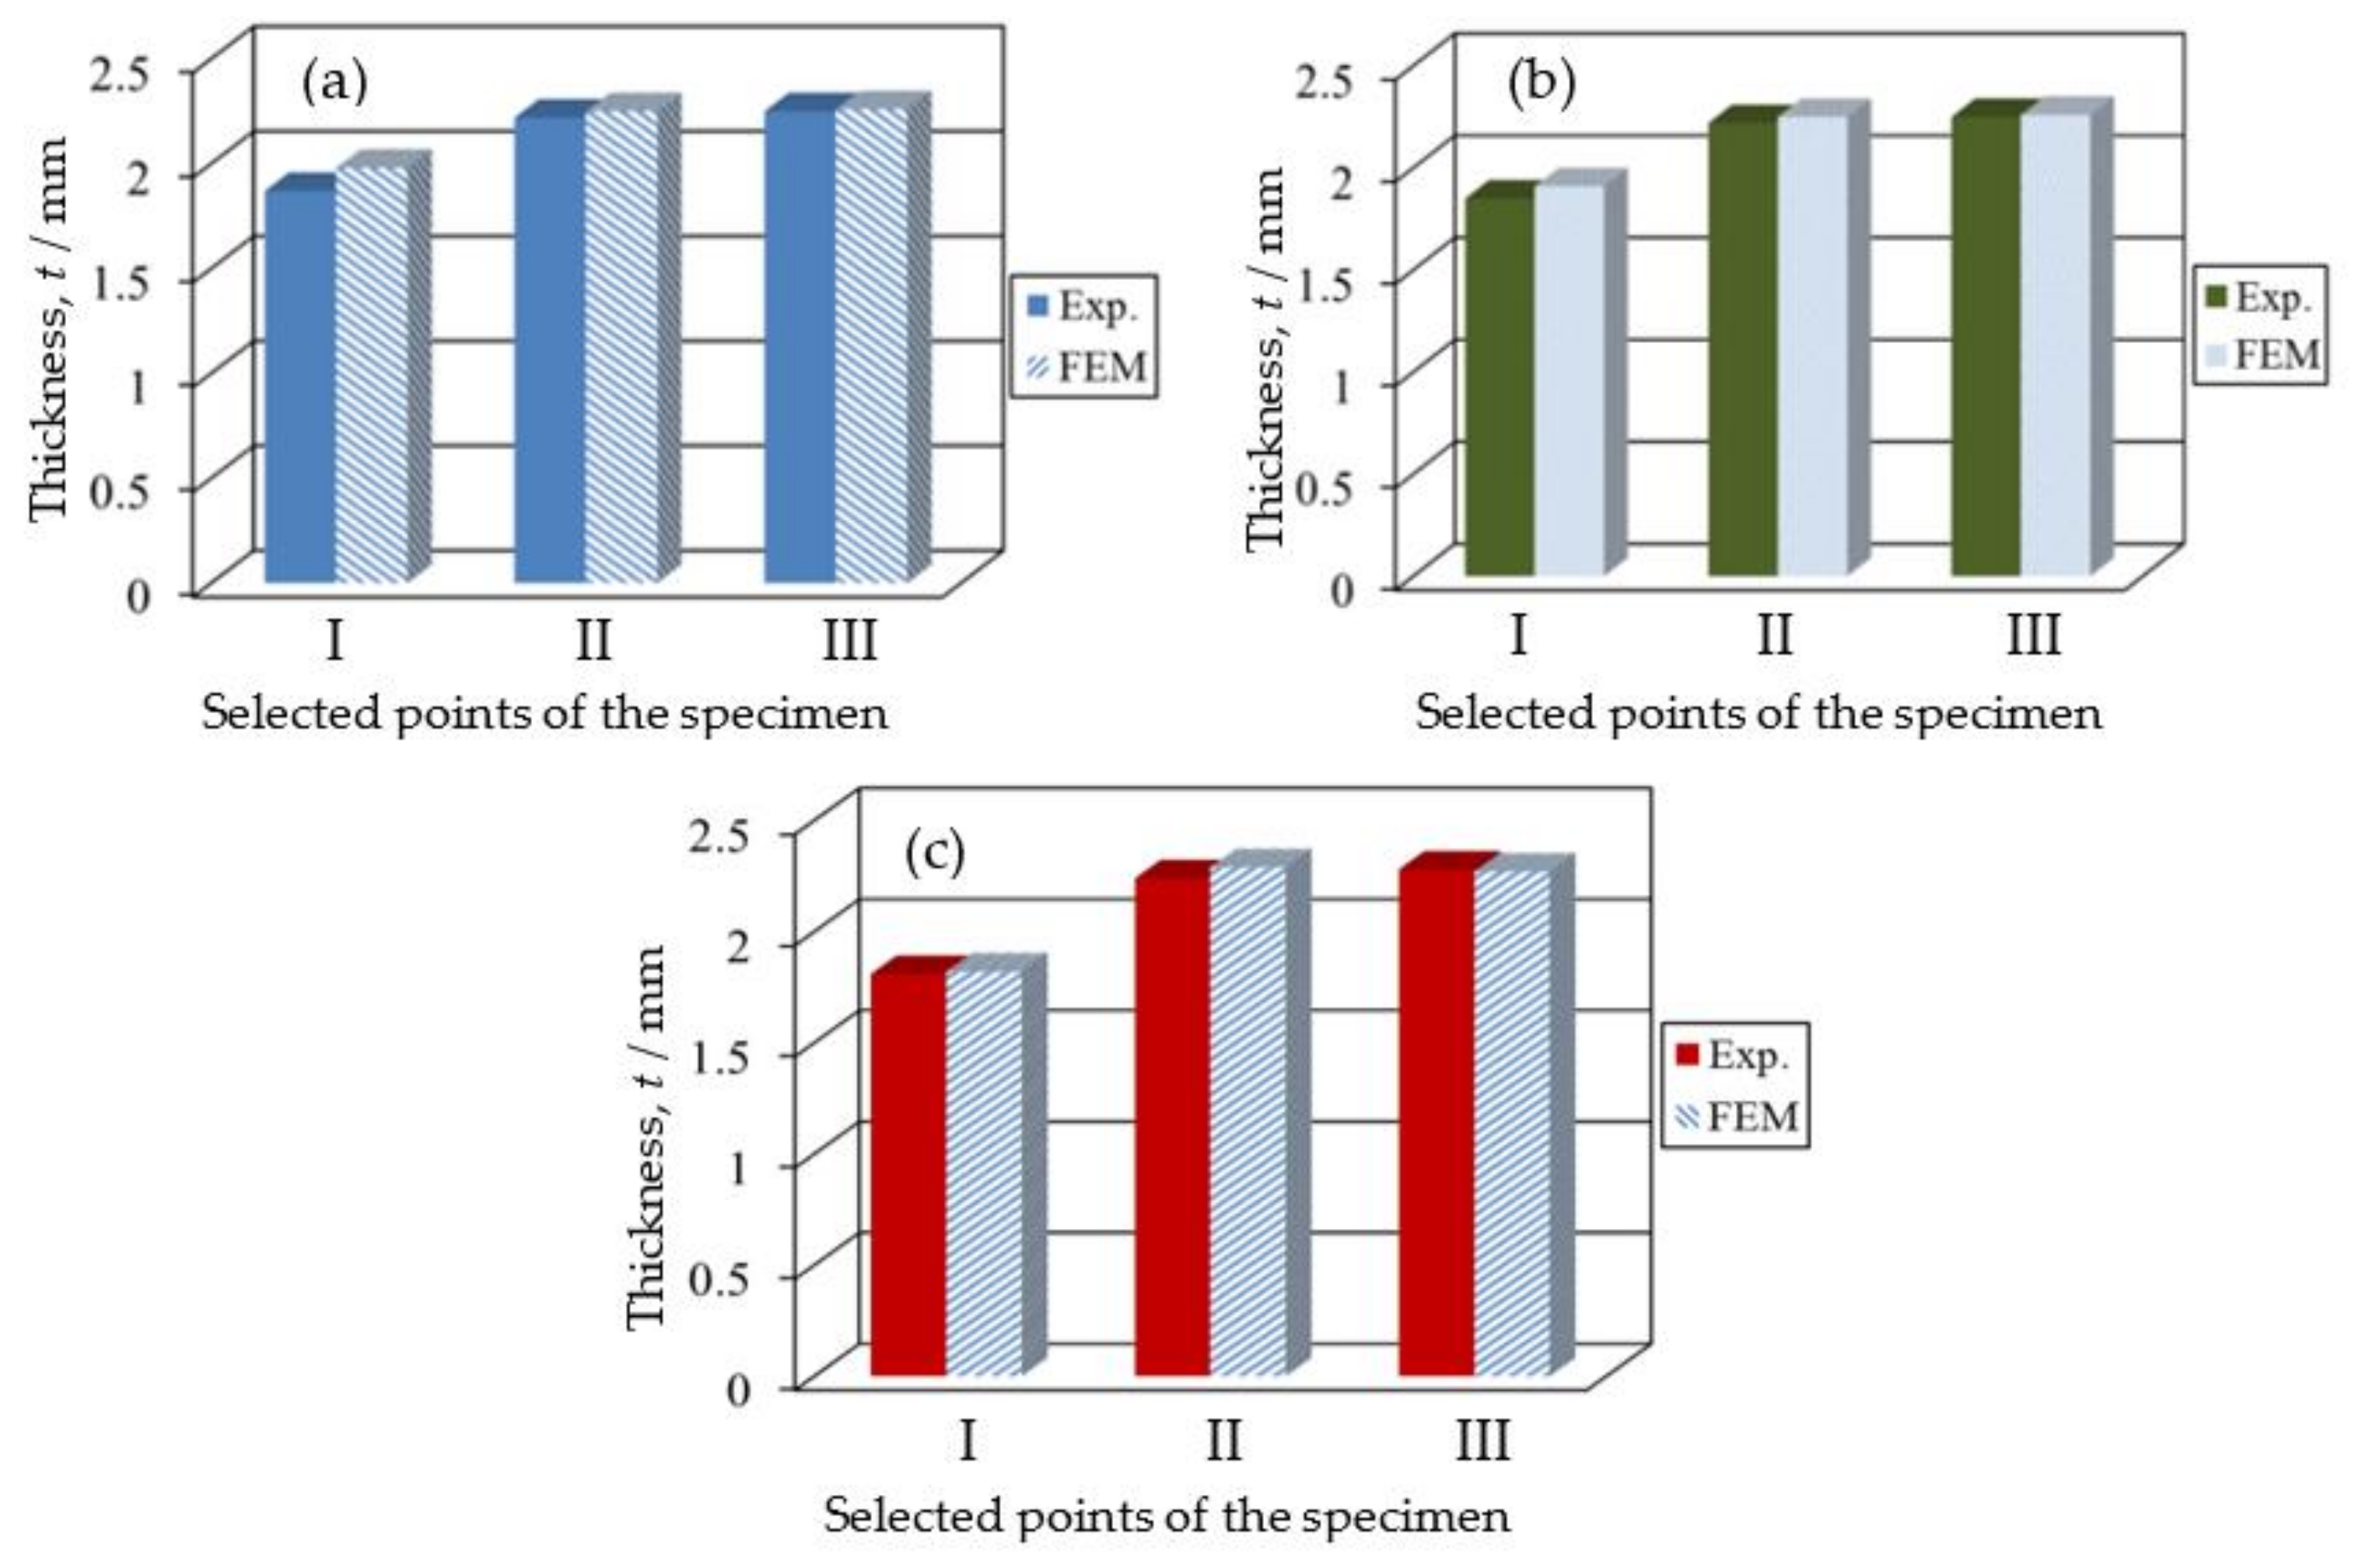
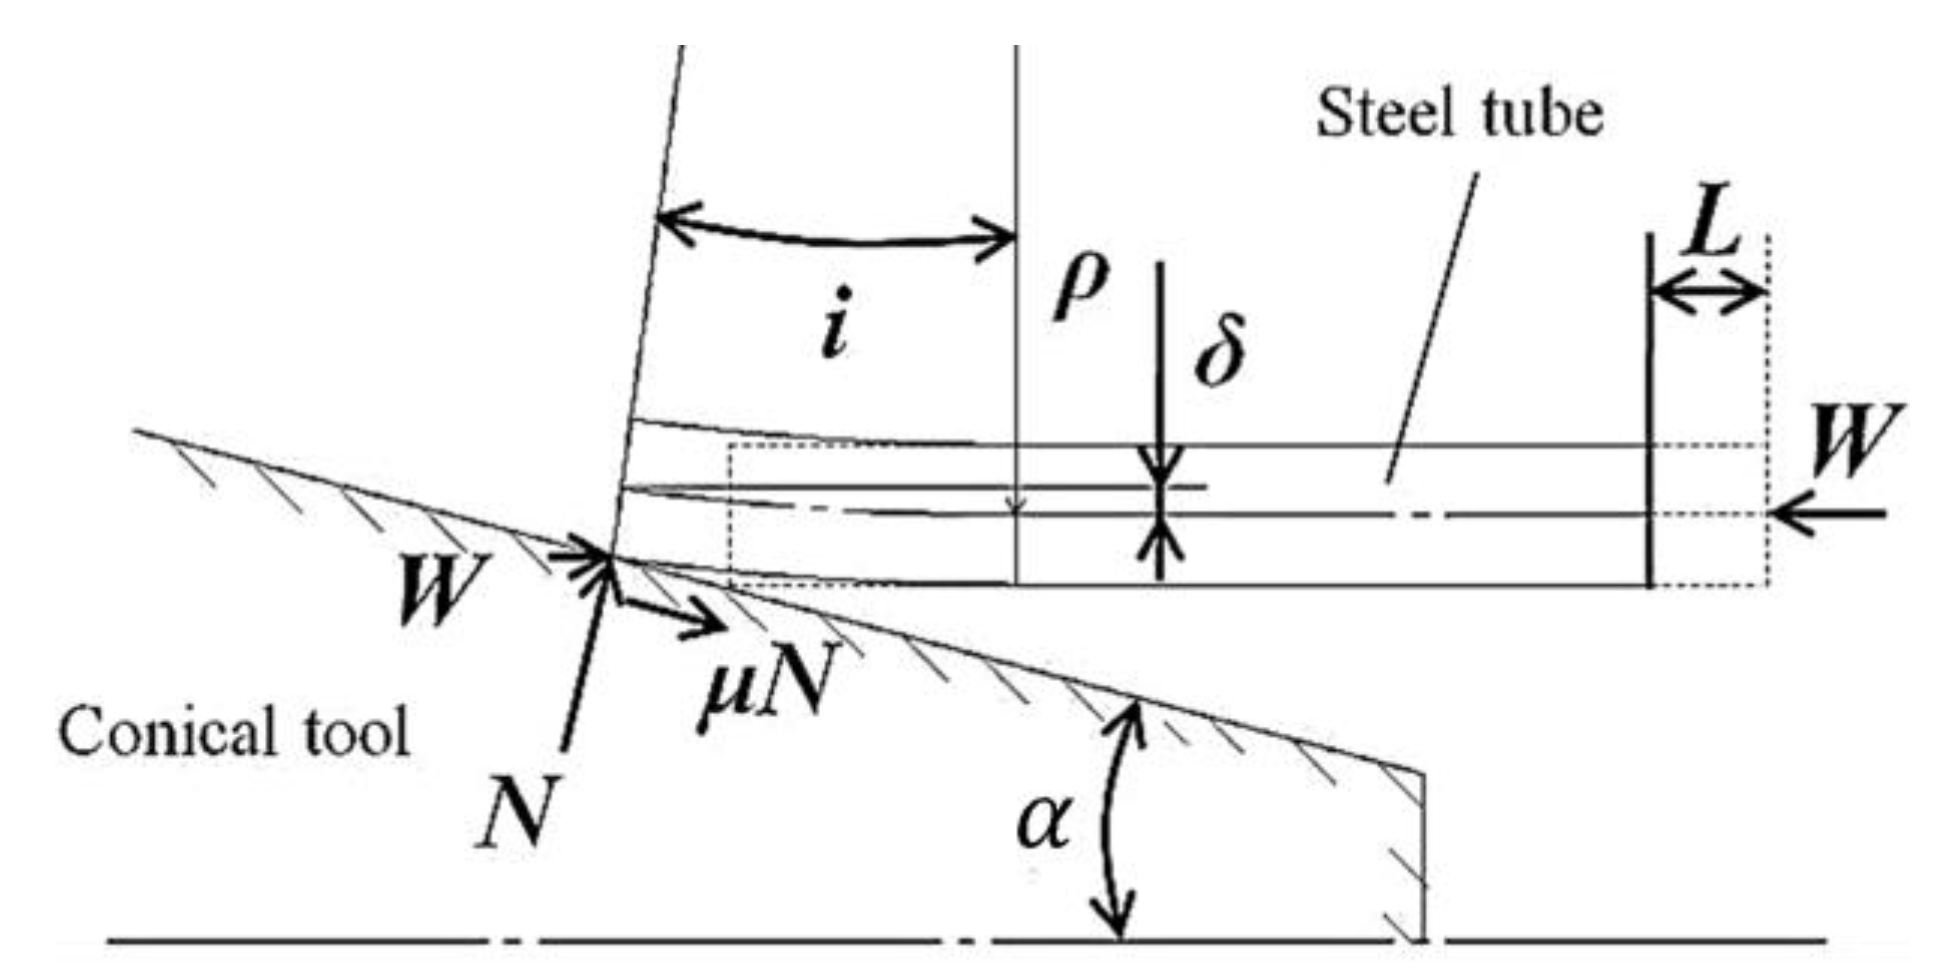
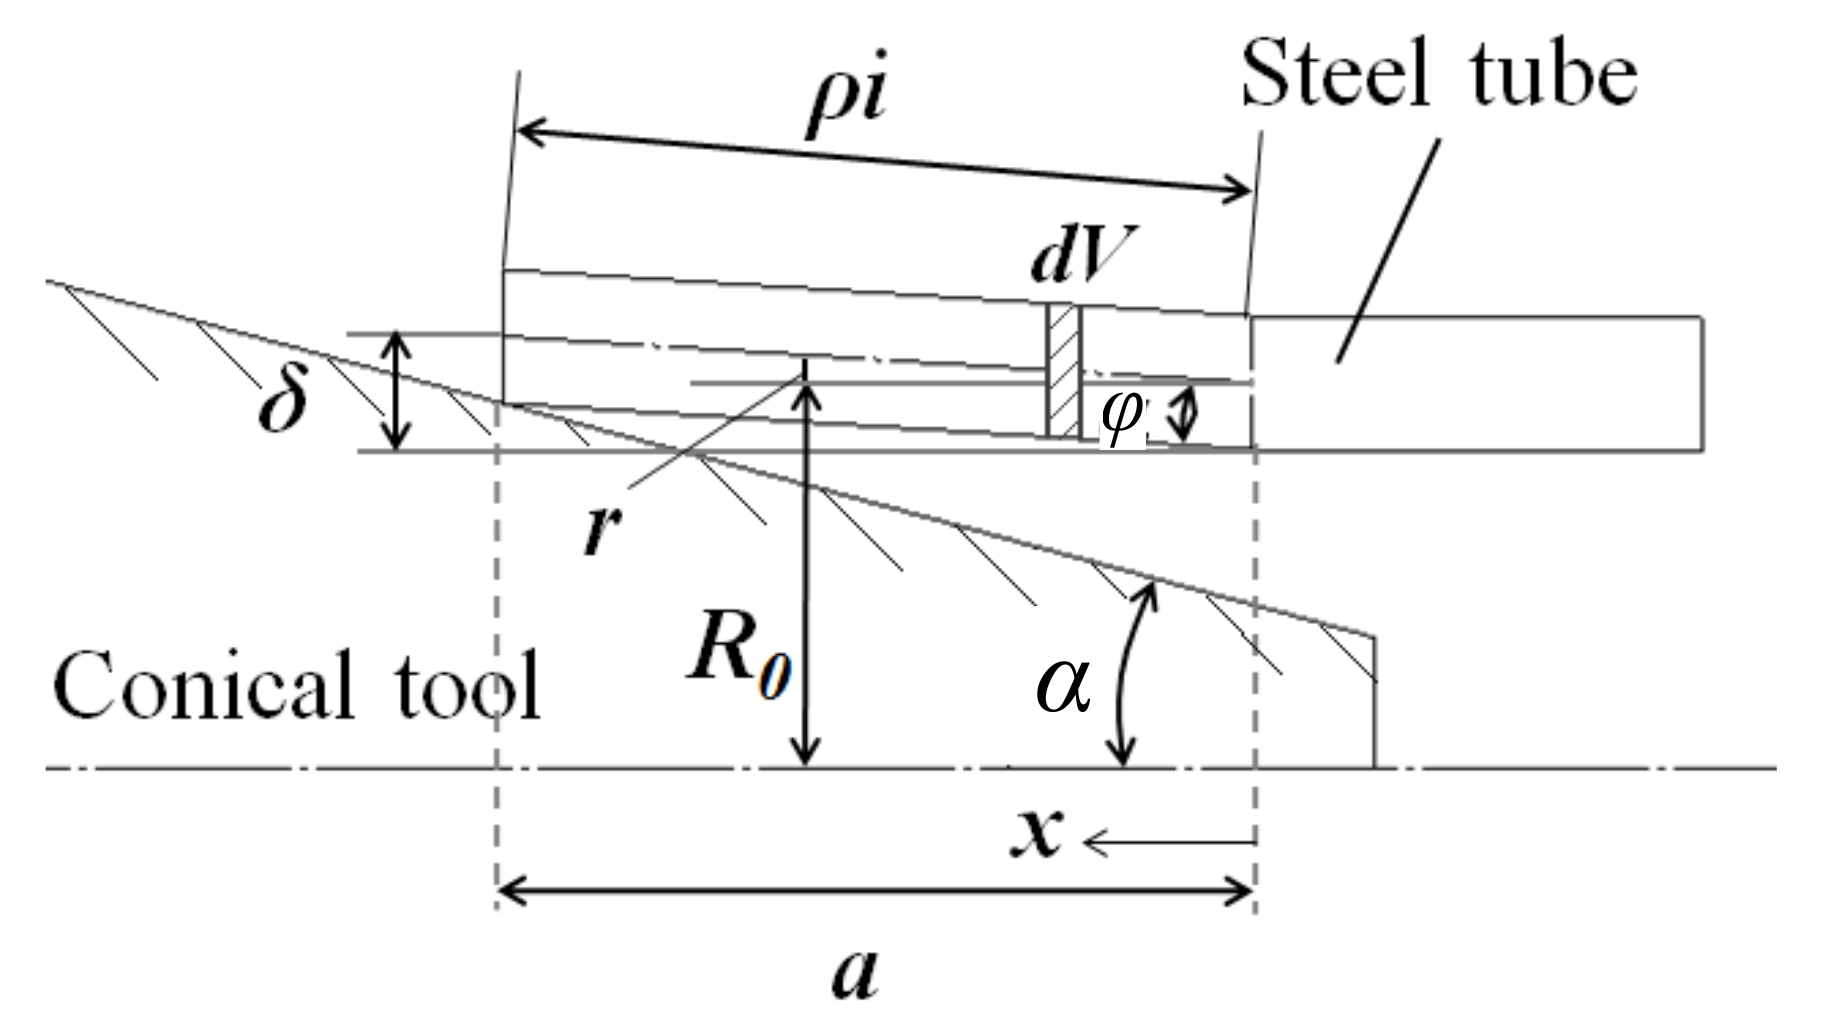
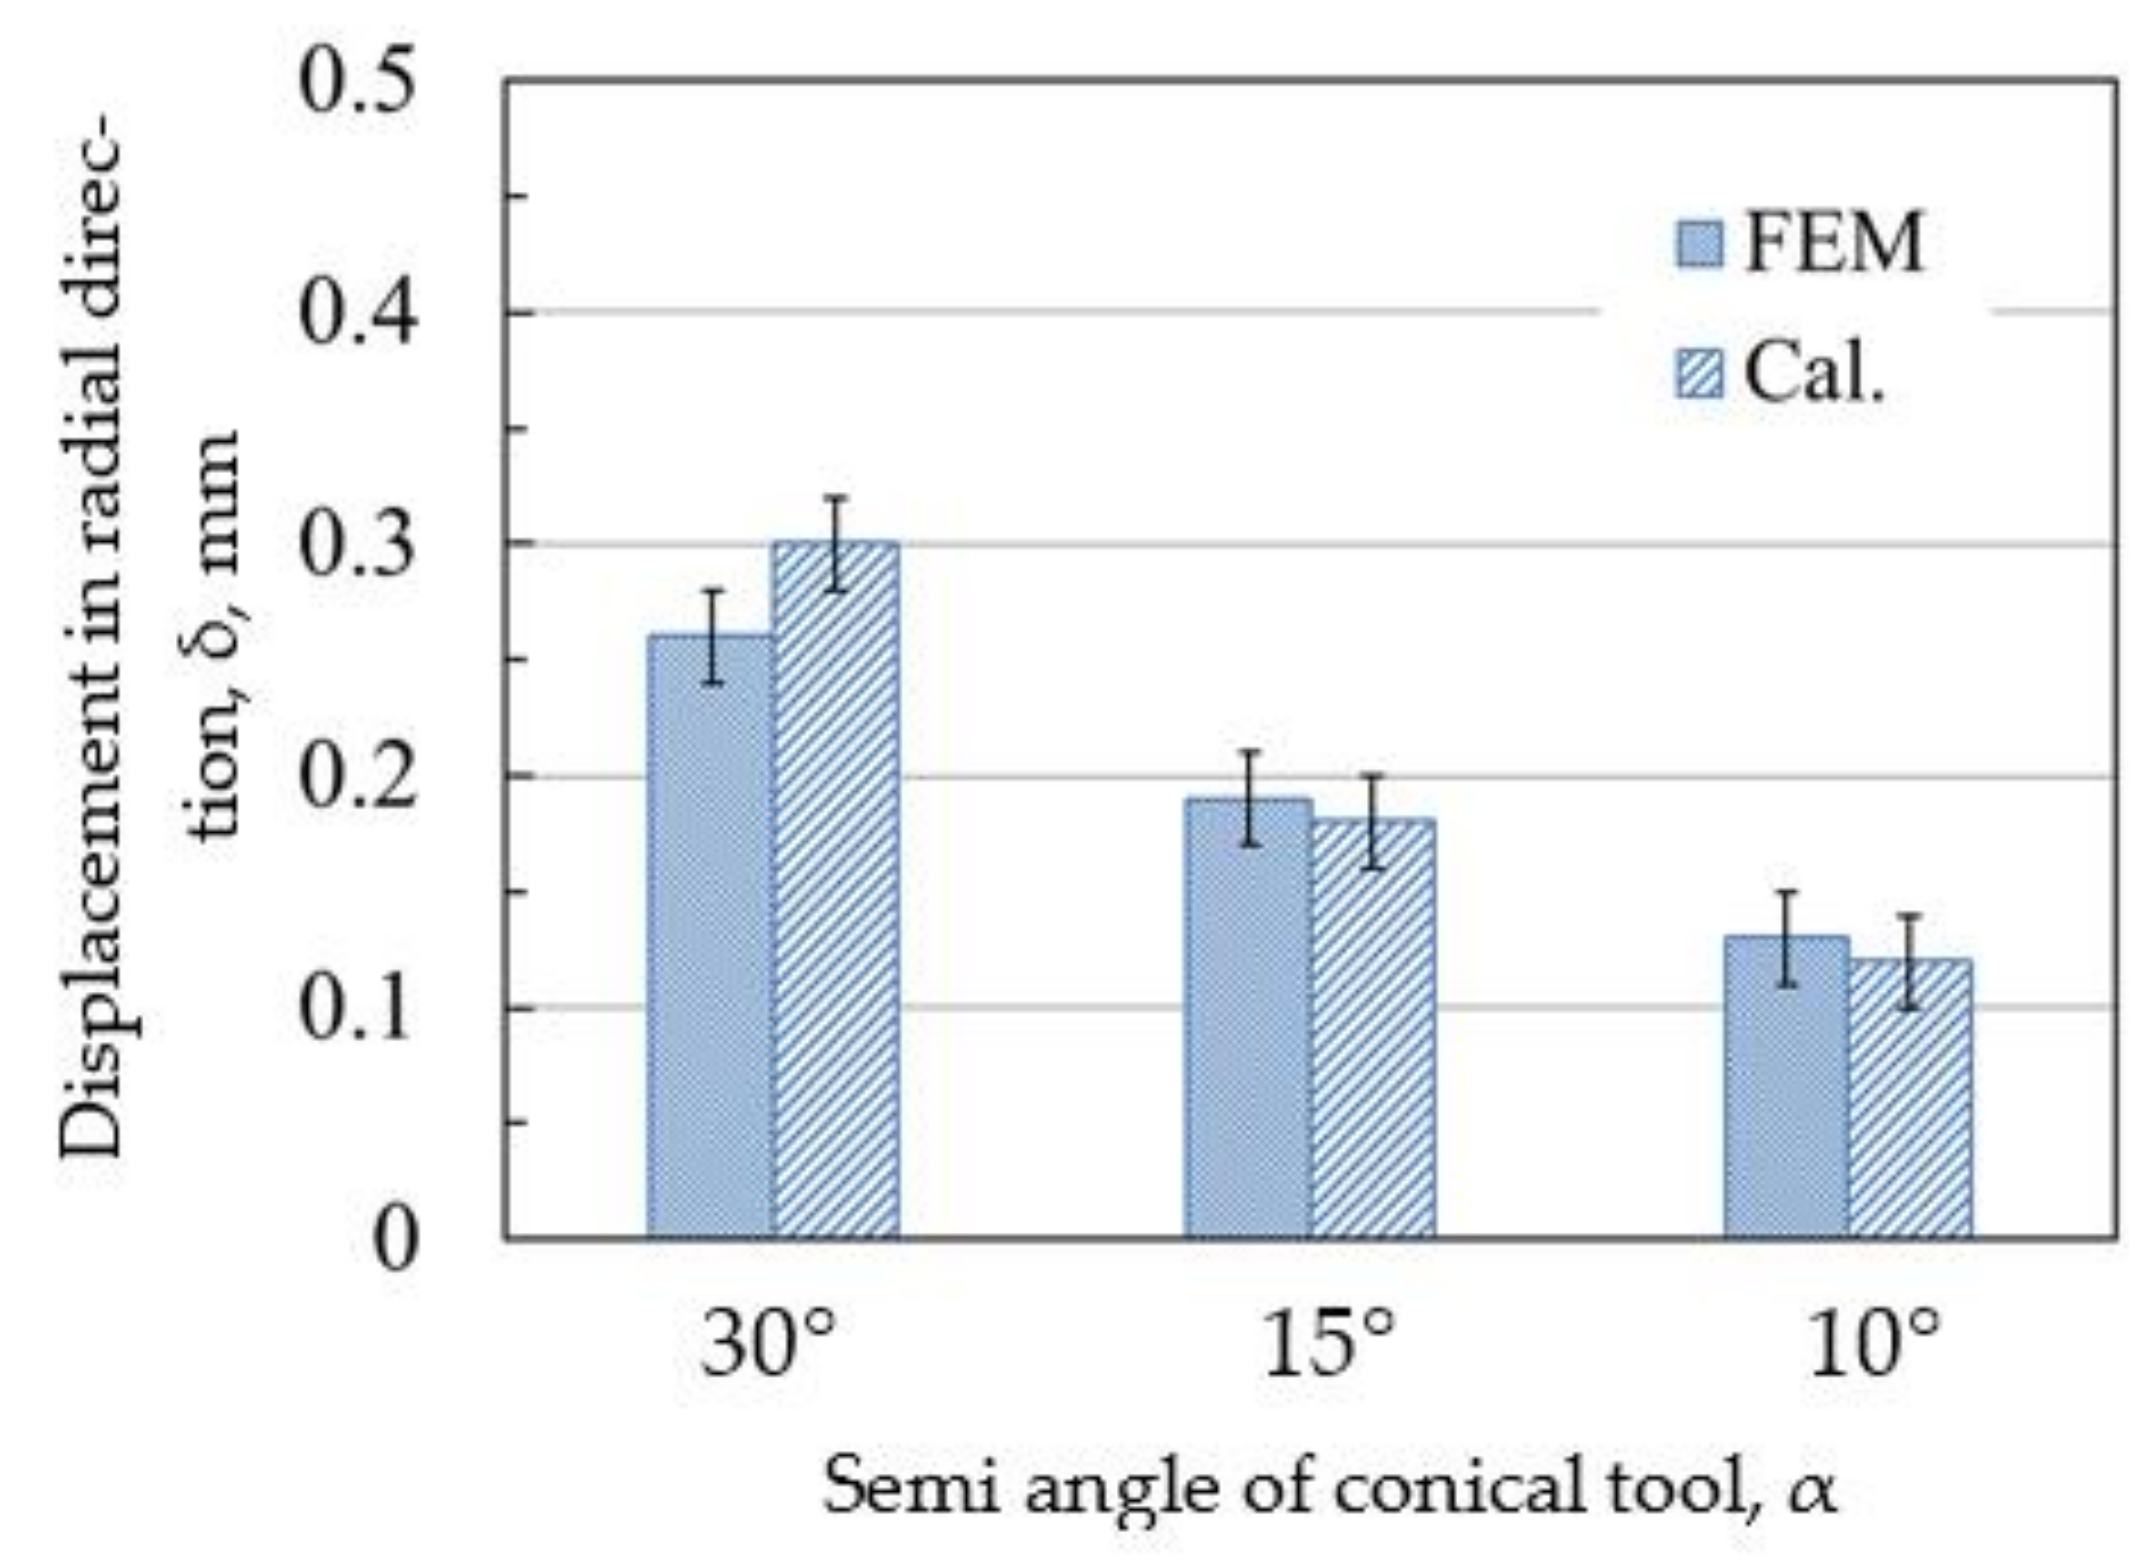
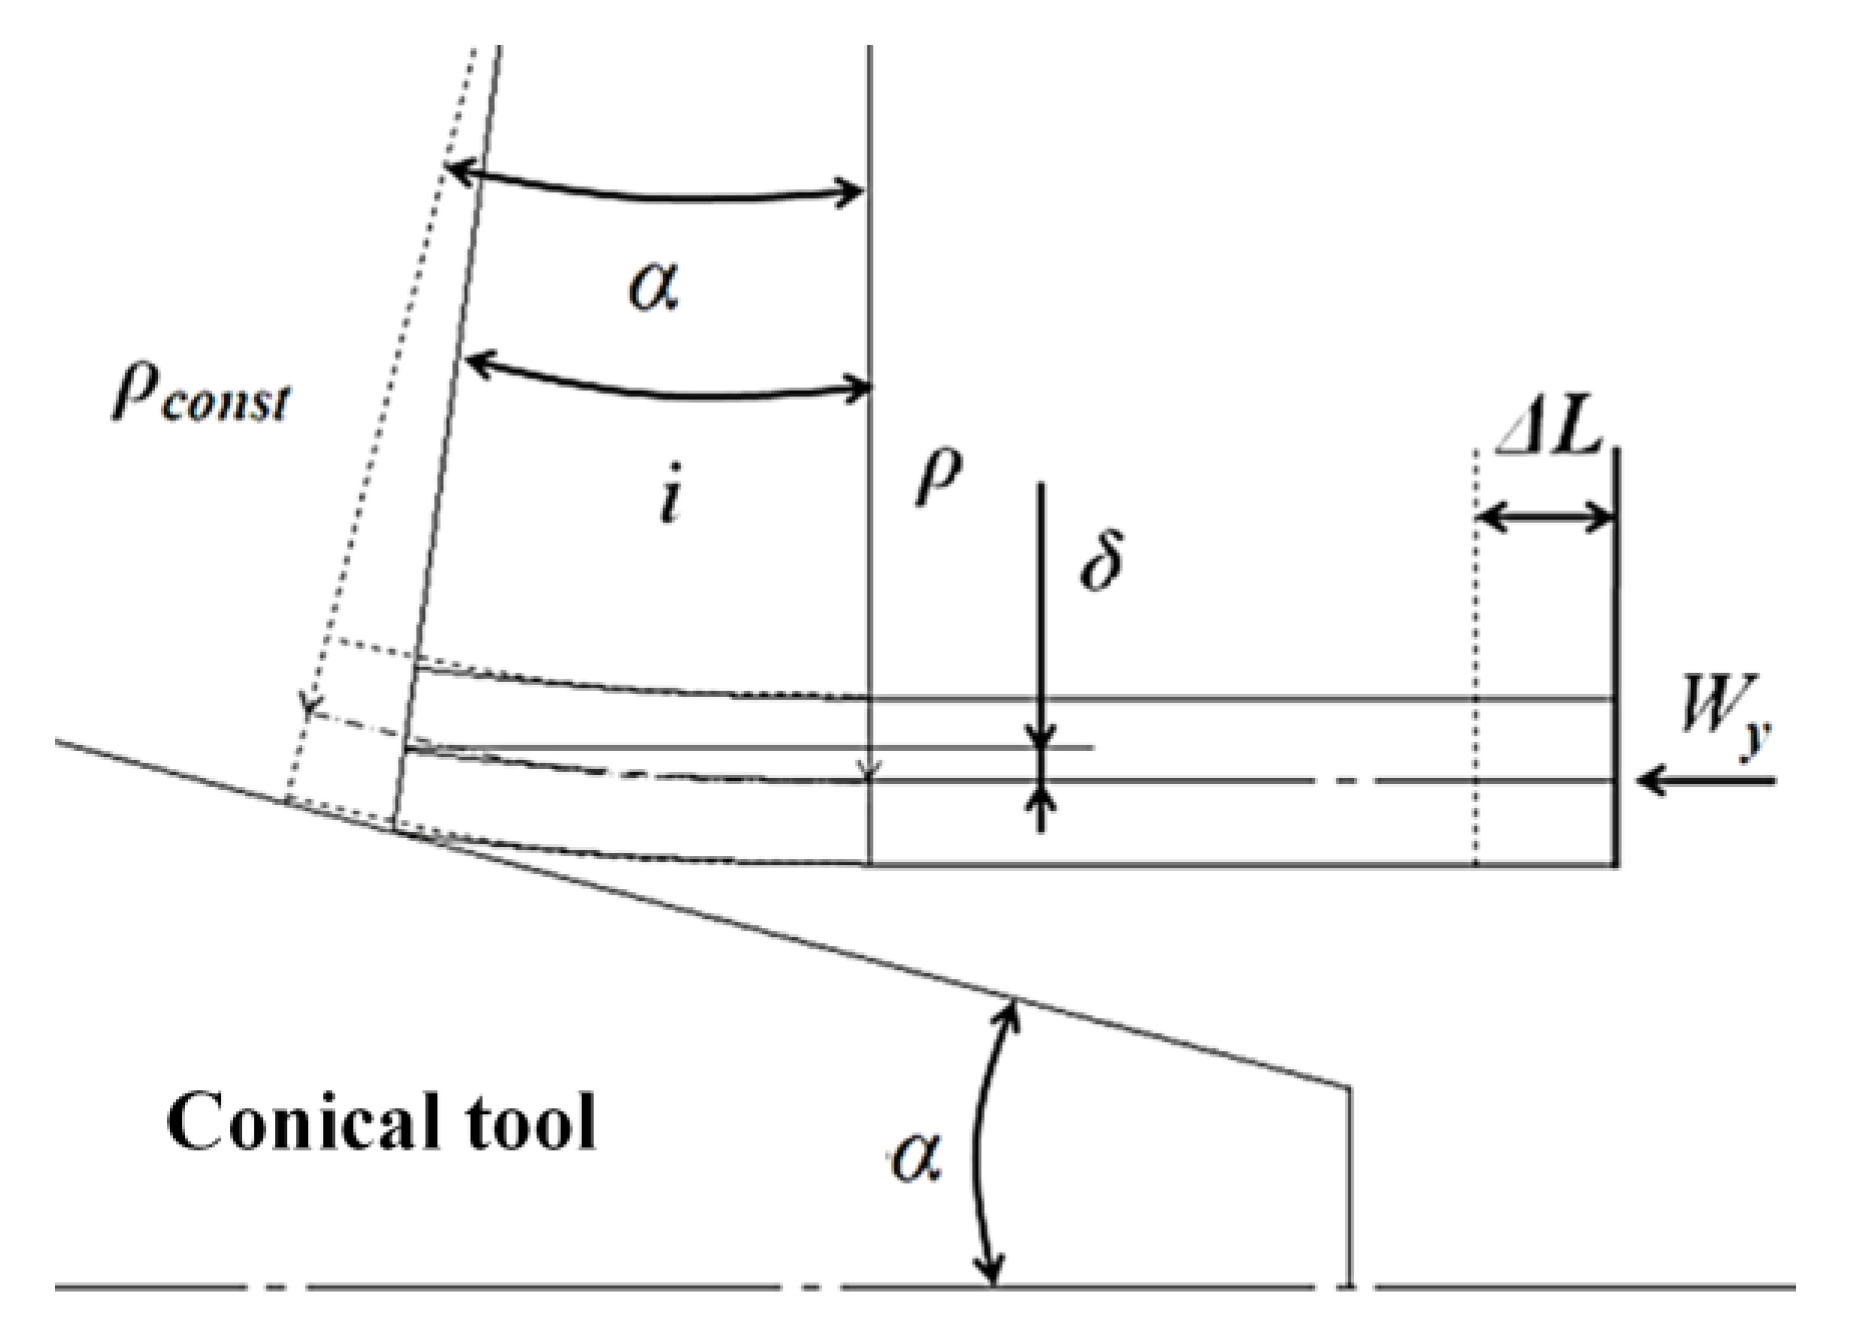
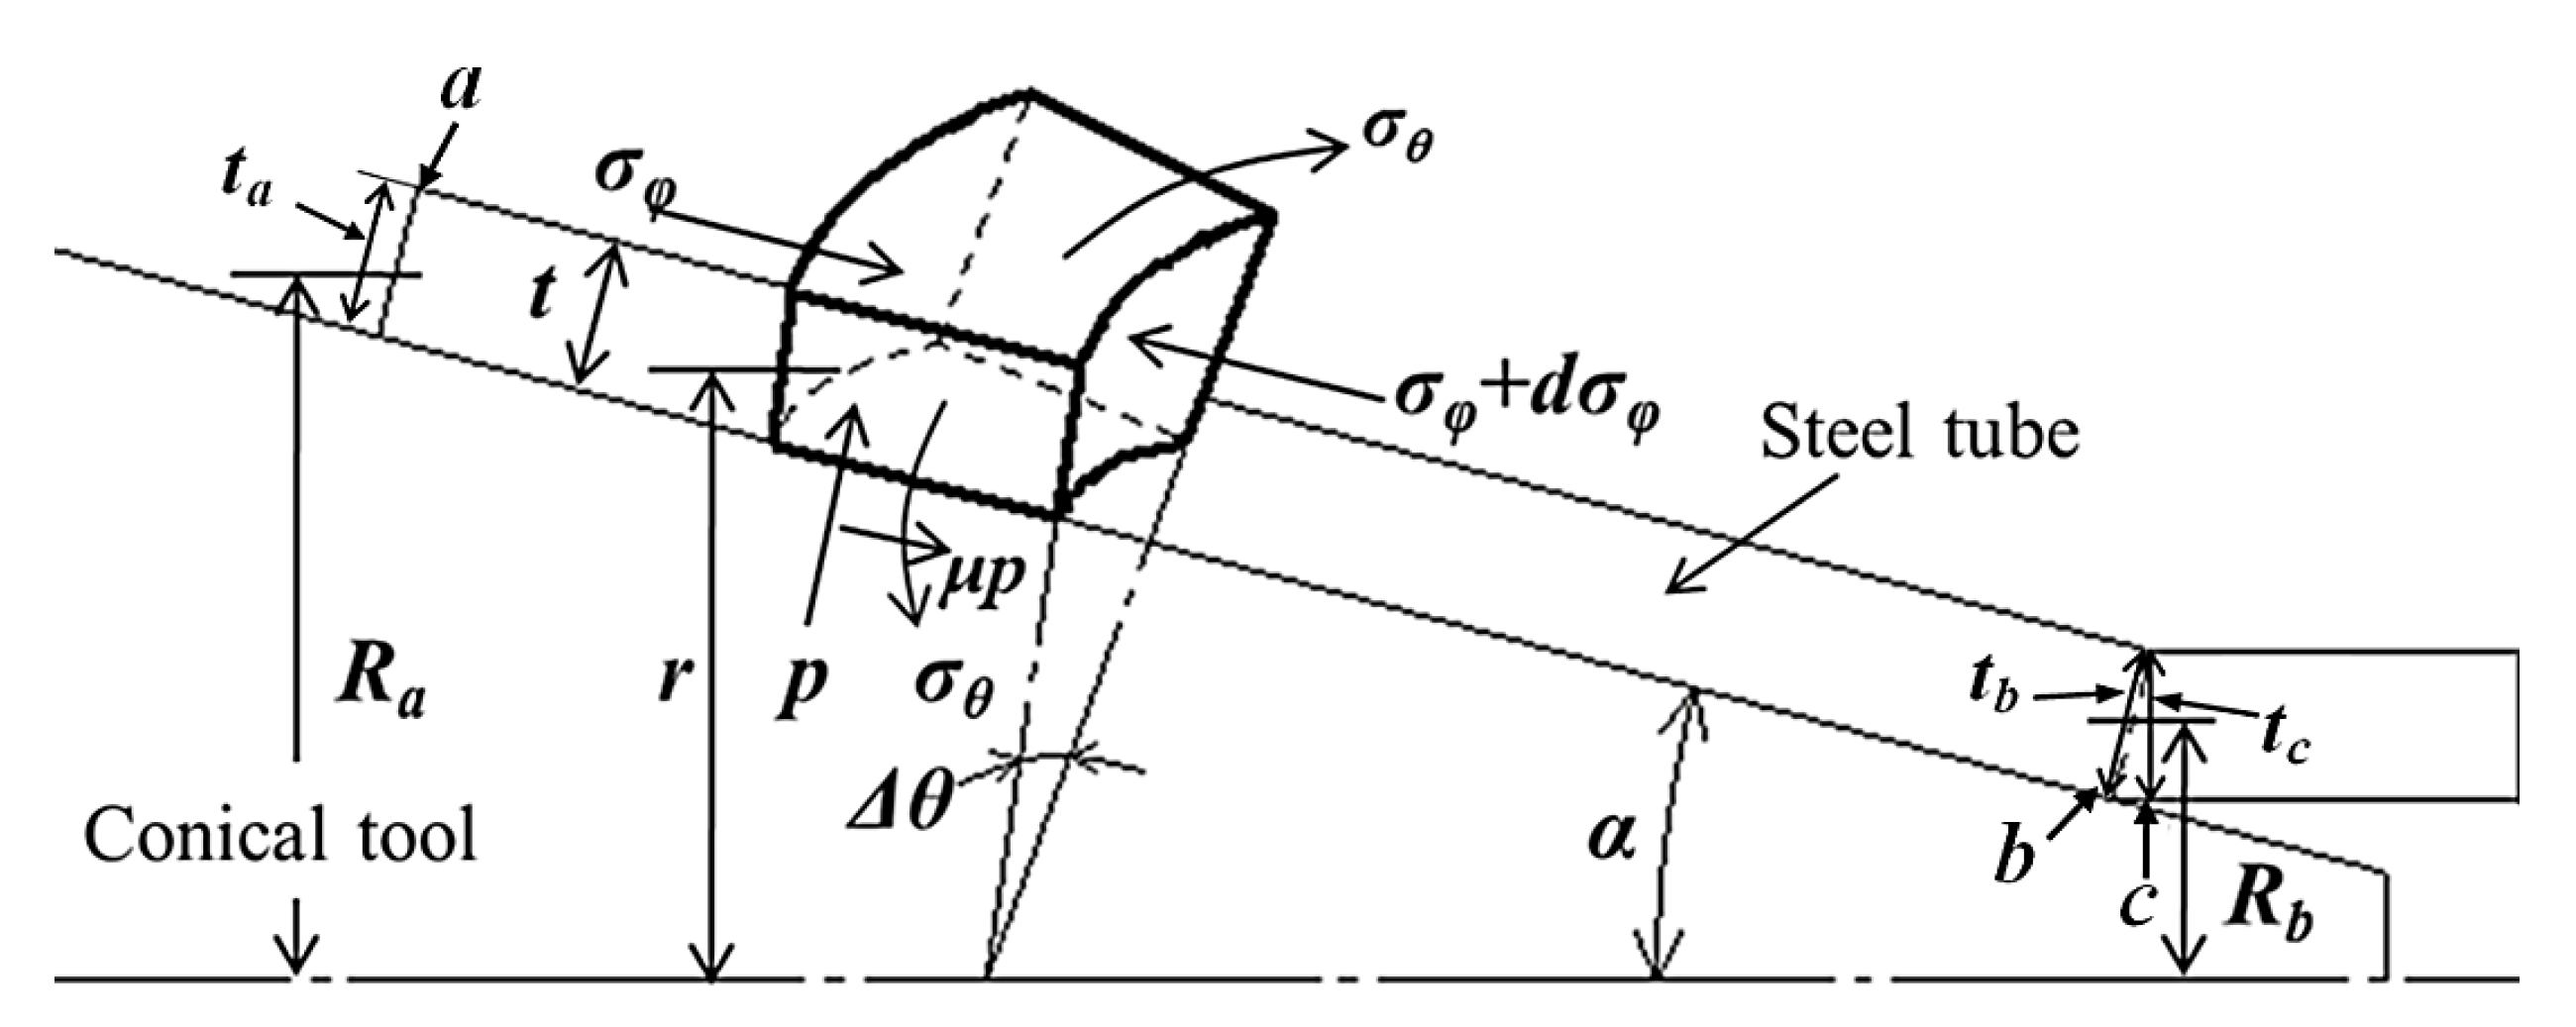
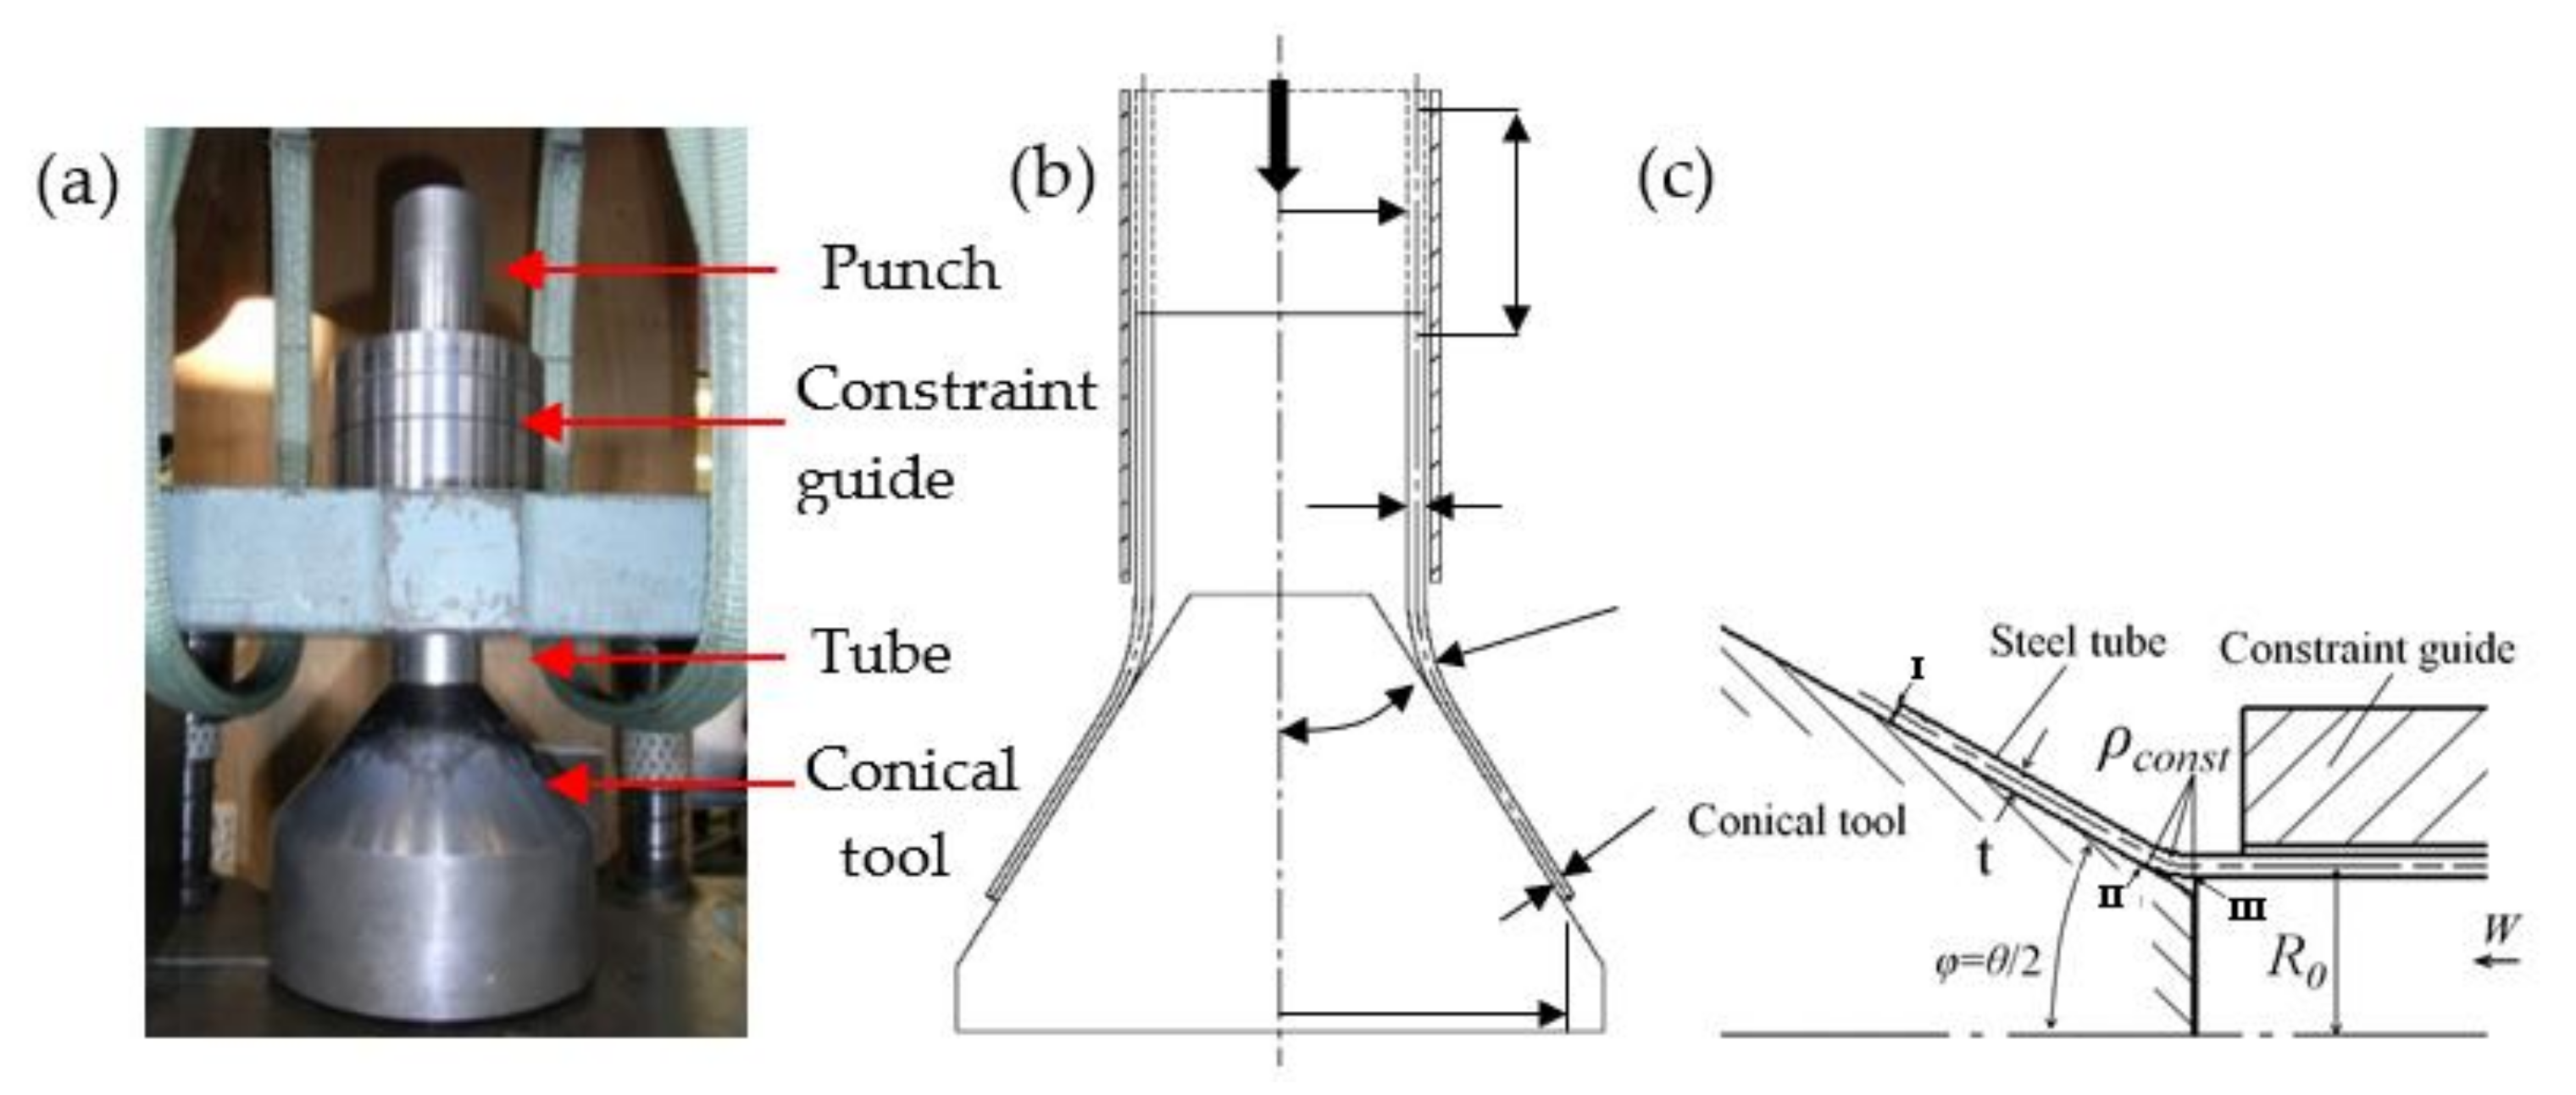
In the tube hydroforming process, the main deformation occurs in the circumferential direction of the tubular materials. The existence of anisotropy in the tubular materials suggested that the investigation on their circumferential mechanical properties is more valuable for the tubular materials that are expected to be used in the tube hydroforming process. However, overviewing the studies mentioned above, there are few studies that focused on the evaluation of circumferential mechanical properties for the tubular materials using the flaring test. The current study aims to propose a simple method to evaluate the circumferential mechanical properties of the tubular materials through the flaring test. The analytical expressions for determining the yield stress (σy), strain hardening coefficient (F) and exponent (n) of the steel tube with the flaring test were derived. To verify the availability of the method proposed in this study, the flaring tests using the conical tools with three different semi vertex angles of 10°, 15° and 30° were carried out experimentally and numerically. Moreover, the calculation results of the yield stress, strain hardening coefficient and exponent values of the steel tube were compared to those obtained with the conventional tensile test of the tube.

2. FEM Model and Experimental Conditions

For the purpose of determining the yield stress, strain hardening coefficient and exponent values of the tube with the flaring test, the FEM simulations of the tube flaring tests were carried out to obtain the deformation behavior and the stress-strain state of the tube end during the flaring process. The availability of the FEM model was verified by comparing the load–stroke curves and the thickness of the selected points of the tube end obtained in the experiment and FEM simulation. The experimental devices in the flaring test, schematic illustration and partial-amplified schematic illustration of the deformation part of the tube in the flaring test are shown in Figure 1.

2.1. FEM Simulation Model

The FEM simulation of the flaring test was performed using an explicit dynamic finite-element code, ANSYS/LS-DYNA (7.0, ANSYS Inc., Pittsburgh, PA, USA). By taking advantage of symmetry, a one-quarter model, which is similar to the one in Figure 1b, was used to save the simulation time. The tube is assumed to be an isotropic elasto-plastic body, and its deformation characteristic is coincident with the power-law expression (σ = σy + F∙εn). The conical tool, the constraint guide and the punch are assumed to be rigid bodies. The static friction coefficient (μs) and kinetic friction coefficient (μk) between the tube and conical tool are assumed to be μs = 0.05, μk = 0.03, respectively. The static and kinetic friction coefficients between the tube and constraint guide are assumed as 0.12 and 0.1, respectively [18].

2.2. Experimental Conditions

The flaring test was carried out in a universal hydraulic testing machine (loading capacity, 5000 kN, Shimadzu, Kyoto, Japan). A computer was used to record the relationship between the punch stroke and punch load. The experimental devices in the flaring test, composed of a punch, a constraint guide, conical tool and conical tool fixed plate, are shown in Figure 1a. During the flaring test, the tube with initial outside diameter D0, inside the fixed constraint guide, is pushed by a punch onto the conical tool. The conical tool is characterized by the semi conical angle α. During the test, the punch keeps moving until the fracture occurs in the tube end at the final diameter Df. A spray-type lubricant composed of PTFE and organic molybdenum was evenly sprayed on the internal surface of the tube and the conical surface, which made contact with the tube’s internal surface in the flaring test. The conical tools with semi-angles of 10°, 15° and 30° were used in this study to verify the availability of the newly proposed method. The experiment was performed with a constant punch speed of 0.05 mm/s at room temperature. The welded tube (JIS STKM11A) was used in this study. The material properties of the tube are listed in Table 1. To verify the accuracy of the circumferential mechanical properties determined by the method proposed in this study, the conventional tensile test with a standard specimen (JIS Z2241:1998) was prepared with the unfolded tube. The specimens were cut from the unfolded tube in perpendicular and parallel directions to the tube axis, as well as along the welded part of the tube. The tensile test was performed with a fixed crosshead speed of 3 mm/s at room temperature.

2.3. Validation of FEM Simulation Model

To evaluate the validation of the FEM simulation model, the load–stroke curves and thickness of selected points (point-I, II, III in Figure 1c) of the specimen, obtained with the FEM simulation, were compared to the ones obtained in the real experiment. Figure 2 presents the load–stroke curves obtained in the FEM simulation and experiment of flaring tests with three different conical tools. It is observed that the load–stroke curves obtained in the FEM simulation and experiment show good agreement. Figure 3 shows the selected point’s thickness in the tube end in the FEM simulation and experiment. The thicknesses of the selected points in the tube end obtained in the FEM simulations agree very well with the ones obtained in the real experiments. By comparing the load–stroke curves and thicknesses of the selected points in the tube end, predicted with the FEM simulation and obtained in the real flaring tests, it could be found that the FEM simulation results have good agreement with the experimental results. It means that the FEM simulation model used in the current work is reliable and with high accuracy.

3. Deformation Behavior of Tube End in the Flaring Test

Combining with the load–stroke curve, the flaring process could be divided into four deformation stages, compression, bending, expansion and fracture, as shown in Figure 4a. The effective stress distributions of the tube end at different deformation times of the flaring test are given in Figure 4b. For the first deformation stage from point-A to C in the load–stroke curve, the tube was pushed onto the conical tool until yield occurred (at point-C in the load–stroke curve) because of the increasing compression force. The effective stress distribution in the tube end at the deformation time of point-B is shown in Figure 4b(B). It could be seen that the effective stress was asymmetrically distributed along the thickness direction. The effective stress of the outside surface is higher than that in the internal surface of the tube end before yield occurs. When yield occurs (point-C), the effective stress distribution became symmetrical in the thickness direction. The first yield point is almost along the mid-thickness line of the tube. The effective stress distribution of the tube end at this moment can be found in Figure 4b(C). With the continuous pushing of the punch, the load increases slowly from point-C to E. The leading edge of the tube end starts to deform along the surface of the conical tool. In other words, the tube walls are primarily bent outwards, but the tube internal surface is not in plane contact with the cone surface yet. The effective stress distributions of point-C and D are shown in Figure 4b(C,D)). In the subsequent stage, the load grows with almost constant slope from point-E to F. The tube internal surface slides on the surface of the conical tool (as shown in Figure 4b(E)) until fracture occurs on the edge of the tube end (point-F).

4. Determination of Yield Stress of Tubular Material in Flaring Test

4.1. Derivation of the Yield Stress Expression

Figure 5 shows a schematic diagram of the deformation part of the tube end when yield occurs. Based on the law of the conservation of energy, the work of the load force should be equal to the sum work of the bending process work ( M i ), the pure deformation work ( W d ) and friction work ( W f ). The following equations could be obtained.
M i + W d + W f = W L
W f = μ N δ sin φ
During the bending process, from the effective stress distribution at bending stage, as shown in Figure 4b(C), it could be seen that the continuing full plastic bending moment happened approximately in the mid-thickness of the tube wall. The approximate maximum bending moment ( M ) could be obtained on the base of the geometric relationship and physical theories.
M = 2 M 0 = π R 0 t 0 2 σ y
The pure deformation work ( W d ) is expressed as follows.
W d = σ ε d V
The tube is assumed as elastic-plastic body. The pure deformation resistance σ equals the yield stress, therefore
σ = σ y
For the isotropic material, the effective strain could be defined by Equation (6). Based on the principle of constant volume, Equation (7) is obtained. The thickness of the tube end is not changed at the yield moment, ε t = 0 . The effective strain of the tube end at the yielding moment could be obtained Equation (8).
ε = 2 3 ε θ 2 + ε φ 2 + ε t 2
ε θ + ε φ + ε t = 0
ε = 2 3 ε θ
To simplify the calculation, the flaring part of the tube end is assumed as a taper, as shown in Figure 6. ε θ and d V are defined as Equations (9) and (10), respectively.
ε θ = r R 0
d V = 2 π t cos φ R 0 + d r d x
Substituting Equations (5), (8) and (10) into Equation (4), the pure deformation work is obtained as
W d = 4 π σ y t c o s φ 3 R 0 d r R 0 + r d V
From the geometrical relationships, r could be determined,
r = δ x a
a = ρ i c o s φ
Substituting Equation (12) into Equation (11), the expression of pure deformation work W d could be rewritten as
W d = 4 π σ y t c o s φ 3 R 0 0 a δ 2 a 2 x 2 + δ R 0 a x d x = 2 π σ y t ρ i c o s 2 φ 3 3 R 0 · 2 δ 2 + 3 R 0 δ
As the value of δ and φ is quite small, δ 2 and c o s φ are assumed as 0 and 1 in Equation (14), respectively. Then, the pure deformation work expression could be simplified as
W d = 2 3 π t δ ρ i σ y
Therefore, the solved yield stress σ y is obtained by combining Equation (1), (3) and (14).
σ y = W π t 0 i · L μ δ μ c o s α + s i n α s i n α / R 0 t 0 2 + 2 3 δ ρ

4.2. Determination of Unknown Quantities for Yield Stress Expression

To obtain the yield stress, the unknown parameters, such as the displacement in radial direction of the bended tube end, δ , the bending radius, ρ , and the bending angle, i , should be determined. The flaring test is simplified to get an approximative value of displacement in the radial direction, δ , as shown in Figure 7.
On the basis of theory for the volume of the deformation part remaining constant before and after deformation, Equation (17) is acquired.
L · t 0 + t 2 · 2 π δ 2 + R 0 = 2 π R 0 · t 0 L
where L = δ / sin α and substituting to Equation (17),
δ 2 2 + R 0 δ = R 0 · 2 t 0 t 0 + t L
is acquired. As the value of δ is very small, the high order term, δ is very small, the high order term,   δ 2 2 is assumed as 0, and δ is confirmed as follows.
δ = 2 t 0 t 0 + t L sin α
From Equation (19), it is found that there is a proportional relation between δ and L sin α . Hence, using a correction factor β replaces 2 t 0 t 0 + t because this expression will remain unchanged for the flaring test with different material, conical tool and et al. Then, Equation (19) is simplified as
δ = β L sin α
From the FEM simulation results, the correction factor β equals 0.6 for the material used in the current study. Figure 8 shows the comparison of calculated values of δ with Equation (20) between the ones obtained with the FEM simulation. It could be seen that the displacement in the radial direction, δ values calculated with Equation (20) have good agreement with these obtained with the FEM simulation. Therefore, Equation (20) is available to determine δ value.
To determine the bending radius ρ and bending angle i at the yield moment, a simple model of the tube deformation part is used, as shown in Figure 9. According to the deformation behavior of tube end in the flaring process, it is known that the radius (ρ_const) of the bending part kept constant from the bending process finished point (point-E in Figure 4a) until fracture occurred (point-F in Figure 4a). From the geometrical relationship, the length of the mid-thickness axis of the bending part in the expansion process (see Figure 4a) equals the sum length of mid-thickness axis length ( ρ i ), when yield occurs and the displacement ( Δ L ) of the tube from the time when the yield starts occurring (point-C in Figure 4a) to the finished point of the bending moment (point-E), i.e.,
ρ i + Δ L = ρ c o n s t α
In addition, according to the geometrical relationship between δ , i and ρ , it is known that
ρ = δ / 1 cos i
Solving Equations (21) and (22), an expression for bending angle at the yield moment is obtained.
i = ρ c o n s t α Δ L 1 cos i / δ
Thus, the unknown quantities in the expression of yield stress are all acquired. The yield stress in the tube flaring test is confirmed.

5. Determination of Strain Hardening Coefficient and Exponent

5.1. Derivation of Expressions for Strain Hardening Coefficient and Exponent

According to the basis equation about punch load in the tube flaring process, proposed by Manabe [12], the expressions for the punch load W and the bending radius ρ c o n s t are obtained for the flaring test in this study.
W = 2 π R 0 t c σ φ c + F t b + t c 4 ρ c o n s t 1 + n
ρ c o n s t = t 0 D 0 / 1 cos α
where F and n indicate the strain hardening coefficient and exponent, respectively. D 0 , R a , R b , t a , t b and t c are the initial outside diameter, mid-thickness circle radius of point-I, radius of point-II, thickness of point-I, point-II and point-III, respectively (see Figure 1c and Figure 10). σ φ c is compressive stress in the meridian direction at point III.
To determine two unknown quantities of F and n in Equation (24), the flaring tests with any two different conditions, such as using the conical tools with two different vertex angles, are required to be performed for the purpose of acquiring two different measured values of other parameters. Two equations with two unknown quantities of F and n could be obtained according to the experimental results of two different flaring tests. Solving the simultaneous equations, the values of F and n are confirmed.
F = W 2 π R 0 t c σ ϕ c · 4 ρ c o n s t t b + t c 1 + n
n = l n t c 1 t c 2 · W 2 2 π R 0 t c 2 σ ϕ c 2 W 1 2 π R 0 t c 1 σ ϕ c 1 / l n ρ c o n s t 1 t b 2 + t c 2 ρ c o n s t 2 t b 1 + t c 1 1

5.2. Determination of the Parameters of Strain Hardening Coefficient and Exponent Expression

In Equations (25) and (26), the unknown quantity σ φ c is required to obtain F and n values. The expression for σ φ , proposed by Furuya [19], is also applicable for the tube flaring process. The tube flaring test is simplified to obtain the σ φ value, as shown in Figure 10. A small hexahedral element is chosen to study the stress state in the flaring part. The stress in the thickness direction is assumed as zero. According to the mechanical equilibrium in the punch moving direction and the direction perpendicular to the conical surface of the conical tool, two equations are obtained as follows.
σ θ t d r / sin α · Δ θ cos α = p r Δ θ d r / sin α
d σ φ t r Δ θ = σ θ t d r / sin α · Δ θ sin α + μ p r Δ θ d r / sin α
Solving the simultaneous equations with Equations (28) and (29) and eliminating the quantity p , one equation with two unknown quantities σ φ and σ θ is obtained.
d d r r σ φ t σ θ t 1 + μ cos φ = 0
Von Mises yield criterion with a form of Tresca yield criterion is used to confirm σ θ ,
σ θ = m Y
where m is a constant (1 < m < 1.155), Y is the yield strength in tensile test. In the current study, the yield strength in the flaring test, σ y , determined by Equation (16), is used.
On the other hand, from the Levy–Mises equation, the relationship between the strain in the circumferential and thickness directions is expressed as follows.
d ε θ σ θ σ θ + σ φ + σ t / 3 = d ε t σ t σ θ + σ φ + σ t / 3
where d ε t = d t / t , d ε θ = d r / r .
From Equations (30)–(32), eliminating the quantity t, a differential equation with σ φ is acquired.
d r r = σ φ 2 m Y 2 σ φ 2 m Y 2 + cot α σ φ + 2 m 2 Y 2 1 + μ cot α d σ φ
After integrated computation with boundary conditions of σ φ = 0 as r = R a , and σ φ = σ φ b as r = R b , an expression for determination σ φ b is obtained.
ln R b R a = 1 4 ln 1 2 + μ cot α 2 1 + μ cot α σ φ b m Y + 1 1 + μ cot α σ φ b m Y 2 + 6 μ cot α 2 12 + 12 μ cot α μ 2 cot 2 α   tan 1 2 + μ cot α 4 σ φ b m Y 12 + 12 μ cot α μ 2 cot 2 α tan 1 2 + μ cot α 12 + 12 μ cot α μ 2 cot 2 α
In addition, without the consideration of the bending part, the relation between   σ φ b and σ φ c is
σ φ c = σ φ b / cos α
Thus, σφc for determination of F and n values with Equations (26) and (27) is obtained. It means that the values of F and n are determined.

6. Validation of Reliability of the Method

In order to verify the reliability of the calculation results, the calculation values of σy, F and n were compared, with these determined by the conventional tensile tests. The tensile properties of the tube in the perpendicular and parallel direction to the tube axis, as well as the weld zone, were investigated at room temperature using an unfolded tube.

6.1. Yield Stress

The parameters given in Table 2 were submitted into Equation (16) to calculate the yield stress in the flaring test. The friction coefficient (μ) is assumed as 0.03 [16]. The calculation results of the flaring test using the conical tools with three different semi angles are summarized in Table 3. It could be seen that the yield stresses determined by the flaring test with semi-angles of 10° and 15° are almost the same, about 320 MPa. However, the calculated yield stress is a little higher, about 344 MPa, when the conical tool with a semi-angle of 30° was used. The tensile test results of the tube in the perpendicular and parallel direction to the tube axis, as well as weld zone obtained with the unfolded tube, are shown in Table 4. The yield stress of the weld zone is 369 MPa, which is higher than that in the other part of the tube. The yield stress obtained with the new method is near to the one obtained with the conventional tensile test.

6.2. Strain Hardening Coefficient and Exponent

The parameters for calculating the strain hardening coefficient and exponent with Equations (25) and (26) are given in Table 5. The calculation results obtained with the combination of the flaring tests using any two of the three conical tools are listed in Table 6. The strain hardening coefficient determined by the combination of flaring tests using the conical tools with the semi-angles of 10° and 15° is a little smaller than those obtained using other combinations. The F-value determined with the new method has reasonable agreement with the one obtained from the tensile test. The calculated strain hardening exponent of the tube is about 0.15. The strain hardening coefficient determined with the conventional tensile test is about 620 MPa, in both perpendicular and parallel directions to the tube axis direction. The strain hardening exponent is about 0.15 in the perpendicular direction and 0.13 in the parallel direction. The n-value obtained with the flaring test has good agreement with the one obtained in the tensile test. The F-value of the weld is a little high, about 642 MPa, but a lower n-value of 0.12 is observed, as shown in Table 7.

7. Discussion

Based on the geometrical and mechanical relationships in the model of the flaring test, the expressions of σy, F and n values were derived. From the yield stress expression Equation (16), it could be seen that the friction coefficient (μ) in the equation has a strong influence on the accuracy of the calculated yield stress. At the ideal lubrication condition (the friction coefficient is zero), the yield stress calculated with Equation (16) should be near to the one determined by the conventional tensile test.
For the calculation of the F and n value, the Von Mises yield criterion, with a form of the Tresca yield criterion, is used to confirm σ θ ( σ θ = m Y ). Generally, m value is chosen at the range from 1 (axisymmetric stress state) to 1.155 (plane strain-stress state). In the cases of the flaring tests using the conical tools with semi-angles of 10° and 15°, m values were assumed to be 1.018 and 1.095, which are in the range of normal values, as shown in Table 5. However, in the case of the flaring test using the conical tool with a semi-angle of 30°, the m value is assumed to be 0.961, which is smaller than 1, to approach the F and n values determined by the conventional tensile test.
In the case of the flaring test using a conical tool with a semi-angle of 30°, the m value was assumed to be 0.961, which is out of the range of normal value because the wavy deformation is considered. The wavy deformation leads to the decrease in punch load compared to the theoretical value in the flaring test, indicated by Manabe et al. [12]. This unfavorable deformation will occur within the flaring test using a conical tool with a big vertex angle. Generally, the flaring test using a conical tool with a small vertex angle is more meaningful for investigating the tube hydroformability and circumferential mechanical properties [5]. In order to obtain F and n values with high accuracy and reliability, as well as reduce the adverse effect of the wavy deformation of the tube during the flaring test using a conical tool with a semi-angle of 30°, the m value is chosen to be a little smaller than 1. From Equations (34) and (35), the smaller m value will result in a smaller σφc value. From Equation (24), it also could be seen that the punch load, W value, decreases with the decrease in σφc value. In other words, with the decrease in W value, the m value will decrease. For the flaring test with wavy deformation, the σφc value is smaller than the theoretical one because the decreased punch load W value is caused by the unfavorable deformation. Therefore, the m value was assumed to be 0.961 to offset the adverse effect of unfavorable deformation on the decrease in punch load.

8. Conclusions

To study the hydroformability of the tube, a method for the evaluation of circumferential mechanical properties of tubular materials with the flaring test was proposed in this study. The main findings are summarized as follows.
(1)
The expressions for yield stress, strain hardening coefficient and exponent of the tube were successfully derived based on the geometrical and mechanical relationships in the tube flaring test.
(2)
By comparing with the yield stress, strain hardening coefficient and exponent values determined by the conventional tensile test, it is known that the method proposed in this study is viable and has high accuracy. It is appropriate to evaluate the circumferential mechanical properties of tubular materials because it is relatively easy to implement and has high reliability.

Author Contributions

Writing, study design and data analysis, Z.Z.; literature search and study design, B.L.; data analysis and study design, K.-I.M.; data collection and data analysis, H.S. All authors have read and agreed to the published version of the manuscript.

Funding

This research was funded by Grant-in-Aid for Young Scientists (B) (No. 25870594) of the Japan Society for the Promotion of Science.

Institutional Review Board Statement

Not applicable.

Informed Consent Statement

Not applicable.

Data Availability Statement

The data presented in this study are available on request from the corresponding author.

Acknowledgments

This work was financially supported by Grant-in-Aid for Young Scientists (B) (No. 25870594) of the Japan Society for the Promotion of Science.

Conflicts of Interest

The authors declare no conflict of interest.

References

  1. Cui, X.L.; Teng, B.; Yuan, S. Hydroforming process of complex T-shaped tubular parts of nickel-based superalloy. CIRP J. Manuf. Sci. Technol. 2021, 32, 476–490. [Google Scholar] [CrossRef]
  2. Zhu, H.; He, Z.; Lin, Y.; Zheng, K.; Fan, X.; Yuan, S. The development of a novel forming limit diagram under nonlinear loading paths in tube hydroforming. Int. J. Mech. Sci. 2020, 172, 105392. [Google Scholar] [CrossRef]
  3. Omar, A.; Tewari, A.; Narasimhan, K. Effect of bulge ratio on the deformation behaviour and fracture location during welded steel tube hydroforming process. Results Mater. 2020, 6, 100096. [Google Scholar] [CrossRef]
  4. Liu, H.; Gong, J.; Ma, Y.; Cui, J.; Li, M.; Wang, X. Investigation of novel laser shock hydroforming method on micro tube bulging. Opt. Lasers Eng. 2020, 129, 106073. [Google Scholar] [CrossRef]
  5. Koç, M.; Altan, T. An overall review of the tube hydroforming (THF) technology. J. Mater. Process. Technol. 2001, 108, 384–393. [Google Scholar] [CrossRef]
  6. Zhang, Z.C.; Manabe, K.; Zhu, F.X.; Mirzai, M.A.; Li, T.H. Evaluation of hydroformability of TRIP steel tubes by flaring test. J. Chin. Soc. Mech. Eng. 2010, 31, 39–46. [Google Scholar]
  7. Manabe, K.; Yoshida, Y. Evaluation of hydroformability of steel pipes by conical flaring test. In Proceedings of the 3rd International Conference on Tube Hydroforming—TUBEHYDRO, Harbin, China, 4–5 June 2007; pp. 39–45. [Google Scholar]
  8. Jang, Y.; Lee, Y.; Song, M.; Han, D.; Kim, N.; Lee, H. Evaluation of ductile fracture in welded tubes with tensile, hardness, flaring tests. Int. J. Mech. Sci. 2021, 210, 106745. [Google Scholar] [CrossRef]
  9. Zhao, X.; Xu, W.; Chen, Y.; Ma, H.; Shan, D.; Lin, H. Fabrication of curved generatrix workpiece of TA15 titanium alloy by variable thickness tube spinning and flaring process. Int. J. Adv. Manuf. Tech. 2017, 88, 1983–1992. [Google Scholar] [CrossRef]
  10. Zhang, Z.; Kong, X.; Mirzai, M.A.; Manabe, K. Determination of Material Constants in Ductile Fracture Criterion for Tubular Materials with Conical Flaring Test. Steel Res. Int. 2017, 88, 1600258. [Google Scholar] [CrossRef]
  11. Huang, Y.M. Elasto-plastic finite element analysis of the axisymmetric tube-flaring process with conical punch. Int. J. Adv. Manuf. Technol. 2001, 18, 390–398. [Google Scholar] [CrossRef]
  12. Huang, Y.M. Finite element analysis of tube flaring process with a conical tool. Int. J. Adv. Manuf. Tech. 2004, 24, 91–97. [Google Scholar] [CrossRef]
  13. Manabe, K.; Nishimura, H. Forming loads in tube-flaring with conical punch-study on nosing and flaring of tubes V. J. Jpn. Soc. Technol. Plast. 1983, 24, 47–52. [Google Scholar]
  14. Fischer, F.D.; Rammerstorfer, F.G.; Daxner, T. Flaring-An analytical approach. Int. J. Mech. Sci. 2006, 48, 1246–1255. [Google Scholar] [CrossRef]
  15. Chumadin, A.S.; Ershov, V.I. Investigation of the process of flaring conical blanks. Sov. Forg. Sheet Met. Stamp. Technol. 1987, 2, 76–79. [Google Scholar]
  16. Lu, Y.H. Study of tube flaring ratio and strain rate in the tube flaring process. Finite Elem. Anal. Des. 2004, 40, 305–318. [Google Scholar] [CrossRef]
  17. Mirzai, M.A.; Manabe, K.; Mabuchi, T. Deformation characteristics of microtubes in flaring test. J. Mater. Process. Technol. 2008, 201, 214–219. [Google Scholar] [CrossRef]
  18. Mirzai, M.A. Evaluation of Deformation Characteristics of Metal Microtubes by Flaring Test; Tokyo Metropolitan University: Tokyo, Japan, 2009; pp. 16–22. [Google Scholar]
  19. Furuya, Y.; Ochiai, I.; Kitayama, Y. Study on the tube-sinking of circular cylindrical shells. J. Jpn. Soc. Technol. Plast. 1966, 7, 73–82. [Google Scholar]
Figure 1. (a) Experimental devices, (b) schematic illustration and (c) detailed view of the schematic illustration of the deformation part of tube in the flaring test.
Metals 12 00764 g001
Figure 2. Load–stroke curves in FEM simulation (FEM) and experiment (Exp.) of flaring test with different conical tools.
Metals 12 00764 g002
Figure 3. Thickness of the selected points in the tube end obtained in the FEM simulations and experiments. (a) α = 10°; (b) α = 15° and (c) α = 30°; α: semi angle of the conical tool.
Metals 12 00764 g003
Figure 4. Load–stroke curve and effective stress distribution of tube end in the flaring test (α = 30°). (a) the load–stroke curve; (b) the effective stress distribution.
Metals 12 00764 g004
Figure 5. Schematic diagram of flaring test when yield occurred.
Metals 12 00764 g005
Figure 6. Schematic diagram of the tube deformation part being assumed as a taper when yielding occurs.
Metals 12 00764 g006
Figure 7. Schematic diagram of flaring test without consideration of bending radius when yield occurs.
Metals 12 00764 g007
Figure 8. Comparison between calculated δ values with Equation (20) and the ones obtained with the FEM.
Metals 12 00764 g008
Figure 9. Simple model for deformation part of flaring test.
Metals 12 00764 g009
Figure 10. Mechanical equilibrium diagram of the deformation part of tube end during the expansion stage of the flaring test.
Metals 12 00764 g010
Table 1. Material properties of the tube.
ParameterValue
Outside diameter, D0/mm38.1
Thickness, t0/mm2.24
Tube length, L/mm100
Density, ρd/kg/m37700
Young’s modulus, E/GPa204
Poisson’s ration, v0.27
Strain hardening coefficient, K-value/MPa624
Strain hardening exponent, n-value0.15
Yield stress, σy/MPa330
Table 2. Parameters for calculating yield stress.
Conical Tool Semi-Angle10°15°30°
Parameters
W/kN5.367.8015.56
L/mm0.981.381.03
ΔL/mm3.453.483.38
δ/ mm0.100.210.31
ρ/mm151.372.454.3
i/rad0.0370.0840.106
Table 3. Calculated results of yield stress with the flaring tests with different conical tools.
Conical Tool Semi-Angle10°15°30°
Calculated Yield Stress, σy/MPa319321344
Table 4. Yield stress determined by the conventional tensile test.
Yield Stress, σy/MPaWeld ZonePerpendicular DirectionParallel Direction
369330340
Table 5. The parameters for calculating F and n values.
Conical Tool Semi-Angle10°15°30°
Parameters
W/kN36.3646.6464.08
tb/mm2.222.222.25
tc/mm2.252.252.28
ρconst/mm37.5025.0012.60
Ra/mm24.7026.1029.10
m1.0181.0950.961
Table 6. F and n values of the tube calculated with Equations (26) and (27).
Combination of Semi-Angle10°&15°10°&30°15°&30°
Parameters
F-value/MPa605621628
n-value0.140.150.15
Table 7. F and n values of the tube obtained with the tensile test.
ParametersWeld ZonePerpendicular DirectionParallel Direction
F-value/MPa642624619
n-value0.120.150.13
Publisher’s Note: MDPI stays neutral with regard to jurisdictional claims in published maps and institutional affiliations.

