
Effect of Mechanical Properties of Rail and Wheel on Wear and Rolling Contact Fatigue


Abstract
:1. Introduction
2. Mechanical Properties
2.1. Materials
2.2. Tensile and Hardness Test
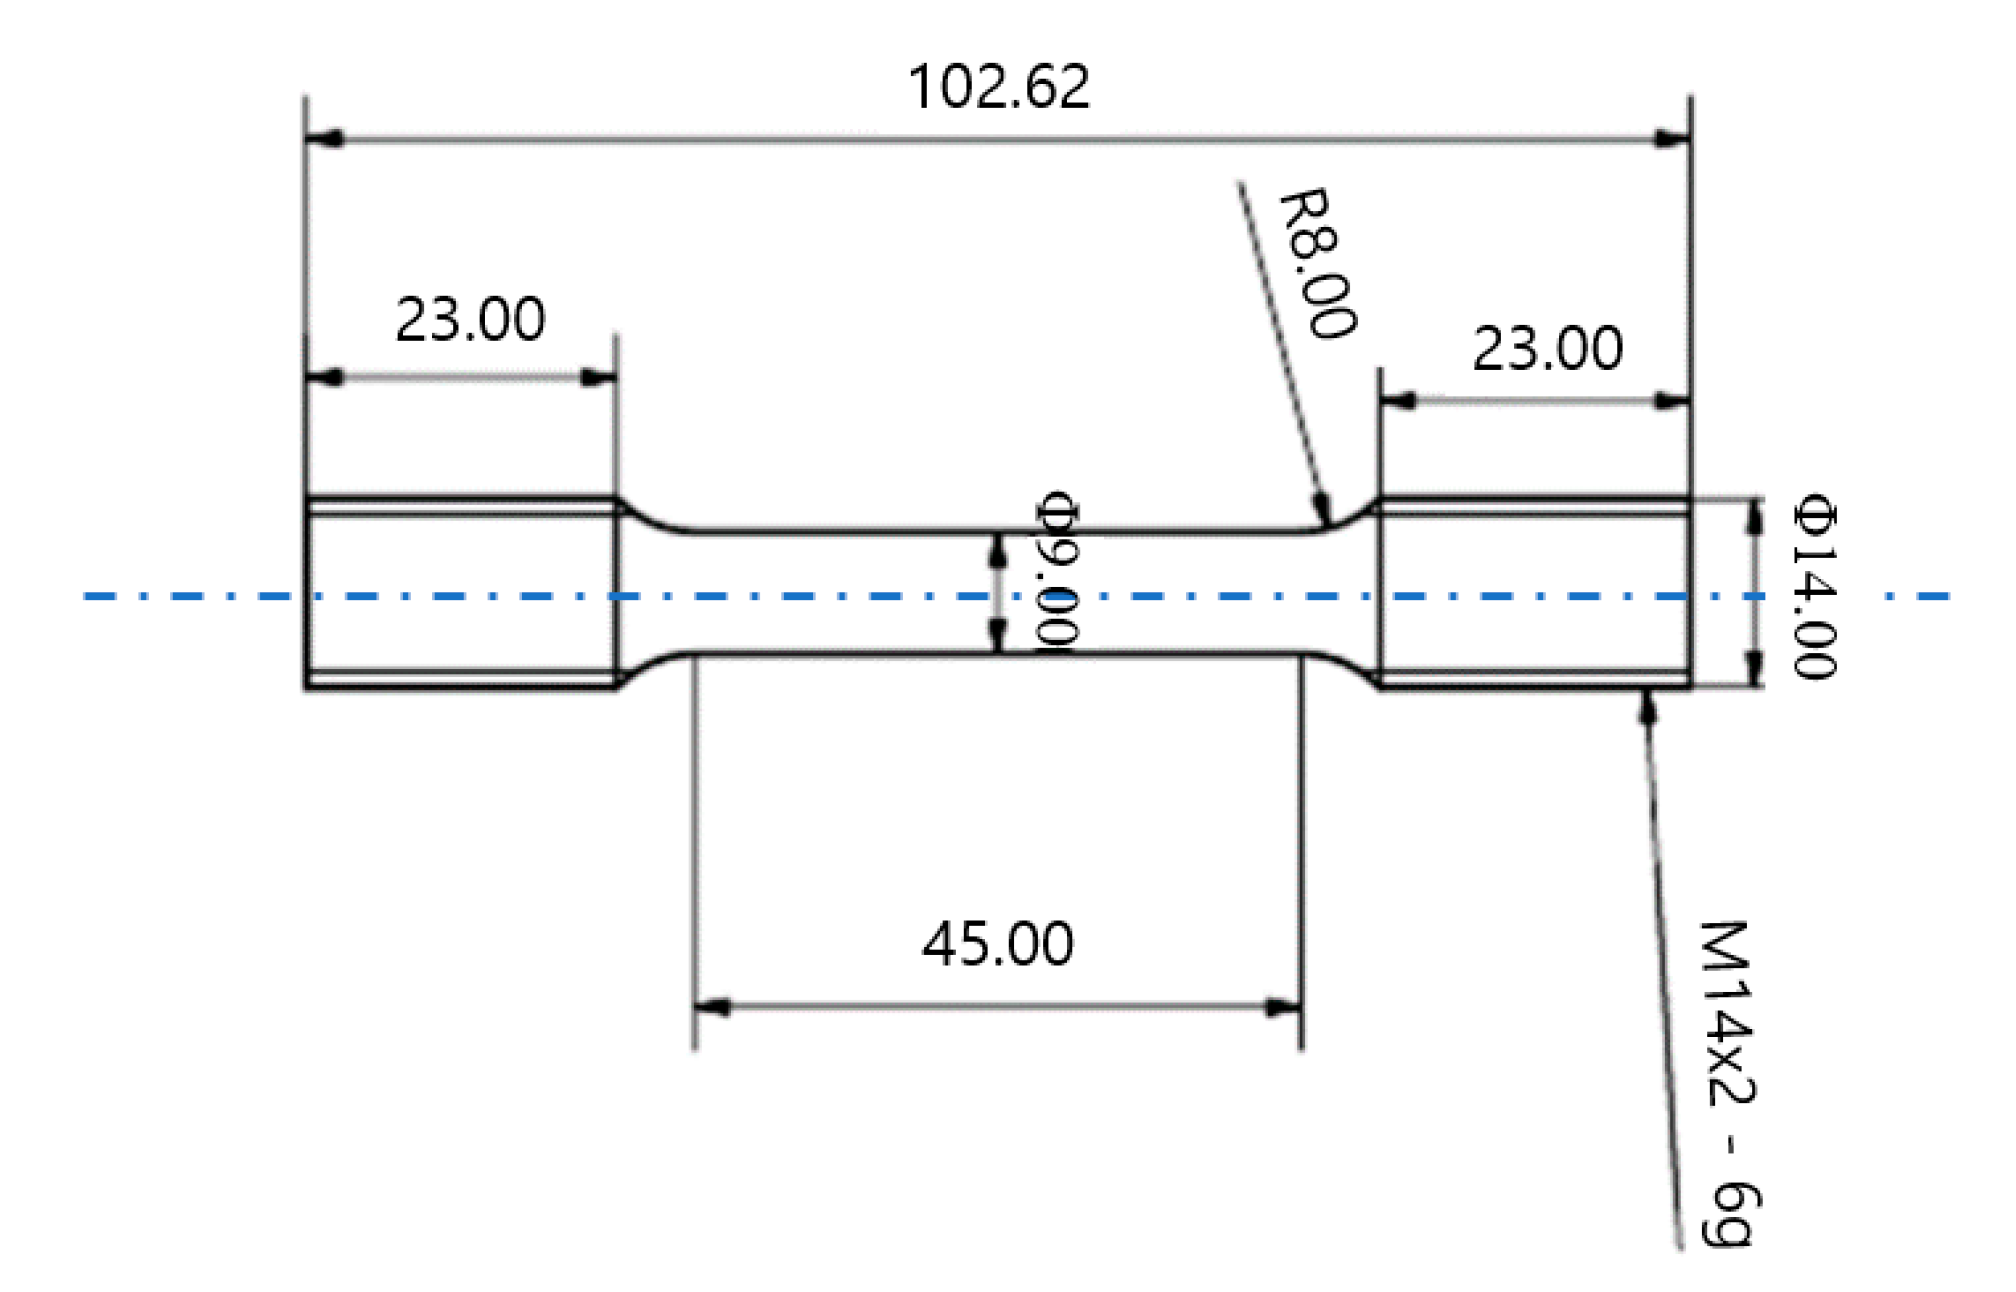
2.2.1. Test Method
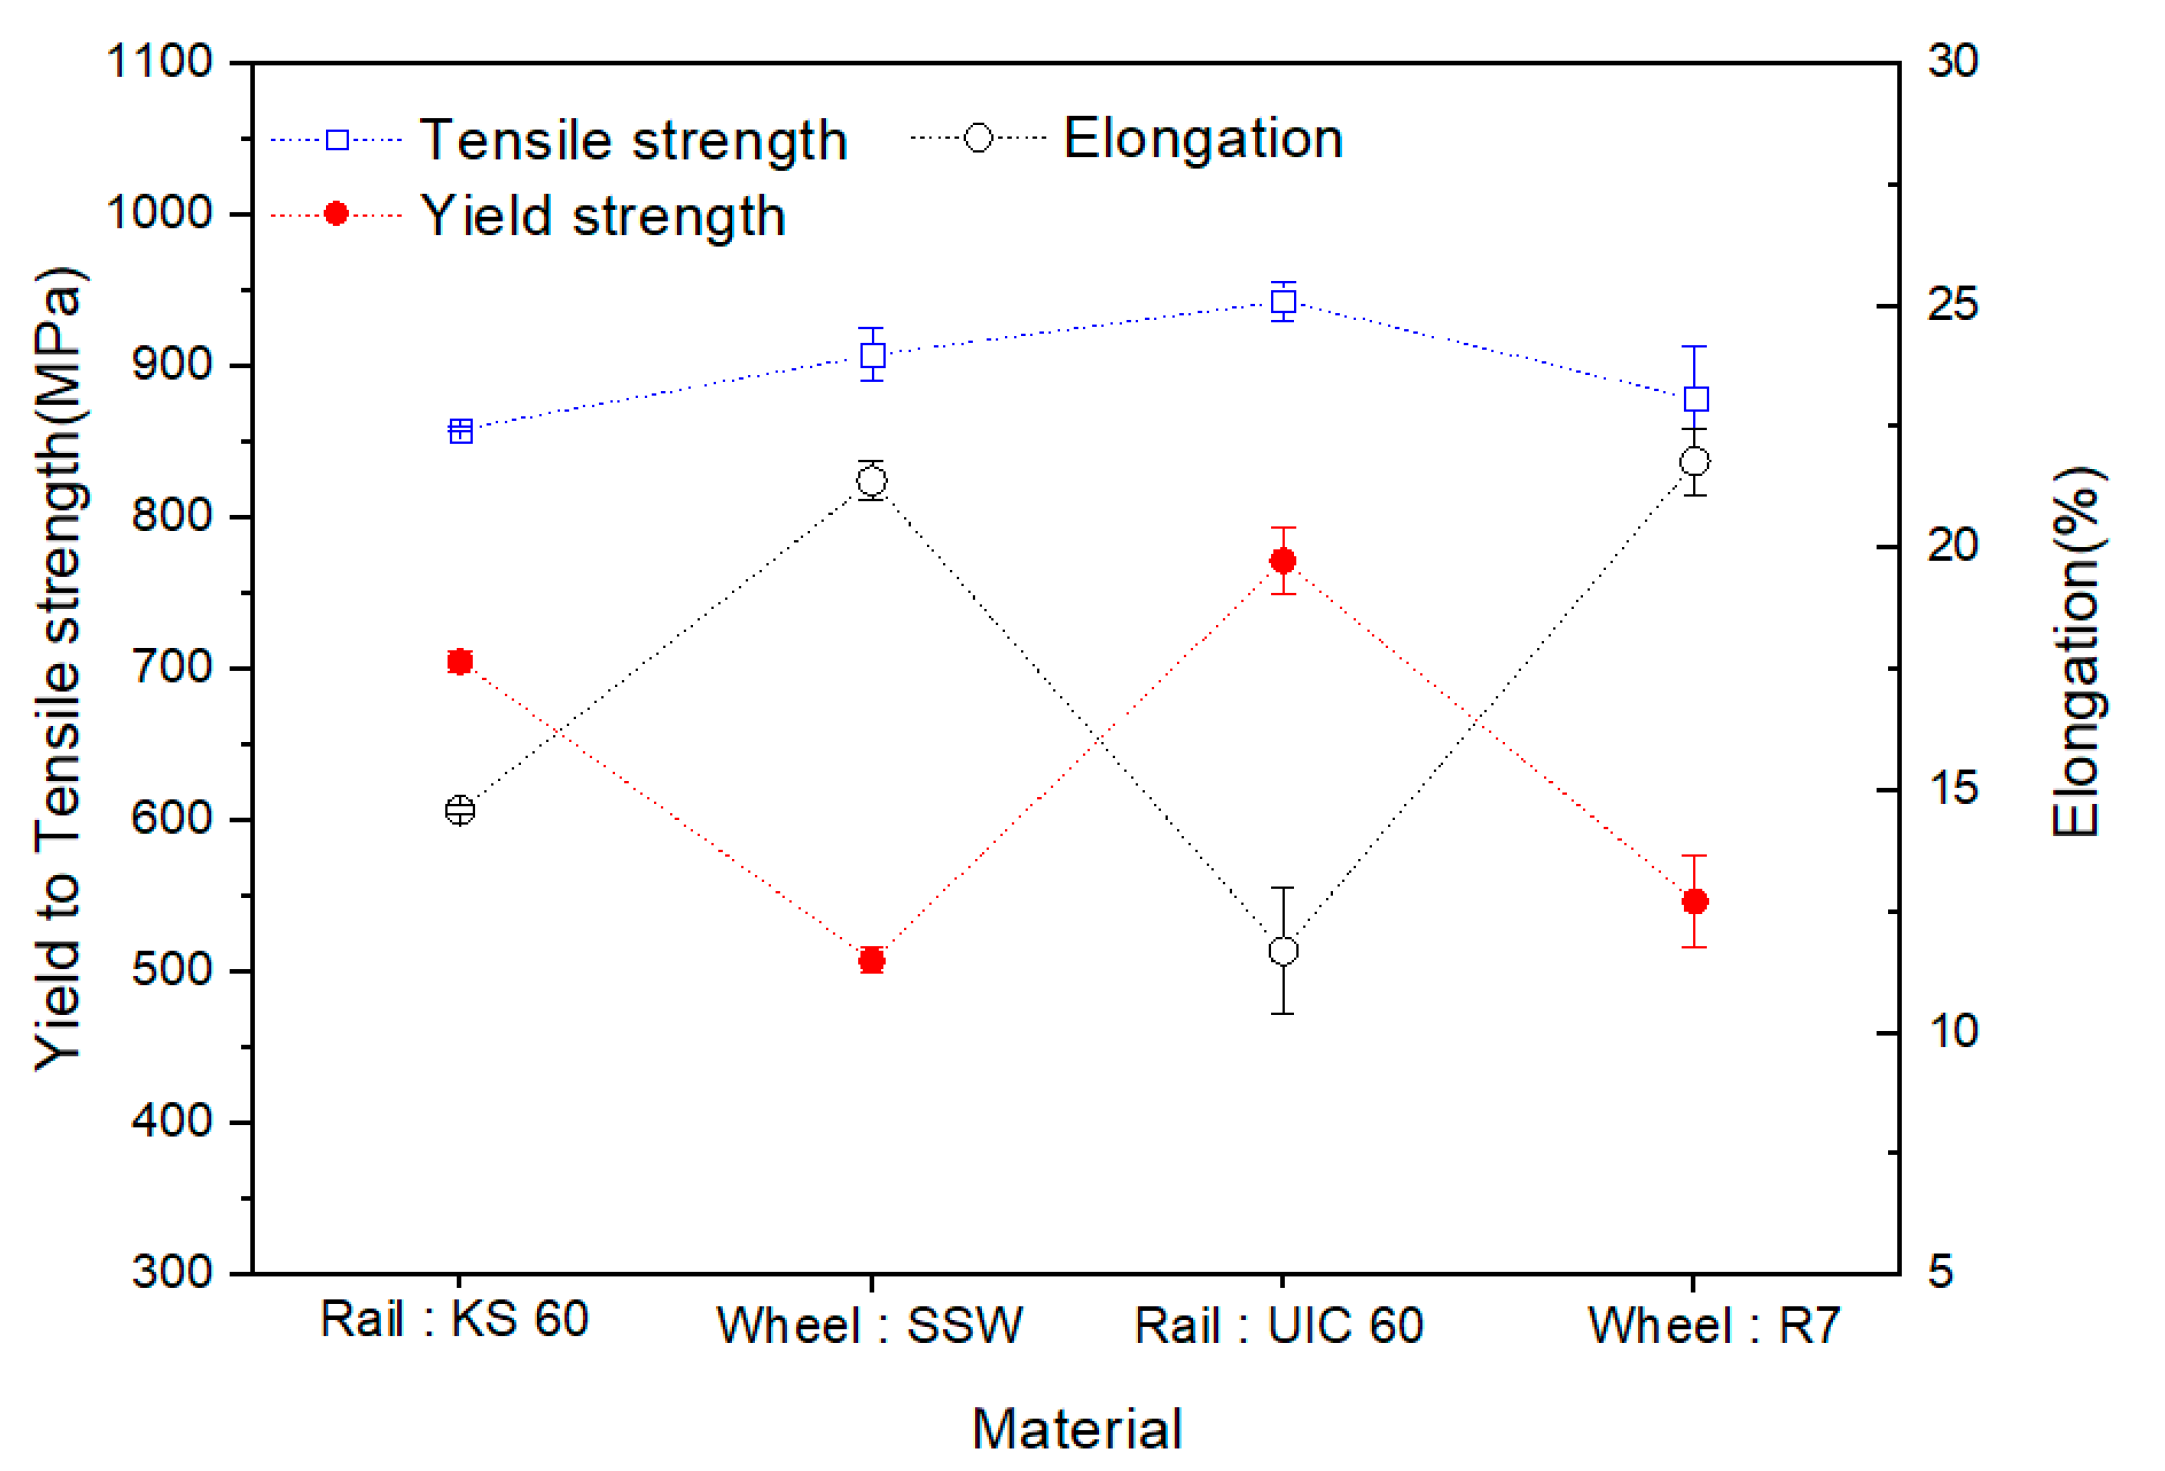
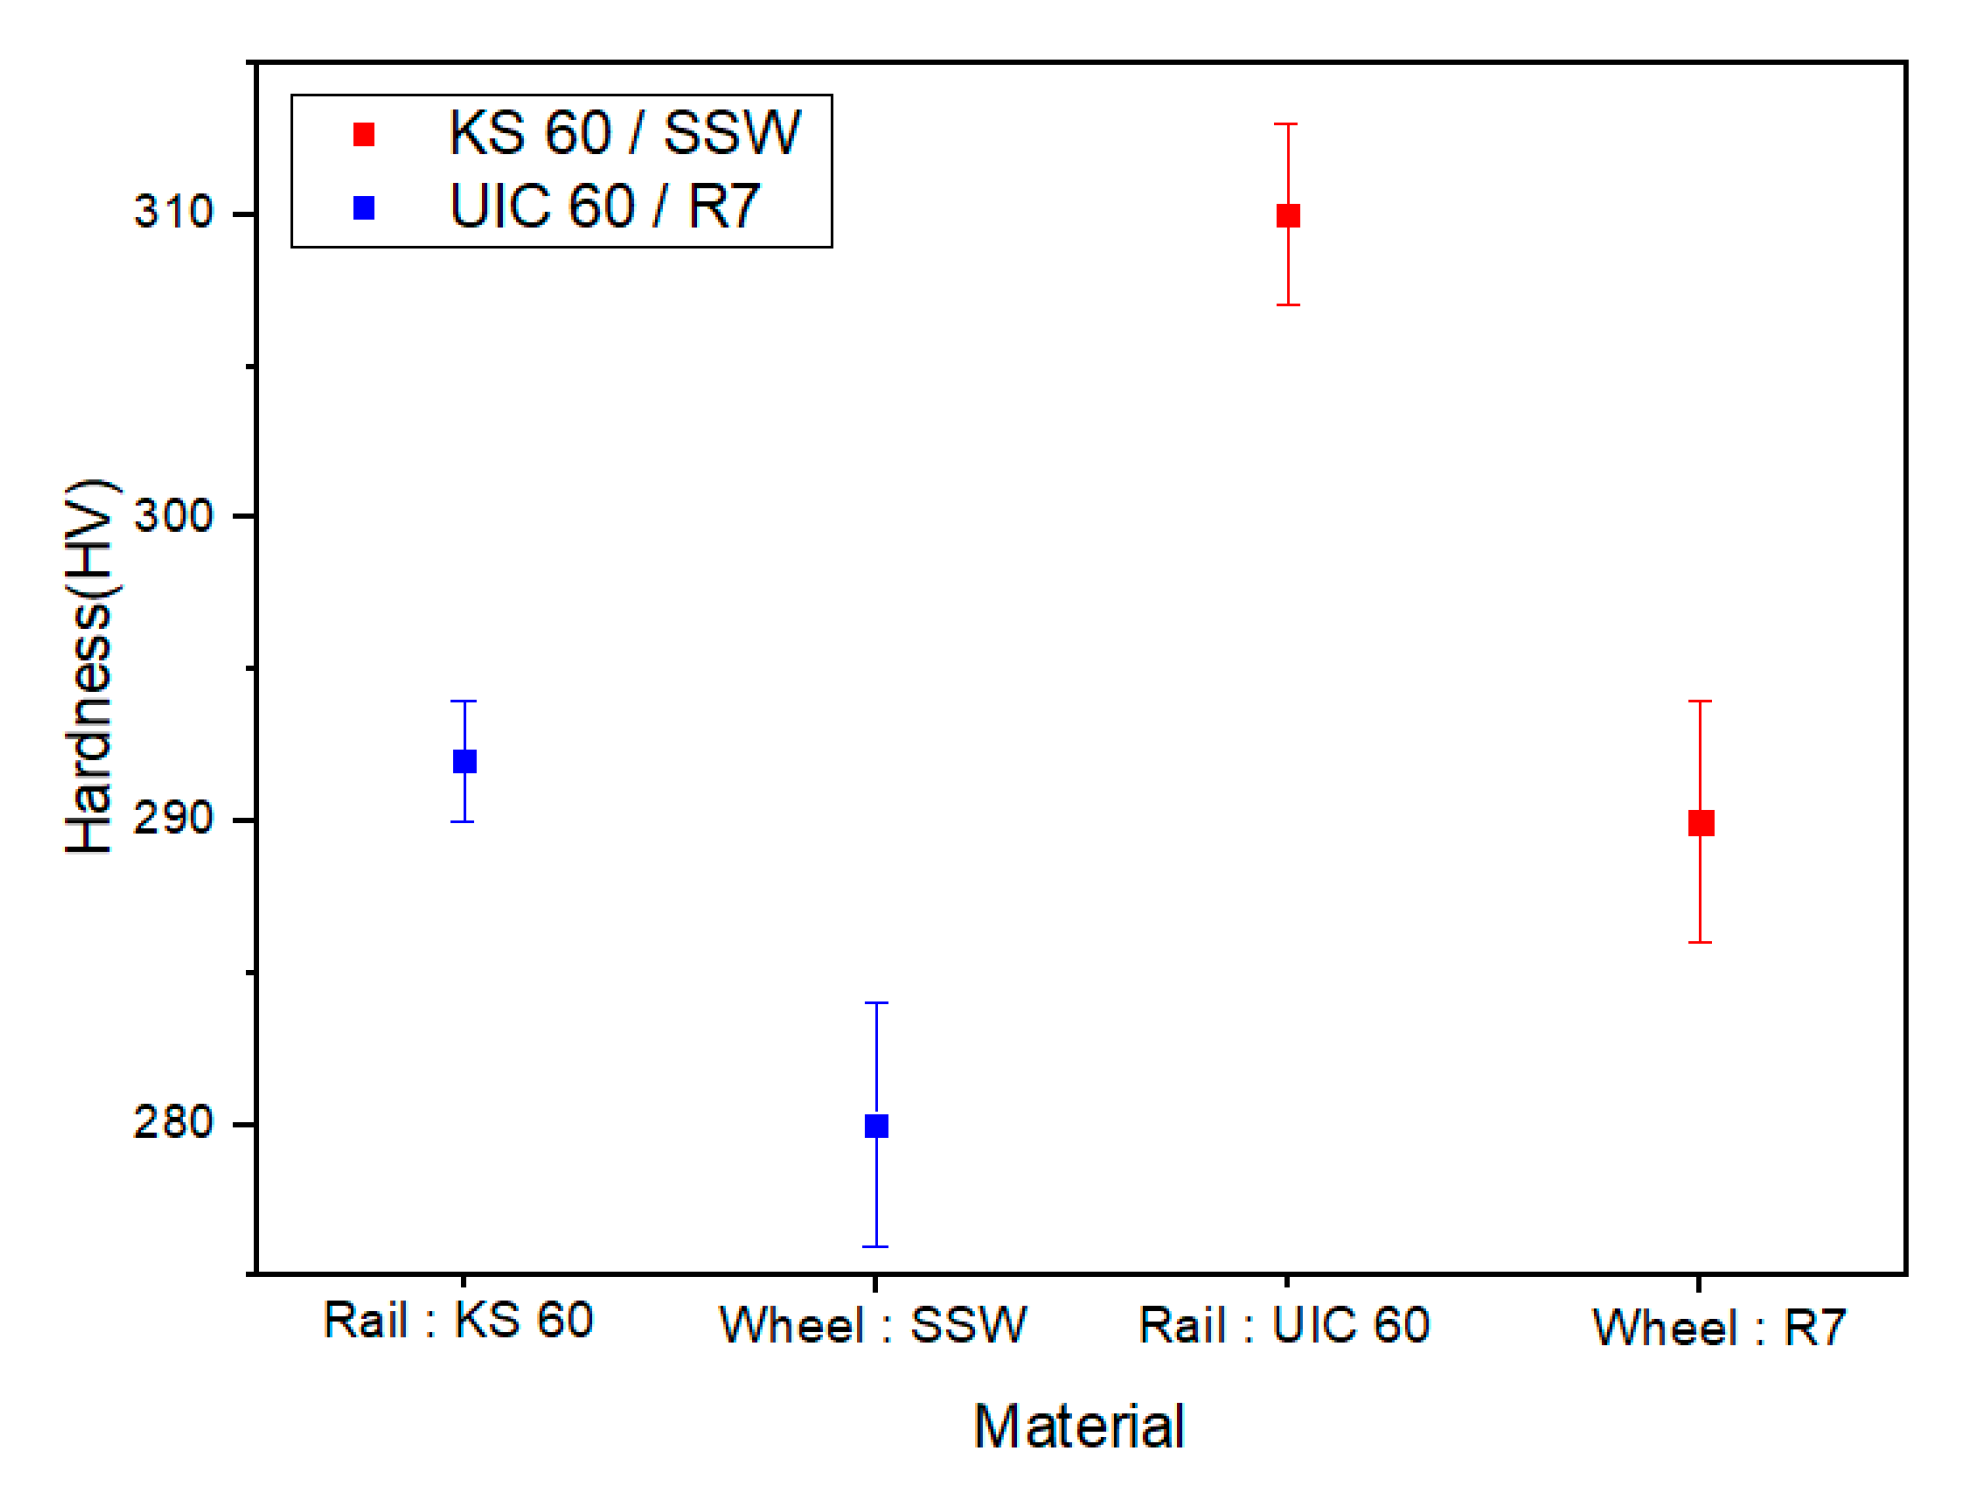
2.2.2. Test Results
2.3. Fatigue Crack Growth Test
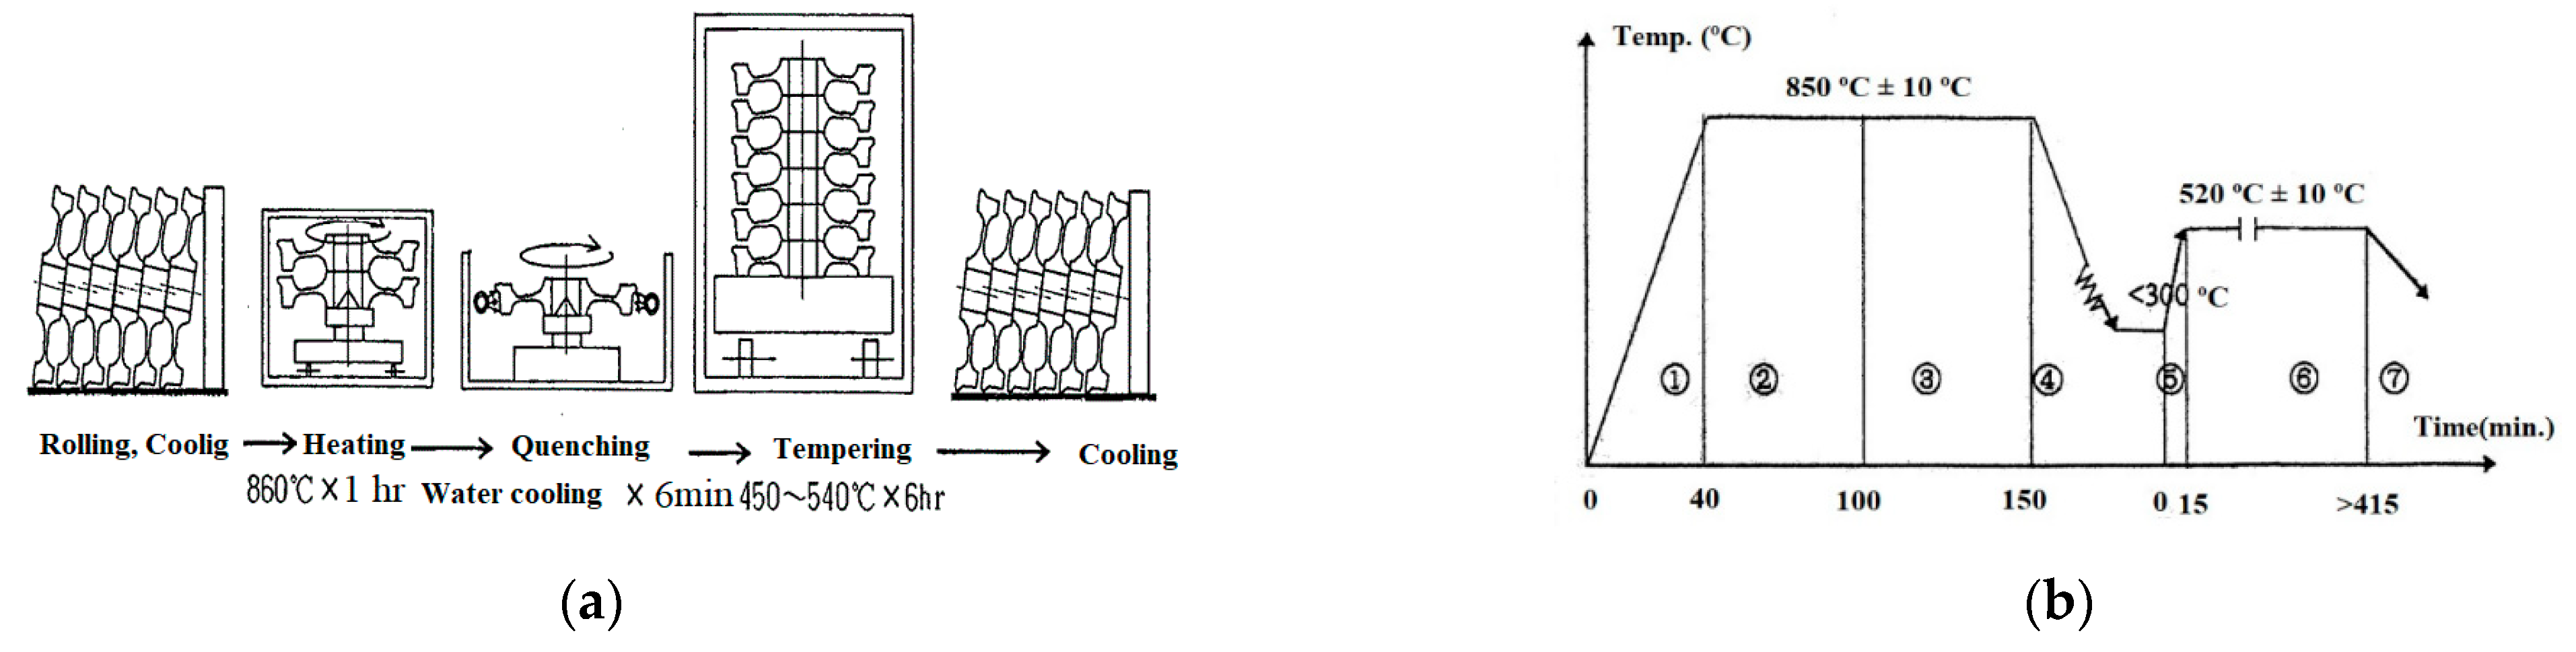
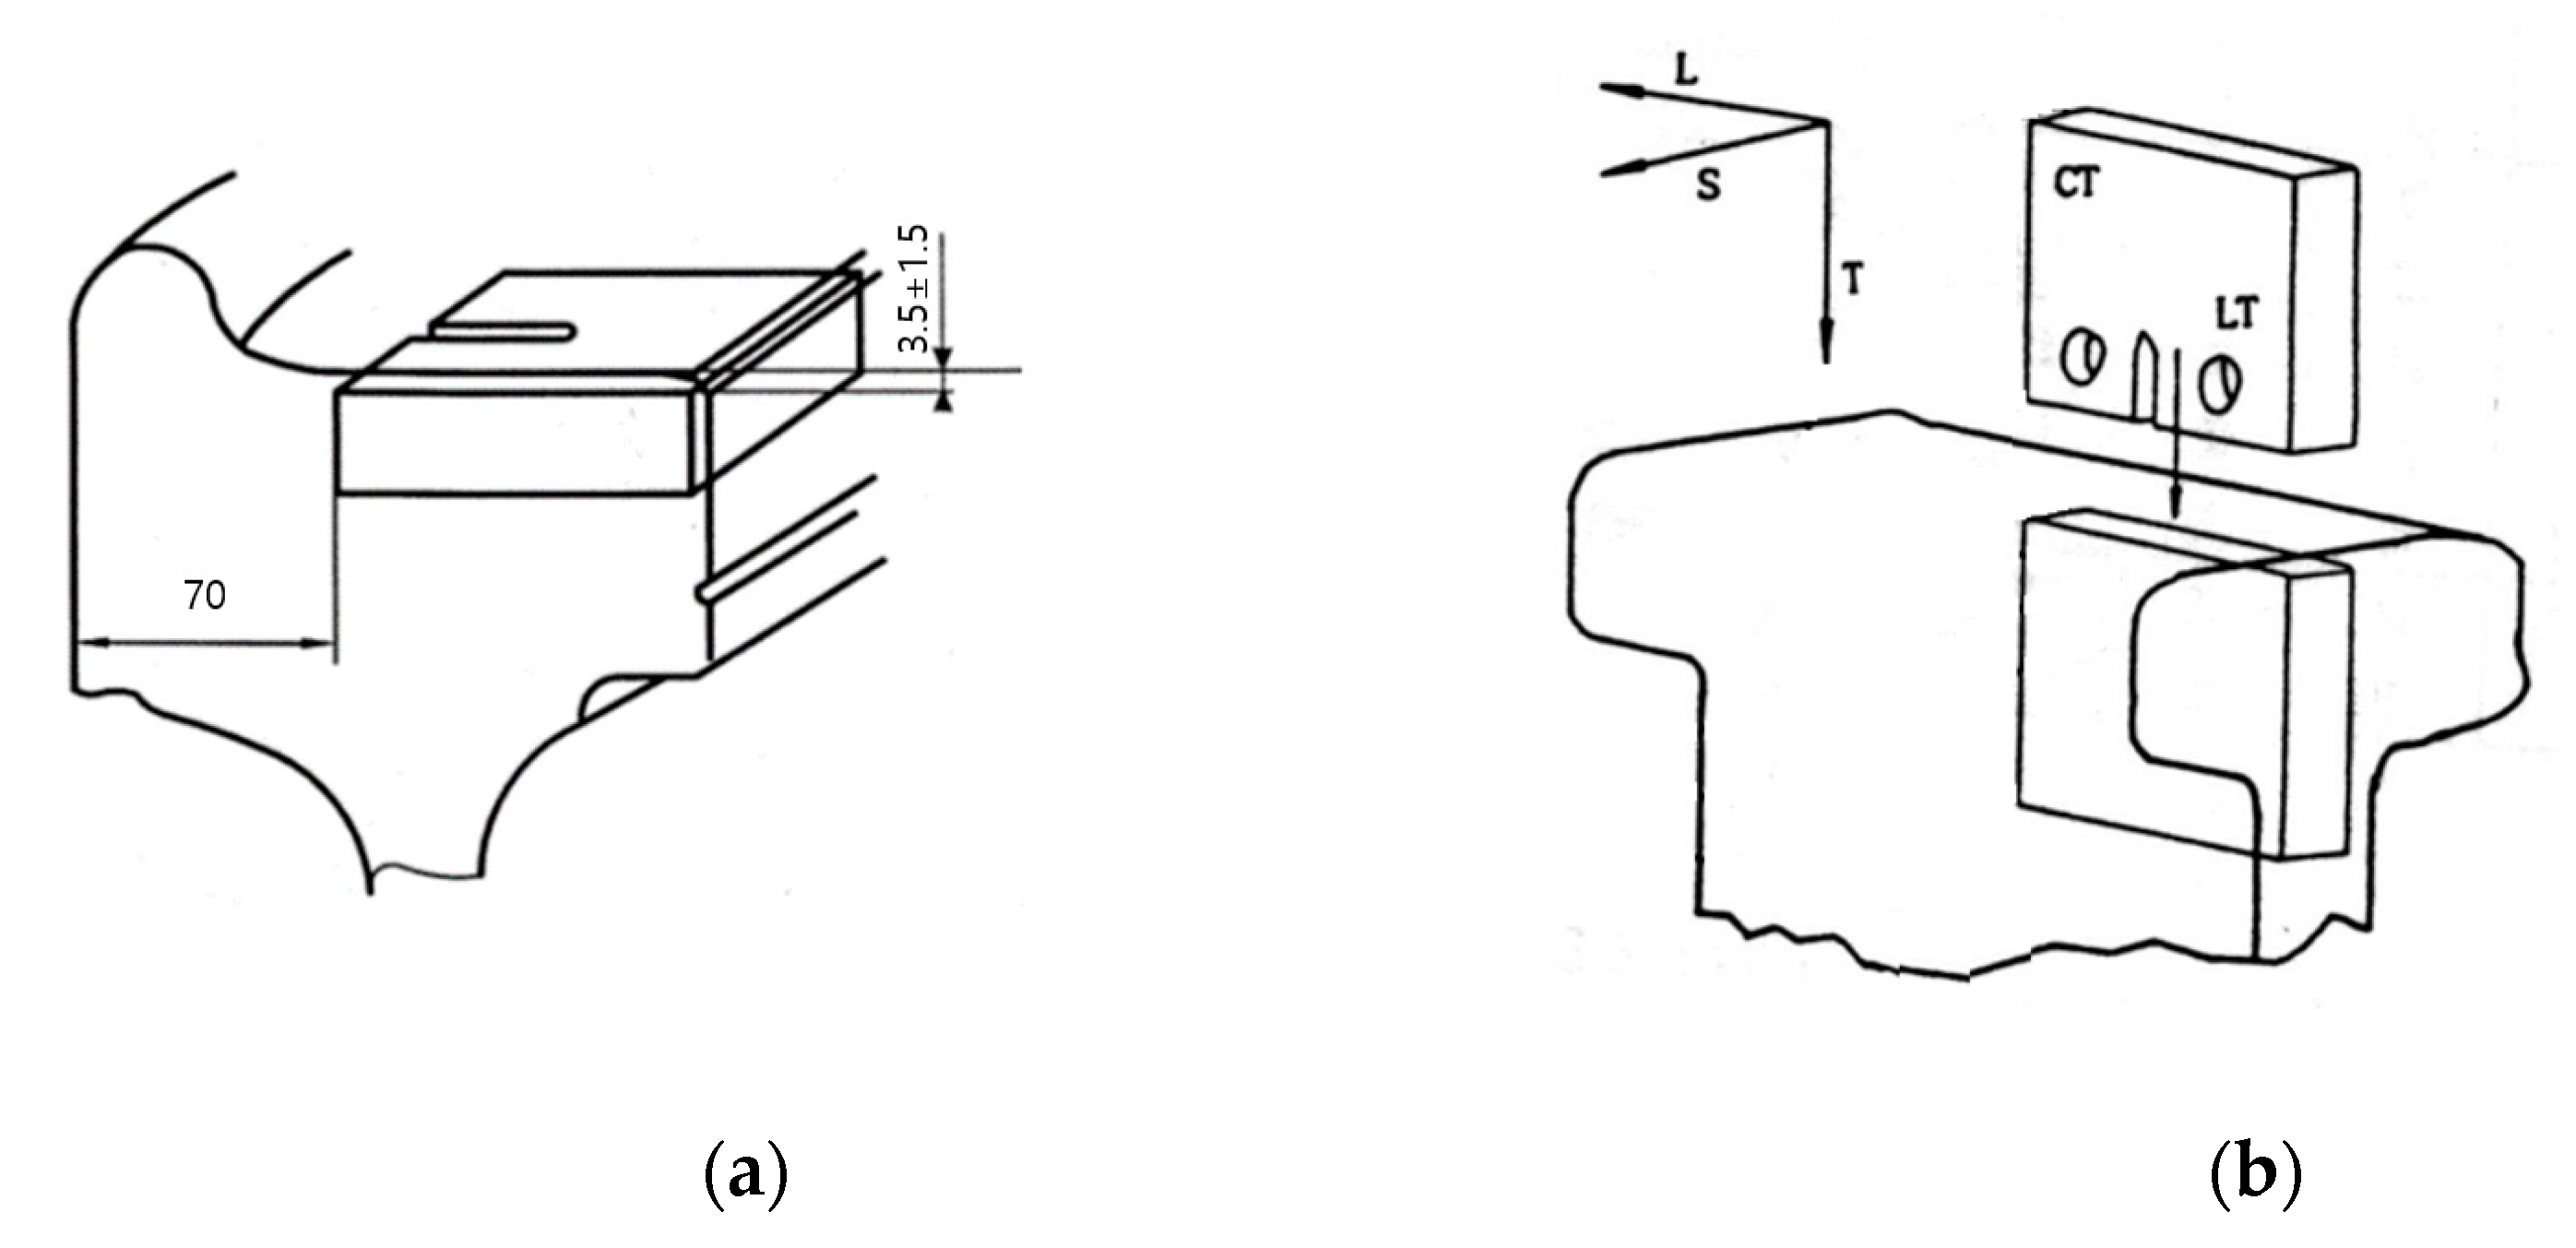
2.3.1. Test Method
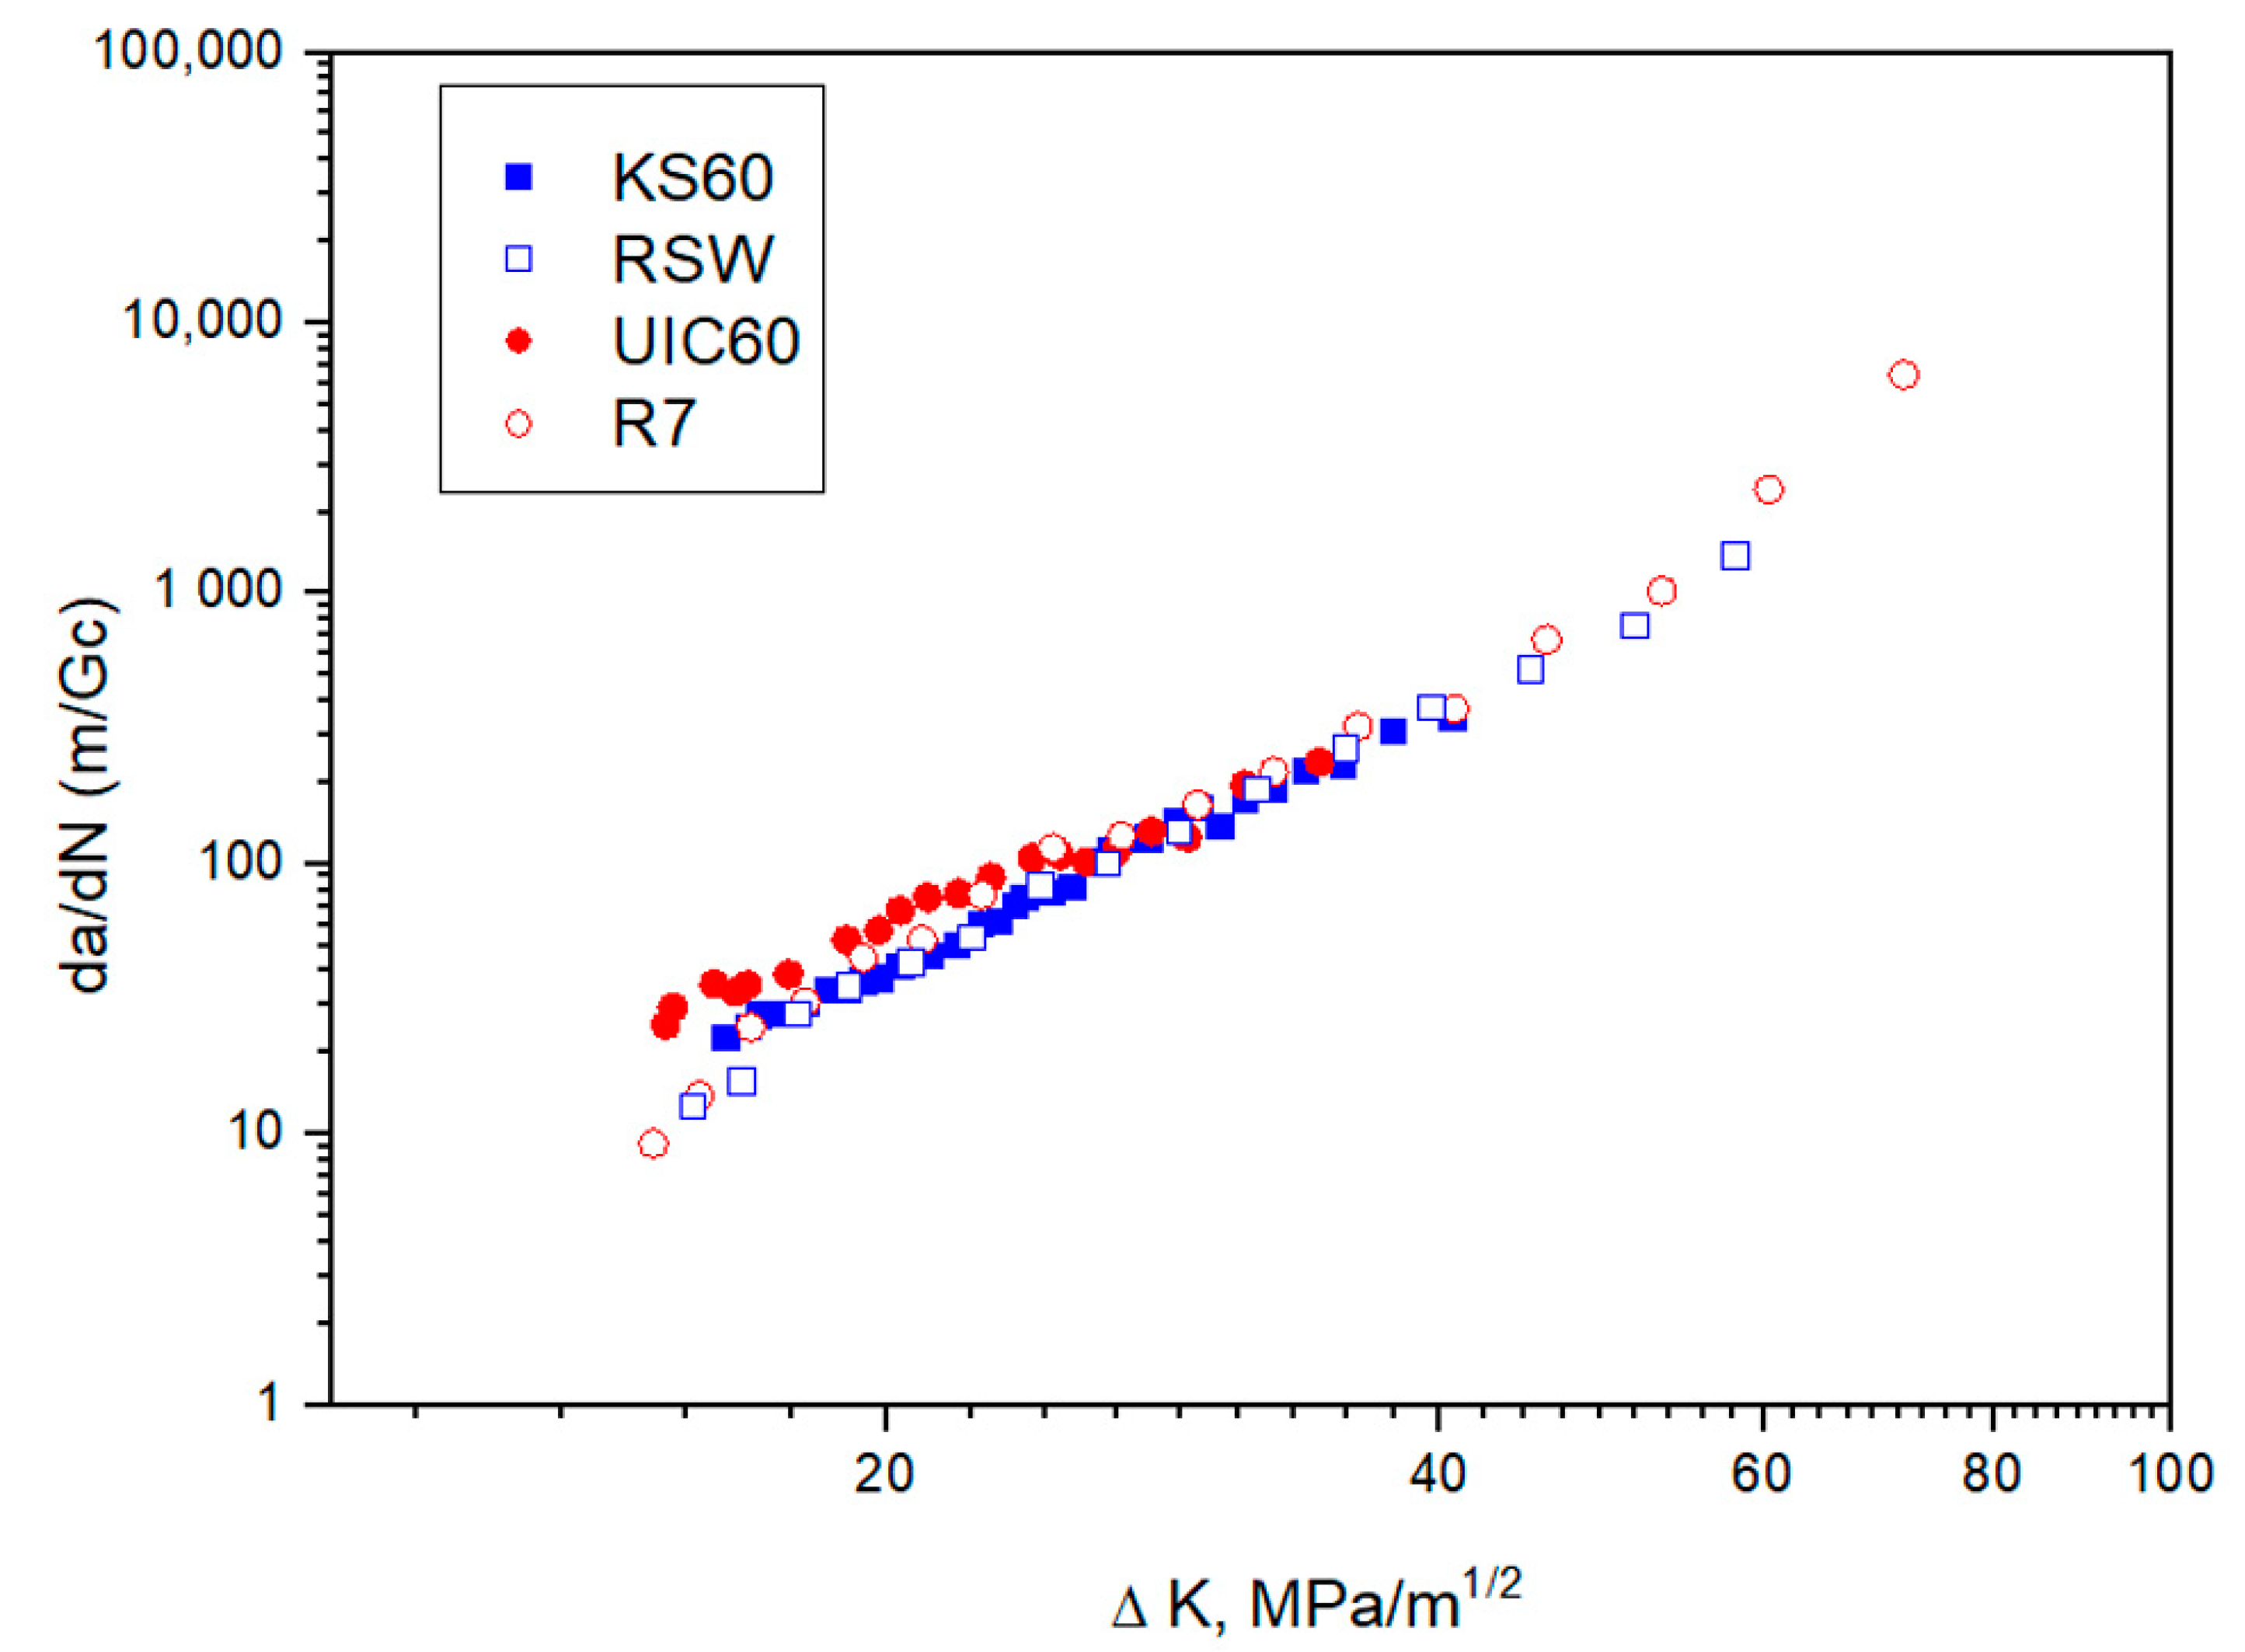
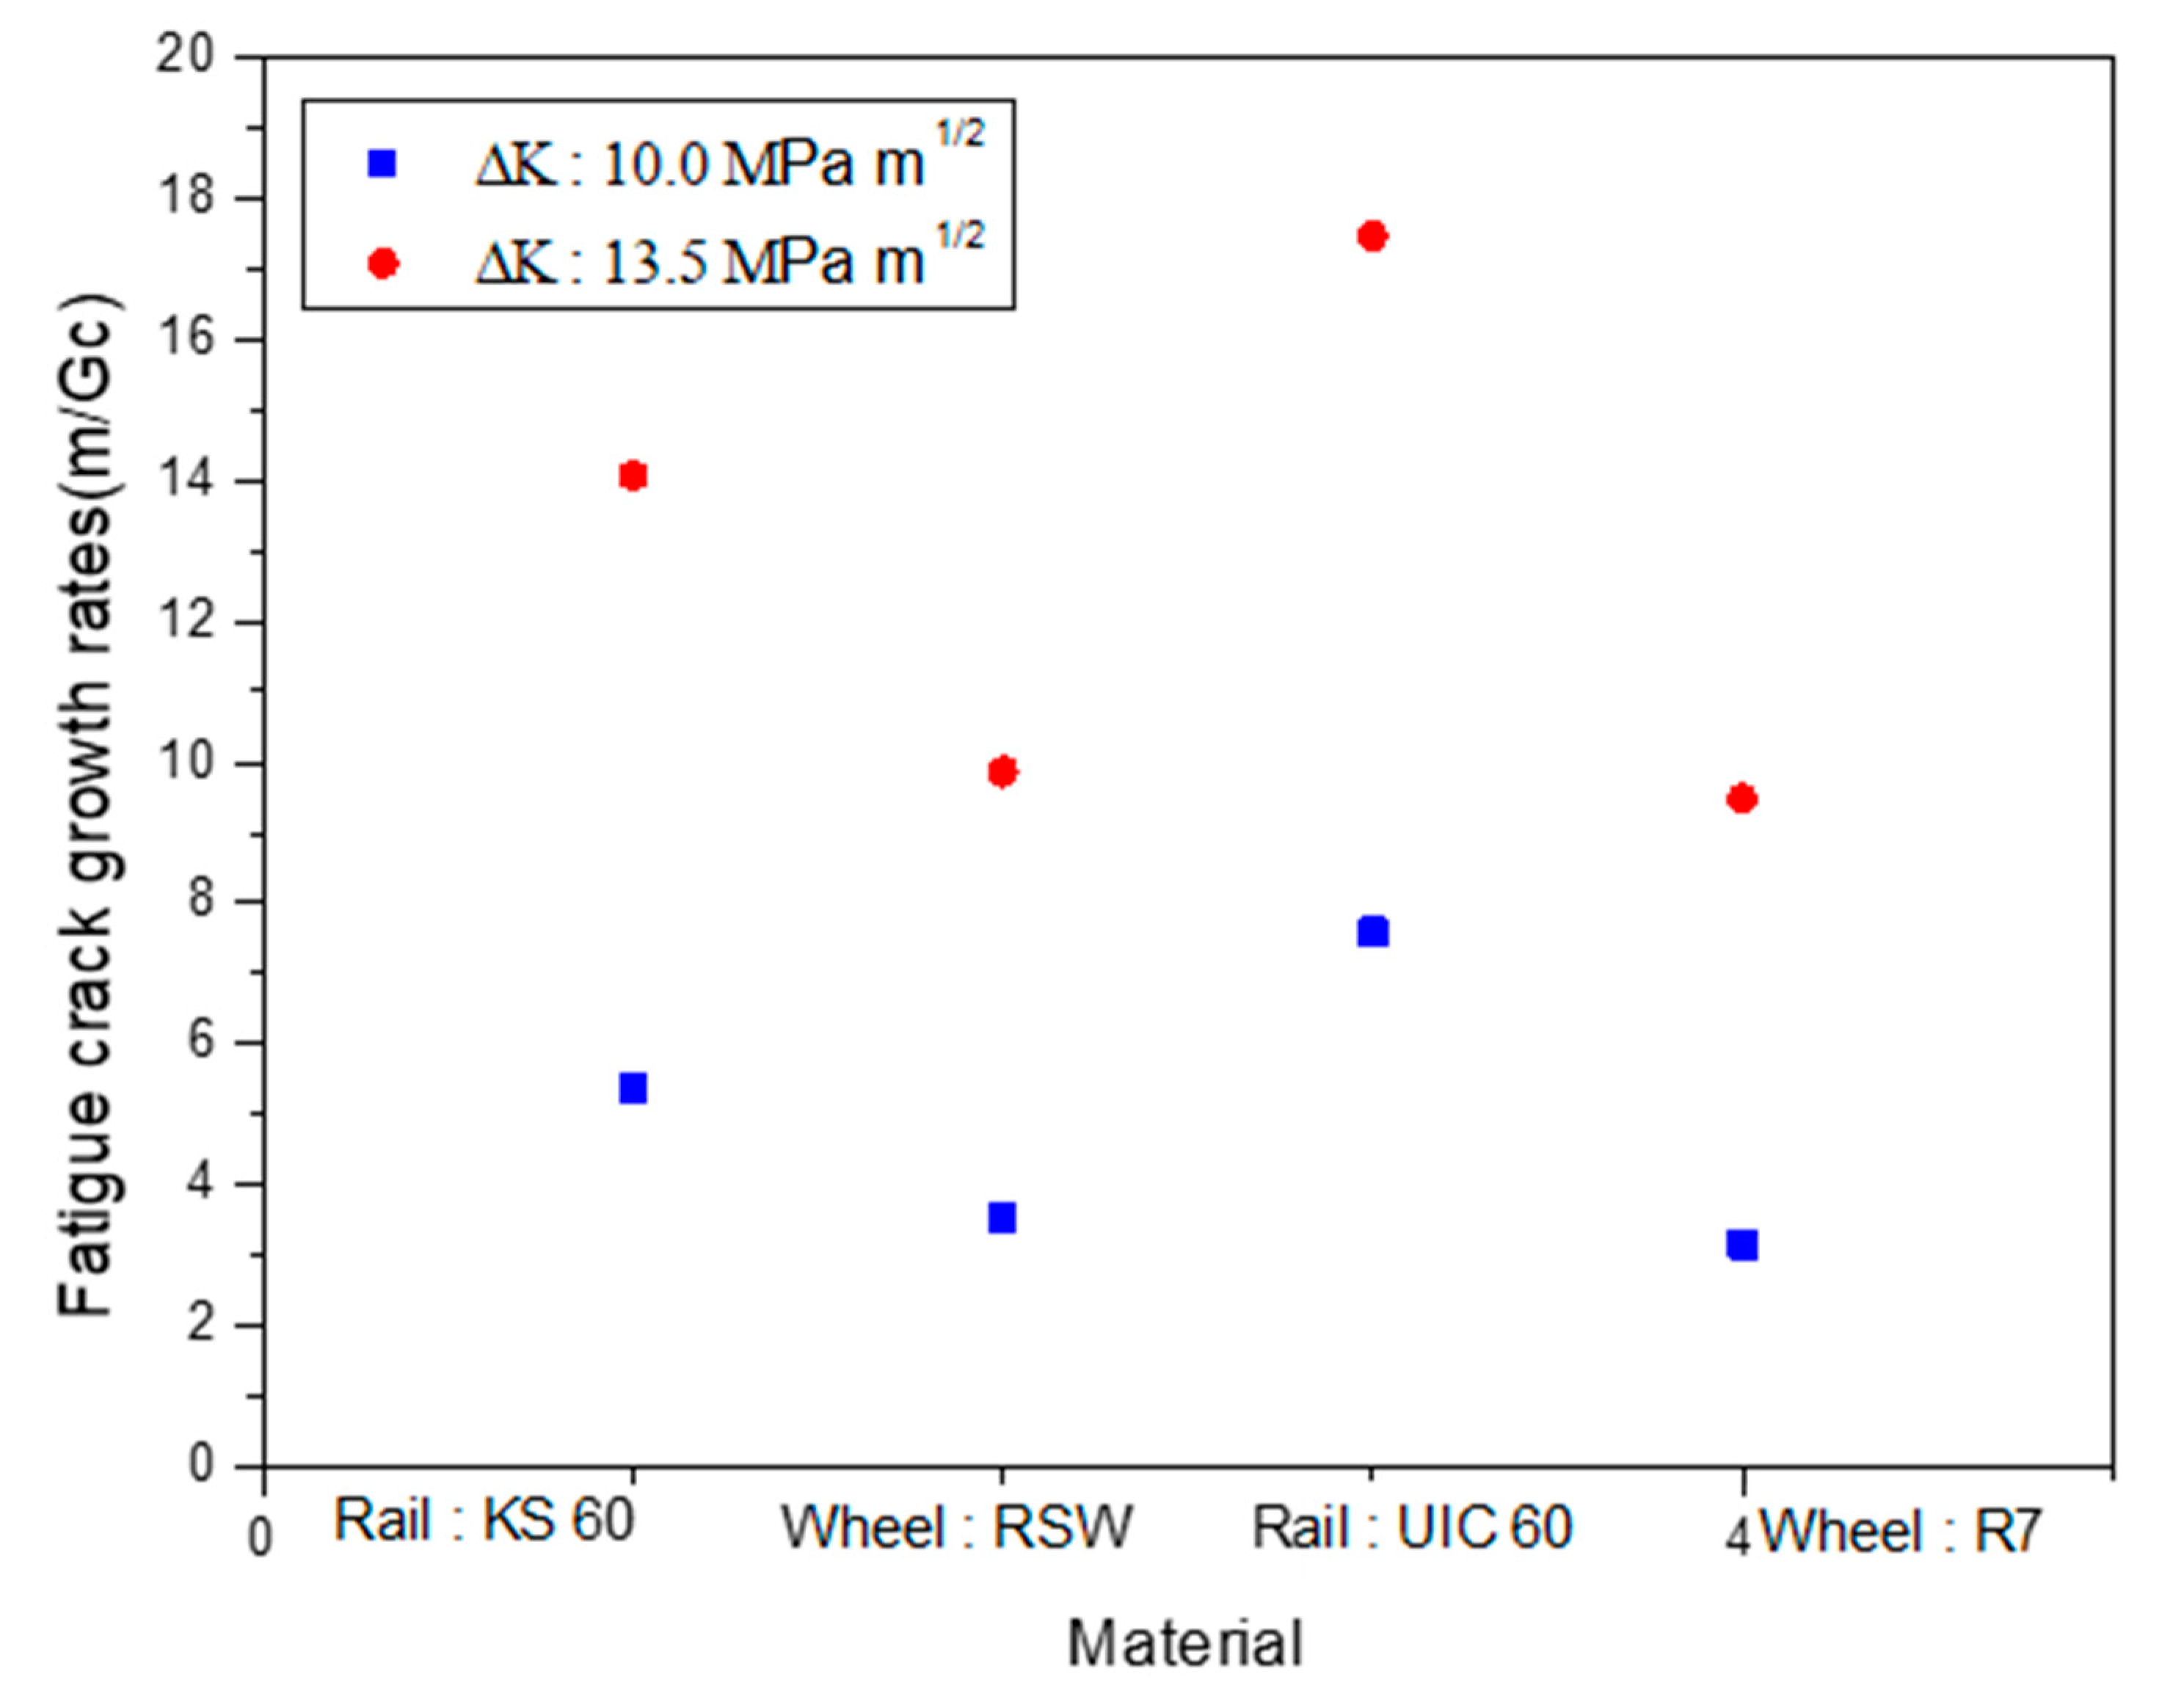
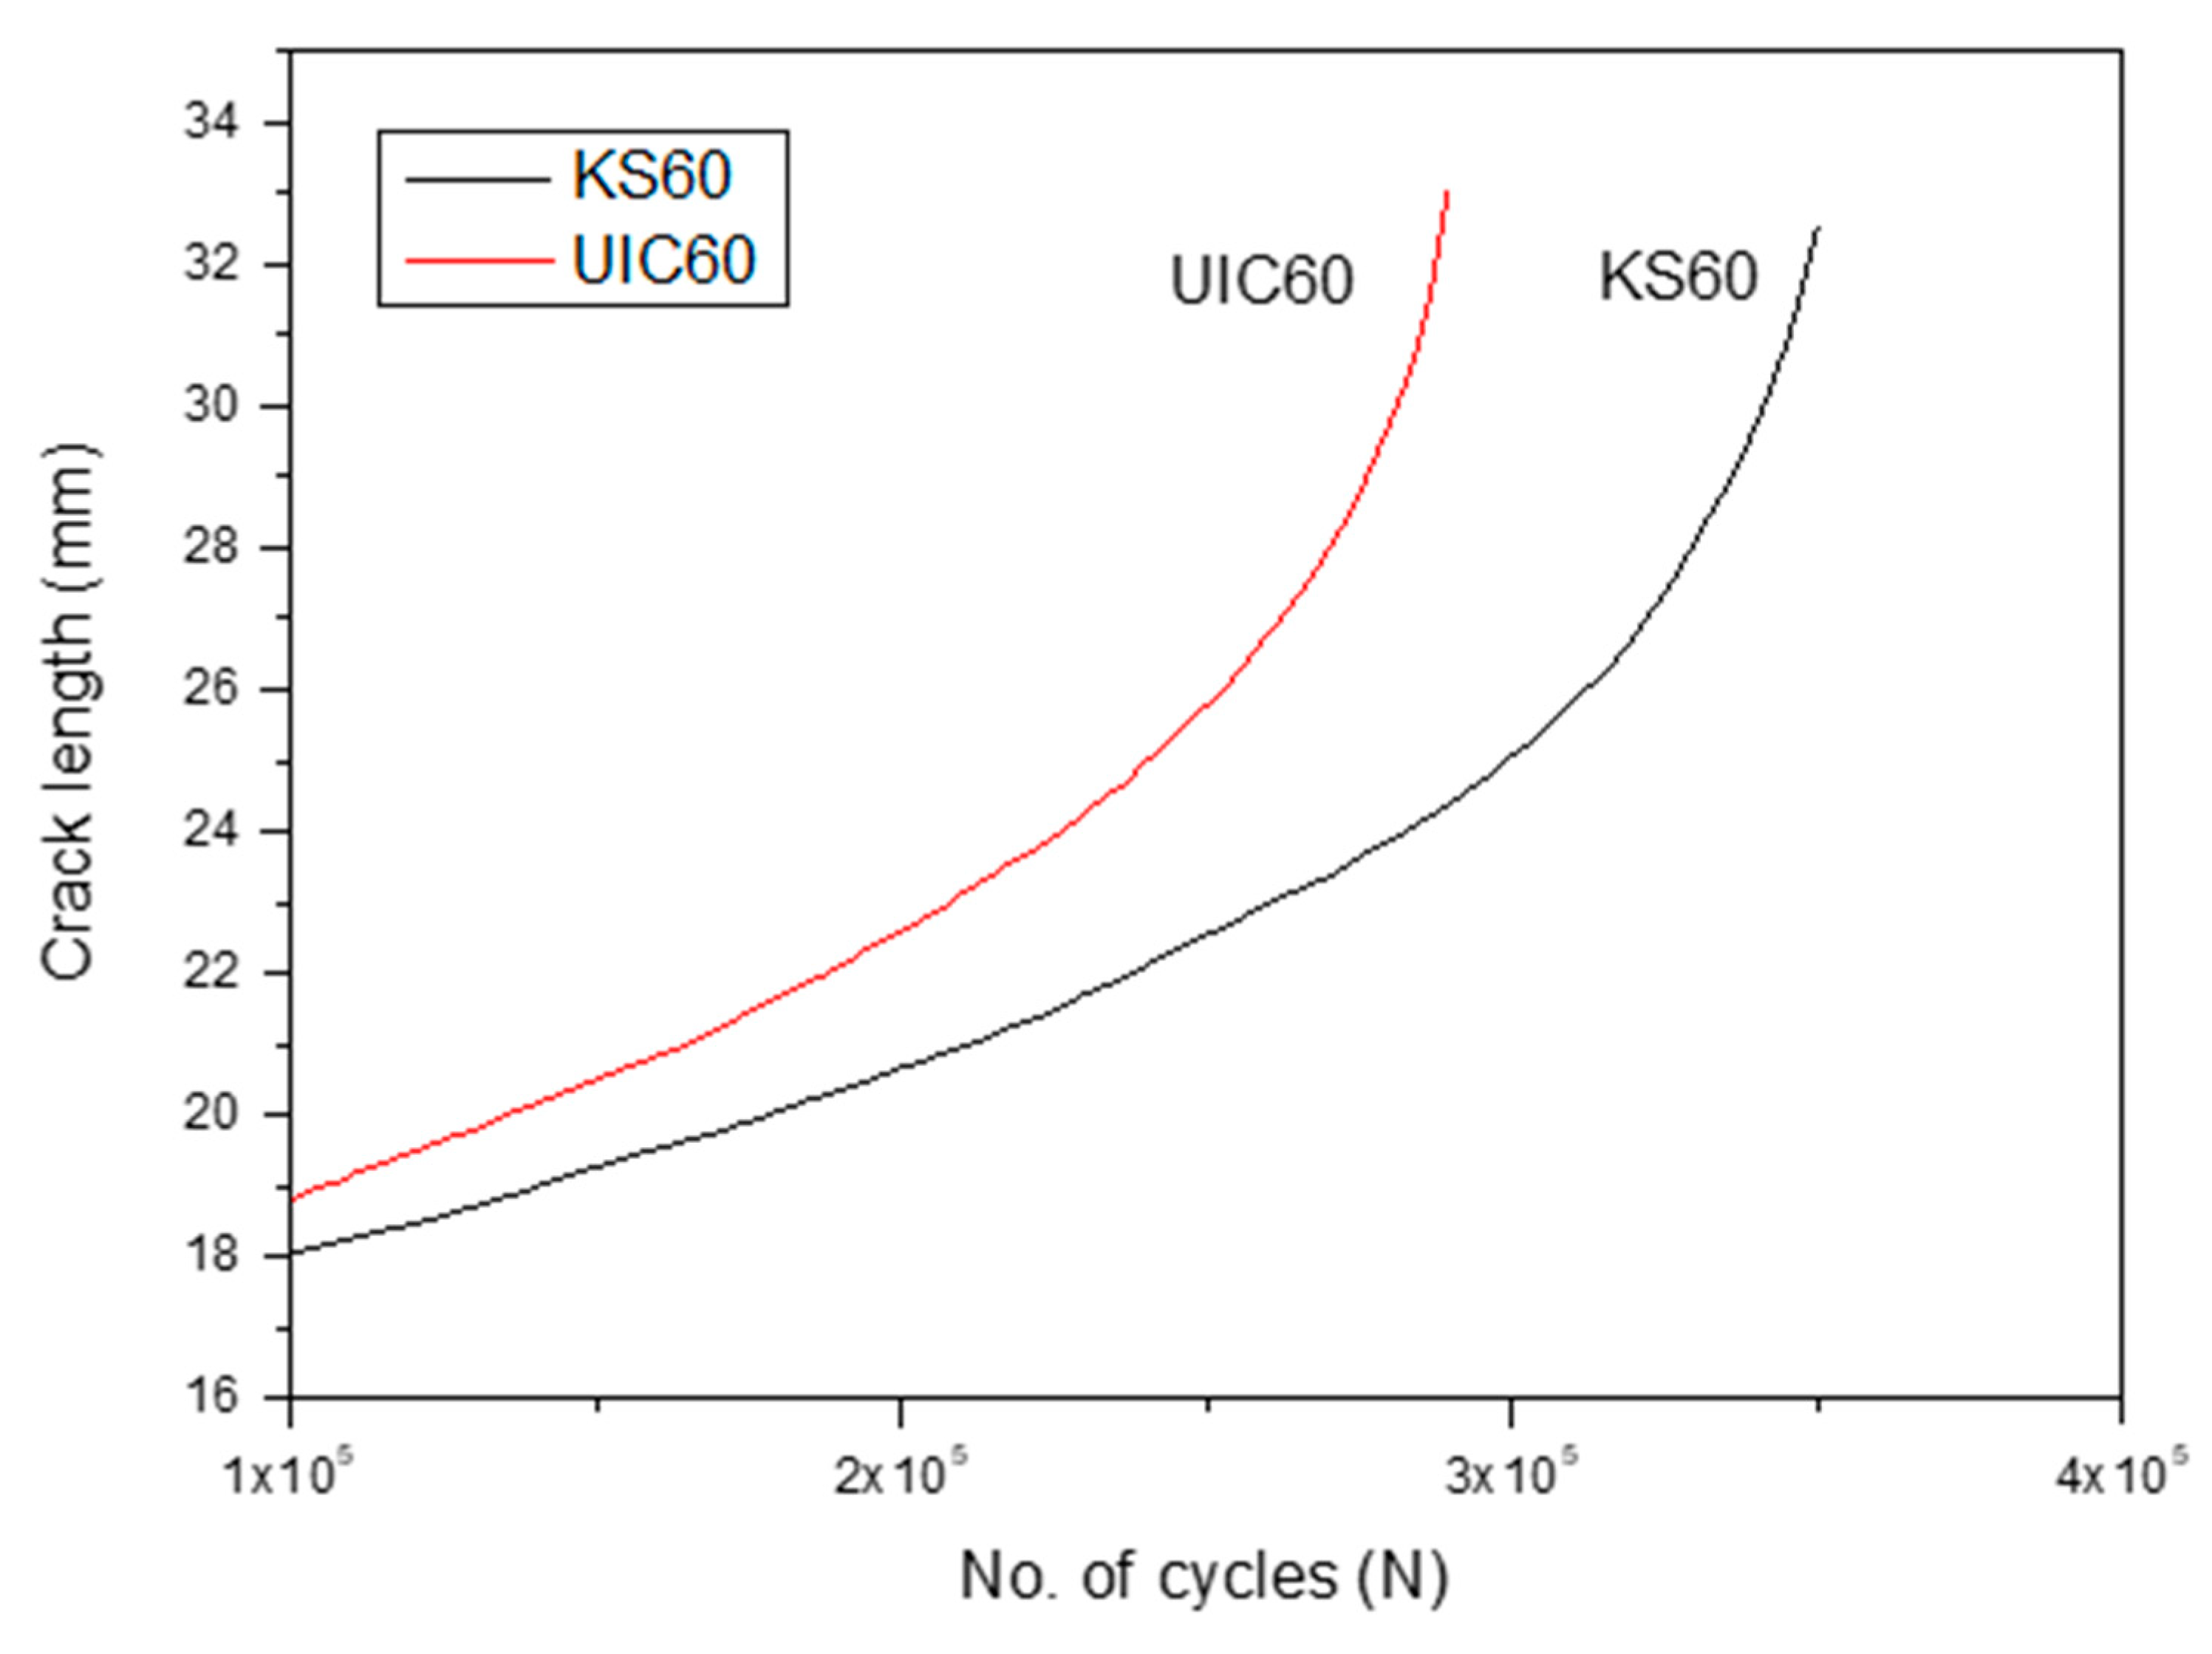
2.3.2. Test Results
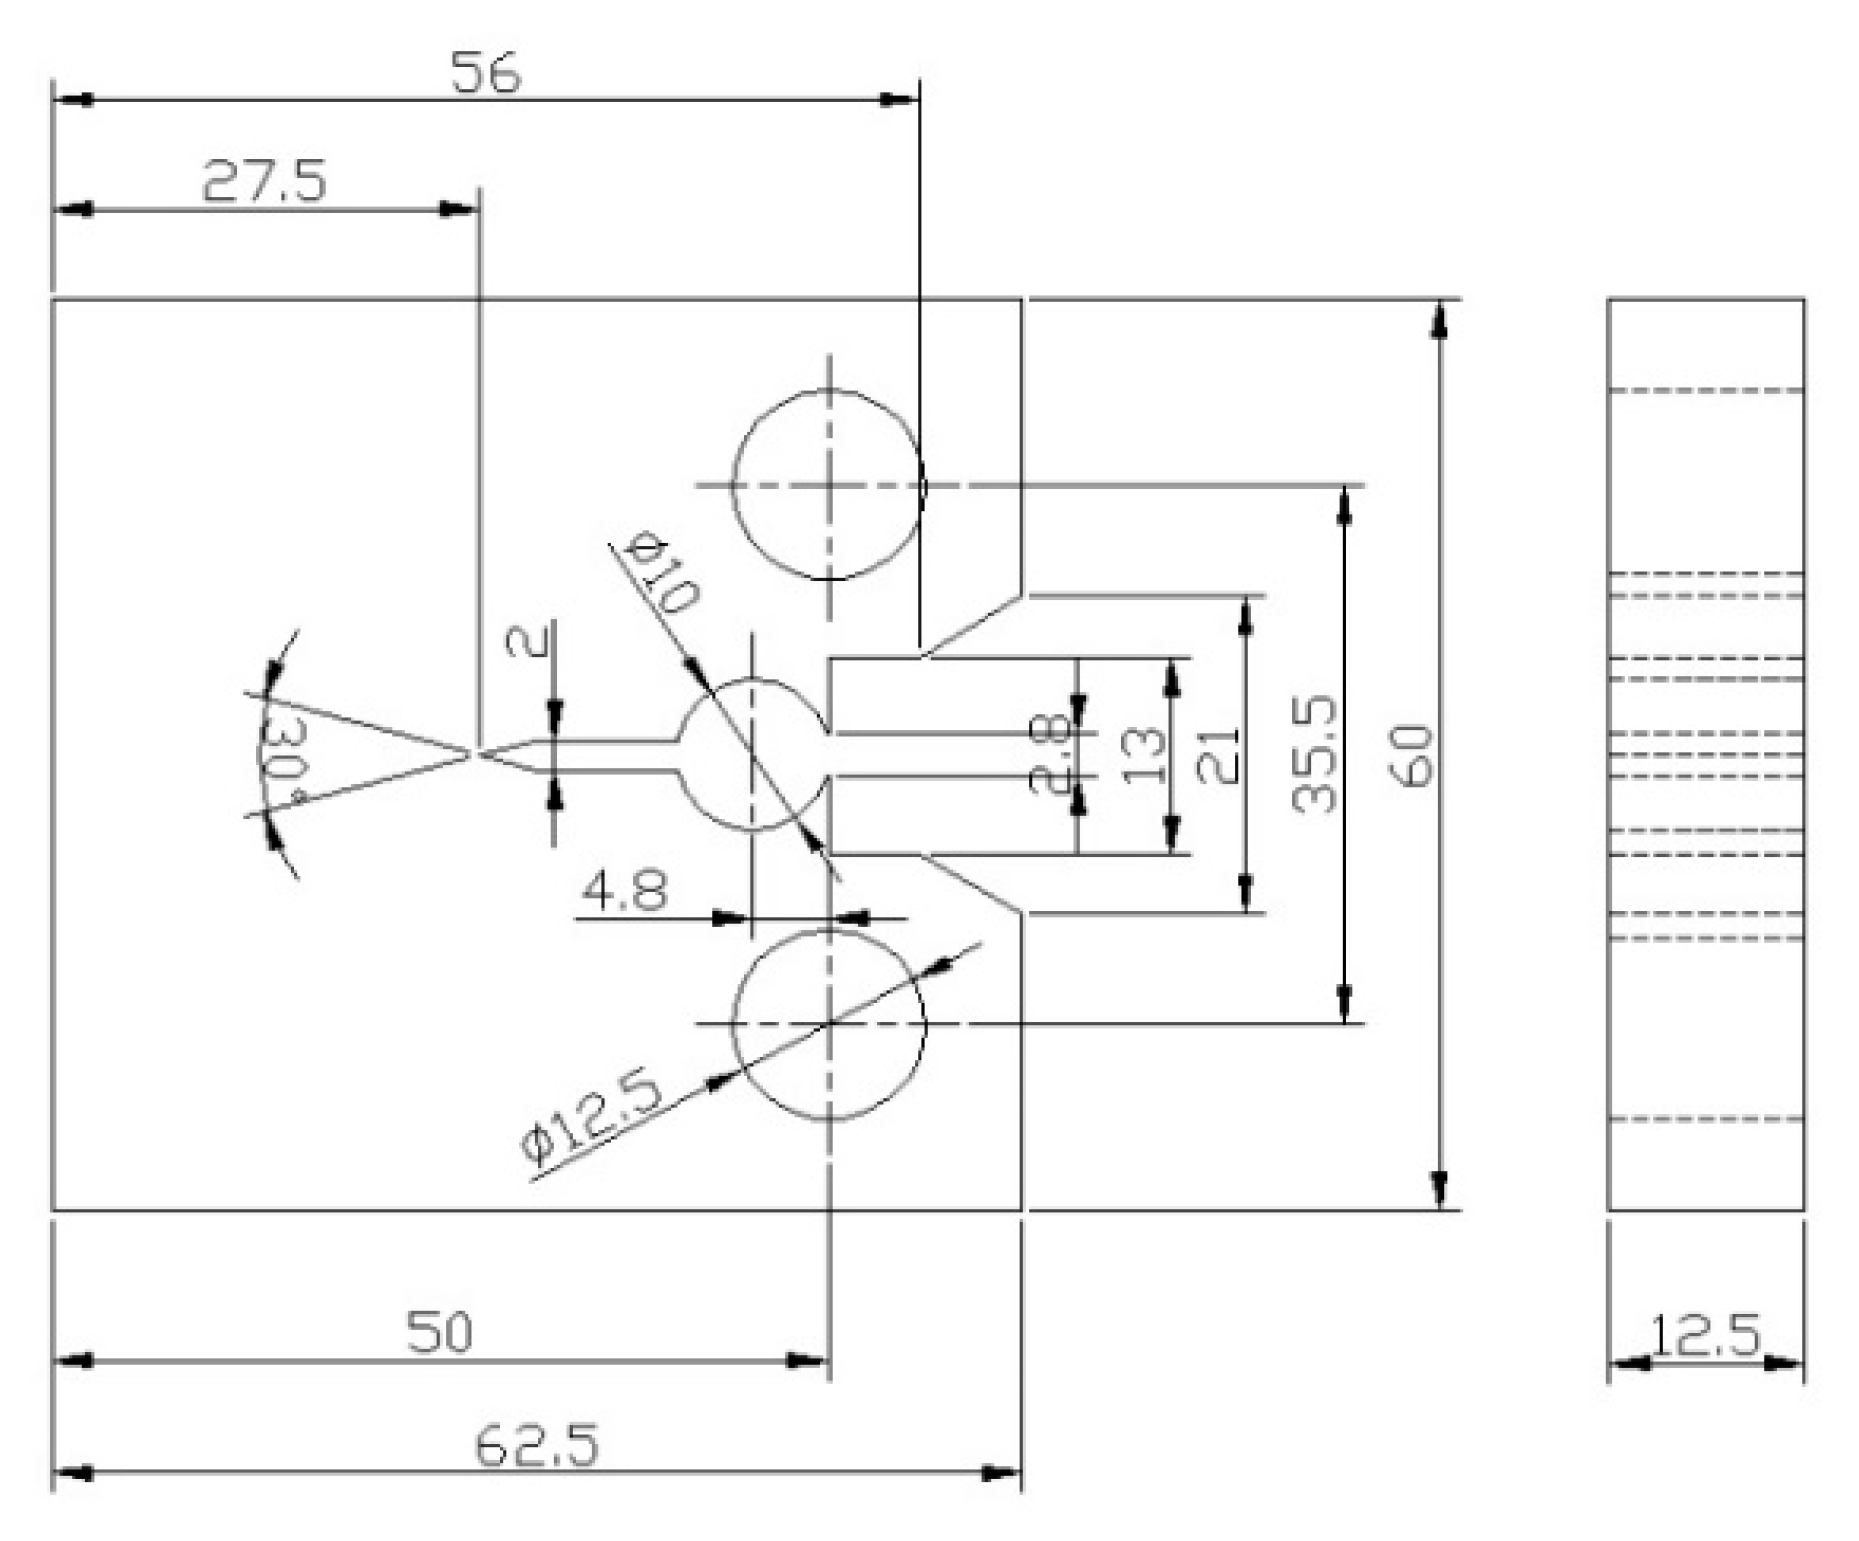
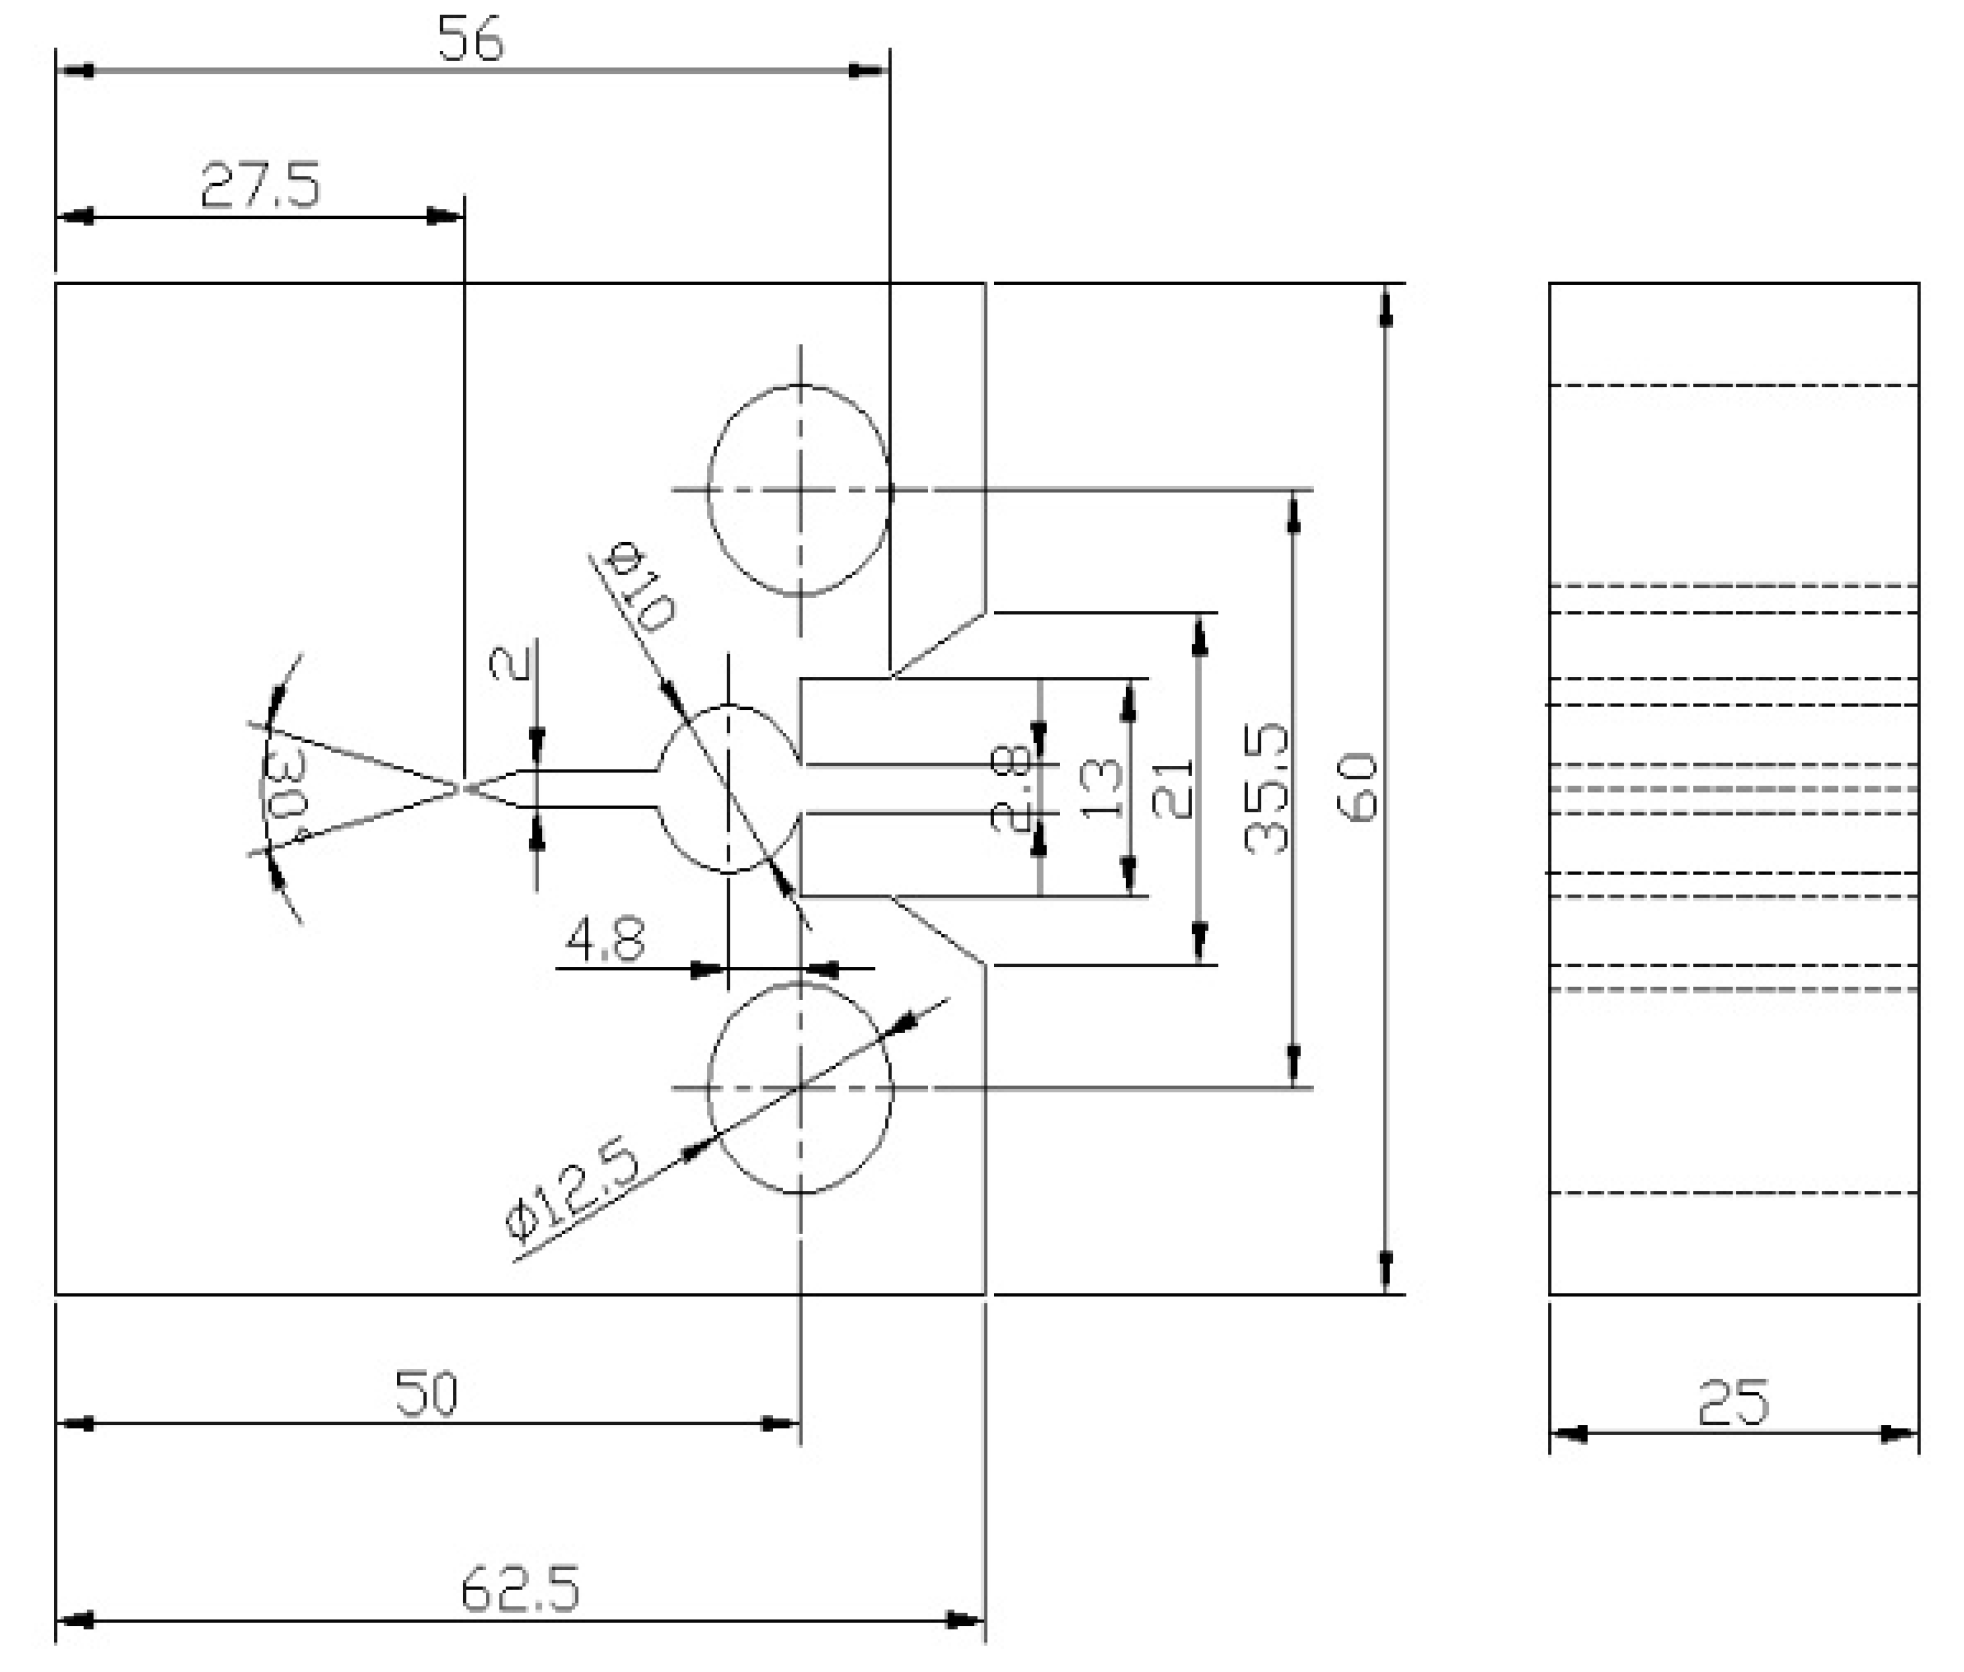
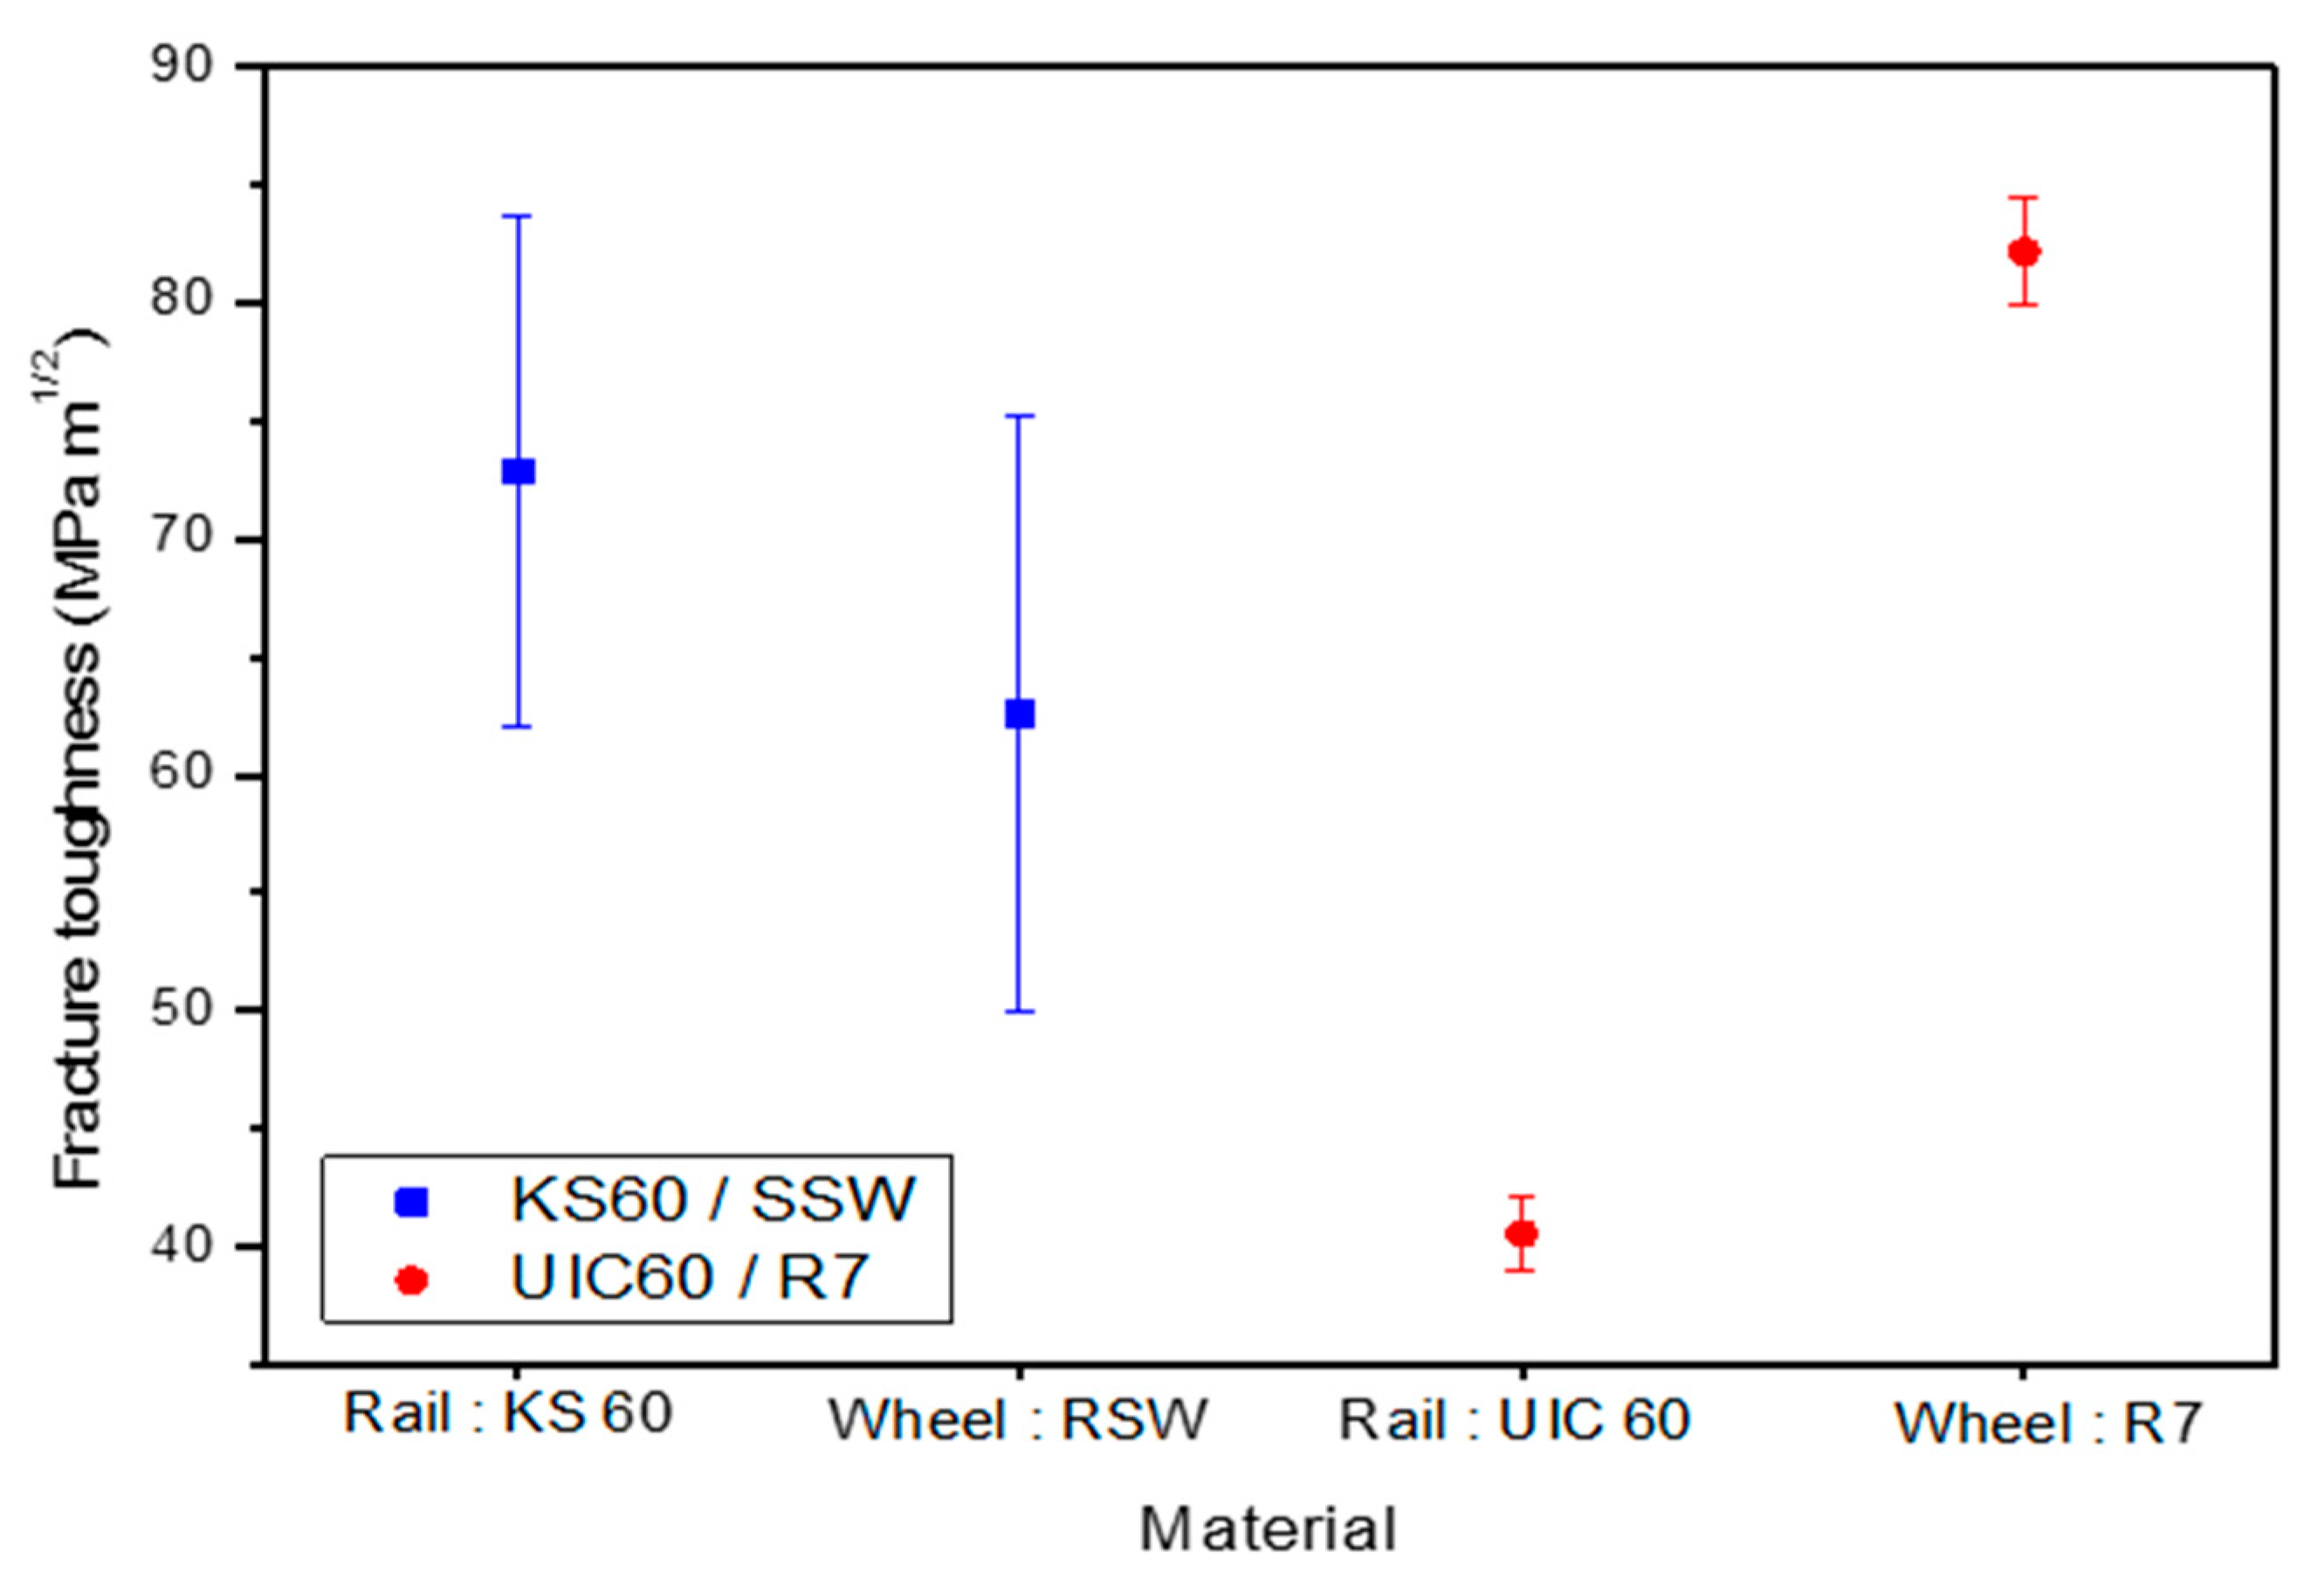
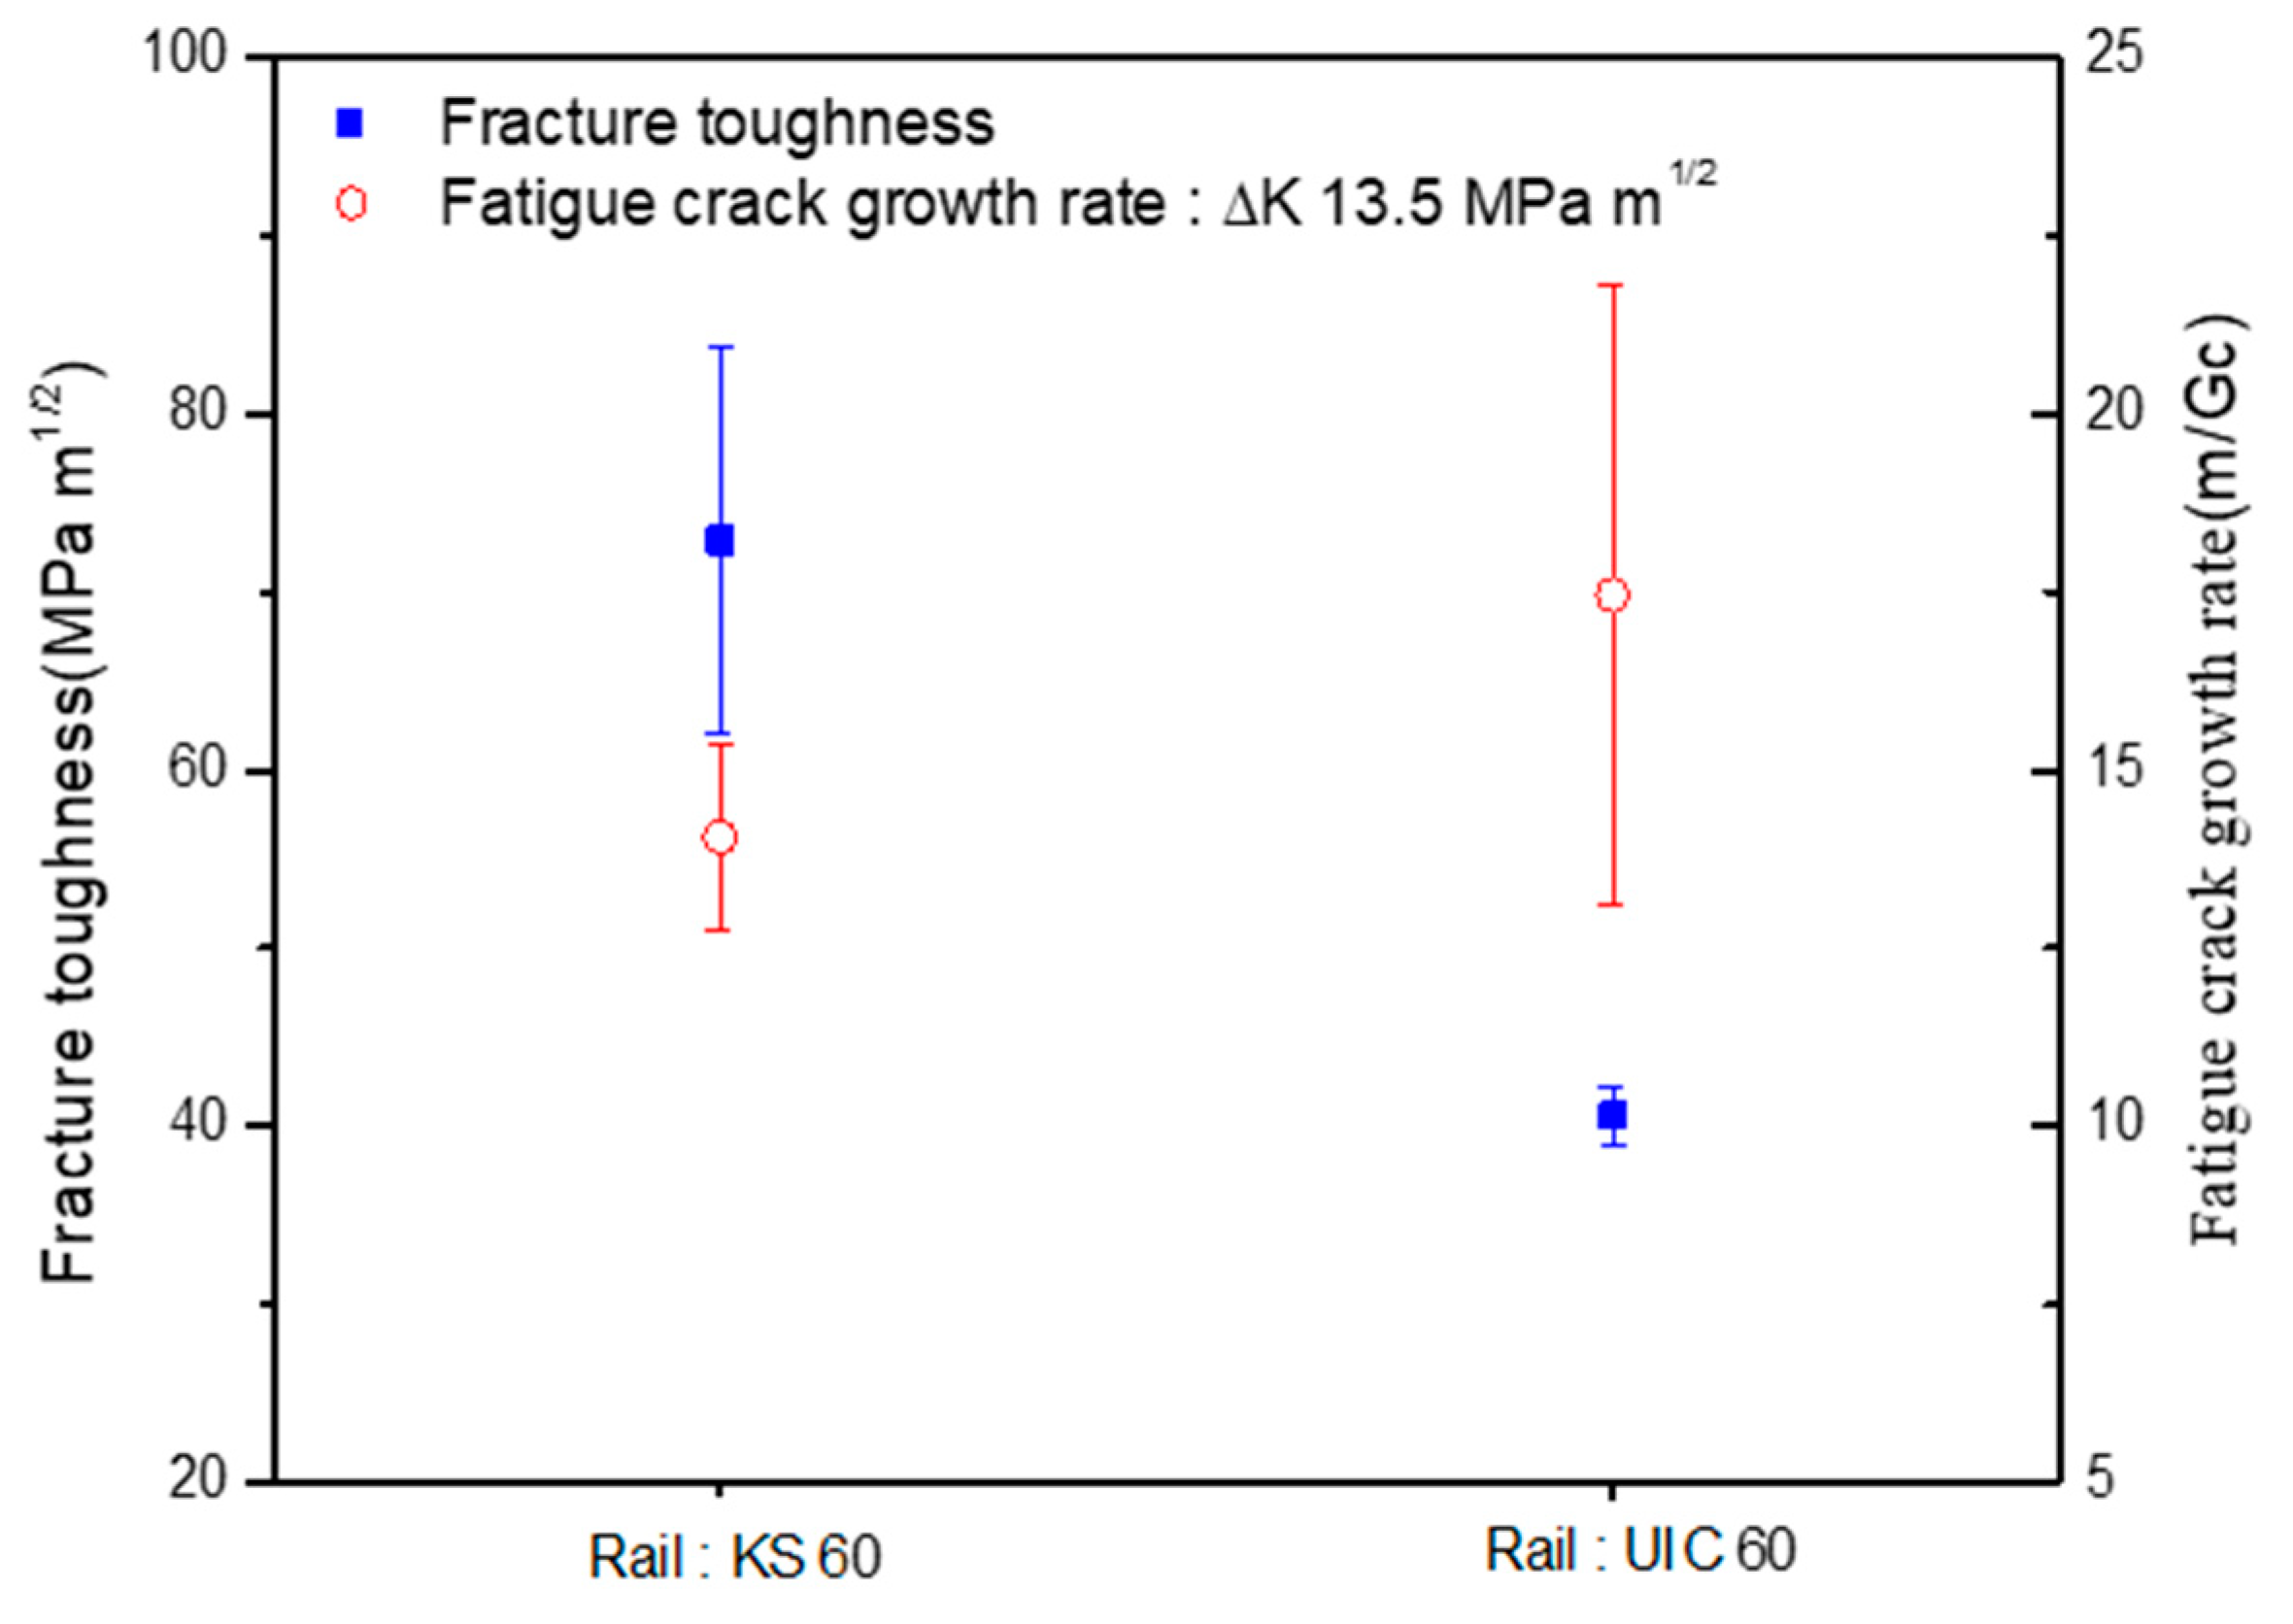
2.4. Fracture Toughness Test
2.4.1. Test Method
2.4.2. Test Results
3. Wear and Contact Fatigue Test
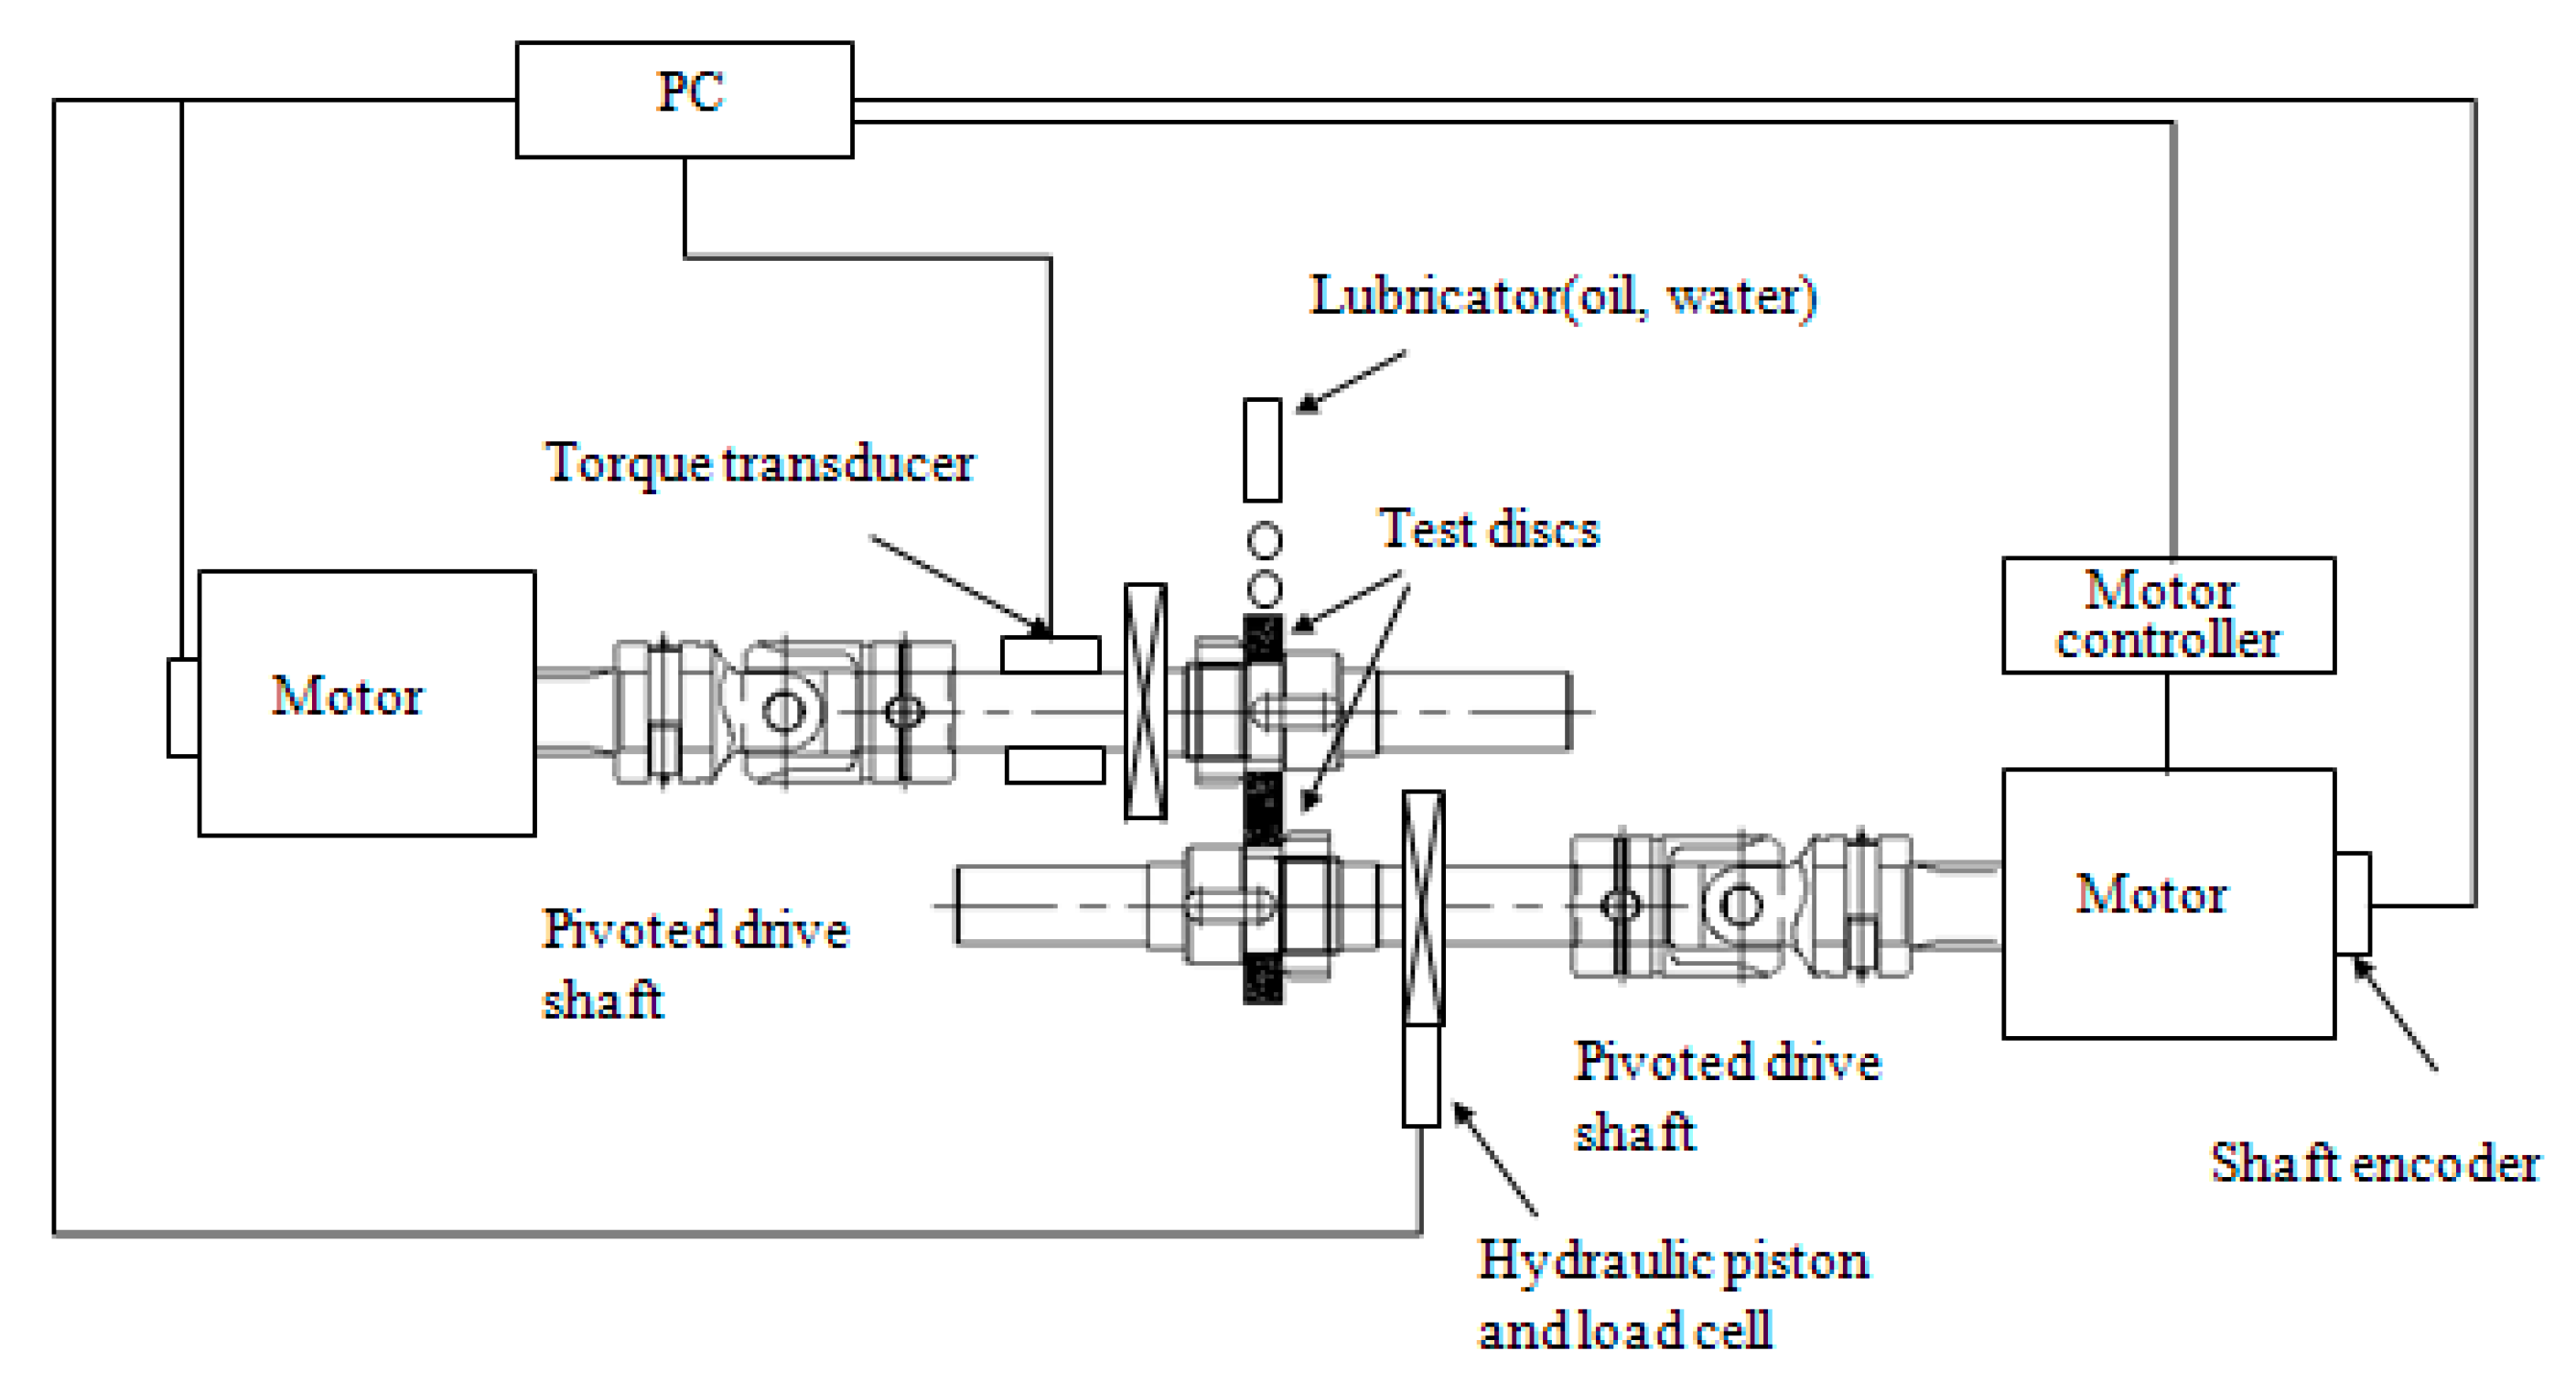
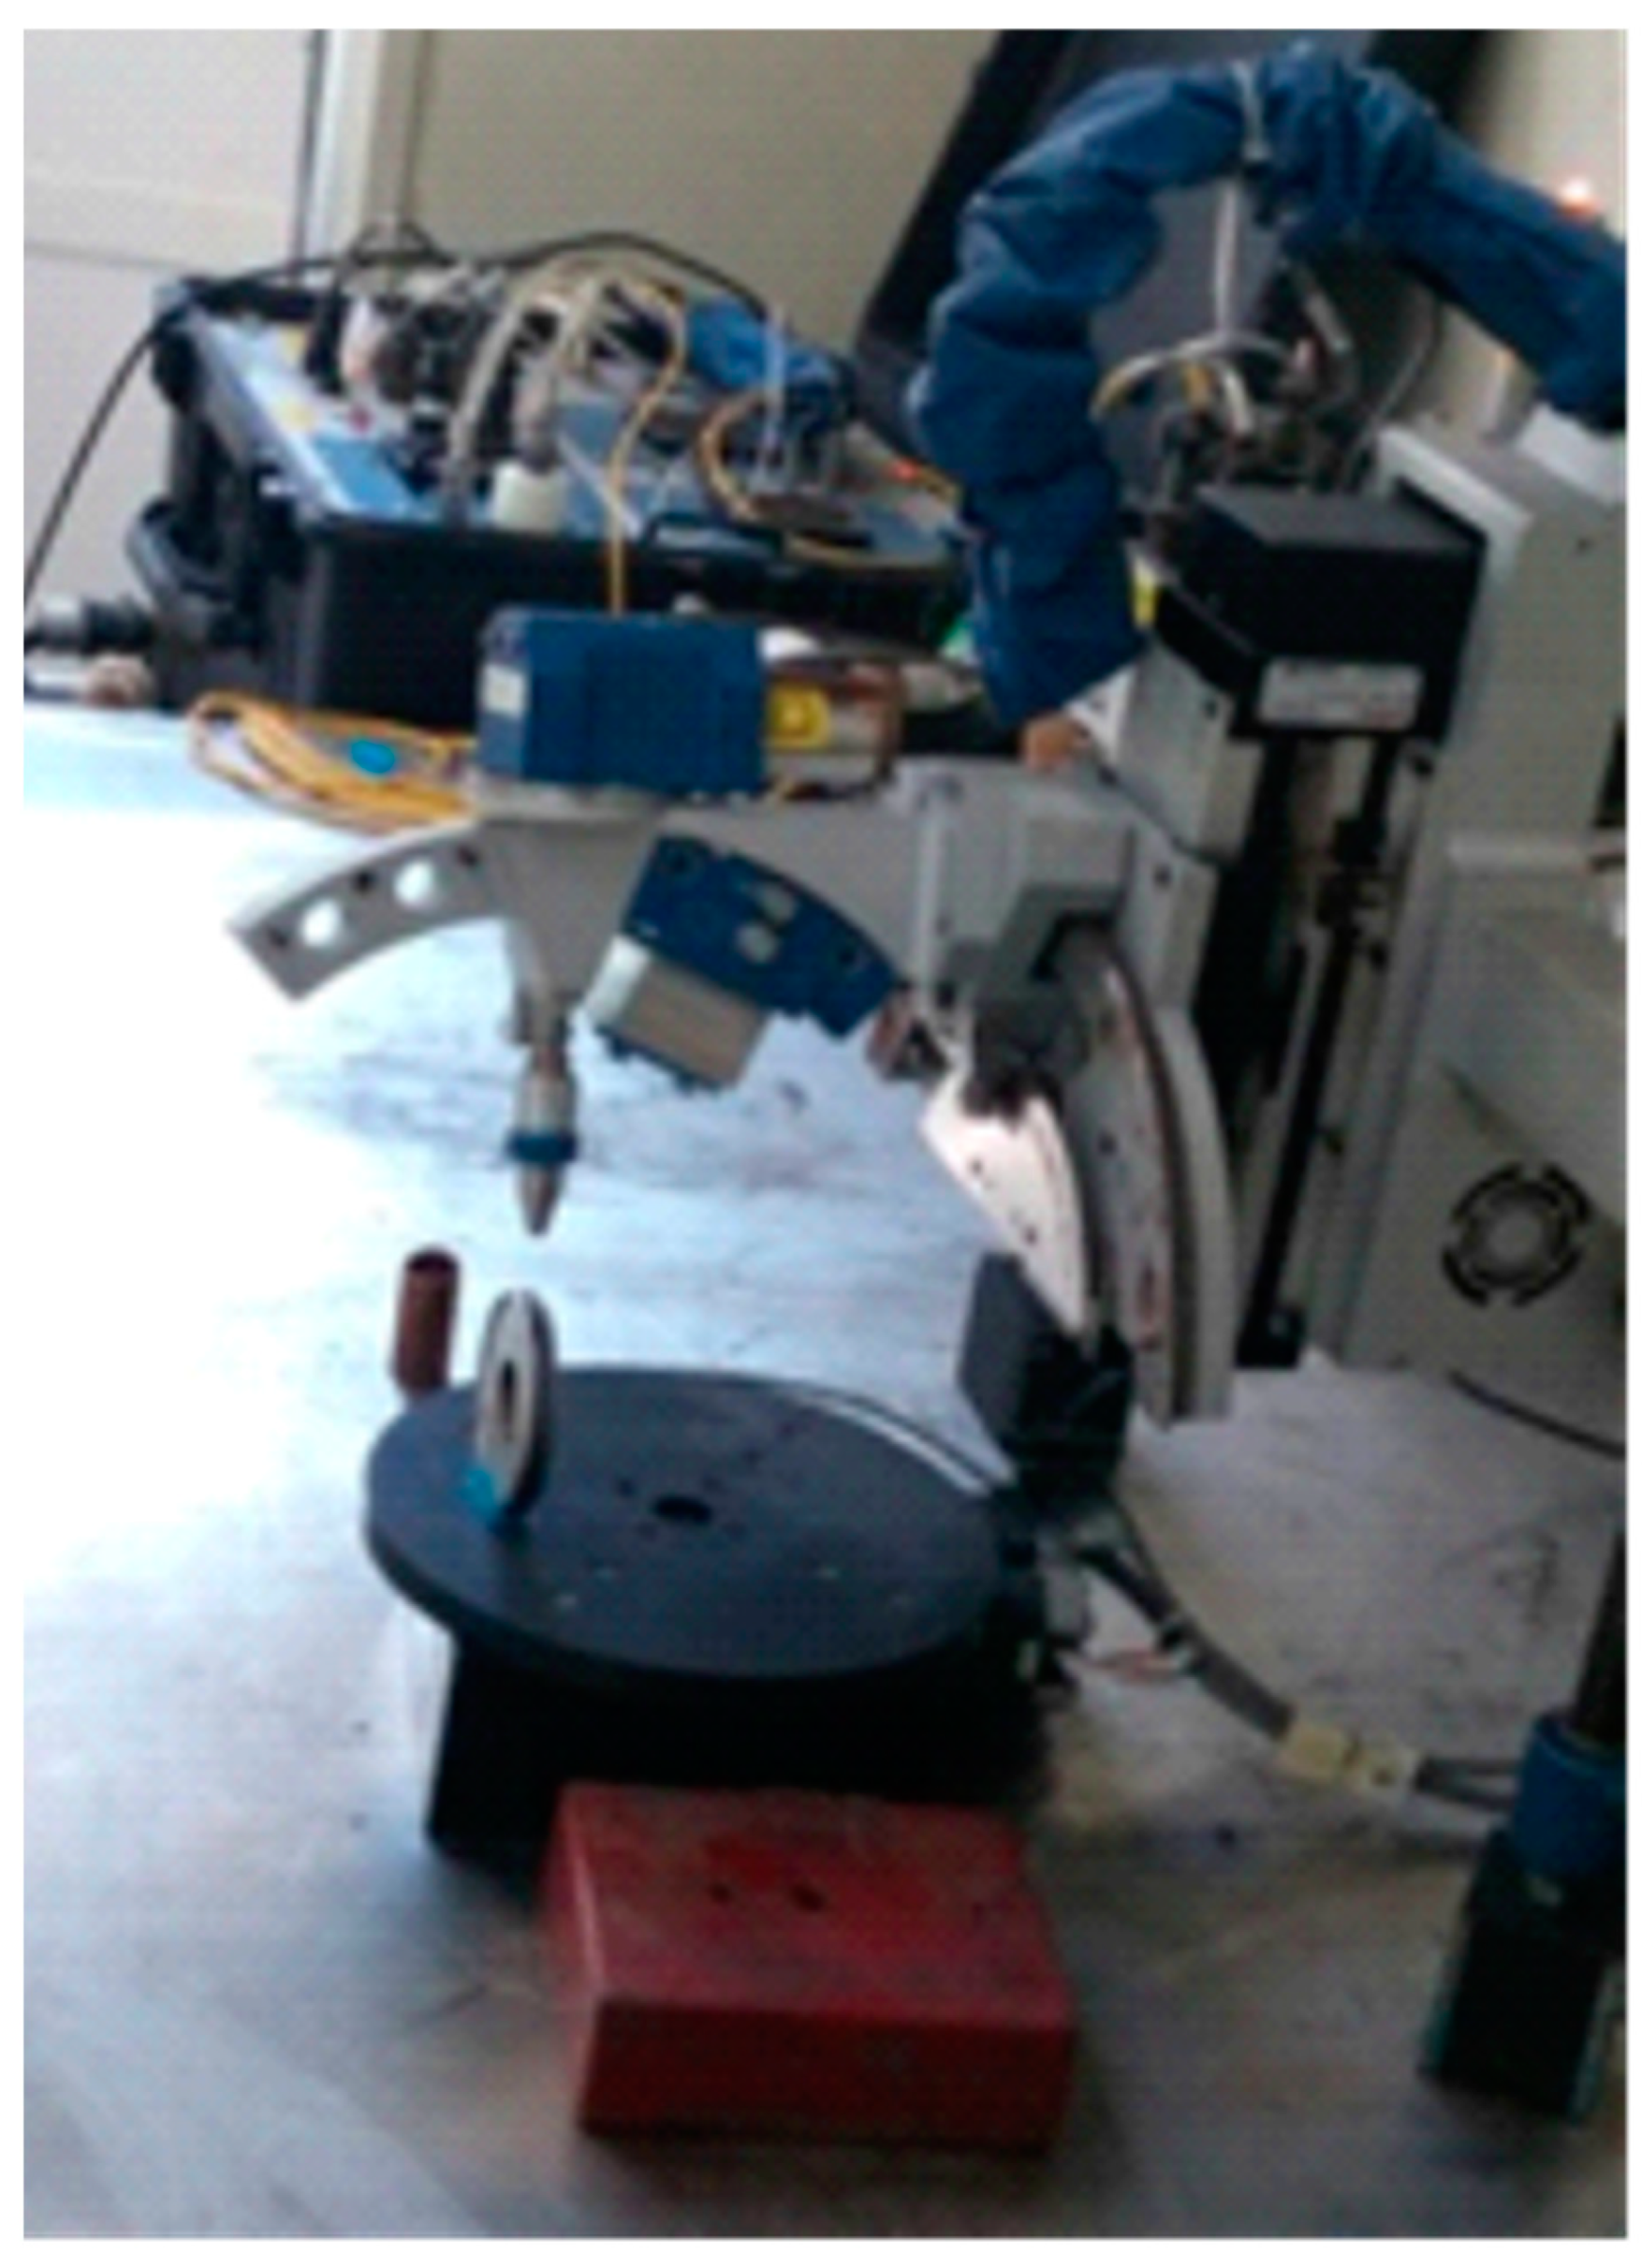
3.1. Test Apparatus
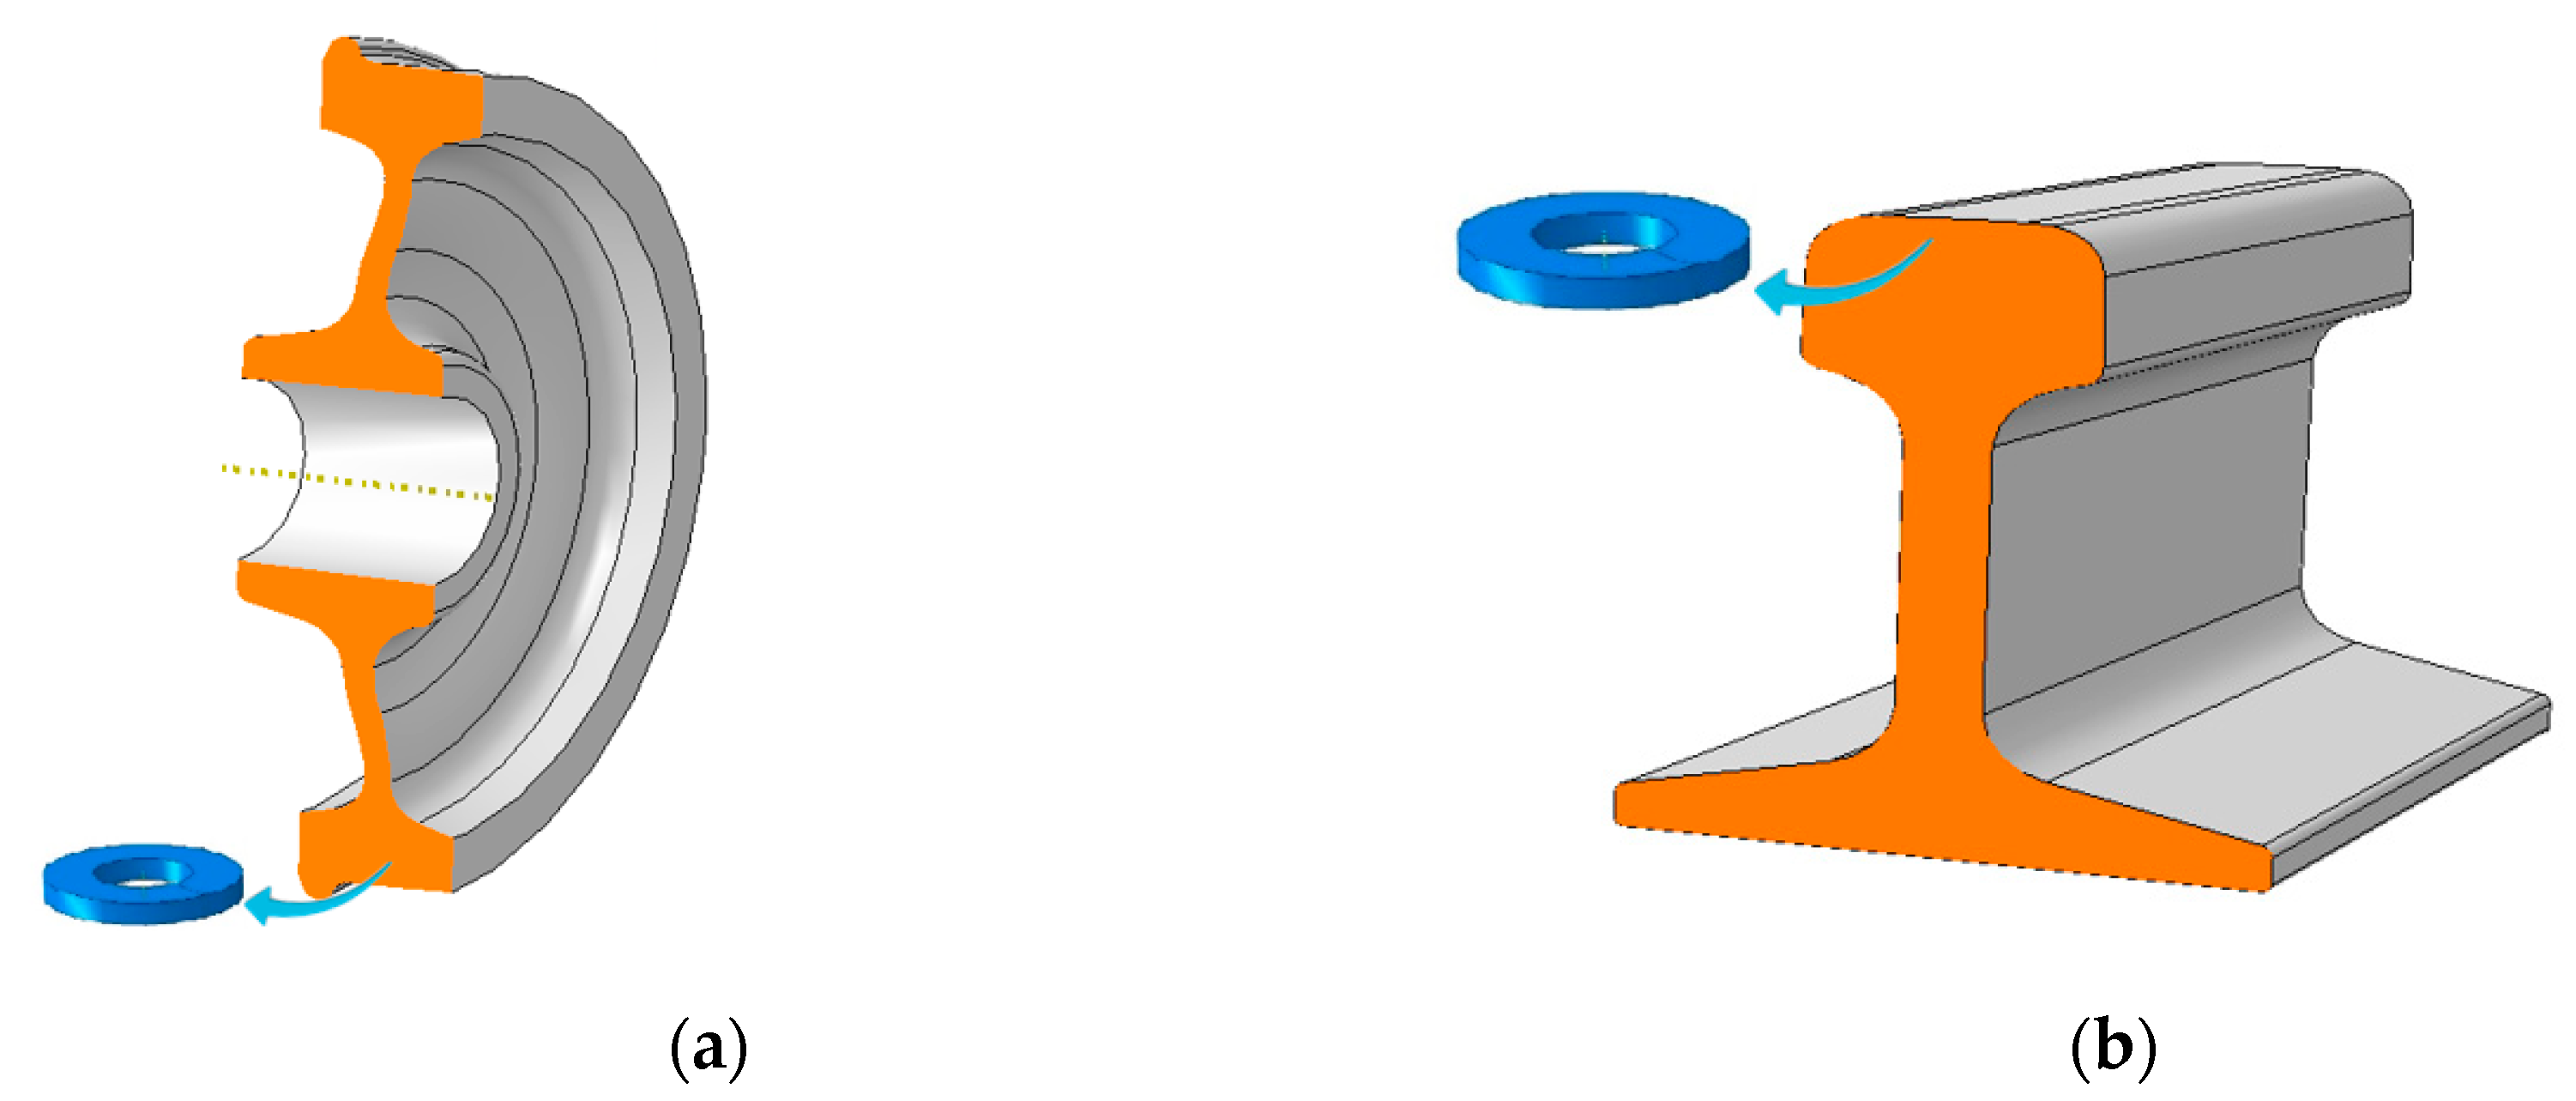
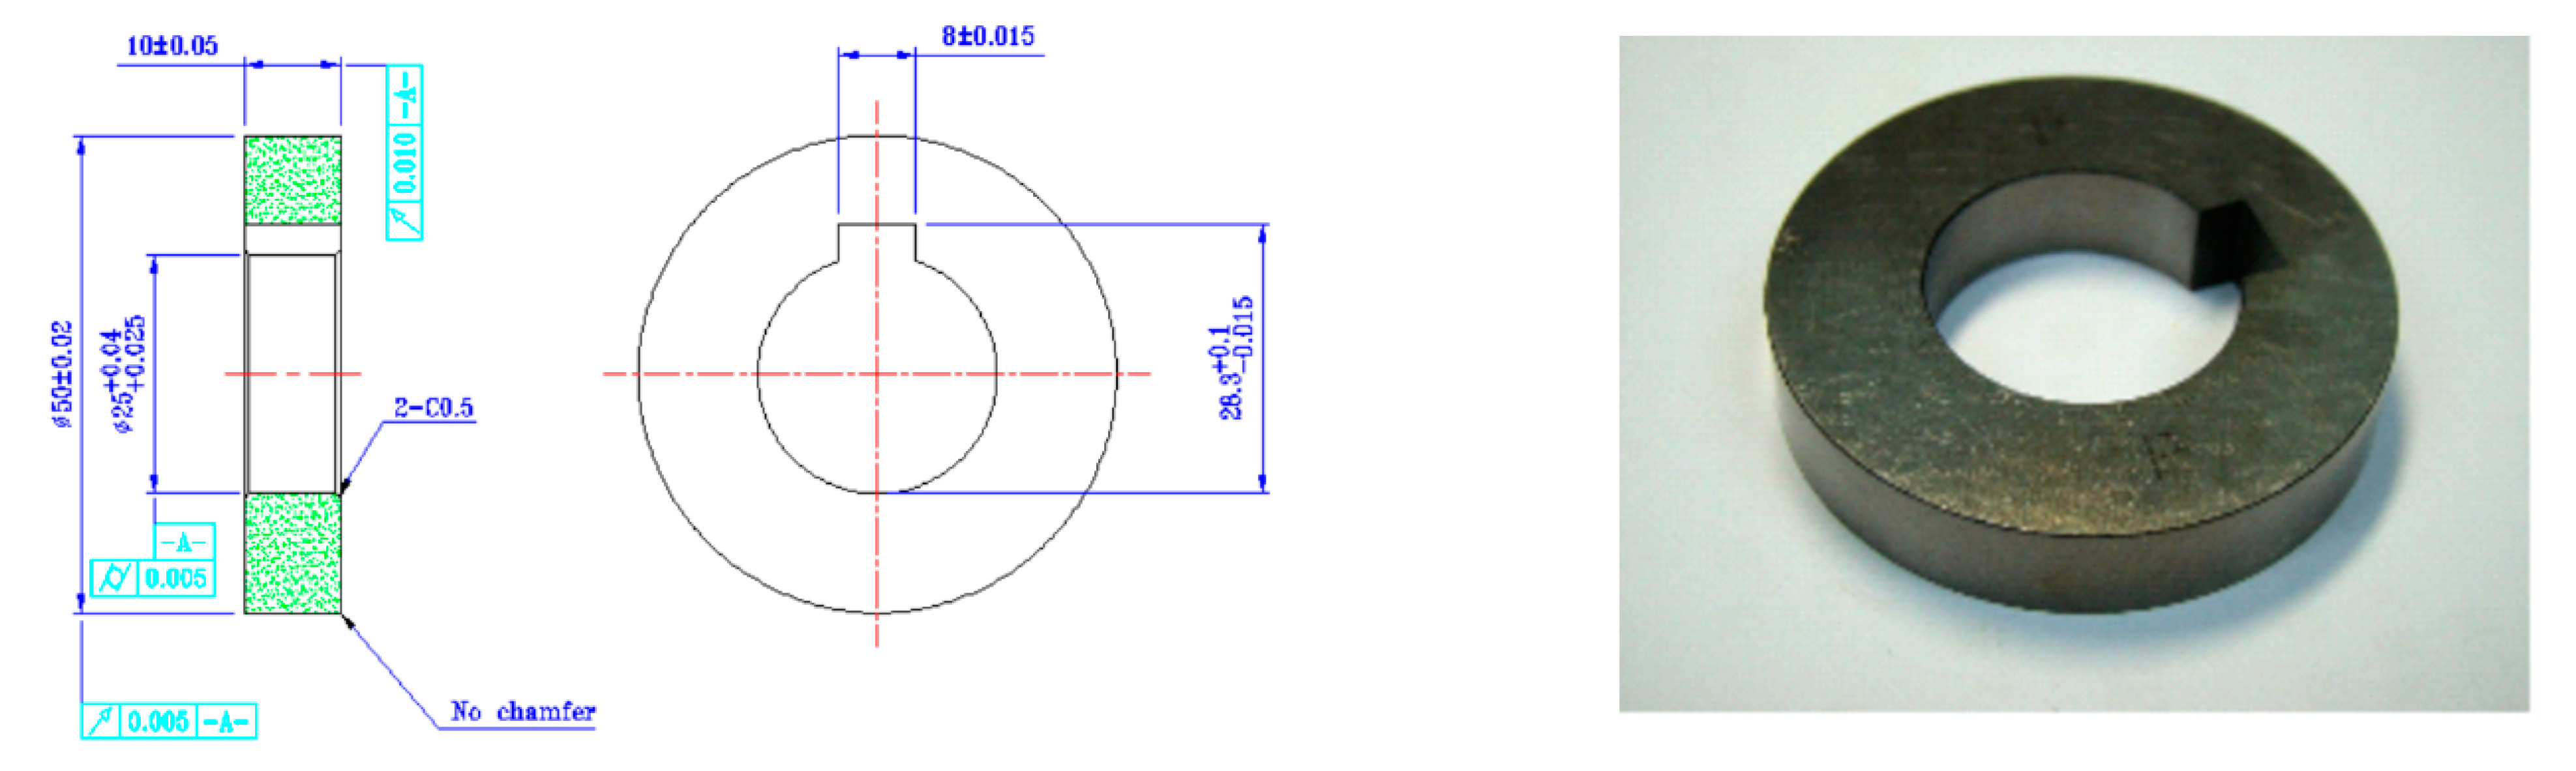
3.2. Specimen and Test Methodology
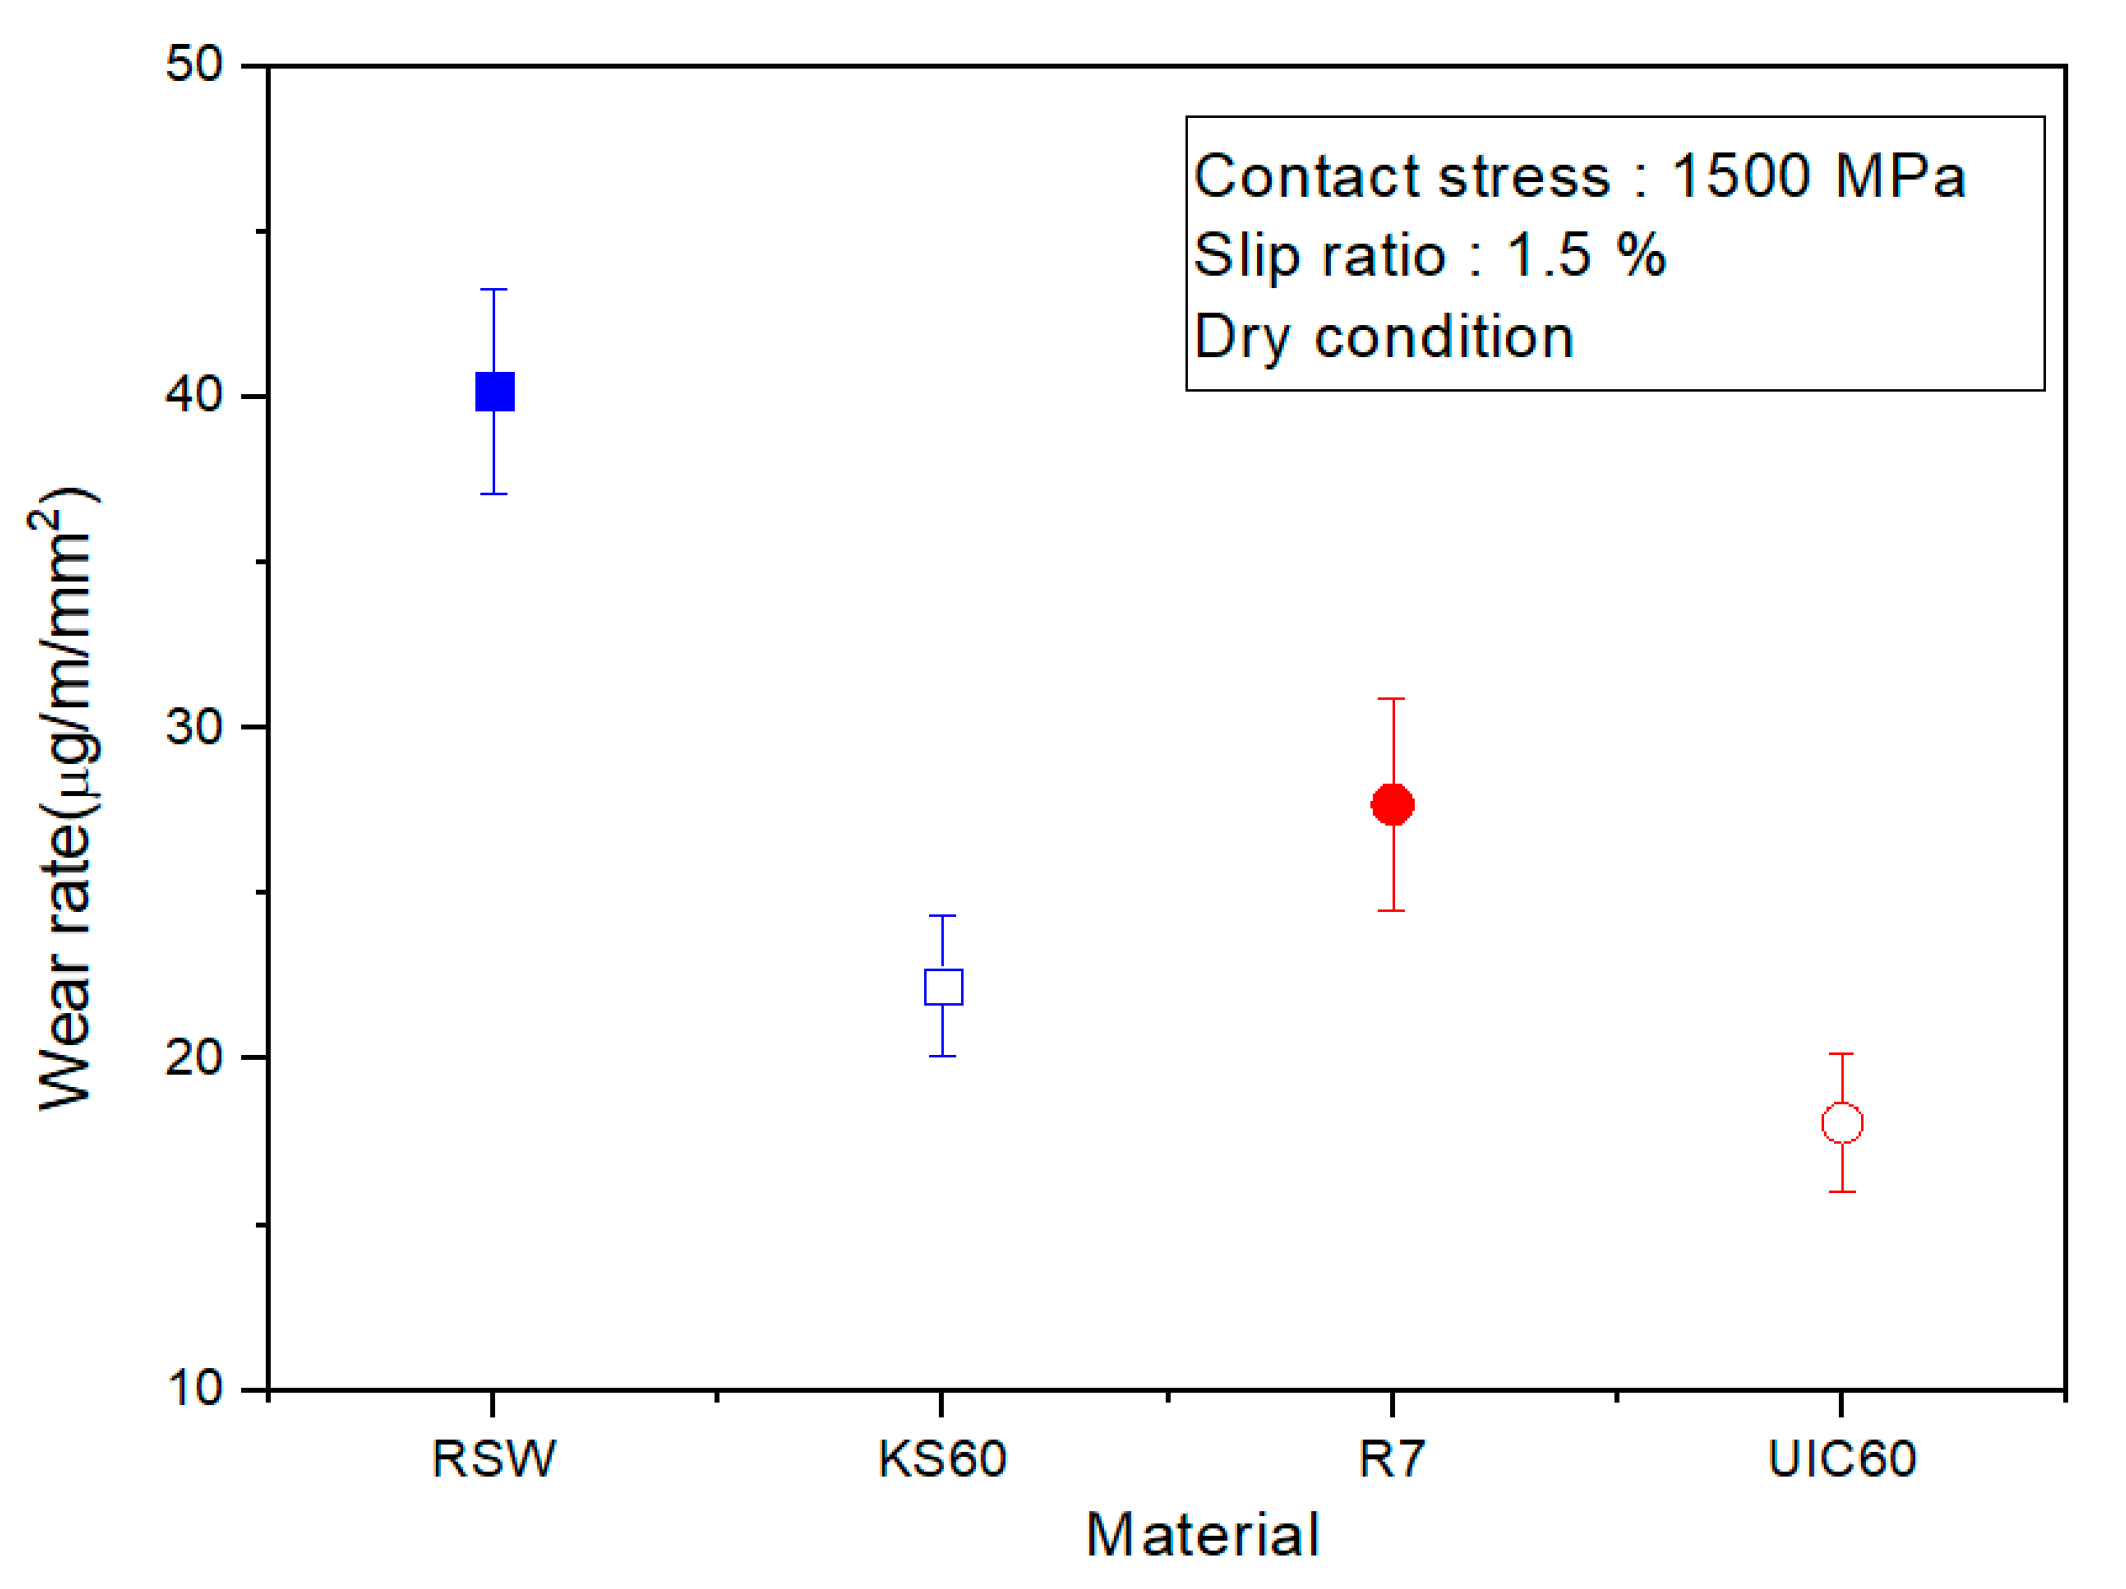
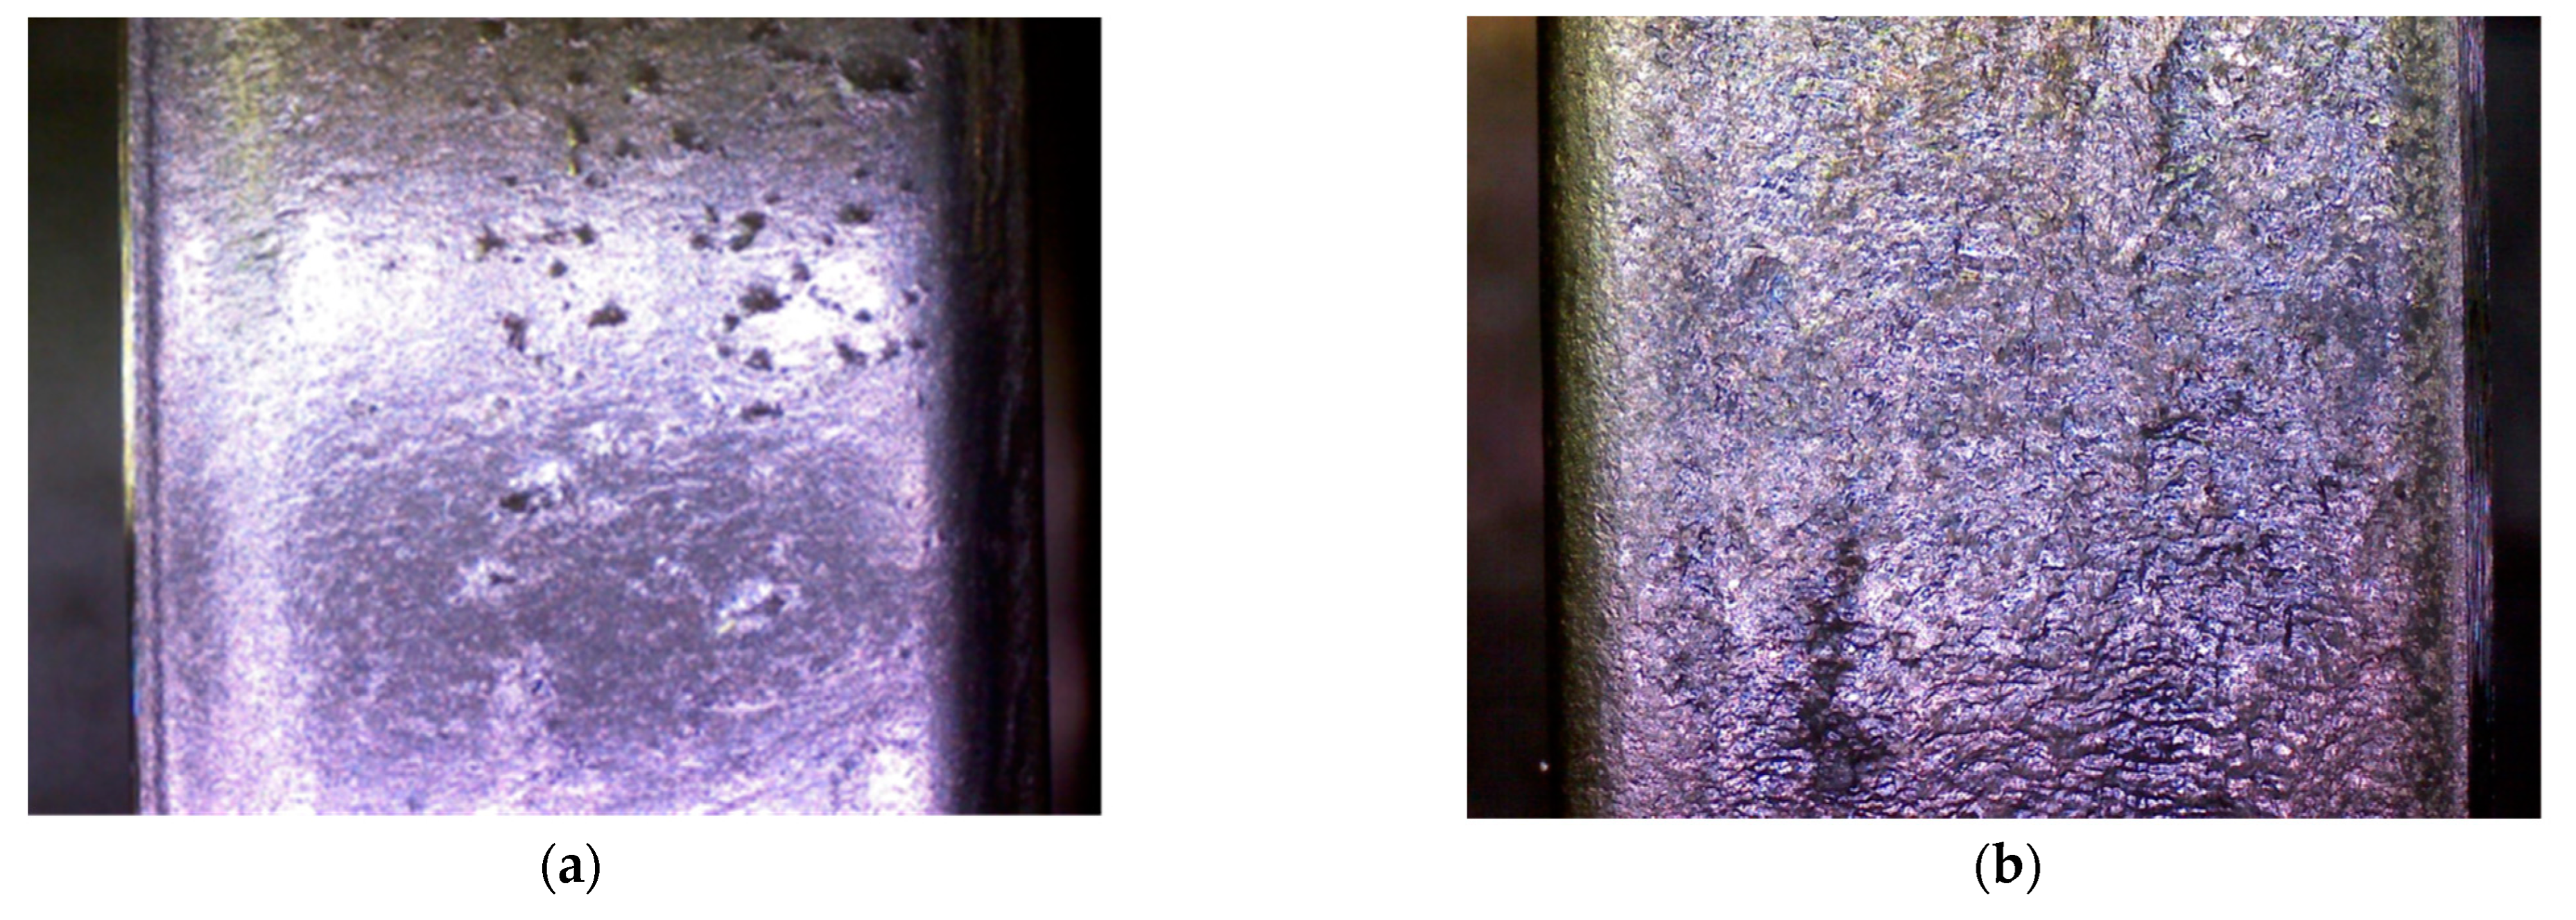
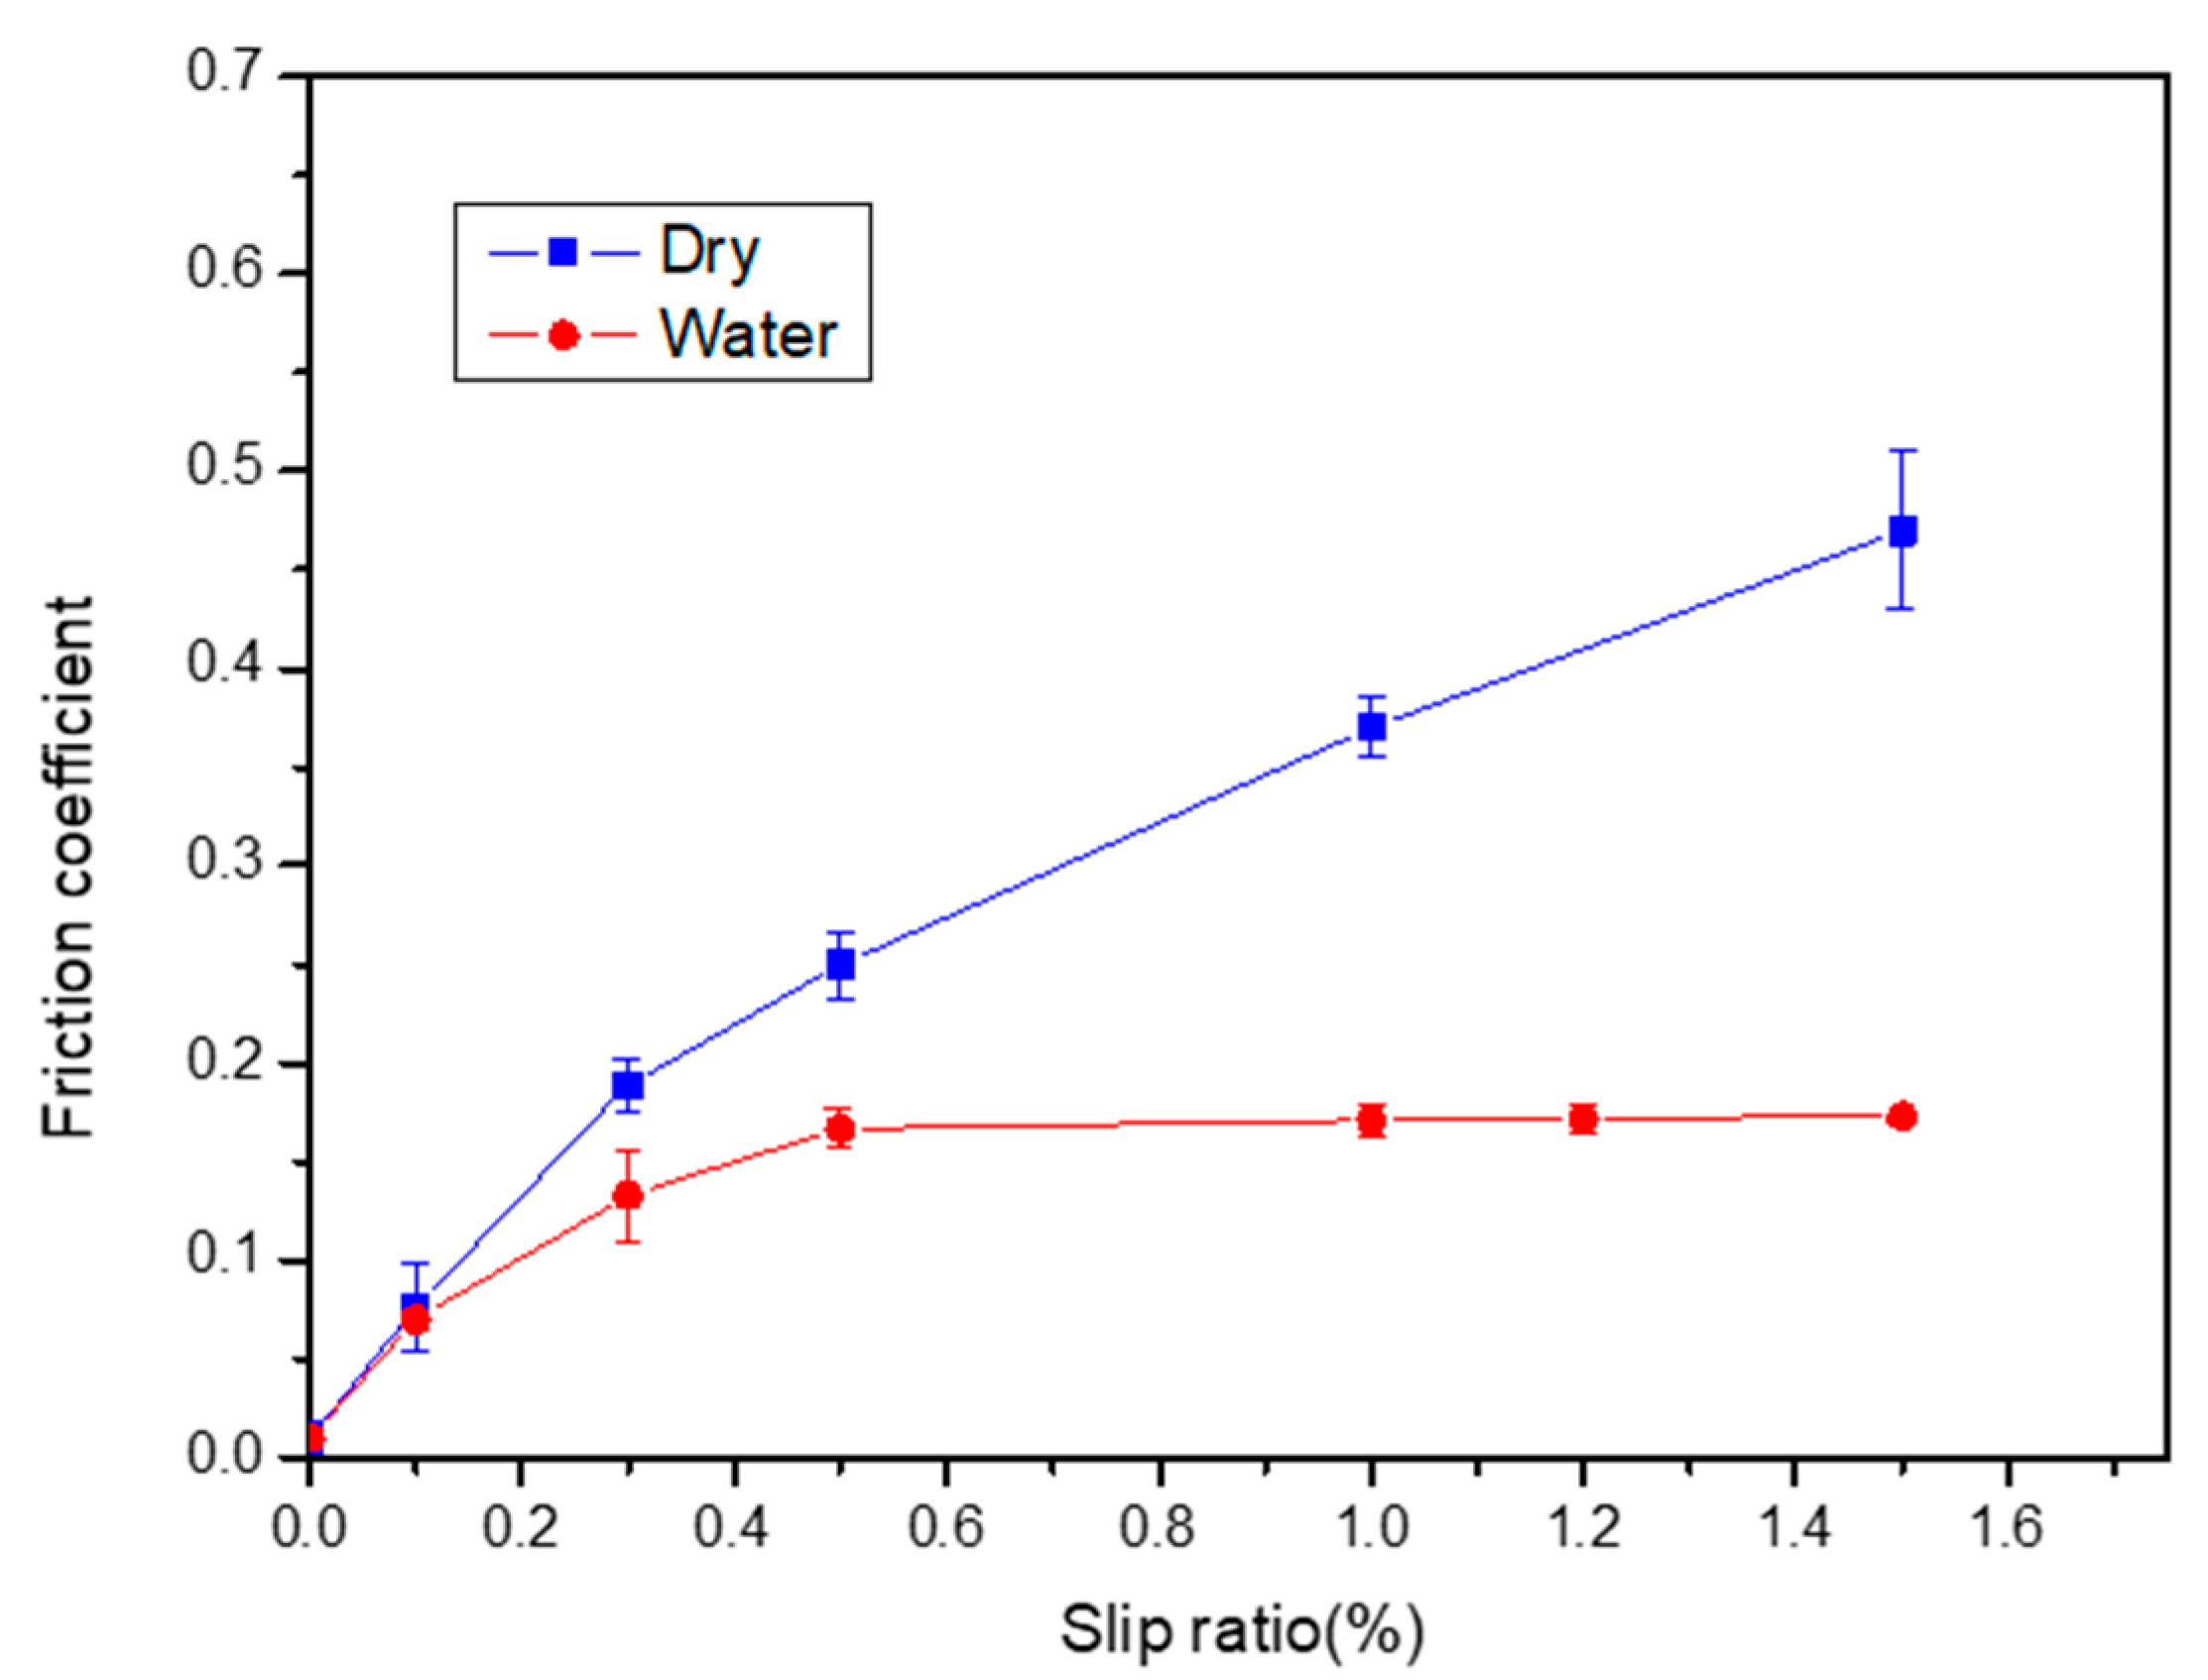
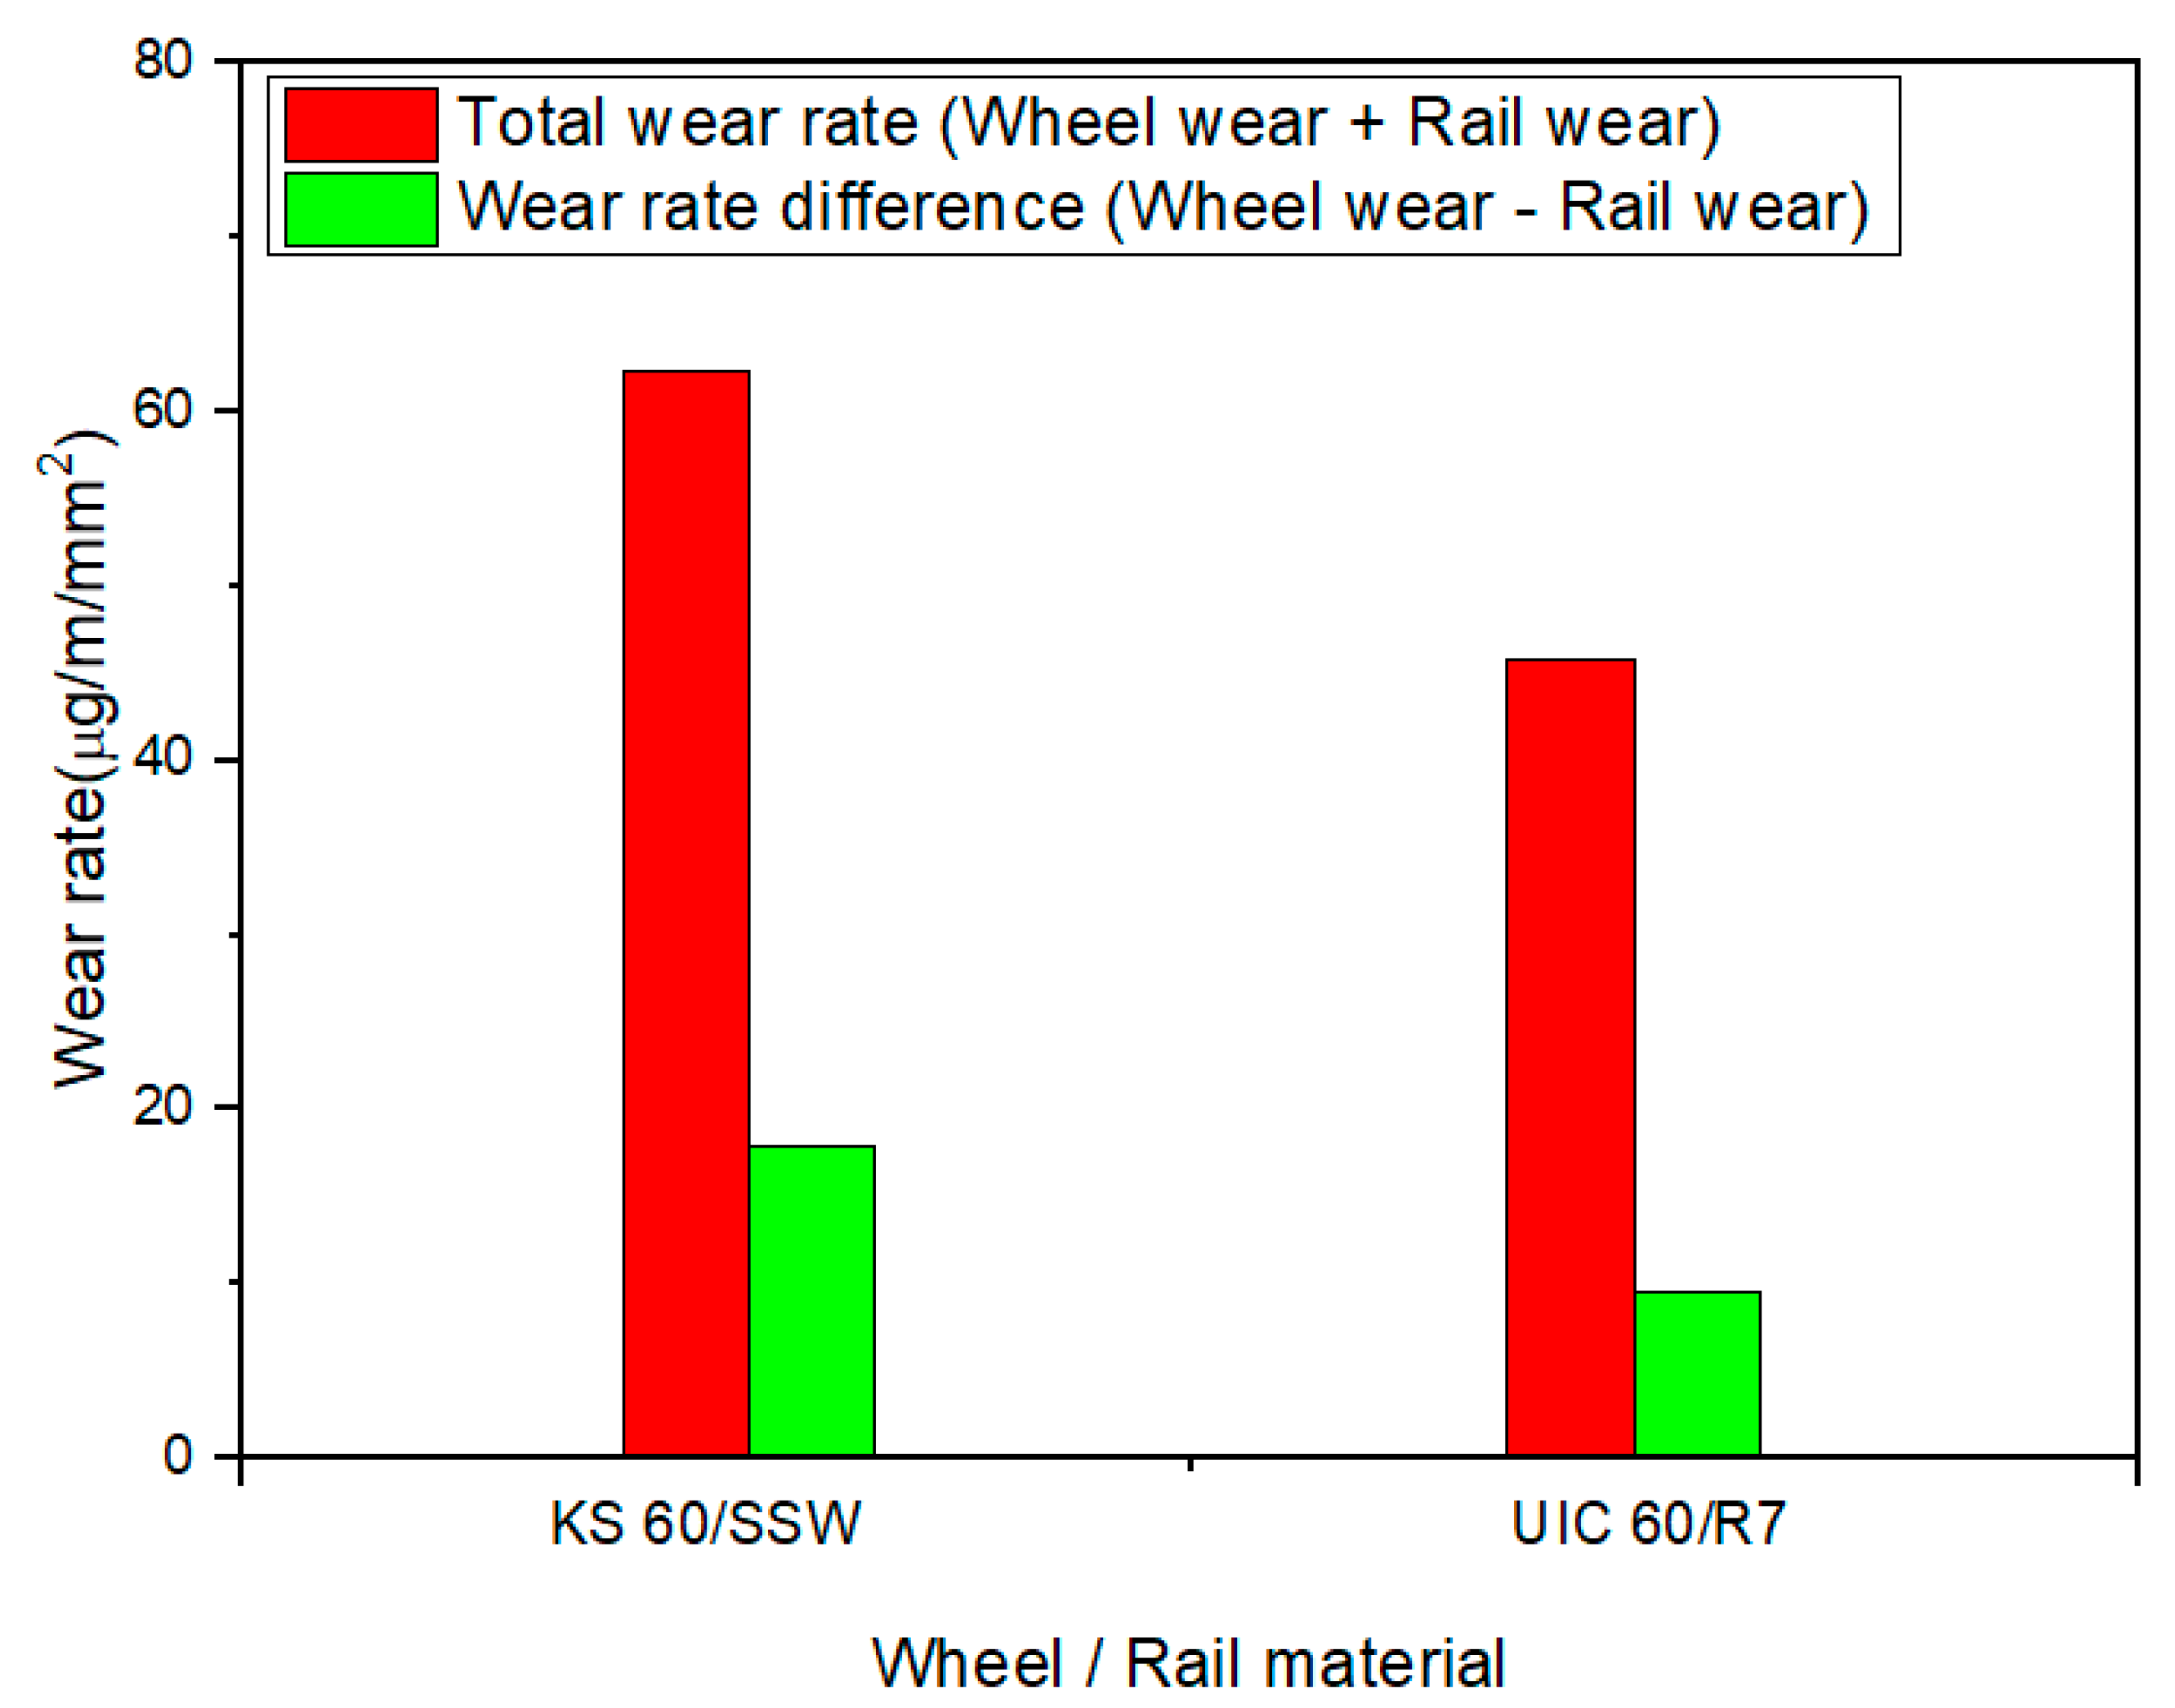
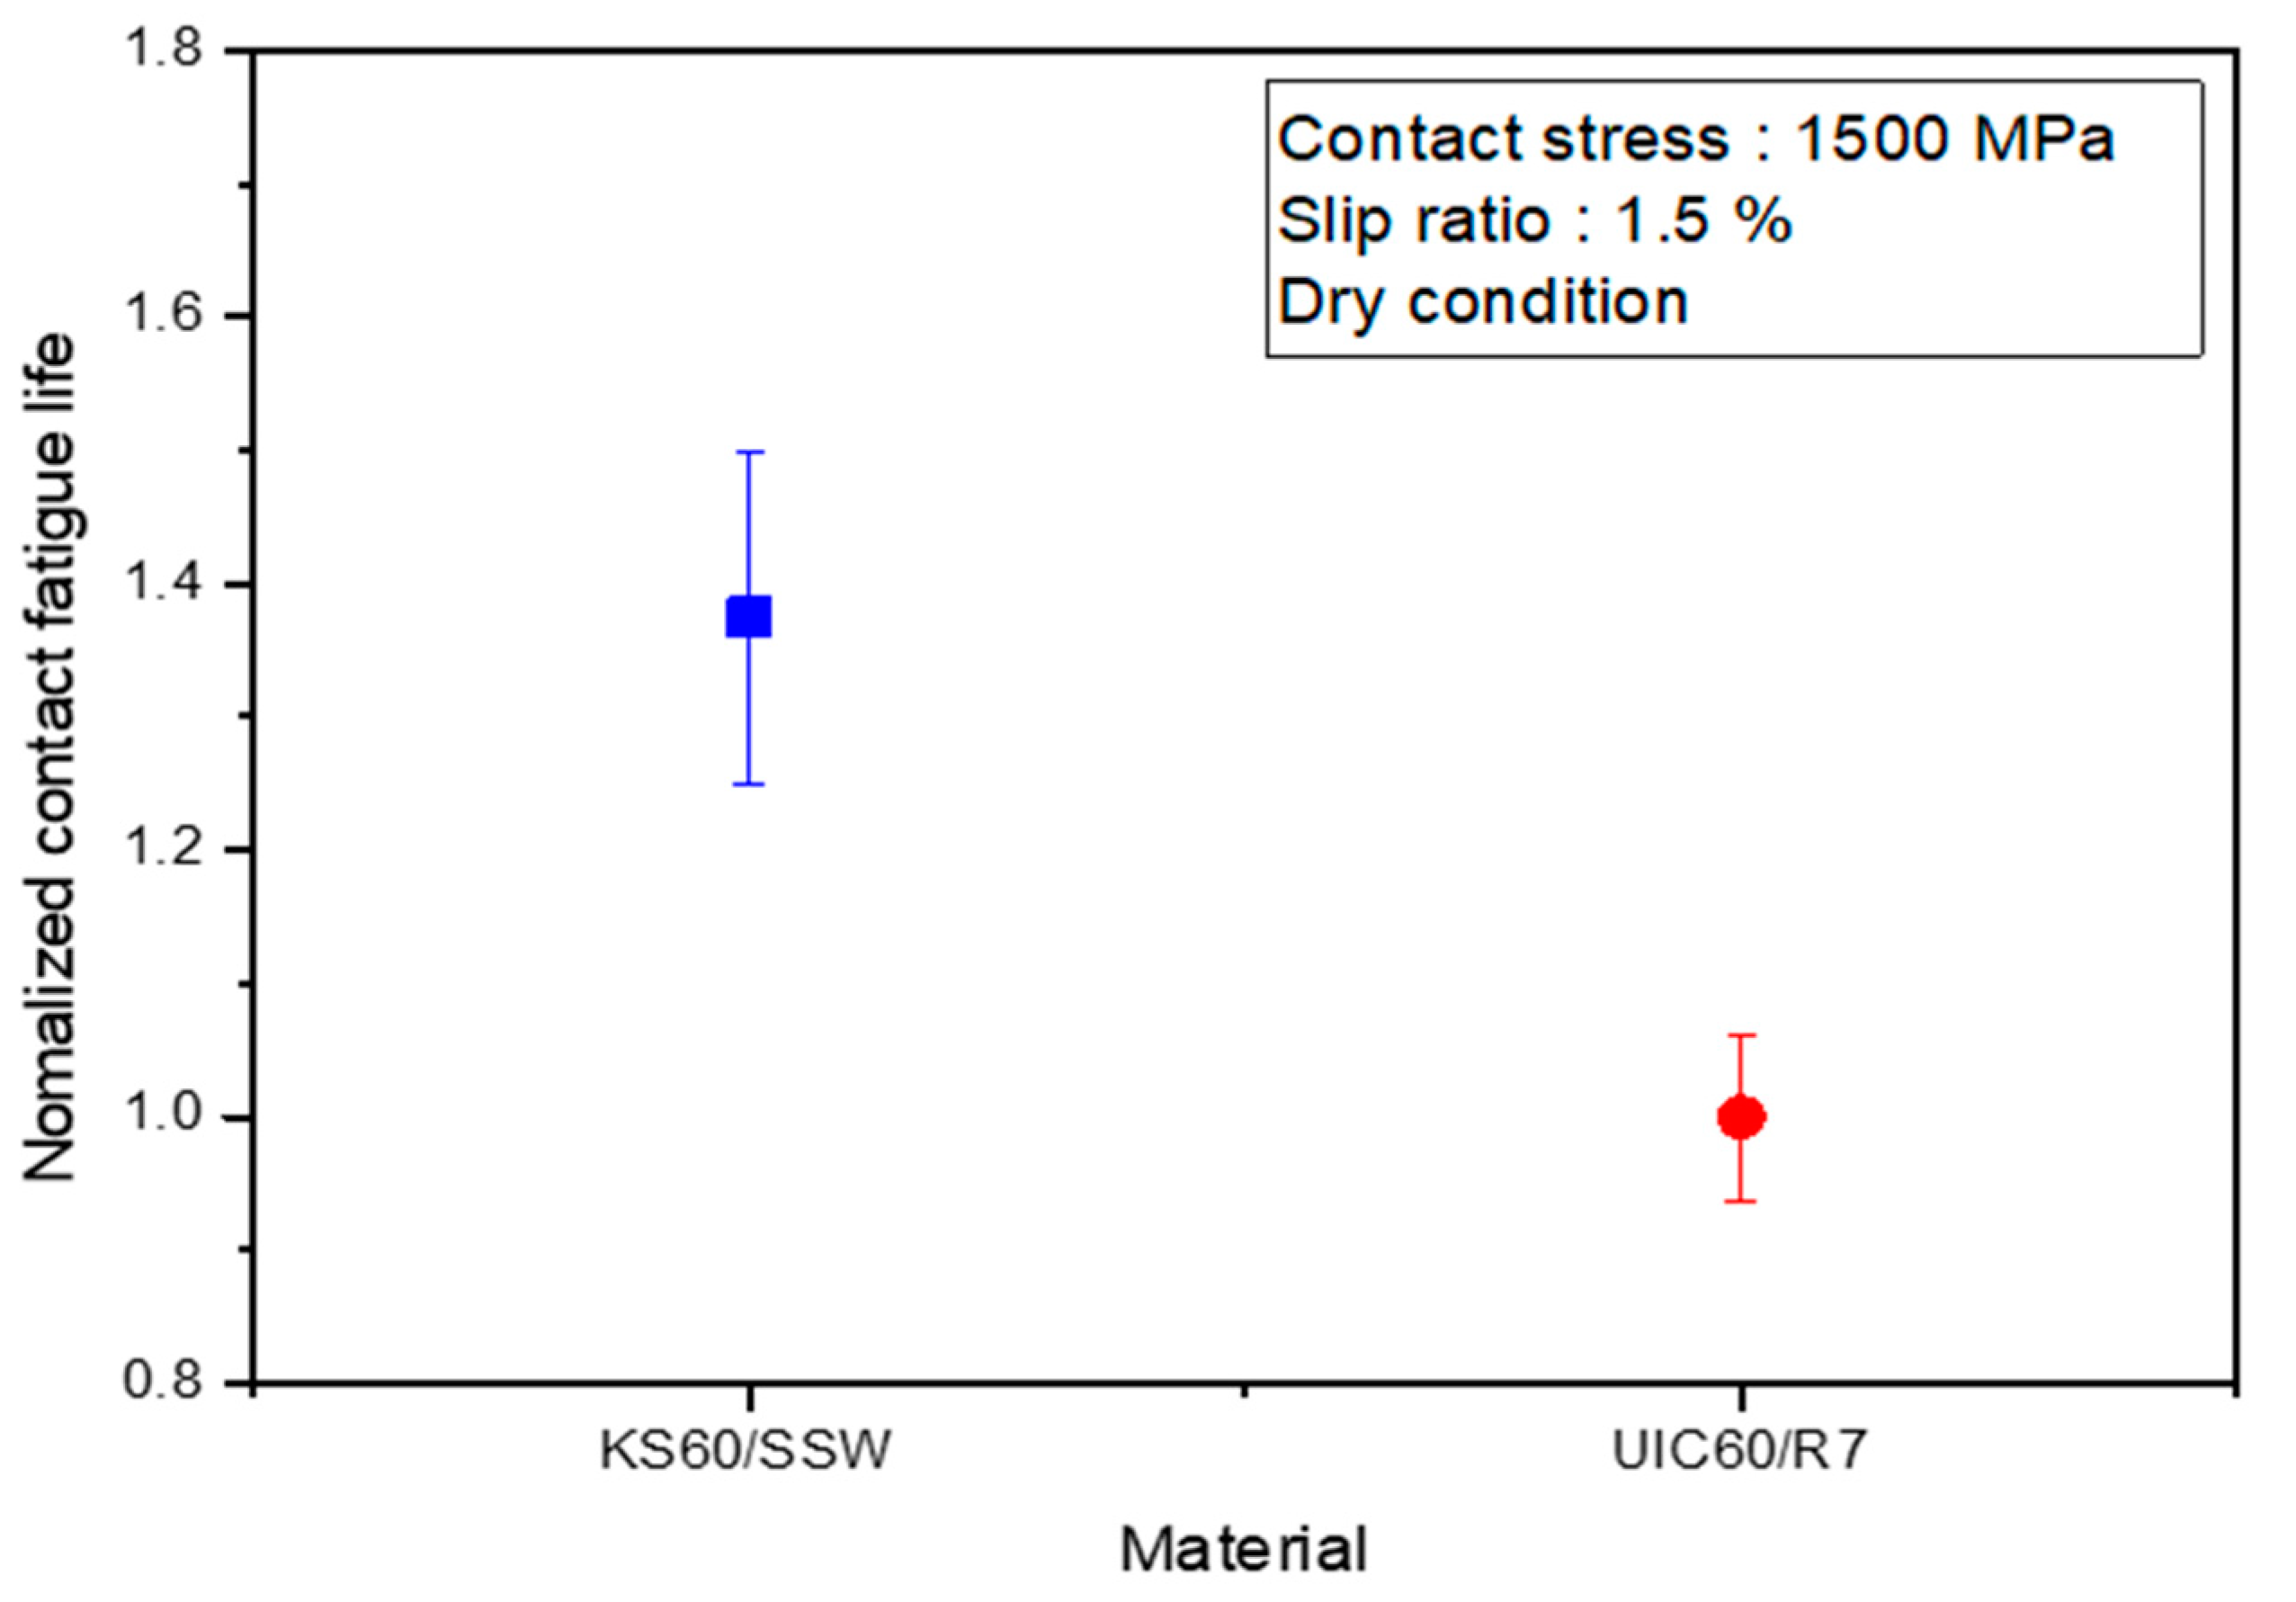
3.3. Wear Test Results
4. Discussion
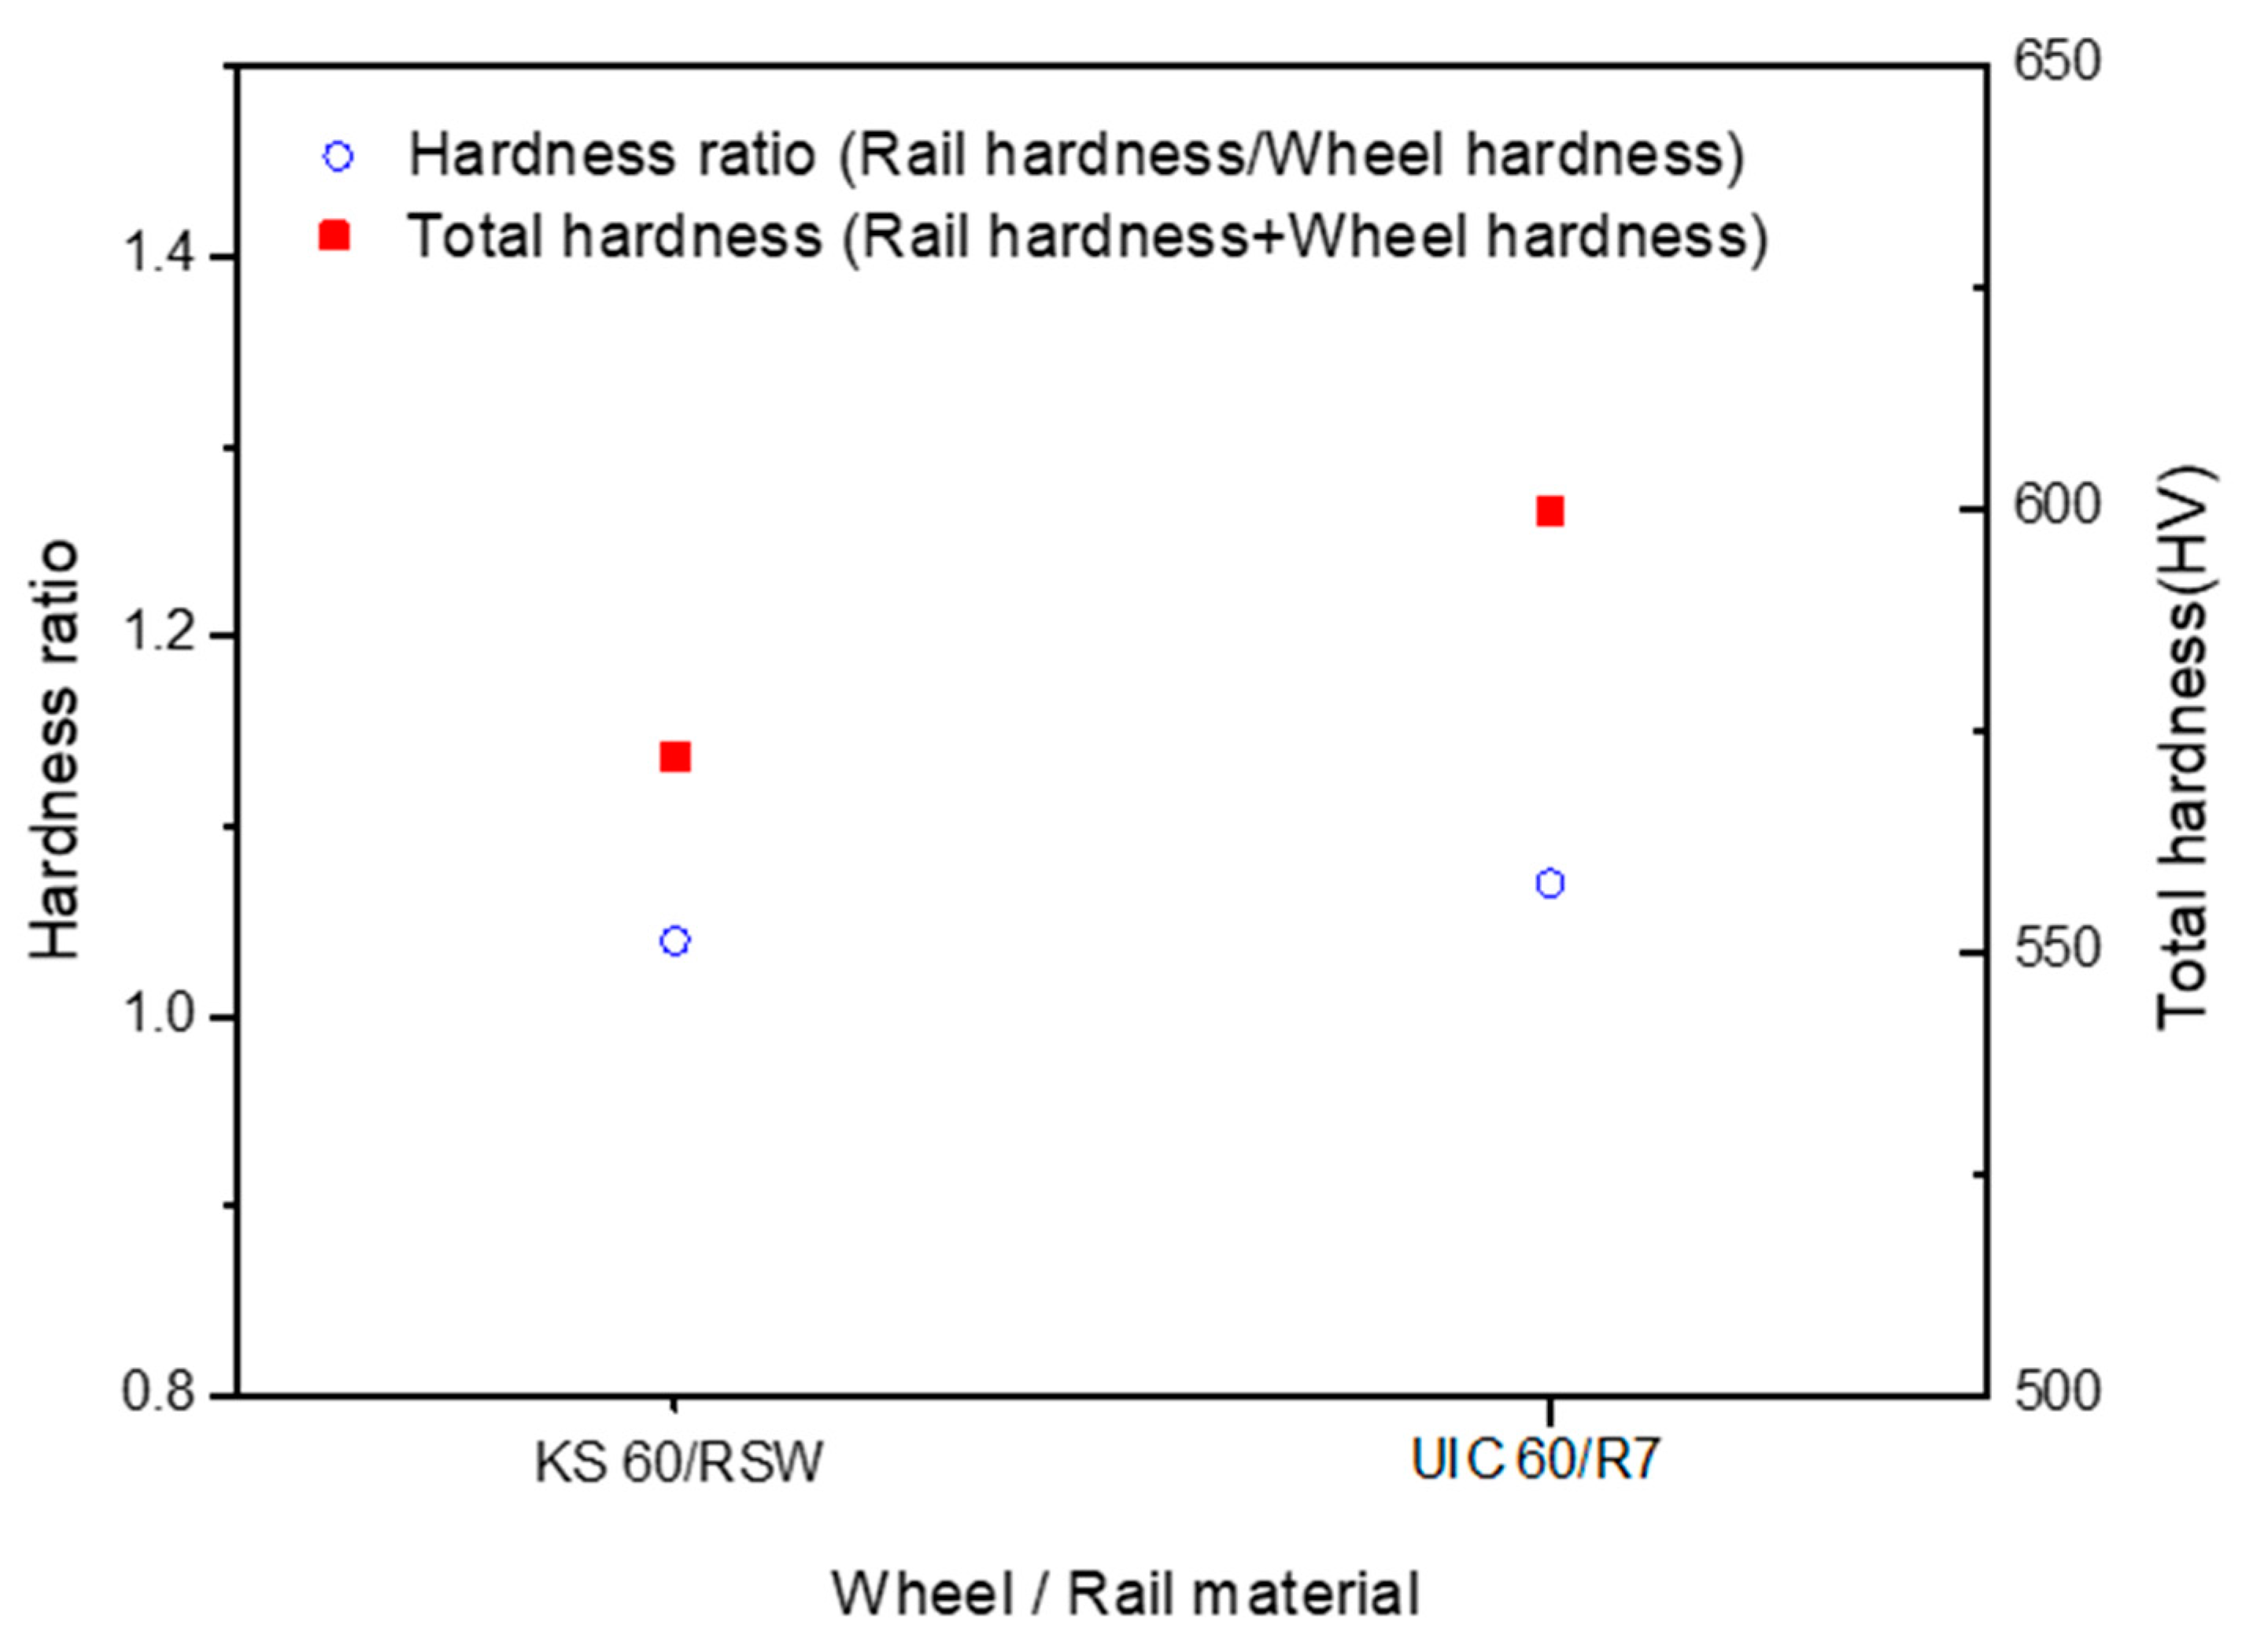
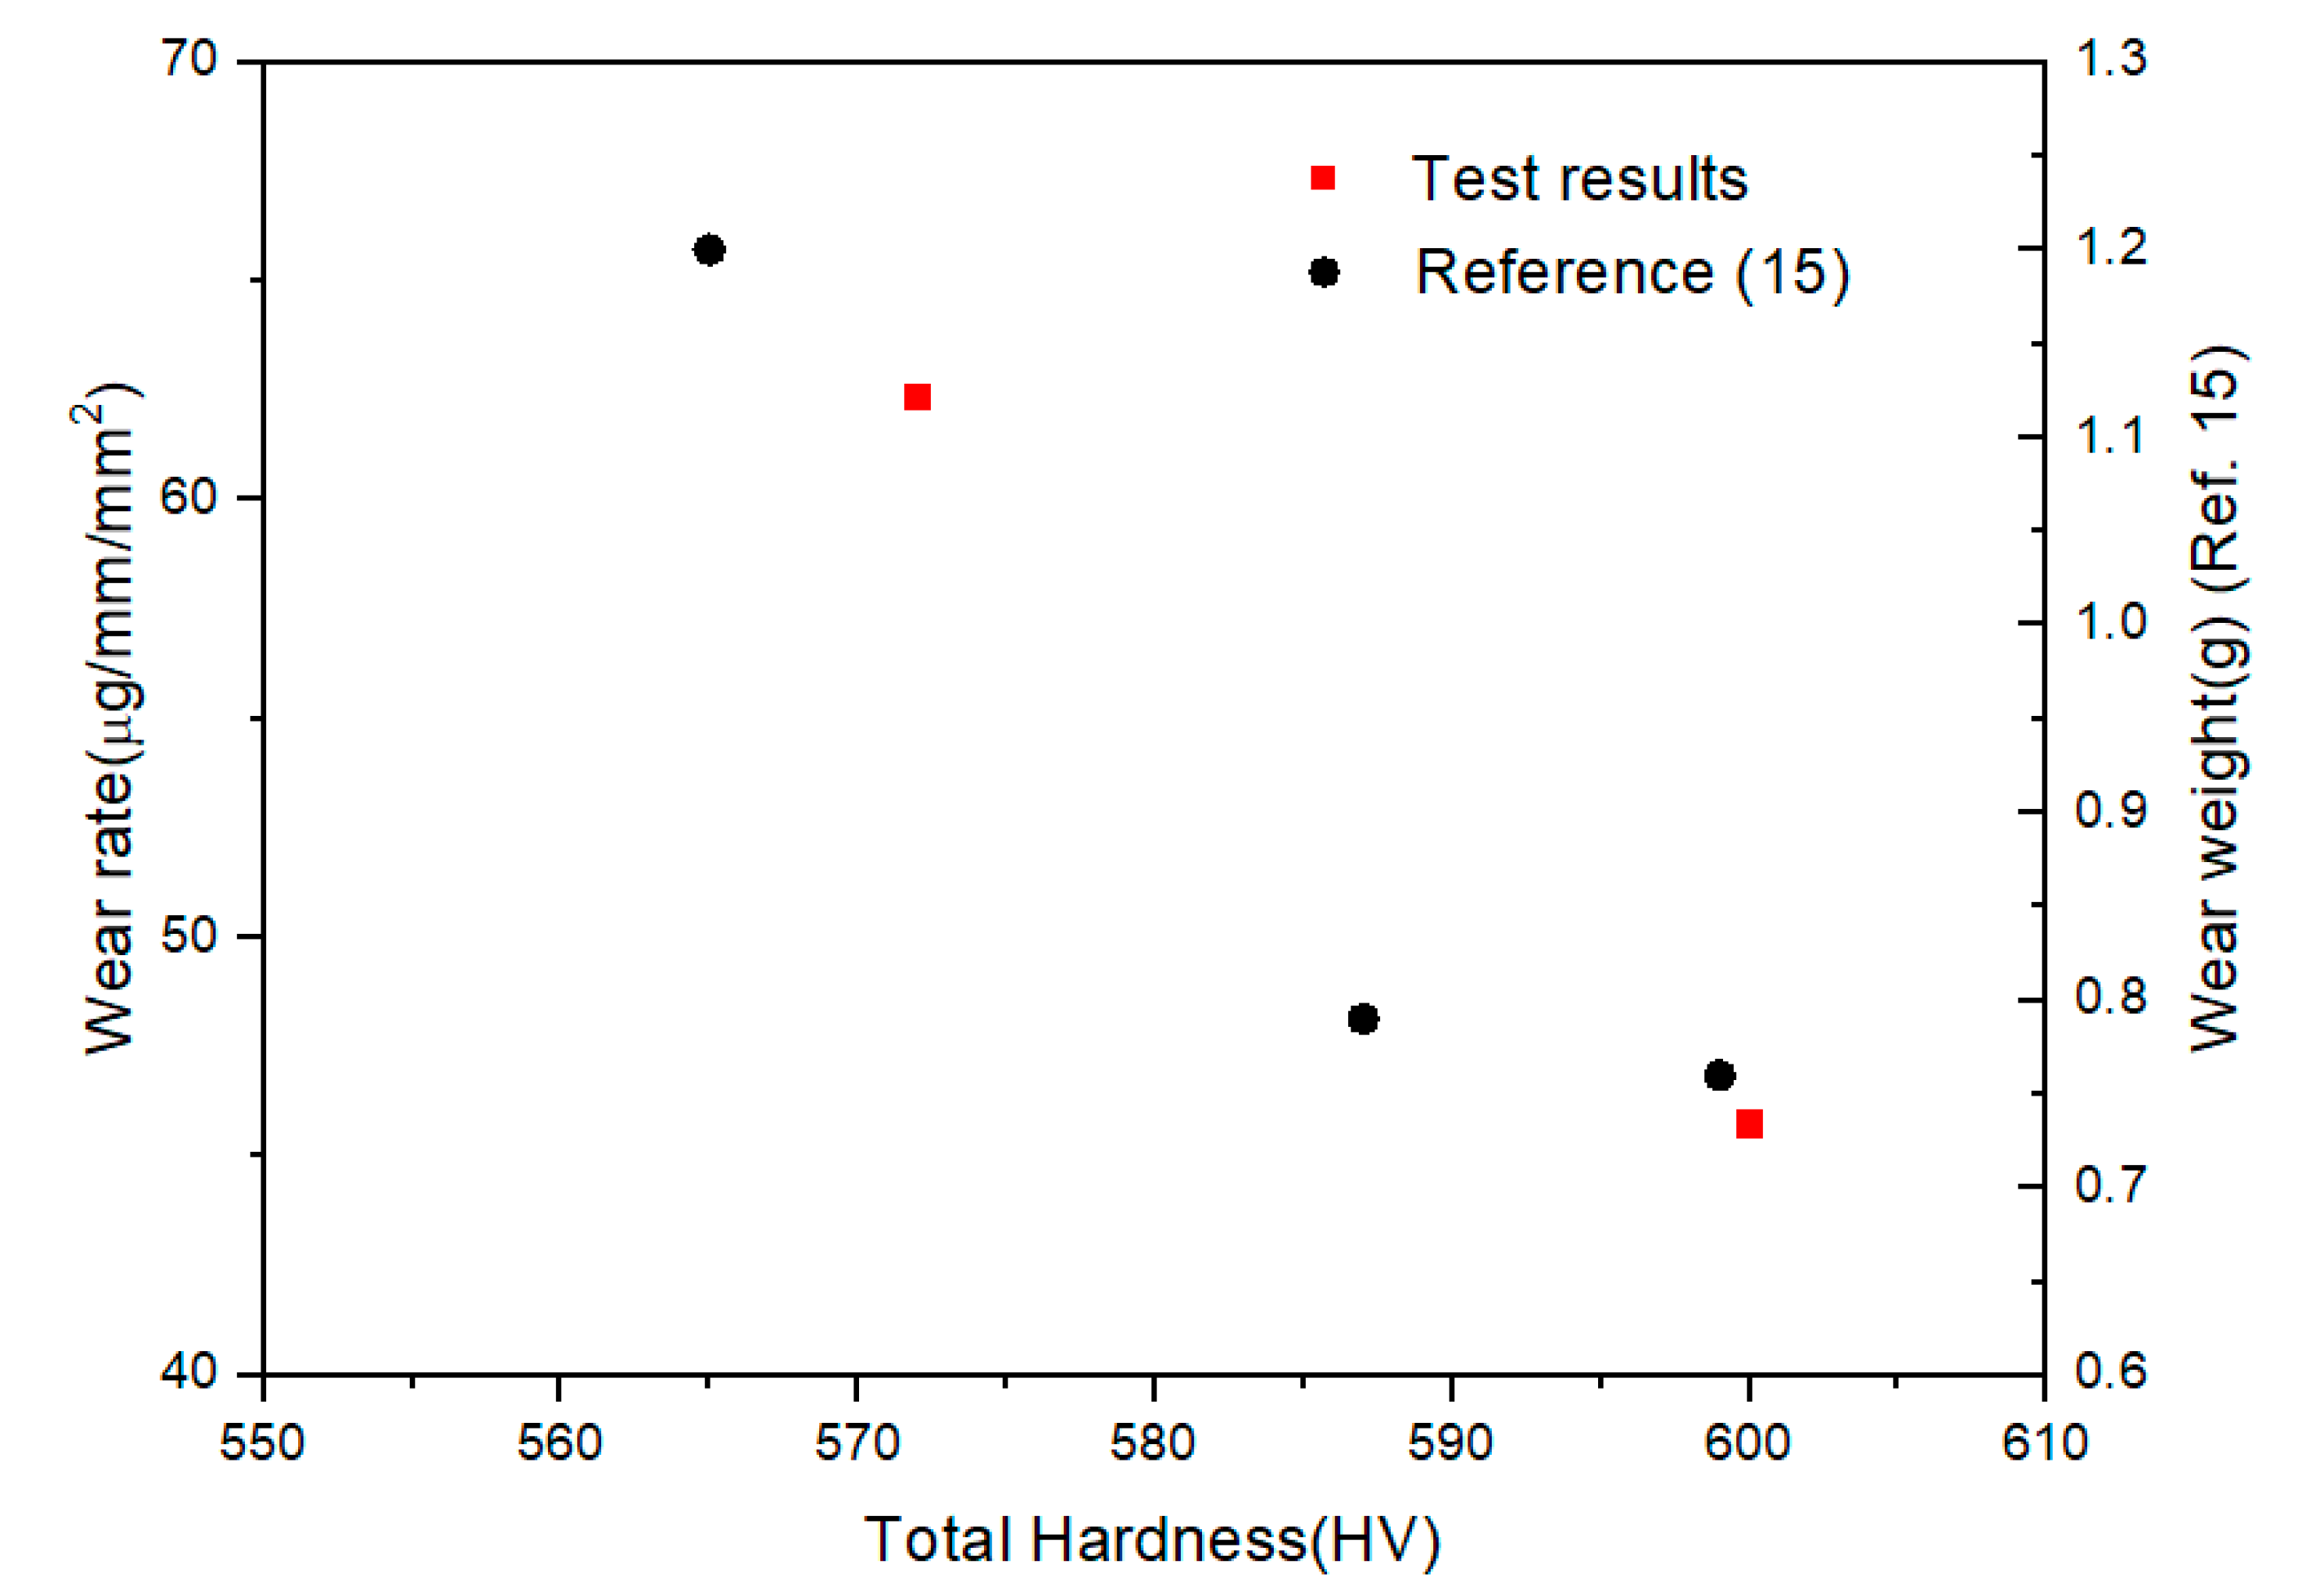
4.1. Hardness and Wear
4.2. Fracture Toughness and Contact Fatigue
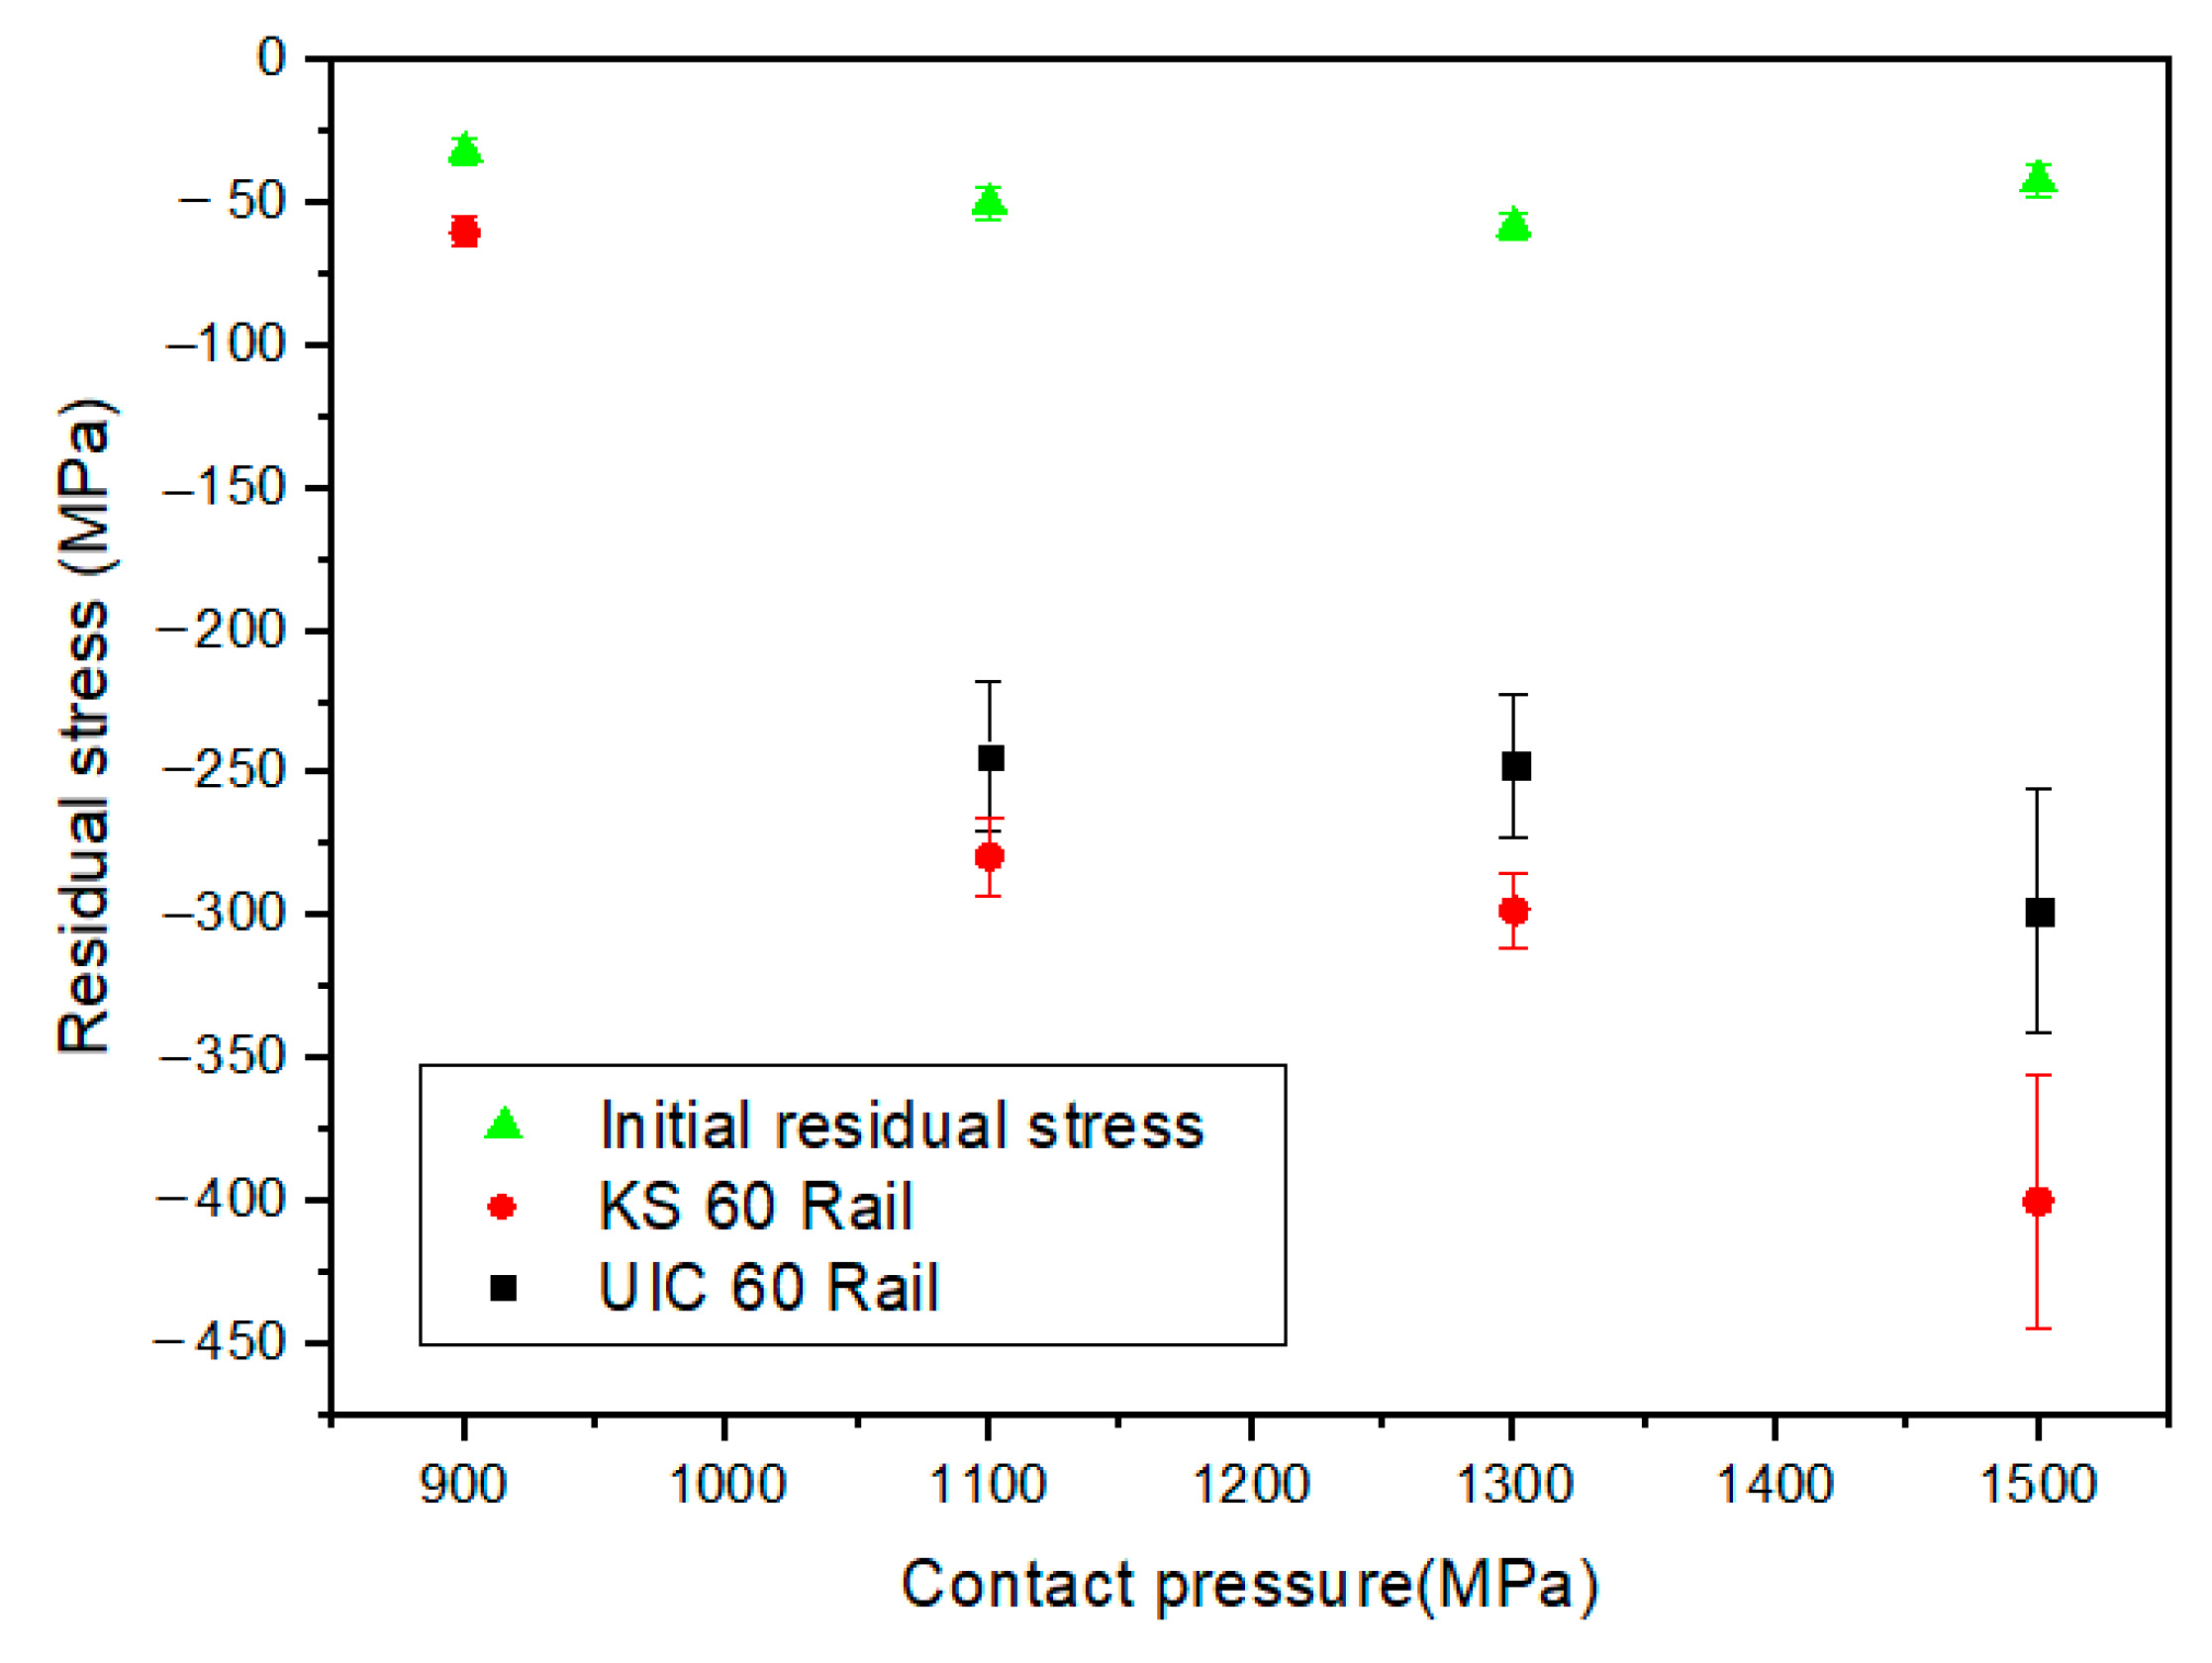
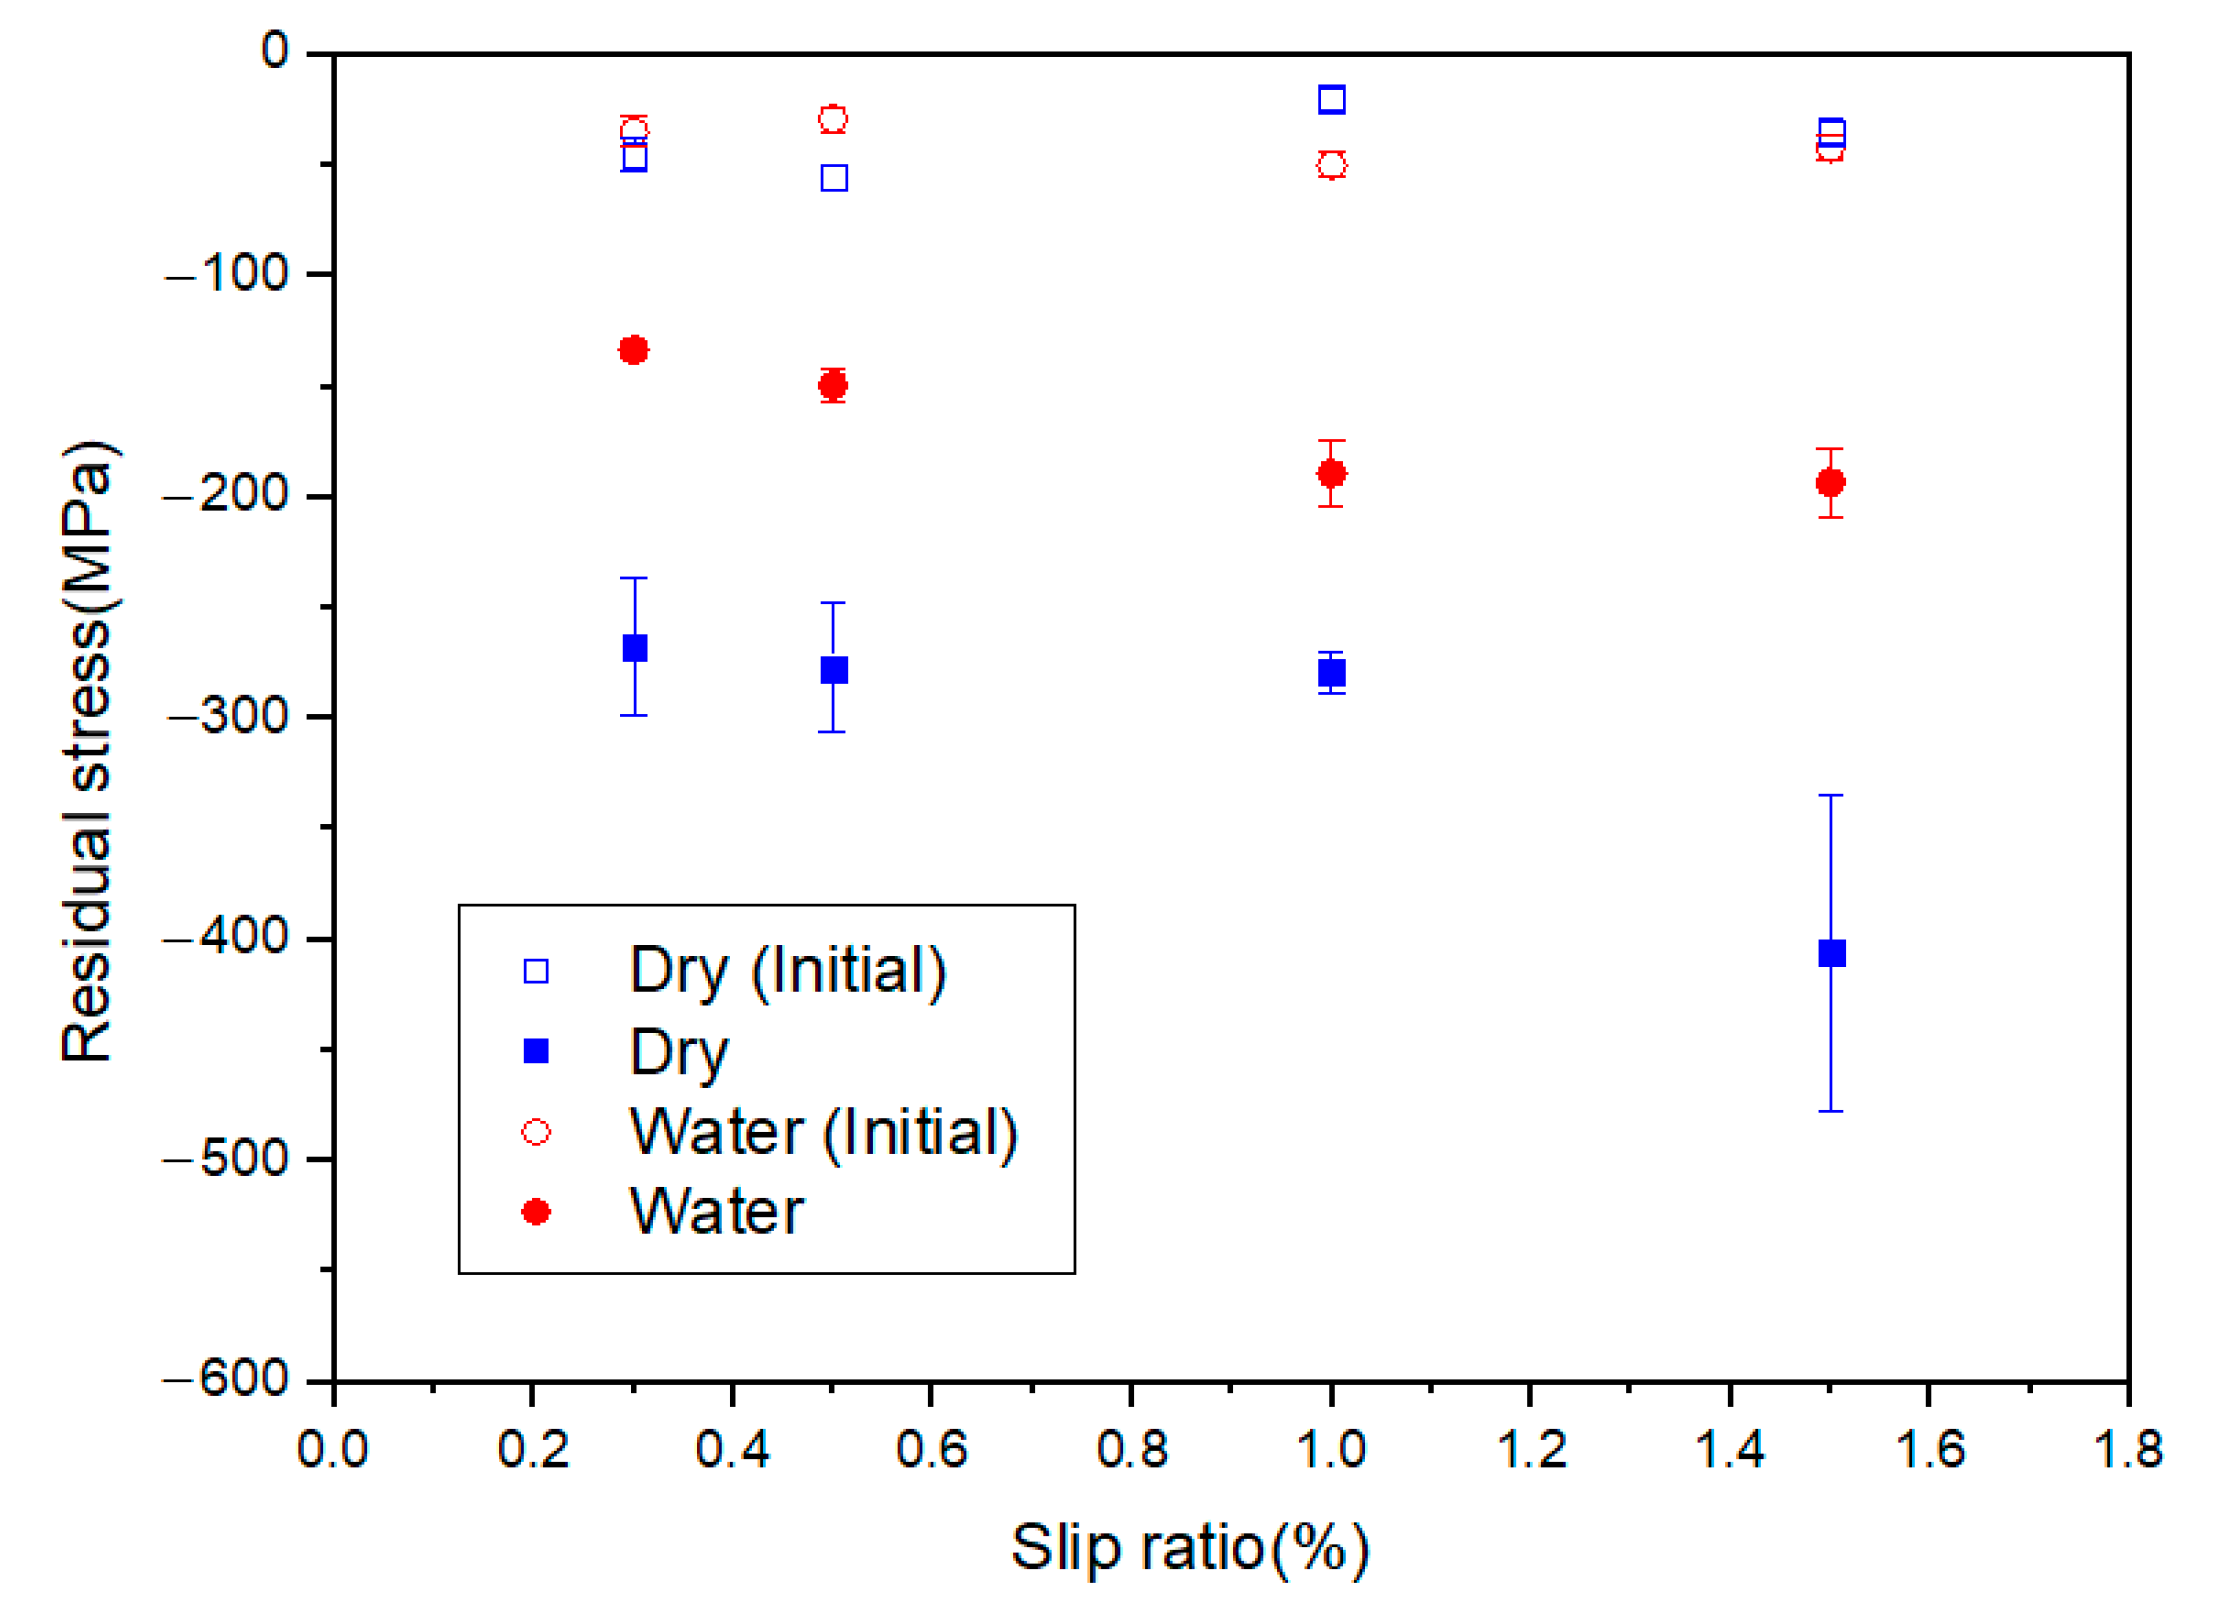
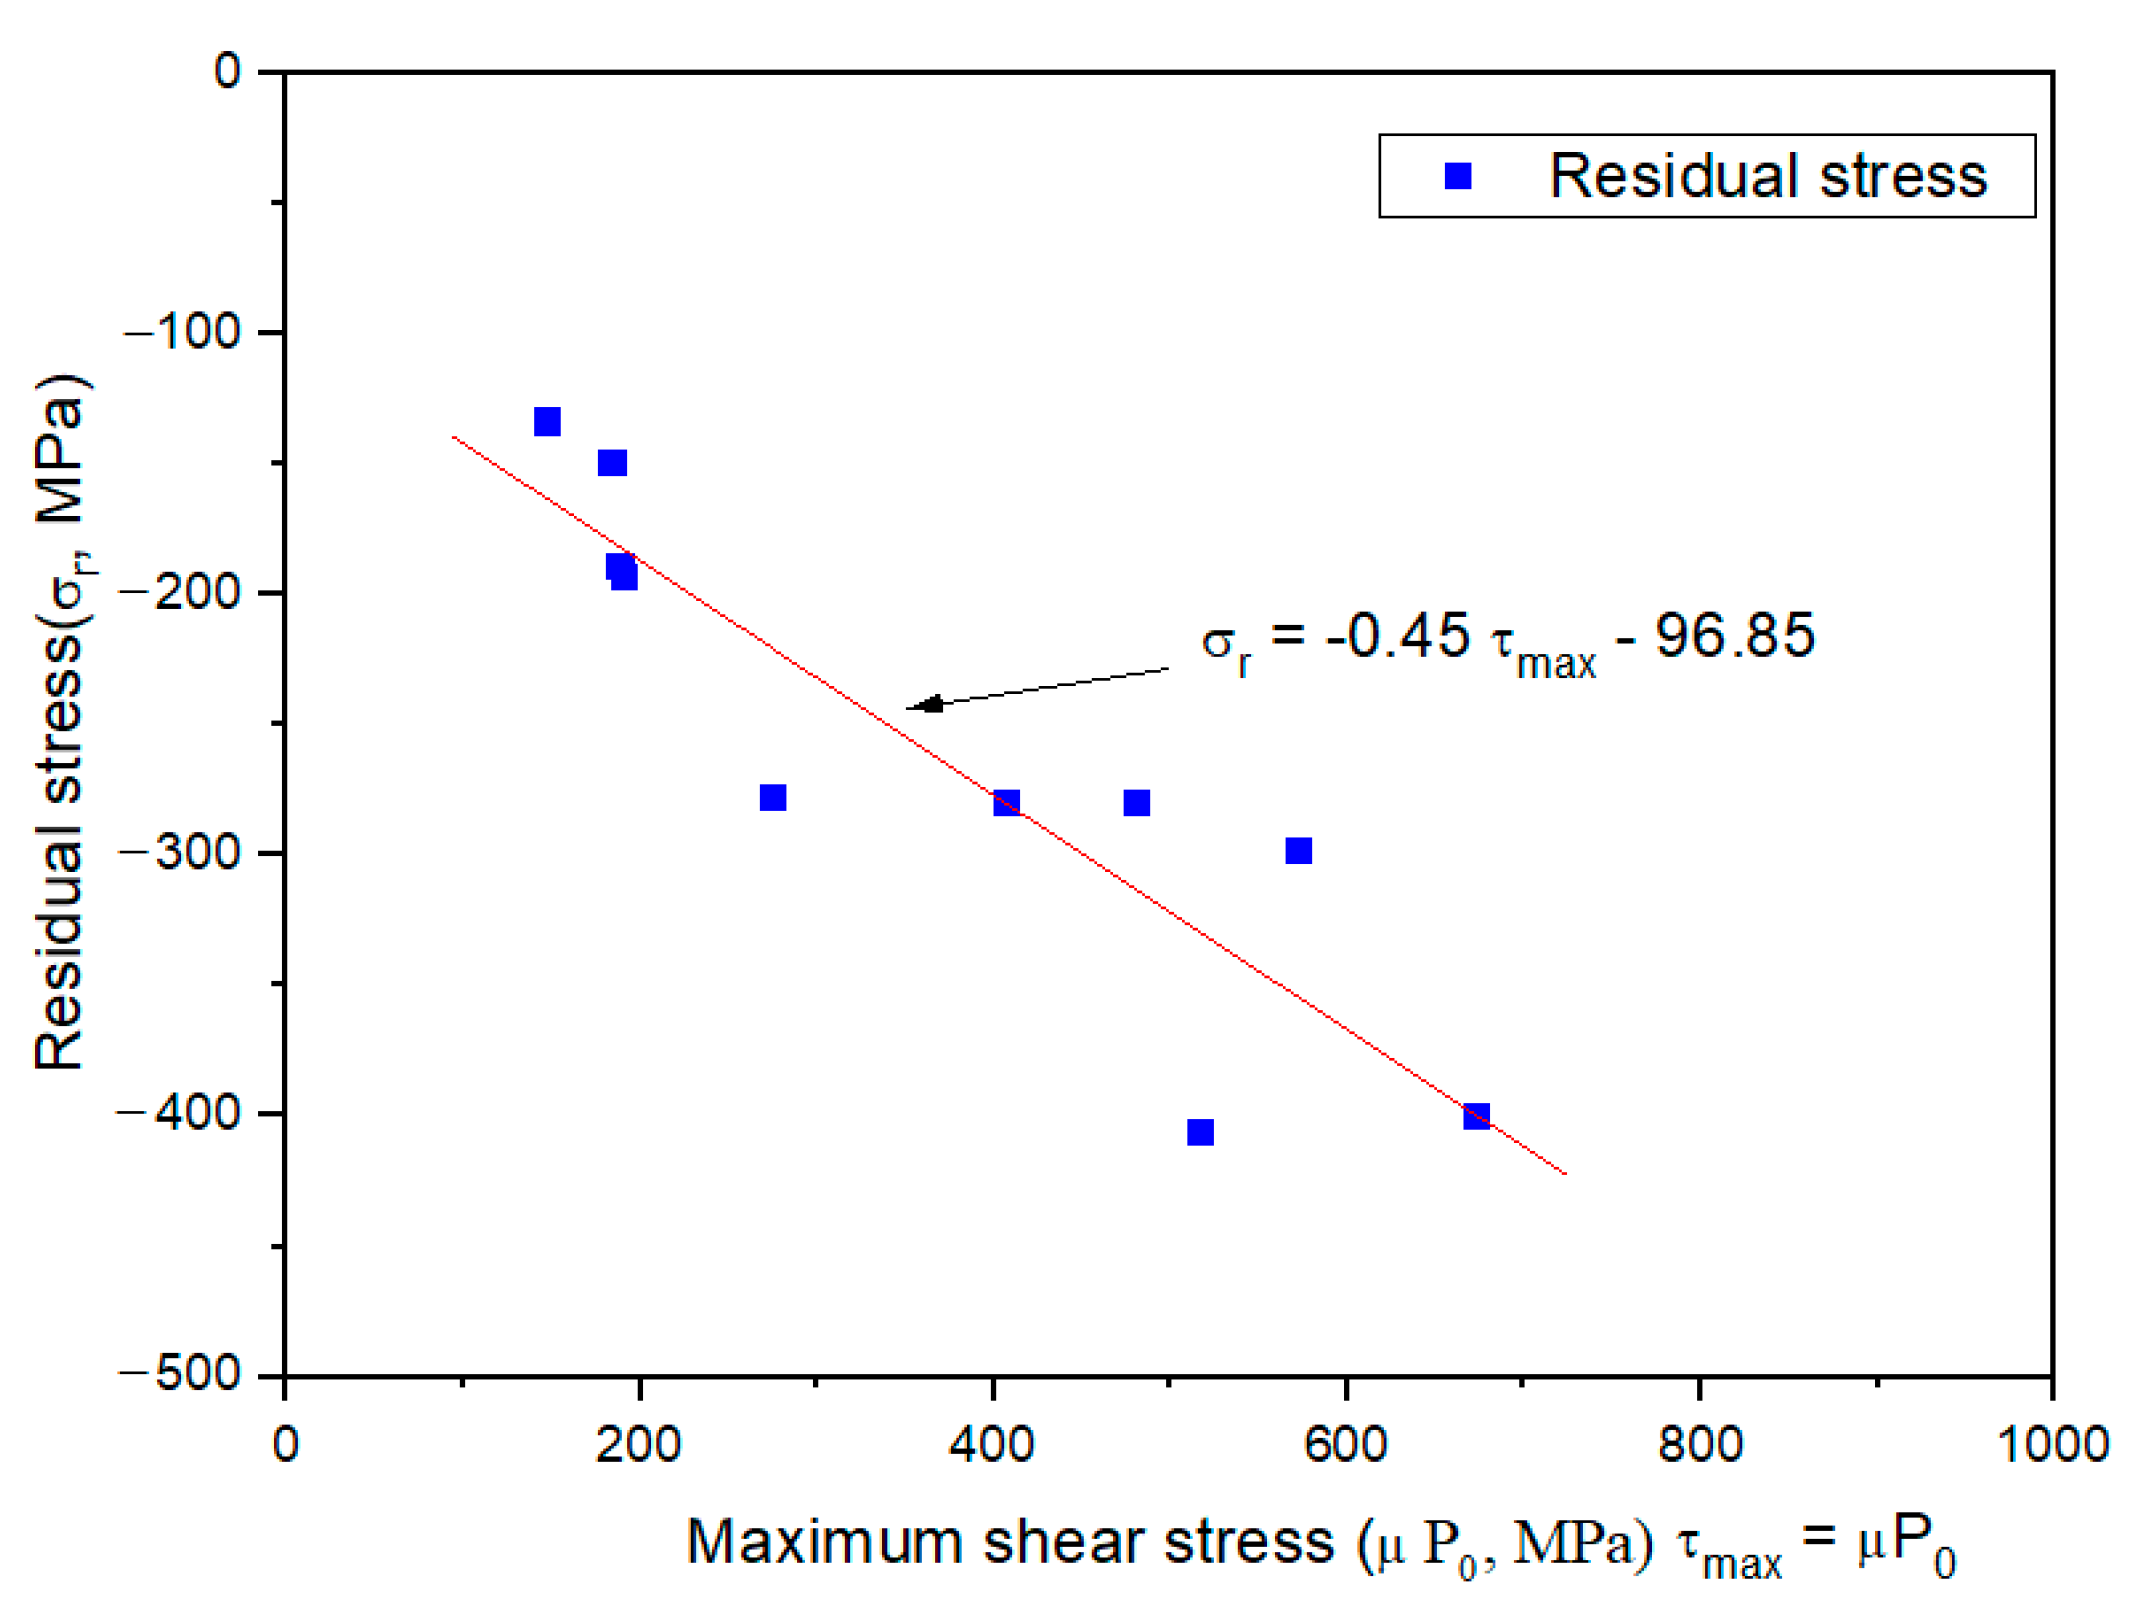
4.3. Residual Stress Evolution
5. Conclusions
Author Contributions
Funding
Data Availability Statement
Conflicts of Interest
References
- Krishna, V.; Hossein-Nia, S.; Casanueva, C.; Stichel, S. Long term rail surface damage considering maintenance interventions. Wear 2020, 460–461, 203462. [Google Scholar] [CrossRef]
- Borja, R.; Albi, S.E.; Unai, A.; Jose, M.M.; Javier, N. Prediction of Rolling Contact Fatigue Behavior in Rails Using Crack Initiation and Growth Models along with Multibody Simulations. Appl. Sci. 2021, 11, 1026. [Google Scholar]
- Lian, Q.; Deng, G.; Zhu, H.; Li, H.; Wang, X.; Liu, Z. Influence of white etching layer on rolling contact behavior at wheel-rail interface. Friction 2020, 8, 1178–1196. [Google Scholar] [CrossRef]
- Lian, Q.; Zhu, H.; Deng, G.; Wang, X.; Li, H.; Wang, X.; Liu, Z. Evolution of thermally induced white etching layer at rail surface during multiple wheel/train passages. Int. J. Fatigue 2022, 159, 106799. [Google Scholar] [CrossRef]
- Zhao, X.; An, B.; Zhao, X.; Wen, Z.; Jin, X. Local rolling contact fatigue and indentations on high-speed railway wheels: Observations and numerical simulations. Int. J. Fatigue 2017, 103, 5–16. [Google Scholar] [CrossRef]
- Zhao, X.; Wang, Z.; Wen, Z.; Wang, H.; Zeng, D. The initiation of local rolling contact fatigue on railway wheels: An experimental study. Int. J. Fatigue 2020, 132, 105345. [Google Scholar] [CrossRef]
- Tyfour, W.R.; Beynon, J.H.; Kapoor, A. The steady state wear behavior of pearlitic rail steel under dry rolling-sliding contact condition. Wear 1995, 180, 79–89. [Google Scholar] [CrossRef]
- Lewis, R.; Olofsson, U. Mapping rail wear regimes and transitions. Wear 2004, 257, 721–729. [Google Scholar] [CrossRef] [Green Version]
- Kondo, K.; Yoroizaka, K.; Sato, Y. Cause, increase, diagnosis, countermeasures and elimination of Shinkansen shelling. Wear 1996, 191, 199–203. [Google Scholar] [CrossRef]
- Cannon, D.F.; Pradier, H. Rail rolling contact fatigue Research by the European Rail Research Institute. Wear 1996, 191, 1–13. [Google Scholar] [CrossRef]
- Taizo, M.; Takanori, K.; Kenji, H. The effect of slip ratio on the rolling contact fatigue property of railway wheel steel. Int. J. Fatigue 2012, 36, 68–79. [Google Scholar]
- Zhong, W.; Hu, J.J.; Li, Z.B.; Liu, Z.R.; Zhou, Z.R. A study of rolling contact fatigue crack growth in U75V and U71Mn rails. Wear 2011, 271, 388–392. [Google Scholar] [CrossRef]
- EN 13674; Railway Applications—Track-Rail. European Committee for Standardization: Brussels, Belgium, 2011.
- EN 13262; Railway Applications—Wheelsets and Bogies-Wheels-Product Requirements. European Committee for Standardization: Brussels, Belgium, 2011.
- Razhkovskiy, A.A.; Bunkova, T.G.; Petrakova, A.G.; Gateluk, O.V. Optimization of hardness ratio in rail-wheel friction pair. J. Frict. Wear 2015, 36, 334–341. [Google Scholar] [CrossRef]
- Wang, W.; Jiang, W.; Wang, H.; Liu, Q.; Zhu, M.; Jin, X. Experimental study on the wear and damage behavior of different wheel/rail materials. J. Rail Rapid Transit 2016, 230, 3–14. [Google Scholar] [CrossRef]
- Hu, Y.; Zhou, L.; Dong, H.H.; Tan, G.X.; Lewis, R.; Liu, Q.Y.; Guo, J.; Wang, W.J. Investigation on wear and rolling contact fatigue of wheel-rail materials under various wheel/rail hardness ratio and creepage conditions. Tribol. Int. 2020, 143, 106091. [Google Scholar] [CrossRef]
- Donzella, G.; Faccoli, M.; Ghidini, A. The competitive role of wear and RCF in a rail steel. Eng. Fract. Mech. 2005, 72, 287–308. [Google Scholar] [CrossRef]
- Donzella, G.; Mazzu, A.; Petrogalli, C. Competition between wear and rolling contact fatigue at the wheel-rail interface: Some experimental evidence on rail steel. Proc. Inst. Mech. Eng. Part F J. Rail Rapid Transit 2009, 223, 31–44. [Google Scholar] [CrossRef]
- Ishida, M.; Abe, N. Experimental study on rolling contact fatigue from the aspect of residual stress. Wear 1996, 191, 65–71. [Google Scholar] [CrossRef]
- Batista, A.C.; Peixoto, D.F.C.; Nobre, J.P.; Coelho, L. Wear and surface residual stress evaluation on twin-disc tests of rail/wheel steels. Mat. Sci. Forum 2014, 768–769, 707–713. [Google Scholar]
- Ueda, M.; Matsuda, K. Effects of carbon and hardness on rolling contact fatigue resistance in heavily loaded pearlitic rail steels. Wear 2020, 444–445, 203120. [Google Scholar] [CrossRef]
- Liu, C.; Zhao, X.; Liu, P.; Pan, J.; Ren, R. Influence of contact stress on surface microstructure and wear property of D2/U71Mn Wheel-Rail Material. Materials 2019, 12, 3268. [Google Scholar] [CrossRef] [PubMed] [Green Version]
- Pereira, H.B.; Alves, L.H.D.; Rezende, A.B.; Mei, P.R.; Goldensten, H. Influence of the microstructure on the rolling contact fatigue of rail steel: Spheroidized pearlite and fully pearlitic microstructure analysis. Wear 2022, 498–499, 204299. [Google Scholar] [CrossRef]
- Li, Q.; Guo, J.; Zhao, A. Effect of upper Bainite on wear behaviour of high-speed wheel steel. Tribol. Lett. 2019, 67, 121. [Google Scholar] [CrossRef]
- Liu, J.; Li, Y.; Zhang, Y.; Hu, Y.; Shi, L.; Ding, H.; Wang, W.; Liu, F.; Zhou, S.; Shi, T. Dry rolling/sliding wear of bainitic rail steels under different contact stresses and slip ratios. Materials 2020, 13, 4678. [Google Scholar] [CrossRef] [PubMed]
- Miranda, R.S.; Rezende, A.B.; Fonseca, S.T.; Fernandes, F.M.; Sinatora, A.; Mei, P.R. Fatigue and wear behavior of pearlitic and bainitic microsturcutes with th same chemical composion and hardness using twin-disc tests. Wear 2022, 494–495, 204253. [Google Scholar] [CrossRef]
- Liu, M.; Fan, Y.; Gui, X.; Hu, J.; Wang, X.; Gao, G. Relationship between microstructure and properties of 1308 MPa Grade bainitic rail steel treated by online bainite-based Quenching and partitioning concept. Metals 2022, 12, 330. [Google Scholar] [CrossRef]
- Pointer, P. High strength rail steels—The importance of material properties in contact mechanics problems. Wear 2008, 265, 1373–1379. [Google Scholar] [CrossRef]
- Noda, T. Safety of wheels and axles for railway vehicles and engineering ethics. Forum 2002, 7, 9–16. [Google Scholar]
- ASTM-E647; Standard test Method for Measurement of Fatigue Crack Growth Rates. ASTM Standards. American Society for Testing and Materials: West Conshohocken, PA, USA, 2001; Volume 3.
- Tyfour, W.R.; Beynon, J.H.; Kapoor, A. Deterioration of rolling contact fatigue life of pearlitic rail steel due to dry-wet rolling-sliding line contact. Wear 1996, 197, 255–265. [Google Scholar] [CrossRef]
- Benson, M. Effect of Differential Hardness on Wheel/Rail Wear Literature Survey; British Rail Research Report LR MT 0006; British Rail Research Division: Derby, UK, 1993. [Google Scholar]
- Zhou, G.Y.; Liu, J.H.; Wang, W.J.; Wen, G.; Liu, Q.Y. Study on the fatigue and wear characteristics of four wheel materials. J. Mod. Transp. 2013, 21, 182–193. [Google Scholar] [CrossRef] [Green Version]
- Liu, Y.; Stratman, B.; Mahadevan, S. Fatigue crack initiation life prediction of railroad wheels. Int. J. Fatigue 2006, 28, 747–756. [Google Scholar] [CrossRef]
- Ekberg, A.; Kabo, E.; Andersson, H. An engineering model for prediction of rolling contact fatigue of railway wheels. Fatigue Fract. Eng. Mater. Struct. 2002, 25, 899–909. [Google Scholar] [CrossRef]
- Ekberg, A.; Paulsson, B. Innovative Laboratory Tests for Rail Steels; INNOTRACK D4.3.7 Final Report; International Union of Railways: Paris, France, 2009; pp. 18–21. [Google Scholar]


| Steel | C | Si | Mn | P | S | Al | N |
|---|---|---|---|---|---|---|---|
| KS60 | 0.63–0.75 | 0.15–0.30 | 0.70–1.10 | 0.030 | 0.025 | ||
| UIC60 | 0.65–0.82 | 0.13–0.60 | 0.65–1.25 | 0.030 | 0.008–0.030 | 0.004 | 0.009 |
| Steel | C | Si | Mn | P | S | Cr | Cu | Mo | Ni | V | (Cr+Mo+Ni) |
|---|---|---|---|---|---|---|---|---|---|---|---|
| RSW | 0.67 | 0.15 | 0.6–0.8 | 0.045 | 0.045 | 0.35 | |||||
| R7 | 0.52 | 0.40 | 0.80 | 0.035 | 0.035 | 0.30 | 0.30 | 0.08 | 0.30 | 0.05 | 0.50 |
| Steel | Yield Strength (MPa) | Ultimate Strength (MPa) | Elongation. (%) |
|---|---|---|---|
| KS60 | 706 | 859 | 15 |
| RSW | 508 | 908 | 21 |
| UIC60 | 772 | 943 | 12 |
| R7 | 547 | 879 | 22 |
| Specimen No. | C | m | △K (MPa√m) | da/dN (m/Gc *) | △K (MPa√m) | da/dN (m/Gc *) |
|---|---|---|---|---|---|---|
| KS 60 | 3.3 × 10⁻³ | 3.21 | 10 | 5.37 | 13.5 | 14.07 |
| RSW | 1.4 × 10⁻³ | 3.41 | 10 | 3.55 | 13.5 | 9.87 |
| UIC 60 | 1.3 × 10⁻² | 2.78 | 10 | 7.59 | 13.5 | 17.47 |
| R7 | 6.9 × 10⁻⁴ | 3.66 | 10 | 3.16 | 13.5 | 9.49 |
Publisher’s Note: MDPI stays neutral with regard to jurisdictional claims in published maps and institutional affiliations. |
© 2022 by the authors. Licensee MDPI, Basel, Switzerland. This article is an open access article distributed under the terms and conditions of the Creative Commons Attribution (CC BY) license (https://creativecommons.org/licenses/by/4.0/).
Share and Cite
Seo, J.-W.; Hur, H.-M.; Kwon, S.-J. Effect of Mechanical Properties of Rail and Wheel on Wear and Rolling Contact Fatigue. Metals 2022, 12, 630. https://doi.org/10.3390/met12040630
Seo J-W, Hur H-M, Kwon S-J. Effect of Mechanical Properties of Rail and Wheel on Wear and Rolling Contact Fatigue. Metals. 2022; 12(4):630. https://doi.org/10.3390/met12040630
Chicago/Turabian StyleSeo, Jung-Won, Hyun-Moo Hur, and Seok-Jin Kwon. 2022. "Effect of Mechanical Properties of Rail and Wheel on Wear and Rolling Contact Fatigue" Metals 12, no. 4: 630. https://doi.org/10.3390/met12040630
APA StyleSeo, J.-W., Hur, H.-M., & Kwon, S.-J. (2022). Effect of Mechanical Properties of Rail and Wheel on Wear and Rolling Contact Fatigue. Metals, 12(4), 630. https://doi.org/10.3390/met12040630