Abstract
A new D457 × 7.1 X65ERW oil pipeline leaked twice during the pressure test. The two failed oil pipes belonged to the same batch of products from the same manufacturer. Failure analysis showed that the cracks in the 1# and 2# cracking pipes propagated from the outer surface of the pipe wall to the inner surface along the weld fusion line. The inclusion phase distributed in chains in the weld zone is speculated to be the root cause of the cracking in the pressure test. The fitness-for-service of this batch of steel pipes was analyzed using the failure-assessment chart technique. The batch of steel pipes could be used safely under the design pressure of 10 MPa, and the re-evaluation period of three years was recommended for the pipeline based on the fatigue results of the steel-pipe weld zone.
1. Introduction
Pipeline leakage causes not only oil loss but also water and soil pollution, seriously threatening people’s property and even life safety. Though defects are not generally allowed to exist in pipelines. some pipes with small defects can be reused after repairment. Zhukov et al. investigated the effect of manufacturing defects on gas pipelines. The simulated calculations confirm the admissibility of defect-controlled grinding repair along their paths []. However, fitness-for-service assessment based on the operational condition is necessary before these pipes are reused.
Due to the possible existence of welding cracks, cavities, solid inclusions, and lack of fusion, welded joints of the pipeline have become one of the most important factors in pipeline failure. At present, many incidents related to the failure of components are caused by welding behavior, mainly in two aspects: the existence of welding defects reduces the cross-sectional area of the weld and the bearing capacity, and causes stress concentration and cracks [,,,,,,,,,]. Second, a potential difference may occur between the welding area and surrounding material due to the discontinuity of the geometric size or phase, and under the action of the corrosive medium, the process of the defect is accelerated, resulting in the failure of the component [,,,,,,].
At present, many studies focus on the effect of defects on the properties of components, such as mechanical properties, brittle fracture resistance, et al. [,,,,]. Litter studies are developed on the later service quality and service life [,,]. Lu analyzed the reasons for the multiple bursts of the ERW oil pipeline during the pressure test. Based on the safety assessment, suggestions were made for depressurized operation and the maximum allowable pressure on the failed pipeline []. This paper investigates the failure event of two oil pipes leaking successively during the pipeline pressure-test process before running, and analyzes the reasons for the failure of the pipes. This study also analyzes the critical crack length of the pipeline, the fatigue life of the pipeline, and recommended the re-evaluation period of the pipeline. This study not only enriches the weld-failure model but also provides guidance for the safety management of similar potentially defective components.
2. Event Overview
According to the design requirements, the working pressure of a refined oil pipeline was 10 MPa, and a X65 grade ERW straight-seam pipe (D457 × 7.1) was adopted. The pipeline should be subjected to 12.5 MPa by pressure testing before running. However, during the pressure tests, the two oil pipes leaked four days apart. The two oil pipes that cracked were products from the same manufacturer and the same batch. Ultrasonic inspection results showed that a defect had an axial length of 25 mm at the weld 1885 mm away from the port of the 1# line pipe, and a defect with an axial length of 34 mm at the weld of the 2# line pipe was observed at a distance of 2905 mm from the port. These two defects are the leak spot of the 1# line pipe and 2# line pipe, as shown in Figure 1.
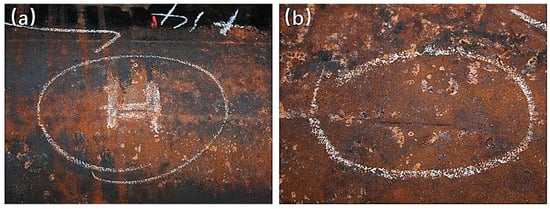
Figure 1.
Morphology of leaking pipes (a) 1# pipe and (b) 2# pipe.
3. Analysis of Cause of Leakage
The 1# and 2# cracking pipe were investigated for crack morphology, base-metal/weld-area microstructure, and weld streamline morphology, etc.
The specific sampling locations are shown in Figure 2. C1–C5 samples were used for crack morphology and microstructure analysis, of which three samples were taken from the crack area (sample numbers are C2, C3, and C4), and one was taken away from both ends of the crack (sample numbers are C1 and C5). The three samples in the WSI 1-3 area were used for the impact toughness analysis of the weld zone. The three samples in the BSI 1-3 area were used for the impact-toughness analysis of the base metal.
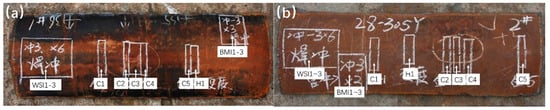
Figure 2.
Schematic of sampling positions of cracking pipes (a) 1# and (b) 2#.
3.1. Analysis of Crack Morphology
3.1.1. Crack Morphology of 1# Pipe
The morphologies of the side cracks of the 1# cracking pipe in the C1–C5 samples were observed. As shown in Figure 3, the cracks on the side of sample C2 had completely penetrated the pipe wall, and the cracks gradually expanded from the inner wall to the outer wall. The crack morphology was invisible on the side of sample C4. This condition shows that the cracks propagated from the outer surface of the pipe wall to the inner surface. Analysis of the microstructure near the cracks showed that the cracks spread along the fusion line of the weld, and many inclusions occurred in the cracks (Figure 4).
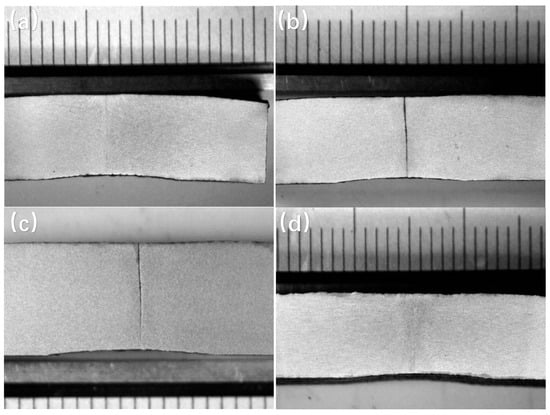
Figure 3.
Macromorphology of weld seam of 1# cracking pipe (a) C1; (b) C2; (c) C3; (d) C4.
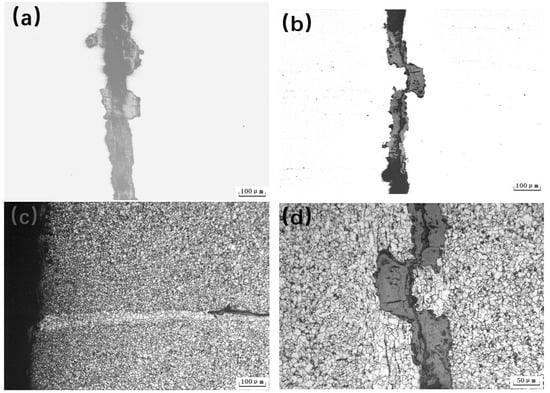
Figure 4.
Analysis of weld of 1# cracking pipe: (a) C2 sample crack; (b) inclusions in crack of C3 sample; (c) crack tip morphology and fusion line on inner surface of C3 sample; (d) microstructure and oxide inclusions in the middle of the weld fusion line of C3 sample.
3.1.2. Crack Morphology of 2# Pipe
For the 2# cracking pipe, the fusion line of the weld seam of the sample was inclined, and the crack propagated from the outer surface of the pipe wall to the inner surface along the fusion line. The cracks of C3 and C4 samples had completely penetrated the wall thickness. Small cracks were inclined to the base metal on the outer surface of the pipe wall, as shown in Figure 5. Inclusions were observed in the small cracks on the outer surface of the tube wall at a distance of 2–3 mm from the fusion line, as shown in Figure 6.
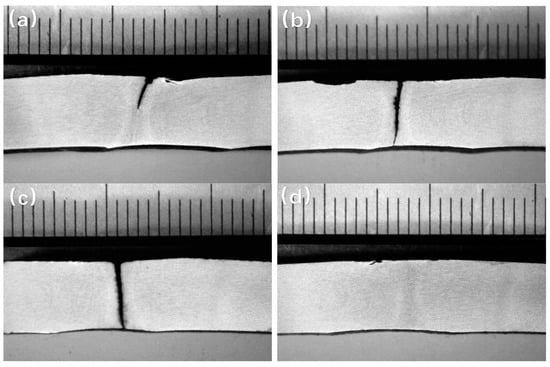
Figure 5.
Macromorphology of weld seam of 2# cracking pipe: (a) C2; (b) C3; (c) C4; (d) C5.
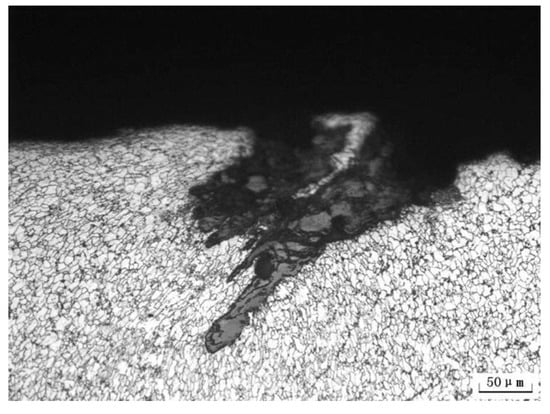
Figure 6.
Small crack structures near outer surface of 2# cracking pipe.
The crack morphology of the C2–C4 samples of the 1# and 2# pipes can be combined, and the fracture morphology of the original pipe wall of the two cracking pipes can be obtained, as shown in Figure 7.
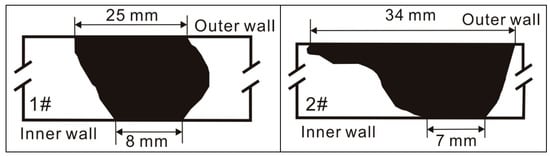
Figure 7.
Restoration diagram of original fracture of leaking pipe.
3.2. Analysis of Crack Source
The TESCAN-VEGA II scanning electron microscope (TESCAN Ltd., Brno, Czech Republic) and the Oxford INCA350 (Oxford Instruments Ltd., High Wycombe, UK) energy dispersive spectrometer were used to further observe the small cracks and complete penetration cracks near the outer surface of the fracture. Inclusions exist at the crack source area, as shown in Figure 8a–d. A large number of secondary cracks can be seen near the inclusion phase. The chemical composition of the inclusion phase is shown in Table 1. The Fe and O contents of the four inclusion phases were similar, and the Fe/O ratio was close to 2:3. Combined with the dendritic structure of the inclusion phase, the inclusion phase is speculated to be iron oxide, which has existed for a certain period at high temperature.
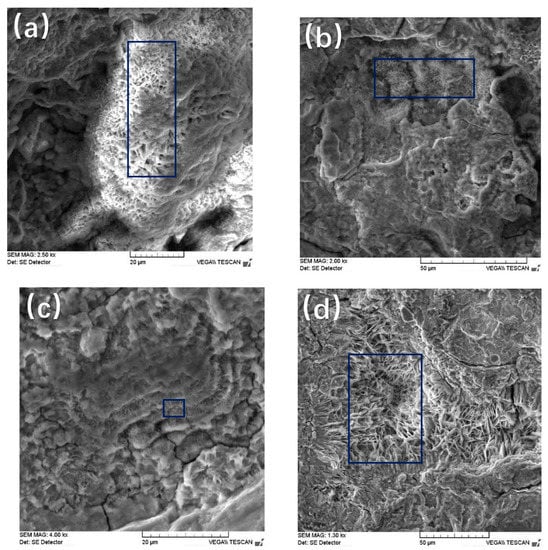
Figure 8.
Morphology of inclusions at crack source. (a) zone 1; (b) zone 2; (c) zone 3; (d) zone 4.

Table 1.
Energy-spectrum analysis results of inclusions at four crack sources (at.%).
3.3. Microstructure Analysis of Weld Area
According to the standards GB/T13298-1991, GB/T10561-2005, and GB/T6394-2002, MEF4M metallographic microscope and image analysis system were used to observe the welding parts of 1# and 2# cracking pipes, as shown in Figure 9 and Figure 10. The microstructure of the weld zone and heat-affected zone was mainly ferrite (F) and pearlite (P). The grain size of the weld zone was higher than grade 9.5, and the grain size of the heat-affected zone was grade 10.5, which met the design requirements. However, gray inclusions in the fusion line were distributed in a shuttle-shaped chain along the direction of the fusion line, that is, the so-called gray spot of weld oxide inclusions with a length of 20–40 μm.
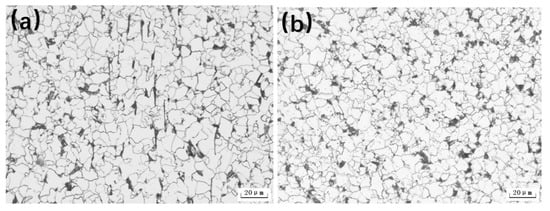
Figure 9.
Microstructure of 1# pipe (a) welding zone; (b) heat-affected zone.
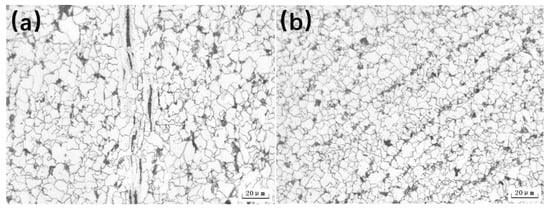
Figure 10.
Microstructure of 2# pipe (a) welding zone; (b) heat-affected zone.
Morphological observation and composition analysis of gray spots in the weld fusion line were conducted, as shown in Figure 11 and Table 2. The chemical composition of the gray spot was similar to that of the inclusion at the crack source (Table 1), and it was the same type of oxide inclusion, that is, iron-oxide inclusion.
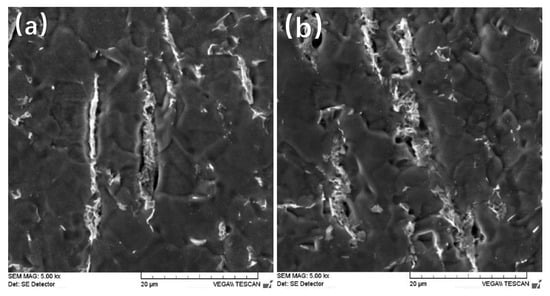
Figure 11.
Enlarged morphology of gray spots in weld fusion line (a) zone 1; (b) zone 2.
Table 2.
Gray-spot energy-spectrum analysis results (at.%).
3.4. Analysis of Weld Streamline Morphology
The streamline morphology of the welding seam was analyzed for the 1# and 2# cracking pipes. As shown in Figure 12a, the streamline morphology of the 1# cracking pipe sample meets the criterion. The fusion line was not obviously inclined, the rising angle of the streamline at the weld did not appear too steep or too flat. The streamline morphology on both sides of the fusion line was symmetrical. The streamlines on the side near the outer surface have double peaks, and the width of the waist drum in the heat-affected zone was moderate. Figure 12b shows that the fusion line of the weld seam of the 2# cracking pipe sample was seriously inclined because of the unbalanced pressing force. The streamline morphology was asymmetric on both sides of the fusion line and the rising angle of some streamlines was extremely large, accompanied by double peaks, and the width of the waist drum in the heat-affected zone was moderate. At the same time, the small cracks near the outer surface of 2# pipe in Figure 6 were due to the turning of the outer surface of the steel sample on the side of the fusion line, as shown in Figure 13.
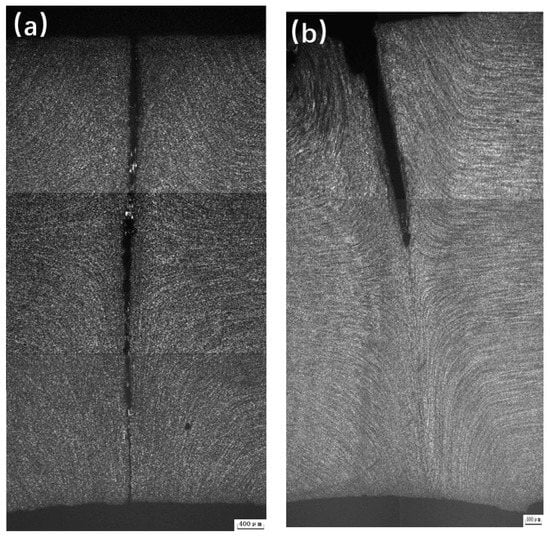
Figure 12.
Streamline morphology of cracking pipe (a) 1#; (b) 2#.
Figure 13.
Rolling and folding on outer surface of 2# cracking pipe.
3.5. Analysis of Mechanical Properties of Weld Zone
To clarify the influence of weld inclusions on the cracking of steel pipes in this batch of products, in addition to two cracking oil pipes, three steel pipes of the same batch without cracks in ultrasonic testing were selected to test the mechanical properties of the weld zone.
3.5.1. Tensile Properties
According to the standard GB/T 228-2002, the weld-sampling analysis of five steel pipes was conducted. Three tensile specimens were taken from each steel pipe. The full-thickness plate specimen was cut perpendicular to the weld, and the weld was located in the middle of the specimen. The specimens were cold-flattened before tensile testing. The test results showed that the tensile strength of the 15 samples was between 540 MPa and 570 MPa, and they were all broken in the weld area. The tensile strength values of specimens are listed in Table 3. The tensile fractures all had “gray spot” defects (Figure 14).
Table 3.
Tensile strength of welding zone.
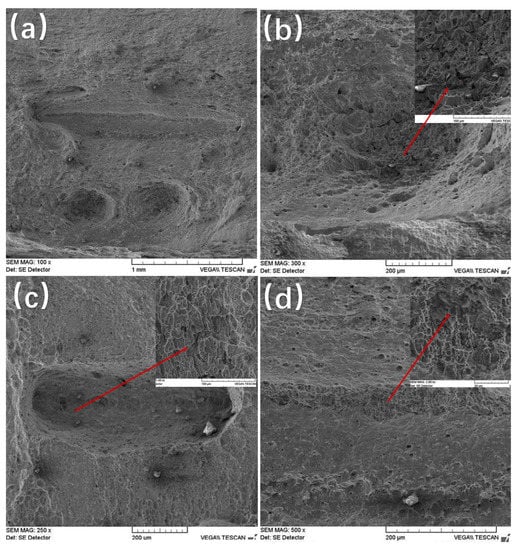
Figure 14.
SEM morphology of tensile fracture: (a) “Gray spot” (bottom) and separation (top) of 1# cracking pipe welds; (b,c) “gray spot” of 2# cracking pipe welds; (d) fracture separation of 2# cracking pipe weld.
3.5.2. Impact Property
According to the standard GB/T 229-2007, the impact properties of five steel pipes (three samples from each steel pipe) were tested in the weld zone at −20 °C. The impact-test results of 15 specimens are listed in Table 4. These values meet the requirements in the technical specification (the average value of impact energy is more than 30 J). However, the impact energy value fluctuated greatly, with a standard deviation of 32.
Table 4.
Impact energy of welding zone.
3.6. Analysis of Physical and Chemical Properties of Pipe
According to API Spec 5L-2012 standard, the chemical composition, material microstructure, and impact toughness of the base metal of the cracking pipe section were tested. The chemical composition of the 1# and 2# pipeline is listed in the Table 5 and Table 6. All experiment results meet the requirements of the API Spec 5L-2012 standard and design requirements for the pipeline.
Table 5.
Chemical composition of 1# pipeline (wt.%).
Table 6.
Chemical composition of 2# pipeline (wt.%).
3.7. Analysis and Discussion
The analysis results show that the cracks in the 1# and 2# pipes completely penetrated the pipe wall, and the cracks extended from the outer surface of the pipe wall to the inner surface along the weld fusion line. Many iron-oxide inclusion phases are distributed in chains in the weld fusion zone of the leaking pipe, and these oxides are the same as the inclusion phases observed in the crack source area of the fracture. At the same time, during the welding process, the stress in the weld area is uneven and the weld fusion line of the 2# pipe is seriously inclined. The most serious fusion line was inclined up to 14.8°.
The ERW steel pipe is heated and welded by high-frequency current. During welding, due to the “skin effects”, the metal on both sides of the butt welding is heated to a very high temperature in a short period. Under the action of the extrusion force, the metals on both sides are welded together to form a welded joint. During normal heating, the welding heat input is sufficient, and the internal impurities have good fluidity at high temperatures and are easy to remove. If the welding heat input is insufficient, the inclusions cannot be melted, the floating ability is poor, and the inclusions remain in the weld. As the composition and structure of the inclusion phase is different from that of the surrounding material, stress concentration occurs when the material is subjected to stress.
During pressure testing, the outer surface of the pipe body was subjected to maximum tensile stress. The stress concentration caused cracks to be generated first in the inclusion phase on the outer surface of the weld zone. With the continuous action of tensile stress, the crack gradually grew until it penetrated the pipe wall and the steel pipe leaked. Weld inclusions are the root cause of oil-pipeline leakage events.
4. Fitness-for-Service Assessment
Fitness-for-service assessment is an engineering-failure critical evaluation method to determine whether the defects found in the manufacturing and operation process are allowed to continue to exist. The advantage of the method is considering the safety and costing for components with potential flaws in service. The investigations of the cracking line pipe show that the welding quality of this batch of steel pipes is poor, and problems occur, such as gray spots and a large dispersion of toughness, which cause hidden dangers in the safe operation of the pipelines. It is necessary to proceed with fitness-for-service assessment for the pipelines. The fitness-for-service assessment of a pipeline includes whether the pipeline can be operated safely under 10 MPa design pressure, and the remaining life for this pipeline (reassessment cycle).
According to the GB50369-2006 and the pipeline design standard, 12.5 MPa hydraulic test should be carried out before operation. As a generally accepted method of pipeline integrity evaluation, hydraulic tests can be used as an alternative and supplement to other integrity-evaluation techniques such as internal inspection. A higher hydropressure test contributes to detecting the most of flaws that trigger off failure, and the pipeline operates safely under lower pressure. A hydropressure of 12.5 MPa ensures the safe operation of pipelines under 10 MPa design pressure. Thus, the key fitness-for-service assessment is only the remaining life prediction of the cracking pipeline.
The pipe-body fatigue behavior is particularly prominent due to the flat-type defects from the straight welding seam and the variable load from shutdown and restart and operating pressure fluctuations. The remaining life is mainly decided by the fatigue life of the cracking pipeline. Figure 15 shows the system flow of fatigue life prediction for pipelines with potential cracking risk. First, the critical defect size of the pipeline under two pressures of 12.5 MPa and 10 MPa was determined based on the FAD system. The critical defect size at 12.5 MPa is the maximum size of potential defect in an operating pipeline. The critical defect size at 10 MPa is an unacceptable defect size for an operating pipeline. Then, whether shutdown and startup and pressure fluctuation cause crack fatigue growth were judged. If the stress-intensity factor ΔK exceeded the fatigue threshold ΔKth, the fatigue life and reassessment cycle of the pipeline where the cracking pipe was located were predicted based on the results of the fatigue-crack growth rate.
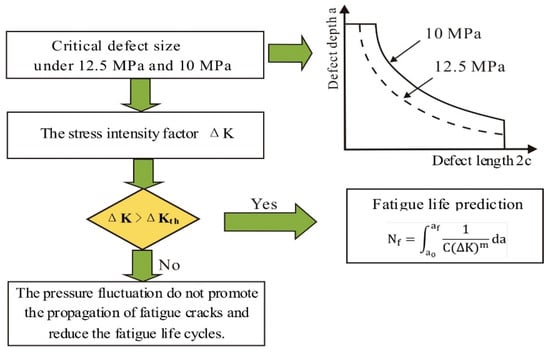
Figure 15.
System flow of fitness-for-service assessment for pipelines with potential leakage risk.
4.1. Critical Defect Size of Pipeline under Pressure of 12.5 MPa and 10 MPa
According to the macroscopic appearance and microscopic analysis results of the cracking pipes, the possible defects in the welds of the pipeline are treated as semielliptical outer-surface cracks. For crack-type defects, the failure-assessment diagram technique is preferentially selected since the technique considers all possible material-failure behaviors, from brittle fracture to plastic instability. The failure-assessment diagram is shown in Figure 16, and the evaluation curve equation is as follows:
where is toughness ratio; is stress-intensity factor; is fracture toughness of the material; is load ratio; is reference stress; and is yield strength of the material. is the cutoff line of the evaluation curve, and , and is tensile strength of the material.
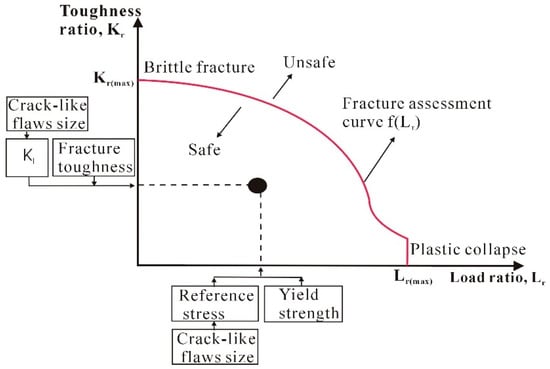
Figure 16.
Failure-assessment diagram.
Based on the API 579 (Fitness for Service), the critical defect size of the pipeline under the test pressure of 12.5 MPa and the design pressure of 10 MPa is calculated and shown in Figure 17. The critical defect size of the pipeline at 12.5 MPa and 10 MPa is a curve controlled by the two parameters of crack depth a and crack length 2c.
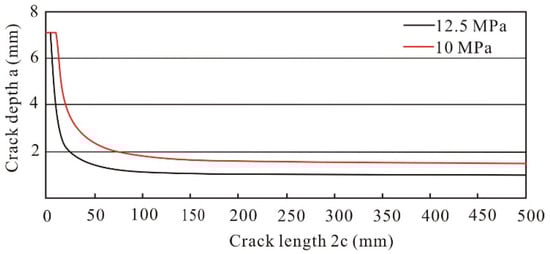
Figure 17.
Critical defect size of pipeline under 12.5 MPa and10 MPa test pressure.
4.2. Fatigue Life Prediction
As shown in Figure 18, the first important step of fatigue life prediction is to determine whether the initial crack propagates under the given conditions. If no propagation occurs, the fatigue life is infinite. Otherwise, the increment (Δa, Δc) of a certain crack size is given based on the initial crack (a0, c0), and the life increment is calculated by virtue of Paris crack-propagation formula. Safety-assessment software (TGRC-AFSP) developed by us is used to calculate the pipe fatigue life. At each step of the life numerical integration, the two parameters (Lr, Kr) of the FAD diagram are used as the criteria of failure conditions. The accumulation and approximation methods are combined to predict the evaluation period.
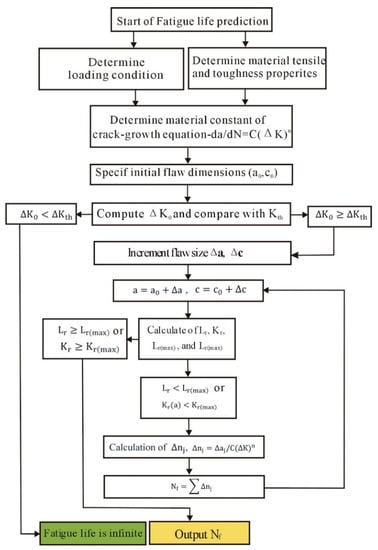
Figure 18.
System flow of fatigue life prediction.
4.2.1. Fatigue-Crack Growth Rate da/dN and Threshold ΔKth
Based on the statistical data of the operating pressure fluctuations of the resemble pipelines within one year, the stress ratio of the pipeline where the cracking pipe was located was set to 0.6 and the fatigue cycle was 47 times per year. The stress ratio with shutdown and restart was 0.1, and the fatigue cycle was 65 times per year. When performing fatigue life prediction, the initial crack depth α0 took the values of 0.95, 1.0, 1.1, 1.2, 1.5, 2.0, 2.5, 3.0, 3.5, 4.0, 4.5, 5.0, 5.5, 6.0, 6.5, and 7.0. The initial crack length 2c0 was determined according to the critical defect length, as shown in Figure 17.
According to the step-by-step force-reduction method in the standard GB/T 6398-2000, the fatigue-crack growth rate da/dN and crack growth threshold ΔKth of the weld seam were tested under the stress ratio (R) of 0.1 and 0.6. The samples were taken from two cracking steel pipes and three steel pipes in the same batch with no cracks in acoustic detection. Three samples were taken from each steel pipe.
Table 7 shows the average values of the fatigue-crack growth threshold ΔKth. When the stress ratio R was 0.1, the average values of the fatigue-crack growth threshold ΔKth were larger than that of the fatigue-crack growth threshold ΔKth when the stress ratio R was 0.6. For the sake of safety, when predicting fatigue life, the threshold value of fatigue-crack growth is the minimum value under the two stress ratios; that is, when the stress ratio is 0.1, ; when the stress ratio is 0.6, .
Table 7.
Average value of ΔKth of steel-pipe welds (MPa·√m).
The measure values of three specimens from the same pipe section were fitted, and the results are shown in Figure 19. The fatigue-crack growth rate when the stress ratio R was 0.6 is higher than the fatigue-crack growth rate when the stress ratio R was 0.1, and the crack growth rates of different steel pipes under the same stress ratio are not much different.
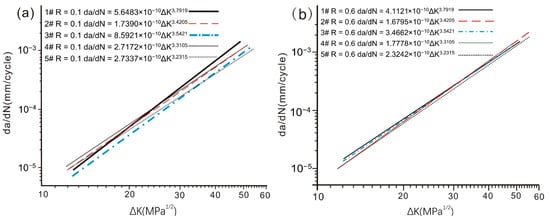
Figure 19.
Fitting curve of fatigue-crack growth rate of weld (a) R = 0.1; (b) R = 0.6.
4.2.2. Determination of Crack Propagation
Fatigue cracks propagate when the stress-intensity factor ΔK at the crack tip is higher than the fatigue-crack growth threshold ΔKth. According to the specification of API 579-2000, for a semielliptical outer surface crack, the crack-tip stress-intensity factor ΔK under internal pressure load should be calculated as follows:
where , , and are the maximum and minimum working pressures of the pipeline, respectively; is the crack depth; and are the inner and outer radii of the pipeline, respectively; , , , , and are influence coefficients.
4.2.3. Fatigue Life Prediction
Taking the critical defect size of the pipeline at 12.5 MPa as the initial crack size, we calculated the fatigue life of the pipeline under stress ratios of 0.6 and 0.1. Figure 20 shows that the trend of the relationship between the cycle times and the initial crack depth under the two stress ratios was similar. When the defect depth was 0.95 mm, the fatigue cycle times of pipelines under both stress ratios reached the lowest value. When the stress ratio was 0.1, the minimum number of cycles was 1363; and when the stress ratio was 0.6, the minimum number of cycles was 18,139.
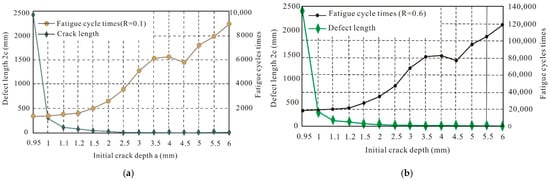
Figure 20.
Relationship between pipeline cycle times and initial crack depth (a) R = 0.1; (b) R = 0.6.
4.3. Reassessment Period
Miner’s theory holds that the fatigue damage of materials at all levels of stress is independent, so the total damage can be accumulated in a linear form. Based on the assumption that the number of cycles for the material to reach failure is N1 under stress ratio R1, and the damage to the structure is D, then the damage to the structure caused by n1 cycles of load is n1D/N1 according to Miner’s theory. For the stress ratios R1 and R2, the damage caused by each cyclic load is D/N1 and D/N2, respectively. When the fatigue damage of the material at all levels of stress reaches the critical value D, the material is damaged, so we can deduce that when the structure suffers fatigue failure, the following is obtained:
That is,
For the failed pipeline, when the stress ratio was 0.6, the fatigue cycle was 47 times per year and the fatigue life cycle was 18,139. When the stress ratio was 0.1, the fatigue cycle was 65 times per year and the fatigue life-cycle times were 1363. According to Equations (4) and (5), the fatigue life of the pipe Tf is obtained by Equation (6).
In general, the inspection period is decided by the following equation:
where Tf is the integrated fatigue life and F is the safety factor.
Due to the large dispersion of fatigue crack growth data, and a certain error between the small-size sample used in the fatigue test and actual pipeline, the safety factor (F) of fatigue life prediction is generally taken as 6 in engineering. According to Equation (7), the reassessment period of the failed pipeline is three years.
5. Conclusions and Recommendations
Through the analysis of the failed parts and fitness-for-service assessment for the pipeline, the following conclusions and suggestions are obtained:
- The results of cracking-failure analysis of the steel pipes show that weld defects are the main reason for the cracking of this pressure test.
- Based on the standards of API 579, GB 50369-2006, and SY/T 6648-2006, the pipeline where the cracking pipe is located can be used safely under a design pressure of 10 MPa.
- Based on the fatigue-test results of pipeline welds, using Miner’s linear cumulative damage theory, a re-evaluation period of three years is recommended for the pipeline where the cracking pipe is located.
- When the pipeline where the cracking pipe is located is put into service, the pressure should be gradually and steadily boosted, and attention to monitoring during boosting is necessary.
- An outside inspection of the entire line should be conducted within three months after the pipeline is put into service to find the possible microseepage points of the pipeline and prevent cracking when the pipeline is in use.
Author Contributions
Experiment, L.-X.Z., L.Z. and G.W.; writing—original draft preparation, L.-F.L. and J.-H.L.; writing—review and editing, J.-H.L. and X.-W.Z. All authors have read and agreed to the published version of the manuscript.
Funding
This research was funded by the Scientific Research and Technology Development Project of PetroChina Company Limited (grant number 2021DJ2804).
Institutional Review Board Statement
Not applicable.
Informed Consent Statement
Not applicable.
Data Availability Statement
Not applicable.
Conflicts of Interest
The authors declare no conflict of interest.
References
- Zhukov, D.; Konovalov, S.; Afanasyev, A. Morphology and development dynamics of rolled steel products manufacturing defects during long-term operation in main gas pipelines. Eng. Fail. Anal. 2020, 109, 104359. [Google Scholar] [CrossRef]
- Karani, A.; Koley, S.; Shome, M. Failure of electric resistance welded API pipes-Effect of centre line segregation. Eng. Fail. Anal. 2019, 96, 289–297. [Google Scholar] [CrossRef]
- Rumiche, F.; Noriega, A.; Lean, P.; Fosca, C. Metallurgical failure analysis of a welded drive beam of a vibrating screen. Eng. Fail. Anal. 2020, 118, 104936. [Google Scholar] [CrossRef]
- Cao, J.; Ma, W.F.; Pang, G.L.; Wang, K.; Ren, J.J.; Nie, H.L.; Dang, W.; Yao, T. Failure analysis on girth weld cracking of underground tee pipe. Int. J. Press. Vessel. Pip. 2021, 191, 104371. [Google Scholar] [CrossRef]
- Taghipour, M.; Bahrami, A.; Mohammadi, H.; Esmaeili, V. Root cause analysis of a failure in a flange-pipe welded joint in a steam line in an ammonia plant: Experimental investigation and simulation assessment. Eng. Fail. Anal. 2021, 129, 105730. [Google Scholar] [CrossRef]
- Demeneghi, G.; Rodgers, K.; Su, C.H.; Medders, W.M.; Gorti, S.; Wilkerson, R. Root cause analysis of premature simulated life cycle failure of friction stir welded aluminum 2219. Eng. Fail. Anal. 2022, 134, 106059. [Google Scholar] [CrossRef]
- Bonikila, P.R.; Indimath, S.S.; Shajan, N. Failure assessment of Mash Seam Weld breakage and development of online weld inspection system for early detection of weld failure. Eng. Fail. Anal. 2022, 133, 105967. [Google Scholar] [CrossRef]
- Datta, R.; Deva, A. An Investigation into the Failure of API 5L X-46 Grade ERW Linepipes. Pract. Fail. Anal. 2002, 2, 59–62. [Google Scholar] [CrossRef]
- Fazzini, P.G.; Belmonte, J.C.; Chapetti, M.D.; Otegui, J.L. Fatigue assessment of a double submerged arc welded gas pipeline. Int. J. Fatigue 2007, 29, 1115–1124. [Google Scholar] [CrossRef]
- Liu, Q.; Yu, H.Y.; Zhu, G.C.; Tong, K.; Wang, P.B.; Song, S.Y. Investigation of weld cracking of a BOG booster pipeline in an LNG receiving station. Eng. Fail. Anal. 2021, 122, 105247. [Google Scholar]
- Feng, Y.R. Analysis of hydrotest Breaks for a pipe. Press. Vessel Technol. 1998, 10, 42–48. [Google Scholar]
- Liu, K.X.; Feng, X.L.; Ma, K.; Wang, L.; Xie, X.W.; Lu, Z.M. Investigation on the welding-induced multiple failures in boiler water wall tube. Eng. Fail. Anal. 2021, 121, 104988. [Google Scholar] [CrossRef]
- Rajasekaran, R.; Lakshminarayanan, A.K.; Damodaram, R.; Balasubramanian, V. Stress corrosion cracking failure of friction stir welded nuclear grade austenitic stainless steel. Eng. Fail. Anal. 2021, 120, 105012. [Google Scholar] [CrossRef]
- Khattak, M.A.; Zaman, S.; Kazi, S.; Ahmed, H.; Habib, H.M.; Ali, H.M.; Tamin, M.N. Failure investigation of welded 430 stainless steel plates for conveyor belts. Eng. Fail. Anal. 2020, 116, 104754. [Google Scholar] [CrossRef]
- El-Sayed, M.H. Grooving corrosion of seam welded oil pipelines. Case Stud. Eng. Fail. Anal. 2014, 2, 84–90. [Google Scholar] [CrossRef][Green Version]
- Pan, J.H.; Fan, Z.C.; Zong, N.S. Research on weld cracking of TP321H stainless steel pipeline under elevated temperature. Int. J. Press. Vessel. Pip. 2016, 148, 1–8. [Google Scholar] [CrossRef]
- Suresh Kumar, T.; Nagesha, A.; Mariappan, K.; Dash, M.K. Deformation and failure behaviour of 316 LN austenitic stainless steel weld joint under thermomechanical low cycle fatigue in as-welded and thermally aged conditions. Int. J. Fatigue 2021, 149, 106269. [Google Scholar] [CrossRef]
- Lu, S.L.; Han, Y.; Qin, C.Y.; Yuan, P.B.; Zhao, X.W.; Luo, J.H. Crack and fitness-for-service assessment of ERW crude oil pipeline. Eng. Fail. Anal. 2006, 13, 565–571. [Google Scholar]
- Zhukov, D.; Konovalov, S.; Melnikov, A.; Chen, D.H. Evaluation of strength and microstructure of welded pipes with wall lamination. Eng. Fail. Anal. 2021, 122, 105235. [Google Scholar] [CrossRef]
- Song, S.P.; Dong, P.S.; Myung, H.K. Residual stresses in narrow-groove girth welds and applications for fitness-for-service assessment. Int. J. Press. Vessel. Pip. 2020, 188, 104238. [Google Scholar] [CrossRef]
- Panin, S.V.; Vlasov, I.V.; Maruschak, P.O.; Eremin, A.V.; Berto, F.; Syromyatnikova, A.S.; Vinogradov, A. Influence of long-term cold climate operation on structure, fatigue durability and impact toughness of 09Mn2Si pipe steel. Eng. Fail. Anal. 2019, 102, 87–101. [Google Scholar] [CrossRef]
- Nykyforchyn, H.; Tsyrulnyk, O.; Zvirko, O.; Krechkovska, H. Non-destructive evaluation of brittle fracture resistance of operated gas pipeline steel using electrochemical fracture surface analysis. Eng. Fail. Anal. 2019, 104, 617–625. [Google Scholar] [CrossRef]
- Lu, Y.J.; Wang, C.H. Effects of geometry of a local thin area defect on remaining strength and fitness of pressure equipment. J. Loss Prev. Process Ind. 2020, 65, 104125. [Google Scholar] [CrossRef]
- Sehgal, R.; Tiwari, A.; Sood, V. A study on fitness-for-service assessment for crack-like defects and corrosion in nuclear reactor pressure tubes. Reliab. Eng. Syst. Saf. 2005, 89, 227–235. [Google Scholar] [CrossRef]
- Dogan, B. Fitness for service of welded components under creep and creep-fatigue loading. Int. J. Press. Vessel. Pip. 2010, 87, 656–663. [Google Scholar] [CrossRef]
Publisher’s Note: MDPI stays neutral with regard to jurisdictional claims in published maps and institutional affiliations. |
© 2022 by the authors. Licensee MDPI, Basel, Switzerland. This article is an open access article distributed under the terms and conditions of the Creative Commons Attribution (CC BY) license (https://creativecommons.org/licenses/by/4.0/).