Abstract
Transition metal oxides have a high initial charge-discharge capacity of 800–1000 mAh/g, the electrochemical performance, cyclic performance and rate performance of the composite of transition metal oxide and graphene have been improved due to the unique two-dimensional structure and excellent electrical conductivity of graphene. In this paper, iron oxides materials with different morphs were prepared by different hydrothermal reaction temperatures, and rGO/Fe2O3-175 °C composites with different graphene ratios were synthesized and used in the anode of lithium ion batteries. The results show that nanorod-shaped Fe2O3 had better electrochemical performance than spherical Fe2O3. 0.2rGO/Fe2O3-175 °C had the best cyclic performance, the first cyclic discharge capacity reaches 1372 mAh/g under the current density of 100 mA/g, and the cyclic reversible capacity remained at about 435 mAh/g after 50 cycles, illustrating that nanorods Fe2O3 and graphene composites can greatly buffer the volume expansion of Fe2O3.
1. Introduction
Transition metal oxides have high cyclic stability and theoretical specific capacity, and their initial charge-discharge capacity is 800–1000 mAh/g, approximately 2–3 times higher than that of carbon materials [1,2,3,4]. Compared with other transition metal oxides, iron oxides have the advantages of low raw material price, easy preparation, stable chemical properties and high theoretical specific capacity. Therefore, iron oxides as anode materials for lithium ion batteries have high research value. However, iron oxides have the problems of volume change and poor conductivity in the charging and discharging process, which leads to poor cycling performance and seriously hinders its engineering application [5,6,7,8,9]. The advantages of combining transition metal oxides and carbon materials are a more stable structure and an excellent electron transport channel between the current collector and the active substance, which is helpful for the avoidance of SEI film formation [10,11,12]. The carbon-coated α-Fe2O3 nano-structure on stainless steel substrates prepared through simple pyrolytic deposition of ferrocene is used as anode materials for lithium ion batteries, this anode material can still possess a high reversible capacity of 1138 mAh/g after 300 cycles at a current density of 500 mA/g, and it can also sustain a capacity of 458.8 mAh/g after the cycle even at a high current density of 10,000 mA/g [13].
Due to the high theoretical specific surface area, unique two-dimensional structure, excellent thermal and electrical conductivity of graphene, the electrochemical performance, cyclic performance and rate performance of the composite of transition metal oxide and graphene have been improved [14,15,16,17]. Yang et al. [18] described a method for the fabrication of graphene-encapsulated metal oxides (GE-MO) through co-assembly between GO (Graphene Oxide) with a negative charge and oxide nanoparticles with a positive charge. The synthetic process is driven by the electrostatic interaction of the two substances, resulting in GE-MO by chemical reduction. The results indicated that GO-Co3O4 showed a high reversible capacity of 1100 mAh/g in the first 10 cycles, and the reversible capacity still reached 1000 mAh/g after 130 cycles, showing excellent cycling performance. Therefore, it has great potential as an anode material for lithium storage. Lian et al. [19] developed a gas-liquid interface synthesis method to prepare nano-SnO2/graphene composites, SnO2 nanoparticles about 2–6 nm in size were uniformly distributed on the graphene matrix, they showed a high reversible specific capacity of 1304 mAh/g at 100 mA/g current density, and it still had a reversible capacity of 748 mAh/g even when the current density was increased to 1000 mA/g. The nano TiO2/nitrogen doped graphene composites were synthesized by Cai et al. [20] through a gas/liquid interface reaction, and nitrogen atoms were successfully doped into graphene tablets, TiO2 nanoparticles 8–13 nm in size were uniformly deposited on nitrogen doped graphene sheets. Compared with TiO2/graphene composites and exposed TiO2 nanoparticles, the nano TiO2/nitrogen-doped graphene composites have better electrochemical properties, and still show a high capacity of 136 mAh/g at a current density of 1000 mA/g after 80 cycles.
Iron oxides were used to improve electrochemical performance by combining with graphene in a great deal of research. Zhou et al. [15] prepared Fe2O3/graphene nano-sheets by a simple and effective spray drying method, it sustained a capacity of 711 mAh/g after 50 times of charge and discharge, indicating improved cycle stability and rate performance. Fe2O3/graphene nanocomposites were also synthesized by Kan et al. [21] through the solvent hydrothermal method. In their study, Fe2O3 is grown on graphene and dispersed evenly to form a unique nano-sheet structure. Fe2O3/graphene obtained a high reversible capacity of 662.4 mAh/g after 100 cycles at 1000 mA/g. The significantly improved cycling performance is attributed to the unique structural affinity between Fe2O3 nano-sheets and graphene nano-sheets. Meng et al. [22] found that a-Fe2O3@graphene aerogel (a-Fe2O3@GA) composites used as anode materials for lithium ion batteries maintained a high reversible capacity of 745 mAh/g at a current density of 100 mA/g, and exhibited superior stable electrochemical cycling performance and excellent rate capability. In the above studies, the morphology of iron oxide is mainly spherical, there are few related studies on other morphology of iron oxide and graphene composites.
In this paper, nano-Fe2O3 was prepared at 220 °C, 205 °C, 190 °C and 175 °C, respectively. Fe2O3/graphene composites were synthesized by the PVP solvent assisted hydrothermal method. The phase composition and morphology were investigated by X-ray diffraction (XRD, Bruker-D8, Karlsruhe, Germany) and scanning electron microscopy (SEM, SSX-550, Shimadzu Corporation, Kyoto, Japan), and electrochemical properties were tested by constant current charge-discharge, cyclic voltammetry and AC impedance.
2. Experimental
2.1. Anode Material Preparation
The reagents in the paper were purchased from Sinopharm Chemical Reagent Co., Ltd. (Shenyang, China), which were of analytical grade (AR).
Preparation of nano ferric oxide: Firstly, 16 g FeCl3·6H2O was dissolved in 300 mL deionized water. During the stirring process, sodium hydroxide solution was dropped at the same time until the pH of the solution reached 10. Then, the solution was loaded into a high-pressure reactor (Sinopharm Chemical Reagent Co., Ltd., Shenyang, China) and reacted at different hydrothermal temperatures (220 °C, 205 °C, 190 °C, 175 °C) for 12 h. After cooling and centrifuge separation, the final product Fe2O3 was obtained by drying at 60 °C for 12 h and calcination at 300 °C for 3 h.
Preparation of GO (modified Hummers method): the appropriate amount of graphite and potassium permanganate was mixed evenly, and slowly added into the mixture of H2SO4 and H3PO4. After stirring at 50 °C for 12 h, the gray-green solution was poured into ice cubes for cooling, then H2O2 was slowly added, the solution turned bright yellow and stirred for 30 min, and graphite oxide was obtained after washing and drying.
Preparation of reduced graphene/iron oxide composite (rGO/Fe2O3): Appropriate amount of GO was dispersed in deionized water by ultrasound for 1 h to obtain GO dispersed suspension. A certain mass of Fe2O3 and 0.45 g polyvinylpyrrolidone (PVP) were, respectively, dissolved in GO dispersion (where the mass ratio of Fe2O3 to GO was 1:0, 1:0.1, 1:0.2, 1:0.3, 1:0.4, 1:0.5). After 30 min ultrasound, the samples were transferred to the high-pressure reactor, followed by hydrothermal reaction at 175 °C for 12 h, centrifugation and drying for 12 h, and Ar calcination at 300 °C for 3 h to obtain different ratios of rGO/Fe2O3.
2.2. Preparation of Electrode Sheet
According to the active substance: acetylene black: PVDF(polyvinylidene fluoride) = 8:1:1 mass ratio to weight, first of all, the binder PVDF and n-methyl-2-pyrrolidone organic solvent was mixed and stirred, and then mixed with other substances into a uniform slurry. Then the paste was evenly coated on copper foil and put into a vacuum drying oven (BZF-50, Shanghai Boxun Industrial Co., Shanghai, China) to dry. Finally, the sheet was washed and pressed to obtain the electrode sheet.
2.3. Assembly of Lithium Ion Button Battery
The electrode sheet was placed in a glove box filled with argon to assemble the CR2032 button battery. The mixture of 1 mol·L−1 LiPF6/ethylene carbonate (EC) + dimethyl carbonate (DMC) (volume ratio: 1:1) was used as the electrolyte, and the electrode was assembled in the sequence of negative shell → spring sheet → lithium sheet gasket → diaphragm → electrode sheet → positive shell. The assembled semi-battery was sealed in time, and the open-circuit voltage was detected to determine whether it was normal. The electrochemical performance was tested after standing for 12 h.
The lithium sheet, copper foil, gasket and spring sheet involved in the battery preparation process were purchased from Shanghai Shunyou Metal Materials Co., Ltd. (Shanghai, China), and the polypropylene microporous film was produced from Celgard in America.
2.4. Physical Properties Characterization of Material
The X-ray diffraction analysis was performed by the Bruker-D8 instrument from Bruker in Germany. The instrument uses Cu Kα as the ray source. The operating voltage was 40 kV, and the scanning speed was set at 6°/min with a scanning range of 10° to 90°.
2.5. Electrochemical Performance Test of Materials
In this paper, the constant-current charge-discharge instrument was the Xinwei battery test system (Shenzhen New Well Electronics Co., Ltd, Shenzhen, China). The charge-discharge specific capacity and cycle performance of the electrode under different current densities were studied. The charge-discharge program adopted the steps of static (15 min) → constant current discharge → static (15 min) → constant current charge → constant voltage charge. The test voltage was 0.01–3 V. The charge-discharge current value was calculated from the theoretical capacity and the mass of the active substance. The energy density, coulomb efficiency and cycle life of the electrode material could be calculated, then the stability of energy density and capacity of electrode materials in the charge and discharge processes could be judged.
The CHI660D electrochemical workstation of Shanghai Chenhua Company (Shanghai, China) was used for the cyclic voltammetry test. The scanning rate is 0.1 mV/s, and the voltage scanning range was 0.01–3.0 V.
The AC impedance test was carried out by the CHI660D electrochemical workstation. The scanning amplitude was 5 mV and the frequency range was 100 Khz–0.1 Hz.
3. Results and Discussion
3.1. The Microstructure
SEM images of Fe2O3 prepared by different hydrothermal temperatures are shown in Figure 1. When the temperature is 220 °C, Fe2O3 particles within 200–500 nm are spherical and evenly distributed. When the temperature drops to 205 °C, Fe2O3 particles show different morphology mainly composed of spherical and nanorod morphology. Among them, the size of spherical particles gradually decreases, and nanorod structure appears. When the temperature decreases further to 190 °C, Fe2O3 particles are mostly nanorod and neatly arranges along a certain direction, and are doped with a small number of spherical particles. The size of the rod is about 100 nm calculated according to the narrowest direction. When the temperature is 175 °C, the spherical particles disappear, and the size nanorod structure is reduced to about 50 nm, which has a phenomenon of micro-agglomeration. Due to the difference in hydrothermal temperature, the growth degree of grain is different. When the temperature is low, it cannot provide enough energy to grow around the nucleation and growth processes, so the crystal can only grow in the direction of the lowest energy and form a rod structure rather than a spherical structure.
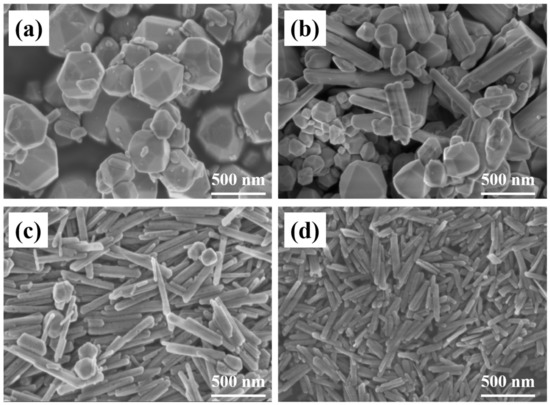
Figure 1.
SEM images of Fe2O3 prepared at (a) 220 °C; (b) 205 °C; (c) 190 °C; (d) 175 °C.
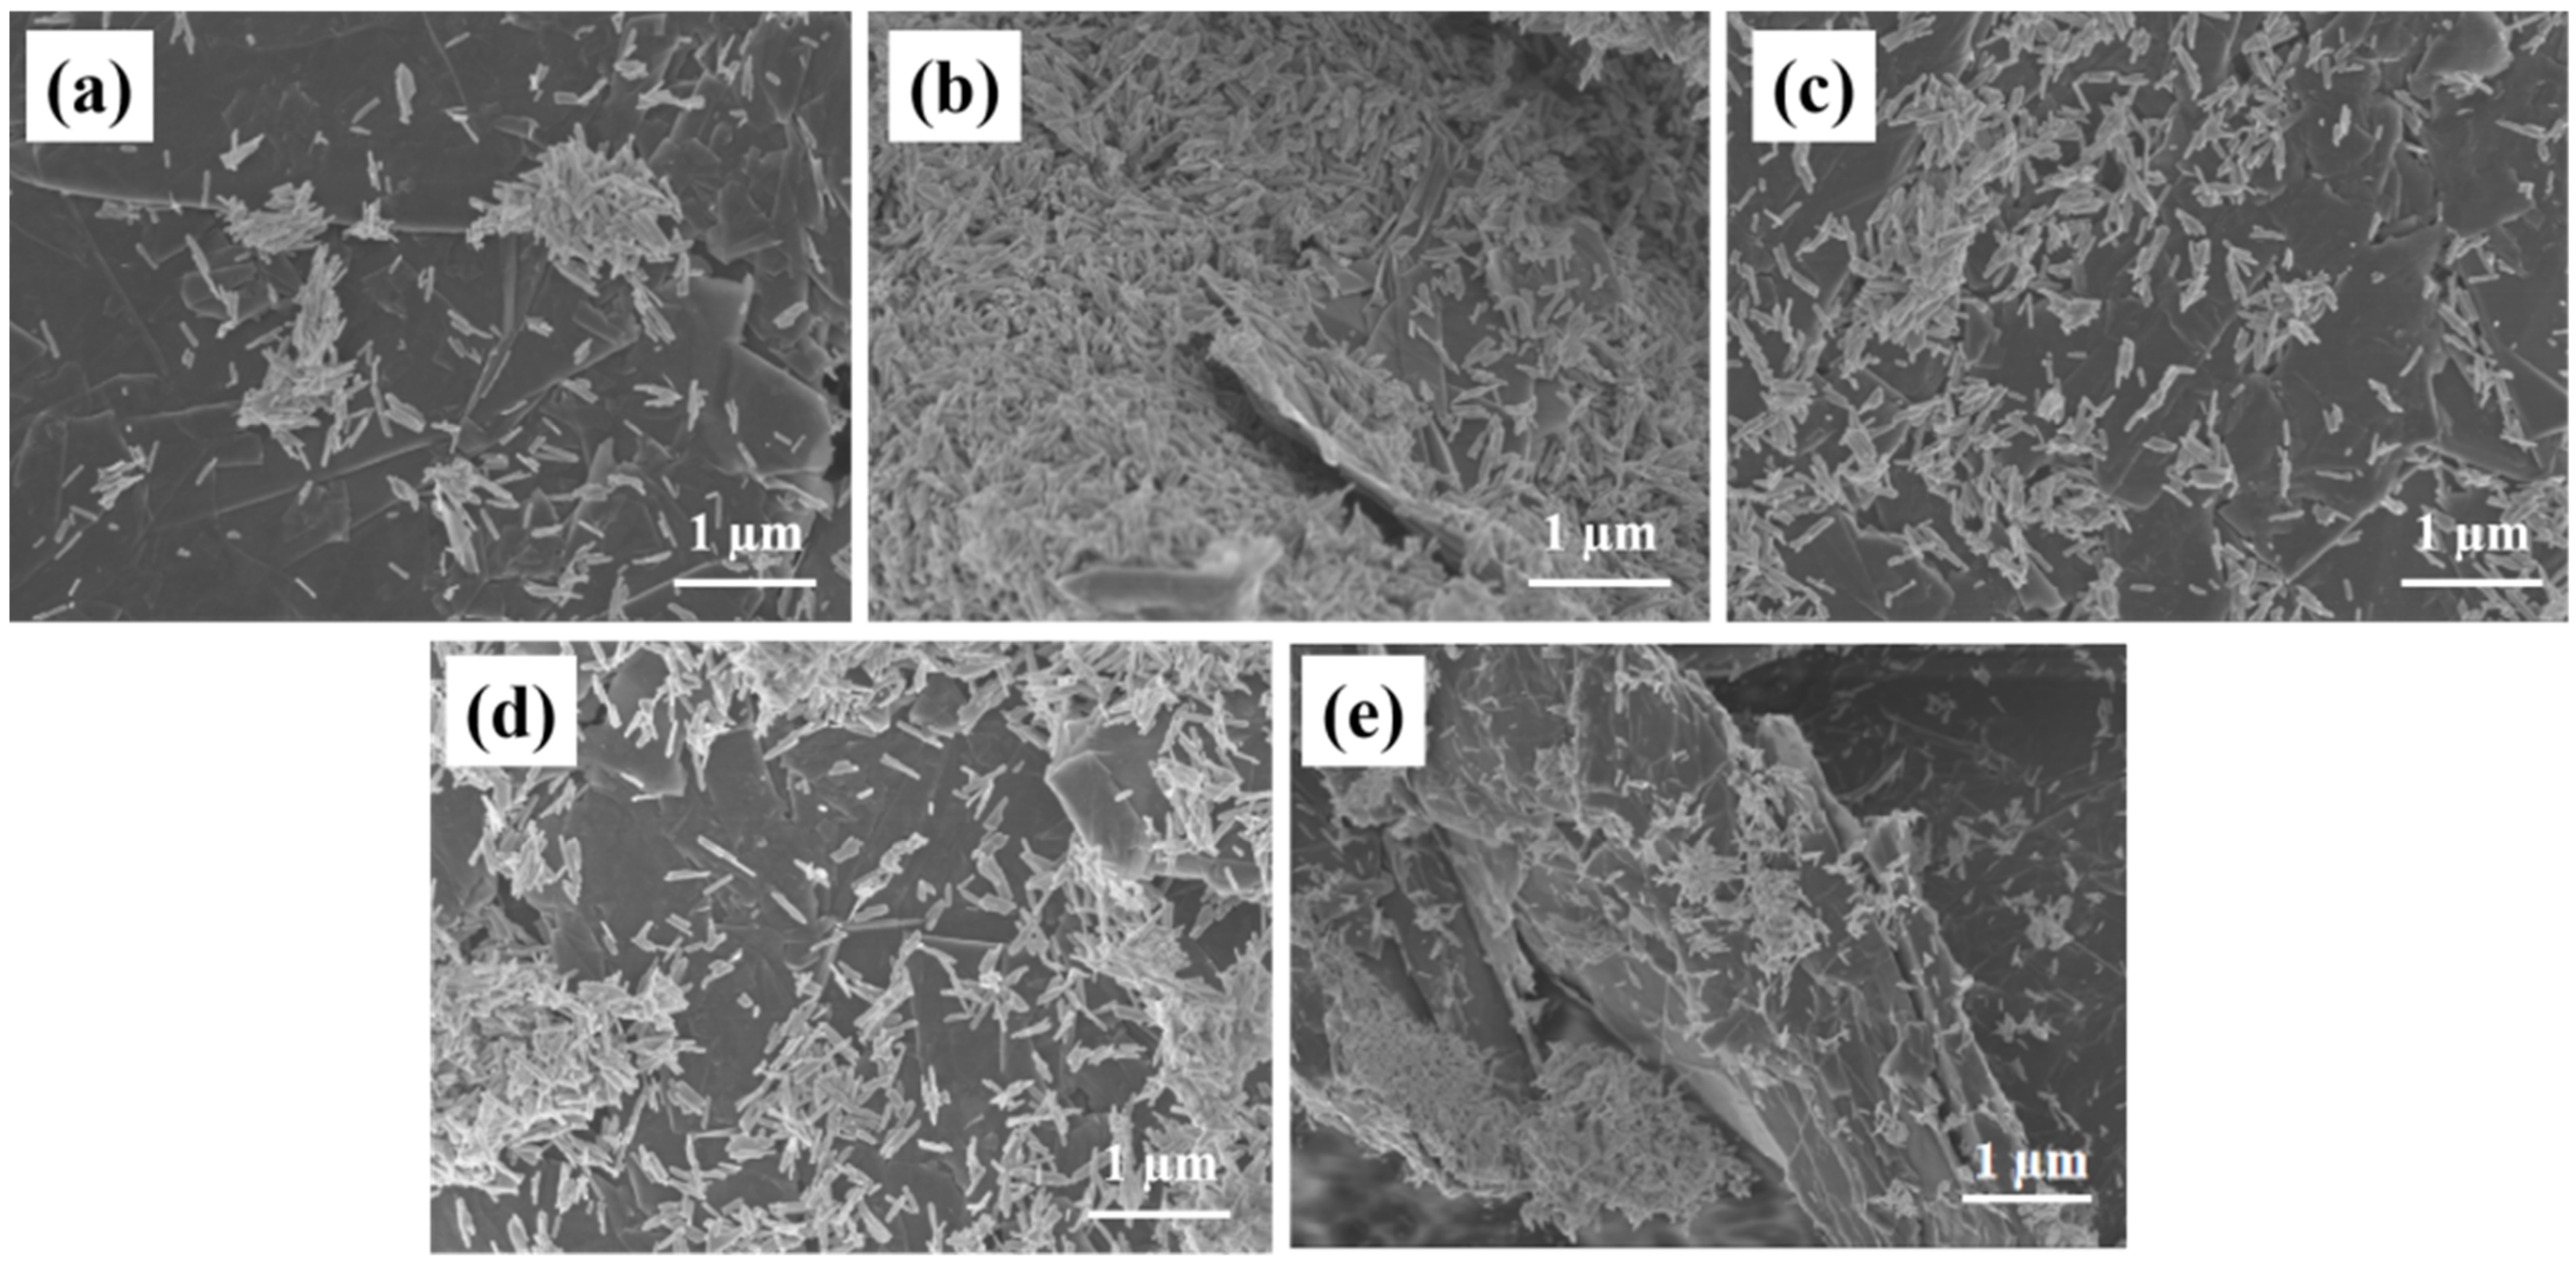
Figure 2 is the SEM diagrams of rGO/Fe2O3-175 °C with different ratios of graphene, the nanorod morphology of Fe2O3 in rGo/Fe2O3-175 °C does not change significantly. From Figure 2a of 0.1rGo/Fe2O3-175 °C, Fe2O3 is slightly agglomerated on the graphene sheet, which is not conducive to buffer the volume expansion caused by Li+ embedding and dislodging of lithium-ion batteries during the charging and discharging process. In 0.2rGo/Fe2O3-175 °C, Fe2O3 is evenly dispersed on the surface of graphene and the size of the nanorod is reduced. It can also be seen that graphene is in small blocks and papery folds can be found. This structure can increase the specific surface area, provide more active sites and lithium storage space. However, when the ratio of graphene continues to increase, the graphene in SEM is in large chunks, and the stacking of graphene becomes more serious with the increase of graphene content [23]. It is due to the gradual thickening of graphene with the increase of GO content, that the tendency for agglomeration is enhanced, which is not beneficial for the uniform distribution of Fe2O3 particles, resulting in the reduction of specific surface area and the loss of lithium storage space. Therefore, 0.2rGo/Fe2O3-175 °C has a better structure in theory.

Figure 2.
SEM images of rGO/Fe2O3-175 °C with different graphene ratios (a) 0.1; (b) 0.2; (c) 0.3; (d) 0.4; (e) 0.5.
3.2. XRD
Figure 3 shows the XRD patterns of Fe2O3 prepared by different hydrothermal temperatures. The sharp diffraction peak belongs to α-Fe2O3 (JCPDS# 89-0596) with excellent crystallinity. It can be seen that the half peak width of nanorod-shaped Fe2O3 is wider than that of spherical Fe2O3. Combined with the Scherrer formula, the grain size of nanorod-shaped Fe2O3 is smaller than that of spherical Fe2O3. It is because the energy provided for crystal growth is less with the lower temperature, leading to the reduction of the grain size of Fe2O3.
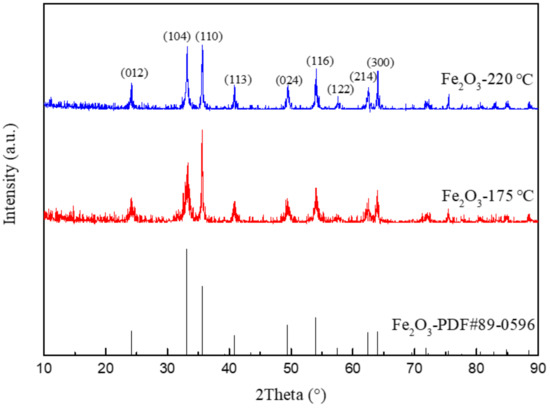
Figure 3.
XRD patterns of Fe2O3 prepared at 220 °C and 175 °C.
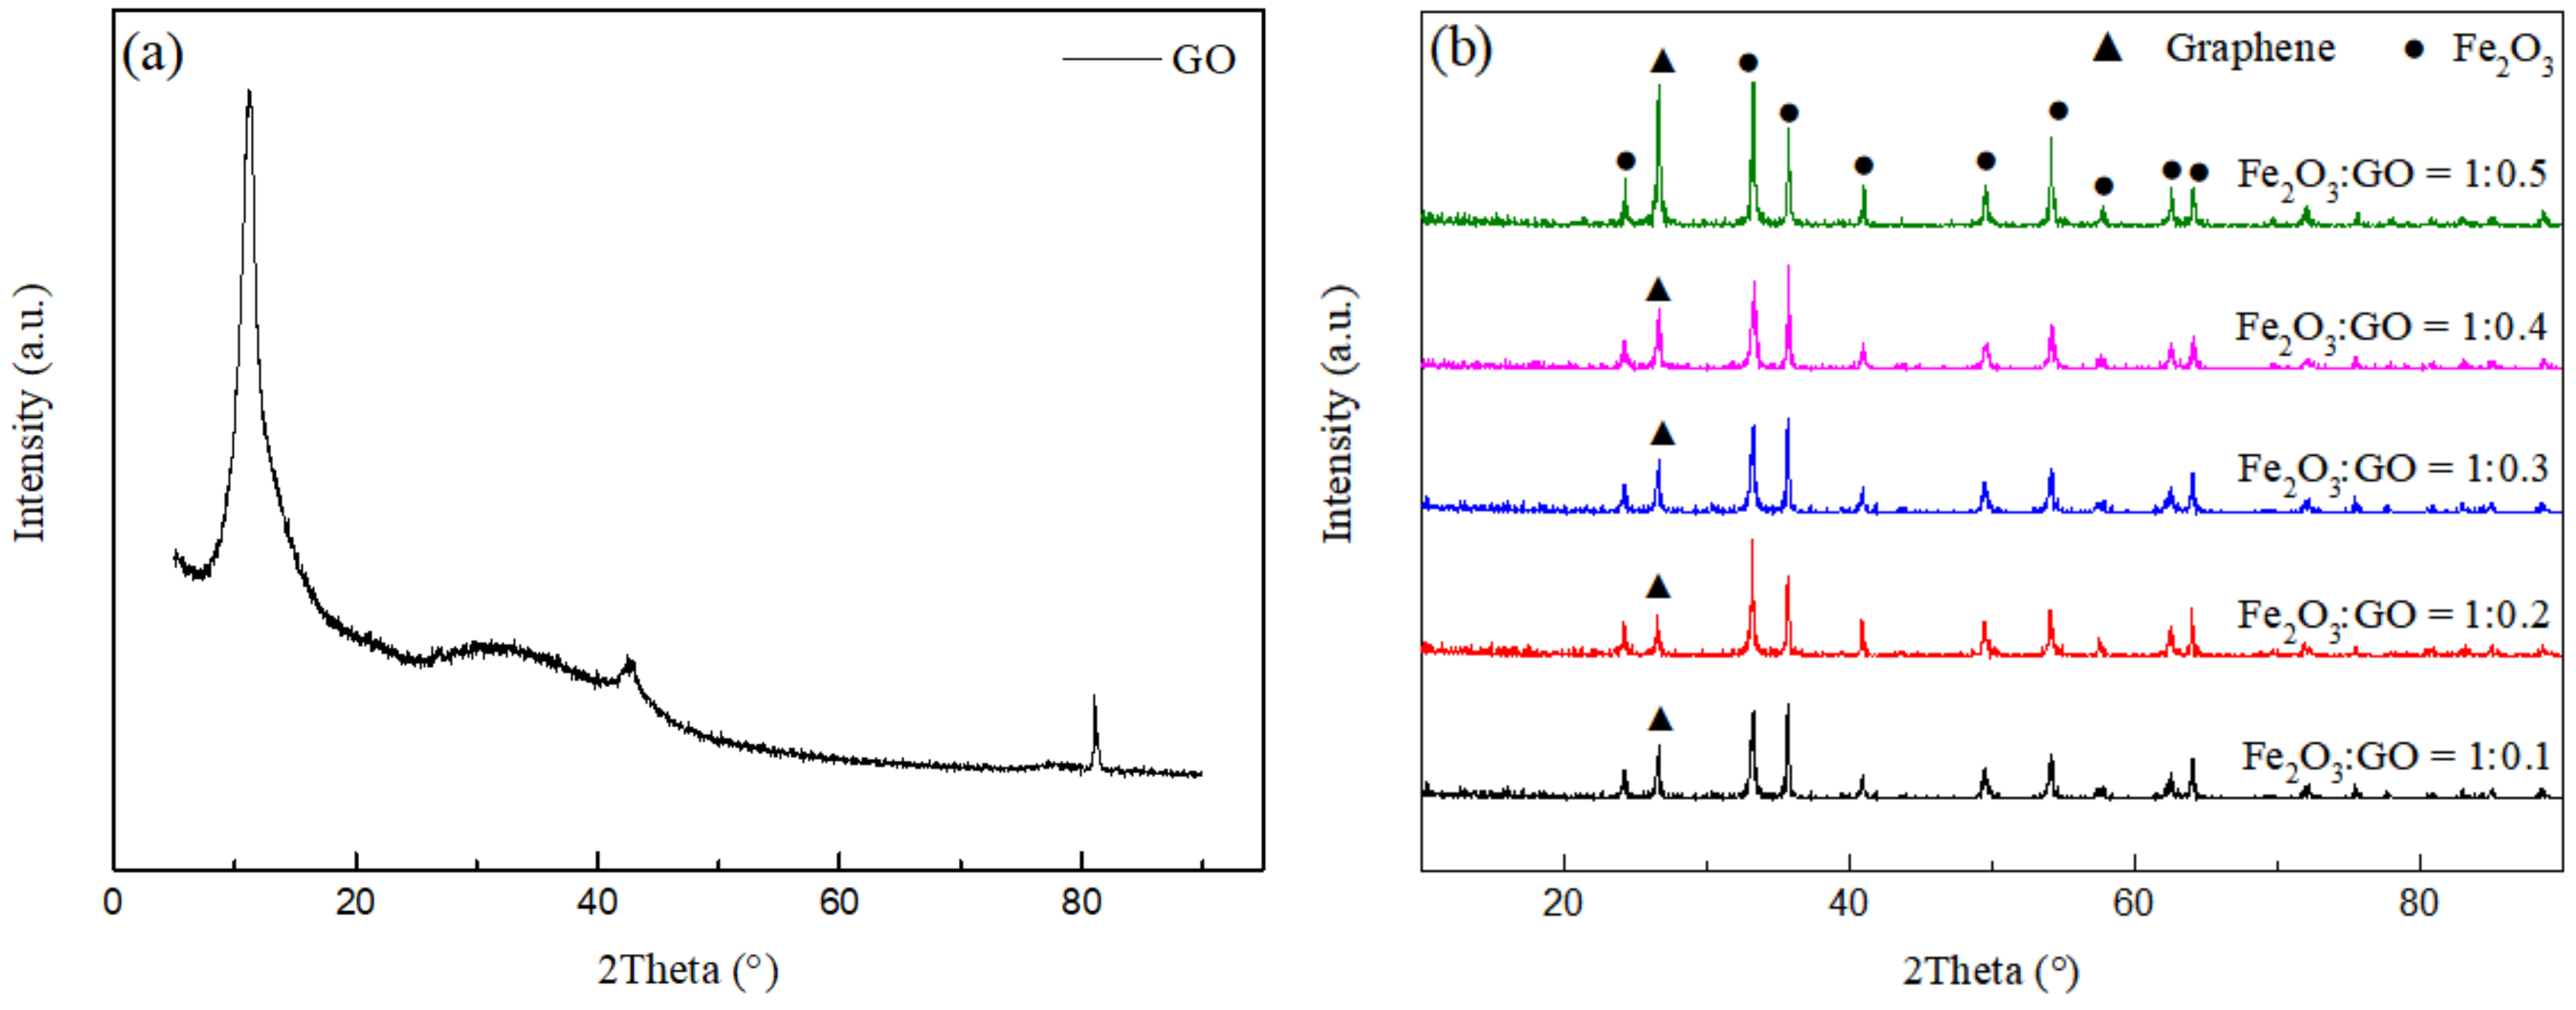
Figure 4a shows the XRD pattern of GO. The diffraction peak at 10.3° is assigned to the (100) crystal plane of GO, which is the interlamellar peak of GO [24]. Figure 4b shows the XRD patterns of rGO/Fe2O3-175 °C with different graphene ratios. It can be seen that the phase of the sample is composed of α-Fe2O3 and graphene. The characteristic peak of GO disappears completely at 10.3°, stating that the graphite oxide in the sample has been reduced, while the diffraction peak at 26.4° is attributed to the (002) crystal plane of graphite (JCPDS 08-0415), expressing that graphene has been successfully introduced into the composite sample without changing the phase structure of α-Fe2O3 [25]. In addition, with the increase of graphene content, the corresponding peak intensity increases.

Figure 4.
XRD patterns of (a) GO and (b) rGO/Fe2O3-175 °C with different graphene ratios.
3.3. Electrochemical Performance
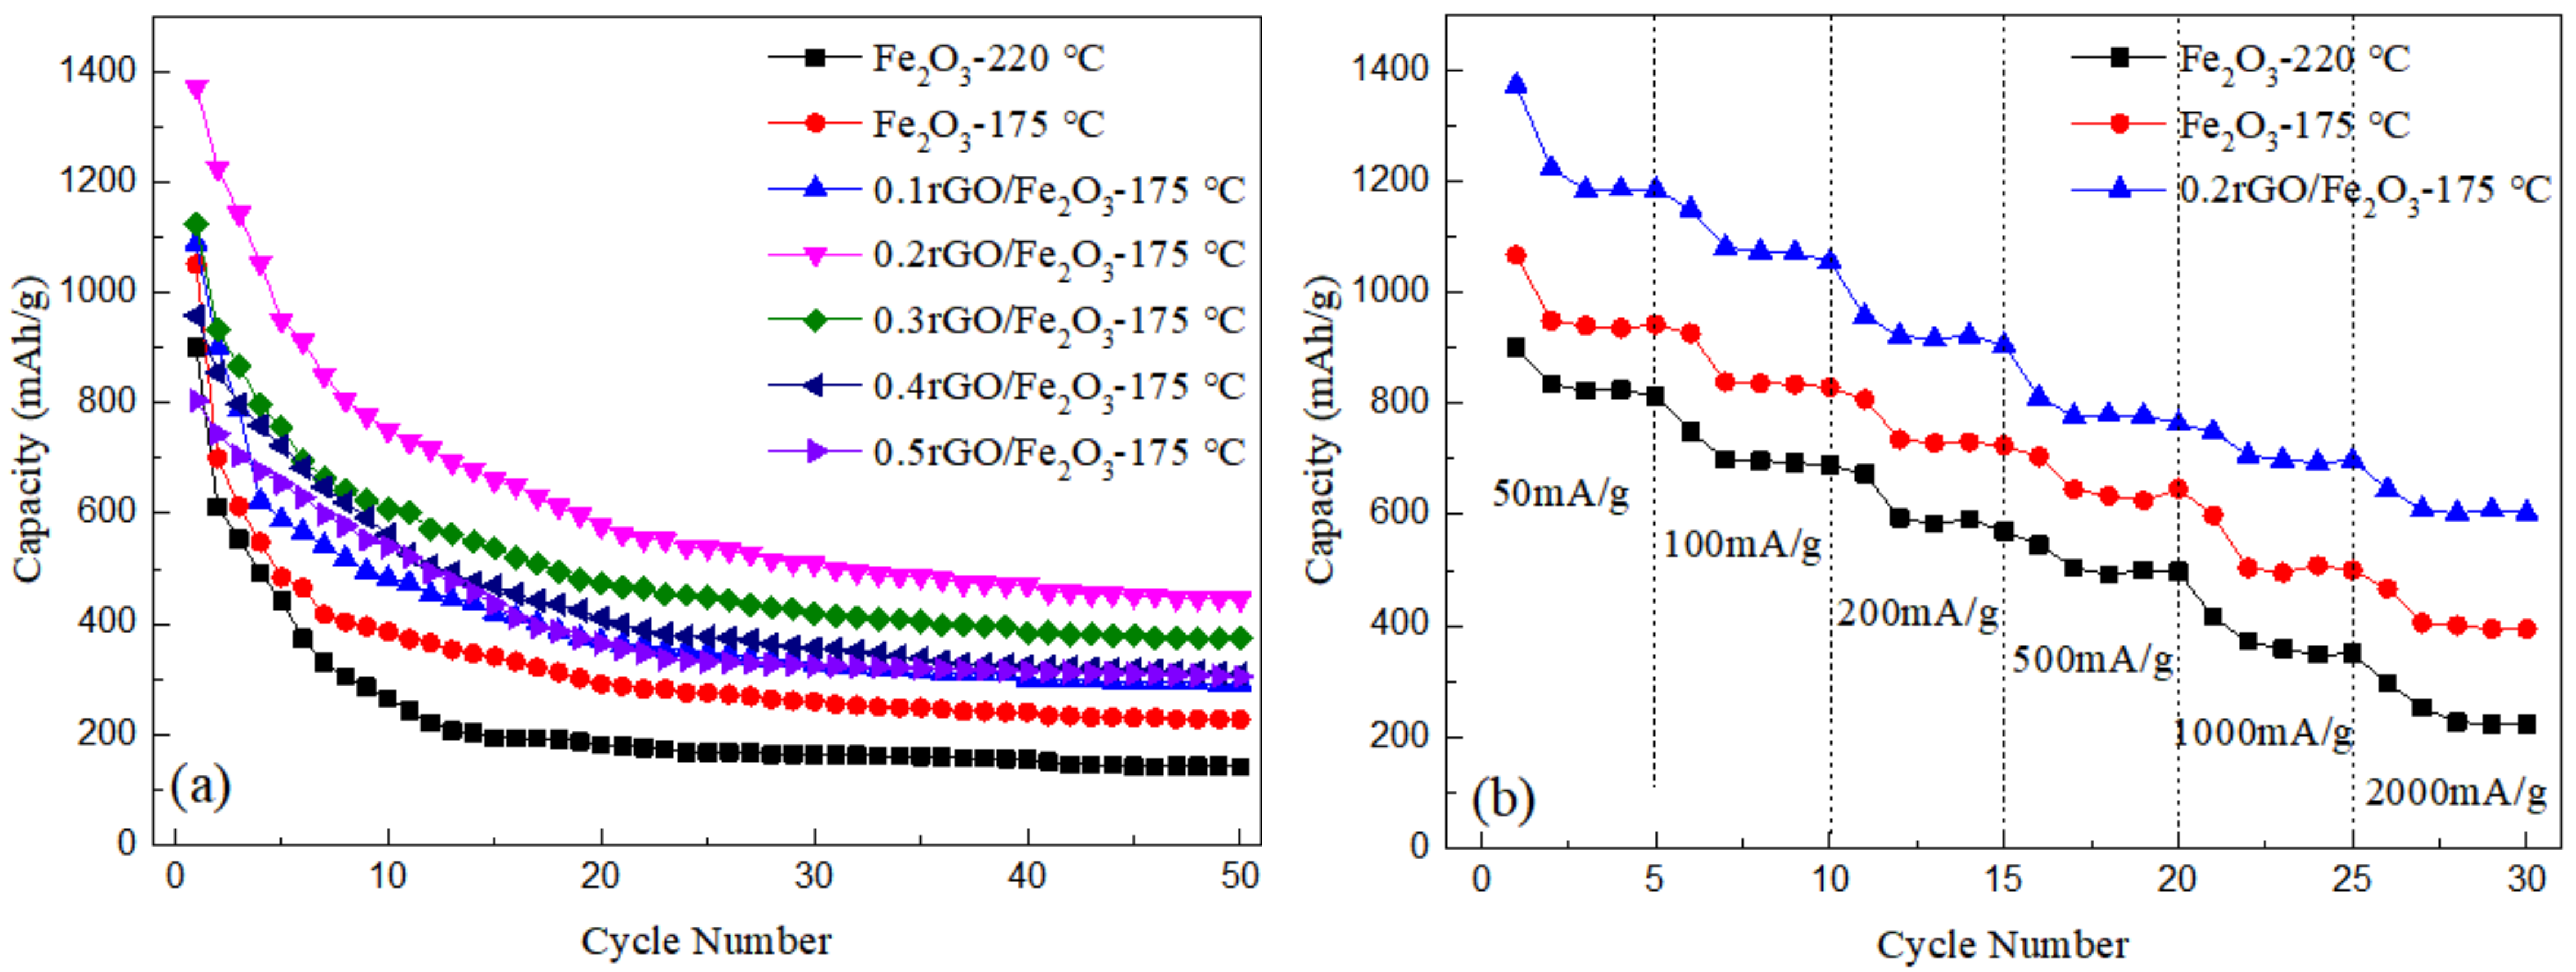
As can be seen from Figure 5a, at the current density of 100 mA/g, the capacity of nanorod Fe2O3-175 °C for the first cycle is 1050 mAh/g, which remains stable at about 300 mAh/g after 20 cycles. Compared with spherical Fe2O3, the reversible capacity of nanorods Fe2O3 is higher in the first cycle and closer to the theoretical capacity. In addition, the capacity of nanorods Fe2O3 is higher after 50 cycles, in other words, it exhibits better cyclic stability. It can be concluded that the capacity decay rate of spherical Fe2O3-220 °C prepared at 220 °C is faster than that of nanorod Fe2O3-175 °C. Combined with XRD and SEM analysis, it may be due to the larger particle size of spherical Fe2O3-220 °C, with its own volume effect gradually causing the pulverization to fall off in the cycle process.
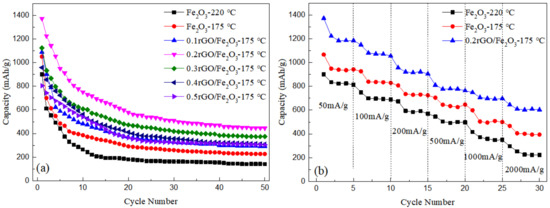
Figure 5.
(a) Constant current discharge curves of Fe2O3 and rGO/Fe2O3-175 °C with different graphene ratios at a current density of 100 mA·g−1; (b) Rate performance of Fe2O3-220 °C, Fe2O3-175 °C and 0.2rGO/Fe2O3-175 °C at different current densities.
Compared with Fe2O3 in Figure 5a, it can be seen that the decay rate of rGO/Fe2O3-175 °C is slower than that of pure Fe2O3. The cycle properties of composite material are significantly improved, which is mainly due to the recombination with graphene. The existence of graphene can effectively alleviate the stress concentration caused by the volume effect of ferric oxide in the repeated charge and discharge process, and suppress the powder shedding of electrode material, to improve the cycle stability. Moreover, the cyclic capacity of 0.2rGO/Fe2O3-175 °C reaches 1372 mAh/g at the current density of 100 mA/g, and the cyclic decay rate is the slowest, the cyclic capacity remains at about 435 mAh/g after 50 cycles. Through SEM analysis, Fe2O3 is evenly distributed on the surface of graphene, and there is no stacking and agglomeration of graphene so that the high flexibility of graphene can effectively buffer the volume expansion of Fe2O3 nanoparticles during the cycle. With the increase of graphene content, it is easy to cause the stacking of graphene sheets and reduce the specific surface area; the loss of lithium storage space of electrode materials leads to a decrease in cycle performance.
In order to further study the rate performance of the samples, the cycling performance under different current densities is tested, as shown in Figure 5b. The discharge specific capacity of 0.2rGO/Fe2O3-175 °C is the highest, followed by Fe2O3-175 °C, and Fe2O3-220 °C is the lowest, which is consistent with the cyclic curve in Figure 5a. When the current density is 200 mA/g, 500 mA/g and 1000 mA/g, the discharge specific capacity of 0.2rGO/Fe2O3-175 °C is kept at 905 mAh/g, 763 mAh/g and 697 mAh/g, respectively, indicating that 0.2rGO/Fe2O3-175 °C had excellent rate performance.
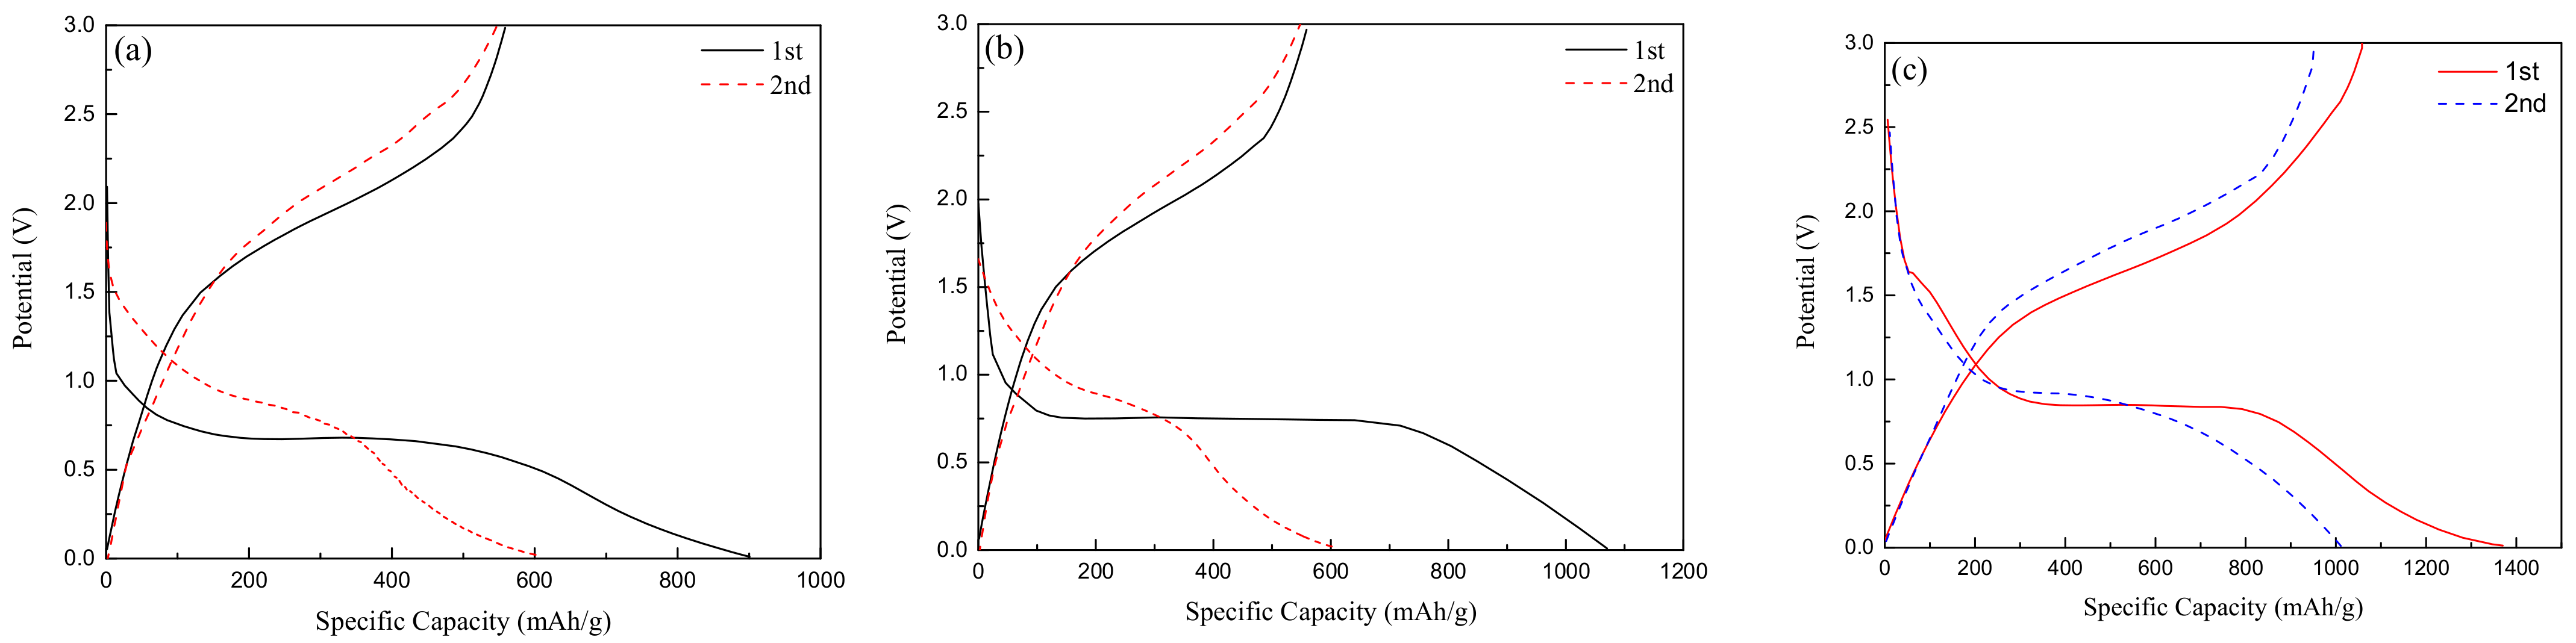
Figure 6a,b, respectively, show the charge-discharge curves of spherical Fe2O3-220 °C and nanorod-like Fe2O3-175 °C at the current density of 100 mA/g. In the first discharge process, there is a flat discharge platform at about 0.7 V, while in the first charge curve, there is a slow platform at 1.5–2 V. The irreversible specific capacity in the first cycle is mainly due to the formation of solid electrolyte SEI film. In comparison, the first specific capacity of about 1060 mAh/g of nanorod-shaped Fe2O3 is larger, indicating that the small size of the nanorod-shaped structure can increase the electrochemical reaction area and improve the electrochemical capacity. Figure 6c shows the charge-discharge curve of 0.2rGO/Fe2O3-175 °C. Different from Fe2O3, two voltage platforms appear at the discharge curve in the first cycle, and one short platform and one long platform are, respectively, located around 1.6 V and 0.75 V, which is mainly related to lithium ions embedded in the Fe2O3 anode and the solid electrolyte phase interface (SEI film) formed by the electrolyte decomposition. In addition, the specific capacity of 0.2rGO/Fe2O3-175 °C for the first cycle reaches 1380 mAh/g, and the changing trend of the second cycle curve is more moderate than that of Fe2O3, indicating that the addition of an appropriate amount of graphene is beneficial to improving the capacity and cycle performance.
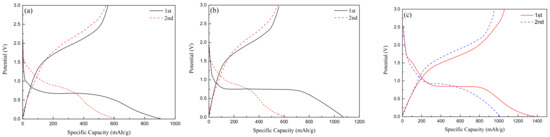
Figure 6.
Charge-discharge curves of (a) Fe2O3-175 °C; (b) Fe2O3-220 °C; (c) 0.2rGO/Fe2O3-175 °C.
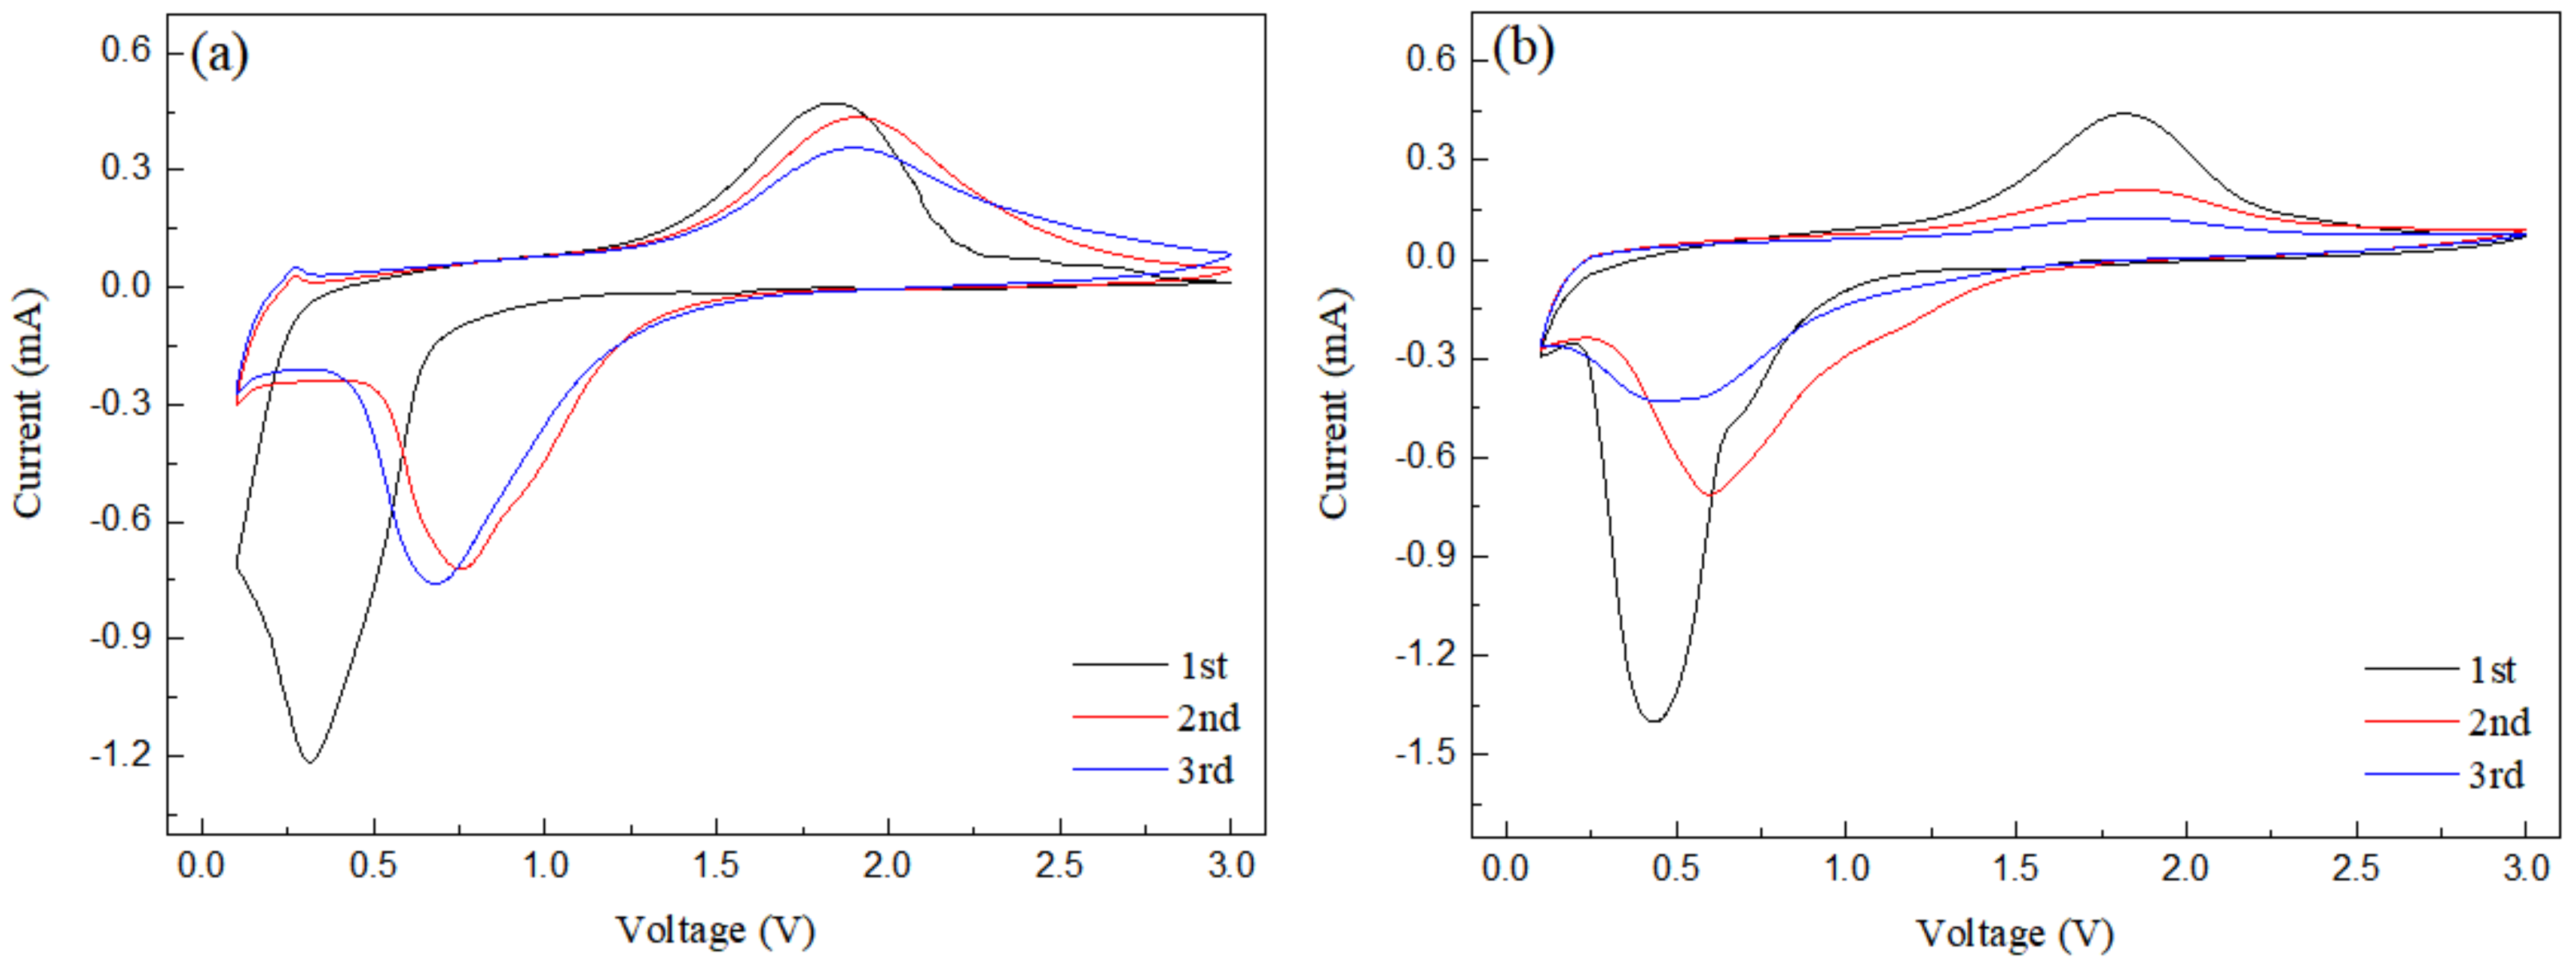
The cyclic voltammetry curve of nanorod-shaped Fe2O3-175 °C is shown in Figure 7a. It can be seen that in the first discharge process, the obvious cathode peak at 0.3 V corresponds to the reduction of Fe3+ to Fe0. In the first charging process, the anode peak is about 1.7 V, corresponding to the oxidation of Fe0 into Fe3+. Additionally, in the second cycle, the cathode peak moved to 0.9 V and the peak area decreased greatly, which was due to the electrolyte decomposition to form an SEI film, resulting in capacity loss [15,16,17,18,19,20]. In addition, the second and third cyclic voltammetry curves are relatively stable and show good reversibility. Figure 7b is the voltammetry curve of 0.2rGO/Fe2O3-175 °C, which belongs to the typical voltammetry curve of metal oxide anode materials. During the first discharge process, an obvious cathode peak appears at 0.43 V, corresponding to the reaction of Li+ + Fe2O3 → LixFe2O3 → Fe0 + Li2O, accompanied by the decomposition of the electrolyte and the formation of an SEI film. In the first charging process, a wide anode peak appears at 1.81 V, corresponding to Fe0→Fe3+ with electrons being released [21,22]. Compared with the first discharge process, the cathode in the second discharge process moves to 0.6 V, and the peak area is also weakened. Compared with nanorod Fe2O3, due to the addition of graphene, the strength of the anode peak in the curve of the 0.2rGO/Fe2O3-175 °C composite changes greatly, and the displacement of the cathode peak in the third cycle curve is more obvious, and the cathode peak strength is weakened.
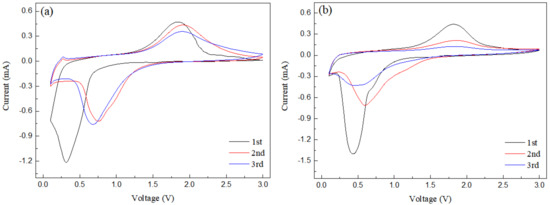
Figure 7.
Cyclic voltammetry curves of (a) Fe2O3-175 °C; (b) 0.2rGO/Fe2O3-175 °C.
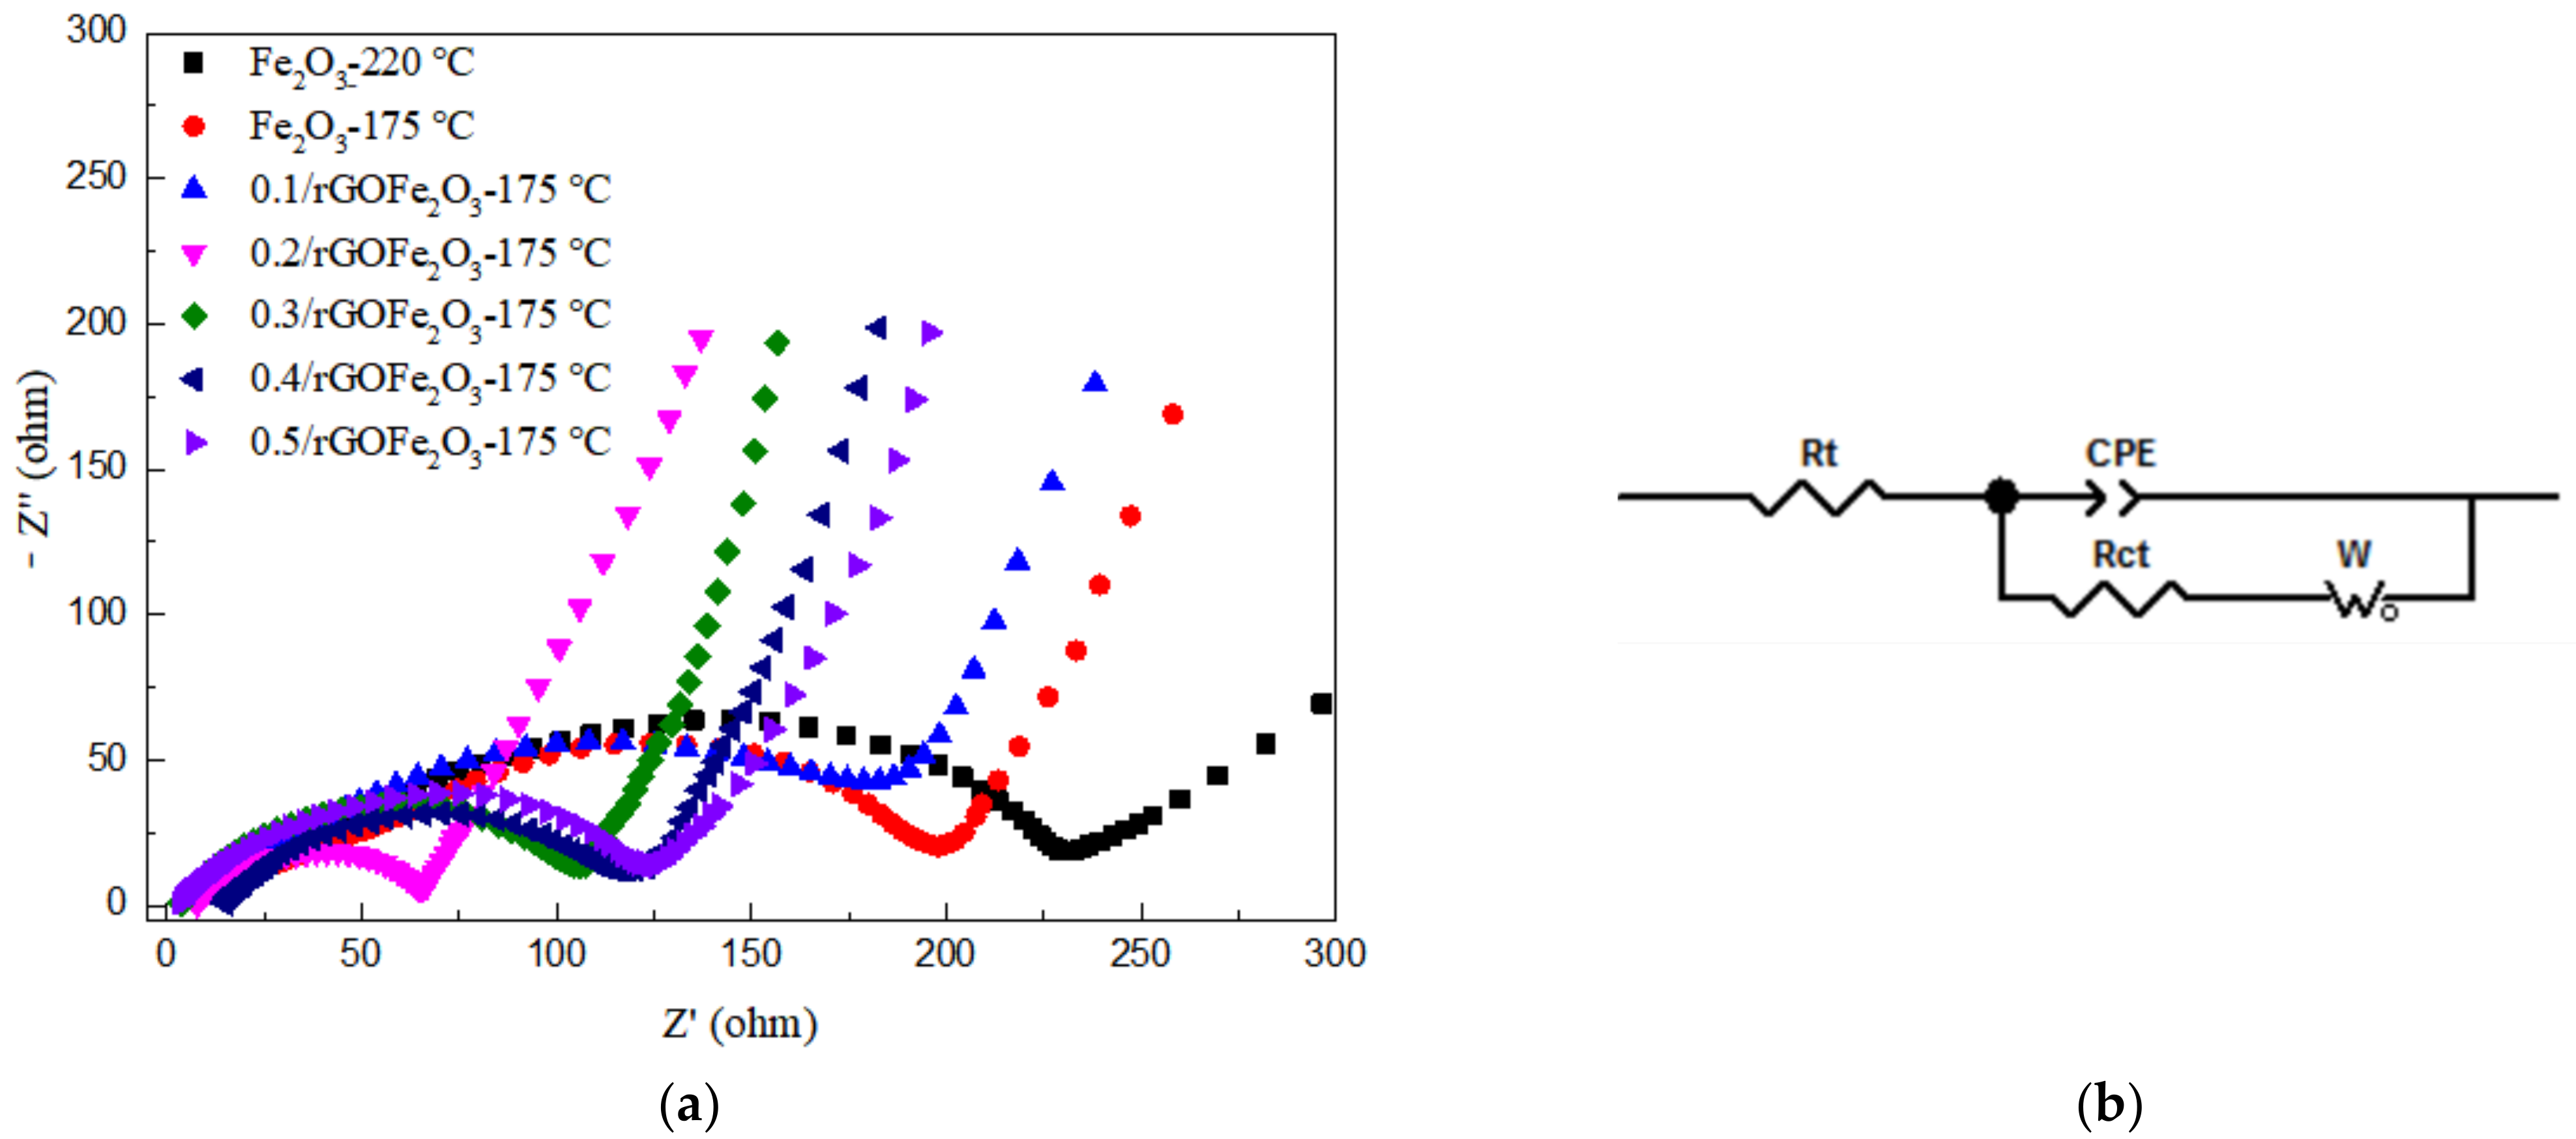
Figure 8a shows the AC impedance diagram of Fe2O3 prepared at different hydrothermal temperatures and rGO/Fe2O3-175 °C with different graphene ratios. EIS curves all contain a semicircle in the high frequency region and a straight line in the low frequency region. The radius of the semicircle represents the electron transfer resistance at the electrode/solution interface, that is, the charge transfer impedance at the electrode interface, which corresponds to the contact resistance of the anode material (Rct). The slope of the straight line represents the mobility of lithium ions inside the electrode, namely the Warburg impedance, corresponding to the charge transfer resistance (W). The equivalent circuit fitted to the AC impedance spectrum is shown in Figure 8b. In Figure 8a, the semicircular radius of nanorod-shaped Fe2O3-175 °C is smaller than that of spherical Fe2O3-220 °C, indicating that the former has smaller contact resistance and charge transfer resistance, which is conducive to the transmission of lithium ions. Therefore, nanorod-shaped Fe2O3-175 °C has better electrochemical performance. Furthermore, it can be seen that the order of internal resistance of the composite materials is R(1:0.2) < R(1:0.3) < R(1:0.4) < R(1:0.5) < R(1:0.1) < R(1:0). The Rct of 0.2rGO/Fe2O3-175 °C anode material is 82 Ω based on the equivalent circuit, which is the minimum in rGO/Fe2O3-175 °C with different graphene ratios and is basically consistent with the results of cyclic properties.

Figure 8.
(a) EIS curves of Fe2O3-220 °C, Fe2O3-175 °C and rGO/Fe2O3-175 °C with different graphene ratios; (b) Equivalent circuit for the electrode interface. “Rt“ stands for impedance; “Rct” stands for charge transfer resistance; “CPE” stands for Constant Phase Element; “Wo” stands for Warburg Element (Open).
4. Discussion
Due to the different hydrothermal synthesis temperatures of Fe2O3, the grain growth degree is different, leading to the grain shape and size being different. It can be seen from the XRD and SEM that the size of spherical Fe2O3 generated at 175 °C is much larger than that of nanorod-shaped Fe2O3 at 220 °C. Fe2O3 materials usually have a large volume expansion rate in the process of charging and discharging, which makes its capacity decay quickly and the cycle performance poor. Moreover, the small size of nanorod Fe2O3 as a lithium ion battery anode material can greatly buffer volume expansion in the charge and discharge process, nanoparticles have obvious advantages of electrochemical, which can effectively shorten the diffusion of lithium ions and electrons, increase the electrochemical reaction area, improve the penetration of the electrolyte, adapt to strain of Li+ out or embedded; so that nanorods Fe2O3 have better charge-discharge cycle performance than spherical Fe2O3.
In the preparation process of rGO/Fe2O3-175 °C, PVP as a surfactant can control the surface charge of nanorods α-Fe2O3 through the interaction between hydrophilic groups and metal oxides, and improve the dispersion of graphene [26,27]. This refinement can shorten the path of lithium ion diffusion and electron transport, and weaken the volume expansion, maintain the structural integrity and cyclic stability of the electrode. At the same time, the high softness of graphene can provide excellent intercalating space for Fe2O3 particles, so that Fe2O3 and graphene can interact more effectively, and provide free space for the volume change, which can greatly buffer the volume expansion of the composite material. In addition, Fe2O3 nanoparticles can also effectively prevent graphene stacking, provide a higher specific surface area, and enable more lithium ions to be embedded, thus further improving the electrochemical performance of graphene and Fe2O3 composites. It can be seen from the electrochemical results that the 0.2rGO/Fe2O3-175 °C anode material has the best cycling performance when appropriate graphene is added.
A comparison of 0.2rGO/Fe2O3-175 °C anode materials with other similar iron oxide and graphene composites is shown in Table 1. As can be seen from the table, researchers have used a variety of different methods in the process of composite materials synthesis, for example, the spray drying method or solvent hydrothermal method. The main morphologies of the composite materials are spherical or wafer shaped, while the morphology of 0.2rGO/Fe2O3-175 °C synthesized by the PVP assisted hydrothermal method in this paper is a unique nanorod shape. In terms of electrochemical properties, it can be seen that 0.2rGO/Fe2O3-175 °C has a large initial discharge capacity, but the capacity after 50 cycles is lower than other compounds, which needs to be further improved.

Table 1.
Comparison of synthesis methods, morphology and electrochemical properties of different iron oxide and graphene composites.
5. Conclusions
Iron oxides materials with different morphs were prepared by different hydrothermal reaction temperatures, on this basis, rGO/Fe2O3-175 °C composites with different graphene ratios were synthesized and used in the cathode of lithium ion batteries. The following conclusions were drawn: The crystal phase of the hydrothermal synthesis reaction product of iron oxide is α-Fe2O3. With the decrease in the hydrothermal reaction temperature, the particle size of Fe2O3 decreased significantly, and the morphology changed from spherical Fe2O3 to nanorod Fe2O3. Nanorod-shaped Fe2O3 had a better electrochemical performance. rGO/Fe2O3-175 °C composites were prepared by PVP surfactants, which were a better fit for lithium ion insertion and release. 0.2rGO/Fe2O3-175 °C had the best cyclic performance and rate performance, the first cyclic discharge capacity was 1372 mAh/g under a current density of 100 mA/g. After 50 cycles, the cyclic reversible capacity remained at about 435 mAh/g, and the internal resistance was at the minimum.
Author Contributions
Conceptualization, G.Z. and B.G.; validation, G.Z.; methodology, G.Z.; formal analysis, G.Z. and H.L.; investigation, G.Z., H.L. and M.W.; resources, H.L. and M.W.; writing—original draft preparation, G.Z.; writing—review and editing, B.G.; supervision, G.T.; project administration, B.G. All authors have read and agreed to the published version of the manuscript.
Funding
This study was supported by the National Natural Science Foundation of China (51671052), the Fundamental Research Funds for the Central Universities (N182502042), the Liao Ning Revitalization Talents Program (XLYC1902105) and Shenyang Science and Technology Plan (20-203-5-39).
Institutional Review Board Statement
Not applicable.
Informed Consent Statement
Not applicable.
Data Availability Statement
The data presented in this study are available on request from the corresponding author.
Conflicts of Interest
The authors declare no conflict of interest.
References
- Cong, Y.; Ge, Y.; Zhang, T.; Wang, Q.; Shao, M.; Wang, Y. Fabrication of z-scheme Fe2O3-MoS2-Cu2O ternary nanofilm with significantly enhanced photo electro catalytic performance. Ind. Eng. Chem. Res. 2018, 57, 881–890. [Google Scholar] [CrossRef]
- Fu, Y.; Wang, X.; Wang, H.; Zhang, Y.; Yang, X.; Shu, H. An Fe3O4@(C-MnO2) core-double-shell composite as a high-performance anode material for lithium ion batteries. RSC Adv. 2015, 5, 14531–14539. [Google Scholar] [CrossRef]
- Li, G.; Han, R.; Xu, X.; Ren, M. Facile synthesis of Mn-doped hollow Fe2O3 nanospheres coated with polypyrrole as anodes for high-performance lithium-ion batteries. RSC Adv. 2016, 6, 48199–48204. [Google Scholar] [CrossRef]
- Poizot, P.; Laruelle, S.; Grugeon, S.; Dupont, L.; Tarascon, J.M. Nano-sized transition-metal oxides as negative-electrode materials for lithium-ionatteries. Nature 2000, 407, 496–508. [Google Scholar] [CrossRef] [PubMed]
- Gu, X.; Chen, L.; Ju, Z.; Xu, H.; Yang, J.; Qian, Y. Controlled Growth of Porous α-Fe2O3 Branches on β-MnO2 Nanorods for Excellent Performance in Lithium-Ion Batteries. Adv. Funct. Mater. 2013, 23, 4049–4056. [Google Scholar] [CrossRef]
- Luo, J.; Xia, X.; Luo, Y.; Guan, C.; Liu, J.; Qi, X.; Fan, H.J. Rationally designed hierarchical TiO2@ Fe2O3 hollow nanostructures for improved lithium ion storage. Adv. Energy Mater. 2013, 3, 737–743. [Google Scholar] [CrossRef]
- Yuan, S.; Zhou, Z.; Li, G. Structural evolution from mesoporous α-Fe2O3 to Fe3O4@C and γ-Fe2O3 nanospheres and their lithium storage performances. CrystEngComm 2011, 13, 4709–4713. [Google Scholar] [CrossRef]
- Zhou, W.; Cheng, C.; Liu, J.; Tay, Y.Y.; Jiang, J.; Jia, X.; Zhang, J.; Gong, H.; Hng, H.H.; Yu, T. Epitaxial Growth of Branched α-Fe2O3/SnO2 Nano-Hetero structures with Improved Lithium-Ion Battery Performance. Adv. Funct. Mater. 2011, 21, 2439–2445. [Google Scholar] [CrossRef]
- Wu, M.; Ou, Y.; Lin, P. Iron oxide nanosheets and nanoparticles synthesized by a facile single-step coprecipitation method for lithium-ion batteries. J. Electrochem. Soc. 2011, 158, 231–236. [Google Scholar] [CrossRef]
- Zhao, Y.; Feng, Z.; Xu, Z.J. Yolk-shell Fe2O3 circle dot C composites anchored on MWNTs with enhanced lithium and sodium storage. Nanoscale 2015, 7, 9520–9525. [Google Scholar] [CrossRef]
- Zheng, F.; He, M.; Yang, Y.; Chen, Q. Nano electrochemical reactors of Fe2O3 nanoparticles embedded in shells of nitrogen-doped hollow carbon spheres as high-performance anodes for lithium-ion batteries. Nanoscale 2015, 7, 3410–3417. [Google Scholar] [CrossRef]
- Yu, A.; Park, W.H.; Davies, A.; Higgins, C.D.; Chen, Z.; Xiao, X. Free-standing layer-by-layer hybrid thin film of graphene-MnO2 nanotube as anode for lithium ion batteries. J. Phys. Chem. Lett. 2011, 2, 1855–1860. [Google Scholar] [CrossRef]
- Lv, X.; Deng, J.; Wang, J.; Zhong, J.; Sun, X. Carbon-coated α-Fe2O3 nanostructures for efficient anode of Li-ion battery. J. Mater. Chem. A 2015, 3, 5183–5188. [Google Scholar] [CrossRef]
- Zhao, B.; Liu, R.; Cai, X.; Jiao, Z.; Wu, M.; Ling, X. Nanorod-like Fe2O3/graphene composite as high-performance anode material for lithium ion batteries. J. Appl. Electrochem. 2014, 44, 53–60. [Google Scholar] [CrossRef]
- Zhou, G.W.; Wang, J.; Gao, P.; Yang, X.; He, Y.; Liao, X.; Yang, J.; Ma, Z. Facile spray drying route for the three-dimensional graphene-encapsulated Fe2O3 nanoparticles for lithium ion battery anodes. Ind. Eng. Chem. Res. 2012, 52, 1197–1204. [Google Scholar] [CrossRef]
- Zhen, Y.X.; Arbizzani, C.; Ortolani, L.; Morandi, V.; Bellani, V.; Giambastiani, G. High yield pro-duction of graphene-Fe2O3 nano-composites via electrochemical intercalation of nitromethane and iron chloride, and their application in lithium storage. FlatChem 2017, 3, 8–15. [Google Scholar]
- Wang, G.X.; Shen, X.P.; Yao, J. Graphene nanosheets for enhanced lithium storage in lithium ion batteries. Carbon 2009, 47, 2049–2053. [Google Scholar] [CrossRef]
- Yang, Y.; Feng, X.; Ivanovici, S.; Mellen, K. Fabrication of graphene-encapsulated oxide nanoparticles: Towards high-performance anode materials for lithium storage. Angew. Chem. 2010, 49, 8408–8411. [Google Scholar] [CrossRef]
- Lian, P.; Zhu, X.; Liang, S.; Li, Z.; Yang, W.; Wang, H. High reversible capacity of SnO2/graphene nanocomposite as an anode material for lithium-ion batteries. Electrochim. Acta 2011, 56, 4532–4539. [Google Scholar] [CrossRef]
- Cai, D.; Li, D.; Wang, S.; Zhu, X.; Yang, W.; Zhang, S.; Wang, H. High rate capability of TiO2/nitrogen-doped graphene nanocomposite as an anode material for lithium-ion batteries. J. Alloys Compd. 2016, 561, 54–58. [Google Scholar] [CrossRef]
- Kan, J.; Wang, Y. Large and fast reversible Li-ion storages in Fe2O3-graphene sheet-on-sheet sandwich-like nanocomposites. Sci. Rep. 2013, 3, 69–74. [Google Scholar] [CrossRef] [Green Version]
- Meng, J.; Fu, L.; Liu, Y.; Zheng, G.; Zheng, X.; Guan, X.; Zhang, J. Gas-liquid interfacial assembly and electrochemical properties of 3D highly dispersed α-Fe2O3@graphene aerogel composites with a hierarchical structure for applications in anodes of lithium ion batteries. Electrochim. Acta 2017, 224, 40–48. [Google Scholar] [CrossRef]
- Tian, L.; Zhuang, Q.; Li, J.; Shi, Y.; Chen, J.; Lu, F.; Sun, S. Mechanism of intercalation and deintercalation of lithium ions in graphene nanosheets. Chin. Sci. Bull. 2011, 56, 3204–3206. [Google Scholar] [CrossRef] [Green Version]
- Alam, S.N.; Sharma, N.; Kumar, L. Synthesis of graphene oxide (GO) by modified hummers method and its thermal reduction to obtain reduced graphene oxide (rGO). Graphene 2017, 6, 1–18. [Google Scholar] [CrossRef] [Green Version]
- Liu, S.; Chen, Z.; Xie, K.; Li, Y.; Xu, J.; Zheng, C. A facile one-step hydrothermal synthesis of alpha-Fe2O3 nanoplates imbedded in graphene networks with high-rate lithium storage and long cycle life. J. Mater. Chem. A 2014, 2, 13942–13948. [Google Scholar] [CrossRef]
- Yoon, S.; In, I. Role of poly(N-vinyl-2-pyrrolidone) as stabilizer for dispersion of graphene via hydrophobic interaction. Mater. Sci. 2009, 46, 1316–1321. [Google Scholar] [CrossRef]
- Shan, C.; Yang, H.; Song, J.; Han, D.; Ivaska, A.; Niu, L. Direct electrochemistry of glucose oxidase and biosensing for glucose based on graphene. Anal. Chem. 2009, 81, 2378–2382. [Google Scholar] [CrossRef]


Publisher’s Note: MDPI stays neutral with regard to jurisdictional claims in published maps and institutional affiliations. |
© 2022 by the authors. Licensee MDPI, Basel, Switzerland. This article is an open access article distributed under the terms and conditions of the Creative Commons Attribution (CC BY) license (https://creativecommons.org/licenses/by/4.0/).