
Thermophysical Properties of Fe-Si and Cu-Pb Melts and Their Effects on Solidification Related Processes

 ,
, 
 ,
, 

Abstract
1. Introduction
2. Theory
2.1. Thermodynamics and Surface Properties of Metallic Melts Representing Phase Separation and Strong Compound Forming Tendency
2.1.1. Phase Separating Liquid Alloys and Self Aggregating Model (SAM)
2.1.2. Compound Forming Liquid Alloys and Compound Formation Model (CFM)
2.1.3. Quasi Chemical Approximation (QCA) for Regular Solution
2.1.4. Perfect Solution Model
2.2. Transport Properties: Viscosity
2.3. Density/Molar Volume
2.4. Structural Information: and Microscopic Functions
3. Results and Discussion
3.1. Thermodynamics of the Two Limiting Cases of Mixing: Cu-Pb and Fe-Si Liquid Alloys
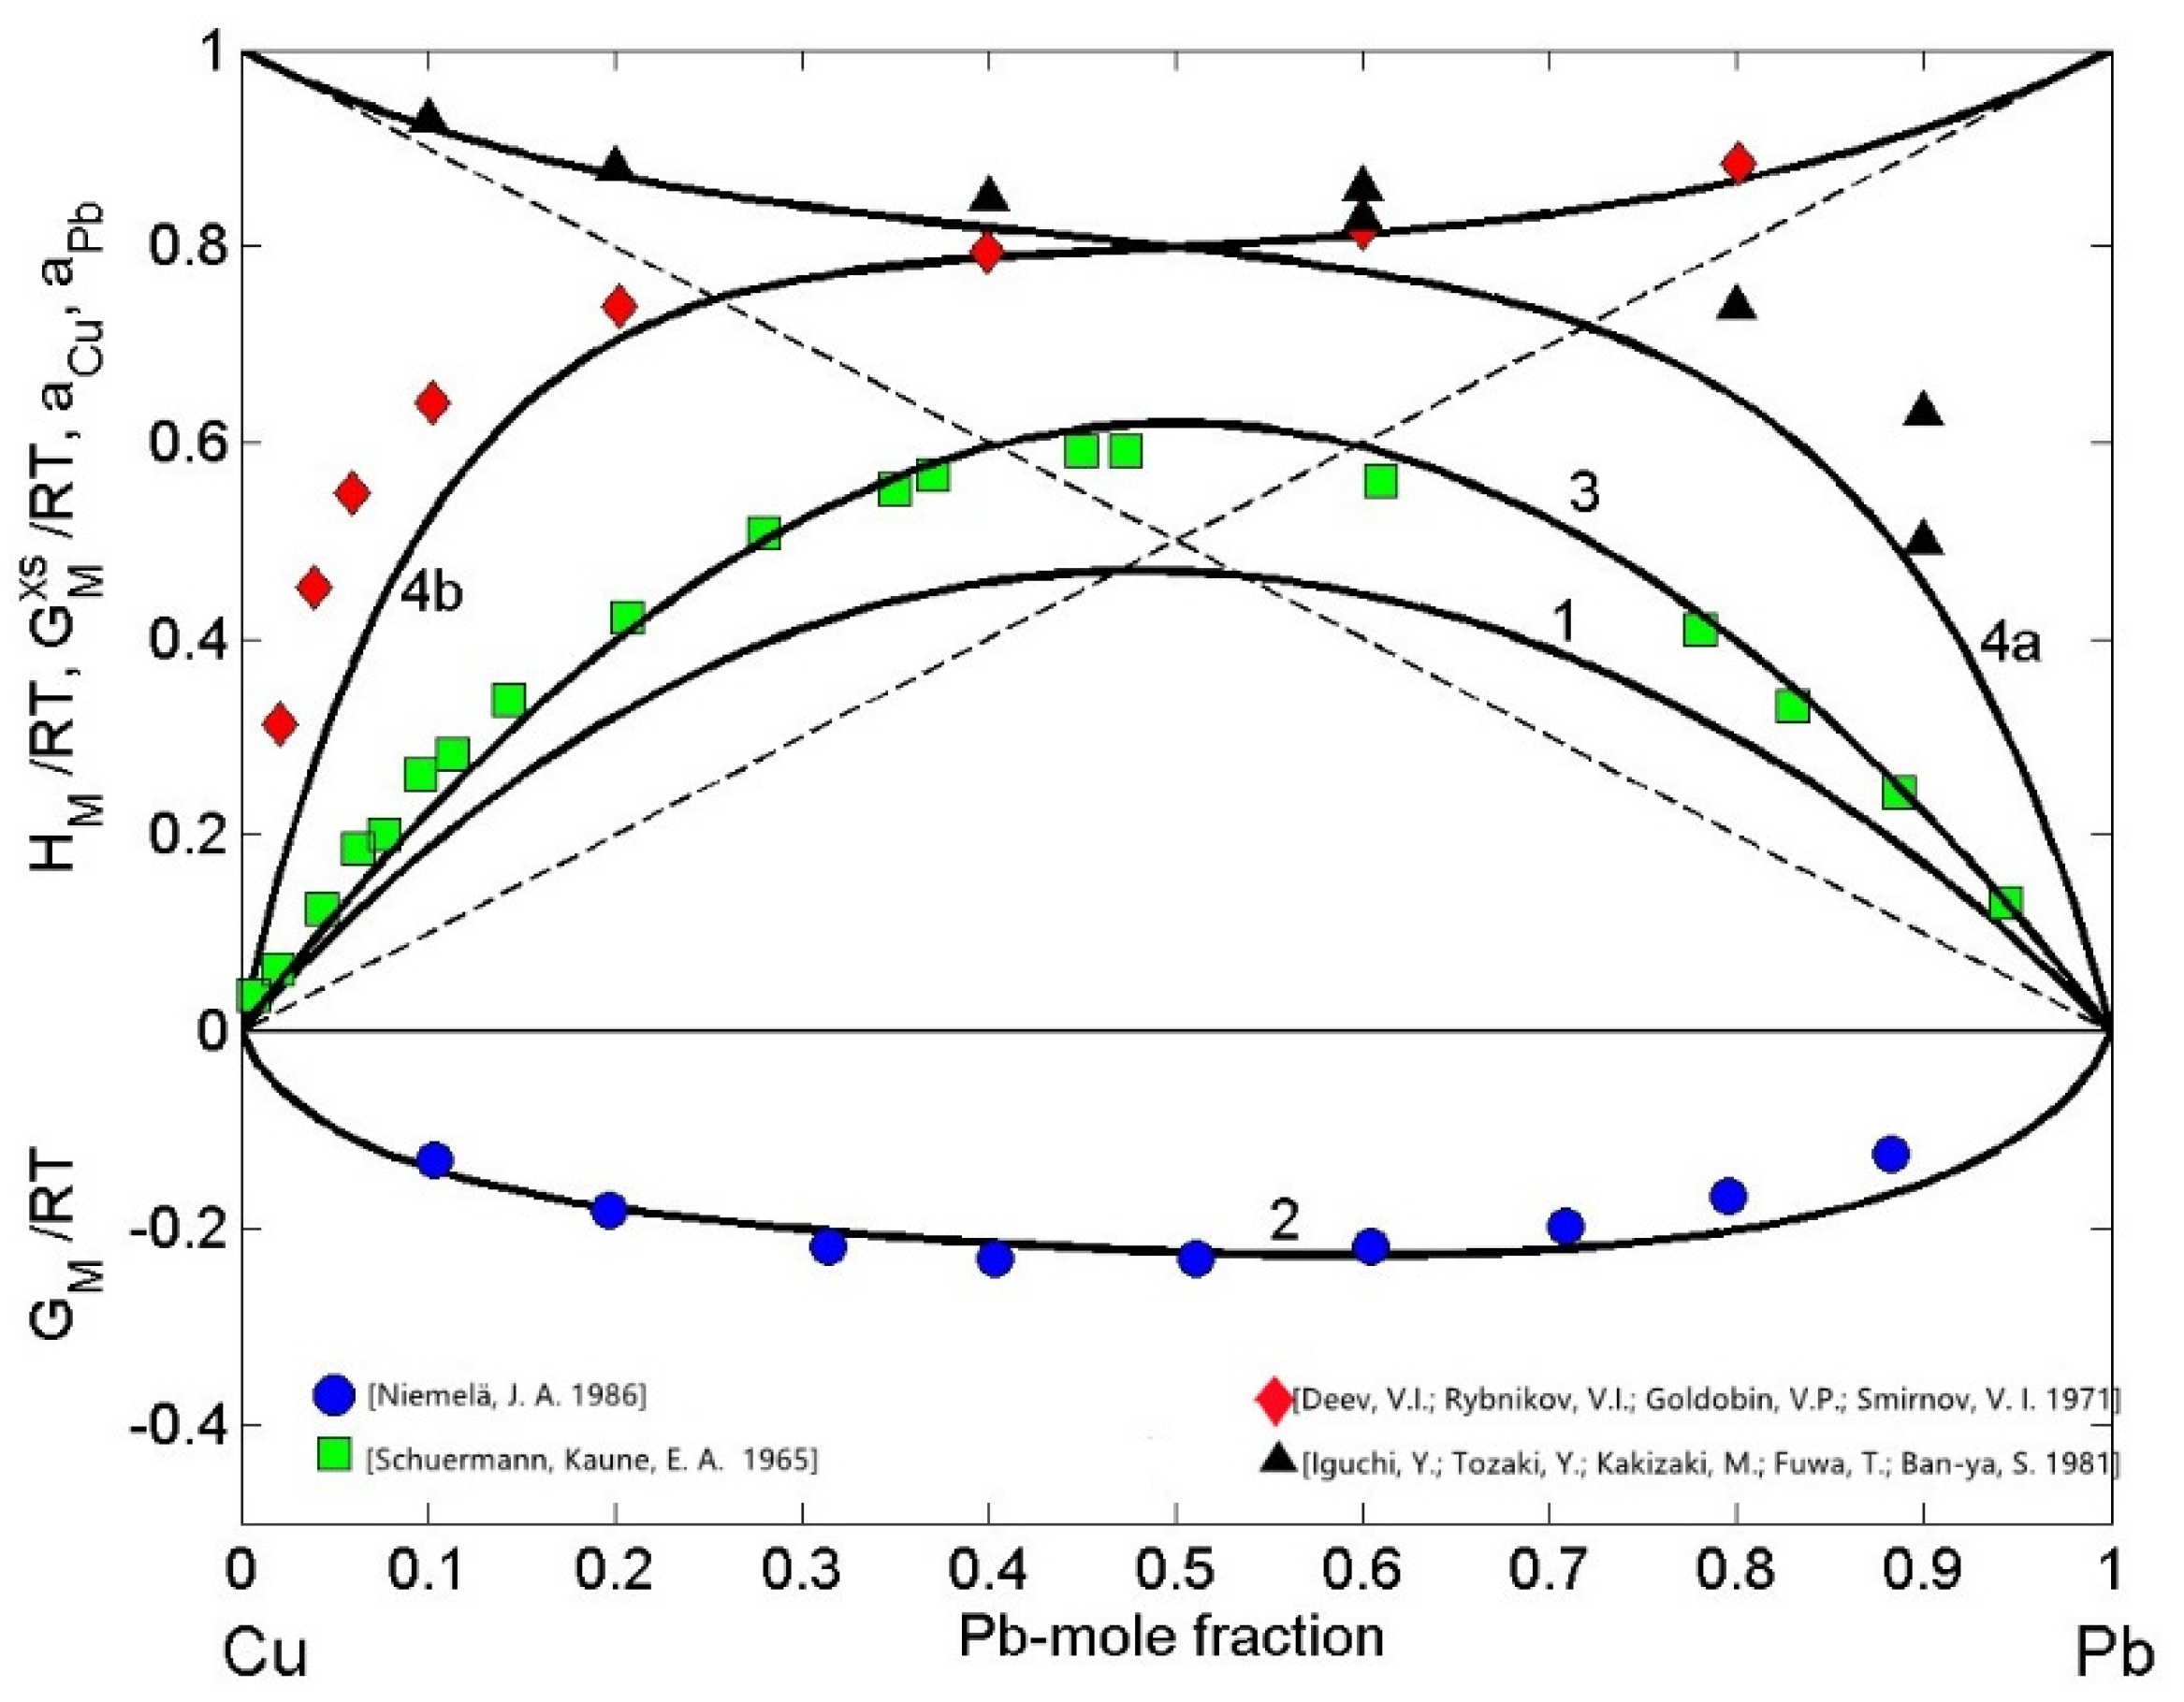
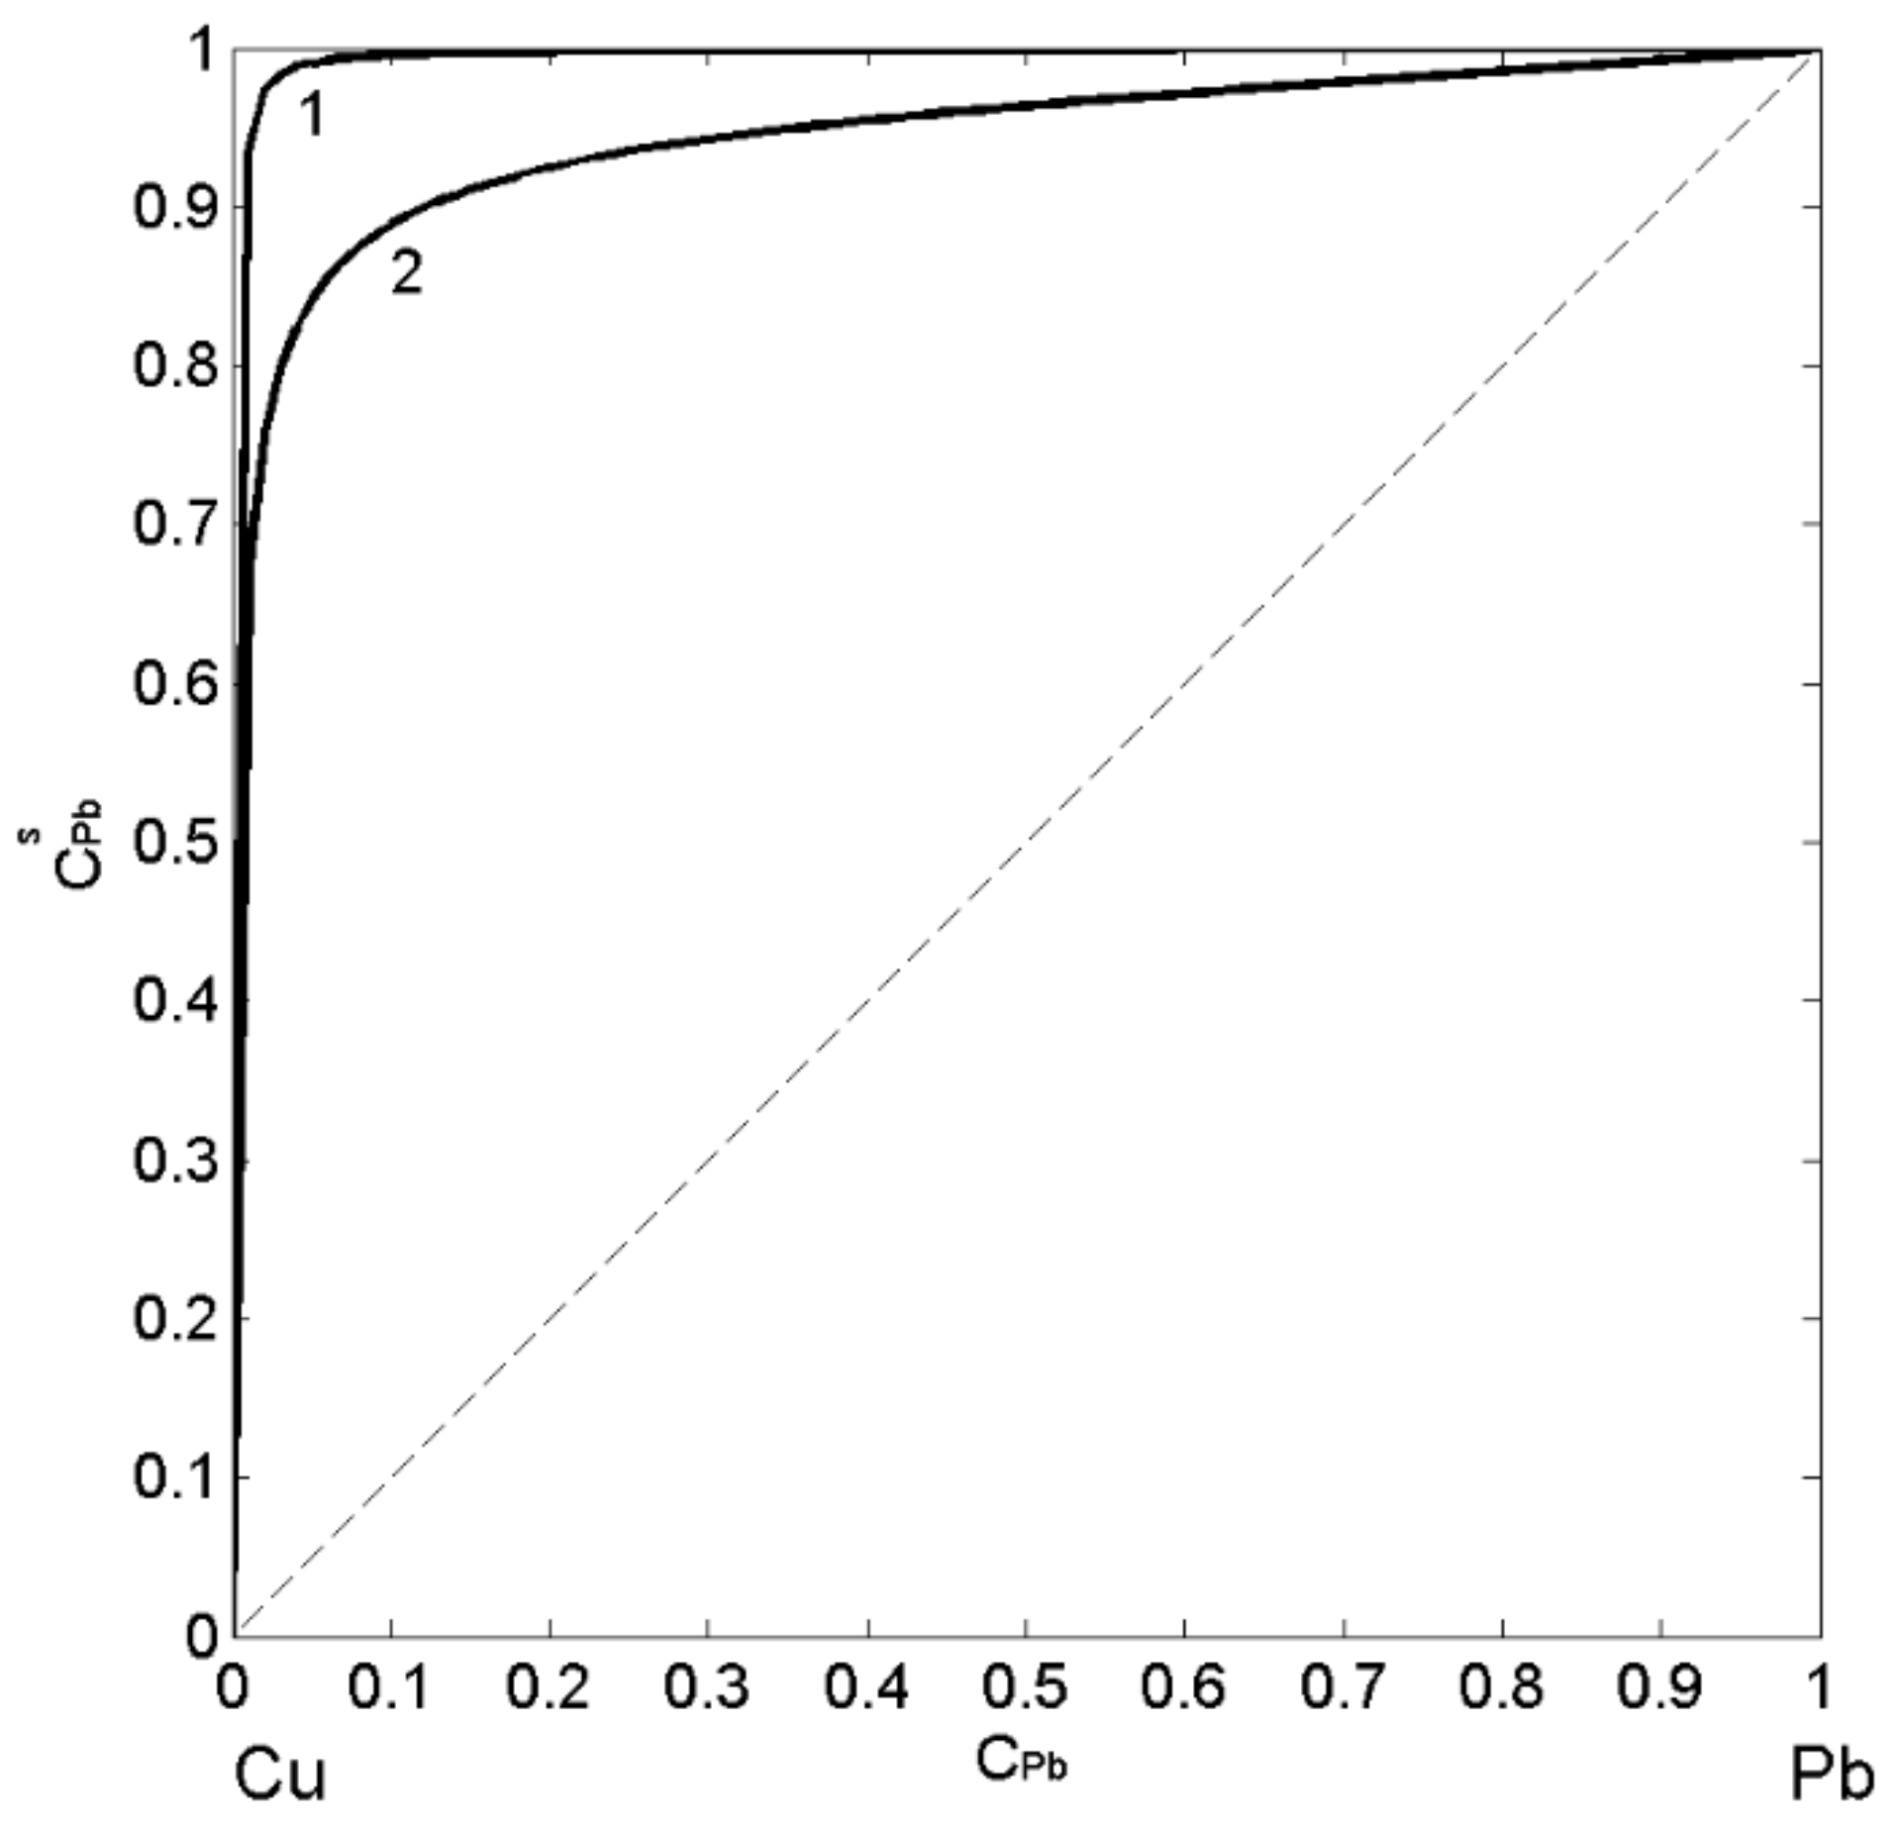
3.1.1. Cu-Pb
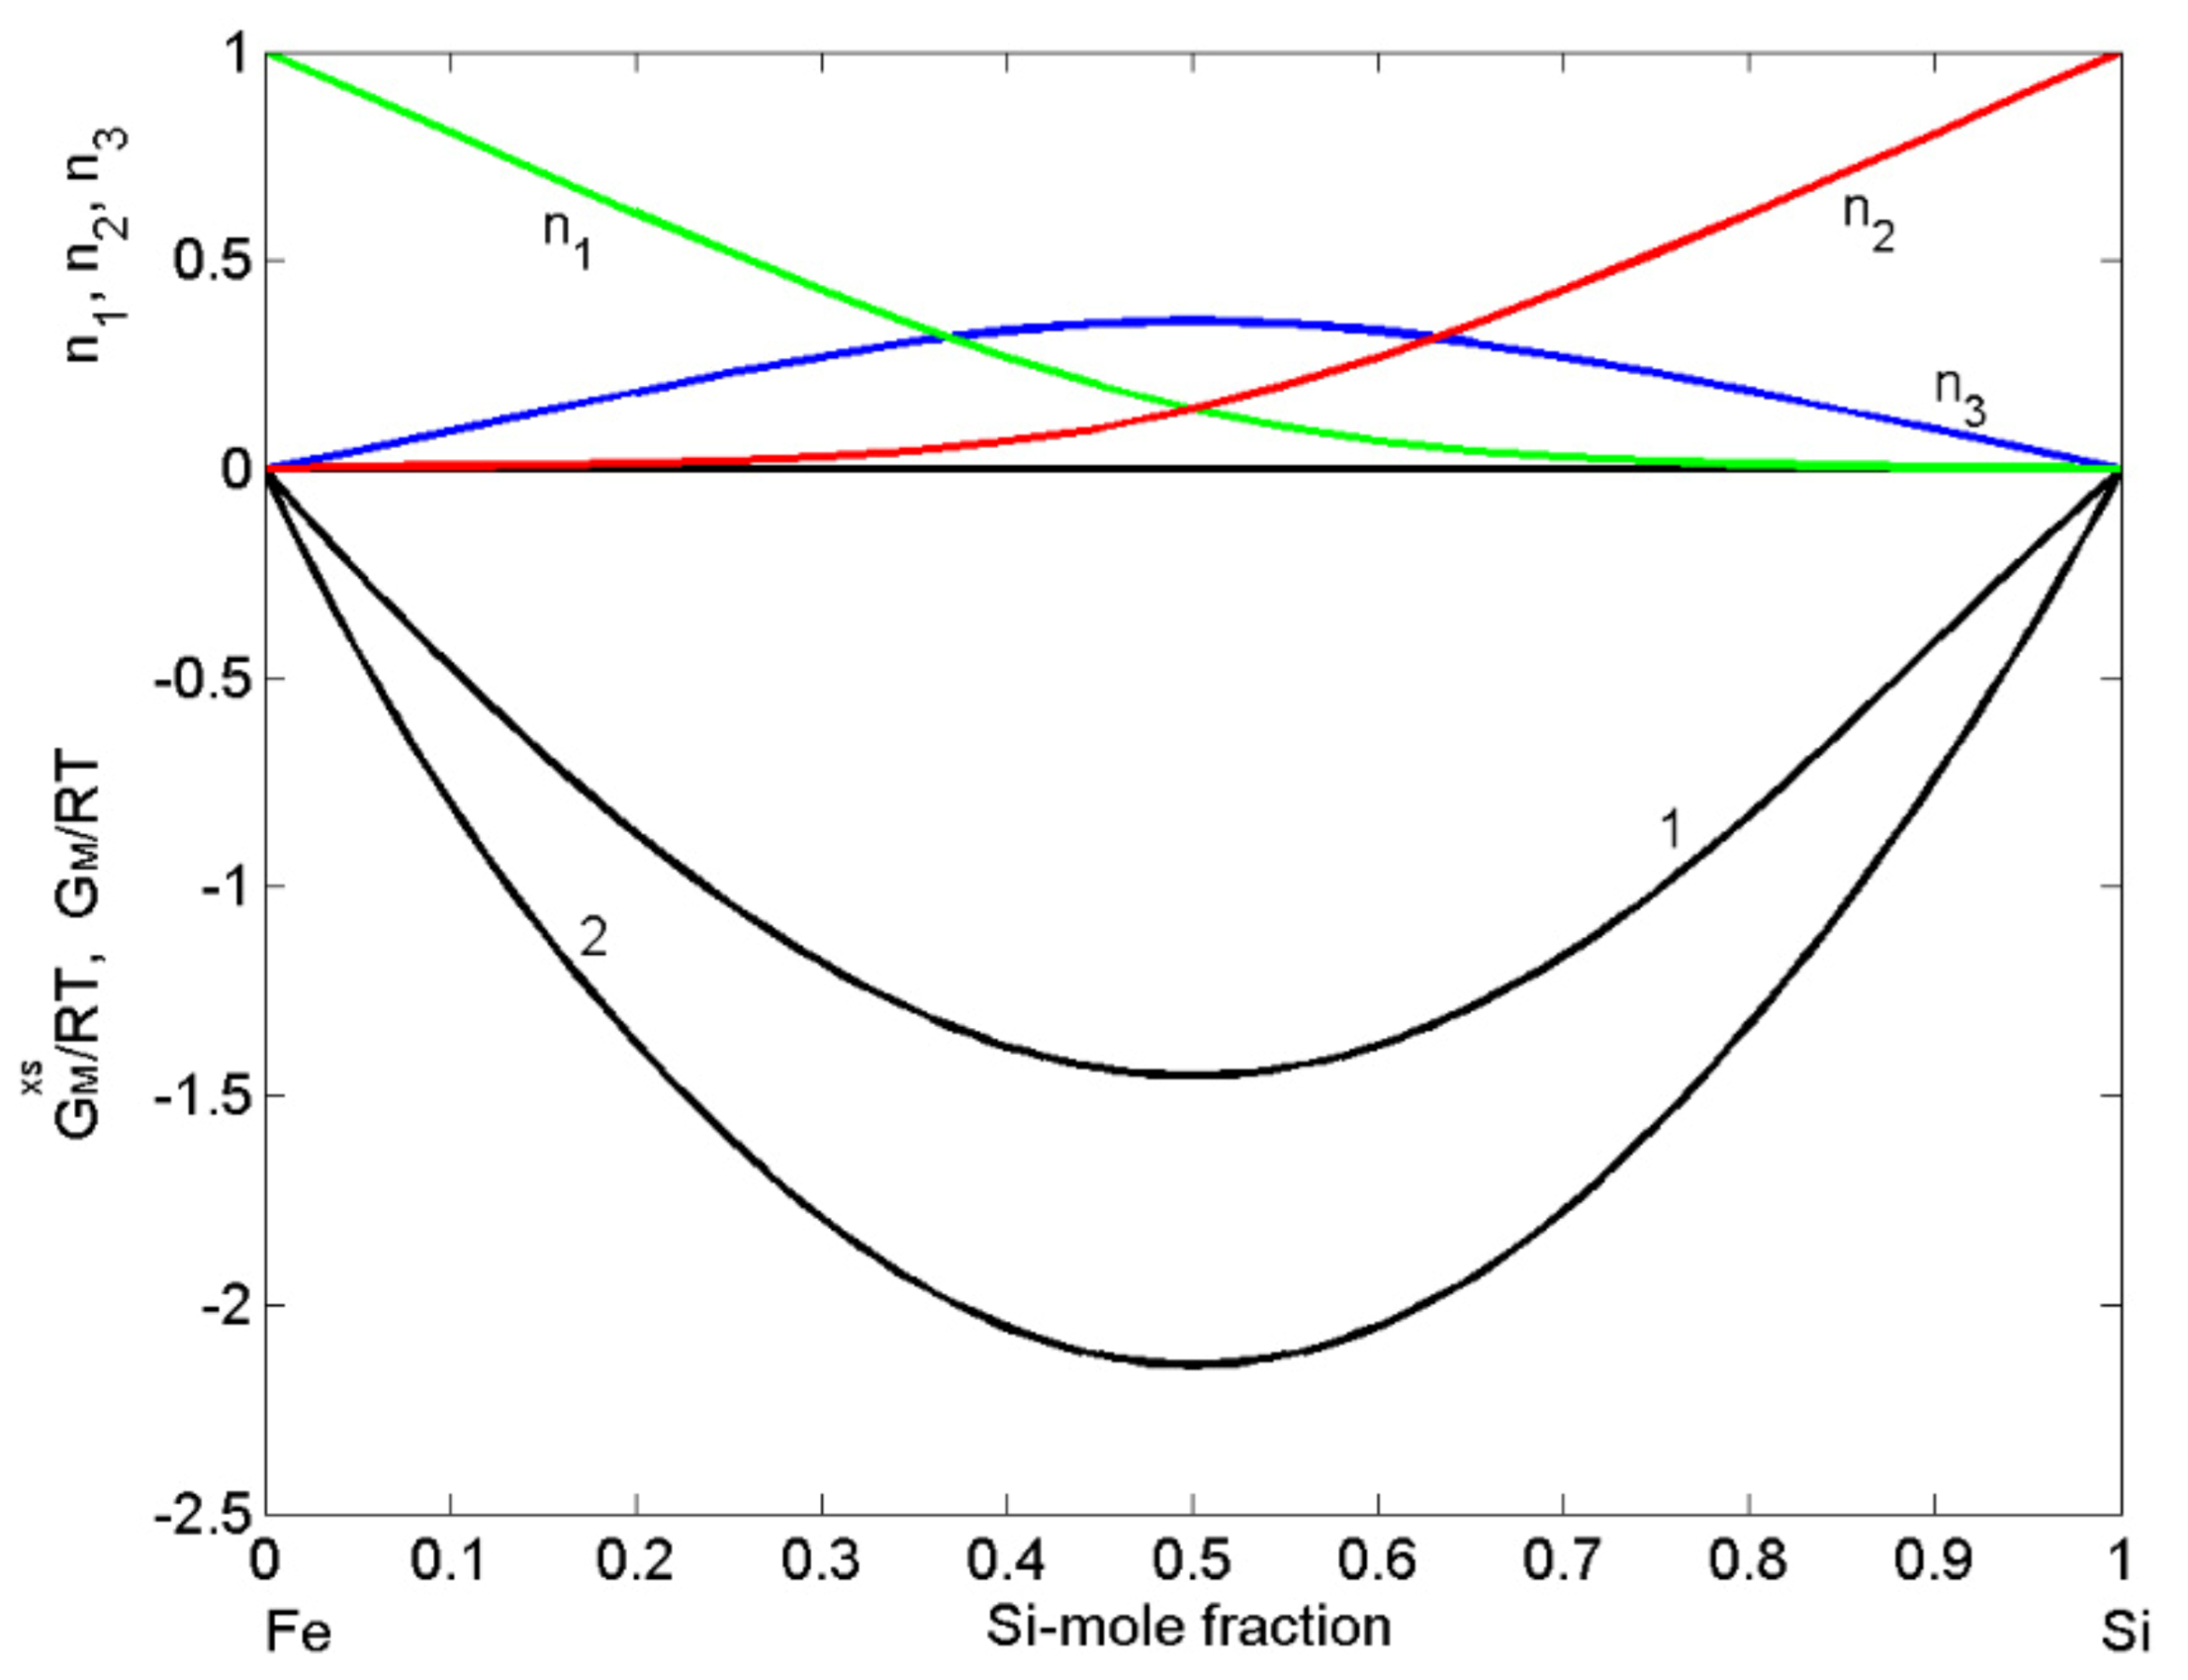
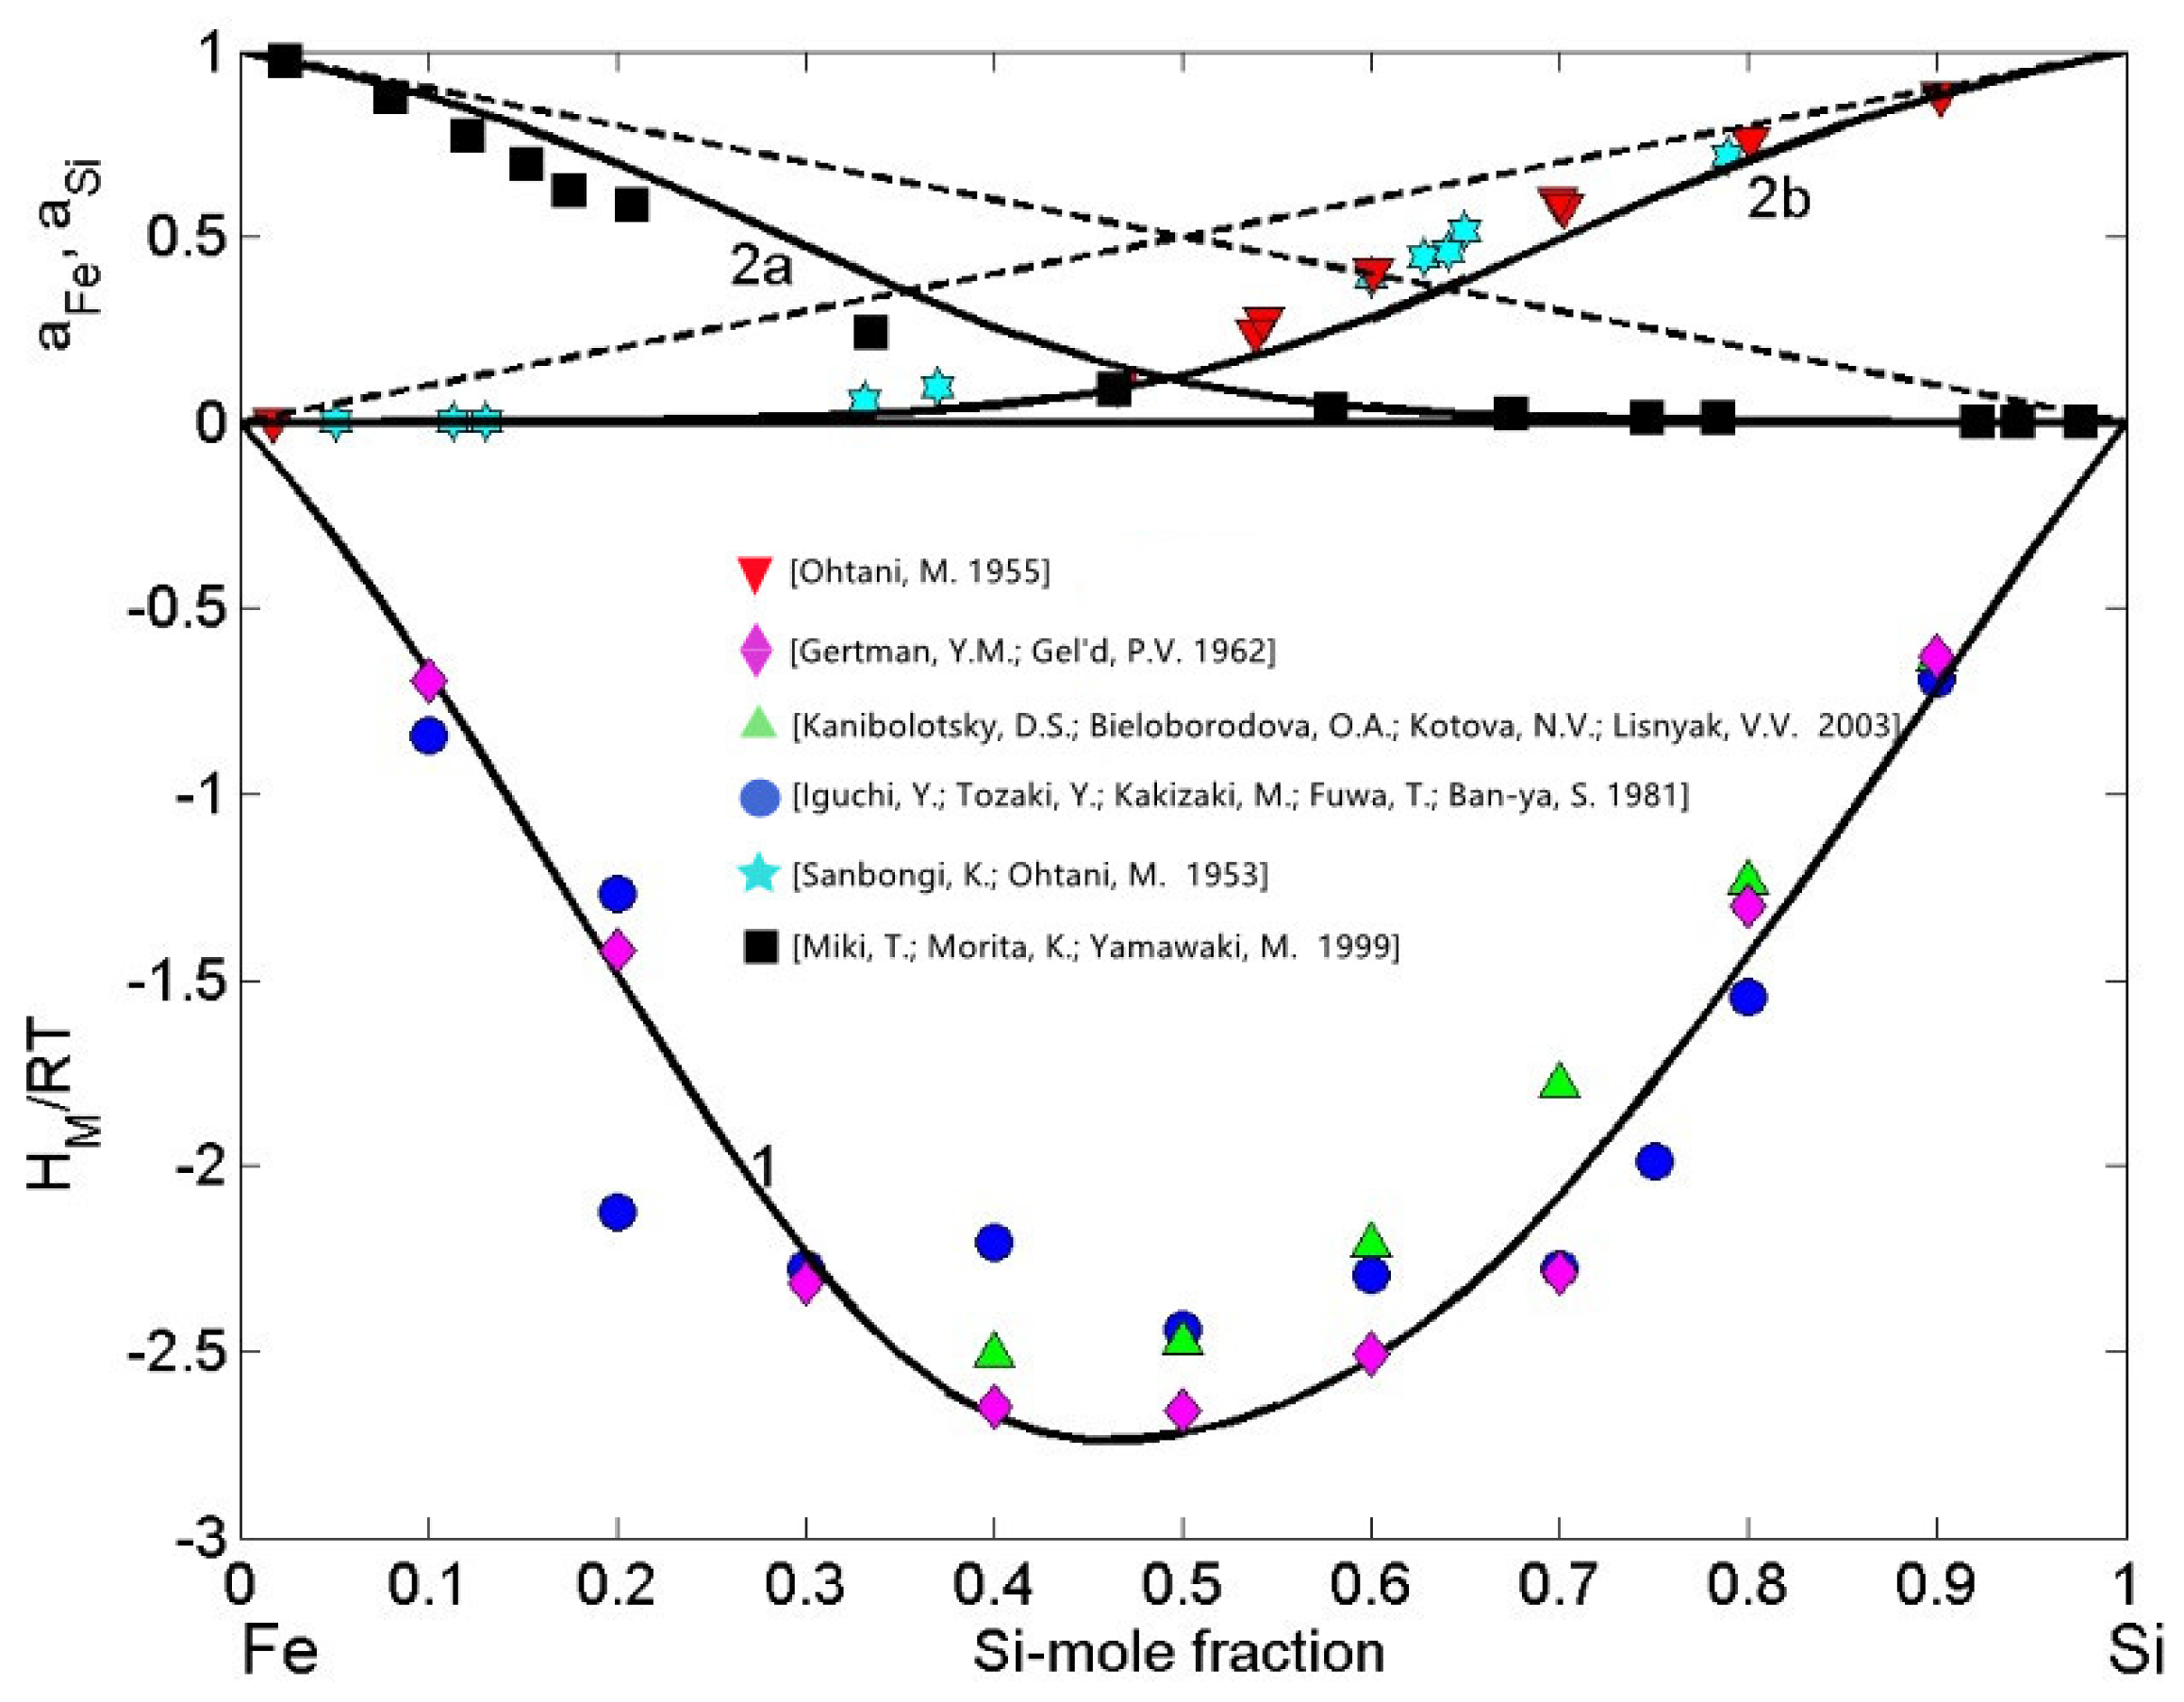
3.1.2. Fe-Si

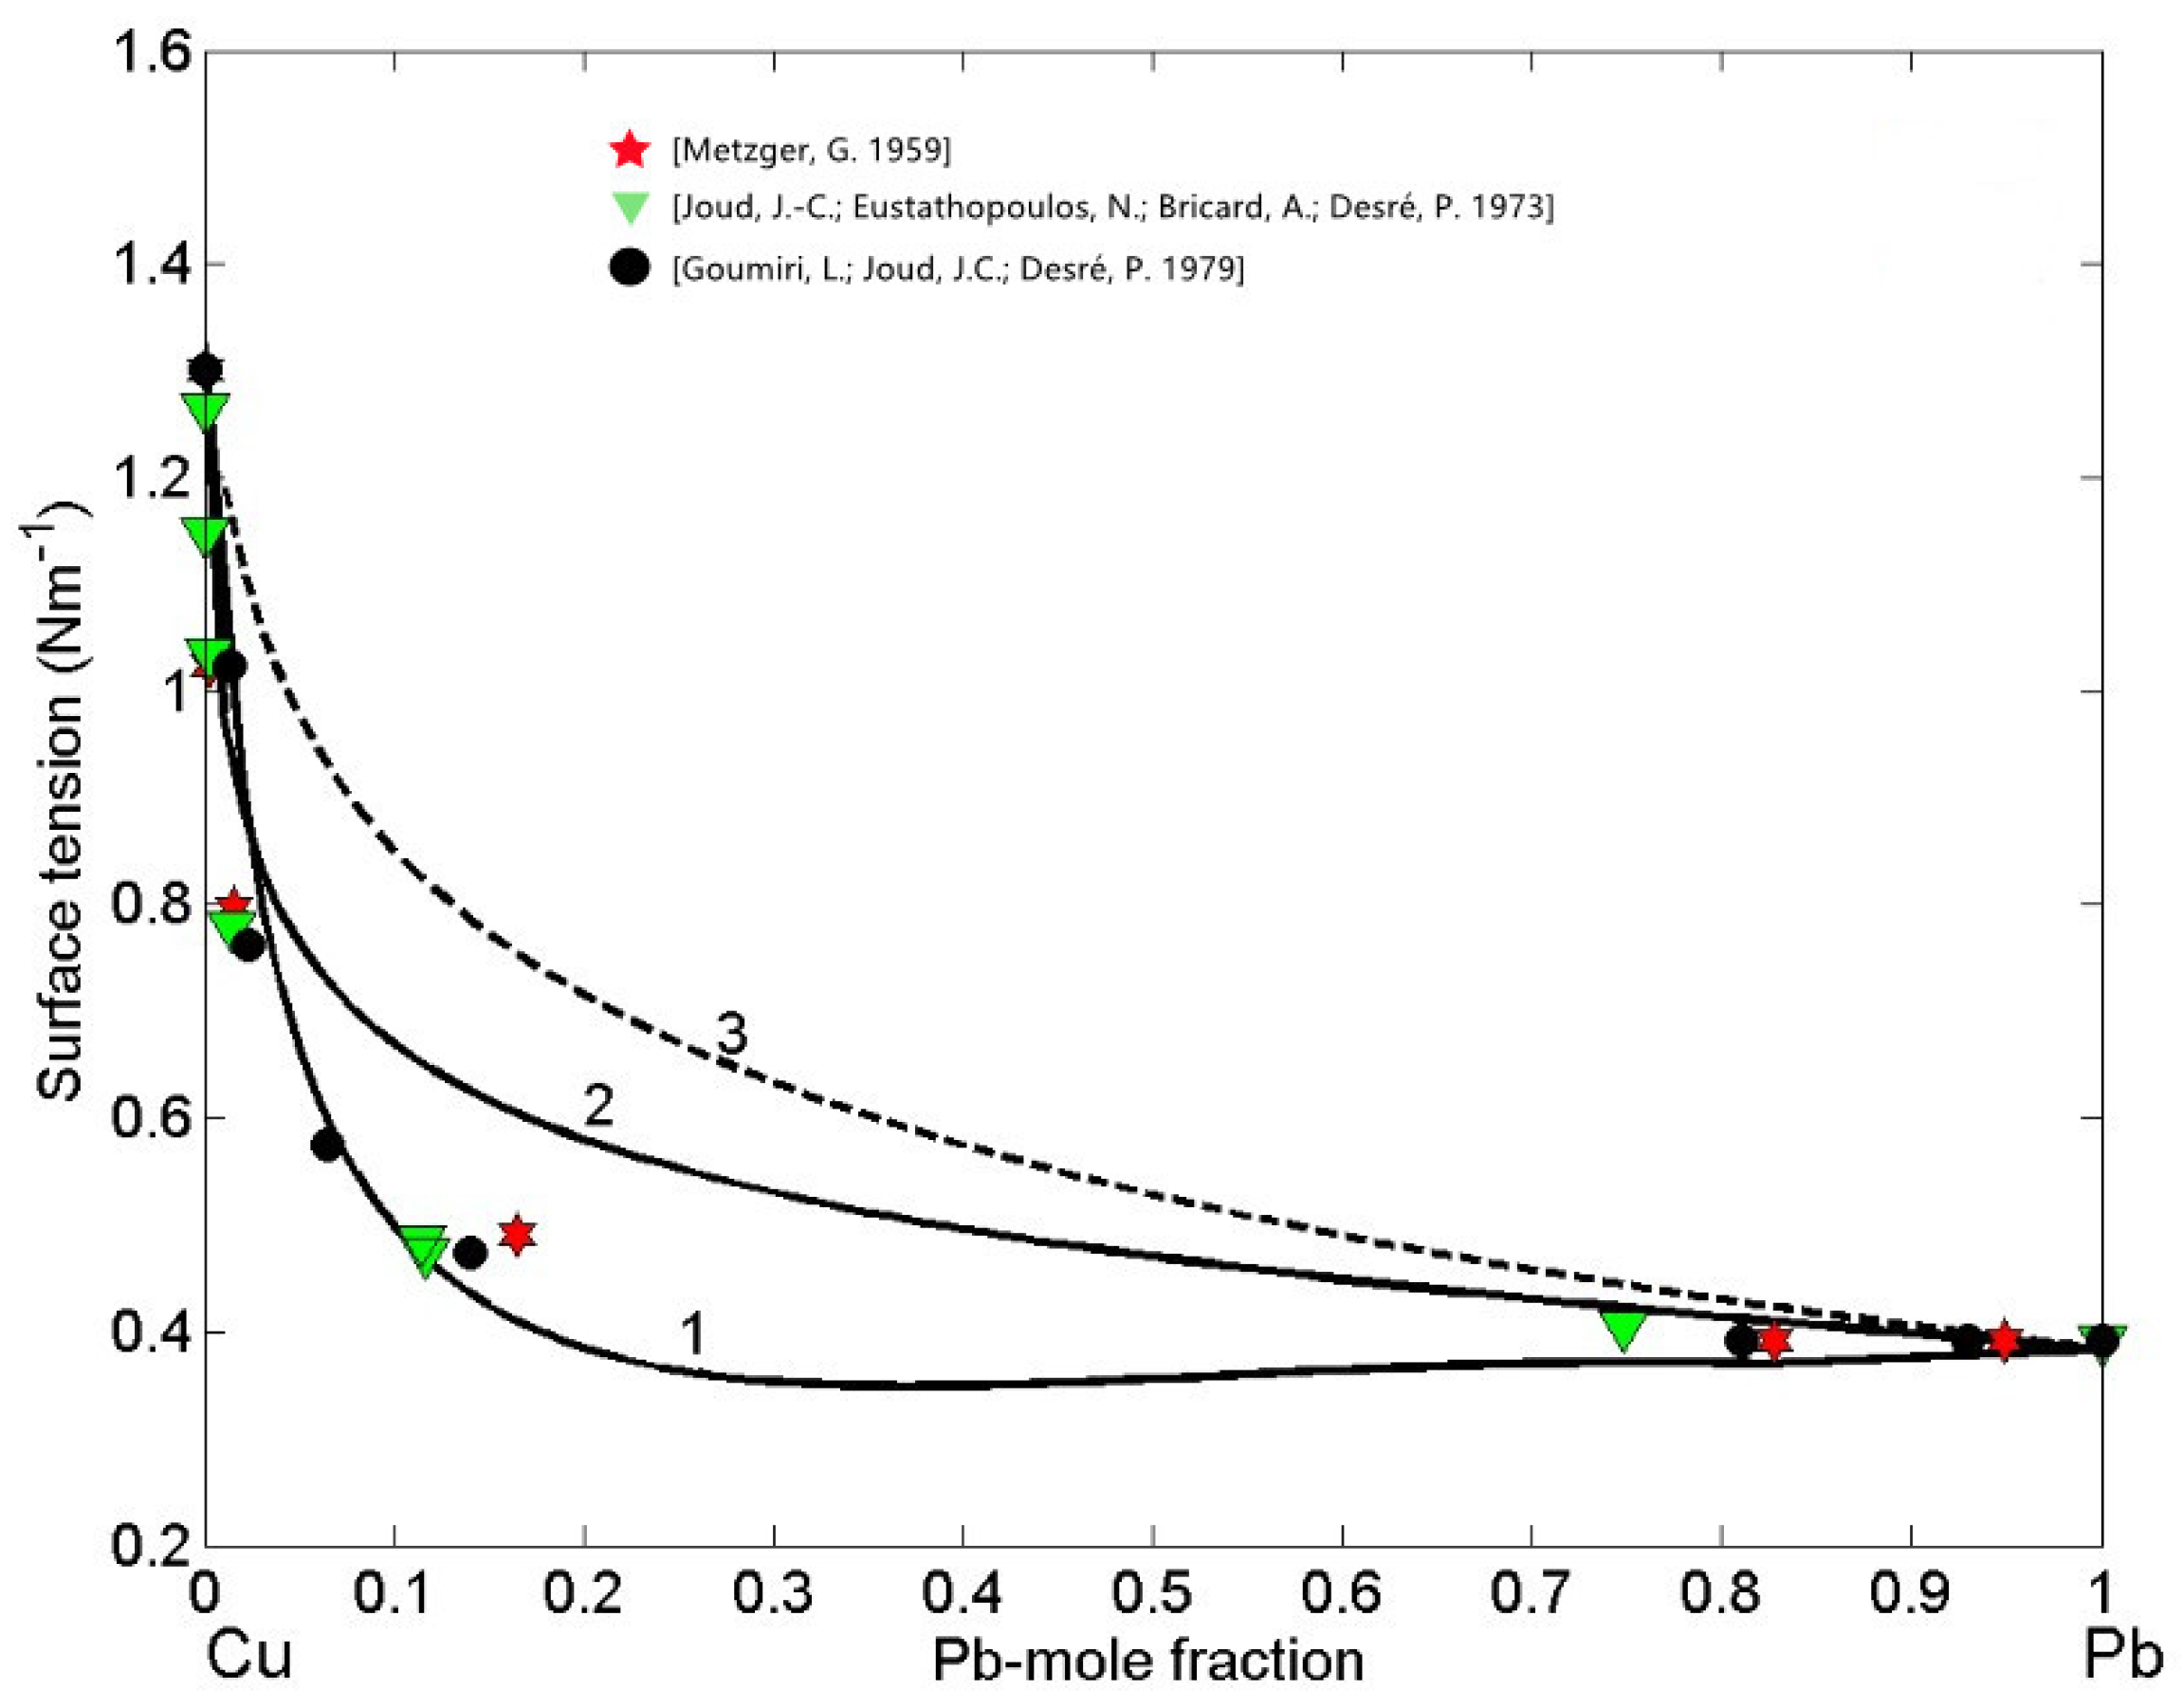
3.2. Surface Properties of Phase Separating and Compound Forming Liquid Alloys
3.2.1. Self Aggregating Model (SAM) and Surface Properties of Cu-Pb Melts
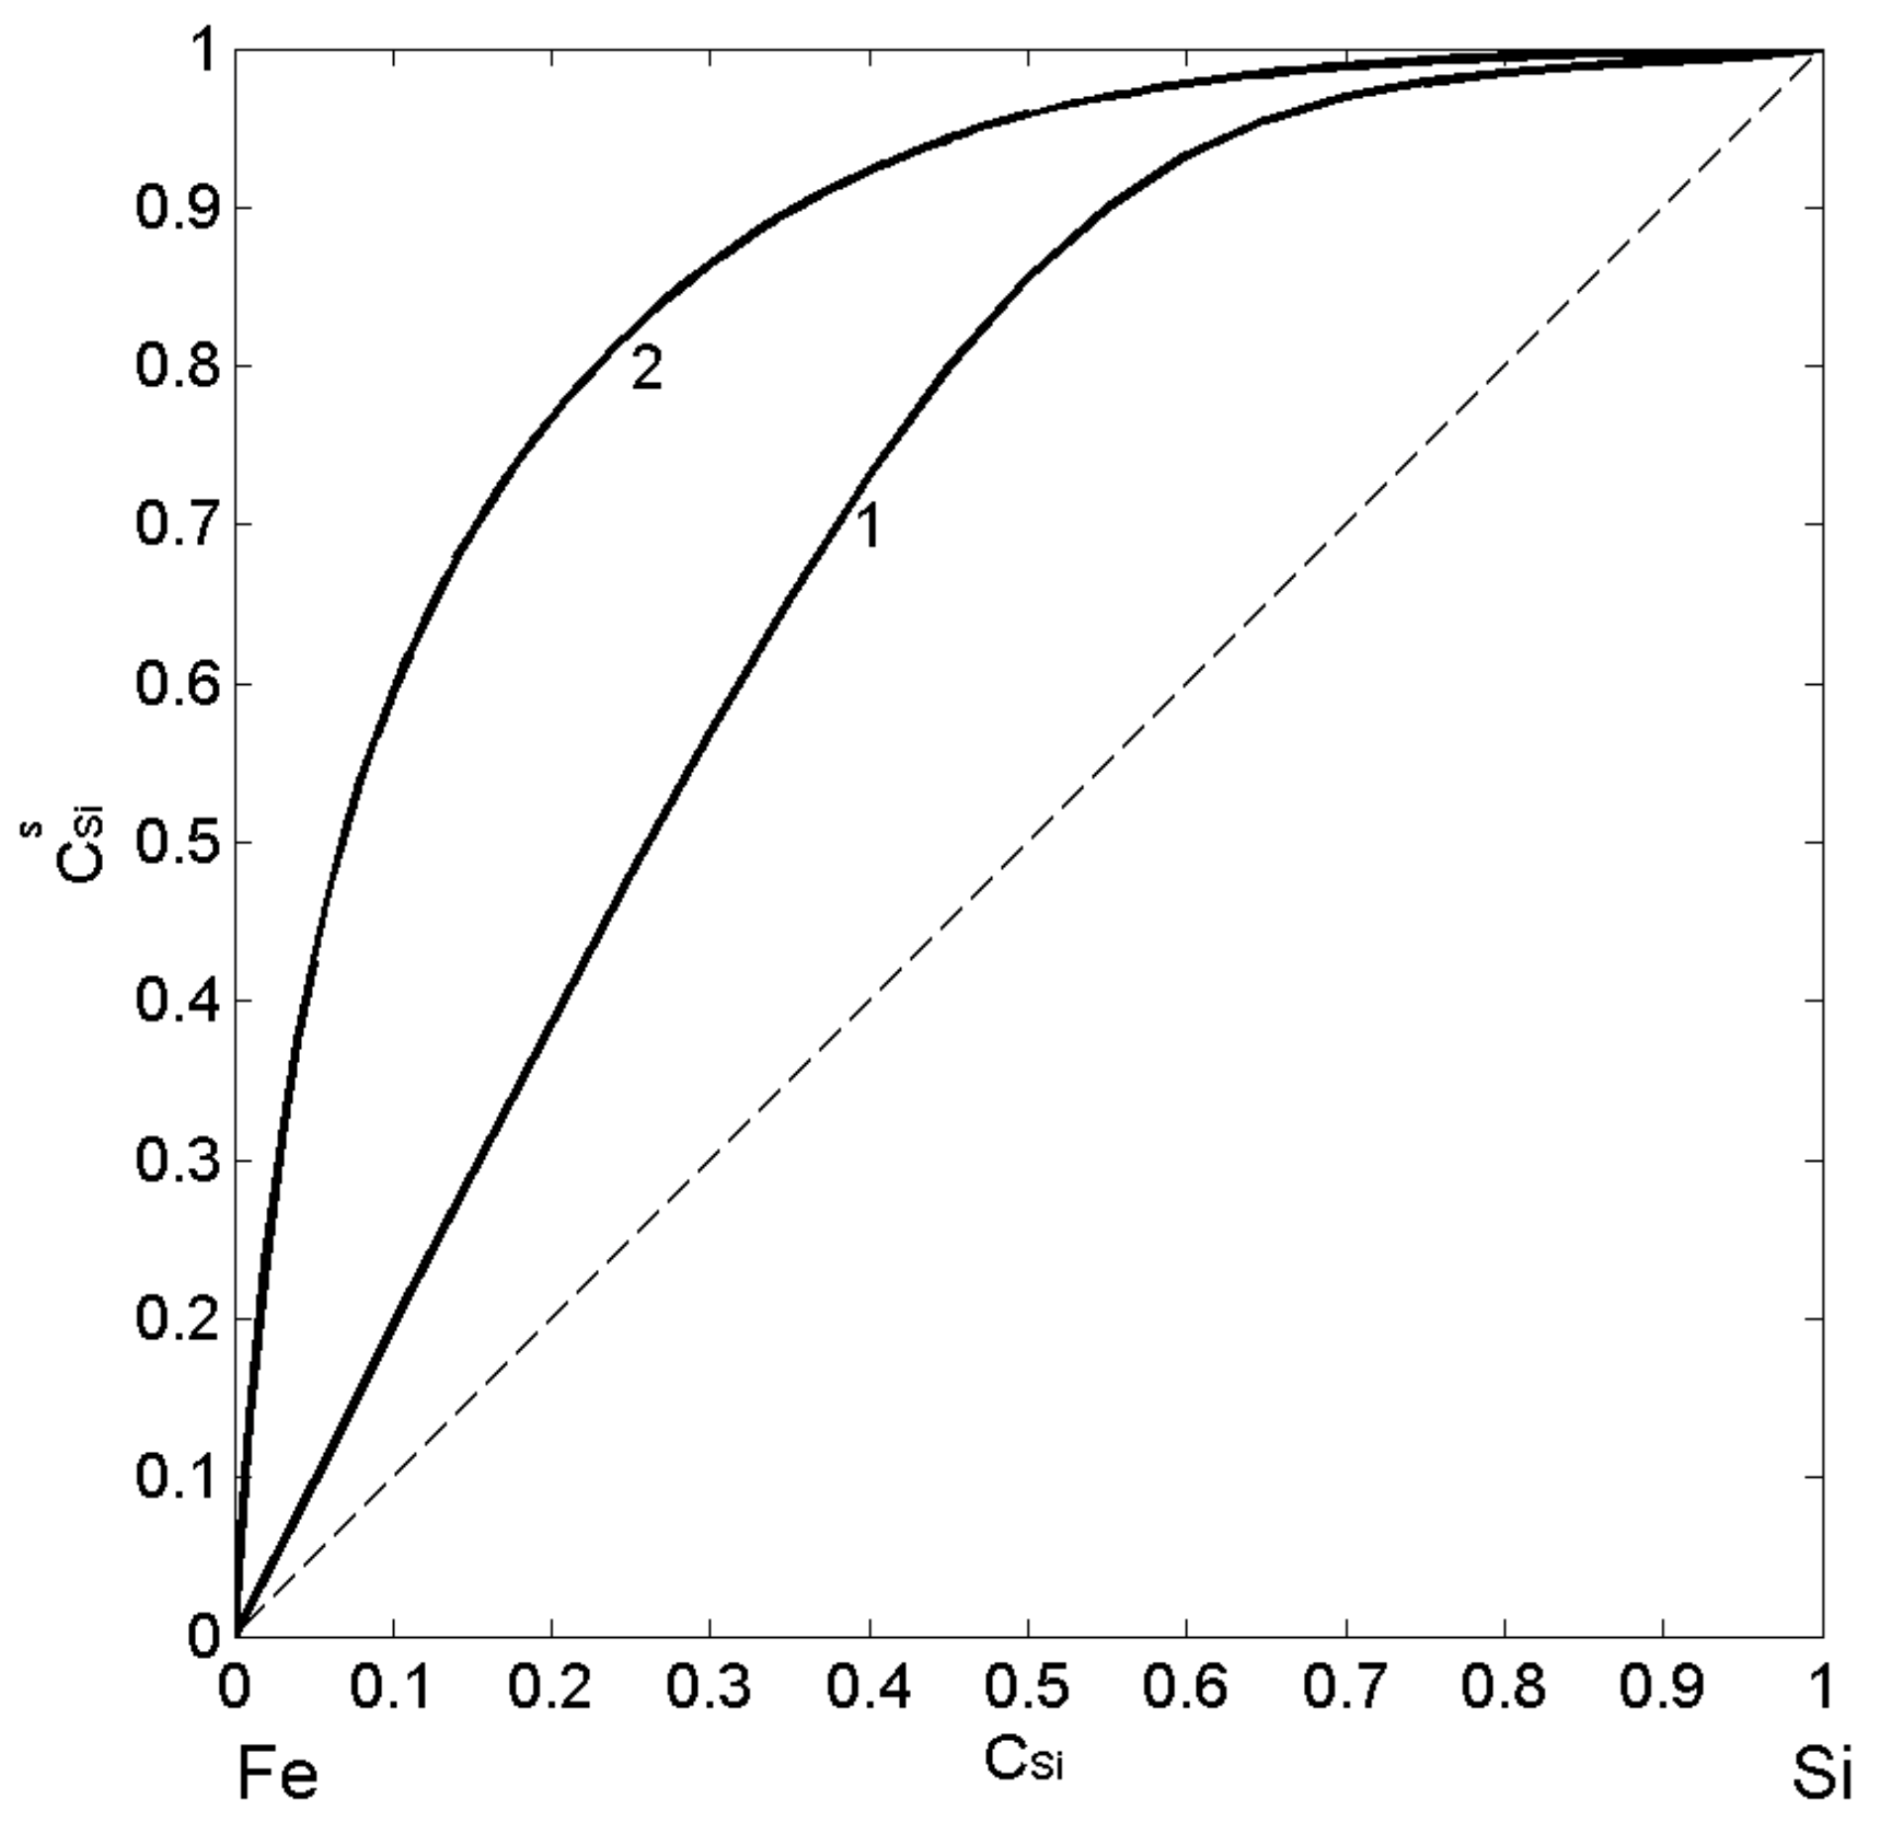
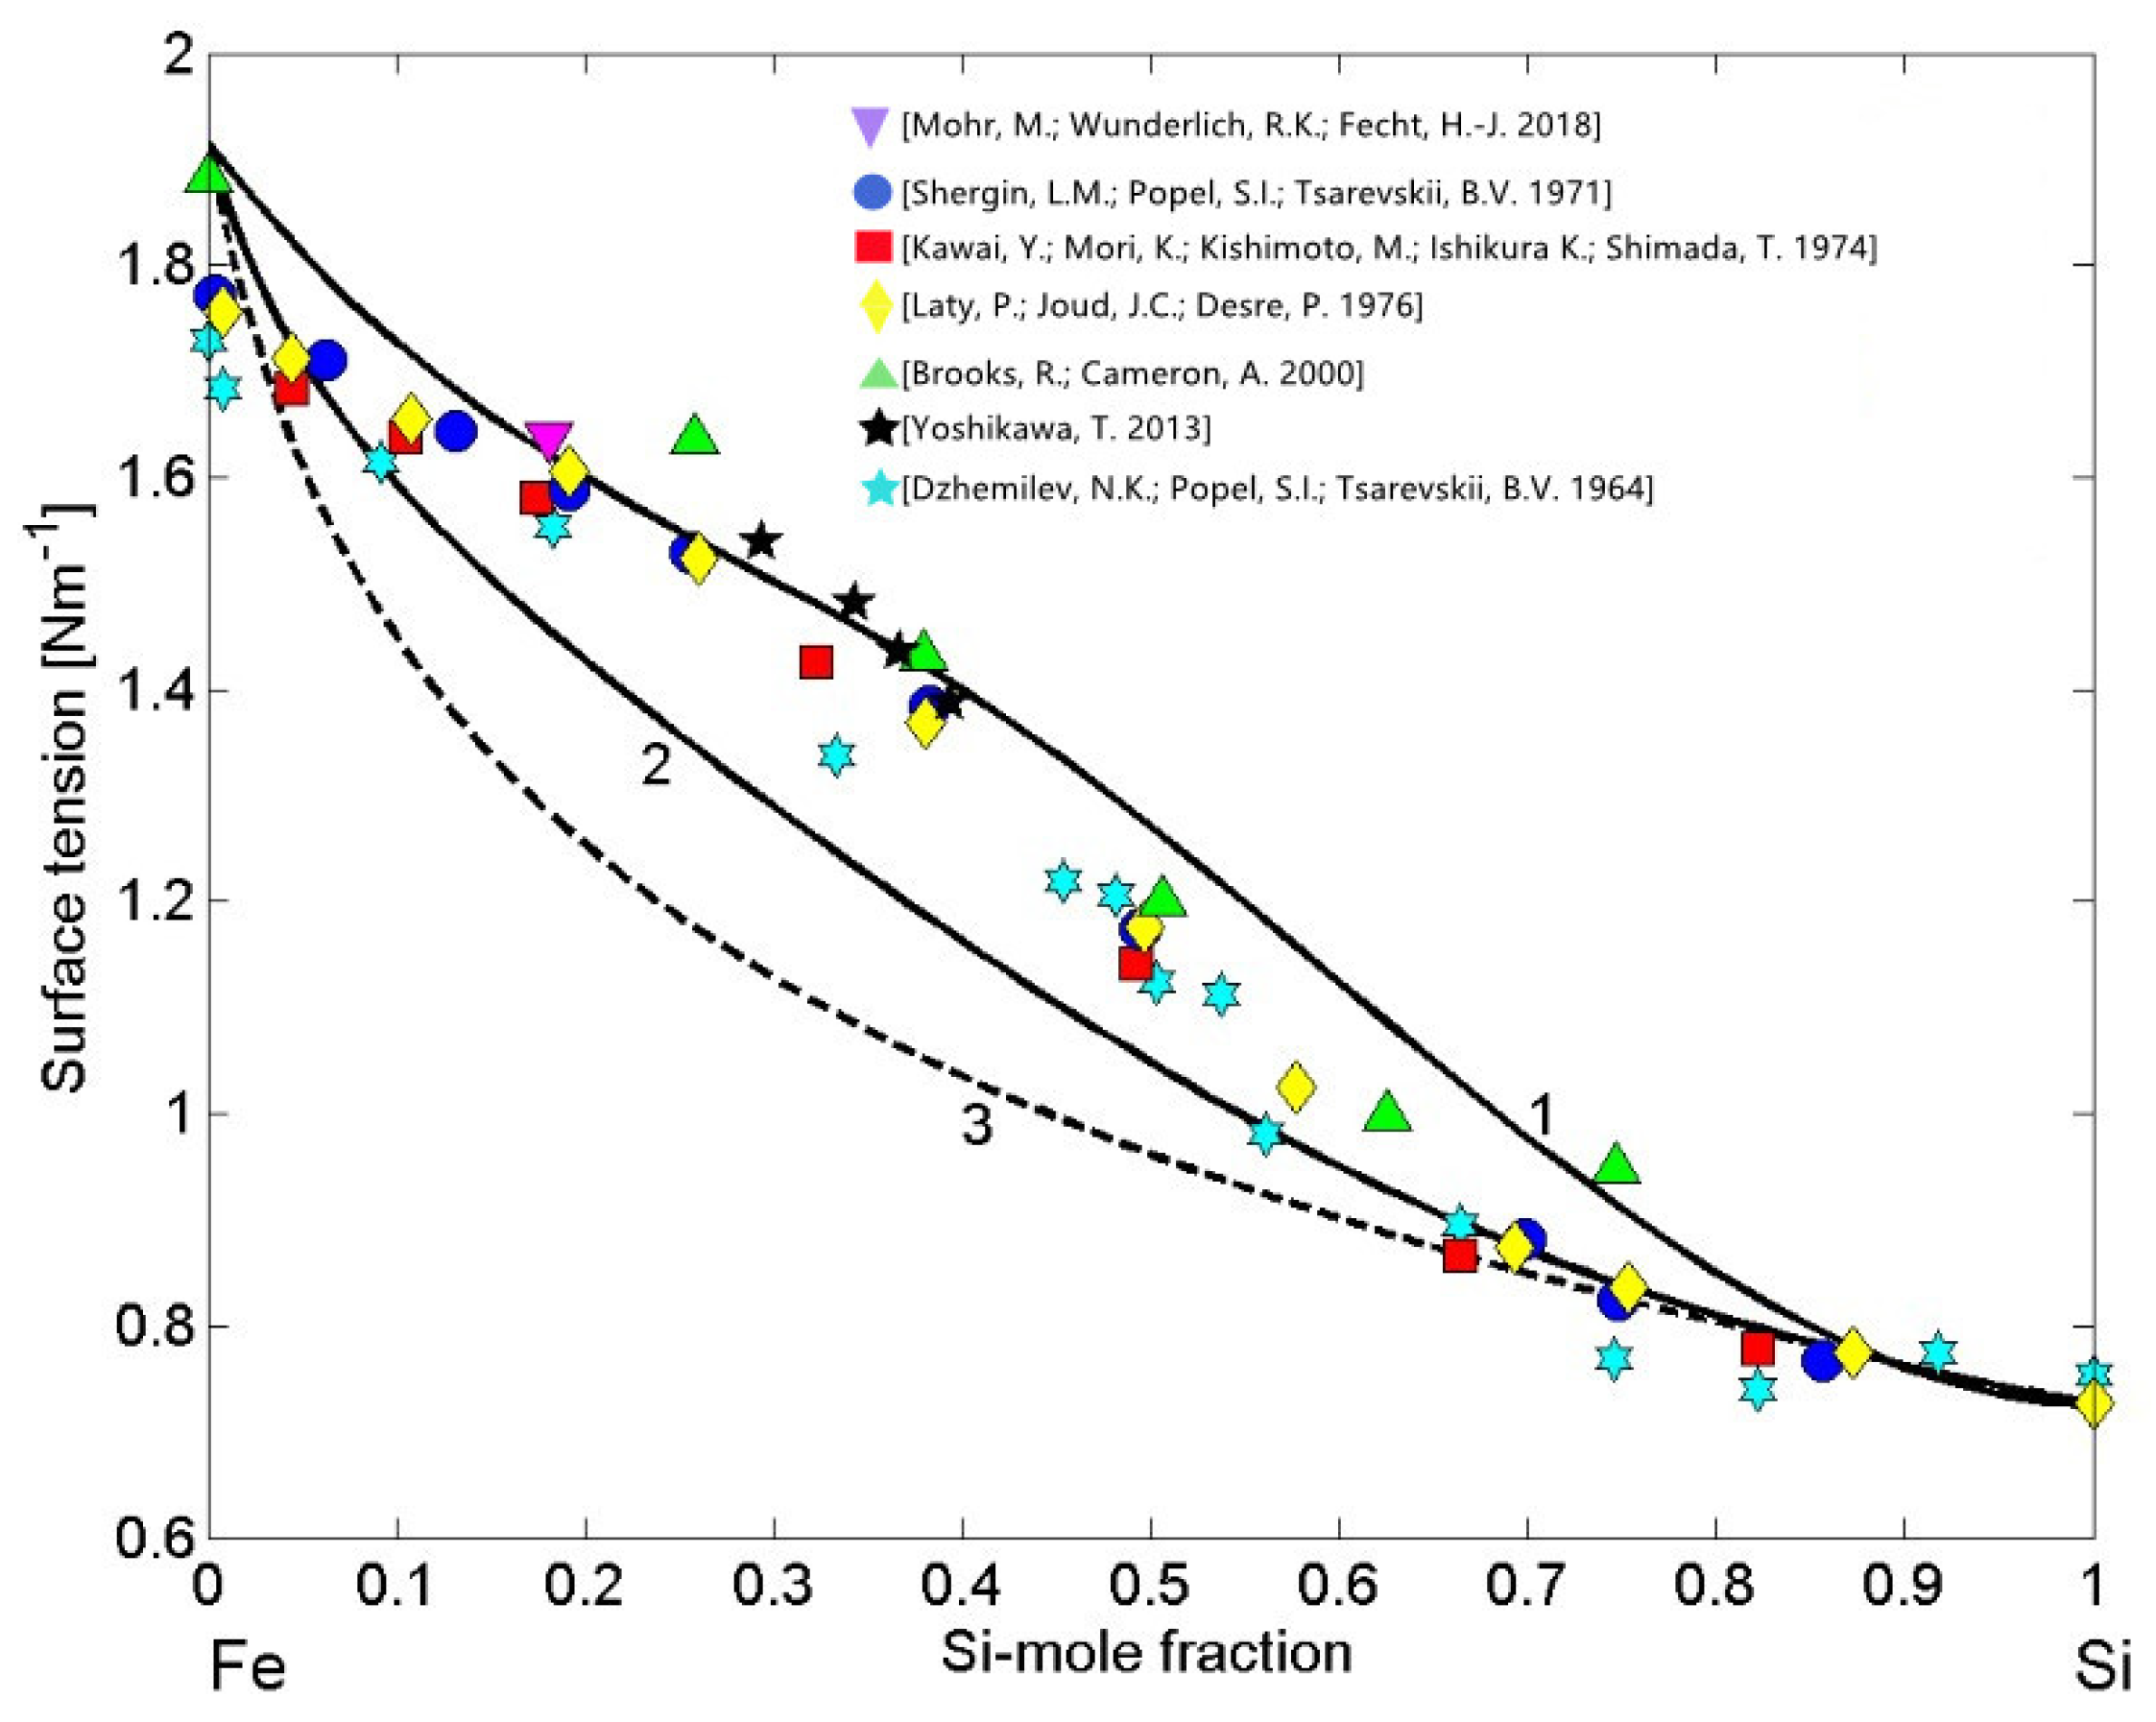
3.2.2. Compound Forming Model (CFM) and Surface Properties of Fe-Si Melts
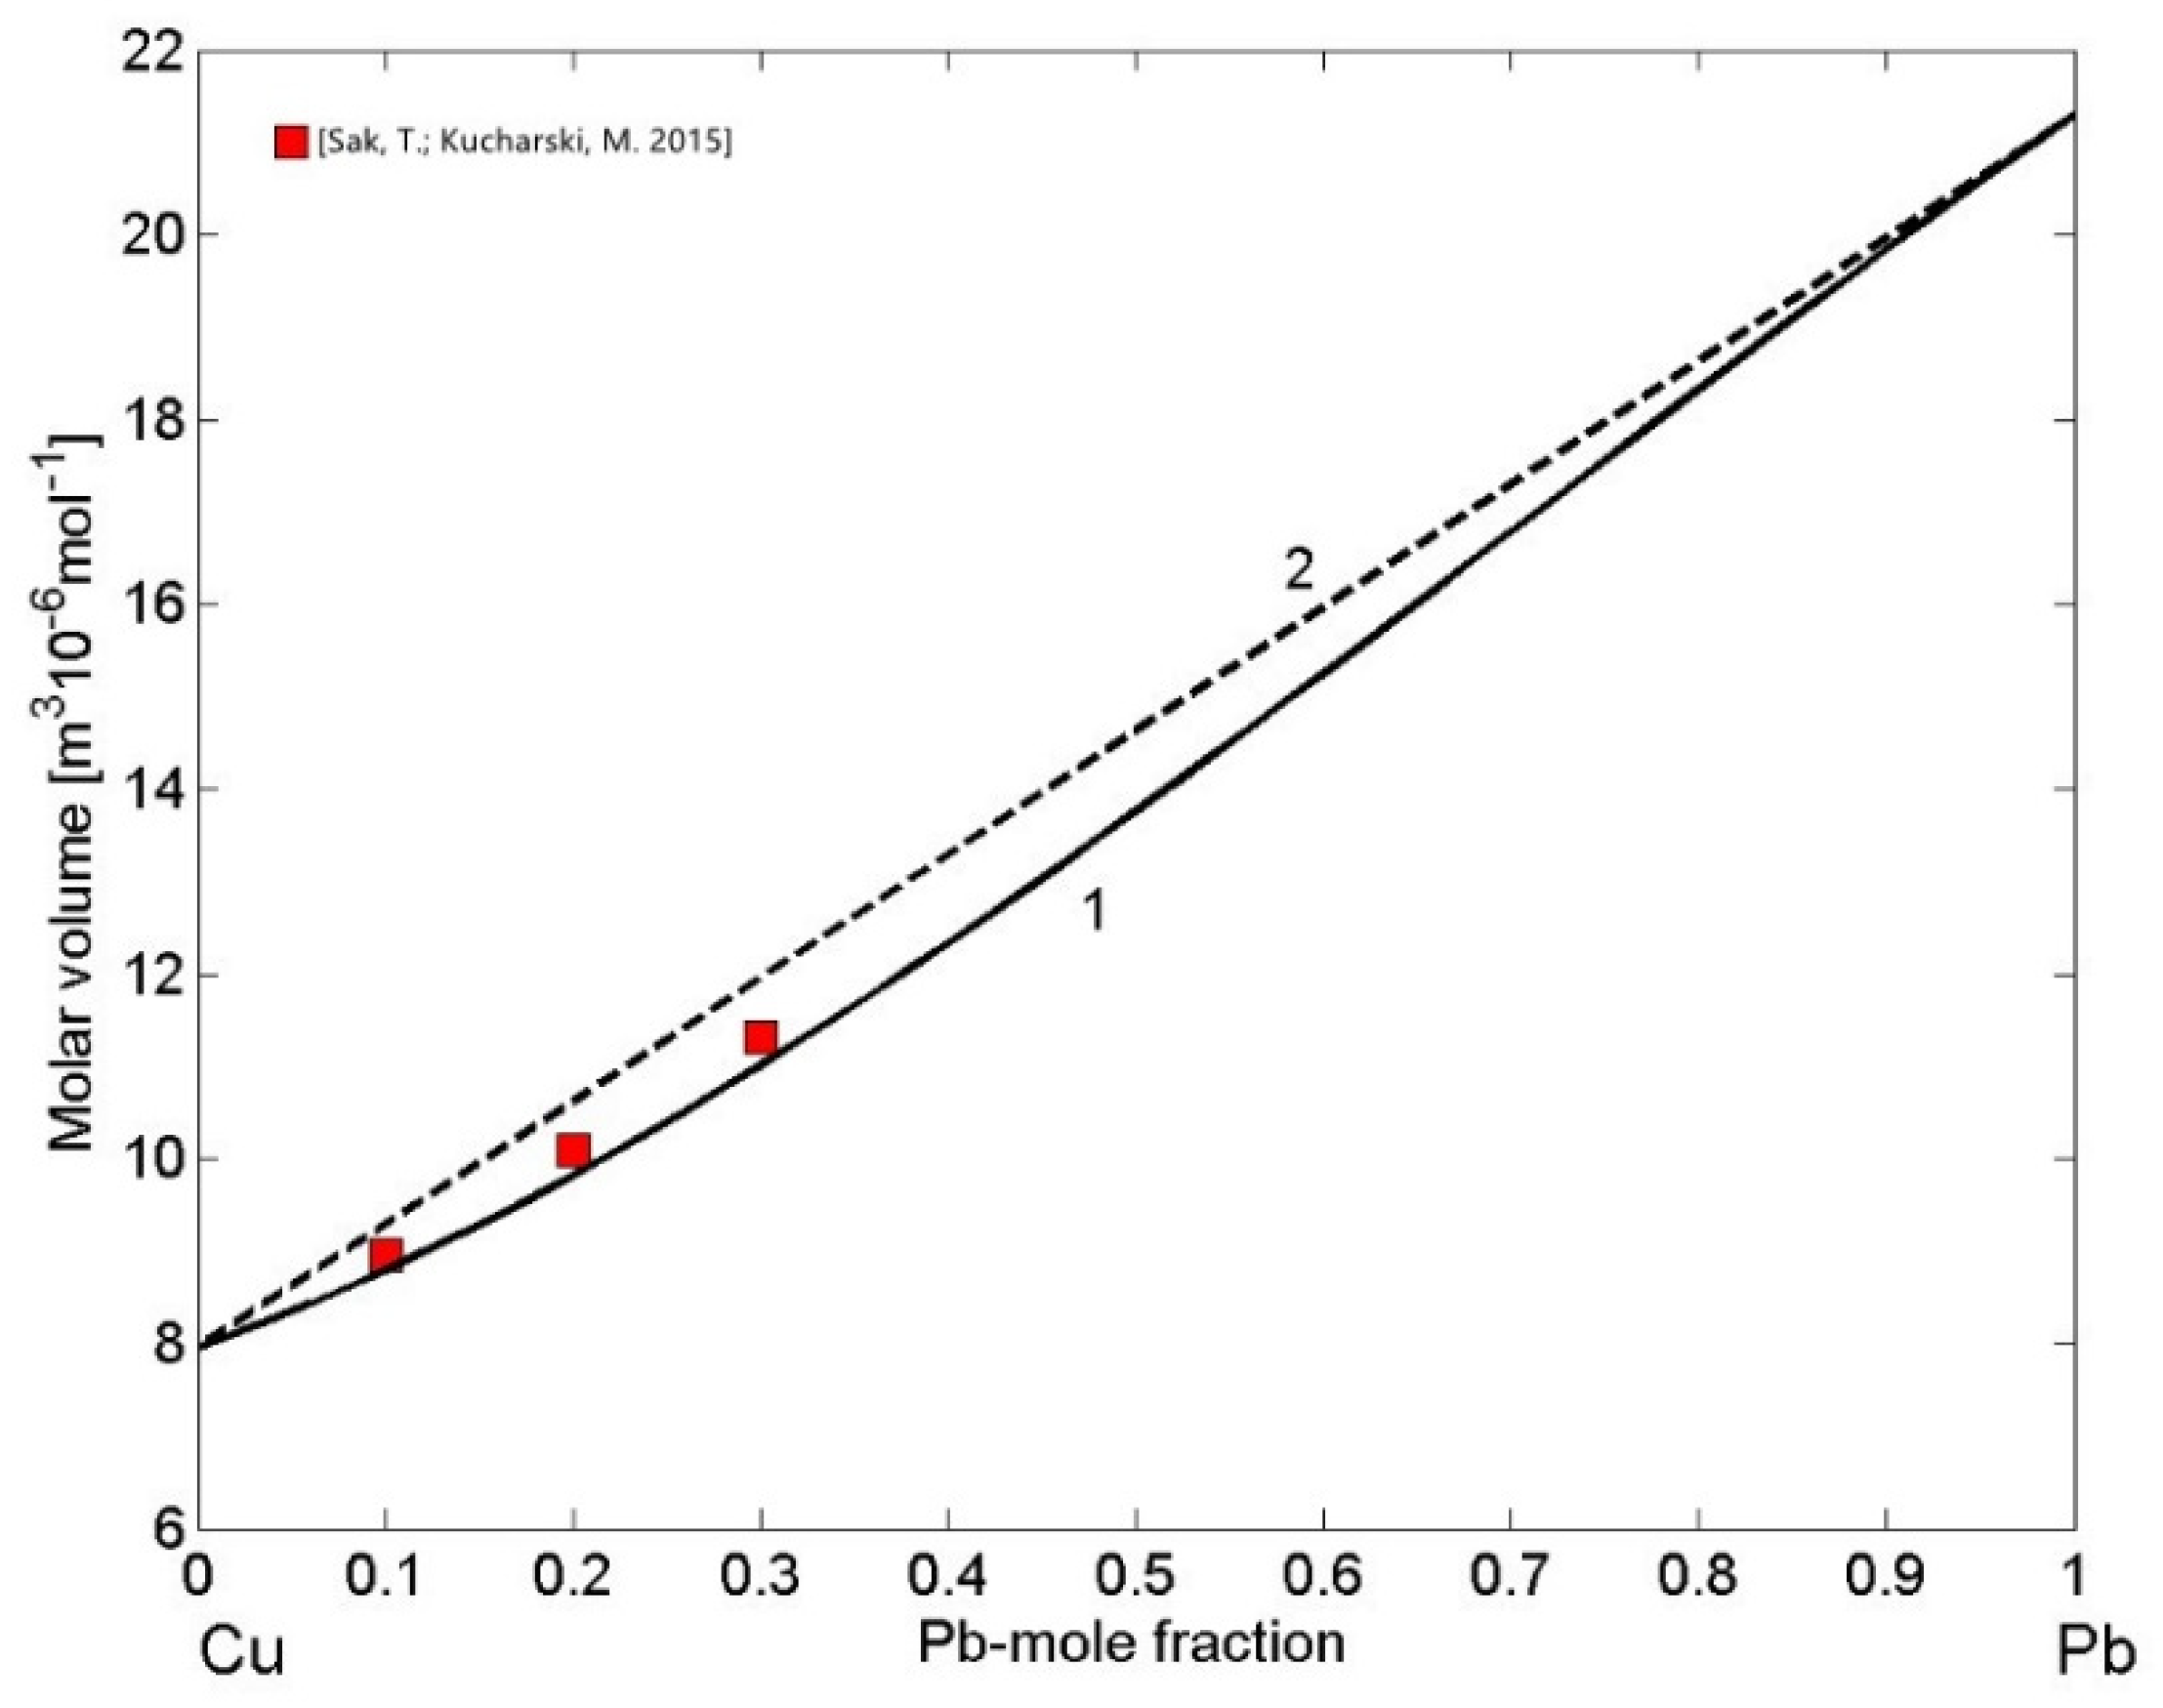
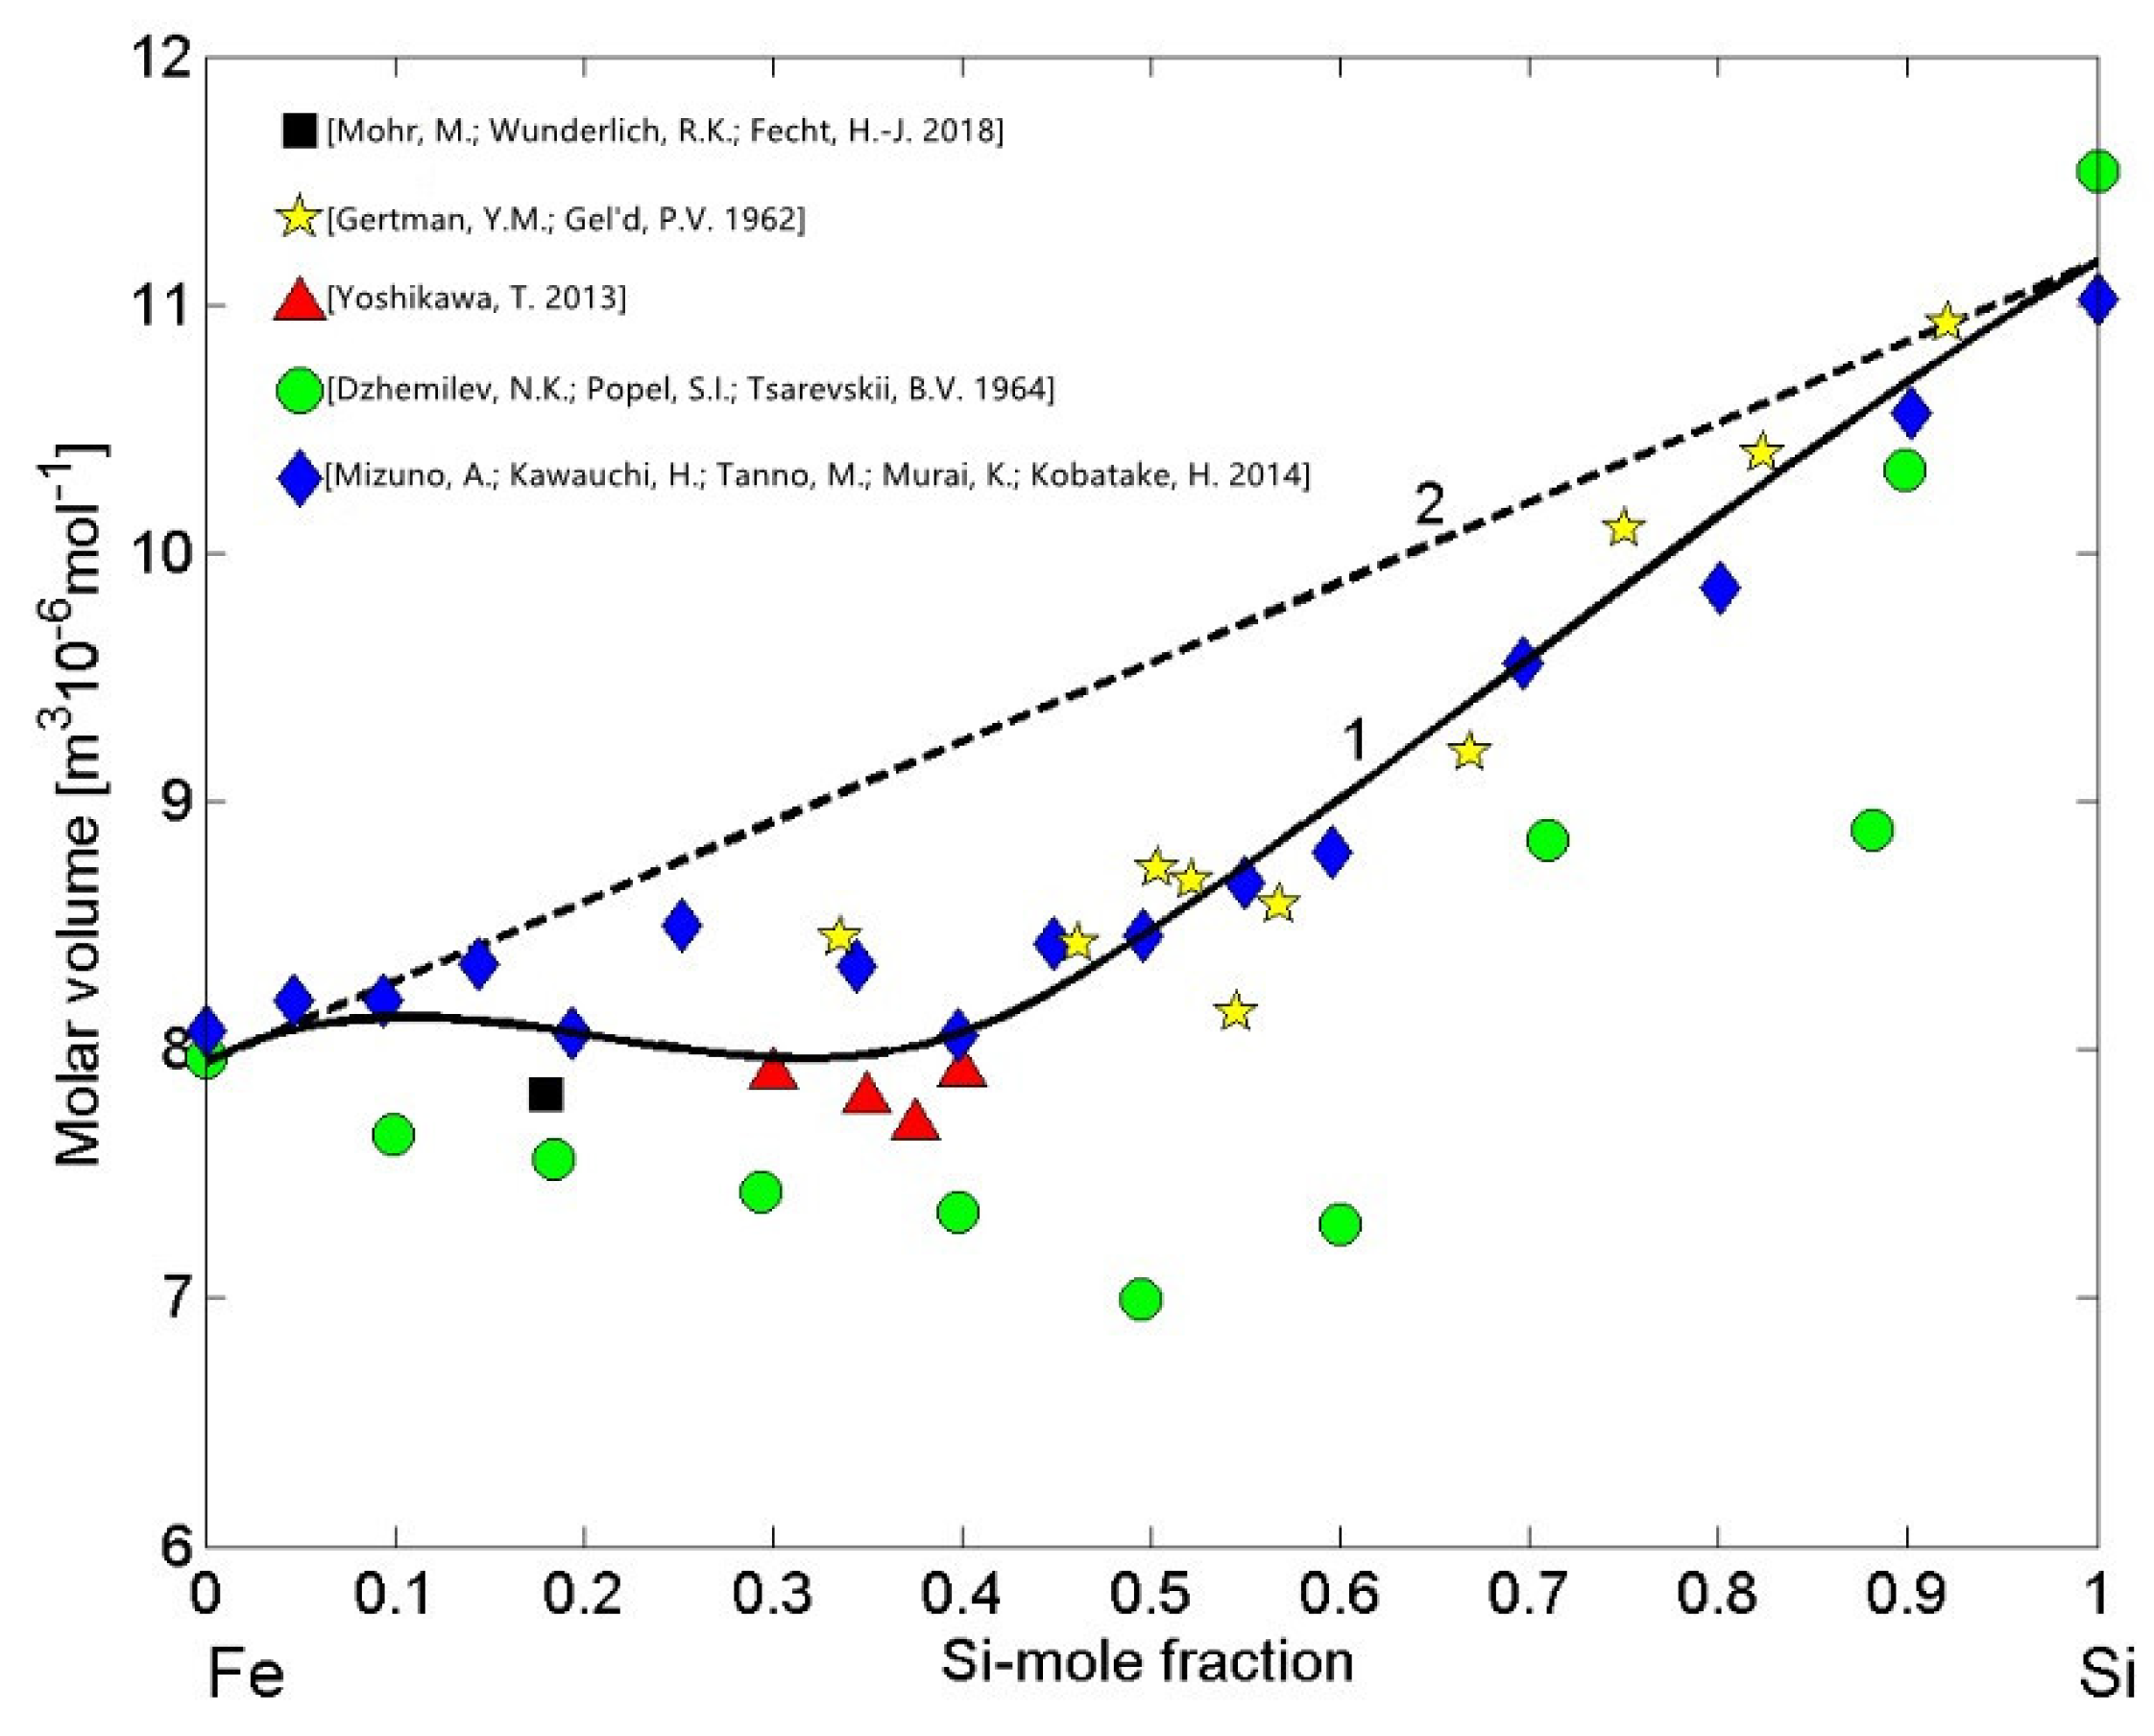
3.3. Molar Volume/Density of Cu-Pb Phase Separating and Fe-Si Compound Forming Liquid Alloys
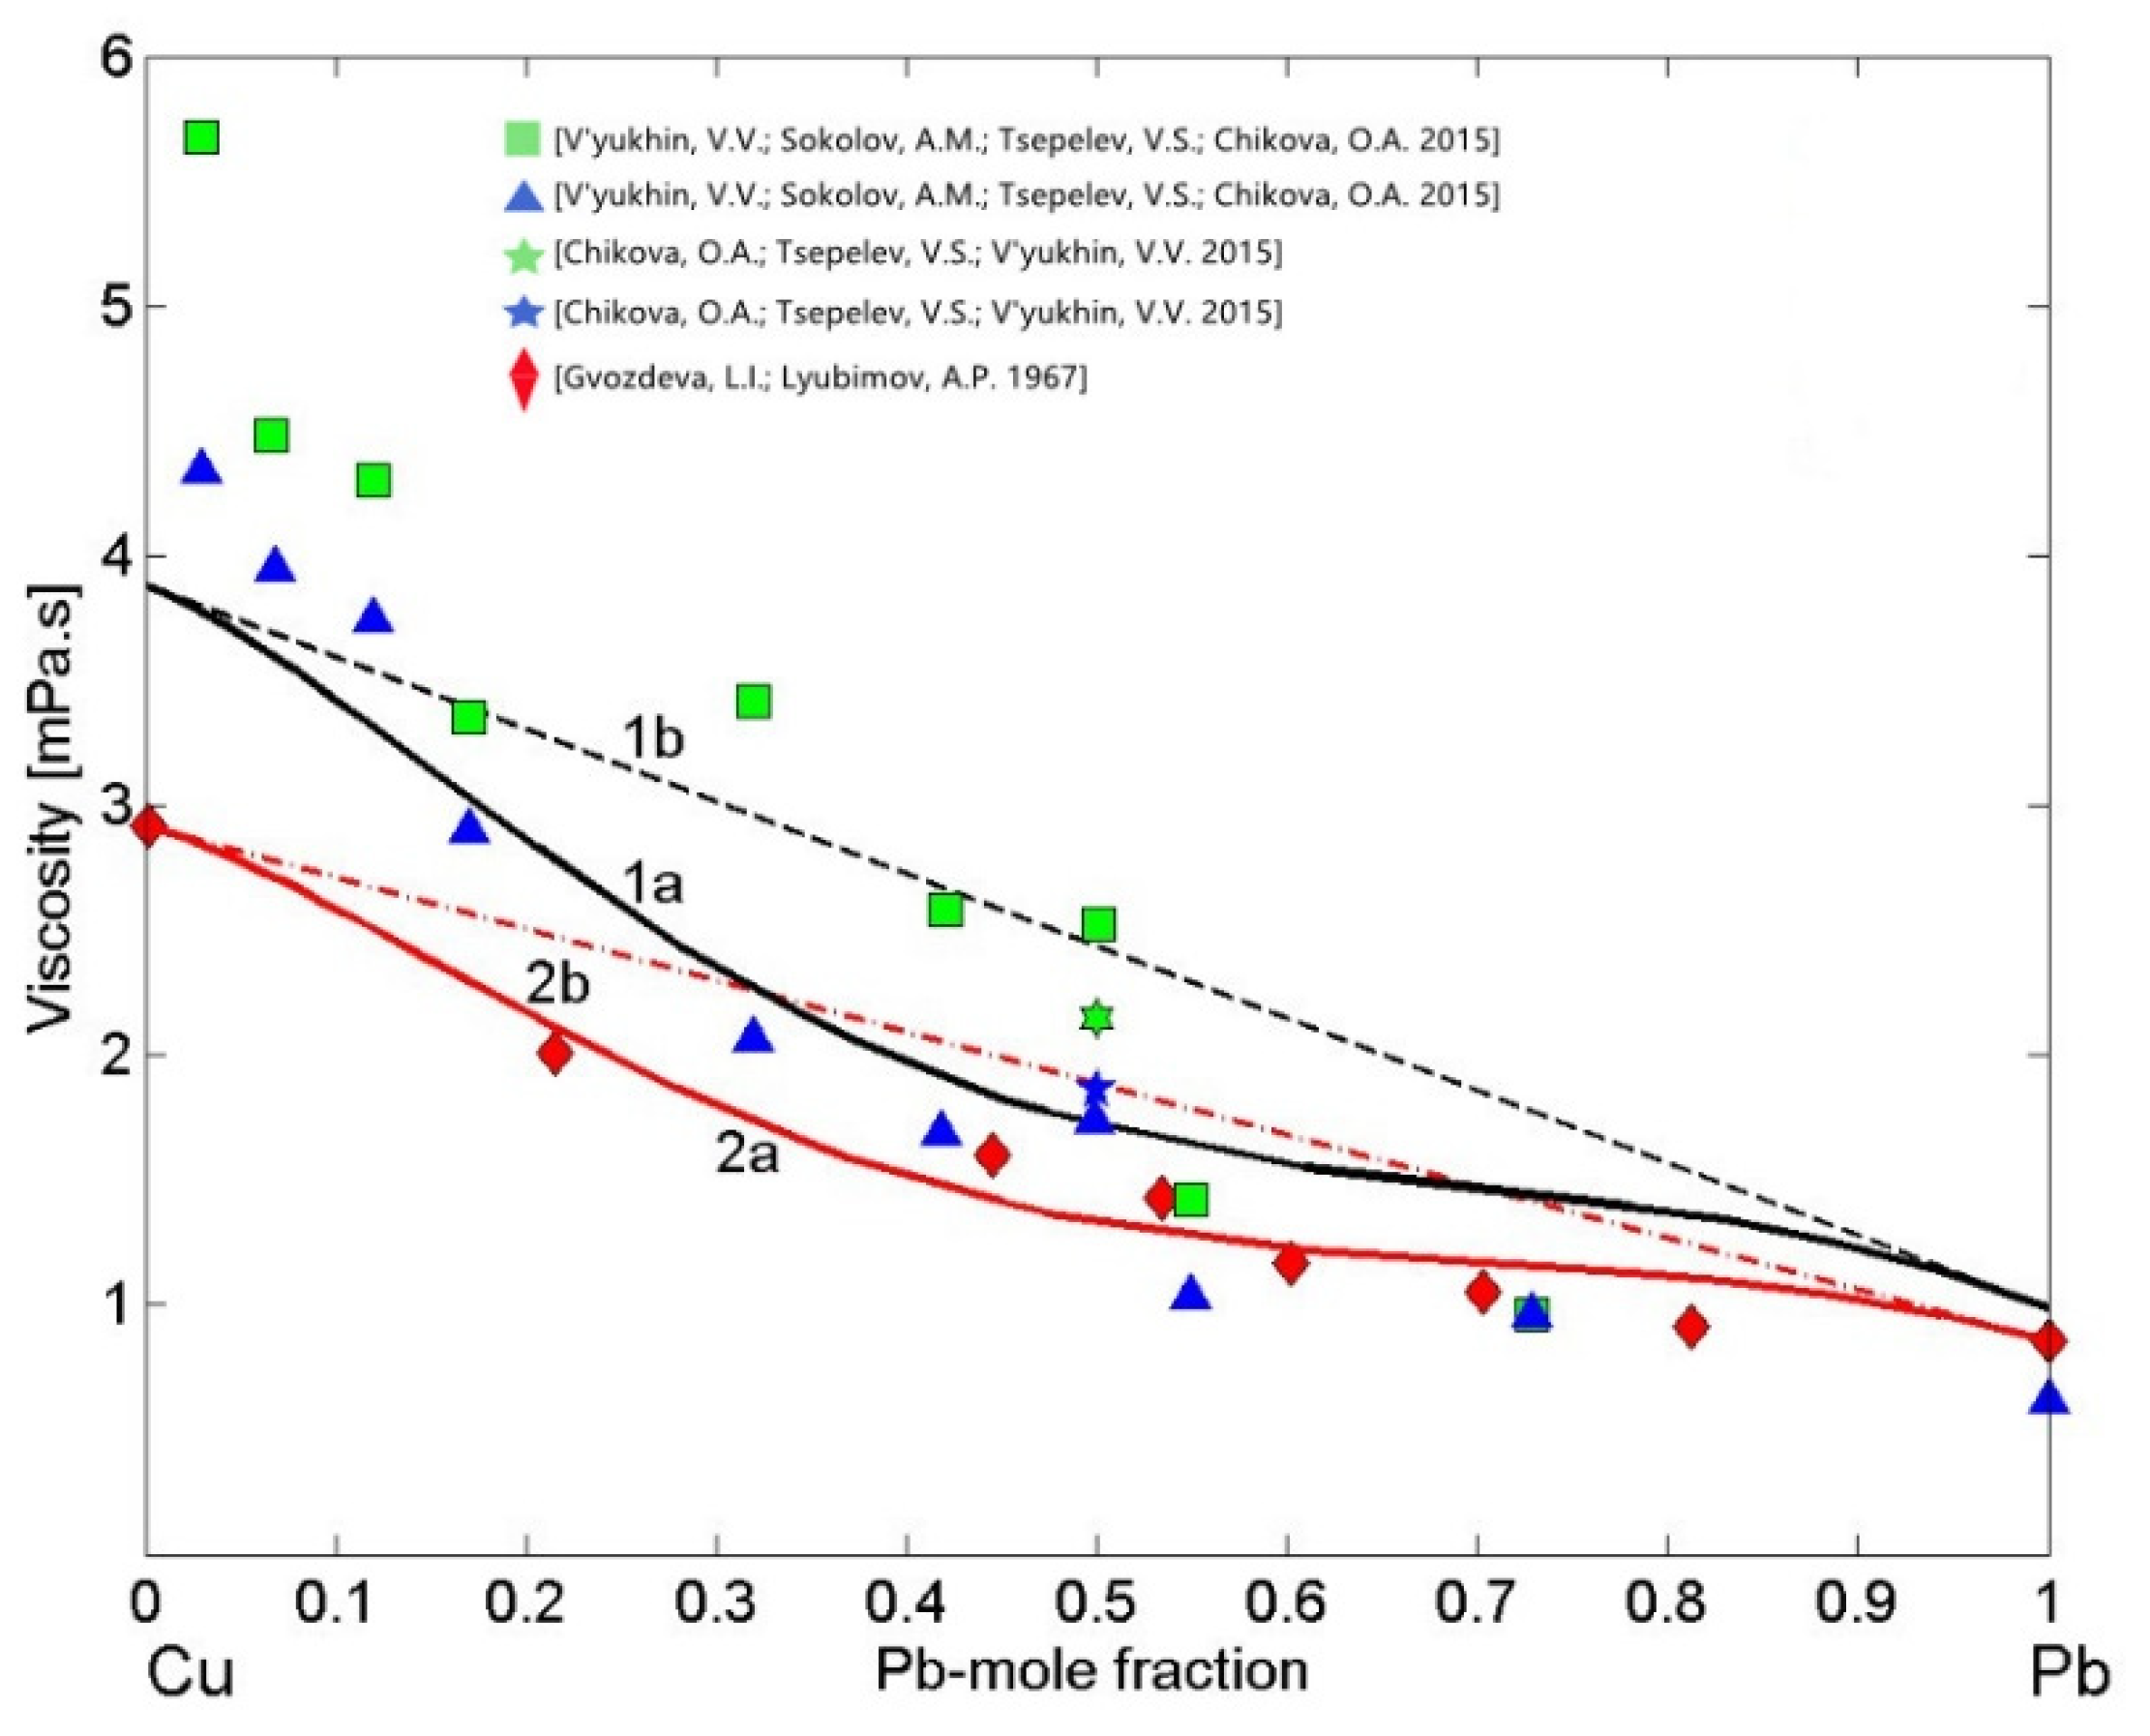
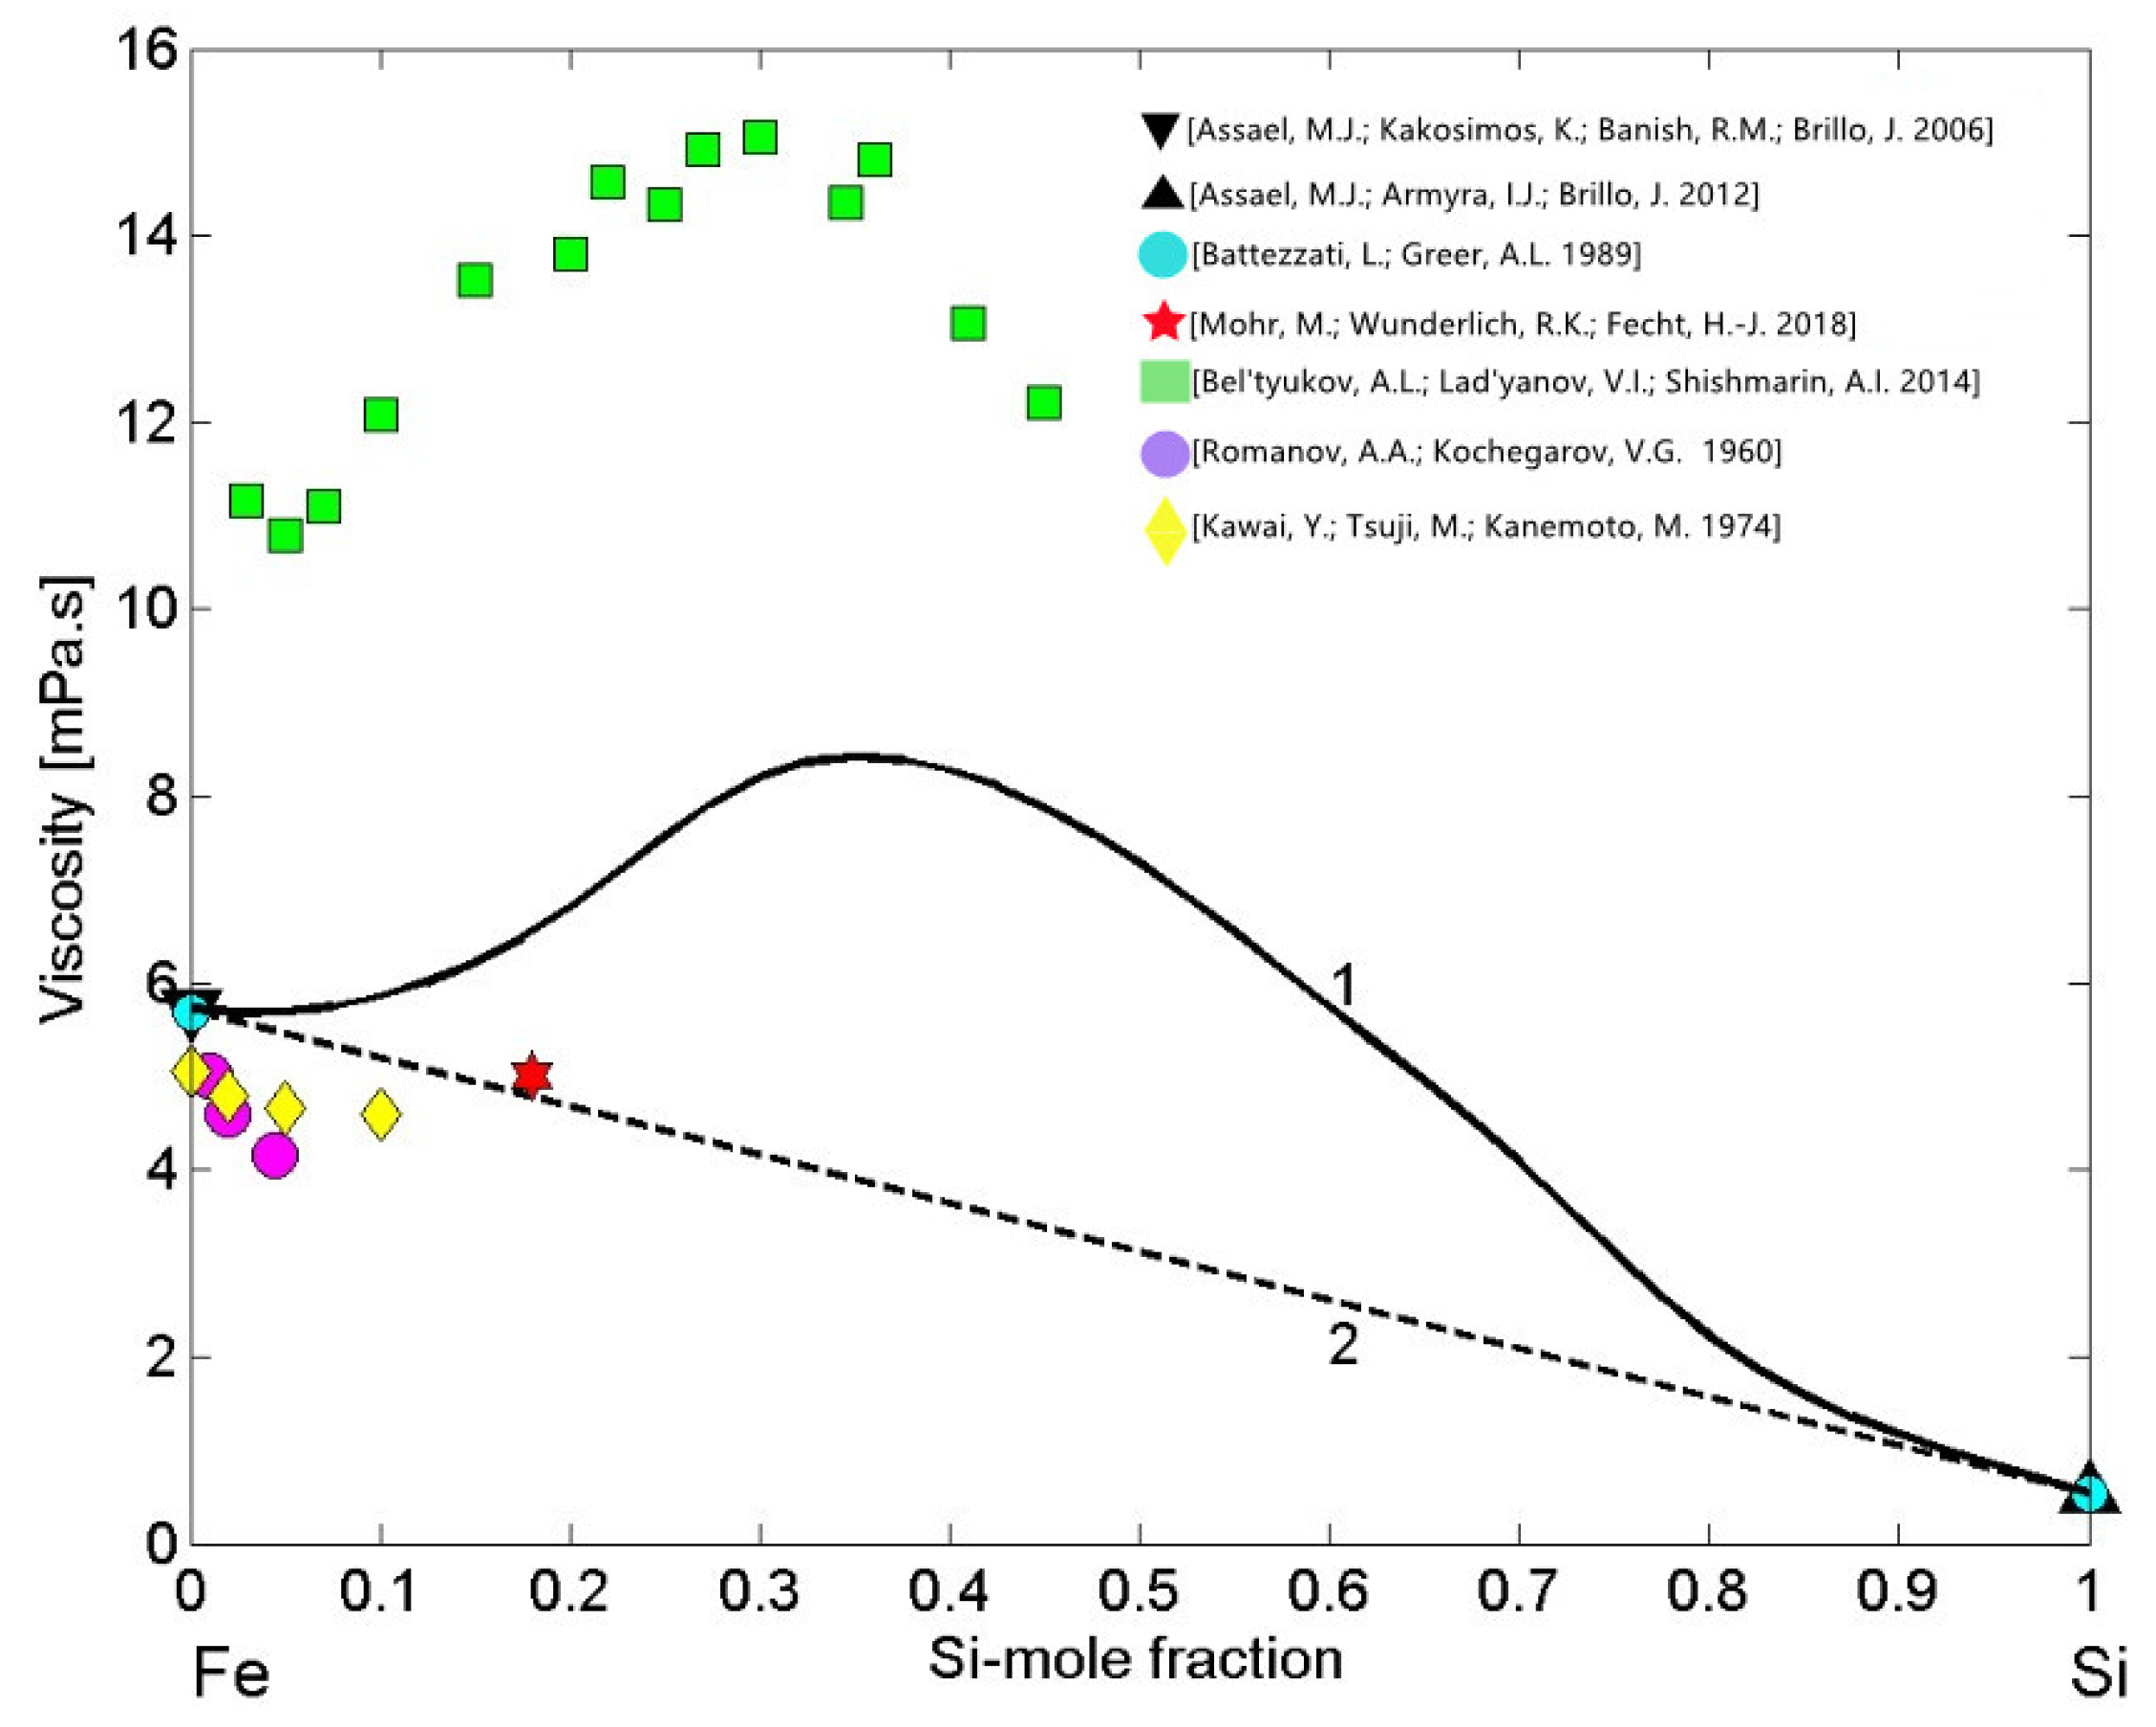
3.4. Viscosity of Cu-Pb Phase Separating and Fe-Si Compound Forming Liquid Alloys
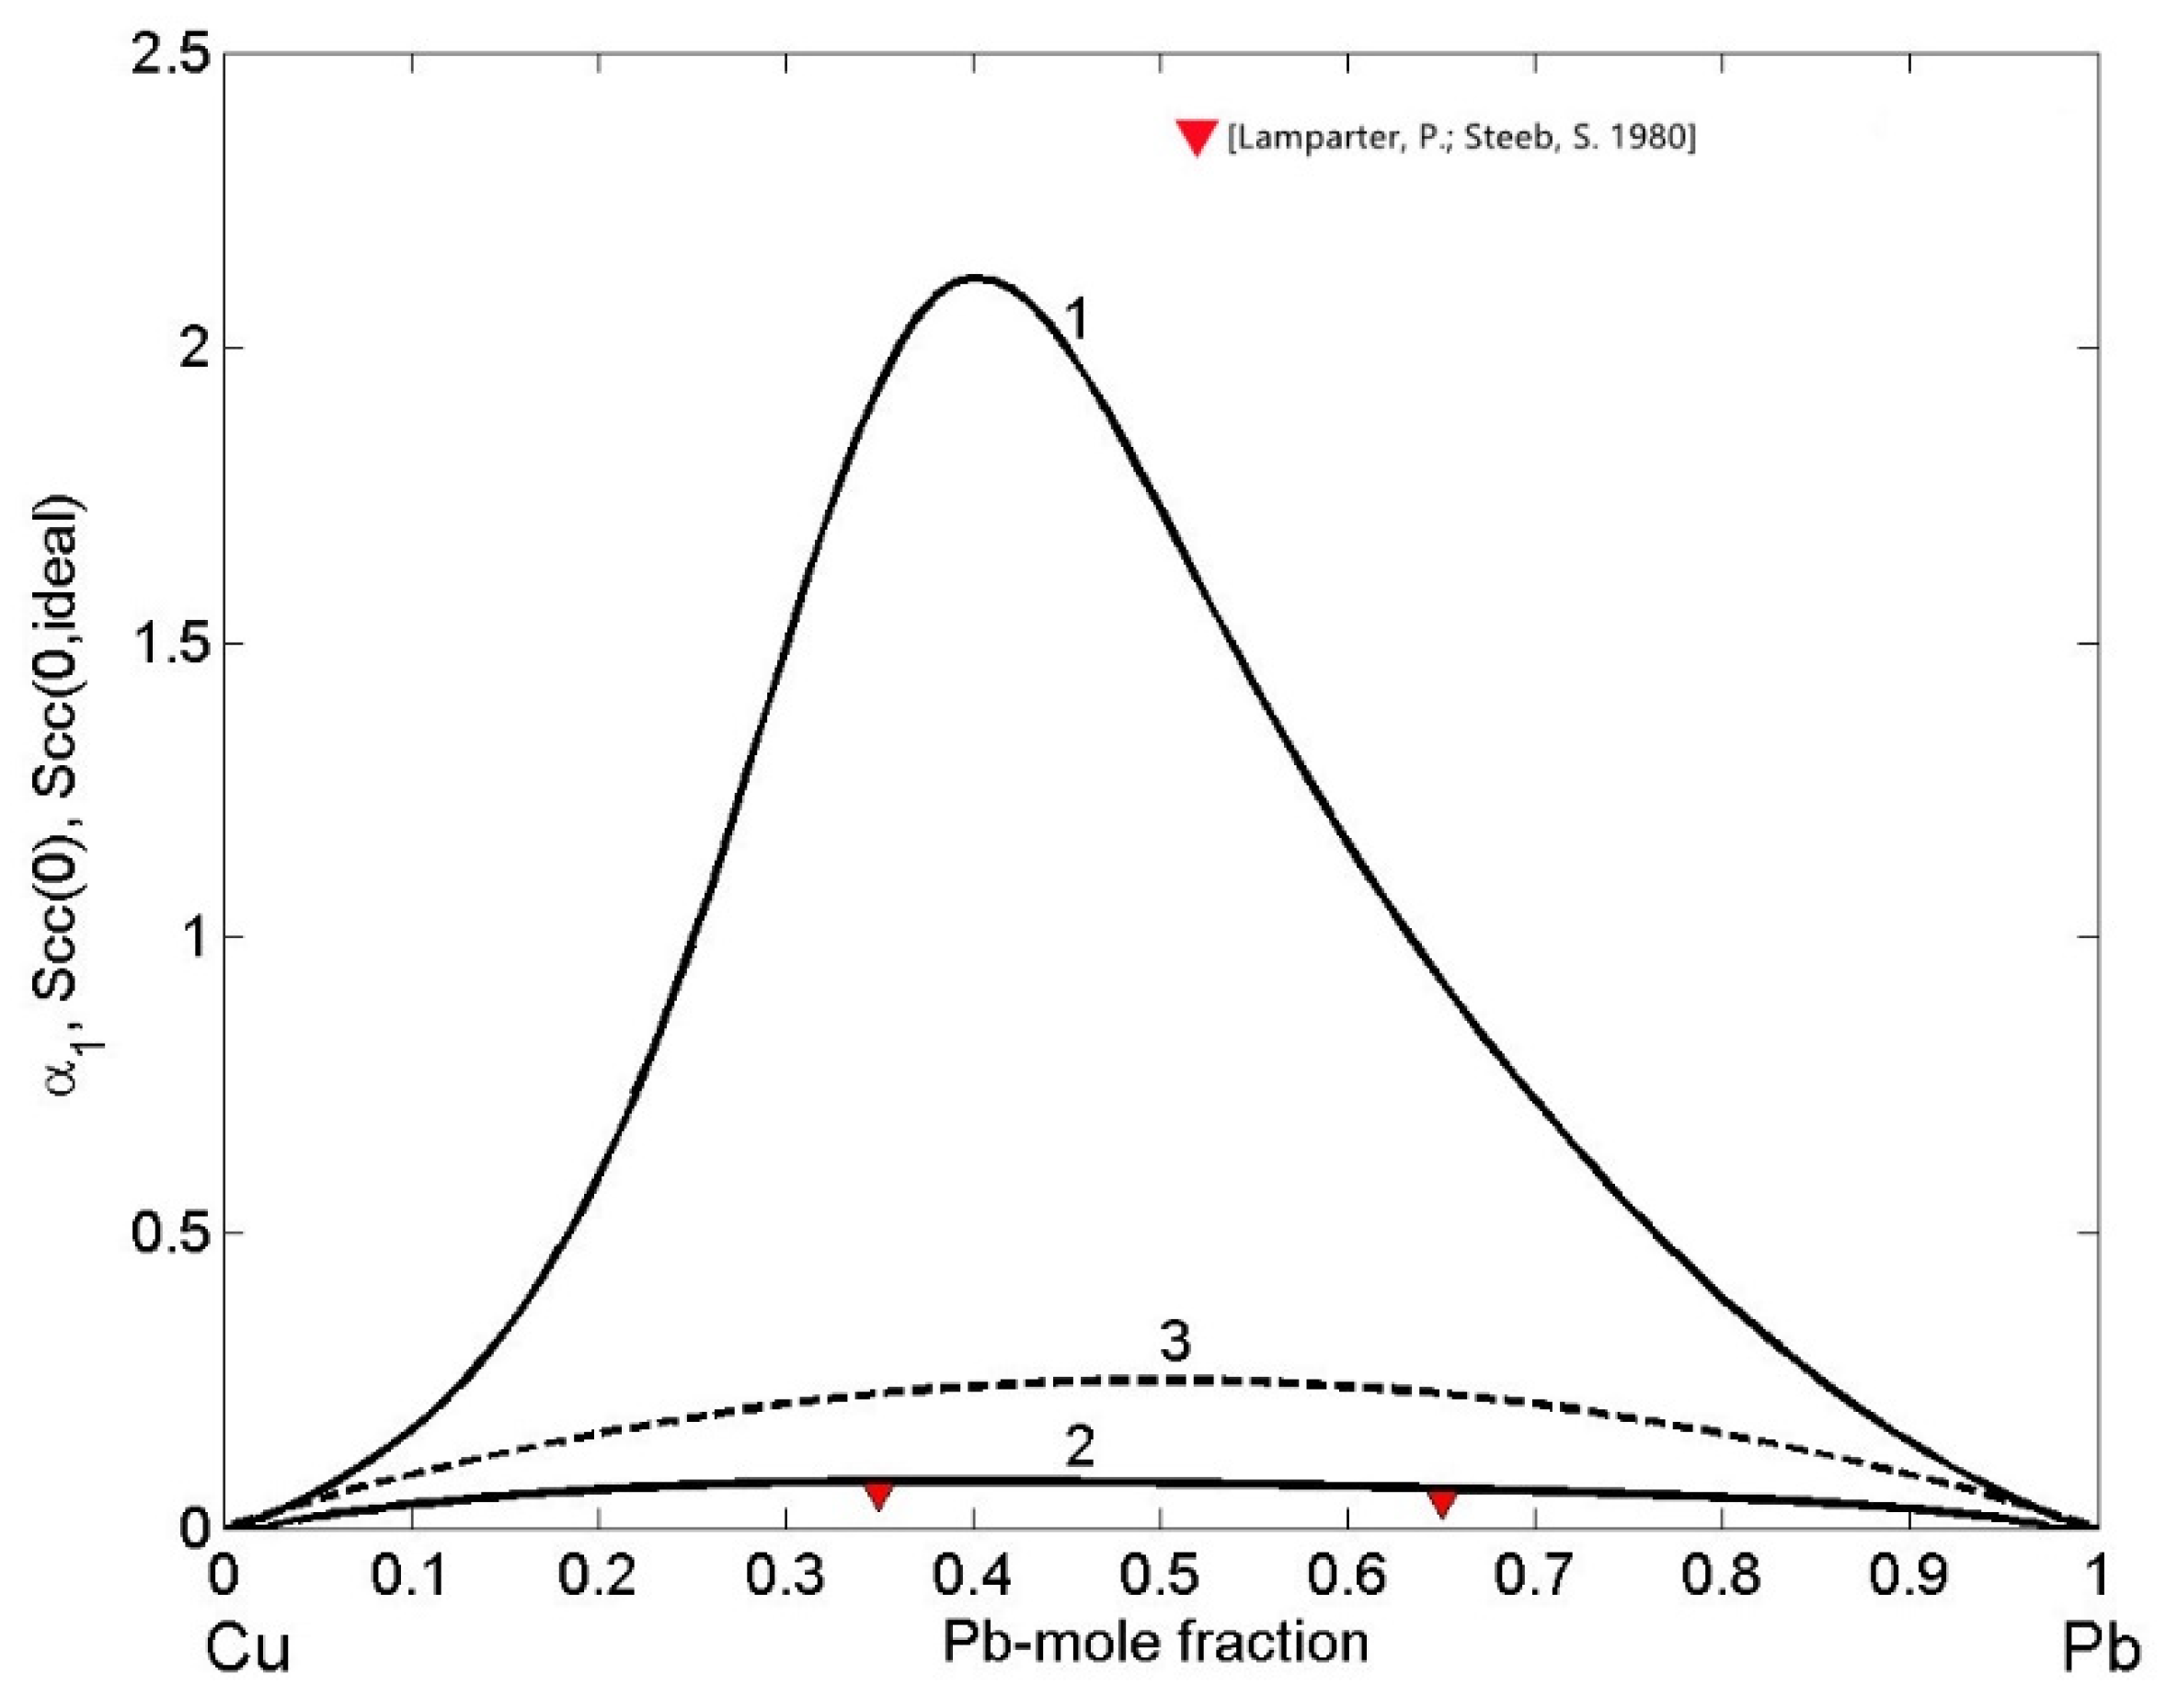
3.5. Microscopic Functions of Cu-Pb Phase Separating and Fe-Si Compound Forming Liquid Alloys
4. Conclusions
Author Contributions
Funding
Institutional Review Board Statement
Informed Consent Statement
Data Availability Statement
Acknowledgments
Conflicts of Interest
Abbreviations
| components of an alloy | |
| () | activity of component |
| () | composition of component |
| () | surface composition of component |
| energetic term of CFM | |
| Gibbs free energy of mixing | |
| excess Gibbs free energy of mixing | |
| enthalpy of mixing | |
| Boltzmann’s constant | |
| () | atomic mass of component |
| () | number of specie according to CFM in an alloy |
| Avogadro’s number | |
| surface coordination fractions | |
| gas constant | |
| surface area of an alloy | |
| concentration fluctuations in the long wavelength limit | |
| concentration fluctuations for the ideal mixing | |
| absolute temperature | |
| () | atomic volume of the component |
| excess volume | |
| volume of a liquid alloy | |
| coordination number | |
| interaction energy term of SAM | |
| () | energetic terms of CFM |
| mean surface area of an alloy | |
| () | surface area of atomic species |
| short-range order parameter | |
| auxiliary function for the bulk phase | |
| auxiliary function for the surface phase | |
| () | activity coefficient of component |
| , | composition functions of the bulk and surface phases |
| viscosity of liquid alloys | |
| () | viscosity of component |
| stoichiometric coefficients of an intermetallic | |
| density of component | |
| density of a liquid alloy | |
| surface tension of liquid alloys | |
| surface tension of pure component | |
| surface tension of pure component |
References
- Busch, R. The thermophysical properties of bulk metallic glass-forming liquids. JOM 2000, 52, 39–42. [Google Scholar] [CrossRef]
- Lu, Z.P.; Liu, C.T. A new glass-forming ability criterion for bulk metallic glasses. Acta Mater. 2002, 50, 3501–3512. [Google Scholar] [CrossRef]
- Tokunaga, T.; Ohtani, H.; Hasebe, M. Thermodynamic evaluation of the phase equilibria and glass-forming ability of the Fe-Si-B system. CALPHAD 2004, 28, 354–362. [Google Scholar] [CrossRef]
- Amore, S.; Brillo, J.; Egry, I.; Novakovic, R. Surface tension of liquid Cu-Ti binary alloys measured by electromagnetic levitation and thermodynamic modelling. Appl. Surf. Sci. 2011, 257, 7739–7745. [Google Scholar] [CrossRef]
- Laws, K.J.; Miracle, D.B.; Ferry, M. A predictive structural model for bulk metallic glasses. Nat. Commun. 2015, 6, 1–10. [Google Scholar]
- Ashby, M.F.; Bréchet, Y.J.M.; Cebon, D.; Salvo, L. Selection strategies for materials and processes. Mater. Design 2004, 25, 51–67. [Google Scholar] [CrossRef]
- Abtew, M.; Selvaduray, G. Lead-free solders in microelectronics. Mater. Sci. Eng. R 2000, 27, 95–141. [Google Scholar] [CrossRef]
- Novakovic, R.; Giuranno, D.; Ricci, E.; Delsante, S.; Li, D.; Borzone, G. Bulk and surface properties of liquid Sb-Sn alloys. Surf. Sci. 2011, 605, 248–255. [Google Scholar] [CrossRef]
- Giuranno, D.; Delsante, S.; Borzone, G.; Novakovic, R. Effects of Sb addition on the properties of Sn-Ag-Cu/(Cu, Ni) solder systems. J. Alloys Compd. 2016, 689, 918–930. [Google Scholar] [CrossRef]
- Fecht, H.J. The ThermoLab project: High-precision thermophysical property data of liquid metals for modelling of industrial solidification processes. High Temp. Mater. Proc. 2008, 27, 385–388. [Google Scholar] [CrossRef]
- Novakovic, R.; Mohr, M.; Giuranno, D.; Ricci, E.; Brillo, J.; Wunderlich, R.; Egry, I.; Plevachuk, Y.; Fecht, H.-J. Surface Properties of Liquid Al-Ni Alloys: Experiments Vs Theory. Microgravity Sci. Technol. 2020, 32, 1049–1064. [Google Scholar] [CrossRef]
- Ricci, E.; Giuranno, D.; Novakovic, R.; Matsushita, T.; Seetharaman, S.; Brooks, R.; Chapman, L.; Quested, P. Density, Surface Tension, and Viscosity of CMSX-4 Superalloy. Int. J. Thermophys. 2007, 28, 1304–1321. [Google Scholar] [CrossRef]
- Keller, T.; Lindwall, G.; Ghosh, S.; Ma, L.; Lane, B.M.; Zhang, F.; Kattner, U.R.; Lass, E.A.; Heigel, J.C.; Idell, Y.; et al. Application of finite element, phase-field, and CALPHAD-based methods to additive manufacturing of Ni-based superalloys. Acta Mater. 2017, 139, 244–253. [Google Scholar] [CrossRef]
- Wunderlich, R.K.; Hecht, U.; Hediger, F.; Fecht, H.-J. Surface Tension, viscosity, and selected thermophysical properties of Ti48Al48Nb2Cr2, Ti46Al46Nb8, and Ti46Al46Ta8 from microgravity experiments. Adv. Eng. Mater. 2018, 20, 1–9. [Google Scholar] [CrossRef]
- Benetti, G.; Cavaliere, E.; Brescia, R.; Salassi, S.; Ferrando, R.; Vantomme, A.; Pallecchi, L.; Pollini, S.; Boncompagni, S.; Fortuni, B.; et al. Tailored Ag-Cu-Mg multielemental nanoparticles for wide-spectrum antibacterial coating. Nanoscale 2019, 11, 1626–1635. [Google Scholar] [CrossRef]
- Mohr, M.; Wunderlich, R.; Novakovic, R.; Ricci, E.; Fecht, H.-J. Precise measurements of thermophysical properties of liquid Ti-6Al-4V (Ti64) alloy on board the international space station. Adv. Eng. Mater. 2020, 20, 1–10. [Google Scholar]
- Joint Committee for Guides in Metrology (JCGM/WG1), GUM 1995 with Minor Corrections, Evaluation of Measurement Data-Guide to the Expression of Uncertainty in Measurement, 1st ed. September 2008, JCGM 2008. pp. 1–120. Available online: https://www.bipm.org/documents/20126/2071204/JCGM_100_2008_E.pdf/cb0ef43f-baa5-11cf-3f85-4dcd86f77bd6 (accessed on 1 January 2022).
- Mohr, M.; Wunderlich, R.K.; Fecht, H.-J. Surface Tension and Viscosity of Fe-10%Si Measured by the Oscillating Drop Method in an Electromagnetic Levitation Device on Board a Parabolic Flight Airplane, DLR ThermoLab Project 50WM1759, ESA ThermoProp Project. August 2018, pp. 1–7. Available online: https://www.preprints.org/manuscript/202201.0391/v1 (accessed on 25 July 2018).
- Tanaka, T.; Hack, K.; Iida, T.; Hara, S. Application of thermodynamic databases to the evaluation of surface tensions of molten alloys, salt mixtures and oxide mixtures. Z. Metallkd. 1996, 87, 380–389. [Google Scholar] [CrossRef]
- Iida, T.; Guthrie, R.I.L. The Thermophysical Properties of Liquid Metals, Fundamentals, 1st ed.; University Press: Oxford, UK, 2015; pp. 1–353. [Google Scholar]
- Singh, R.N.; March, N.H. Principles. In Intermetallic Compounds. Principles and Practice, 1st ed.; Westbrook, J.H., Fleischer, R.L., Eds.; John Wiley & Sons: New York, NY, USA, 1995; pp. 661–686. [Google Scholar]
- Lamparter, P.; Steeb, S. Structure factors of liquid Cu-Pb alloys by neutron diffraction. Z. Naturforsch. 1980, 35a, 1178–1181. [Google Scholar] [CrossRef]
- Steeb, S.; Falch, S.; Lamparter, P. Structur und thermisches Verhalten rasch abgeschreckter Legirungen. Z. Metallkd. 1984, 75, 599–613. (In German) [Google Scholar]
- Singh, R.N.; Sommer, F. Segregation and immiscibility in liquid binary alloys. Rep. Prog. Phys. 1997, 60, 57–150. [Google Scholar] [CrossRef]
- Vaajamo, I.; Johto, H.; Taskinen, P. Solubility study of the copper-lead system. Int. J. Mater. Res. 2013, 104, 372–376. [Google Scholar] [CrossRef]
- Chakrabarti, D.J.; Laughlin, D.E. The Cu-Pb (Copper-Lead) system. Bull. Alloy Phase Diagr. 1984, 5, 503–510. [Google Scholar] [CrossRef]
- Hansen, M.; Anderko, K. Constitution of Binary Alloys, 2nd ed.; McGraw-Hill: New York, NY, USA, 1958. [Google Scholar]
- Hayes, F.H.; Lukas, H.L.; Effenberg, G.; Petzow, G. A thermodynamic optimisation. of the Cu-Ag-Pb system. Z. Metallkd. 1986, 77, 749–754. [Google Scholar]
- Niemelä, J. A thermodynamic evaluation of the copper-bismuth and copper-lead systems. CALPHAD 1986, 10, 77–89. [Google Scholar] [CrossRef]
- Teppo, O.; Niemela, J.; Taskinen, P. The copper-lead phase diagram. Thermochim. Acta 1991, 185, 155–169. [Google Scholar] [CrossRef]
- Onderka, B.; Zabdyr, L. A new critical assessment of the copper-lead system. Scand. J. Metall. 2001, 30, 320–323. [Google Scholar] [CrossRef]
- Miettinen, J.; Docheva, P.; Vassilev, G. Thermodynamic description of the Cu-Pb-Sn system at the Cu-Pb side. CALPHAD 2010, 34, 415–420. [Google Scholar] [CrossRef]
- Hultgren, R.; Desai, P.D.; Hawkins, D.T.; Gleiser, M.; Kelly, K.K. Thermodynamic Properties of Cu-Pb Binary Alloy System; Thermodynamic Properties of Fe-Si Binary Alloy System. In Selected Values of Thermodynamics Properties of Binary Alloys, 1st ed.; ASM International: Metals Park, OH, USA, 1973; pp. 773–776, 871–883. [Google Scholar]
- Shrestha, G.K.; Singh, B.K.; Jha, I.S.; Koirala, I. Theoretical study of thermodynamic properties of Cu-Pb liquid alloys at different temperature by optimization method. J. Inst. Sci. Techn. 2017, 22, 25–33. [Google Scholar] [CrossRef][Green Version]
- Lide, D.R. CRC Handbook of Chemistry and Physics, 84th ed.; CRC Press LLC: Boca Raton, FL, USA, 2004. [Google Scholar]
- Pauling, L. Nature of the Chemical Bonding; Cornell University Press: Ithaca, NY, USA, 1960. [Google Scholar]
- Lacaze, J.; Sundman, B. An Assessment of the Fe-C-Si System. Metall. Trans. A 1991, 22A, 2212–2223. [Google Scholar] [CrossRef]
- Ohtani, M. Activities of silicon and carbon in molten Fe-Si-C alloys. Sci. Rep. Tohoku Imp. Univ. Ser. A 1955, 7, 487–501. [Google Scholar]
- Cui, S.; Jung, I.-H. Critical reassessment of the Fe-Si system. CALPHAD 2017, 56, 108–125. [Google Scholar] [CrossRef]
- Adhikari, D.; Jha, I.S.; Singh, B.P. Structural asymmetry in liquid Fe-Si alloys. Philos. Mag. 2010, 90, 2687–2694. [Google Scholar] [CrossRef]
- Giuranno, D.; Novakovic, R. Surface and transport properties of liquid Bi-Sn alloys. J. Mater. Sci. Mater. El. 2020, 31, 5533–5545. [Google Scholar] [CrossRef]
- Moelwyn-Hughes, E.A. Physical Chemistry, 2nd ed.; Pergamon Press: New York, NY, USA, 1961; pp. 786–788. [Google Scholar]
- Delsante, S.; Borzone, G.; Novakovic, R. Experimental thermodynamics, surface and transport properties of liquid Ag-Ge alloys. Thermochim. Acta 2019, 682, 178432. [Google Scholar] [CrossRef]
- Novakovic, R.; Tanaka, T.; Muolo, M.L.; Lee, J.; Passerone, A. Bulk and surface transport properties of liquid Ag-X (X = Ti, Hf) compound forming alloys. Surf. Sci. 2005, 591, 56–69. [Google Scholar] [CrossRef]
- Novakovic, R.; Tanaka, T. Bulk and surface properties of Al-Co and Co-Ni liquid alloys. Phys. B Condens. Matter 2006, 371, 223–231. [Google Scholar] [CrossRef]
- Meschel, S.V.; Kleppa, O.J. Standard enthalpies of formation of some 3d transition metal silicides by high temperature direct synthesis calorimetry. J. Alloys Compd. 1998, 267, 128–135. [Google Scholar] [CrossRef]
- Bernard, G.; Lupis, C.H.P. The surface tension of liquid silver alloys: Part I. Silver-gold alloys. Metall. Trans. B 1971, 2, 555–559. [Google Scholar] [CrossRef]
- Schuermann, E.; Kaune, A. Calorimetry and thermodynamics of Cu-Pb alloys. Z. Metallkd. 1965, 56, 453–462. (In German) [Google Scholar]
- Timucin, M. Thermodynamic properties of liquid Cu-Pb alloys. Met. Trans. 1980, 11B, 503–510. [Google Scholar] [CrossRef]
- Deev, V.I.; Rybnikov, V.I.; Goldobin, V.P.; Smirnov, V.I. Thermodynamic properties of liquid alloys of Cu-Pb system. Zh. Fiz. Khim. 1971, 45, 3053–3056. (In Russian) [Google Scholar]
- Singh, R.N.; Sommer, F. A simple model for demixing binary liquid alloys. Z. Metallkd. 1992, 83, 533–540. [Google Scholar] [CrossRef]
- Schlesinger, M.E. Thermodynamics of solid transition-metal silicides. Chem. Rev. 1990, 90, 607–628. [Google Scholar] [CrossRef]
- Gertman, Y.M.; Gel’d, P.V. On thermochemistry of liquid iron alloys with silicon. Russ. J. Phys. Chem. 1962, 36, 788–792. [Google Scholar]
- Kanibolotsky, D.S.; Bieloborodova, O.A.; Kotova, N.V.; Lisnyak, V.V. Thermodynamics of liquid Fe-Si and Fe-Ge alloys. J. Therm. Anal. Calorim. 2003, 71, 583–591. [Google Scholar] [CrossRef]
- Iguchi, Y.; Tozaki, Y.; Kakizaki, M.; Fuwa, T.; Ban-ya, S. A calorimetric study of heats of mixing of liquid iron alloys. J. Iron Steel Inst. Japan 1981, 67, 925–932. [Google Scholar] [CrossRef]
- Sanbongi, K.; Ohtani, M. Activities of coexisting elements in molten iron. II. Activity of silicon in a molten iron-silicon system. Sci. Rep. Tohoku Imp. Univ. Ser. A 1953, 5, 350–357. [Google Scholar]
- Miki, T.; Morita, K.; Yamawaki, M. Measurements of thermodynamic properties of iron in molten silicon by Knudsen effusion method. J. Mass Spectrom. Soc. Jpn. 1999, 47, 72–75. [Google Scholar] [CrossRef][Green Version]
- Giuranno, D.; Gnecco, F.; Ricci, E.; Novakovic, R. Surface tension and wetting behaviour of molten Bi-Pb alloys. Intermetallics 2003, 11, 1313–1317. [Google Scholar] [CrossRef]
- Metzger, G. Surface Tension Measurements, VII. Temperature Dependence of the Surface Tension of Copper and the Surface Tension of Molten Silver- Lead, Silver-Bismuth and Copper-Lead Alloys. Z. Phys. Chem. 1959, 211, 1–25. (In German) [Google Scholar]
- Joud, J.-C.; Eustathopoulos, N.; Bricard, A.; Desré, P. Determination de la tension superficielle des alliages Ag-Pb et Cu-Pb par la méthode de la goutte posée. J. Chim. Phys. 1973, 170, 1290–1294. [Google Scholar] [CrossRef]
- Goumiri, L.; Joud, J.C.; Desré, P. Estimation de la tension superficielle d’alliages liquides binaires présentant un effet de taille important. Surf. Sci. 1979, 88, 461–473. (In French) [Google Scholar] [CrossRef]
- Brillo, J.; Egry, I. Surface tension of nickel, copper, iron and their binary alloys. J. Mater. Sci. 2005, 40, 2213–2216. [Google Scholar] [CrossRef]
- Hibiya, T.; Morohoshi, K.; Ozawa, S. Oxygen partial pressure dependence on surface tension and its temperature coefficient for metallic melts: A discussion from the viewpoint of solubility and adsorption of oxygen. J. Mater. Sci. 2010, 45, 1986–1992. [Google Scholar] [CrossRef]
- Shergin, L.M.; Popel, S.I.; Tsarevskii, B.V. Temperature dependence of the density and surface tension of Cobalt-Silicon and Nickel-Silicon melts. Tr. Inst. Met. Akad. Nauk SSSR Uralsk. Nauch. Tscntr. 1971, 25, 52. [Google Scholar]
- Kawai, Y.; Mori, K.; Kishimoto, M.; Ishikura, K.; Shimada, T. Surface tension of liquid Fe-C-Si alloys. Tetsu to-Hagané 1974, 60, 29–31. [Google Scholar] [CrossRef][Green Version]
- Laty, P.; Joud, J.C.; Desre, P. Surface tensions of binary liquid alloys with strong chemical interactions. Surf. Sci. 1976, 60, 109–124. [Google Scholar] [CrossRef]
- Brooks, R.; Cameron, A. Measurements of the surface tension of the Iron-Silicon system using electromagnetic levitation. ISIJ Int. 2000, 40, 157–159. [Google Scholar] [CrossRef]
- Yoshikawa, T. Surface Tensions of Fe-(30–40 mol %) Si-C Alloys at 1523–1723 K. Mater. Trans. 2013, 54, 1968–1974. [Google Scholar] [CrossRef]
- Dzhemilev, N.K.; Popel, S.I.; Tsarevskii, B.V. Isotherm of the density and surface energy of iron-silicon melts. Phys. Met. Metallogr. 1964, 18, 77–78. [Google Scholar]
- Kero, I.; Grådahl, S.; Tranell, G. Airborne Emissions from Si/FeSi Production. JOM 2017, 69, 365–380. [Google Scholar] [CrossRef]
- Kim, Y.; Kim, H.G.; Kang, Y.-B.; Kaptay, G.; Lee, J. Prediction of Phase Separation of Immiscible Ga-Tl Alloys. Metall. Mater. Trans. A Phys. Metall. Mater. Sci. 2017, 48A, 3130–3136. [Google Scholar] [CrossRef]
- Zhao, J.-Z.; Ahmed, T.; Jiang, H.-X.; He, J.; Sun, Q. Solidification of Immiscible Alloys: A Review. Acta Metall. Sin. (Engl. Lett.) 2017, 30, 1–28. [Google Scholar] [CrossRef]
- Sak, T.; Kucharski, M. Density of the copper-rich Cu-Pb-Fe alloys. Arch. Metall. Mater. 2015, 60, 1685–1692. [Google Scholar] [CrossRef]
- Assael, M.J.; Kalyva, A.E.; Antoniadis, K.D.; Banish, R.M.; Egry, I.; Wu, J.; Kaschnitz, E.; Wakeham, W.A. Reference data for the density and viscosity of liquid copper and liquid tin. J. Phys. Chem. Ref. Data 2010, 39, 1–8. [Google Scholar] [CrossRef]
- Sobolev, V. Thermophysical properties of lead and lead-bismuth eutectic. J. Nucl. Mater. 2007, 362, 235–247. [Google Scholar] [CrossRef]
- Assael, M.J.; Kakosimos, K.; Banish, R.M.; Brillo, J.; Egry, I.; Brooks, R.; Quested, P.N.; Mills, K.C.; Nagashima, A.; Sato, Y.; et al. Reference data for the density and viscosity of liquid aluminium and liquid iron. J. Phys. Chem. Ref. Data 2006, 35, 285–300. [Google Scholar] [CrossRef]
- Assael, M.J.; Armyra, I.J.; Brillo, J.; Stankus, S.V.; Wu, J.; Wakeham, W.A. Reference data for the density and viscosity of liquid cadmium, cobalt, gallium, indium, mercury, silicon, thallium, and zinc. J. Phys. Chem. Ref. Data 2012, 41, 033101. [Google Scholar] [CrossRef]
- Mizuno, A.; Kawauchi, H.; Tanno, M.; Murai, K.; Kobatake, H.; Fukuyama, H.; Tsukada, T.; Watanabe, M. Concentration dependence of molar volume of binary Si alloys in liquid state. ISIJ Int. 2014, 54, 2120–2124. [Google Scholar] [CrossRef]
- Plevachuk, Y.; Egry, I.; Brillo, J.; Holland Moritz, D.; Kaban, I. Density and atomic volume in liquid Al-Fe and Al-Ni binary alloys. I. Int. J. Mater. Res. 2007, 98, 107–111. [Google Scholar] [CrossRef]
- Terzieff, P. The viscosity of liquid alloys of polyvalent metals with Cu, Ag and Au: Theoretical treatments based on the enthalpy of mixing. Phys. B 2009, 404, 2039–2044. [Google Scholar] [CrossRef]
- Terzieff, P. The viscosity of liquid alloys. J. Alloys Compd. 2008, 453, 233–240. [Google Scholar] [CrossRef]
- Gvozdeva, L.I.; Lyubimov, A.P. Lyubimov. Ukr. Fiz. Zh. 1967, 12, 207. [Google Scholar]
- V’yukhin, V.V.; Sokolov, A.M.; Tsepelev, V.S.; Chikova, O.A. Viscosity and Separation of Cu-Pb Melts. Russ. Metall. (Met.) 2015, 2015, 525–528. [Google Scholar] [CrossRef]
- Chikova, O.A.; Tsepelev, V.S.; V’yukhin, V.V. Viscosity of High-Entropy Melts in Cu-Sn-Pb-Bi-Ga, Cu-Sn, Cu-Pb, Cu-Ga, and Cu-Bi Equiatomic Compositions. Russ. J. Non-Ferr. Met. 2015, 56, 246–250. [Google Scholar] [CrossRef]
- Battezzati, L.; Greer, A.L. The viscosity of liquid metals and alloys. Acta Metall. 1989, 37, 1791–1802. [Google Scholar] [CrossRef]
- Mehta, U.; Yadav, S.K.; Koirala, I.; Koirala, R.P.; Shrestha, G.K.; Adhikari, D. Study of surface tension and viscosity of Cu-Fe-Si ternary alloy using a thermodynamic approach. Heliyon 2020, 6, e046742. [Google Scholar] [CrossRef] [PubMed]
- Budai, I.; Benkő, M.Z.; Kaptay, G. Comparison of different theoretical models to experimental data on viscosity of binary liquid alloys. Mater. Sci. Forum 2007, 537–538, 489–496. [Google Scholar] [CrossRef]
- Bel’tyukov, A.L.; Lad’yanov, V.I.; Shishmarin, A.I. Viscosity of Fe-Si melts with silicon content up to 45 at%. High Temp. 2014, 52, 185–191. [Google Scholar] [CrossRef]
- Wunderlich, R.K.; Fecht, H.-J. Surface tension and viscosity of NiAl catalytic precursor alloys from microgravity experiments. Int. J. Mater. Res. 2011, 102, 1164–1173. [Google Scholar] [CrossRef]
- Romanov, A.A.; Kochegarov, V.G. Kochegarov. Fizika Metal 1960, 17, 300. [Google Scholar]
- Kawai, Y.; Tsuji, M.; Kanemoto, M. Viscosity of liquid Fe-C-Si-alloy. Tetsu-to-Hagane 1974, 60, 38–44. [Google Scholar] [CrossRef][Green Version]
- Zhou, S.X.; Dong, B.S.; Qin, J.Y.; Li, D.R.; Pan, S.P.; Bian, X.F.; Li, Z.B. The relationship between the stability of glass-forming Fe-based liquid alloys and the metalloid-centered clusters. J. Appl. Phys. 2012, 112, 023514. [Google Scholar] [CrossRef]


Publisher’s Note: MDPI stays neutral with regard to jurisdictional claims in published maps and institutional affiliations. |
© 2022 by the authors. Licensee MDPI, Basel, Switzerland. This article is an open access article distributed under the terms and conditions of the Creative Commons Attribution (CC BY) license (https://creativecommons.org/licenses/by/4.0/).
Share and Cite
Novakovic, R.; Giuranno, D.; Lee, J.; Mohr, M.; Delsante, S.; Borzone, G.; Miani, F.; Fecht, H.-J. Thermophysical Properties of Fe-Si and Cu-Pb Melts and Their Effects on Solidification Related Processes. Metals 2022, 12, 336. https://doi.org/10.3390/met12020336
Novakovic R, Giuranno D, Lee J, Mohr M, Delsante S, Borzone G, Miani F, Fecht H-J. Thermophysical Properties of Fe-Si and Cu-Pb Melts and Their Effects on Solidification Related Processes. Metals. 2022; 12(2):336. https://doi.org/10.3390/met12020336
Chicago/Turabian StyleNovakovic, Rada, Donatella Giuranno, Joonho Lee, Markus Mohr, Simona Delsante, Gabriella Borzone, Fabio Miani, and Hans-Jörg Fecht. 2022. "Thermophysical Properties of Fe-Si and Cu-Pb Melts and Their Effects on Solidification Related Processes" Metals 12, no. 2: 336. https://doi.org/10.3390/met12020336
APA StyleNovakovic, R., Giuranno, D., Lee, J., Mohr, M., Delsante, S., Borzone, G., Miani, F., & Fecht, H.-J. (2022). Thermophysical Properties of Fe-Si and Cu-Pb Melts and Their Effects on Solidification Related Processes. Metals, 12(2), 336. https://doi.org/10.3390/met12020336