Abstract
In this paper, we report two cases studies where solidification processes were successfully investigated with CALPHAD-based methodologies. The first one refers to the use of thermodynamic databases to describe the solidification processes of a precious Au-base alloy containing Ir as a grain refiner. The second one concerns the development and use of a quaternary database for Al-Mg-Si-Er alloys for additive manufacturing, where Er is added as a nucleating agent. While in the former case, the solidification process was investigated by running the Thermo-Calc software with a specific TCNOBL1 commercial database, in the latter, the necessary database was first constructed, using available thermodynamic assessments in the literature and experimental data, and then applied to investigate the solidification behavior of selected alloys.
1. Introduction
Nowadays, computational methods and software have proved very useful in reducing the need for experimental trial and error in materials design and process optimization [1]. Due to the intrinsic difficulty of this task, computer calculations and simulations are carried out at different length scales, following the well-accepted paradigm of Integrated Computational Materials Engineering (ICME). At the nano-micro-scale (10−9–10−6 m), different models are available to describe phase transformations, including solidification, and to predict final microstructures. Because thermodynamic parameters are necessary for kinetic simulations, the foundation of many of these models lies in the CALPHAD methodology, which is able to describe equilibrium thermodynamics and phase diagrams of complex multicomponent systems [2,3]. Based on the CALPHAD method, thermodynamic databases can be constructed and then used to compute various properties for a variety of different types of materials (Ni-base superalloys, steels, high entropy alloys, etc.). Several computer codes are available to perform such calculations, and most of them are commercial software (Thermo-Calc [4], JMatPro [5], MatCalc [6], Pandat [7]), but a few of them are open-source packages (OpenCalphad [8], PyCalphad [9]).
In this work, we present two case studies where CALPHAD-based calculations were applied to obtain the thermodynamic properties of two different types of materials: (a) an Au-based alloy for jewelry; (b) different Al-based alloys for additive manufacturing.
In the processes of jewelry manufacturing, annealing treatments are widely used to restore alloy ductility by re-crystallization and to reduce the “orange peel” effect after mechanical working [10]. Controlling grain growth during annealing is a crucial point of the process and can be achieved by adding small amounts of some metals with high melting points and low solubility in gold. This is the case of iridium, ruthenium, or rhenium— when added in low percentages, they produce grain refinement of the gold cast microstructure [10].
Iridium, in particular, is a very efficient grain refiner [11] for Au-based alloys due to small solubility (less than 0.1 wt.%) and a high melting point (2447 °C) [12]. Before solidification of the Au-based alloy, Ir promotes the formation of finely dispersed particles which enhance crystal nucleation, followed by growth. The final grain size of cast alloys is usually inversely related to the number of nuclei, i.e. the more nuclei are formed in the liquid alloy, the smaller will the grain size in the alloy be. The amount of Ir usually added in 14- and 18-carat gold alloys is between 0.005 wt.% and 0.010 wt.%. Such small amounts are sufficient for a refining treatment. Higher concentrations, however, should be avoided, as segregation of iridium particles can occur. In addition, a too low melting temperature or/and a too short holding time in the liquid state may induce the formation of iridium inclusions, forming hard spots, which affect polishing [13]. The literature suggests that a better control of inoculants concentration and/or an optimization of processing could reduce Ir-segregation problems [10].
In order to investigate the role of Ir additions on the quality of Au-based alloys, calculations of the thermodynamic properties of an Ir-containing Au-based alloy were performed. The following information was obtained: phase diagrams and standard thermodynamic properties as a function of temperature and compositions, phase amount as a function of temperature for different compositions, and solidification behavior in equilibrium and non-equilibrium conditions.
The second case study is in the context of Additive Manufacturing (AM) and regards aluminum alloys. AM technologies are developing at a very rapid pace and applications are widening [14,15]. As solidification occurs several times layer by layer when using AM methods, it is important to fine tune the process in order to obtain the desired microstructures and properties [16,17,18]. Furthermore, even if commonly used alloys with suitable solidification properties are mostly used as raw materials, the need for new ad-hoc metallic alloys is constantly rising. One of the most used Al-based metallic systems, both in traditional casting and in AM, is the ternary Al-Mg-Si. In recent years, the scientific community has been investigating multiple possibilities to modify these ternary alloys, for example with the addition of rare earths, such as erbium. These additions can act as inoculants and improve the mechanical properties of the modified alloys. In this second case study, we then focused on the quaternary Al-Mg-Si-Er system, with special attention to the properties of interest in AM processes. In order to perform solidification calculations, it was first necessary to construct a quaternary thermodynamic database using the CALPHAD method. A multicomponent database is usually built starting from low-order subsystems (binaries) and moving up to higher order ones (ternaries, etc.). An “assessment” of each subsystem needs to be carried out or taken from the literature. The assessment procedure allows to obtain the thermodynamic parameters present in the mathematical models which describe the Gibbs free energy of each phase of a system according to the CALPHAD method [2]. In the present case (Al-Mg-Si-Er), most subsystems have already been assessed and are available in the literature, as will be detailed in the following sections. After constructing the thermodynamic database, it was first validated by comparing the calculated results with available experimental data on ternary and quaternary alloys. Afterwards, calculations of equilibrium and non-equilibrium solidification and other thermodynamic properties relevant for AM processes were carried out.
2. Thermodynamic Models and Software
Thermodynamic properties, phase diagrams, and simulations of equilibrium and non-equilibrium (Scheil) solidification were performed with the Thermo-Calc 2021 software.
For the first case study, a typical 18-carat Au-based alloy was selected. Together with 75 wt.% of Au, the presence of 4.5 wt.% of Ag and 0.05 wt.% of Zn was considered. In order to stress the effect of Ir, a composition close to the upper limit (i.e. 0.009 wt.%) was fixed, taking Cu content as a balance.
The commercial database TCNOBL1 from ThermoCalc was used [19]. Calculations were performed, both in equilibrium and in metastable conditions, i.e. considering or neglecting the formation of some equilibrium phases. These conditions can be achieved by setting selected phases as “entered” or “suspended”, respectively. In fact, quite often, specific phases are stable when the system is considered at equilibrium, but they are not present when using real processing conditions. For example, rapid quenching may prevent their formation at room temperature. Hence, calculations in metastable conditions can sometimes better describe the final phase mixture obtained experimentally.
For the second case study, the quaternary Al-Mg-Si-Er system, a custom database, was developed by putting together the thermodynamic parameters of ternary systems from the literature, as outlined in Table 1.

Table 1.
Data available in the literature for the listed ternary systems in Al-Mg-Si-Er alloys.
For Al-Mg-Si and Al-Mg-Er systems, full ternary CALPHAD assessments are available in the literature, and they have been taken without modifications. It is noteworthy to remark that the thermodynamic models used here are compatible and hence these systems can easily be merged in a single database.
For the Al-Si-Er system, no ternary assessment and very limited experimental information are available. Fortunately, assessments for all binary subsystems (Al-Si, Al-Er, and Si-Er) are available in the literature. This makes it possible to use the thermodynamic parameters for the binary subsystems and extrapolate them to create a database for the ternary Al-Si-Er system. However, the Si-Er binary system was assessed using a quasi-chemical model for the liquid phase [22], whereas in all other binary subsystems, a Redlich-Kister model was used [25]. For this reason, the results of the binary assessment from ref. [22] cannot be directly merged into a single database and a reassessment of this binary system was carried out in this work.
Finally, for the last ternary system, Mg-Si-Er, no assessment is available and no experimental information is reported in the literature to the best of our knowledge. Hence, the ternary database was extrapolated from available binary assessments (using the reassessed database for Si-Er).
The reassessment of the binary Si-Er system was carried out using the same experimental information as in ref. [22]. According to the CALPHAD method, the Gibbs energy of each phase () of the system was described as:
where the first term refers to the weighted average of the Gibbs energy of pure elements, the second one is the ideal mixing contribution, and the third one is an excess term, which can be described using different models.
For the liquid phase, a Redlich–Kister model was used [25]:
where R is the gas constant, T is the temperature and the coefficients are interaction parameters, which can be temperature-dependent and have been optimised.
As there is no reported solubility in the terminal solid solutions (diamond Si and h.c.p. Er), no interaction parameters were introduced in these phases.
The intermetallic compounds have been described as stoichiometric phases because the available experimental evidence does not show any solubility range. Accordingly, the following equations were used for a generic EruSiv compound:
where and is the free energy of pure Er and Si, respectively, in standard conditions (SER = Standard Element Reference). The interaction term is the Gibbs energy of formation of the compound, usually expressed as:
where a, b, c, and dn are optimised parameters.
From the assessed thermodynamic databases, alloy solidification can be simulated in equilibrium conditions by minimizing the total Gibbs energy of the system using the optimized parameters in the database [2,3]. As industrial solidification processes are usually out-of-equilibrium, non-equilibrium solidification simulations were also carried out using the so-called Scheil model [26]. The model assumes infinite diffusion of the elements in the liquid phase, no diffusion in the solid phase(s), and thermodynamic equilibrium at the interface. Although the original equation was developed only for binary alloys and assuming a constant partitioning coefficient between the solid and liquid phases, it was numerically extended to multicomponent alloys in ThermoCalc [3].
3. Results
3.1. Au-Based Alloy for Jewelry Manufacturing
3.1.1. Pseudo-Binary Phase Diagrams
The equilibrium and metastable pseudo-binary phase diagrams of selected alloy are reported in Figure 1. The composition of interest of the alloy, for both cases, is at 0.009 wt.% of Ir and is represented with a dashed line. Metastable phase diagrams are obtained when one or more phases are not included (“suspended”) in the calculations and they can help rationalize the non-equilibrium behaviour.
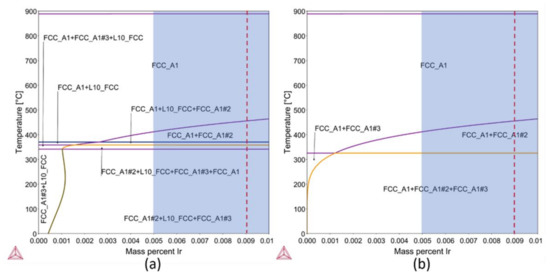
Figure 1.
Equilibrium pseudo binary phase diagram: (a) calculated considering all stable phases in the system and (b) after suspending the ordered L10_FCC. Colored area represents the typical amount of Ir present in 14- and 18-carat gold alloys. The dashed line indicates the selected case study.
The equilibrium pseudo-binary phase diagram (Figure 1a) shows five stable phases: LIQUID, L10_FCC, FCC_A1, FCC_A1#2, and FCC_A1#3 (the last three are different composition sets of the solid solution FCC_A1).
When the ordered L10_FCC phase is suspended, the metastable phase diagram (Figure 1b) shows only four phases: LIQUID, FCC_A1, FCC_A1#2, and FCC_A1#3, whose evolution as a function of the temperature is reported in the following subsections.
3.1.2. Phase Fractions and Phase Compositions vs. Temperature
In Figure 2a, the calculated phase fractions of five phases are shown as a function of temperature in equilibrium conditions. The liquid (blue line) starts to solidify at 889 °C and forms first an fcc solid solution (FCC_A1); this phase (red line) is disordered and stable in a wide range of temperatures from the solidus temperature at 881 °C down to 370 °C. At 456 °C, another fcc disordered solid solution (FCC_A1#2, black line) is formed from the FCC_A1; FCC_A1#2 is maintained as a stable phase down to room temperature and its amount is rather limited. Then, FCC_A1 decomposes into two more solid solutions: at first, at 370 °C, into an ordered solid solution L10_FCC (violet line), followed by another disordered solid solution at 358 °C, named FCC_A1#3 (green line). The number after the hashtag identifies different composition sets within the fcc disordered solid solution, i.e. they are all fcc solutions but with different compositions.
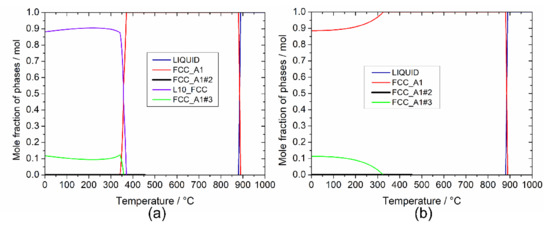
Figure 2.
Phase fractions vs. temperature for the selected Au-based alloy: (a) in equilibrium condition and (b) in metastable condition, suspending the ordered L10_FCC phase.
In Figure 2b, only four phases appear in metastable conditions. The liquid (blue line) starts to solidify at the same liquidus point (889 °C), to form an FCC_A1 solid solution; as for equilibrium calculations, this phase (red line) is disordered, but now it is present down to room temperature, where it has a fraction of 89%. On decreasing the temperature, two additional disordered solid solutions appear: FCC_A1#2 (black line) and FCC_A1#3 (green line).
The composition of each phase is reported as a function of temperature in Figure 3 and Figure 4, both in the equilibrium and in metastable conditions, respectively. A common range of temperatures (0–1000 °C) was selected to underline not only the composition of phases but also their range of stability, in accordance with the phase fraction plot presented above.
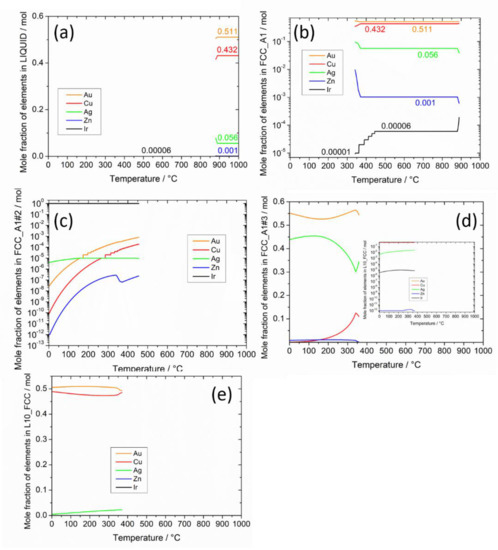
Figure 3.
Calculated mole fraction of elements in each phase in the selected Au-based alloy as a function of temperature in equilibrium; (a) LIQUID, (b) FCC_A1, (c) FCC_A1#2, (d) FCC_A1#3, and (e) L10_FCC. In the inset of (d), a zoom on the elements with minority content is reported.
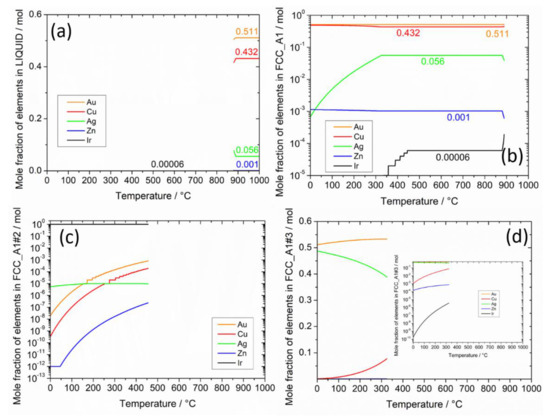
Figure 4.
Calculated mole fractions of elements in each phase in the selected Au-based alloy as a function of temperature in metastable conditions; (a) LIQUID, (b) FCC_A1, (c) FCC_A1#2, and (d) FCC_A1#3. In the inset of (d), a zoom on the elements with minority content is reported.
Since only the liquid phase is present at high temperatures, it has the nominal composition of the alloy. Iridium is fully dissolved in the liquid phase (Figure 3a and Figure 4a). In both equilibrium and metastable conditions, when FCC_A1 solidifies from the liquid, after a short biphasic temperature range, it shows the nominal composition again, as only one phase is present. In metastable conditions at 456 °C, the amount of Ir in the FCC_A1 solid solution starts to decrease as shown in Figure 4b, reaching a mole fraction as low as 0.00001. This is due to the formation of FCC_A1#2 solid solution, which is basically pure iridium, as reported in the Figure 3c. This phase remains stable down to room temperature. At 325 °C, FCC_A1#3 starts to be formed: it is a solid solution mainly composed of Au and Ag, with Cu decreasing on decreasing temperatures (Figure 4d). The other elements are in a limited amount, as shown in the logarithmic scale plot in the inset of the same figure. Consequently, FCC_A1 loses Ag on cooling. Differing in the results in equilibrium conditions, the phase FCC_A1 decomposes into two solid solutions: at first, an ordered solid solution L10_FCC at 370 °C (Figure 3e), mainly composed of equimolar Au and Cu; then a disordered solid solution (FCC_A1#3) at 358 °C, whose main components are Au and Ag (Figure 3d).
In metastable conditions (Figure 4), the differences are to be ascribed to the absence of the ordered solid solution L10_FCC. Hence, FCC_A1 is maintained until room temperature; at 325 °C, FCC_A1#3 starts to be formed: it is a solid solution mainly composed of Au and Ag, with Cu decreasing on lowering temperatures (Figure 4d). The other elements are in a limited amount, as shown in the logarithmic scale plot in the inset of the same figure. Consequently, FCC_A1 loses Ag on cooling. At room temperature, three phases coexist: FCC_A1, FCC_A1#2, and FCC_A1#3.
3.1.3. Liquidus/Solidus Temperatures and Solid Fraction
The solid fraction, obtained both in equilibrium conditions and according to the Scheil model, is reported in Figure 5 as a function of temperature. Liquidus temperature is at 899 °C and solidus temperature at 881 and 850 °C, respectively, for the equilibrium and the Scheil model. In both cases, only the FCC_A1 solid solution forms upon solidification. Hence, even in non-equilibrium solidification, the other phases (L10_FCC, FCC_A1#2, FCC_A1#3) are not stable enough to precipitate at these temperatures.
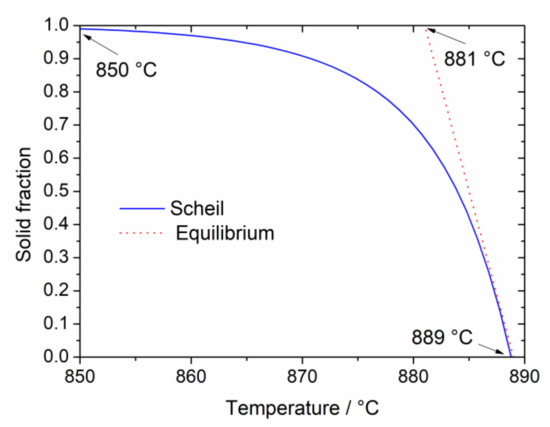
Figure 5.
The solid fraction in the selected Au-based alloy as a function of temperature obtained on the base of both the Scheil model (full line) and in equilibrium conditions (dotted line). Liquidus and solidus temperatures are indicated.
While for the equilibrium condition, solidification occurs in a narrow range of temperature, according to the Scheil model, this range is larger. The latter is expected to be closer to real solidification condition of the alloy in continuous casting and so are the solidus temperature and the solid fraction.
3.1.4. Enthalpy and Specific Heat of the Alloy
The plot of the enthalpy of the Au-base alloy as a function of temperature in equilibrium and metastable conditions (i.e. L10_FCC phase suspended) is reported below in Figure 6a,c, respectively. The reference state is the enthalpy at 300 K. The first jump in the enthalpy at around 889 °C is related to the solidification of the LIQUID into the FCC_A1 solid solution with no difference between metastable or equilibrium conditions; the second jump in the enthalpy is reported only for the equilibrium at 370 °C and is mainly due to the formation of the ordered solid solution L10_FCC. In Figure 6b,d, the specific heat (Cp) of the alloy is also reported as a function of the temperature and the stable phases are labelled. Evaluation of enthalpy and specific heat of the alloy is a crucial step in order to optimize the solidification process. These are also input parameters of more complex models to simulate alloy solidification and further fine tune the experimental process.
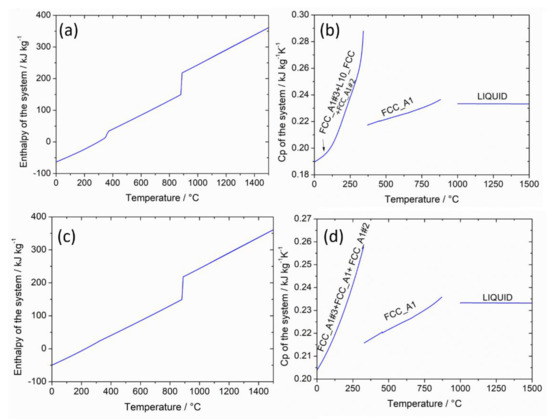
Figure 6.
(a) Enthalpy of the system plot and Cp of the system plot in equilibrium condition (a,b) and in metastable condition (L10_FCC suspended) (c,d). Stable phases are labelled in the plot.
3.2. Al-Based Alloys for Additive Manufacturing
3.2.1. Re-optimization of the Binary Er-Si System
As already introduced above, a reassessment of the binary Er-Si system was necessary in this work in order to include it in the quaternary Al-Mg-Si-Er database, as the only assessment reported in the literature (Kim et al. [22]) is not compatible with the assessments of the other subsystems. The results of this re-optimization are shown below.
In the Er-Si system, there are different intermetallic compounds (α-Er3Si5, β-Er3Si5, ErSi, Er5Si4 and Er5Si3). Several invariant points are also present in the phase diagram: two eutectics, one at X(Er) = ~0.2 and one at X(Er) = ~0.87, one peritectic point at X(Er) = ~0.37 and two congruent melting points for the ErSi phase at X(Er) = 0.5 and for the Er5Si3 phase at X(Er) = 0.625. Between ErSi and Er5Si3 phases, a eutectic and a peritectic point are very near in composition, at approximately X(Er) = ~0.540 and X(Er) = ~0.545, respectively, close to the melting point of the Er5Si4 phase. The Er3Si5 intermetallic compound shows a transition at 1067 K between two different crystal structures, the low-temperature alpha phase and the high-temperature beta phase.
The calculated invariant equilibria, according to the present reassessment, are listed in Table 2 and compared with experimental data from different sources. It is clearly visible that a satisfactory agreement between the calculated and experimental values was obtained. The largest discrepancy occurs for the eutectic point in the Er-rich side of the phase diagram, as there is also a large difference in the experimental temperatures reported in two different works.
Table 2.
Calculated (from this work) and experimental (from indicated references) invariant reactions in the Er-Si system.
The calculated phase diagram of the Er-Si system is displayed in Figure 7, together with available experimental data from the literature. As can be seen, there is very good agreement between the experimental values and the lines calculated with Thermo-Calc.
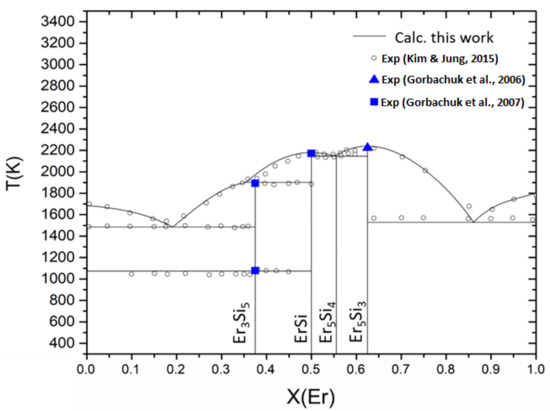
Figure 7.
Calculated phase diagram of Er-Si system according to the present assessment (lines), compared to experimental data (points). Experimental data are from references [22,29,30].
A good agreement between calculated and experimental thermodynamic properties (enthalpies of formation of the solid phases, enthalpy of mixing of the liquid phase, specific heats of the solid phases) was also obtained (not shown).
3.2.2. Quaternary Database Construction and Validation
After the reassessment of the binary Er-Si system, it was possible to construct the quaternary thermodynamic database for the Al-Mg-Si-Er system. This step requires the construction of a single “TDB” file, i.e. a single file containing the assessed thermodynamic parameters of all binary and ternary subsystems. From the quaternary database (available as Supplementary Materials), it is then possible to calculate thermodynamic properties and phase diagrams for quaternary alloys, as well as for alloys in lower order subsystems. The obtained database is reported as a supplementary file.
It is then desirable to validate a new database, i.e. to compare calculated results for ternary and quaternary alloys with available experimental data and verify the soundness of the predictions.
Unfortunately, to the best of our knowledge, literature experimental data on these quaternary alloys are very rare. In a doctoral thesis by S. Marola in our group [31], some experimental data on different alloys in this system were obtained.
In particular, DSC measurements on a ternary AlSi10Mg and a quaternary AlSi10Mg+Er (0.3wt.%) were carried out and thermodynamic properties, such as liquidus/solidus temperatures and the enthalpy of melting, were obtained (Table 3). These quantities were calculated with Thermo-Calc using developed quaternary database and then compared with the experimental ones.
Table 3.
Experimental (DSC measurements) and computed data for melting and solidification of different alloys in the Al-Mg-Si-Er system.
As there is some uncertainty on the Si and Mg contents of the ternary and quaternary experimental alloys (Si content is between 9 and 11 wt.% and Mg between 0.2 and 0.45 wt.%), the calculation was done on three different sets of composition: 9 wt.% of Si and 0.2 wt.% of Mg, which corresponds to the minimum amounts of components, then 10 wt.% of Si and 0.325 wt.% of Mg, which is the median composition and at last 11 wt.% of Si, and 0.45 wt.% of Mg, which corresponds to the maximum amounts. Given these uncertainties, from a comparison of the experimental results from [31] and the computed values, a satisfactory agreement was observed for the liquidus and solidus temperatures, both for the ternary and quaternary alloys. It is worth noting that the lower experimental temperatures obtained on cooling with respect to the values obtained on heating are most probably due to some degree of undercooling occurring during DSC measurements. The calculated enthalpies of melting (ΔHmelt) are also in reasonable agreement with the experimental values and within an expected experimental uncertainty of 1–2 kJ/mol for this kind of measurements.
3.2.3. Solidification of Quaternary Al-Mg-Si-Er Alloys
The results of equilibrium solidification calculations (phase fractions as a function of temperature) are reported in Figure 8 for two selected quaternary alloys (Al-7Si-0.6Mg-0.4Er and Al-7Si-0.6Mg-1.2Er). These alloys are different from those considered in the previous subsection because, as shown in the following, we will compare the results with previous literature findings in similar systems and show how calculations can be carried out in composition regions where no experimental data are available. Considering the first alloy (Figure 8a), at high temperatures (900 K), the system is all in the liquid phase. When decreasing the temperature, the L12 phase (Al fcc) starts to precipitate at the liquidus point and its fraction rapidly increases on cooling. On further cooling, just below 850 K, the Si diamond phase appears and quickly reaches a phase fraction of about 0.07 at slightly lower temperatures. Minor amounts of Er3Si5_alpha and Mg2Si phases appear on further cooling. At the lowest temperature, 500 K, a mixture of Al fcc, Si diamond, Er3Si5_alpha, and Mg2Si is found in equilibrium conditions, with the first phase being largely dominant, with a phase fraction equal to about 0.92.
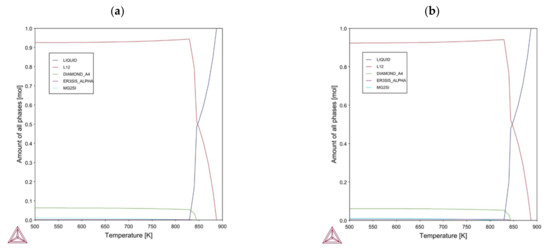
Figure 8.
Calculated phase fractions for (a) equilibrium solidification for the Al-7Si-0.6Mg-0.4Er alloy, (b) equilibrium solidification for the Al-7Si-0.6Mg-1.2Er.
Increasing the erbium content, as in the second alloy, Al-7Si-0.6Mg-1.2Er (Figure 8b) does not significantly change the above results, except for slightly different transition temperatures and a modest increase in the phase fraction of Er3Si5_alpha phase at 500 K.
The above results provide a first picture of phase equilibria occurring on solidification, but they refer to a very slow cooling, which allows the system to reach equilibrium. Solidification in AM processes typically occurs at much faster cooling rates and in non-equilibrium conditions, for which Scheil simulations are more suitable. Hence, the same quaternary alloys were investigated by performing Scheil calculations and the results are shown in Figure 9. For the first alloy (Figure 9a), on cooling from liquid phase, the first solid phase to solidify as primary phase is the Al fcc at 887 K. Then, at 845 K and 0.48 fraction of solid, the reaction liquid →Si diamond + Al fcc begins, followed by the precipitation of Er3Si5_alpha at a solid fraction of 0.81 and around 838 K. Finally, there is the quaternary eutectic reaction of liquid → Mg2Si+ Er3Si5_alpha+Si+Al, which occurs when 90% of the system has already become solid at about 830 K. The results for the second alloy (Figure 9b) are very similar.
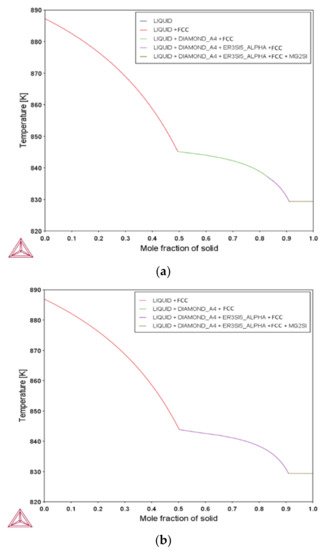
Figure 9.
Calculated results for (a) Scheil solidification for the Al-7Si-0.6Mg-0.4Er alloy, (b) Scheil solidification for the Al-7Si-0.6Mg-1.2Er.
These calculated results are consistent with experimental microstructures reported in the literature [32], where primary dendrites of Al fcc were found, surrounded by eutectic silicon and different intermetallic compounds. According to this work, however, both the structure and compositions of these compounds remain uncertain, and some may contain impurities, such as Fe.
Since different rare earths typically behave in a similar way, a comparison with calculated results in Al-Mg-Si-Sc and Al-Mg-Si-Ce systems [33,34] seems reasonable to validate the present findings. In fact, the phases precipitating during solidification found in Scheil calculations for the quaternary Al-7SI-0.6Mg-0.4X and Al-7SI-0.6Mg-1.2X alloys (X = Sc, Ce) are the same, as we report here with Er (Al fcc, Si diamond and Mg2Si). The only difference is that the results for the alloys with Sc and Ce show the precipitation of a ternary compound, AlScSi2 and AlCeSi2, respectively, instead of the binary phase Er3Si5_alpha. This point deserves further investigations, as some ternary compounds reported in an experimental investigation of the Al-Si-Er system [23] have not been included in the present database. However, the experimental data reported in this work are not sufficient for an assessment of the ternary Al-Si-Er system and an AlErSi2 phase was not found by these authors. Unfortunately, an extended experimental investigation of the ternary Al-Si-Er system was beyond the scope of this work.
CALPHAD calculations can explore the change of several properties in the complex composition space of multicomponent systems with four and more elements. As a final example of useful calculations for AM alloys, we show the variation of the so-called “solidification window” (ΔTls), i.e. the difference between liquidus and solidus temperatures at different compositions for quaternary Al-Si-Mg-Er alloys. Alloys with a small solidification window show limited segregations and inhomogeneities after solidification and are, therefore, better suited for AM applications. In this case, compositions ranging from 0 to 10 wt.% Mg and from 0 to 20 wt.% Si were investigated, with a fixed 0.25 wt.% Er content. The resulting variation of the calculated solidification window is shown in Figure 10.
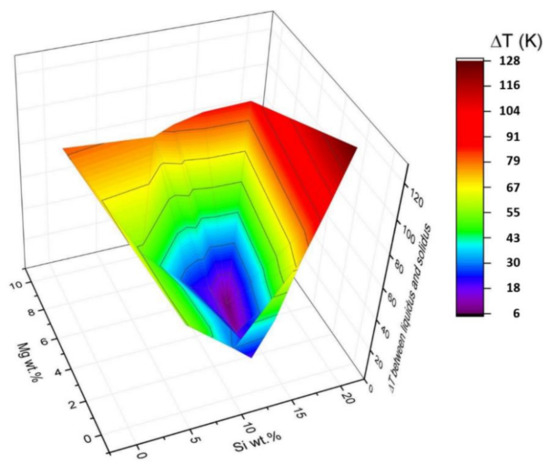
Figure 10.
3D plot of the "solidification window” as a function of Mg and Si compositions for the Al-Mg-Si-Er system. Here, a fixed amount of Er, 0.25 wt%, was used, while the variable content of Mg and Si is shown on the axis (in wt.%, Al content is balance). On the z-axis (and also in color scale), the calculated ΔT = Tliq − Tsol (in K) is shown for each composition.
It can be seen that the plot presents a minimum approximately at 13–14 wt.% Si and at 3–5 wt.% Mg. The alloys with low ΔTls have compositions close to the quaternary eutectic point. It can also be observed that the quantity of Si has a more drastic influence on the ΔTls than the variation of the quantity of Mg in the investigated composition range. Similar plots were obtained when using different fixed quantities of Er (not shown) and similar results were obtained.
4. Conclusions
CALPHAD-based methods and the Thermo-Calc software were applied to calculate thermodynamic properties and the solidification behavior of an Au-based alloy and quaternary Al-Mg-Si-Er alloys for additive manufacturing.
For the first alloy, calculations were performed considering both the presence and absence of the L10_FCC ordered solid solution. This is stable in the phase diagram, but it is usually not found in real products, due to the fast-quenching process. In both cases, at high temperatures, iridium was found in solution in the liquid phase and in the primary fcc solid solution (FCC_A1), which solidify first on cooling.
At lower temperatures (456 °C), another fcc solid solution (FCC_A1#2), which is almost pure iridium, precipitates from the primary fcc phase, evidencing the presence of a miscibility gap.
When the ordered solid solution L10_FCC is included in the calculation, the primary fcc solid solution (FCC_A1) further decomposes at low temperatures into L10_FCC, whose composition is approximately 50%Au-50%Cu, and another fcc solid solution (FCC_A1#3, a different composition set), which is mostly composed by Au and Ag. On the contrary, when the ordered solid solution L10_FCC is suspended in the calculation, the FCC_A1 remains stable down to room temperature.
These findings are the first step to understand the influence of Ir addition and the formation of Ir precipitates in 18 K gold alloys.
In the second case study, the primary objective was to explore the solidification behaviour of quaternary Al-Mg-Si-Er alloys and to calculate relevant properties for AM processes. This required the construction of a quaternary thermodynamic database from various binary and ternary subsystems taken from the literature. A full reassessment of the binary Er-Si binary system was carried out as the only assessment available was not compatible with the other subsystems. The results of this reassessment were presented above and show that the calculated results are in good agreement with the available experimental data.
After the construction of the quaternary thermodynamic database, it was validated by comparing the calculated results of different properties for ternary and quaternary alloys with experimental data (microstructural and DSC data) and with calculated results for similar quaternary systems Al-Mg-Si-X systems (X = Sc, Ce).
Finally, the solidification behavior of quaternary alloys was investigated in equilibrium and non-equilibrium (Scheil) conditions. The sequence of solid phases precipitating on cooling was found to be: primary fcc Al, Si diamond, Er3Si5_alpha, and Mg2Si. These results are consistent with literature experimental microstructures, which show the present of primary Al fcc dentrites surrounded by eutectic Si. The presence of intermetallic phases in low amounts, however, needs further confirmation.
Another property relevant for AM application is the solidification window of this quaternary alloy, which was also evaluated in this work as a function of composition. This can help the design of new ad-hoc alloys for AM as it is important to have a small window to limit segregations and inhomogeneities occurring during solidification.
The results here reported for two case studies are relevant for alloy innovation in industrial processes. The important contribution to the management of alloy solidification processes provided by suitable thermodynamic calculations performed with the CALPHAD method were shown. These data, together with direct application in driving process parameters, can provide useful inputs for further modelling and simulation of industrial processes (e.g. Finite Elements Modelling).
Supplementary Materials
The following supporting information can be downloaded at: https://www.mdpi.com/article/10.3390/met12020322/s1.
Author Contributions
Conceptualization, F.S., M.P., M.B., S.A. and C.V.; methodology, F.S., M.P., M.B., S.A. and C.V.; software, F.S., M.P. and C.V.; validation, F.S., M.P. and M.B.; formal analysis, F.S. and M.P.; investigation, F.S. and M.P.; resources, M.P. and M.B.; data curation, F.S. and M.P.; writing—original draft preparation, F.S. and M.P.; writing—review and editing, F.S., M.P. and M.B.; visualization, F.S.; supervision, M.P. and M.B.; project administration, M.P. and M.B.; funding acquisition, M.P. and M.B. All authors have read and agreed to the published version of the manuscript.
Funding
This research received no external funding.
Institutional Review Board Statement
Not applicable.
Informed Consent Statement
Not applicable.
Data Availability Statement
The data presented in this study are available on request from the corresponding author.
Acknowledgments
This work was supported by Regione Piemonte through project STAMP (Sviluppo Tecnologico dell’Additive Manufacturing in Piemonte). Livio Battezzati is kindly acknowledged for proving support and useful hints for discussion in the field of additive manufacturing.
Conflicts of Interest
The authors declare no conflict of interest.
References
- Wang, W.; Li, J.; Liu, W.; Liu, Z.-K. Integrated computational materials engineering for advanced materials: A brief review. Comput. Mat. Sci. 2019, 158, 42–48. [Google Scholar] [CrossRef]
- Lukas, H.L.; Fries, S.G.; Sundman, B. Computational Thermodynamics, the Calphad Method; Cambridge University Press: Cambridge, UK, 2007. [Google Scholar]
- Saunders, N.; Miodownik, A.P. CALPHAD–Calculation of Phase Diagrams; Pergamon Materials Series Vol. 1; Cahn, R.W., Ed.; Elsevier Science: Oxford, UK, 1998. [Google Scholar]
- Andersson, J.O.; Helander, T.; Hoglund, L.H.; Shi, P.F.; Sundman, B. THERMO-CALC & DICTRA, computational tools for materials science. CALPHAD 2002, 26, 273–312. [Google Scholar]
- Saunders, N.; Guo, Z.; Li, X.; Miodownik, A.P.; Schille, J.-P. Using JMatPro to model materials properties and behavior. J. Mater. 2003, 55, 60–65. [Google Scholar] [CrossRef]
- MatCalc Engineering, Metallurgical Process Simulations. Available online: https://www.matcalc-engineering.com/images/external/PDF-Files/Portfolio_MatCalc-Engineering-GmbH.pdf (accessed on 6 February 2022).
- Cao, W.; Chen, S.L.; Zhang, F.; Wu, K.; Yang, Y.; Chang, Y.A.; Schmid-Fetzer, R.; Oates, W.A. PANDAT software with PanEngine, PanOptimizer and Pan-Precipitation for multi-component phase diagram calculation and materials property simulation. CALPHAD 2009, 33, 328–342. [Google Scholar] [CrossRef]
- Sundman, B.; Kattner, U.R.; Sigli, C.; Stratmann, M.; Le Tellier, R.; Palumbo, M.; Fries, S.G. The OpenCalphad thermodynamic software interface. Comput. Mater. Sci. 2016, 125, 188–196. [Google Scholar] [CrossRef]
- Otis, R.; Liu, Z.-K. pycalphad: CALPHAD-based Computational Thermodynamics in Python. J. Open Res. Softw. 2017, 5, 1–11. [Google Scholar] [CrossRef]
- Riabkina, M.; Gal-Or, L.; Fishman, Y.; Iram, G. Grain-refined Recrystallized 14-Carat Gold Alloy Effect of small addistions of elements in an Au-Ag-Cu-Zn alloy. Gold Bull. 1984, 17, 1–8. [Google Scholar] [CrossRef]
- Nielsen, J.P.; Tucillo, J.J. Grain size in gold cast alloys. J. Dent. Res. 1966, 45, 964–969. [Google Scholar] [CrossRef]
- Massalski, T.B. Binary Alloy Phase Diagrams; ASM International: Materials Park, OH, USA, 1990. [Google Scholar]
- Dieter, O.; Raub, C.J. Grain Size of Gold and Gold Alloys, a review and some recent developments. Gold Brill. 1981, 14, 69–74. [Google Scholar]
- Khorasani, M.; Ghasemi, A.; Rolfe, B.; Gibson, I. Additive manufacturing a powerful tool for the aerospace industry. Rapid Prototyp. J. 2022, 28, 87–100. [Google Scholar] [CrossRef]
- Boschetto, A.; Bottini, L.; Cardini, V.; Eugeni, M.; Gaudenzi, P.; Veniali, F. Aircraft part substitution via additive manufacturing: Design, simulation, fabrication and testing. Rapid Prototyp. J. 2021, 27, 995–1009. [Google Scholar] [CrossRef]
- Krishnan, M.; Atzeni, E.; Canali, R.; Calignano, F.; Manfredi, D.; Ambrosio, E.P.; Iuliano, L. On the effect of process parameters on properties of AlSi10Mg parts produced by DMLS. Rapid Prototyp. J. 2014, 20, 449–458. [Google Scholar] [CrossRef]
- AlRedha, S.; Shterenlikht, A.; Mostafavi, M.; van Gelderen, D.; Lopez-Botello, O.E.; Reyes, L.A.; Zambrano, P.; Garza, C. Effect of build orientation on fracture behavior of AlSi10Mg produced by selective laser melting. Rapid Prototyp. J. 2021, 27, 112–119. [Google Scholar] [CrossRef]
- Dai, S.; Liao, H.; Zhu, H.; Zeng, X. The mechanism of process parameters influencing the AlSi10Mg side surface quality fabricated via laser powder bed fusion. Rapid Prototyp. J. 2021. [Google Scholar] [CrossRef]
- Noble Metal Alloy Database. Available online: https://thermocalc.com/products/databases/noble-metal-based-alloys/ (accessed on 6 February 2022).
- Database From: Ansara, I.; Dinsdale, A.T.; Rand, M.H. Thermochemical Database for Light Metal Alloys. 1998. Available online: http://www.opencalphad.com/databases/CGNA18499ENC_001.pdf (accessed on 6 February 2022).
- Cacciamani, G.; Saccone, A.; De Negri, S.; Ferro, R. The Al-Er-Mg Ternary System Part II: Thermodynamic Modeling. J. Phase Equilibria 2002, 23, 38. [Google Scholar] [CrossRef]
- Kim, J.; Jung, I.-H. Critical evaluation and thermodynamic optimization of the Si-RE systems: Part II. Si-RE system (RE = Gd, Tb, Dy, Ho, Er, Tm, Lu and Y). J. Chem. Thermodyn. 2015, 81, 273–297. [Google Scholar] [CrossRef]
- Pukas, S.; Łasocha, W.; Gladyshevskii, R. Phase equilibria in the Er–Al–Si system at 873 K. CALPHAD 2009, 33, 23–26. [Google Scholar] [CrossRef]
- Kim, J.; Jung, I.-H. Critical evaluation and thermodynamic optimization of the Si-RE systems: Part I. Si-RE system (RE = La, Ce, Pr, Nd and Sm). J. Chem. Thermodyn. 2015, 81, 253–272. [Google Scholar] [CrossRef]
- Redlich, O.; Kister, A. Algebraic representation of thermodynamic properties and the classification of solutions. Ind. Eng. Chem. 1948, 40, 345–348. [Google Scholar] [CrossRef]
- ThermoCalc Site. Available online: https://thermocalc.com/products/thermo-calc/scheil94solidification-simulations/ (accessed on 20 December 2021).
- Luzan, S.; Listovnichii, V.; Buyanov, Y.; Martsenyuk, J.P.S. Phase diagram of the binary erbium-silicon system and physical properties of erbium silicides up to 1050°C. J. Alloys Compd. 1996, 239, 77–82. [Google Scholar] [CrossRef]
- Copeland, M.I.; Kato, H. In Proc. Symp. Physics and Materials Problems of Reactor Control Rods, 1964, 295–316. Available online: https://inis.iaea.org/collection/NCLCollectionStore/_Public/44/082/44082669.pdf (accessed on 6 February 2022).
- Gorbachuk, N.P.; Kirienko, S.N.; Sidorko, V.R.; Obushenko, I.M. Thermodynamic properties of Er5Si3 in a wide temperature range. Ukr. Khim. Zh. 2006, 72, 20–24. [Google Scholar]
- Gorbachuk, N.P.; Kirienko, S.N.; Sidorko, V.R.; Obushenko, I.M. The enthalpy of ErSi and ErSi1. 67 in the temperature range from 400 to 2300 K. High Temp. 2007, 45, 173–177. [Google Scholar] [CrossRef]
- Marola, S. Aluminium Alloys for Additive Manufacturing: Alloys Microstructure, Rapid Solidification Processes, Testing of Products. Ph.D. Thesis, University of Turin, Turin, Italy, 2020. [Google Scholar]
- Colombo, M.; Morri, E.A. Er addition to Al-Si-Mg-based casting alloy: Effects on microstructure, room and high temperature mechanical properties. J. Alloys Compd. 2017, 708, 1234–1244. [Google Scholar] [CrossRef]
- Lu, Z.; Zhang, L. Thermodynamic description of the quaternary Al-Si-Mg-Sc system and its application to the design of novel Sc-additional A356 alloys. Mater. Des. 2017, 116, 427–437. [Google Scholar] [CrossRef]
- Lu, Z.; Li, X.; Zhang, L. Thermodynamic Description of Al-Si-Mg-Ce Quaternary System in Al-Rich Corner and Its Experimental Validation. J. Phase Equilib. Diffus. 2018, 39, 57–67. [Google Scholar] [CrossRef]


Publisher’s Note: MDPI stays neutral with regard to jurisdictional claims in published maps and institutional affiliations. |
© 2022 by the authors. Licensee MDPI, Basel, Switzerland. This article is an open access article distributed under the terms and conditions of the Creative Commons Attribution (CC BY) license (https://creativecommons.org/licenses/by/4.0/).