Article

Coarsening Kinetics of Y2O3 Dispersoid in New Grade of Fe-Al-Cr-Based ODS Alloy

1
Institute of Physics of Materials and CEITEC IPM, Czech Academy of Sciences, Žižkova 22, 616 00 Brno, Czech Republic
2
Institute of Physics of Materials, Czech Academy of Sciences, Žižkova 22, 616 62 Brno, Czech Republic
*
Author to whom correspondence should be addressed.
Metals 2022, 12(2), 210; https://doi.org/10.3390/met12020210
Submission received: 10 December 2021 / Revised: 14 January 2022 / Accepted: 21 January 2022 / Published: 23 January 2022
(This article belongs to the Special Issue Product Development in Net-Shape Metal Powder Technologies)

Abstract

:
Oxide dispersion strengthened (ODS) alloys with a high content of Al are candidate materials for extreme high temperature applications such as turbine blades and other components working at temperatures significantly above 1000 °C. While oxidation kinetics of Fe–Al ODS steels is frequently studied, the stability and growth kinetics of strengthening oxide dispersion is a rarely studied topic. The Fe-10Al-4Cr-4Y2O3 is an experimental material, fabricated at IPM by powder metallurgy route and contains much higher volume fraction of Y2O3 than similar materials. Stability and growth kinetics of Y2O3 particles of our material are studied on 24 samples aged for 0.5, 1, 2, 4, 8, 16, 32 and 72 h at 1200 °C, 1300 °C and 1400 °C. The sizes of at least 600 individual Y2O3 particles are measured on each sample to obtain extensive statistical analysis of the particle growth. The average particle size coarsens from 28.6 ± 0.7 nm to 36.9 ± 0.9 nm in 1200 °C series and to 81.4 ± 5.6 nm in 1400 °C series. The evaluated activation energy of coarsening of Y2O3 particles is 274 ± 65 kJ. The effects of particle coarsening on mechanical properties is demonstrated by HV measurements, which is in very good agreement with the Orowan theory.

Graphical Abstract

1. Introduction

The Fe-Al-Cr-based alloys such as Kanthal are promising materials due to their excellent oxidation resistance at high temperatures. They are also considered as a replacement for high Cr steels used so far [1]. The Fe-Al-Cr alloys can be divided into two distinct groups: (i) intermetallics with high Al content and (ii) ferritic solid solutions with Al content below 10 wt %. Both groups demonstrate an excellent oxidation resistance by forming a protective alumina layer on their surfaces. The first group suffers from low ductility, formability and toughness at room temperature, which significantly limits their practical applications [2,3,4,5]. The second group suffers from poor creep resistance if matrix is not sufficiently strengthened by dispersoid of carbides, nitrides or oxides.
Oxide dispersion strengthening (ODS) is one of the approaches to improve mechanical behavior of alloys at high temperatures (up to 1300 °C). Steels employing this strengthening mechanism are investigated as potential materials to be used in energy industry and even in fusion reactors [6,7]. The matrix of ferritic ODS alloys is usually strengthened by very fine dispersion of Y-Al-Ti based oxides with size typically ranging from 5 to 30 nm and typical volume fraction below 1%. Much attention is paid to the powder metallurgical process of fabrication of ODS alloys, which includes mechanical alloying followed by consolidation via spark plasma sintering [8,9,10], hot isostatic pressing [11,12], hot extrusion [13] or a combination of mentioned methods. Even though the Fe-Al-Cr ODS alloys excel at high temperature oxidation and creep properties, they are difficult to join by conventional welding techniques [14].
Our team strives for several years to develop an alloy with the best possible resistance to oxidation and creep at temperatures of 1100–1300 °C). This has led to an increase in the Al content in the new grade [15,16,17,18] Fe-Al-Cr-based ODS alloy to 10 wt. % and the volume fraction of pure Y2O3 to 5%.
The excellent creep resistance of the ODS alloys at temperatures 1000–1300 °C is due to high resistance of oxide dispersoid against coarsening. While growth kinetics and other aspects of the protective alumina layer on Fe-Al-Cr-based alloys have been studied quite thoroughly [19,20,21,22,23], the information about coarsening of dispersion of nano-oxides in the ODS alloys are significantly rarer.
The aim of this paper is to investigate the coarsening kinetics of the Y2O3 dispersoid in the new grade of the Fe-Al-Cr ODS alloy at 1200 °C, 1300 °C and 1400 °C for 0.5 up to 72 h. This is achieved by analyzing the size distribution evolution of the Y2O3 dispersoid and determining the respective kinetic constants and their activation energy. Furthermore, the hardness is correlated with the Y2O3 dispersoid coarsening.

2. Materials and Methods

The material used in this study of chemical composition Fe-10Al-4Cr-4Y2O3 is prepared by mechanical alloying of the input Fe, Al, Y2O3, Cr and Y powders or granulates of typical size of 100 μm, 100 μm, 5 μm, 3 mm and 3 mm. All inputs are of purity 99.9 wt %. The amount of added metallic Y granulates is 1 wt % to compensate the O adsorbed at surfaces of the Fe and Al powders and to guarantee that the dispersoid consists exclusively of pure Y2O3, which is the most stable oxide against coarsening. During mechanical alloying of total 1.5 kg input powders in the evacuated self-made attritor of diameter 400 mm with 100 bearing balls of size 40 mm rotating with 70 rpm along horizontal axis for two weeks the inputs homogenize up to atomic level. The resultant powder consists of homogeneous alloy with a huge amount of defects like dislocations of estimated density 1017 m−2. The complete dissolution of Y2O3 is allowed by trapping of O and Y at dislocation cores [24]. After mechanical alloying, the powder is canned in an evacuated steel tube 20/1 mm and hot consolidated by rolling in three steps to thickness 8 mm at 870 °C, to thickness 5 mm at 900 °C and to thickness 3.25 mm at 900 °C. During hot rolling provoking the strain rate of about 10 s−1, an intensive dynamic recrystallization occurs, which leads to formation of ultra-fine equiaxed grain microstructure. Then, the hot rolled sheet is stripped from the can and annealed at 1200 °C/4 h to induce secondary recrystallization. The oxides nucleate and grow already during hot rolling up to the size of 5 nm and they coarsen to 20–30 nm during annealing provoking secondary recrystallization. The processing steps following the mechanical alloying are discussed in detail and described by a quantitative model in [25]. The specimens were aged in a furnace (Clasic cz s.r.o., Řevnice, Czech Republic) in alumina crucibles. After ageing was completed, the specimen in the alumina crucible was removed and left to cool in the air. The oxide distribution of the as-received specimen is documented on Figure 1 by bright-field (BF) scanning transmission electron microscopy (STEM) micrographs. Figure 1a demonstrates the homogeneous distribution of Y2O3 oxides and Figure 1b shows a detailed view. The micrographs in Figure 1a,b were recorded using the transmission electron microscope (TEM) Talos F200i (ThermoFisher Scientific Inc., Waltham, MA, USA) operating at 200 keV. The specimen in a form of thin lamella was lifted out by standard procedures on Helios dual beam microscope. Figure 1c shows a micrograph taken by the TEM JEOL JEM-2100F (Jeol, Ltd., Tokyo, Japan). A TEM transparent foil in Figure 1c was thinned electrolytically in the TenuPol 5 until final perforation. An electrolyte with a composition 950 mL of acetic acid and 50 mL of perchloric acid provided optimum thinning conditions at 12 °C and 80 V. An energy dispersive spectrum (EDS) presented in Figure 1d was acquired by a detector X-Max80 from Oxford Instruments using the AZtec software (Oxford Instruments plc, Abingdon, UK).
In order to minimize the influence of the surrounding matrix, the EDS measurements were performed randomly on several oxides near the thin edge of the foil, see Figure 1c as an example. Corresponding EDS data are listed in Table 1. The investigated particles are composed primarily of O and Y with a small content (mostly under 10 at%) of iron and negligible additions of Cr and/or Al.

3. Results

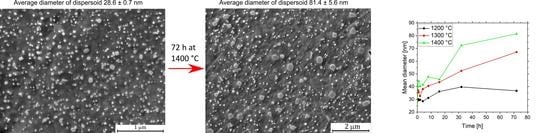
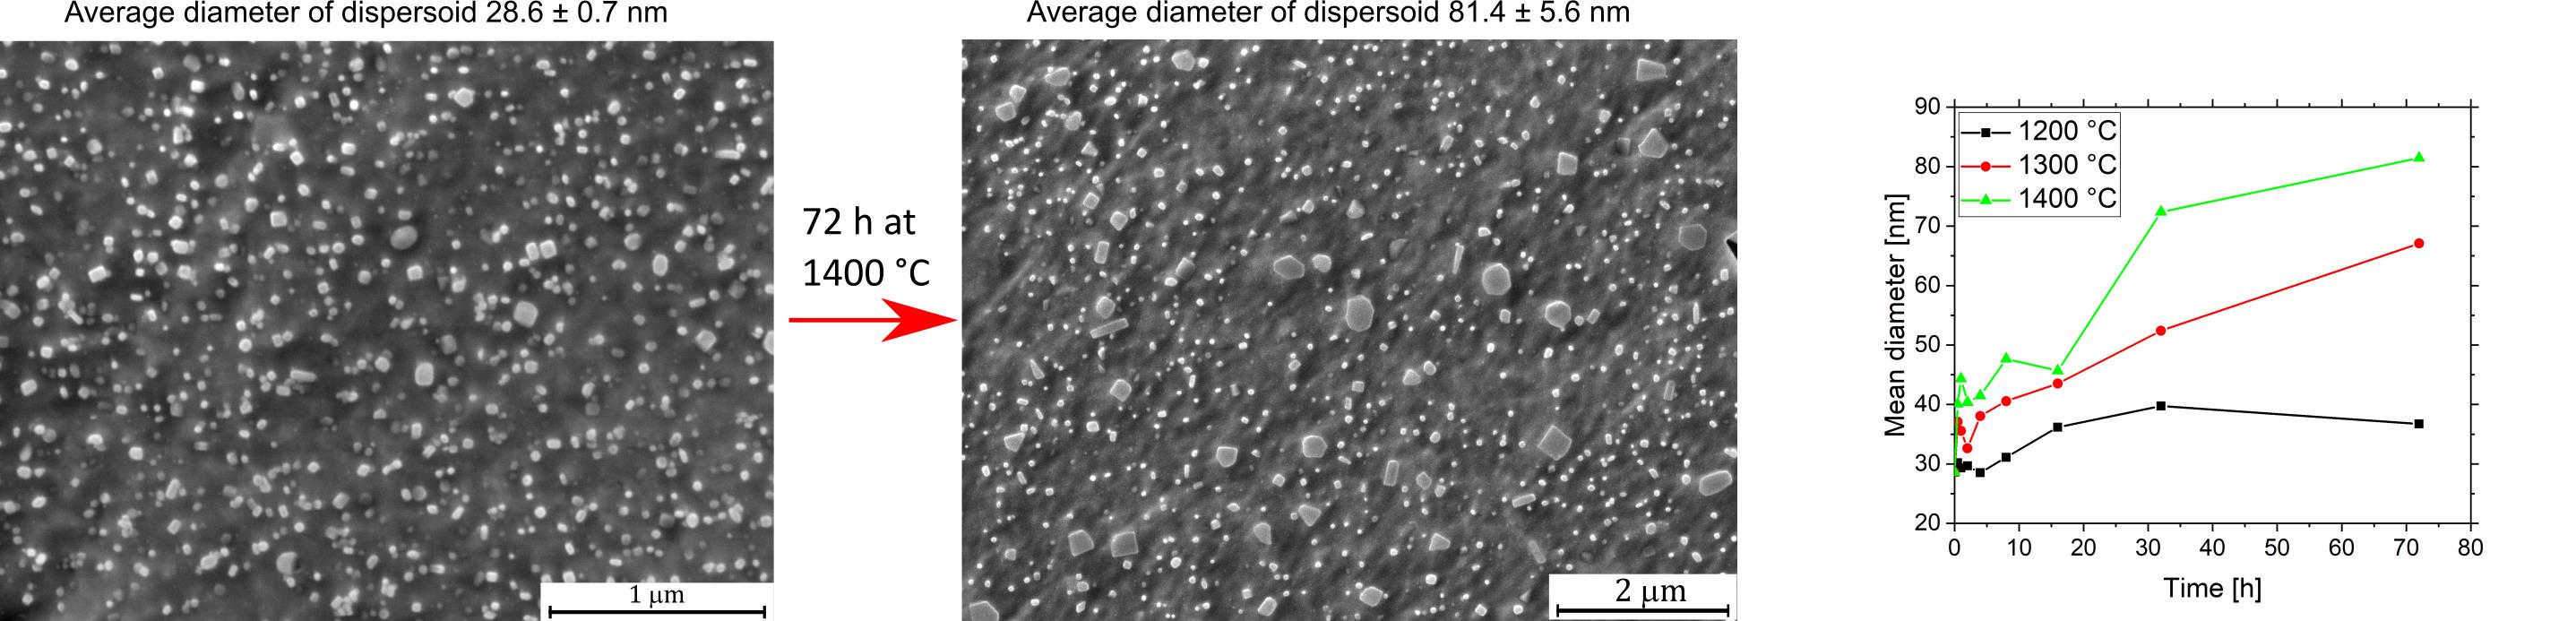
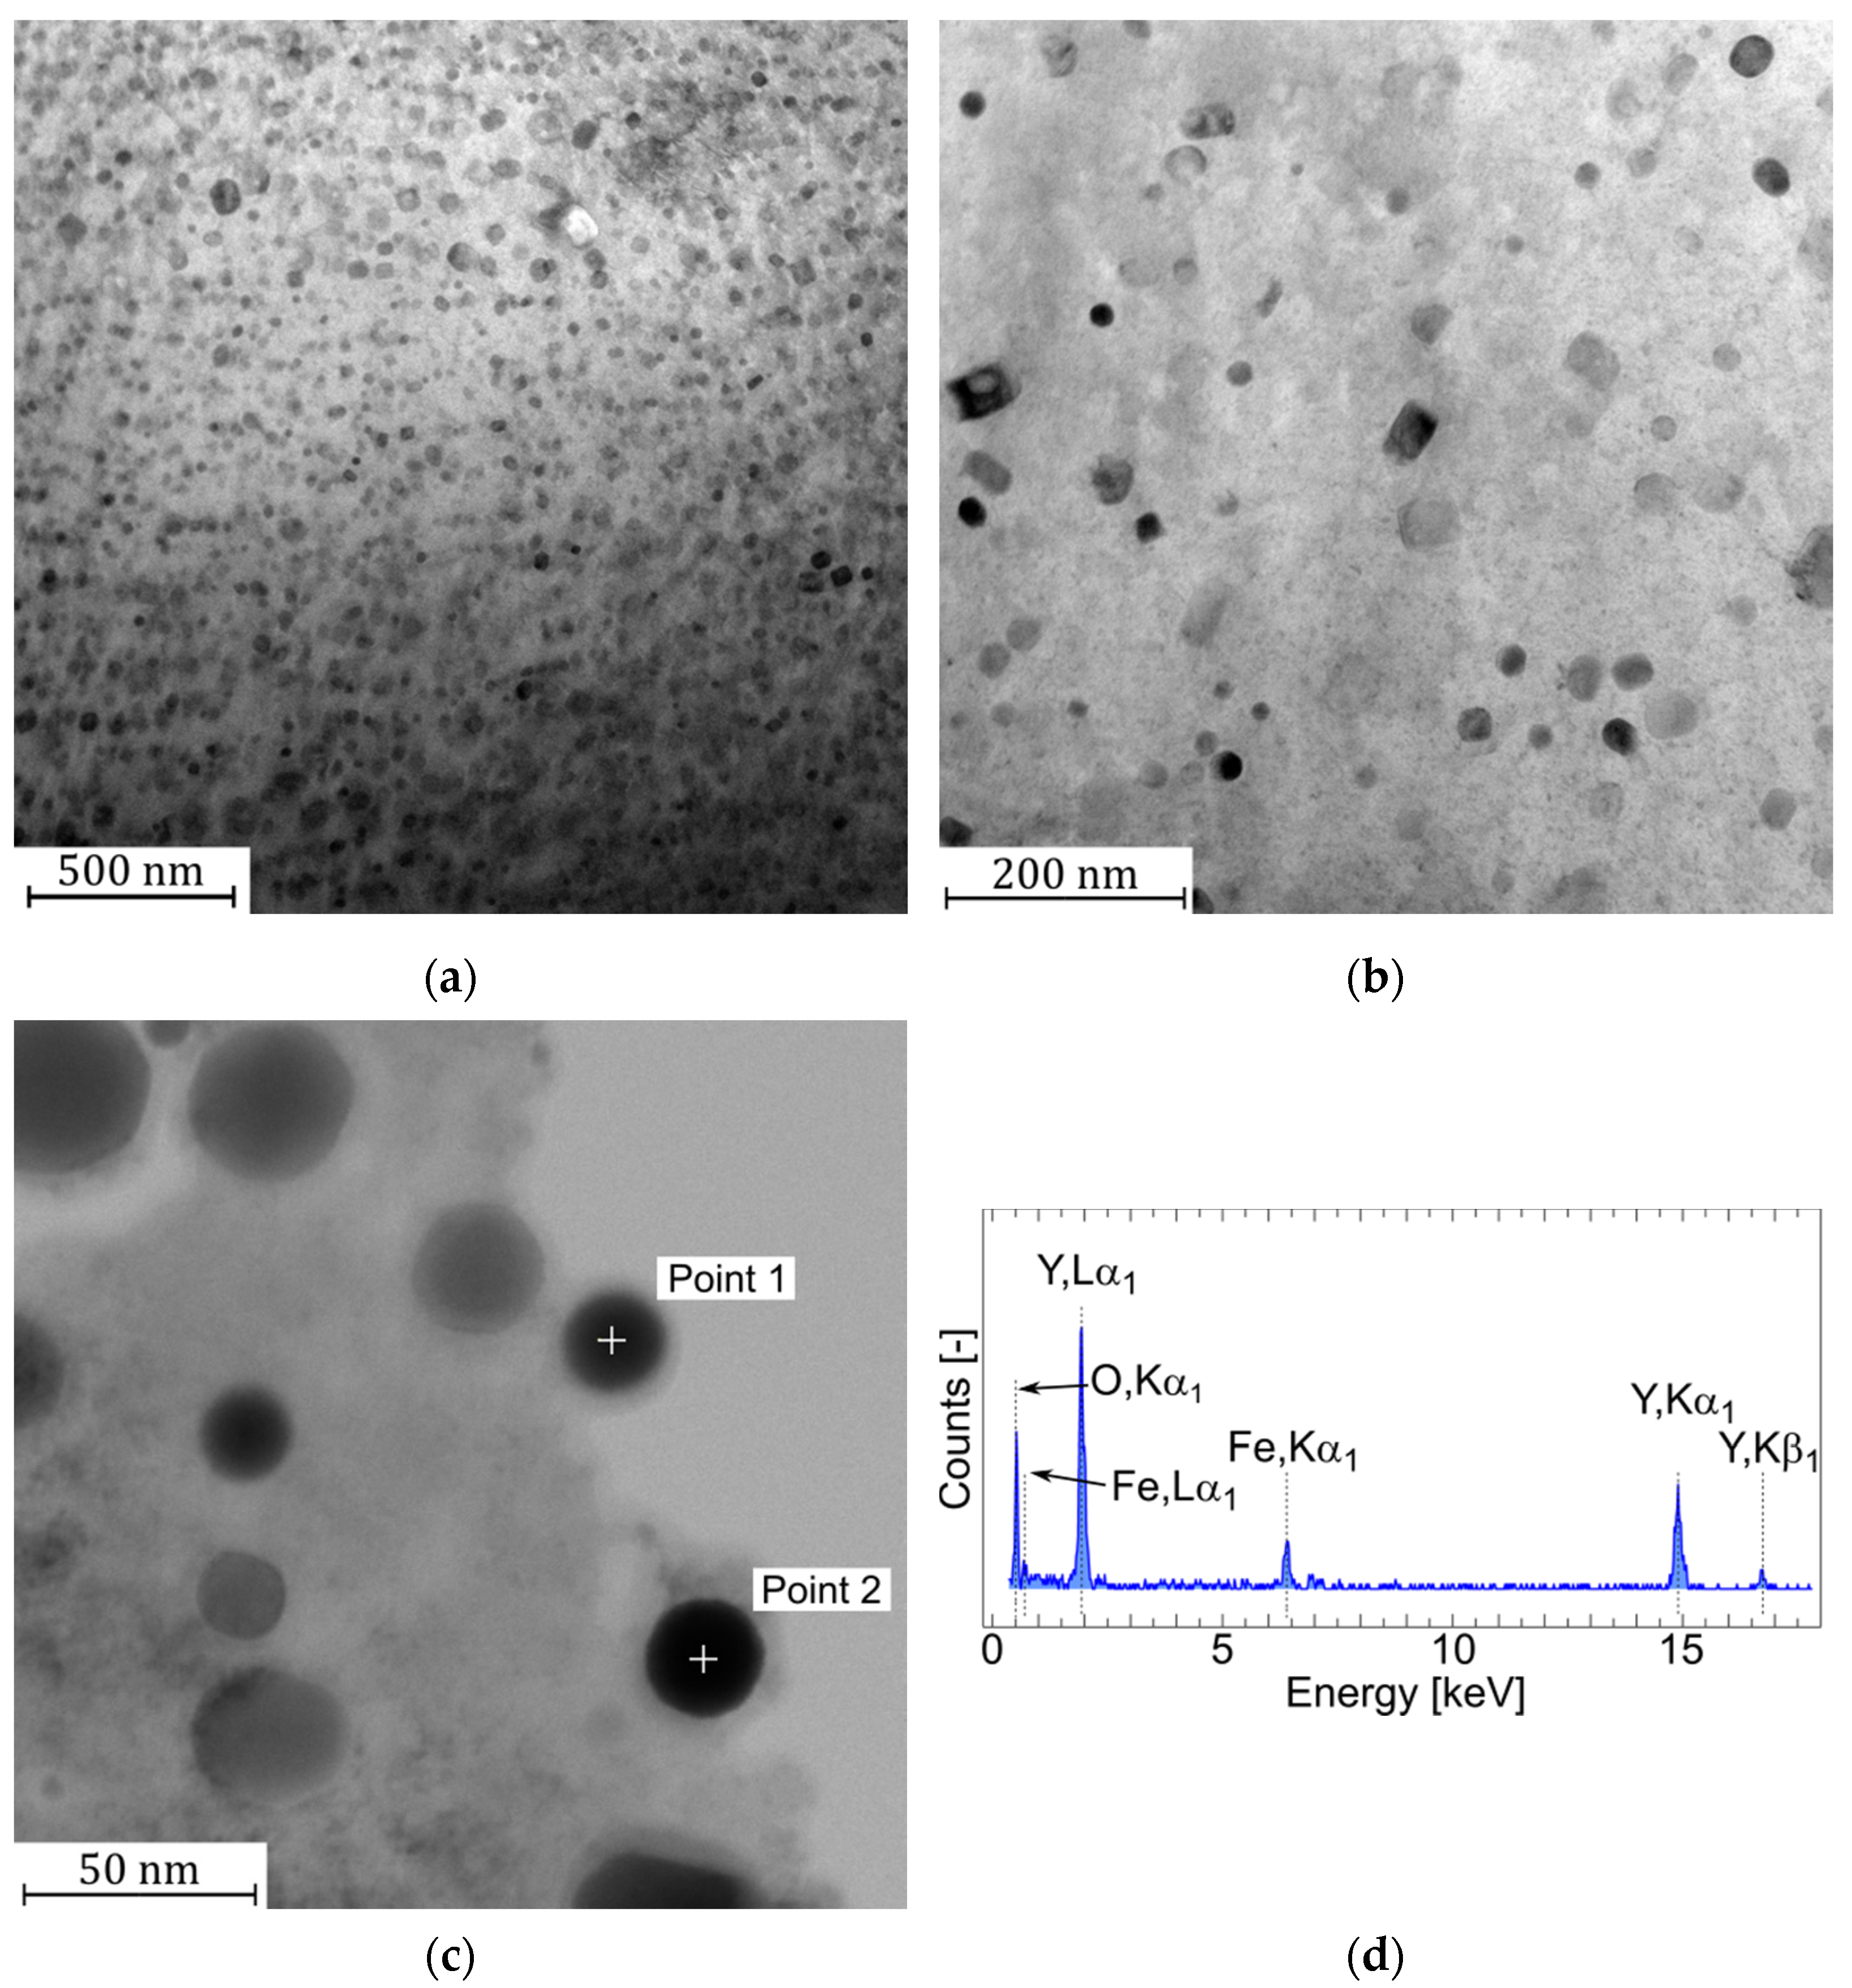
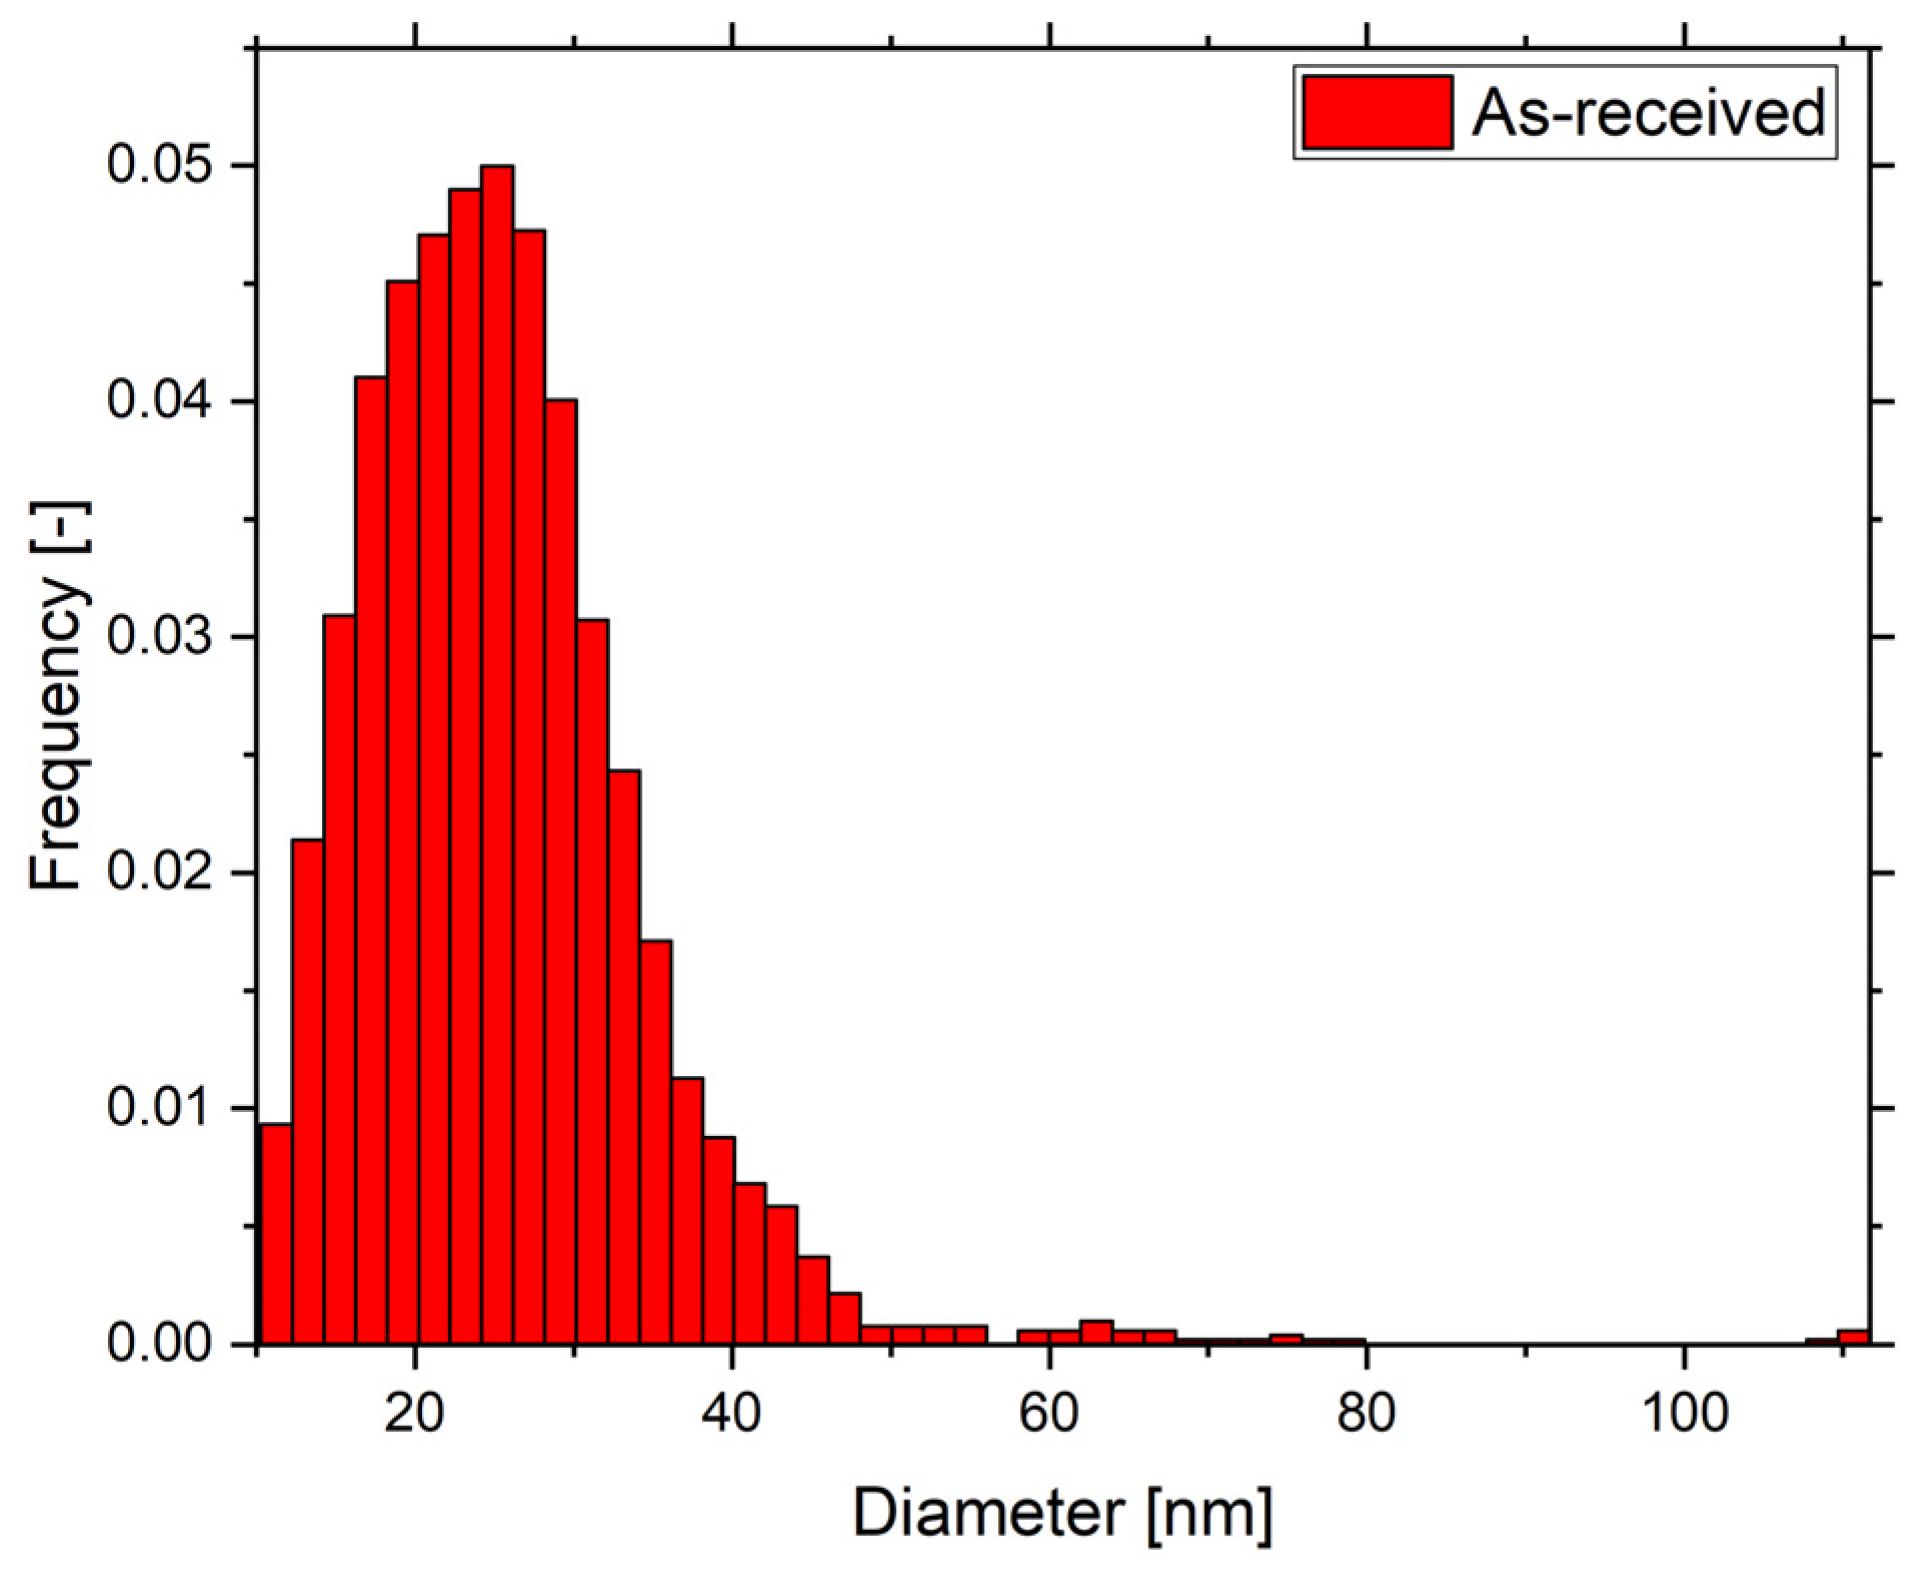
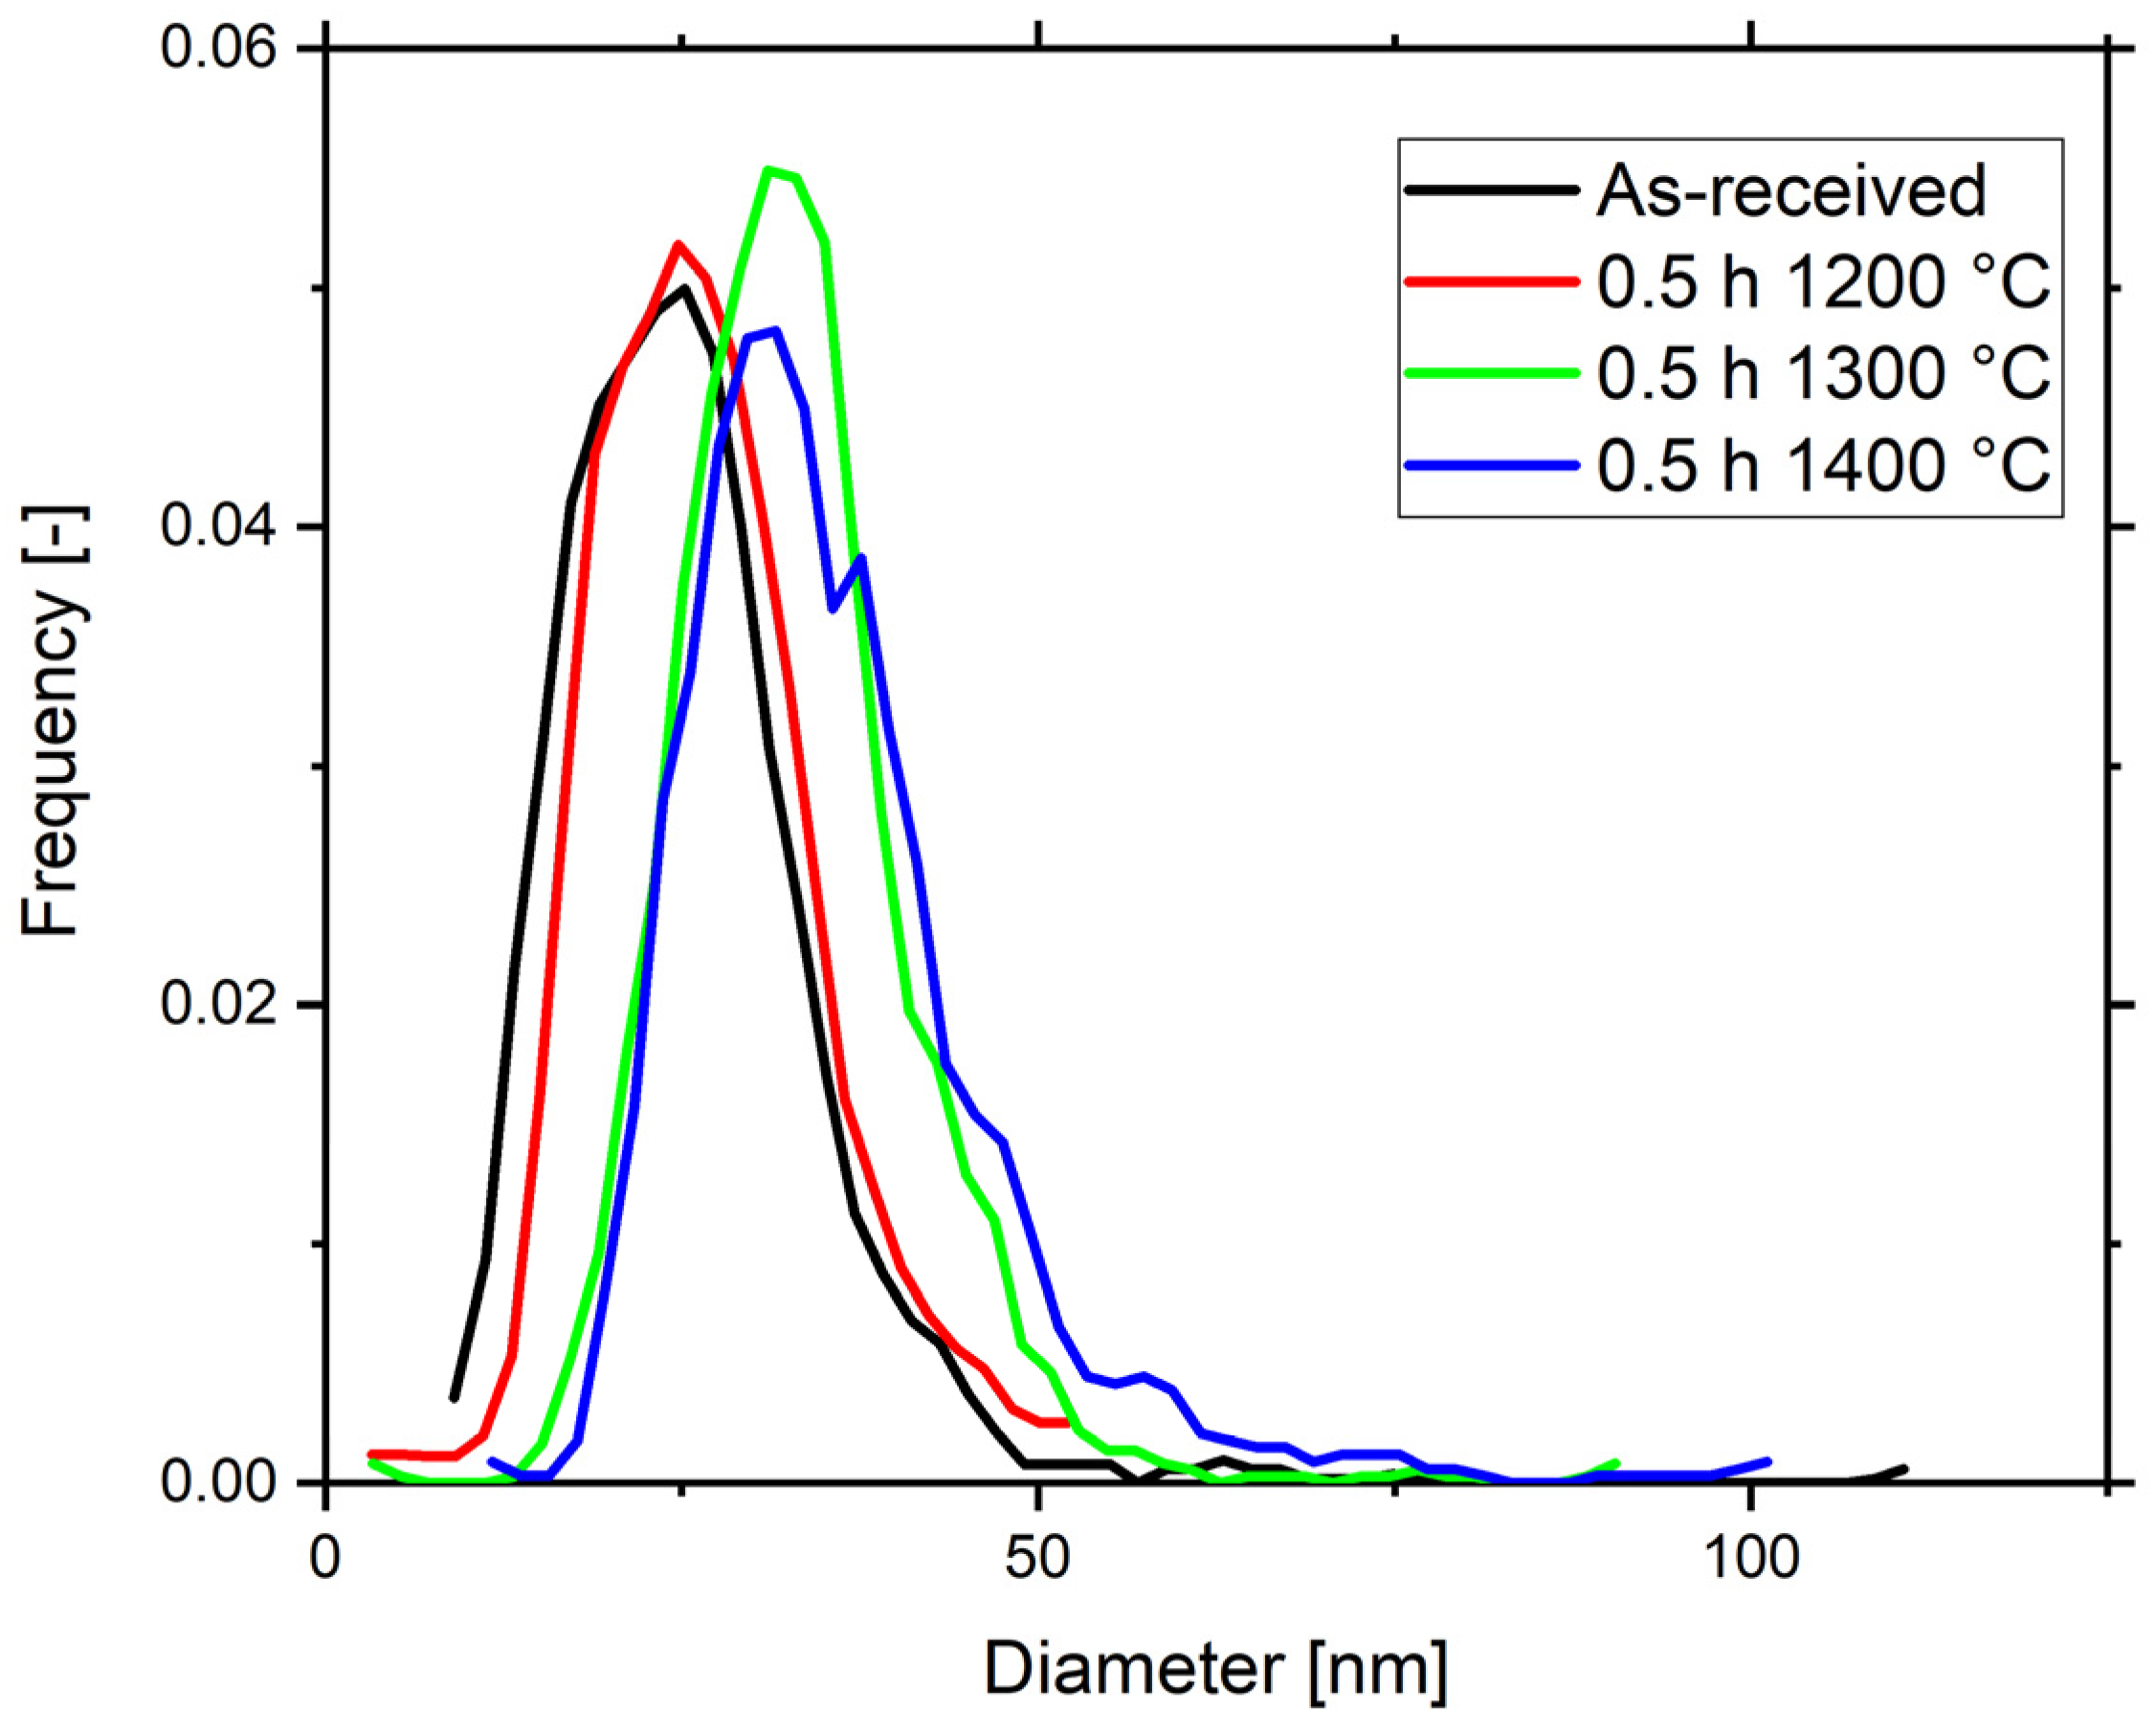
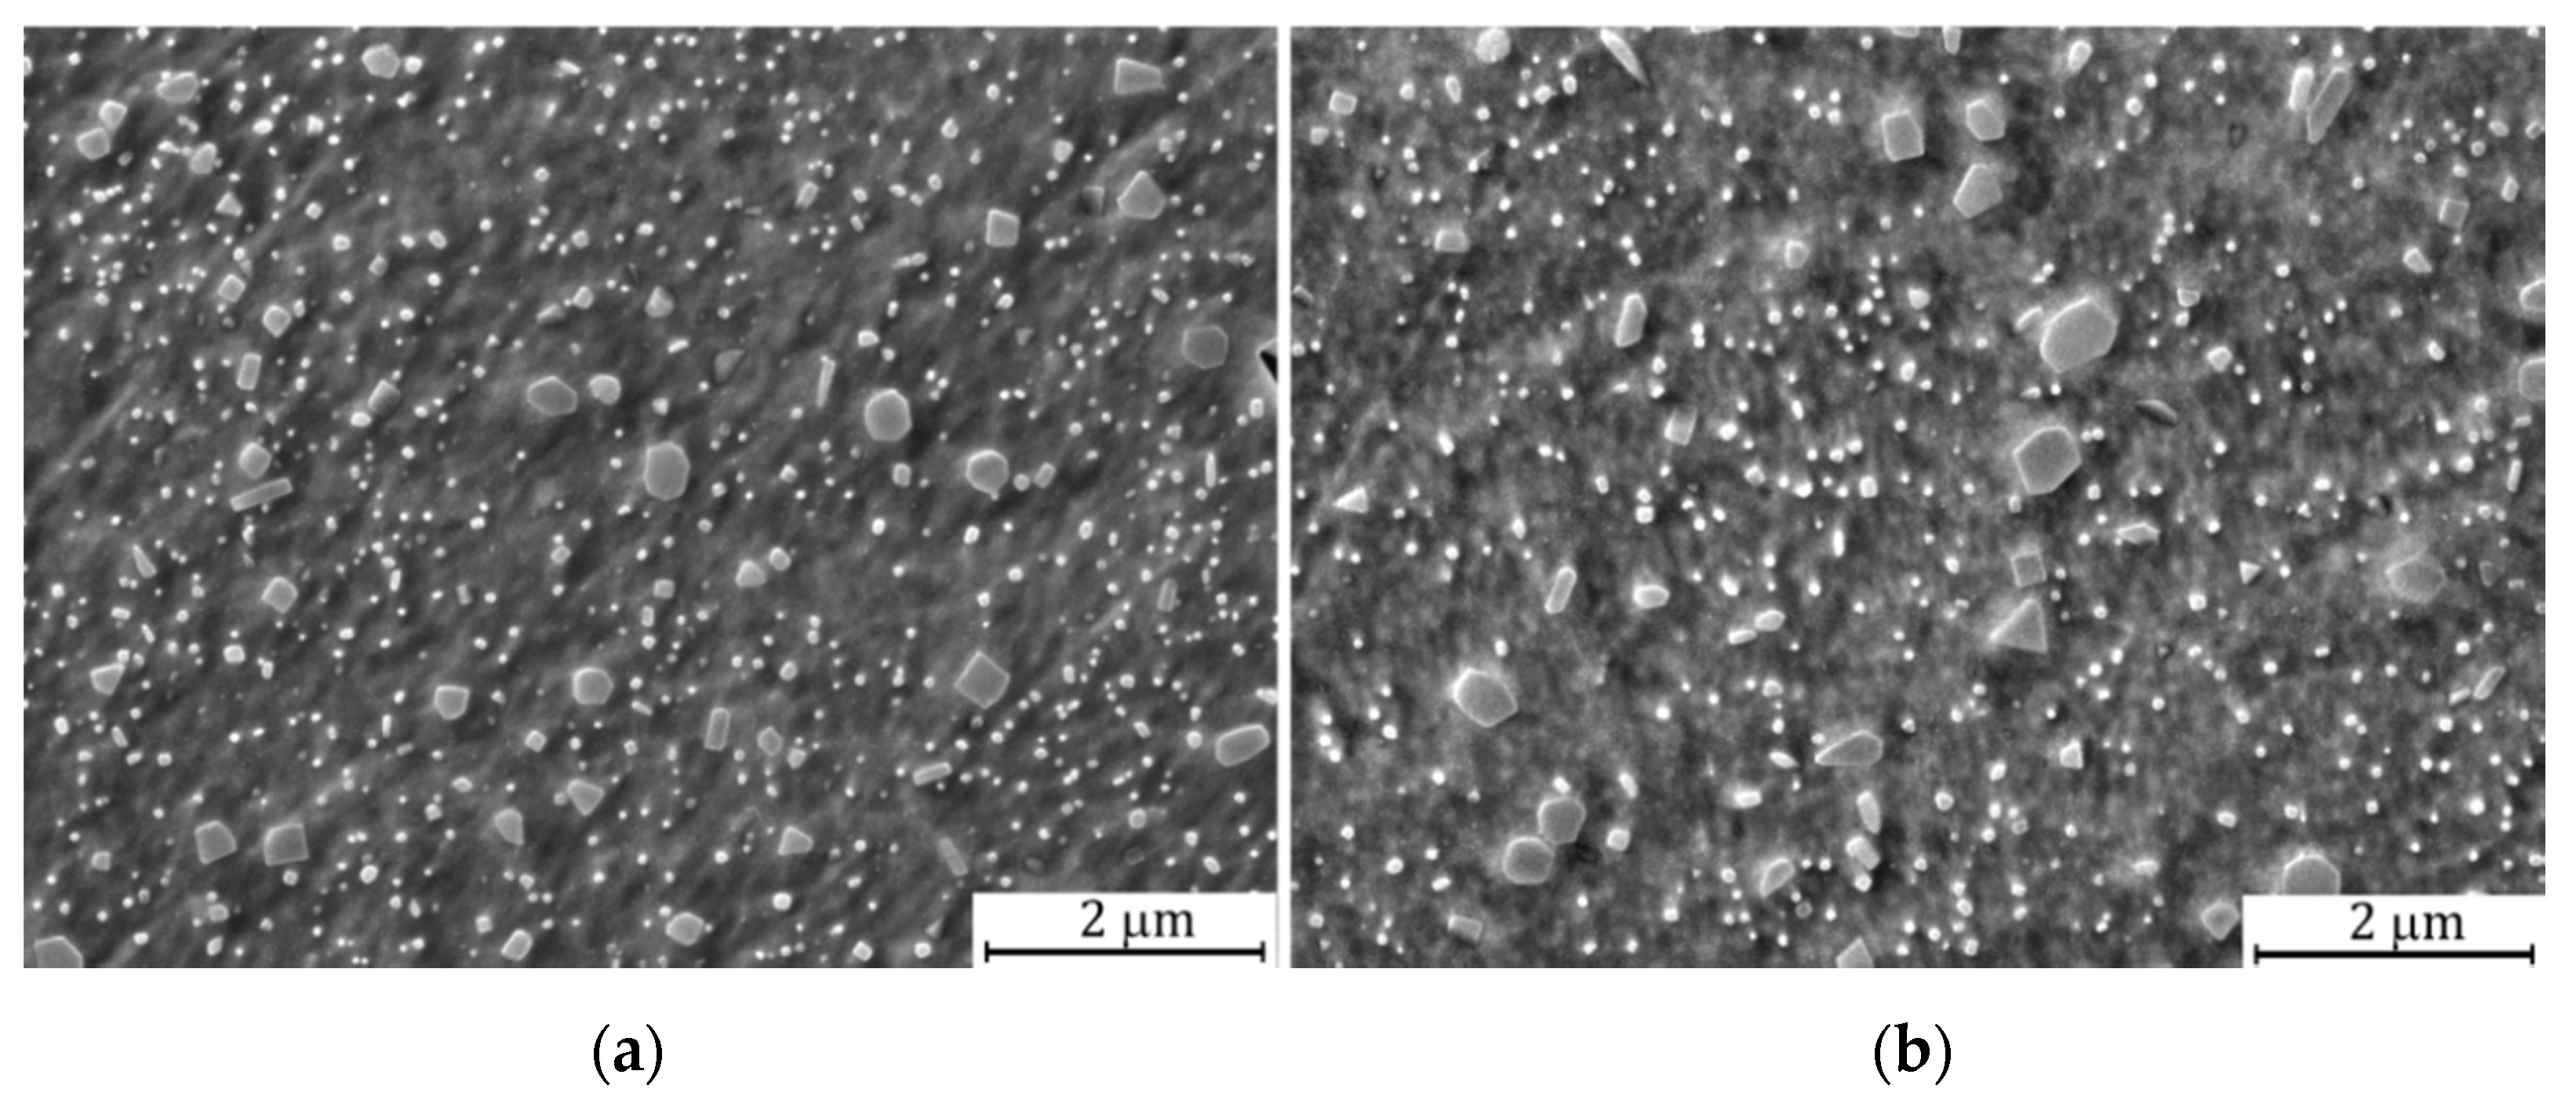
3.1. Microstructure and Particle Analysis of Y2O3 Dispersoid

Micrographs of dispersoid at each condition (temperature and time) are taken on a SEM and size distribution of dispersoid is evaluated by ImageJ software [26]. As brightness threshold is not sufficient to differentiate the particles from the matrix and agglomerates, brightness is lowered, and the borders of the oxides are manually highlighted with white color to assure an accurate area analysis. For each condition, the amount of analyzed particles exceeded 600. The nano-oxides are considered as spherical particles. Their projected area is measured by the image analyzer and the particle size corresponds to the diameter of the circle with the same area. The example of the analysis is demonstrated in Figure 2. Figure 2a shows the SEM picture of the dispersoid, and Figure 2b demonstrates the mask used for the image processing software.
The distribution analysis of oxides in Figure 2 is represented as a normalized histogram in Figure 3. The mean diameter D of oxides is 28.6 ± 0.7 nm (computed as 95% confidence interval; 95% confidence intervals of mean will be used in the manuscript unless stated otherwise). Although in the as-received state, large oxides (>50 nm in diameter) are present, the majority of oxides have diameters around 30 nm and distribution does not seem bimodal.
For an easier comparison of several histograms, lines are used in Figure 4 to represent the histograms of as-received state and specimens aged at 1200 °C, 1300 °C and 1400 °C for 30 min. While the difference between as-received state and aged state at 1200 °C for 30 min is statistically insignificant, the aged at 1300 °C and 1400 °C for a 30 min period shifts the average size of the oxides towards detectably higher values. Furthermore, all oxide size distributions display visible right skewing (most pronounced for 1400 °C). Such skewing is exhibited by the deviation of median from mean value, see Table 2, and suggests the start of evolution towards a bimodal distribution.
The comparison of all specimens aged at 1200 °C is shown in Figure 5a. A detectable coarsening of the dispersoid starts between 8 and 16 h. Further coarsening of the oxides is demonstrated after this time if the scatter of the statistical treatment is taken into consideration. A higher variation of the oxide distributions is observed for specimens aged at 1300 °C shown in Figure 5b. A significant widening of the distribution emerges after 4 h of ageing and is more apparent with increasing time. The largest widening is observed for specimens aged for 32 and 72 h. A similar trend is observed for specimens aged at 1400 °C, whose oxide size distributions are shown in Figure 5c. Only small changes to the distribution are observed within the first 4 h of the aging and a significant increase in mean oxide size is observed later on. Largest changes are evident, similarly to 1300 °C case, after 16 h when oxide size increases rather quickly. The dependencies of mean diameter of the oxides on the aging time, accounting also sporadic oxides of size above 100 nm, are summarized in Figure 5d, which clearly demonstrates a significant dependence of coarsening kinetics on aging temperature.

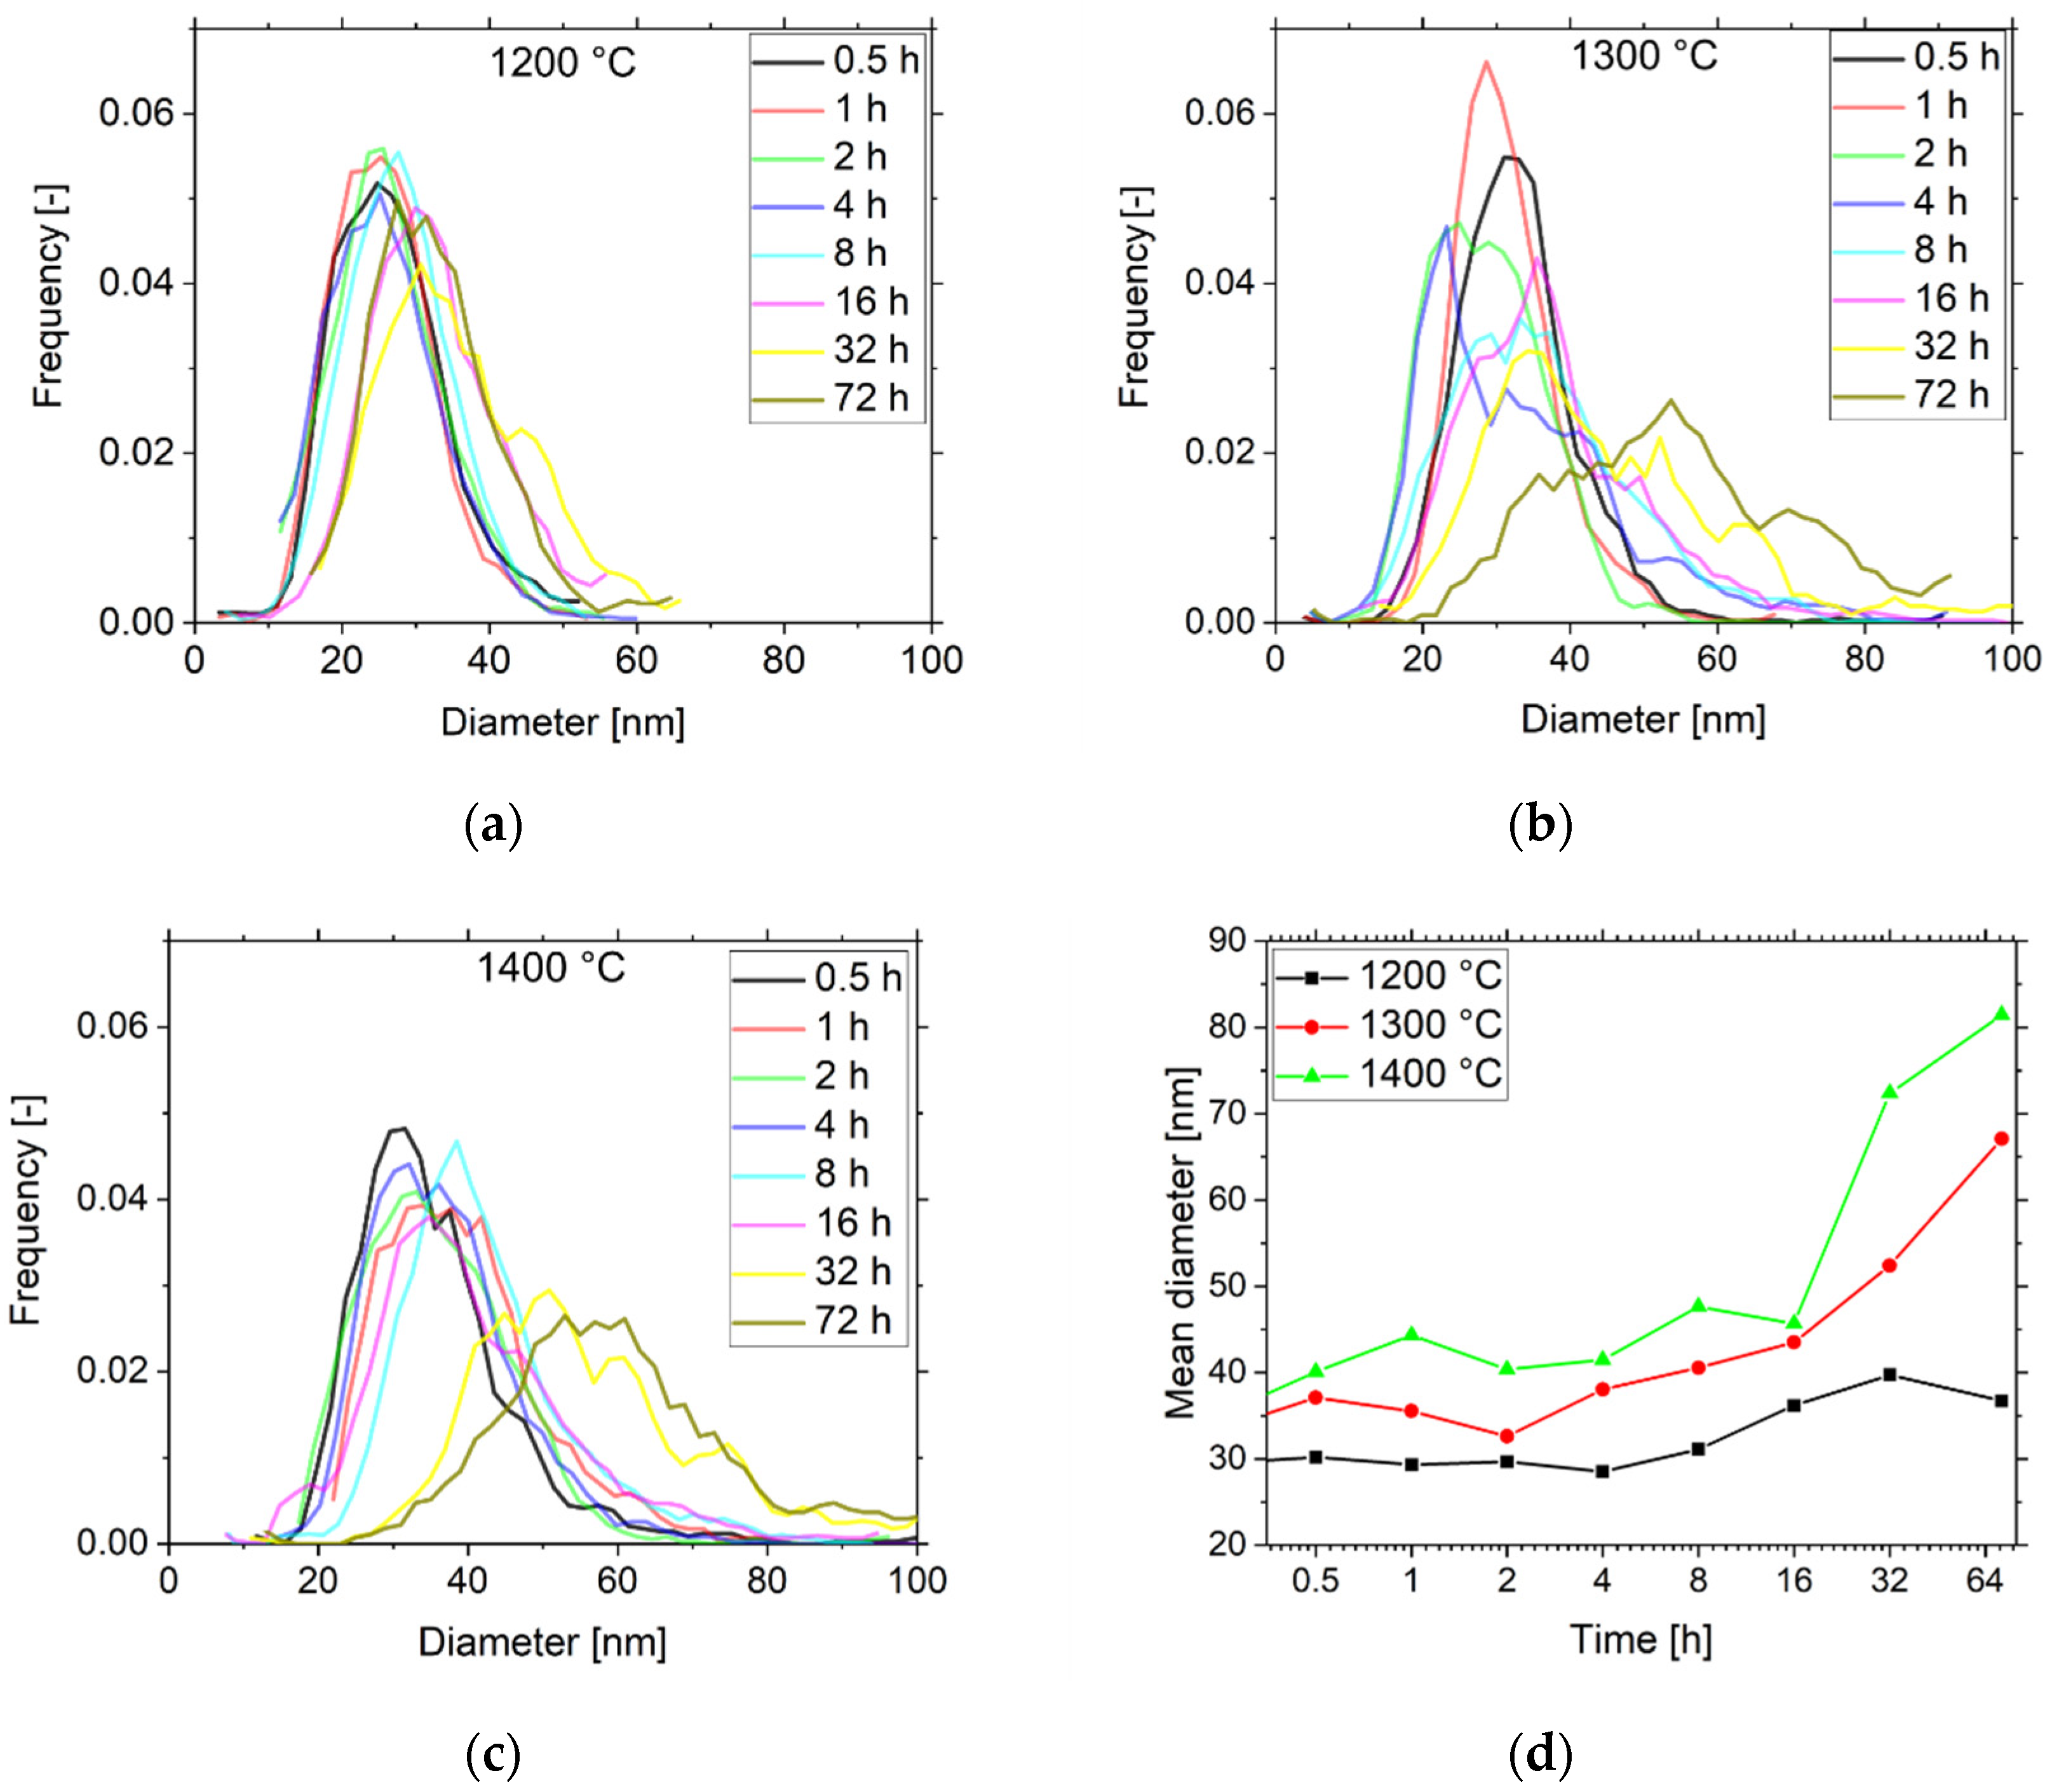
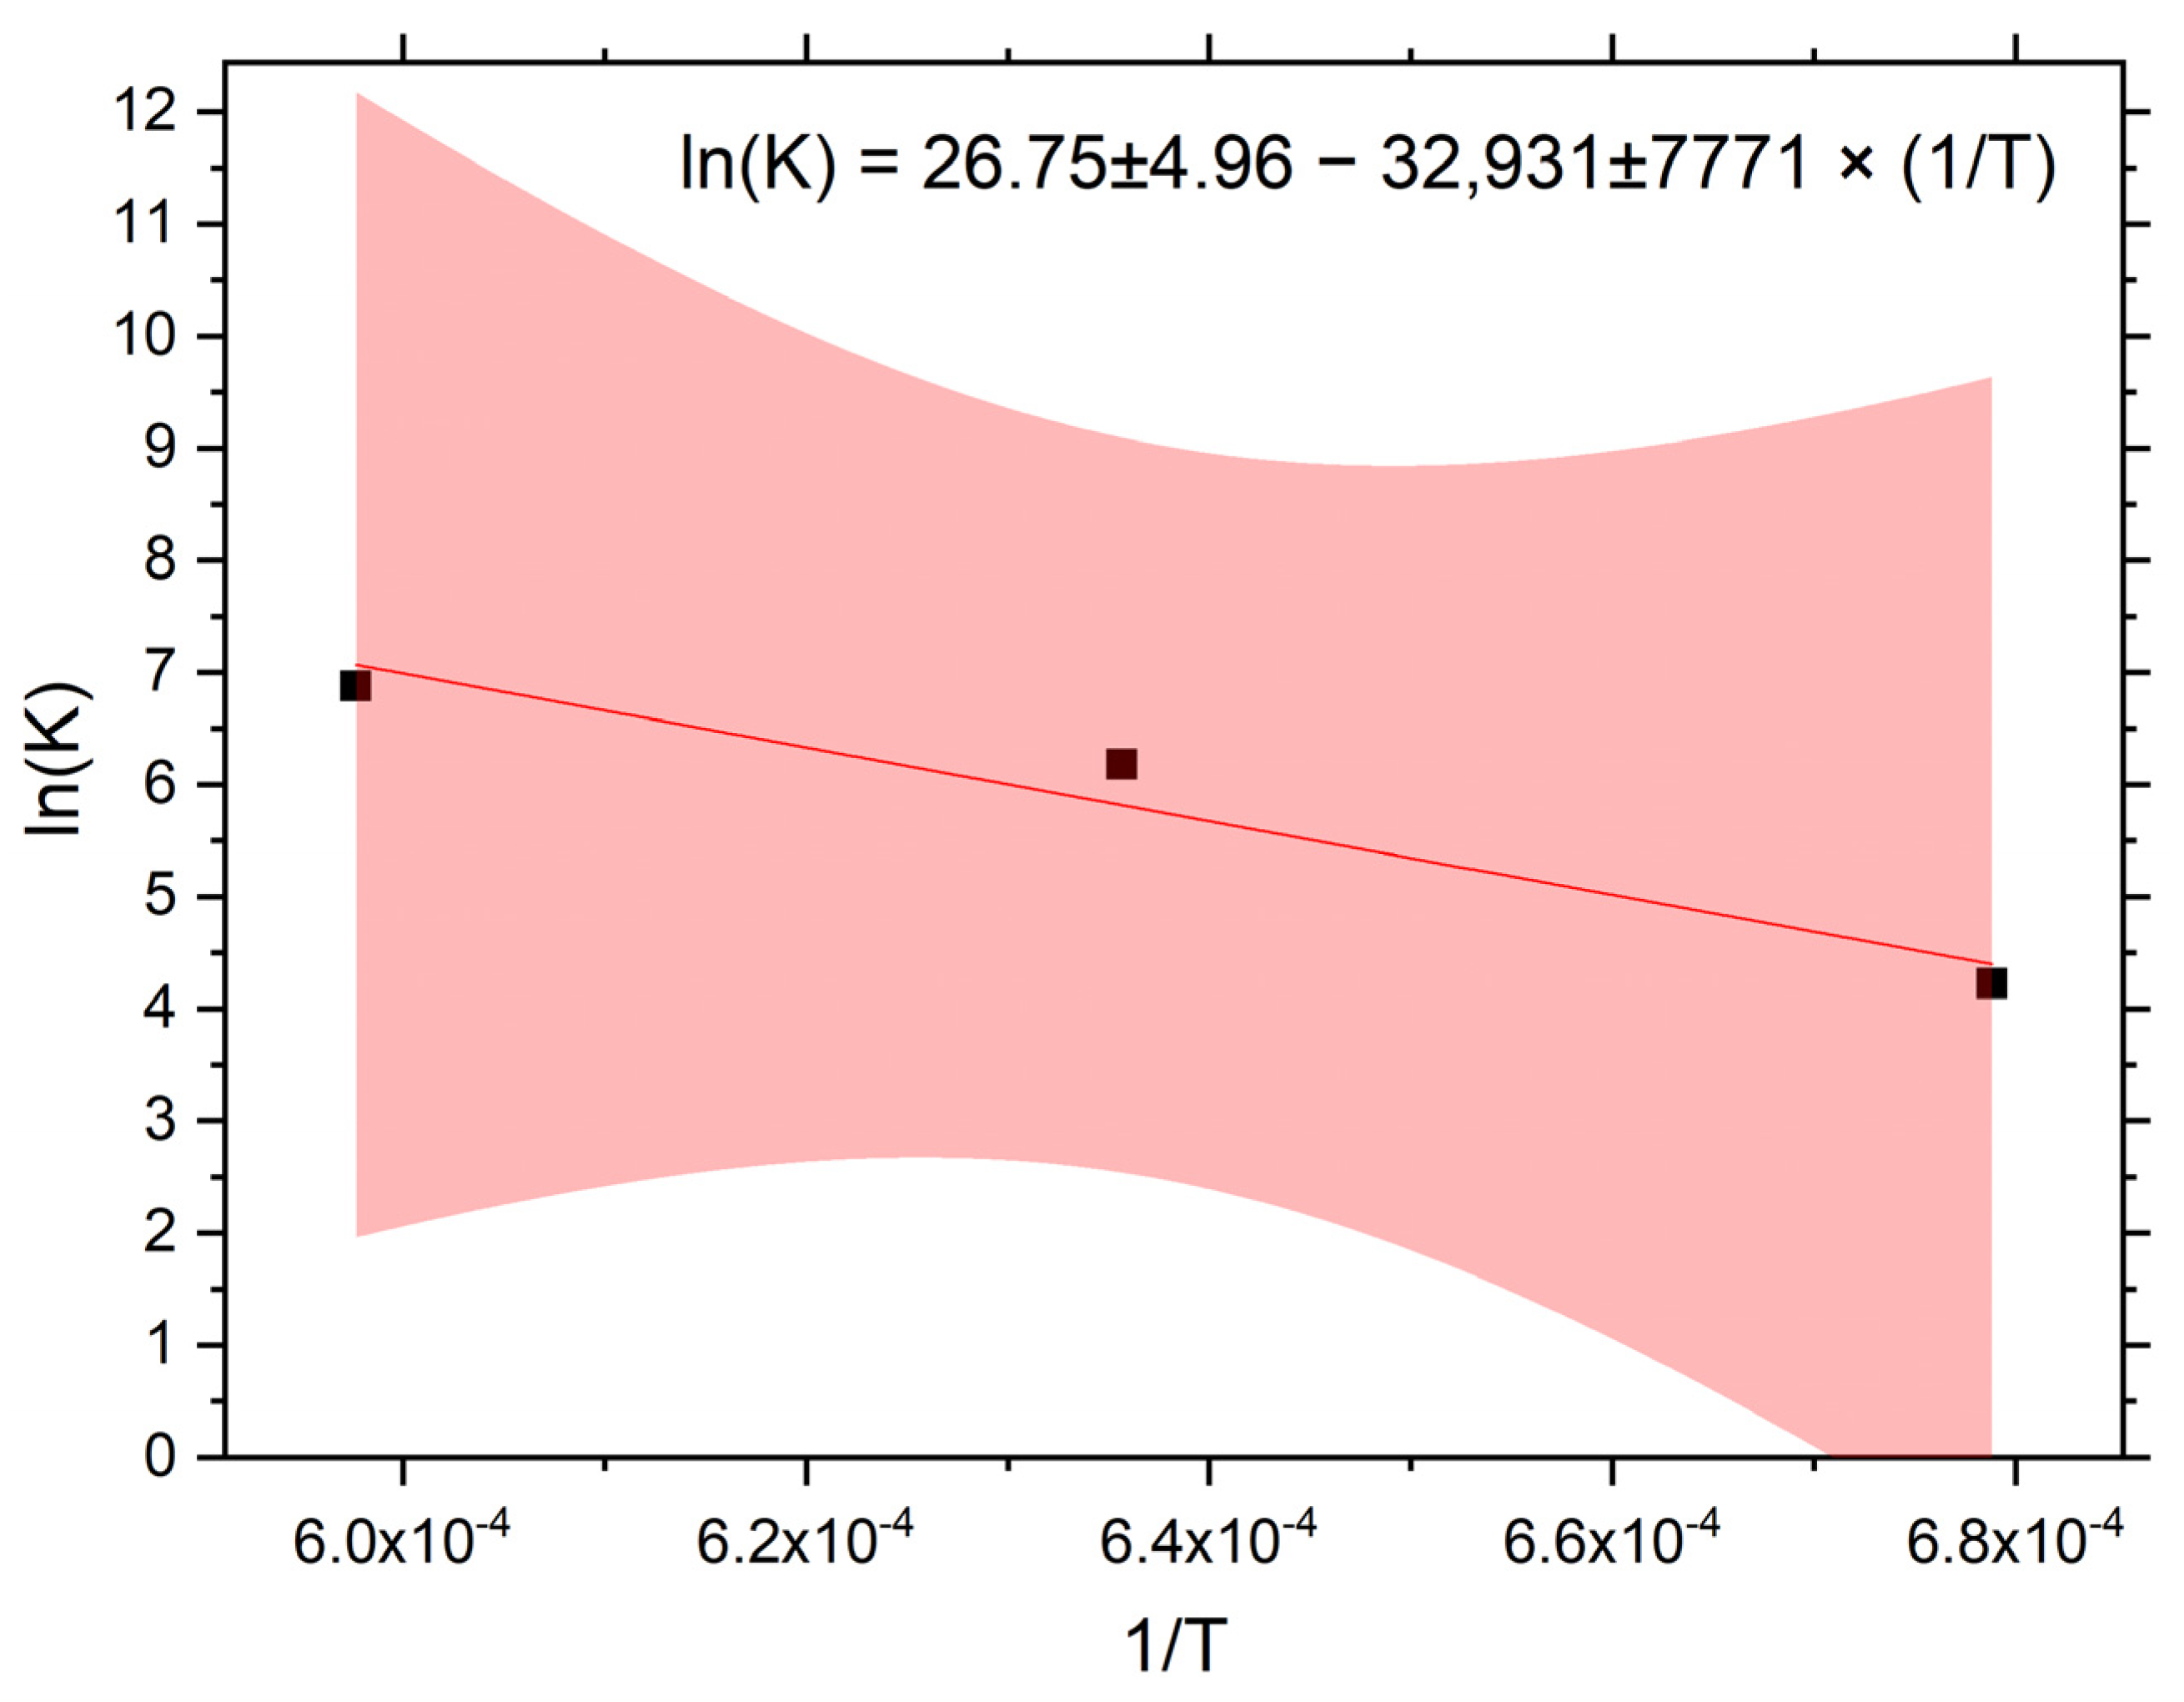
3.2. Dispersoid Coarsening and Calculation of Activation Energy of Y2O3

The evolution of the size distributions and the growth of the average size of the oxides indicates that the oxides coarsen via Ostwald ripening, during which the small oxides are dissolved in the matrix and their matter is utilized for the growth of the large ones. The kinetic relationship for the lattice diffusion controlled precipitate coarsening through Ostwald ripening is given by equation:
r t 3 r 0 3 = K   ·   t ,
where rt and r0 are mean value of oxide radius at time t and initial oxide radius, respectively. t is time and K is the rate constant described by the equation as
K = A   ·   e Q R T ,
where A is the pre-exponential factor, Q is the activation energy, R is the gas constant and T is absolute temperature. The K term in Equation (2) is obtained for each temperature by using linear regression of the r t 3 r 0 3 data set by using zero absolute term. After logarithmic conversion, Equation (2) reads
ln ( K ) = ln ( A ) Q R T .
By applying linear regression to Equation (3) with the K factors obtained from previous series of linear regressions, the pre-exponential factor A and the activation energy Q is obtained. The result of the linear regression is shown in Figure 6.
The final results obtained from fitting Equation (3), shown in Figure 6, together with propagated errors, are A = 4.2 × 10¹¹ ± 2.0 × 10¹² and Q = 274 ± 65 kJ. The activation energy of coarsening has a close relation to the formation enthalpy of the oxides and Y2O3 has the largest one as it is shown in [18].

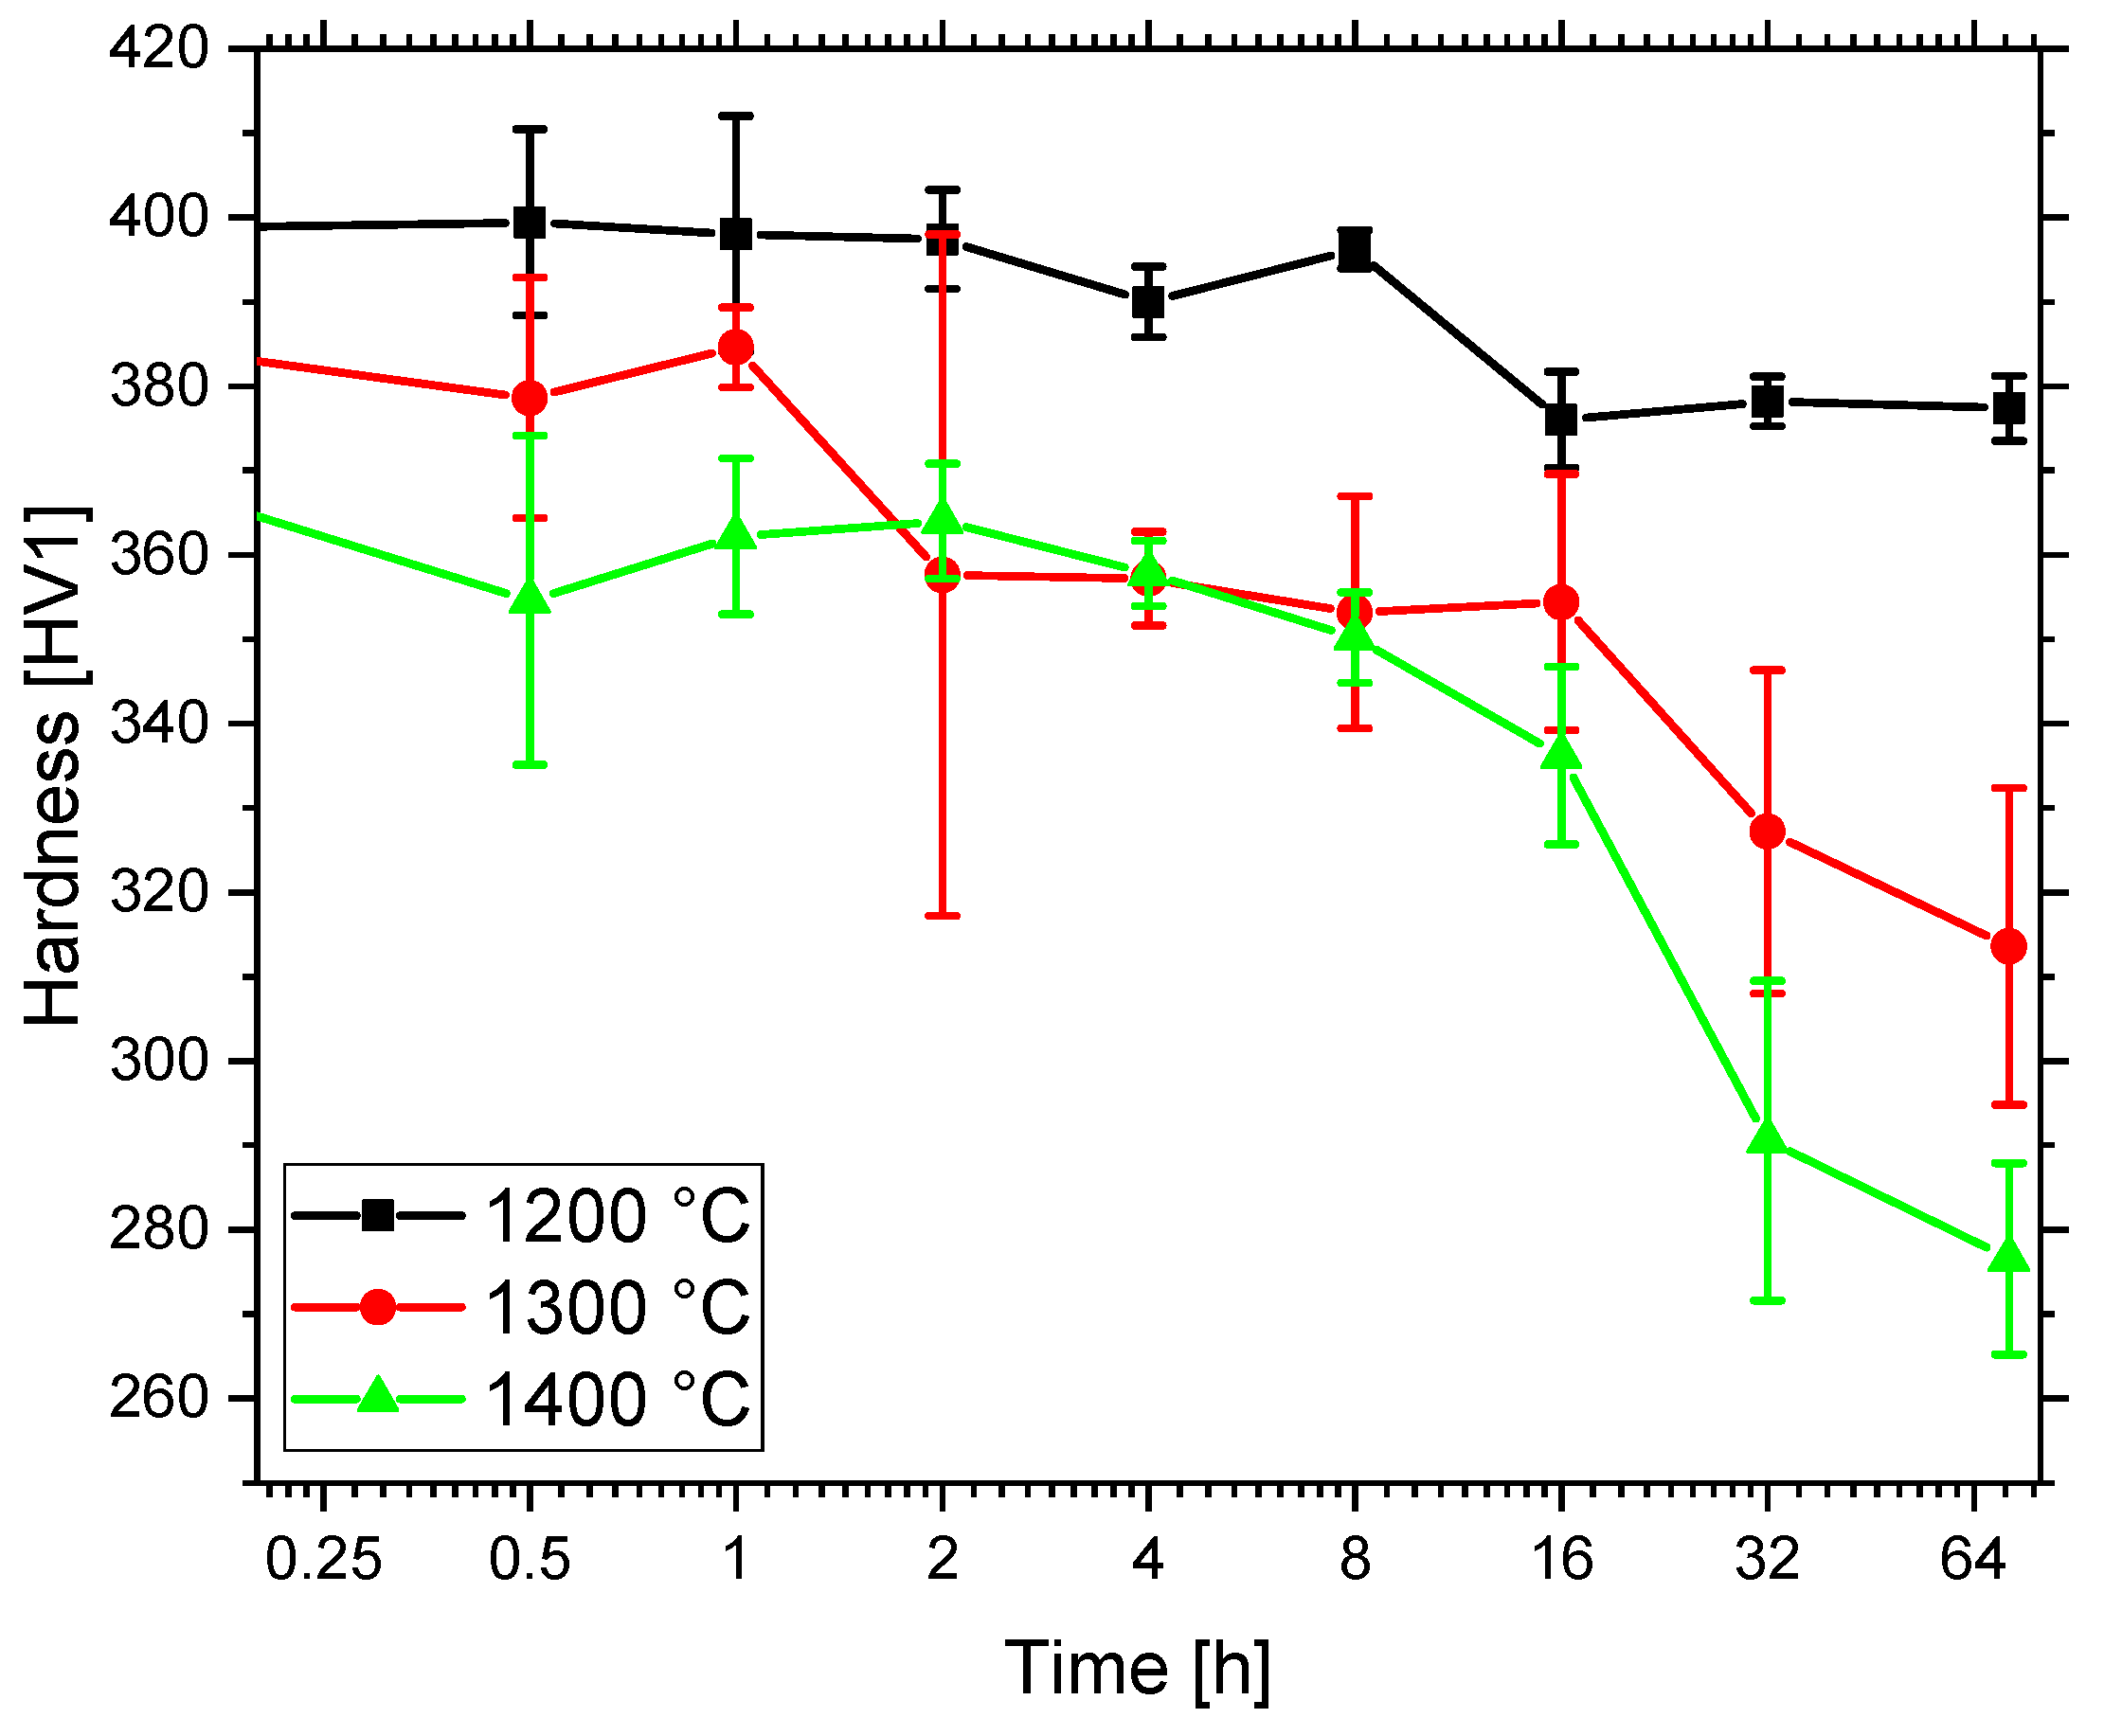
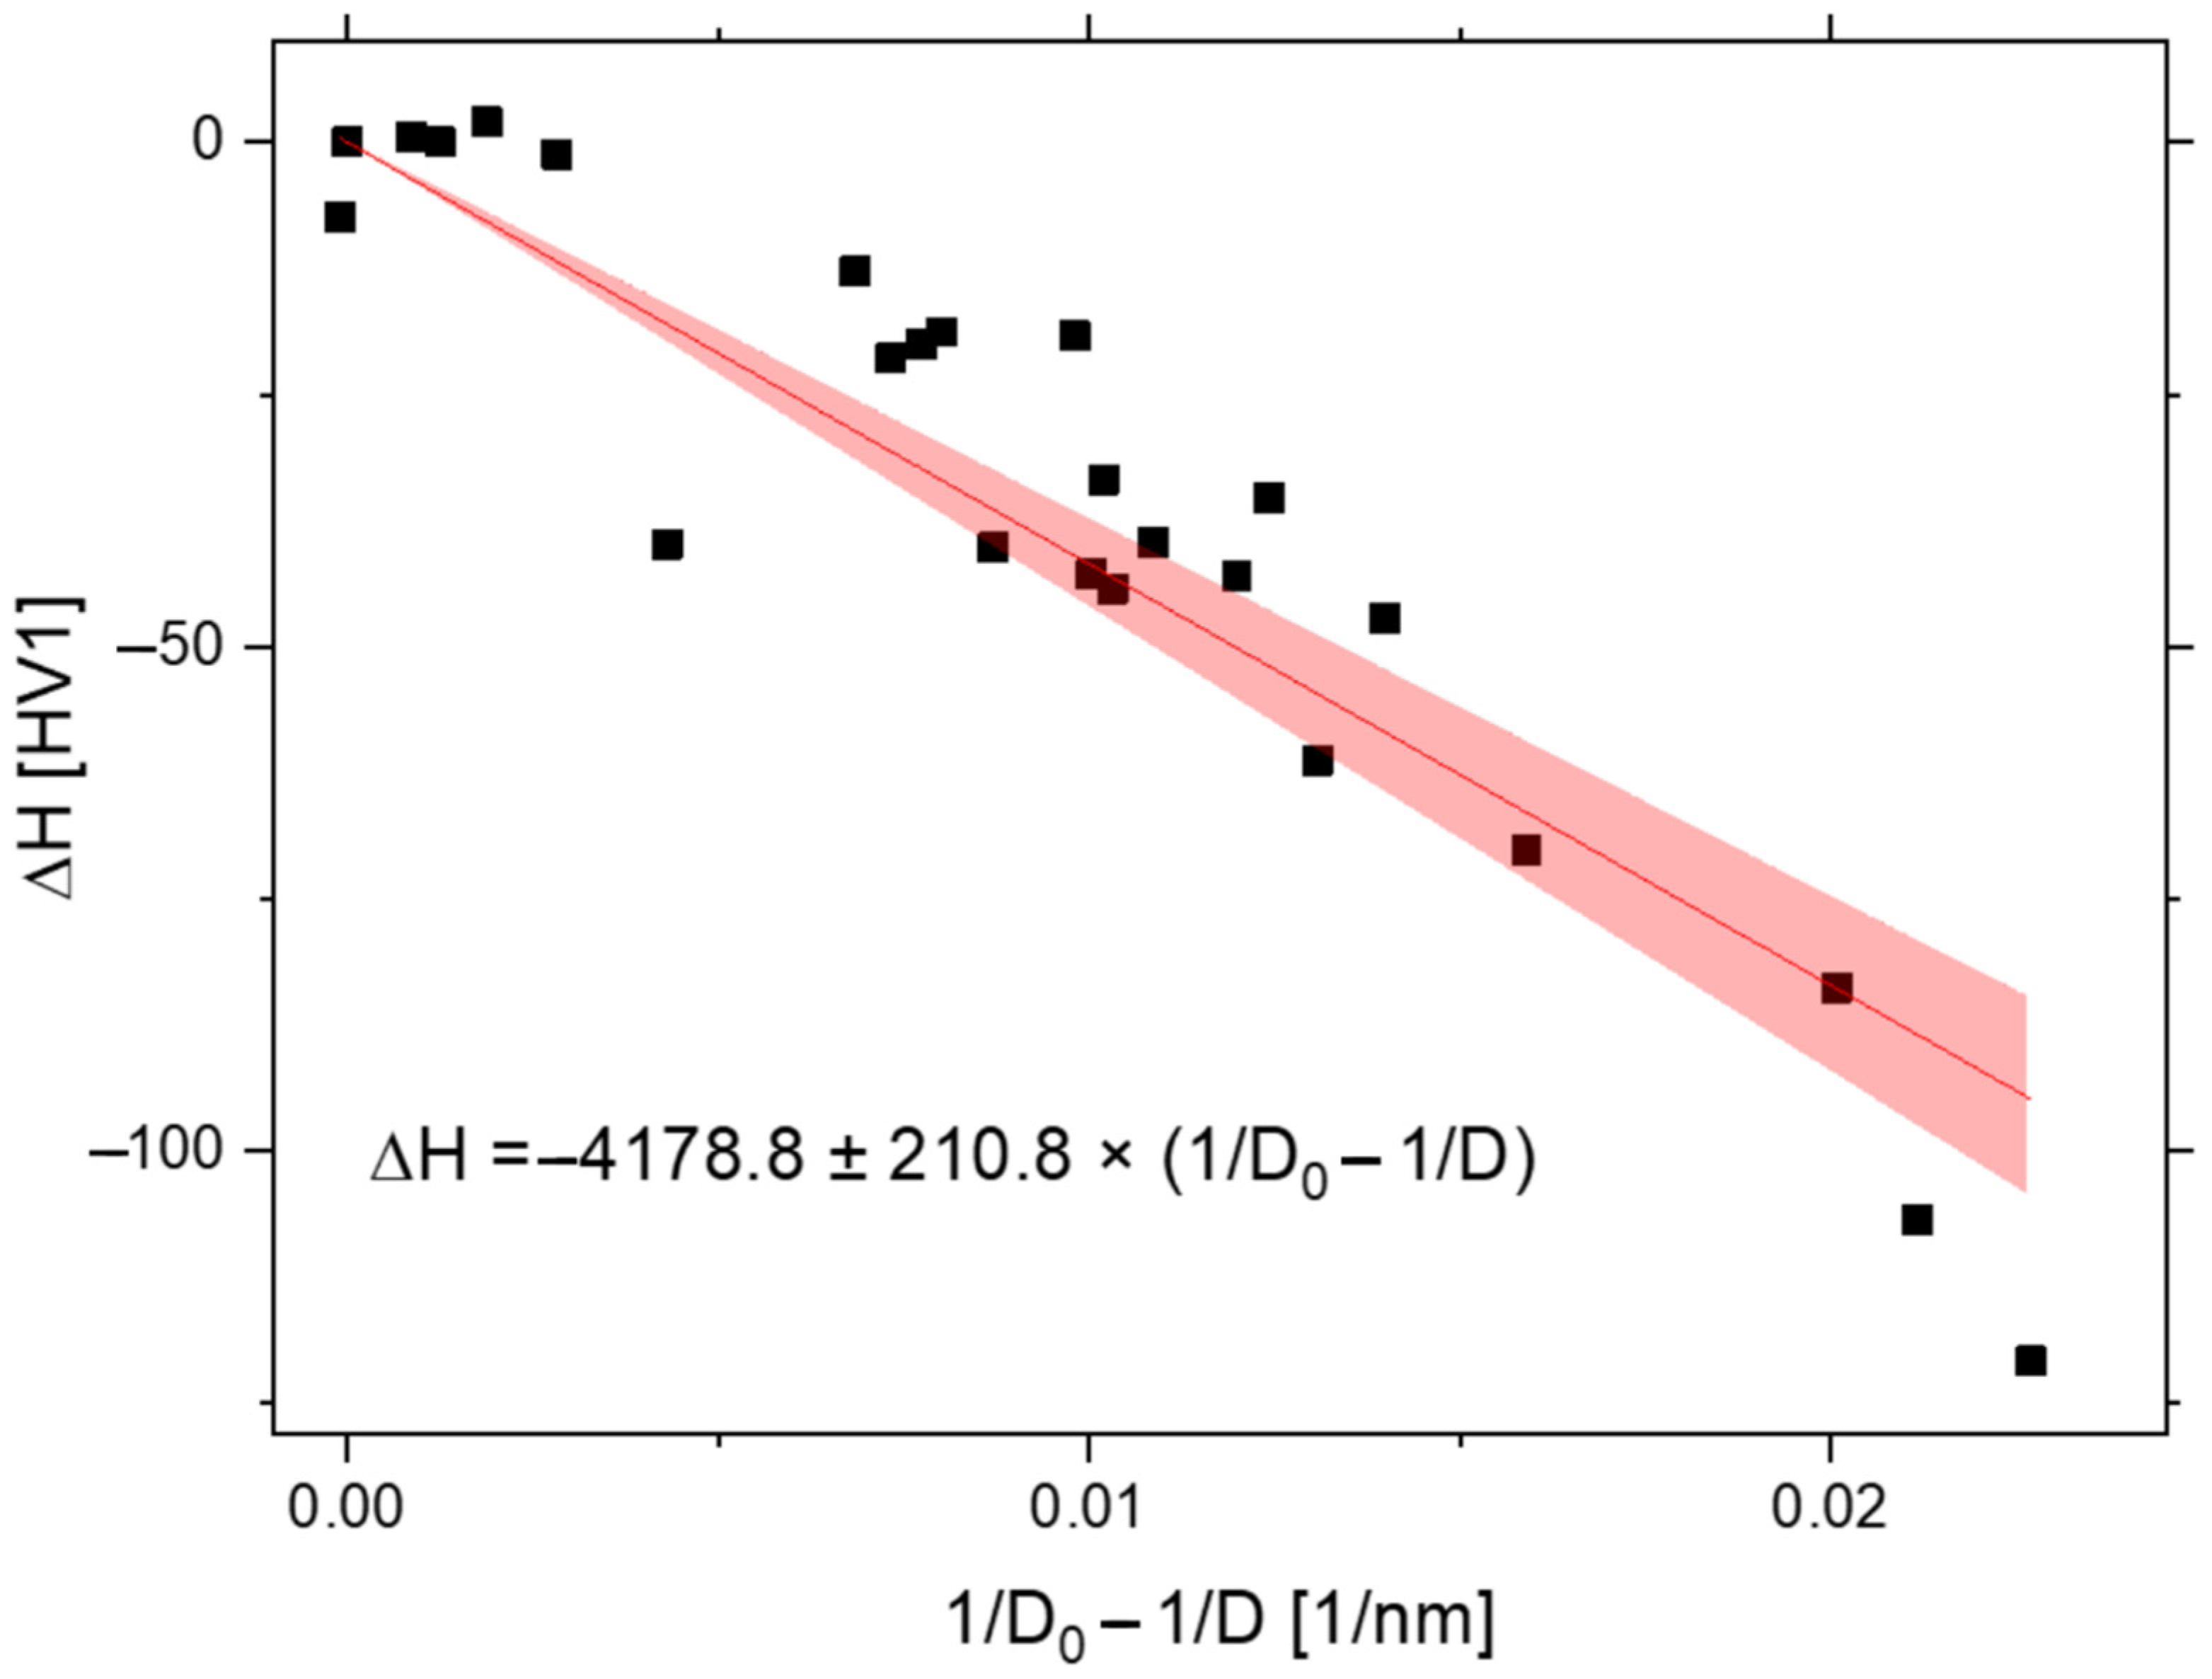
3.3. Hardness Correlation

The initial hardness of as received specimen was 397.4 HV1. The hardness drop of the specimens aged at 1200 °C is relatively minor, only 20 HV1, compared to the specimens aged at higher temperatures. The hardness of specimens aged at 1300 °C was reduced by 83 HV1 to ca 315 HV1, while the hardness of the specimens aged at 1400 °C was reduced by more than 120 HV1 to 275 HV1. The dependence of hardness on aging time and temperature is shown on Figure 7.
As during coarsening, which conserves the total volume of the oxides, both L (average distance between oxides) scales with D and D scales with itself as unity, the contribution to the hardness due to nano-oxide dispersoid can be expressed as ΔH = A/D with A being a constant. The correlation is shown in Figure 8 for the coordinates 1/D0 − 1/D and H0 − ΔH.

4. Discussion

The results of coarsening kinetics revealed a very good resistance of the nano-oxides against coarsening. Oono at al. [27] studied coarsening of Y2O3 particles in the 9CrODS steel and states that particles coarsen roughly 4 to 5 times at 1350 °C and 30 h. In the case of our Fe-10Al-4Cr-4Y2O3 ODS steel presented in this paper, the dispersoid coarsens about 1.5 times in case of 1300 °C ageing and two times in the 1400 °C case for the same time period. In an earlier work [28], the oxides in Fe-17Cr-7Al-4Y2O3 ODS steel without addition of metallic Y (mixed Al-Y oxides are formed), the oxides annealed at 1200 °C for 32 h coarsened approximately 3 times, in our Fe-10Al-4Cr-4Y2O3 ODS steel the coarsening is only 30%. Coarsening of Al2O3 in the Fe-11Al-1O ODS steel is even much faster, see [28]. The coarsening kinetics is determined by the lowest value of the products of solubility and diffusion coefficient in the matrix of the elements forming the nano-oxides, see [29]. As oxygen has significantly higher affinity to Y than to Al or Ti, and as there is a sufficient amount of Y in the matrix due to addition of metallic Y, only pure Y oxides are formed in the system. The free oxygen in the matrix is greatly reduced, and its solubility is also reduced to the order of 10−12 at 1200 °C. Then, just the solubility of oxygen determines the coarsening kinetics of the nano-oxides and the Y2O3 oxides have much better resistance to the coarsening than mixed Al-Ti-Y oxides or pure Al oxides, see [28].
The classical LSW theory provides the left skewed distribution functions, see [30]. This is, however, in contradiction with our initial significantly right skewed distribution function. Moreover, the right skewing is gradually increasing with coarsening. This fact could be explained by following reasoning. The oxides are nucleated in powders during heating preceding the hot consolidation by rolling and slightly grown during hot rolling. Then, the oxides coarsen rather significantly during secondary recrystallization, while a substantial part of time the nano-oxides are in contact with boundaries of nanograins, which significantly enhances the coarsening kinetics. After secondary recrystallization the nano-oxides are embedded in large grains with very low density of dislocations. These conditions fit very well to those assumed by LSW theory. However, one can anticipate, that not all precipitated oxides have the same interface energy due to different misorientation of the oxide and matrix lattice. Thus, there is always a certain amount of oxides with lower interface energy than other precipitates, which can grow significantly faster. This may cause an abnormal growth of such oxides and increase the right skewness of the size distribution in time. The idea of fast growth of oxides with the lowest interface energy can be supported by Figure 9, where many large precipitates assume a cuboidal shape indicating a semi-coherent interface with a low energy. One can expect that the small oxides (about 40–80 nm, see Figure 5c) totally disappear during a hundreds of hours ageing process at 1400 °C.
Figure 8 supports the Orowan theory of hardening for a rather wide range of coarsening conditions, except the conditions of the highest times and temperatures. In those cases, however, the right skewing of the size distribution is extreme, see Figure 5c. As shown in Figure 9, the large oxides consume many small oxides, and the scaling of L with D assumed for derivation of ΔH = A/D stops being valid. This can explain why the softening for the most coarsened dispersoids is significantly higher as shown in Figure 8. The Fisher–Pearson skewness coefficient for all the distributions is between 0.328 and 3.240. The specimens aged at 1400 °C for 32 and 72 h have the highest skewness coefficients, 2.932 and 3.240, which also explains the deviation of the softening for the highest times and temperatures of the ageing process.
Let us also discuss the influence of the nano-oxide coarsening on the creep properties in the temperature range 1100–1300 °C. The coarsening caused a drop in the hardness of 120 HV1 at room temperature, which corresponds approximately to the softening by 385 MPa. In the temperature range 1100–1300 °C, it must be taken into account that the shear modulus influencing the dislocation line energy drops to about one half, and the dislocations can overcome the oxide by climbing. That is why softening can be estimated as 120–160 MPa, which seems to be drastic. The creep and tensile test strength in this temperature range is, however, given by the cohesive strength of the grain boundaries and the grains behave like hard objects. That is why a certain portion of coarsening can still keep a sufficient hardness of the grains without any change in creep properties. A detailed discussion concerning this topic can be found in [31]. The influence of the oxide coarsening on the creep and tensile test properties at 1100–1300 °C will be a topic of the follow-up paper.

5. Conclusions

The investigations described in this paper can be summarized in the following conclusions.
  • The measured coarsening kinetics of Y2O3 nanoprecipitates in the Fe-10Al-4Cr matrix at temperatures 1200–1400 °C and times up to 72 h indicates an unprecedented resistance of the dispersoid against coarsening.
  • The coarsening kinetics of the dispersoid obeys cubic law with the activation energy Q = 274 ± 65 kJ.
  • The size distribution of the dispersoid exhibits a right skewness that increases with the amount of coarsening. This phenomenon is explained by different interface energies of individual precipitates.
  • The softening of the ODS alloy due to coarsening of the dispersoid is in agreement with the Orowan theory of strengthening.

Author Contributions

J.H.: methodology, writing, writing—original draft preparation. Š.G.: investigation, N.L.: writing—review and editing, investigation, A.D.: investigation, J.S.: conceptualization, writing—review and editing. All authors have read and agreed to the published version of the manuscript.

Funding

This research was funded by Czech Science Foundation, grant number 21-02203X.

Institutional Review Board Statement

Not applicable.

Informed Consent Statement

Not applicable.

Data Availability Statement

The data are not publicly available due to being part of ongoing study.

Conflicts of Interest

The authors declare no conflict of interest.

References

  1. Montealegre, M.; González-Carrasco, J.L.; Morris-Muñoz, M.; Chao, J.; Morris, D. The high temperature oxidation behaviour of an ODS FeAl alloy. Intermetallics 2000, 8, 439–446. [Google Scholar] [CrossRef]
  2. Stoloff, N. Iron aluminides: Present status and future prospects. Mater. Sci. Eng. A 1998, 258, 1–14. [Google Scholar] [CrossRef]
  3. Morris, D.; Morris-Munoz, M.A. The influence of microstructure on the ductility of iron aluminides. Intermetallics 1999, 7, 1121–1129. [Google Scholar] [CrossRef]
  4. Strothers, S.; Vedula, K. Hot extrusion of B2 iron aluminide powders. Prog. Powder Metall. 1987, 43, 597–610. [Google Scholar]
  5. Matysik, P.; Jozwiak, S.; Czujko, T. The kinetics of non-isothermal iron and aluminum powder mixtures sintering in protective atmosphere. J. Alloys Compd. 2012, 549, 92–99. [Google Scholar] [CrossRef]
  6. Lindau, R.; Möslang, A.; Rieth, M.; Klimiankou, M.; Materna-Morris, E.; Alamo, A.; Tavassoli, A.-A.F.; Cayron, C.; Lancha, A.-M.; Fernández, P.; et al. Present development status of EUROFER and ODS-EUROFER for application in blanket concepts. Fusion Eng. Des. 2005, 75–79, 989–996. [Google Scholar] [CrossRef]
  7. Jitsukawa, S.; Kimura, A.; Kohyama, A.; Klueh, R.; Tavassoli, A.; van der Schaaf, B.; Odette, G.; Rensman, J.; Victoria, M.; Petersen, C. Recent results of the reduced activation ferritic/martensitic steel development. J. Nucl. Mater. 2004, 329–333, 39–46. [Google Scholar] [CrossRef]
  8. Heintze, C.; Hernández-Mayoral, M.; Ulbricht, A.; Bergner, F.; Shariq, A.; Weissgärber, T.; Frielinghaus, H. Nanoscale characterization of ODS Fe–9%Cr model alloys compacted by spark plasma sintering. J. Nucl. Mater. 2012, 428, 139–146. [Google Scholar] [CrossRef]
  9. Ji, G.; Bernard, F.; Launois, S.; Grosdidier, T. Processing conditions, microstructure and mechanical properties of hetero-nanostructured ODS FeAl alloys produced by spark plasma sintering. Mater. Sci. Eng. A 2013, 559, 566–573. [Google Scholar] [CrossRef]
  10. Mihalache, V.; Mercioniu, I.; Velea, A.; Palade, P. Effect of the process control agent in the ball-milled powders and SPS-consolidation temperature on the grain refinement, density and Vickers hardness of Fe14Cr ODS ferritic alloys. Powder Technol. 2019, 347, 103–113. [Google Scholar] [CrossRef]
  11. Oksiuta, Z.; Baluc, N. Effect of mechanical alloying atmosphere on the microstructure and Charpy impact properties of an ODS ferritic steel. J. Nucl. Mater. 2009, 386–388, 426–429. [Google Scholar] [CrossRef]
  12. Ukai, S.; Fujiwara, M. Perspective of ODS alloys application in nuclear environments. J. Nucl. Mater. 2002, 307–311, 749–757. [Google Scholar] [CrossRef]
  13. Toualbi, L.; Cayron, C.; Olier, P.; Malaplate, J.; Praud, M.; Mathon, M.-H.; Bossu, D.; Rouesne, E.; Montani, A.; Logé, R.; et al. Assessment of a new fabrication route for Fe–9Cr–1W ODS cladding tubes. J. Nucl. Mater. 2012, 428, 47–53. [Google Scholar] [CrossRef] [Green Version]
  14. Tatlock, G.J.; Dawson, K.; Boegelein, T.; Moustoukas, K.; Jones, A.R. High resolution microstructural studies of the evolution of nano-scale, yttrium-rich oxides in ODS steels subjected to ball milling, selective laser melting or friction stir welding. Mater. Today Proc. 2016, 3, 3086–3093. [Google Scholar] [CrossRef]
  15. Stratil, L.; Horník, V.; Dymáček, P.; Roupcová, P.; Svoboda, J. The influence of aluminium content on oxidation resistance of new-generation ODS alloy at 1200 °C. Metals 2020, 10, 1478. [Google Scholar] [CrossRef]
  16. Svoboda, J.; Kunčická, L.; Luptáková, N.; Weiser, A.; Dymáček, P. Fundamental Improvement of Creep Resistance of New-Generation Nano-Oxide Strengthened Alloys via Hot Rotary Swaging Consolidation. Materials 2020, 13, 5217. [Google Scholar] [CrossRef] [PubMed]
  17. Svoboda, J.; Luptáková, N.; Jarý, M.; Dymáček, P. Influence of Hot Consolidation Conditions and Cr-Alloying on Microstructure and Creep in New-Generation ODS Alloy at 1100 °C. Materials 2020, 13, 5070. [Google Scholar] [CrossRef] [PubMed]
  18. Chlupová, A.; Šulák, I.; Kunčická, L.; Kocich, R.; Svoboda, J. Microstructural aspects of new grade ODS alloy consolidated by rotary swaging. Mater. Charact. 2021, 181, 111477. [Google Scholar] [CrossRef]
  19. Zhang, Z.G.; Gesmundo, F.; Hou, P.Y.; Niu, Y. Criteria for the formation of protective Al2O3 scales on Fe–Al and Fe–Cr–Al alloys. Corros. Sci. 2006, 48, 741–765. [Google Scholar] [CrossRef]
  20. Issartel, C.; Buscail, H.; Chevalier, S.; Favergeon, J. Effect of yttrium as alloying on a model alumina-forming alloy oxidation at 1100 °C. Oxid. Met. 2017, 88, 409–420. [Google Scholar] [CrossRef]
  21. Pedraza, F.; Grosseau-Poussard, J.; Dinhut, J. Evolution of oxide scales on an ODS FeAl intermetallic alloy during high temperature exposure in air. Intermetallics 2005, 13, 27–33. [Google Scholar] [CrossRef] [Green Version]
  22. Montealegre, M.; Strehl, G.; González-Carrasco, J.; Borchardt, G. Oxidation behaviour of novel ODS FeAlCr intermetallic alloys. Intermetallics 2005, 13, 896–906. [Google Scholar] [CrossRef]
  23. Li, D.; Zhou, L.; Xi, Y.; Liu, L.; Liu, Z.; Si, J.; Zhu, K. Phase transformation behavior of alumina grown on FeAl alloys with reactive element dopants at 1273 K. J. Alloys Compd. 2017, 692, 427–433. [Google Scholar] [CrossRef]
  24. Svoboda, J.; Ecker, W.; Razumovskiy, V.; Zickler, G.; Fischer, F. Kinetics of interaction of impurity interstitials with dislocations revisited. Prog. Mater. Sci. 2019, 101, 172–206. [Google Scholar] [CrossRef]
  25. Svoboda, J.; Horník, V.; Riedel, H. Modelling of Processing Steps of New Generation ODS Alloys. Met. Mater. Trans. A 2020, 51, 5296–5305. [Google Scholar] [CrossRef]
  26. Schneider, C.A.; Rasband, W.S.; Eliceiri, K.W. NIH Image to ImageJ: 25 Years of image analysis. Nat. Methods 2012, 9, 671–675. [Google Scholar] [CrossRef]
  27. Oono, N.; Nakamura, K.; Ukai, S.; Kaito, T.; Torimaru, T.; Kimura, A.; Hayashi, S. Oxide particle coarsening at temperature over 1473 K in 9CrODS steel. Nucl. Mater. Energy 2016, 9, 342–345. [Google Scholar] [CrossRef]
  28. Svoboda, J.; Horník, V.; Stratil, L.; Hadraba, H.; Mašek, B.; Khalaj, O.; Jirková, H. Microstructure Evolution in ODS Alloys with a High-Volume Fraction of Nano Oxides. Metals 2018, 8, 1079. [Google Scholar] [CrossRef] [Green Version]
  29. Fischer, F.D.; Svoboda, J.; Fratzl, P. A thermodynamic approach to grain growth and coarsening. Philos. Mag. 2003, 83, 1075–1093. [Google Scholar] [CrossRef]
  30. Lifshitz, I.; Slyozov, V. The kinetics of precipitation from supersaturated solid solutions. J. Phys. Chem. Solids 1961, 19, 35–50. [Google Scholar] [CrossRef]
  31. Svoboda, J.; Bořil, P.; Holzer, J.; Luptáková, N.; Jarý, M.; Mašek, B.; Dymáček, P. Substantial Improvement of High Temperature Strength of New-Generation Nano-Oxide-Strengthened Alloys by Addition of Metallic Yttrium. Materials 2022, 15, 504. [Google Scholar] [CrossRef]
Figure 1. Bright-field STEM micrographs of as-received sample, camera length 205 mm: (a) Overview picture with horizontal field of view (HFV) of 21,850 nm. (b) Detail of the oxide dispersion with HFV 772 nm. (c) A foil area (HFW of 194 nm) showing locations where EDS point spectra were collected from particles 1 and 2. (d) EDS spectrum from the particle 2.
Metals 12 00210 g001
Figure 2. (a) The secondary electron SEM image surface of the specimen aged at 1400 °C for 30 min after final etching by the Vilella-Bain etchant; (b) particle analysis corresponding to left micrograph.
Metals 12 00210 g002
Figure 3. The normalized distribution of particle size described by diameter recalculated from area in as-received state.
Metals 12 00210 g003
Figure 4. A comparison of oxide-size normalized distribution for as-received state and aged samples at 1200, 1300 and 1400 °C for 30 min.
Metals 12 00210 g004
Figure 5. Oxide diameter normalized distributions for all specimens aged at (a) 1200 °C, (b) 1300 °C, (c) 1400 °C and (d) dependency of mean oxide diameter on time for all temperatures.
Metals 12 00210 g005
Figure 6. Linear regression of K dependency on inverse temperature with 95% confidence intervals. The fitted values are shown in the equation together with standard errors.
Metals 12 00210 g006
Figure 7. Evolution of hardness [HV1] in time for 1200, 1300 and 1400 °C.
Metals 12 00210 g007
Figure 8. The correlation of the hardness reduction (H) with increasing average diameter of the oxides (1/D0 1/D).
Metals 12 00210 g008
Figure 9. The micrographs of dispersoid aged at 1400 °C for 32 h (a) and 72 h (b).
Metals 12 00210 g009
Table 1. Results of EDS point analysis of the dispersoid. Results are presented in atomic percent.
ElementPoint 1Point 2Point 3Point 4Point 5Point 6
O41.250.342.640.449.252.4
Al1.61.10.10.00.00.0
Cr2.70.00.90.60.71.2
Fe5.16.28.18.68.09.6
Y49.442.448.350.442.136.8
Table 2. Average values and median of diameters for as-received state and 30-min aging at 1200, 1300 and 1400 °C.
SpecimenMean [nm]Median [nm]
As-received28.6 ± 0.727.70
1200 °C30.2 ± 0.729.49
1300 °C37.08 ± 0.736.36
1400 °C40.09 ± 137.42
Publisher’s Note: MDPI stays neutral with regard to jurisdictional claims in published maps and institutional affiliations.

