Article

Effect of Interpass Temperature on Wire Arc Additive Manufacturing Using High-Strength Metal-Cored Wire

1
School of Mechanical and Aerospace Engineering, Nanyang Technological University, 50 Nanyang Avenue, Singapore 639798, Singapore
2
Precision Laser Solutions Pte. Ltd., 280 Woodlands Industrial Park E5, Singapore 757322, Singapore
*
Author to whom correspondence should be addressed.
Metals 2022, 12(2), 212; https://doi.org/10.3390/met12020212
Submission received: 28 December 2021 / Revised: 19 January 2022 / Accepted: 21 January 2022 / Published: 24 January 2022
(This article belongs to the Special Issue Advances in Welding, Joining and Surface Coating Technology)

Abstract

:
Wire arc additive manufacturing (WAAM) is suitable to fabricate large components because of its high deposition rate. In this study, a metal-cored low-alloy high-strength welding filler metal was used as feedstock. Single wall structures were prepared using the WAAM process with different interpass temperatures (150 °C, 350 °C, and 600 °C). No obvious microstructure change was observed when the alloy was deposited with the interpass temperatures of 150 °C and 350 °C. Electron backscattered diffraction analysis shows that that no significant texture is developed in the samples. The yield strength tends to decrease with the increase in interpass temperature; however, the influence is insignificant. The highest ultimate tensile strength is found at the interpass temperature of 350 °C. A higher interpass temperature can lead to a higher deposition rate because of the shorter waiting time for the cooling of the earlier deposited layer. It was found that the upper limit interpass temperature for WAAM of the low-alloy high-strength steel is 350 °C. When a higher interpass temperature of 600 °C was used, collapse of the deposited materials was observed.

1. Introduction

Additive manufacturing (AM) has gained tremendous attention in industry and academia due to its advantages over conventional subtractive manufacturing processes in terms of its complex geometry and near net shape fabrication. Fusion-based AM is one of the most popular techniques applied in engineering applications, including selective laser melting (SLM) [1,2], electron beam melting (EBM) [3], laser metal deposition (LMD), [4,5] and wire arc additive manufacturing (WAAM) [6,7]. Among these AM processes, WAAM is a variation of a direct energy deposition technology using cost efficient production resources. It is transformed from an arc welding technology to build components in a layer-by-layer strategy [8,9,10]. Unlike the powder-bed AM processes, WAAM uses a metal wire as the feedstock, which is much cheaper than metal powder.
Although powder-bed AM processes possess high fabrication accuracy due to the small melt pool size [11,12], the drawback is their low deposition rate. From our experience, the deposition rate is about 40–100 g per hour for SLM, 100–300 g per hour for EBM and 150–2400 g per hour for LMD processes. In contrast, the deposition rate is higher at about 500–10,000 g per hour for the WAAM process. Table 1 summarizes the deposition rates for the major fusion-based AM processes for the purpose of easy comparison.
WAAM also possesses the additional advantages of having a lower cost of the welding facilities and the wide availability of wires. WAAM is generally regarded as an efficient and economic AM process for making large components because of the high deposition rates and cheap feedstock.
The WAAM process has been widely used for the fabrication of several types of metallic materials, such as aluminum alloys [14,15], copper alloys [16], stainless steels [17], and low-alloy high-strength steels [10,18]. However, most of the works focus on the study of processing–microstructure–properties relationships. Because of the layer-by-layer building strategy of AM processes, there is a waiting time between the printing of two adjacent layers. If the waiting time can be shortened, the efficiency of the WAAM process can be increased. Manipulating the interpass temperature would be a strategy to further increase the efficiency.
Interpass temperature is the temperature at which the subsequent deposition layer runs during the WAAM process. Controlling the interpass temperature within a reasonable range is essential to manipulate the microstructures, mechanical properties, and efficiency. Köhler et al. [14] studied the WAAM of Al 5356 alloy with different interpass temperatures. They concluded that the mechanical properties did not show dependency on the interpass temperature. Chen et al. [16] studied the WAAM of Cu-8Al-2Ni-2Fe-2Mn alloy with the interpass temperatures of 100 °C, 400 °C, and 700 °C. No significant effect on the microstructure was observed for the interpass temperature of 100 °C and 400 °C, but the interpass temperature of 400 °C decreased the tensile strength of the deposited materials compared to 100 °C. Unfortunately, the microstructure and tensile properties of the interpass temperature of 700 °C were not provided due to poor formability.
Shen et al. [19] reported the WAAM of Fe3Al alloy with the interpass temperatures of 280 °C, 320 °C, 360 °C, and 400 °C. They observed a larger grain size when a low interpass temperature was used and a higher yield strength when a high interpass temperature was used. This observation is contrary to the usual expectation and warrants further study. Ma et al. [20] investigated the effect of interpass temperature (100 °C, 200 °C, 300 °C, 400 °C, and 500 °C) on in situ alloying of TiAl alloy in a WAAM process. They found that with an increase in the interpass temperature, a decrease in the α2-Ti3Al phase fraction was observed due to the lower cooling rate. The microhardness was also decreased with the increase in interpass temperature.
Low-alloy high-strength steels have a wide range of engineering applications [21,22,23]. The metal-cored welding wire T89 4 ZMn2NiCrMo M M21 1 H5 developed by Böhler Welding Group is a low-alloy high-strength steel. Compared with solid metal wire, metal-cored wire consists of small amounts of arc stabilizers such as sodium and potassium. Welds made with a metal-cored wire will only have small silicon islands from the deoxidized products that appear on the surface of the weld.
Up to now, to our knowledge, there has not been any study of WAAM using this filler wire. We report the results of our study of WAAM using this filler wire, with special attention paid to the effect of interpass temperature (150 °C, 350 °C, and 600 °C) on microstructures, mechanical properties of the deposited metals, and the formability.

2. Materials and Methods

2.1. Materials and WAAM Procedures

Commercial T89 4 ZMn2NiCrMo M M21 1 H5 metal-cored wire with the chemical composition of Fe-2.2Ni-1.9Mn-0.7Si-0.6Cr-0.5Mo-0.06C (wt%) was used as feedstock. The diameter of the wire was 1.2 mm. The WAAM machine consisted of a robotic arm (ABB, Sweden) and a cold metal transfer (CMT) welding system (TPS 400i, Fronius, Pettenbach, Austria). The welding nozzle was set at an angle of 90° to a plain carbon steel substrate. The mixed gas of 10% CO2 + Ar was used as the shielding gas. Single wall structures with the length of 120 mm were deposited. Figure 1 shows the schematic of the WAAM system.
The interpass temperature was monitored using an infrared thermometer. The curve of the cooling profile obtained is shown in Figure 2. Three interpass temperatures were used (150, 350, and 600 °C). The highest interpass temperature of 600 °C was chosen because it would be practically difficult to achieve a higher interpass temperature due to very rapid cooling above 600 °C, as shown in Figure 2. It is reasonable to choose 150 °C as the lowest temperature because the waiting time would be too long and the WAAM productivity would be too low if a lower interpass temperature was used. A temperature of 350 °C was chosen as the interpass temperature between the two extremes.
The major experimental parameters are summarized in Table 2. The deposition rate can be calculated as 4300 g per hour during the continuous deposition (i.e., neglecting the waiting time between the adjacent passes).

2.2. Microstructure Characterization

The samples for microstructural analyses were cut from the central portion of the single wall structures, ground with progressively finer SiC papers (320–4000 grit), and then polished with silicon oxide polishing suspension (OP-S). After polishing, the samples were etched with 2% nitric acid aqueous solution. The microstructures were observed using optical microscope (Zeiss Axioskop 2 MAT, Carl Zeiss, Oberkochen, Germany), scanning electron microscope (SEM, JEOL JSM-7600F, JEOL, Akishima, Tokyo), X-Ray diffraction (XRD, PANalytical Empyrean, Malvern Panalytical, Malvern, UK), energy-dispersive X-ray spectroscopy (EDS, Oxford Instruments, Oxford, UK), and electron backscatter diffraction (EBSD, Oxford Instruments, Oxford, UK). XRD measurement was conducted using Cu Kα1 (λ = 0.15406 nm) at 30 kV and 30 mA with the step size of 0.01° and scan speed of 1.2°/min. A step size of 0.8 μm and an accelerating voltage of 20 kV were used for EBSD measurement.

2.3. Mechanical Properties

The microhardness tests were conducted using Matsuzawa MMT-X3 machine (Japan Instrumentation system, Minato-ku, Tokyo) with a load of 500 g and a dwell time of 15 s. For each sample, 15 indentations were carried out and the average microhardness was calculated. Tensile samples were machined using electric wire cutting from the single wall structures with the tensile axis oriented parallel to the welding direction. They had gauge dimensions of 14 mm × 4 mm × 2 mm and total length of 80 mm. Tensile tests were carried at room temperature using Instron 5982 universal tensile testing machine (Instron, Norwood, MA, USA). A constant strain rate of 10−3 s−1 was used for the tensile test. A non-contact Instron AVE 2 extensometer (Instron, MA, USA) was used to measure the tensile strain.

3. Results

3.1. Microstructures

Optical images in Figure 3 show the microstructure of the polished cross-sections (before and after etching) of the materials deposited with different interpass temperatures. No porosities were observed in the deposited materials after polishing, as shown in Figure 3a,d,g, indicating the high relative density. The microstructure consists of predominantly bainite and acicular ferrite phases.
After etching, the optical images were taken at the melt pool boundaries (Figure 3b,e,h) and inside the melt pool (Figure 3c,f,i) to observe the microstructures. The grains are bigger in the heat affected zone (HAZ) of the material deposited with a higher interpass temperature. A higher interpass temperature produced larger grains. Black spherical dots can be observed, as shown in Figure 3a,d,g. The distribution of the black dots was also observed using SEM backscatter electron (BSE) mode, as shown in Figure 4a. The black dots were found to be oxide particles using SEM-EDS, as shown in Figure 4b,c. The atomic percentage of the particles shows the ratio of (Mn + Si) to O to be 1:2, indicating they are a mixture of MnO2 and SiO2 particles, which are typically observed in Mn/Si deoxidized steels [24]. The submicron oxide particles were observed in all the samples prepared using different interpass temperatures. However, from Figure 3a,d,g, it can be concluded that the size and quantity of the oxide particles are larger in the materials prepared using the higher temperatures of 350 °C and 600 °C.
The XRD patterns of the deposited materials using different interpass temperatures are shown in Figure 5. The phase of the deposited material is indexed as fully ferrite. This is not surprising since the filler wire only contains a low level of alloying elements (e.g., Ni at 2.2 wt%). Upon cooling, the ferrite phase transformed from the austenitic phase. No peaks of oxide phase were detected because of the small content.
The microstructures of the WAAM deposited materials were also observed using SEM with different magnifications, as shown in Figure 6. The grains are an irregular shape and tend to increase in size with the increase in interpass temperature.
The EBSD study of the WAAM deposited materials using different interpass temperatures is shown in Figure 7. The average grain size, which is calculated using the equivalent diameter of each grain, was measured automatically by the EBSD method three times for each of the interpass temperatures. The average of the three measurement results was taken as the grain size and were 3.9 ± 0.1 μm, 4.1 ± 0.1 μm, and 4.9 ± 0.2 μm for the interpass temperatures of 150 °C, 350 °C, and 600 °C, respectively. The grain size is shown to increase with the increase in interpass temperature. The results of the qualitative grain size measurements are consistent with the SEM observation shown in Figure 6.
Figure 7d–f show the grain size distributions of the WAAM deposited low-alloy high-strength steels. It can be seen from the figures that the percentage of small grains decreases and the percentage of large grains increases with the increasing interpass temperature. This also shows the trend of increasing grain size with the increasing interpass temperature.
Figure 7g–i are maps showing the distribution of low angle grain boundaries (LAGB) and high angle grain boundaries (HAGB) for the WAAM deposited materials. The fraction of LAGB was measured to be 25.5%, 25.9, and 24.1% for the interpass temperatures of 150 °C, 350 °C, and 600 °C, indicating that the fraction of LAGB or HAGB keeps at the similar level for the different interpass temperatures.
Pole figures of the WAAM deposited materials using different interpass temperatures are shown in Figure 8. The maximum texture index is 2.9 for the interpass temperature of 150 °C, 3.8 for the interpass temperature of 350 °C, and 3.6 for the interpass temperature of 600 °C. The texture index tends to increase with the increase in interpass temperature, but the change is insignificant. The EBSD analysis shows that no significant texture is developed in the samples.

3.2. Mechanical Properties

Figure 9a shows the engineering tensile stress–strain curves of the WAAM deposited low-alloy high-strength steel. The yield strength, ultimate tensile strength, elongation, and microhardness are compared in Figure 9b and summarized in Table 3. The WAAM deposited materials with the interpass temperature of 150 °C have the highest yield strength (776.8 MPa). The yield strength decreased by about 100 MPa when the interpass temperature was increased to 350 °C and 600 °C, but it was almost the same (674.9 MPa and 671.8 MPa) for the interpass temperatures of 350 °C and 600 °C. Although the yield strength tends to decrease with the increase in interpass temperature, the influence is insignificant because of the large standard deviation observed (as shown in Figure 9b and Table 3).
The highest ultimate tensile strength is 1075.9 MPa when the interpass temperature is 350 °C. The lowest ultimate tensile strength is 921.2 MPa when the interpass temperature is the highest at 600 °C. The elongation is 21.4%, 16.6%, and 19.0% for the interpass temperature of 150 °C, 350 °C, and 600 °C. The microhardness is 294.1 HV, 324.4 HV, and 291.0 HV for the interpass temperature of 150 °C, 350 °C, and 600 °C. Normally, the microhardness of metallic materials has a linear relationship with the ultimate tensile strength [1]. Since the sample with 350 °C interpass temperature has the highest ultimate tensile strength, it is not surprising that it also has the highest microhardness.

4. Discussion

4.1. Effect of Interpass Temperature on Microstructures and Mechanical Properties

EBSD results in Figure 7 and Figure 8 reveal that the grain size is coarsened with the increase in interpass temperature. Although the heat input is the same for all the three conditions, the materials deposited with higher interpass temperature experience longer duration at high temperatures. The major microstructural factors presented earlier are summarized in Table 4 together with the values of yield strength for the purpose of understanding how they affect the mechanical properties. More mechanical properties such as ultimate tensile strength, elongation, and microhardness can be found in Figure 9b and Table 3. It is clear from Table 4 that the grain size is coarsened with the increase in interpass temperature, but interpass temperature only has a small effect on the fraction of LAGB, HAGB, and texture index. As a result, the yield strength, ultimate tensile strength, elongation, and microhardness are not changed significantly with the change in interpass temperature. This is expected since the mechanical properties of metallic materials are controlled by the microstructures.
Similar results were reported by Rodrigues et al. [18] for the WAAM process using a low-alloy high-strength steel filler wire (ER110S-G). They observed no significant microstructural changes or mechanical properties for considerably different heat inputs used.
It is interesting to observe that the yield strength and elongation are the highest for the interpass temperature of 150 °C. Materials usually gain strength at the expense of ductility. A possible reason for the highest yield strength and elongation is that the lowest interpass temperature of 150 °C resulted in the finest grains. Fine grains are known to lead to more grain boundary strengthening and better ductility as well. However, it should be noted that grain size is only one of the factors determining the strength and ductility of a material.

4.2. Effect of Interpass Temperature on Formability

As shown in Figure 2, the temperature of the WAAM deposited materials drops sharply from liquid state to 600 °C within a short period of about 25 s. It takes 74 s to cool down to 350 °C. However, it takes a very long time of 210 s to cool down to 150 °C. To increase the deposition rate, the interpass temperature should not be too low. The cross-sections of the WAAM deposited materials with high interpass temperatures of 350 °C and 600 °C are shown in Figure 10. Although a small compromise of yield strength was observed with the application of high interpass temperature, a much shorter waiting time for the cooling of the earlier deposited layer can lead to a significantly higher deposition rate.
The thickness of the wall was about 10 mm when the interpass temperature was 350 °C, while the thickness became about 13 mm when the interpass temperature was increased to 600 °C. This is because the deposited material collapsed at the high interpass temperature, as shown in Figure 11. No collapse was observed for the lowest interpass temperature of 150 °C. Only a slight collapse was discerned for the interpass temperature of 350 °C, indicating the upper limit for the application of the interpass temperature.
To increase the deposition rate by reducing the interlayer dwell time during the WAAM process, interpass cooling can also be used. Wu et al. [25] applied compressed CO2 gas during the WAAM of Ti6Al4V alloy to accelerate the cooling. It was found that the interpass cooling produces less surface oxidation, refined microstructure, and enhanced strength. Another control method is the use of thermoelectric cooling [20]. With this method, the refined microstructure was observed due to an increased cooling rate. In addition, a decrease of 60.9% in total fabrication time was achieved and, thus, manufacturing efficiency was improved due to the reduction in dwell time between deposited layers. Manufacturing efficiency is critical for the fabrication of components with a large volume. This work provides a practical point of view for the engineering application of the WAAM process.

5. Conclusions

(1)
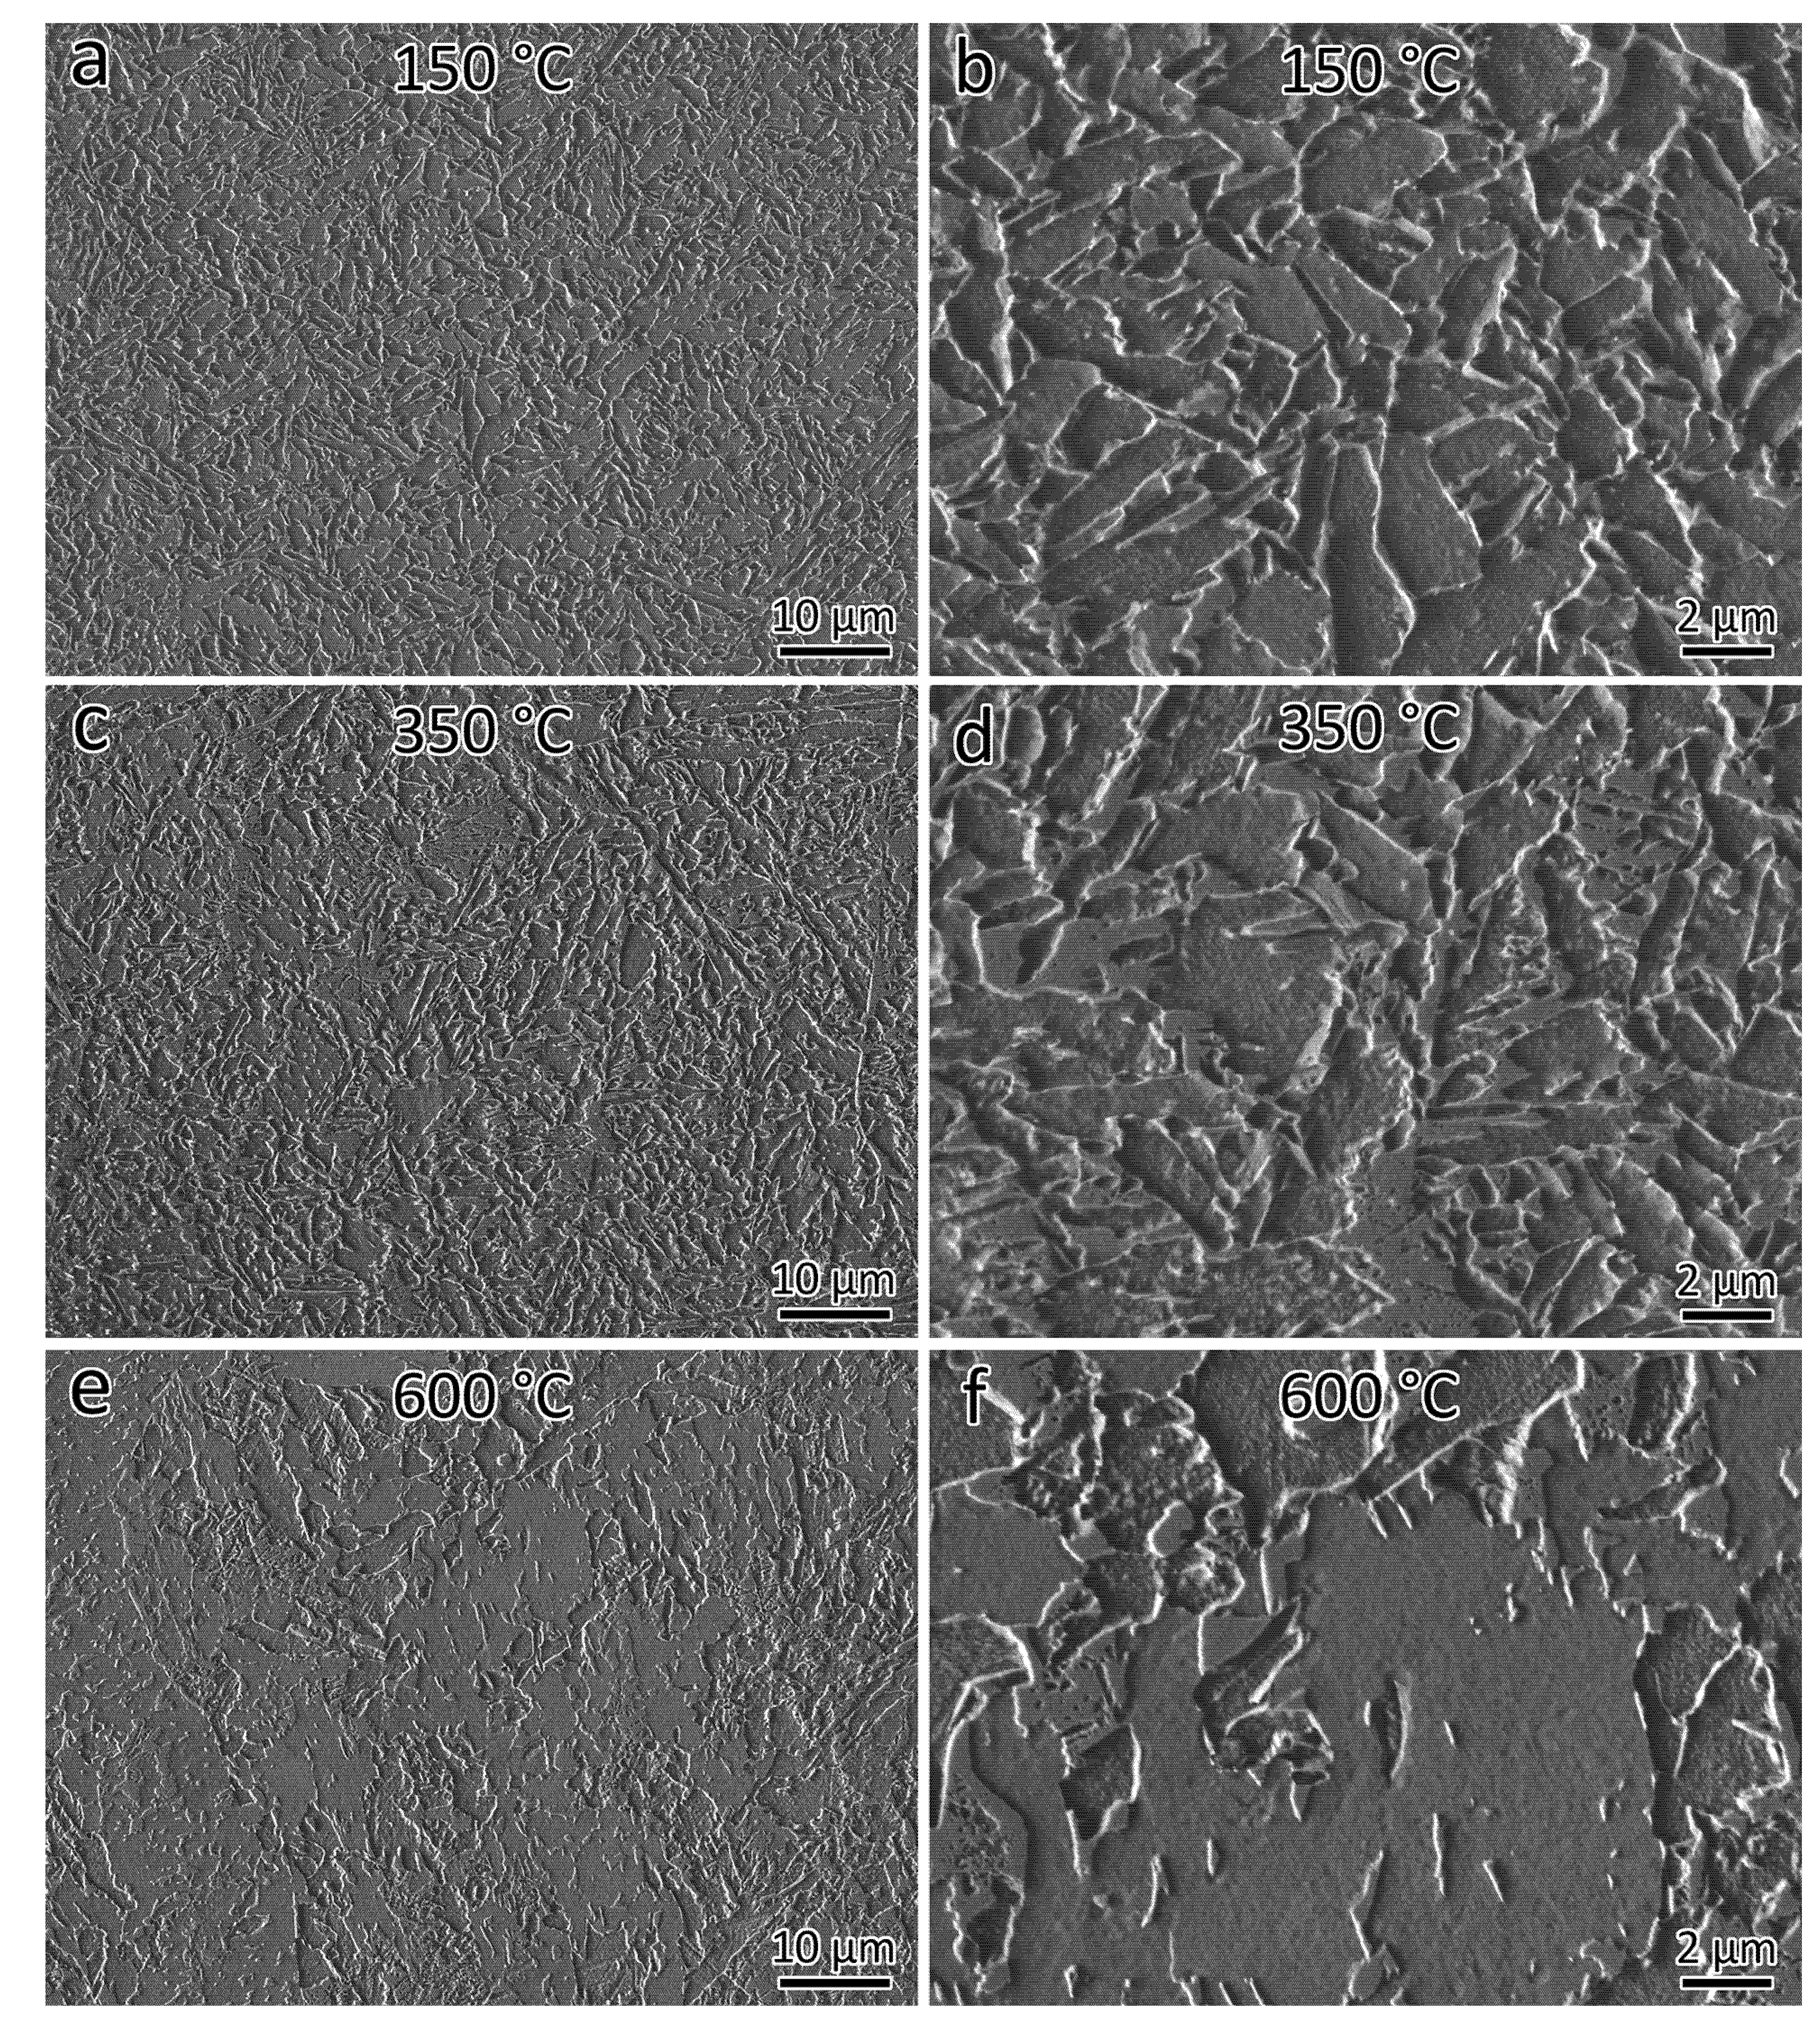
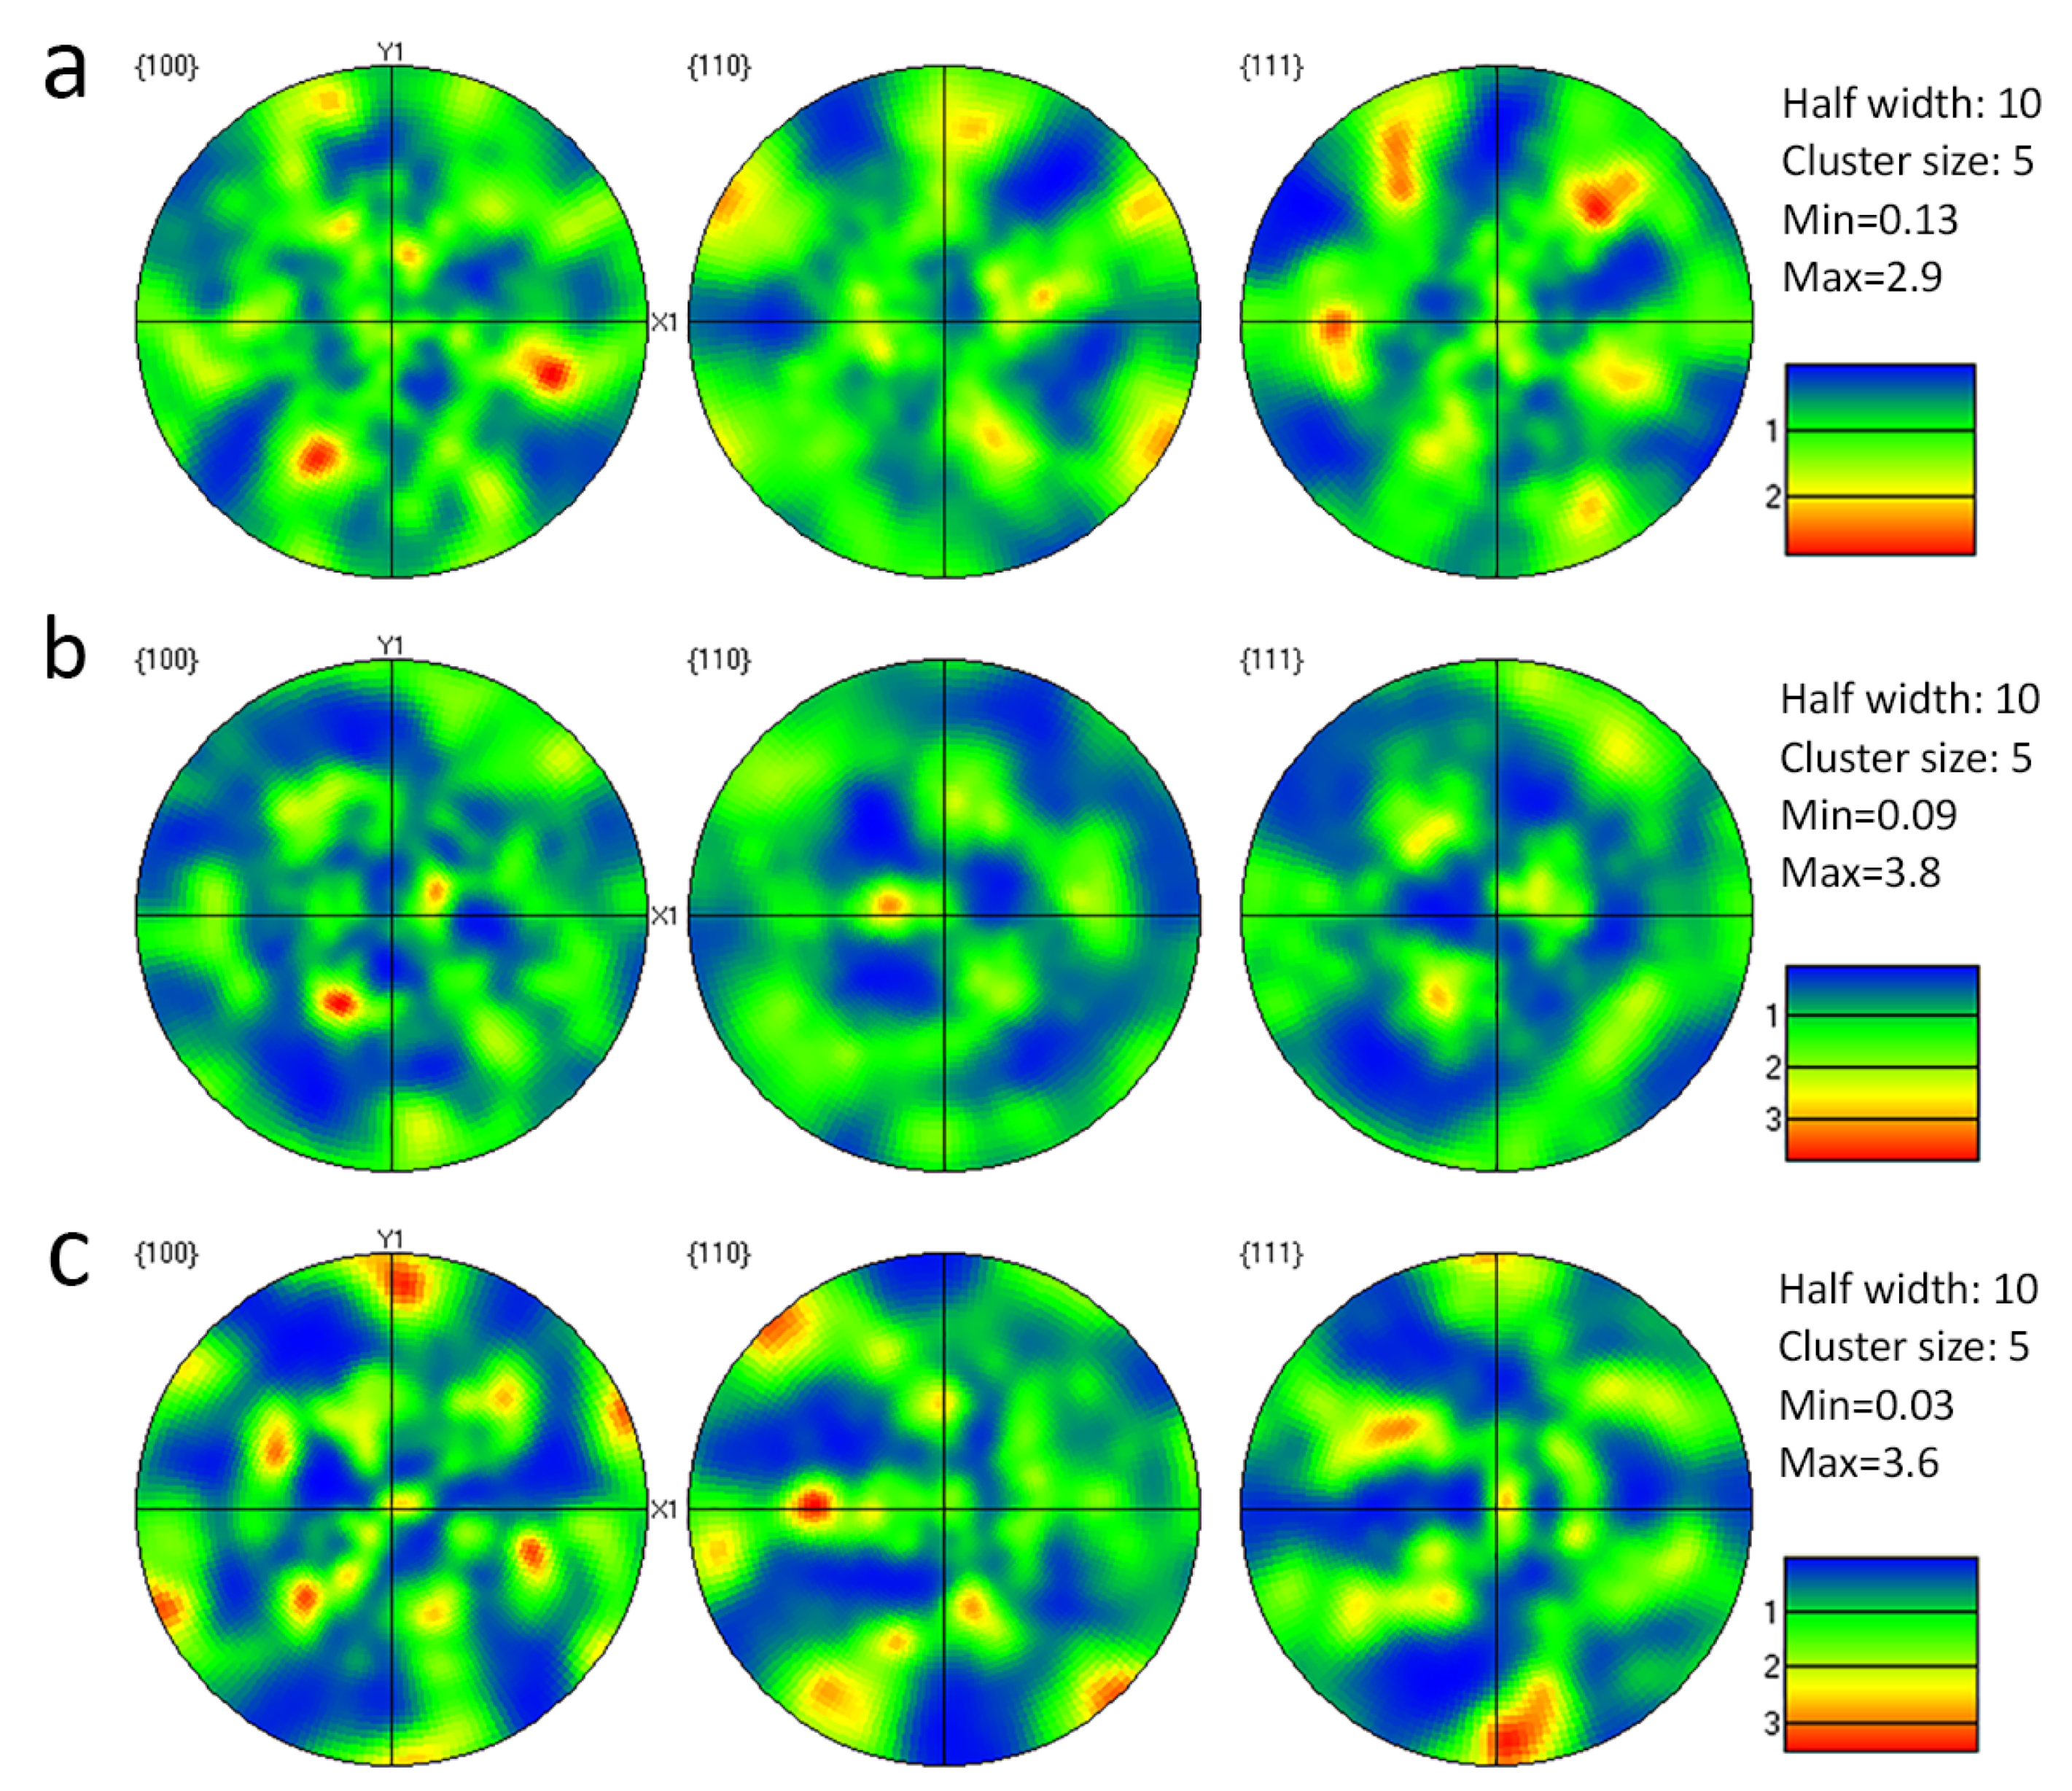
Grain size is 3.9 μm, 4.1 μm, and 4.9 μm for the interpass temperatures of 150 °C, 350 °C, and 600 °C, respectively, showing the trend of increase in grain size with the increase in interpass temperature. In contrast, the interpass temperature has an insignificant influence on other microstructural factors, with the fraction of LAGB at 25.5%, 25.9%, and 24.1% and texture index at 2.9, 3.8 and 3.6 for the interpass temperatures of 150 °C, 350 °C, and 600 °C, respectively.
(2)
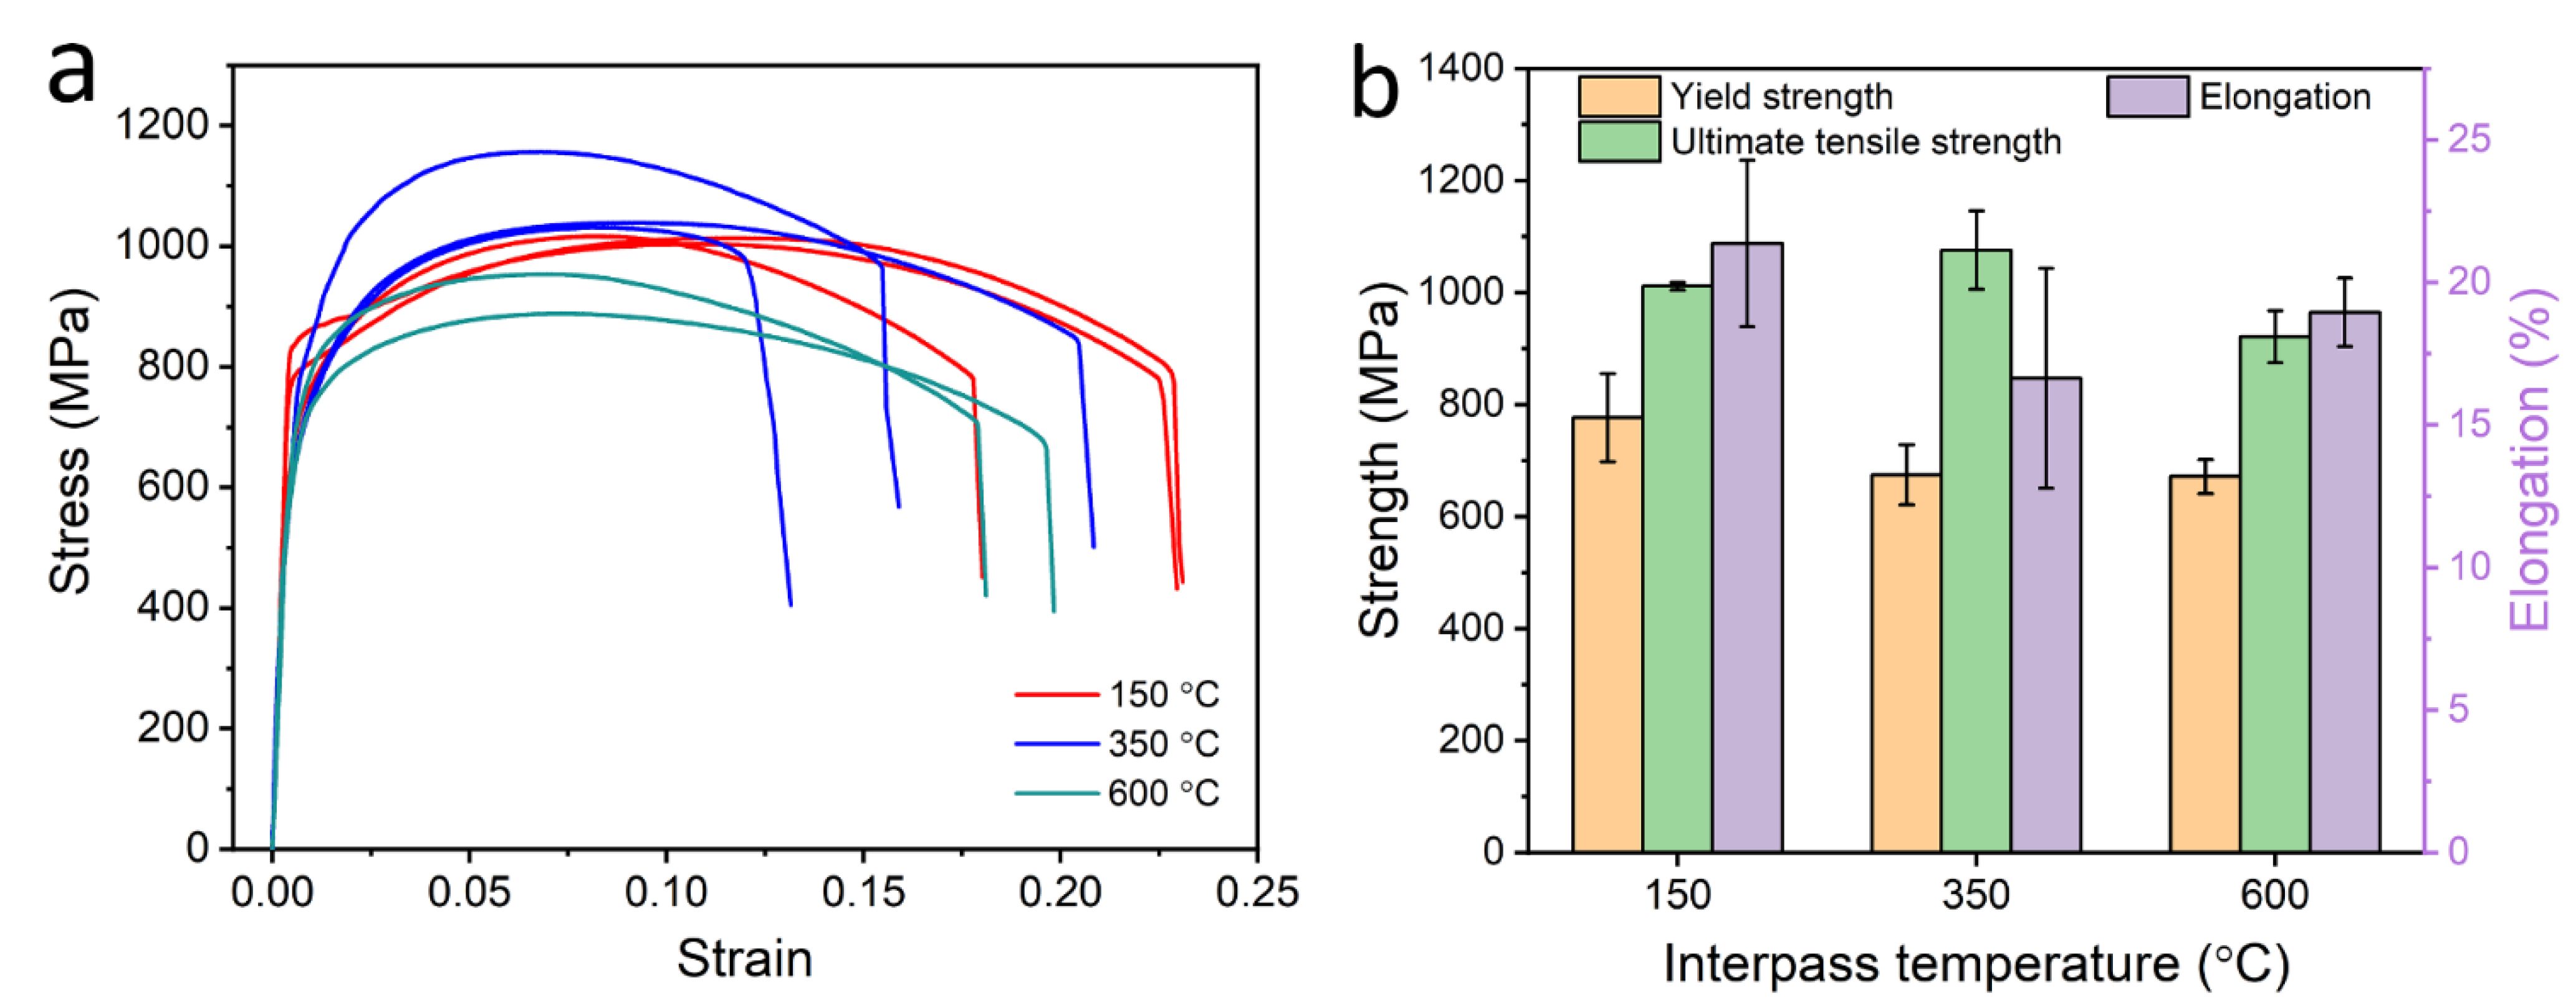
The yield strength tends to decrease with the increase in interpass temperature, but the influence is insignificant.
(3)
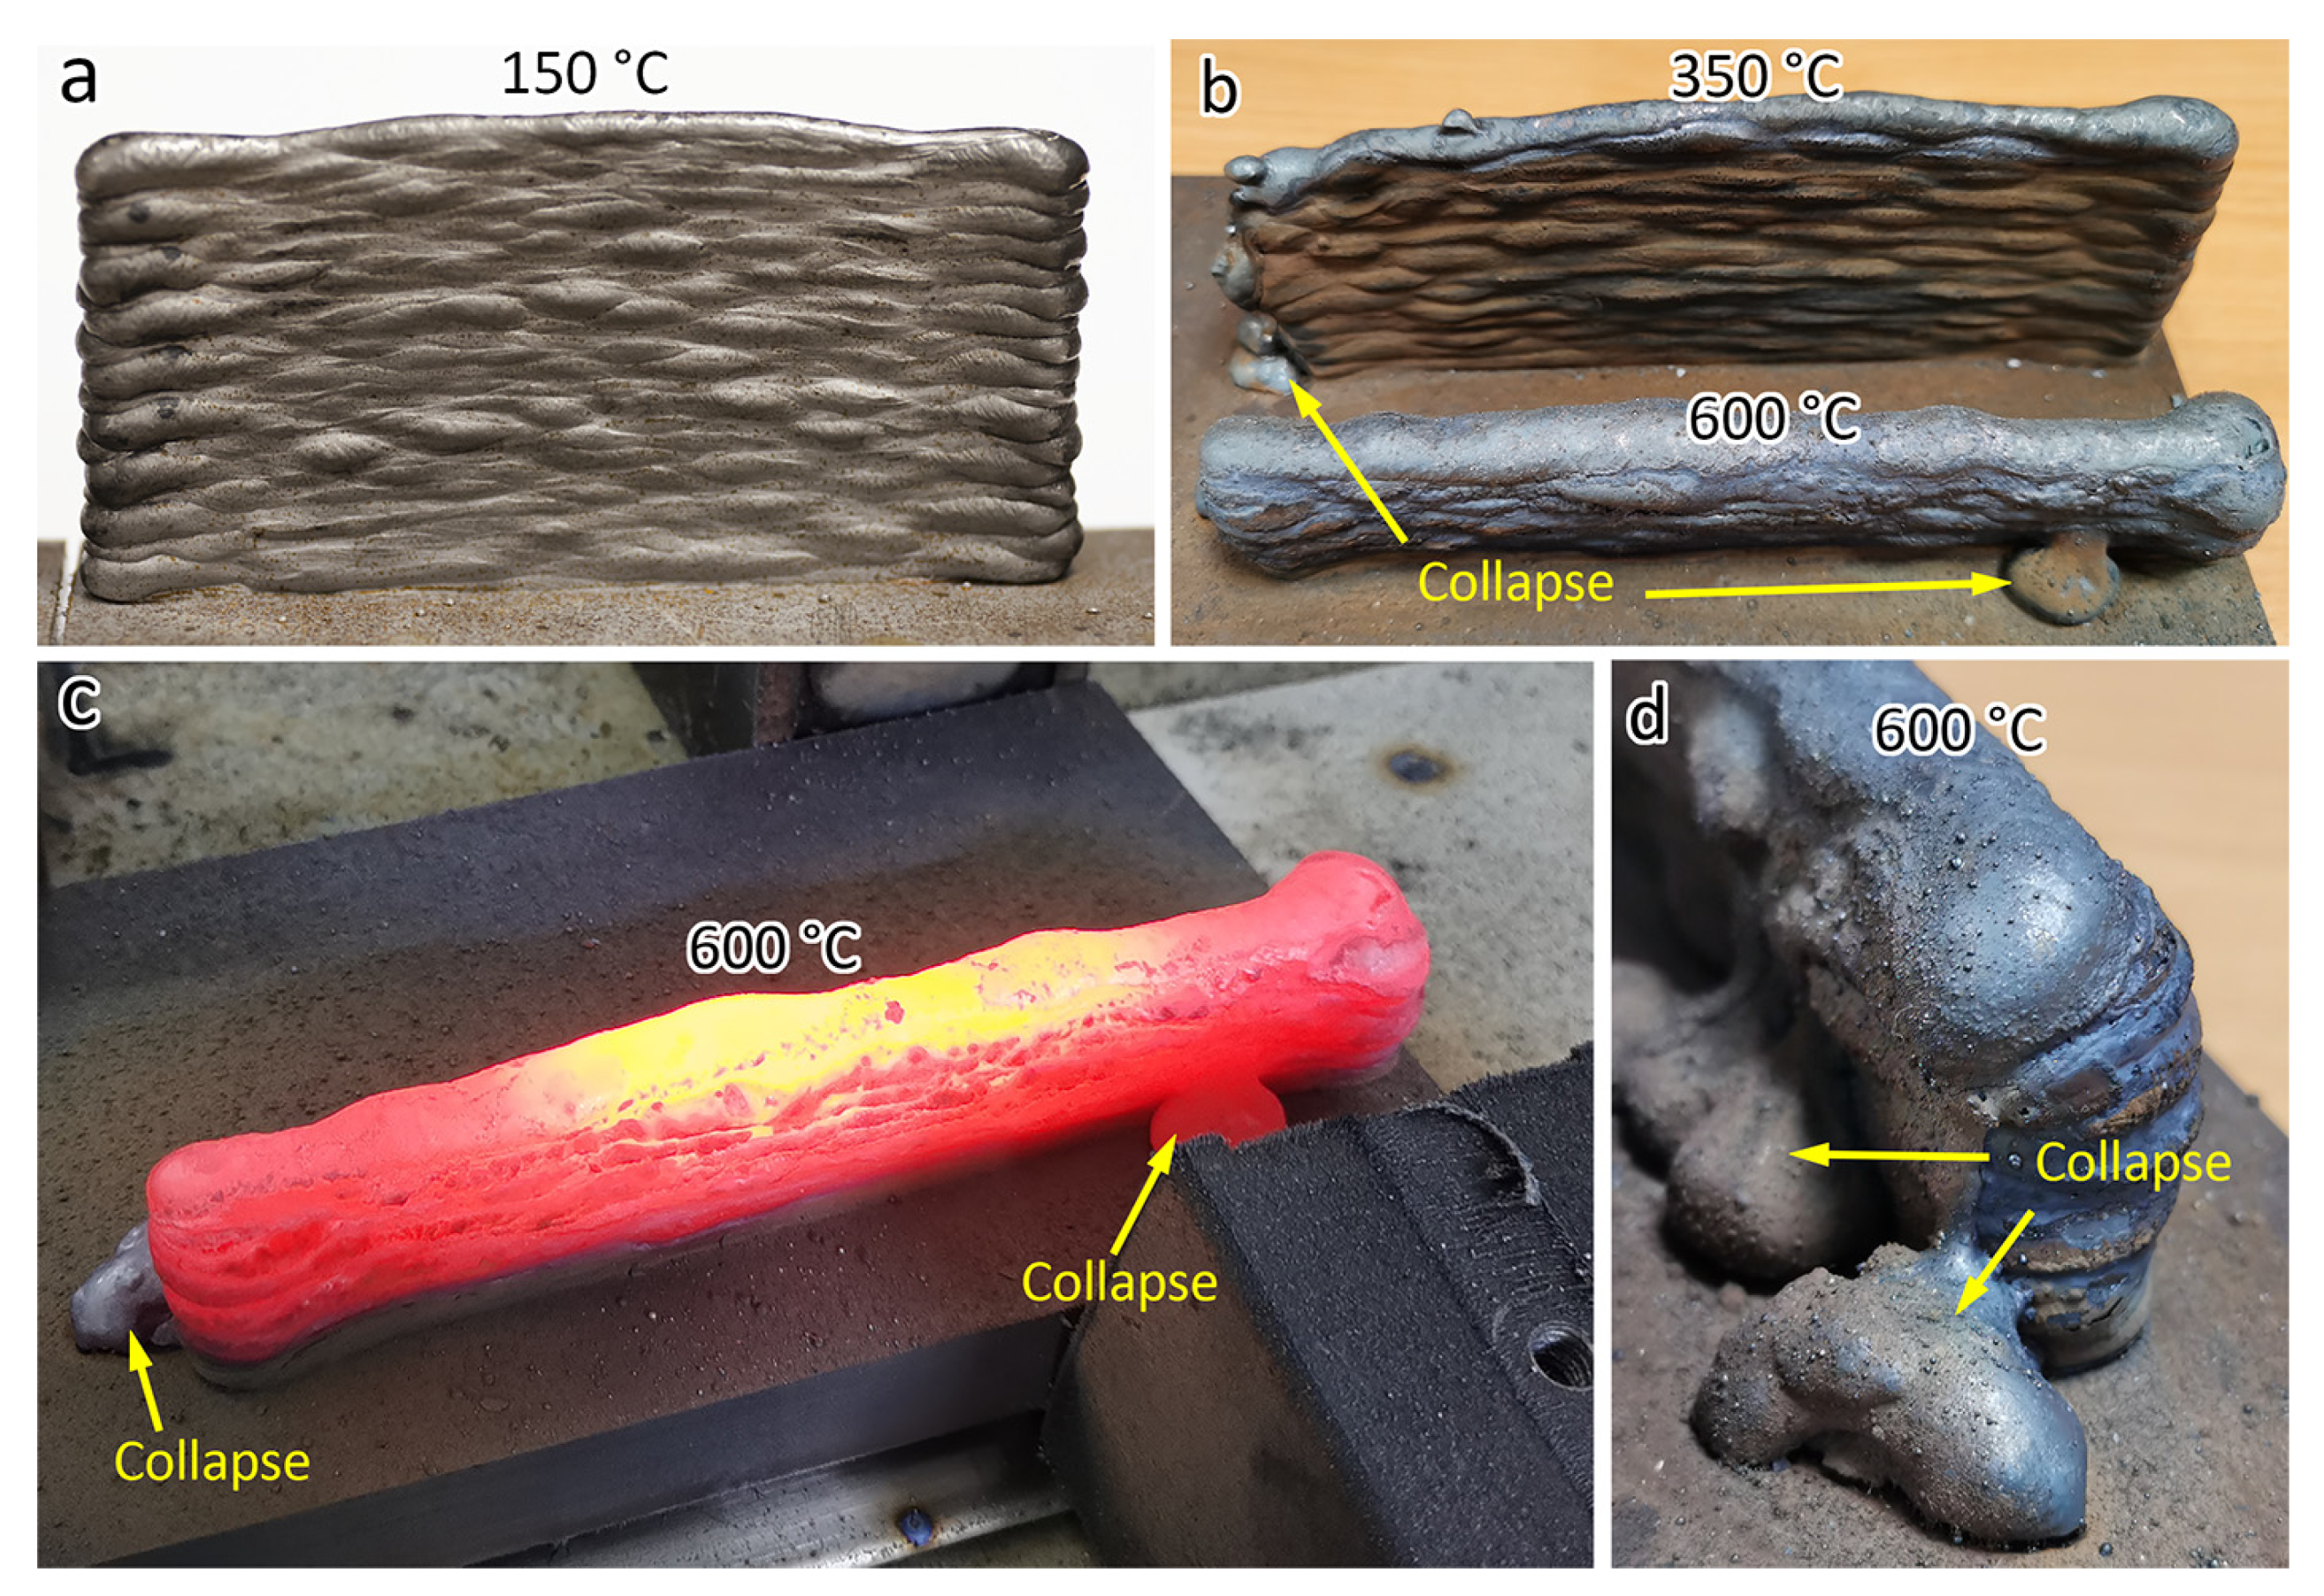
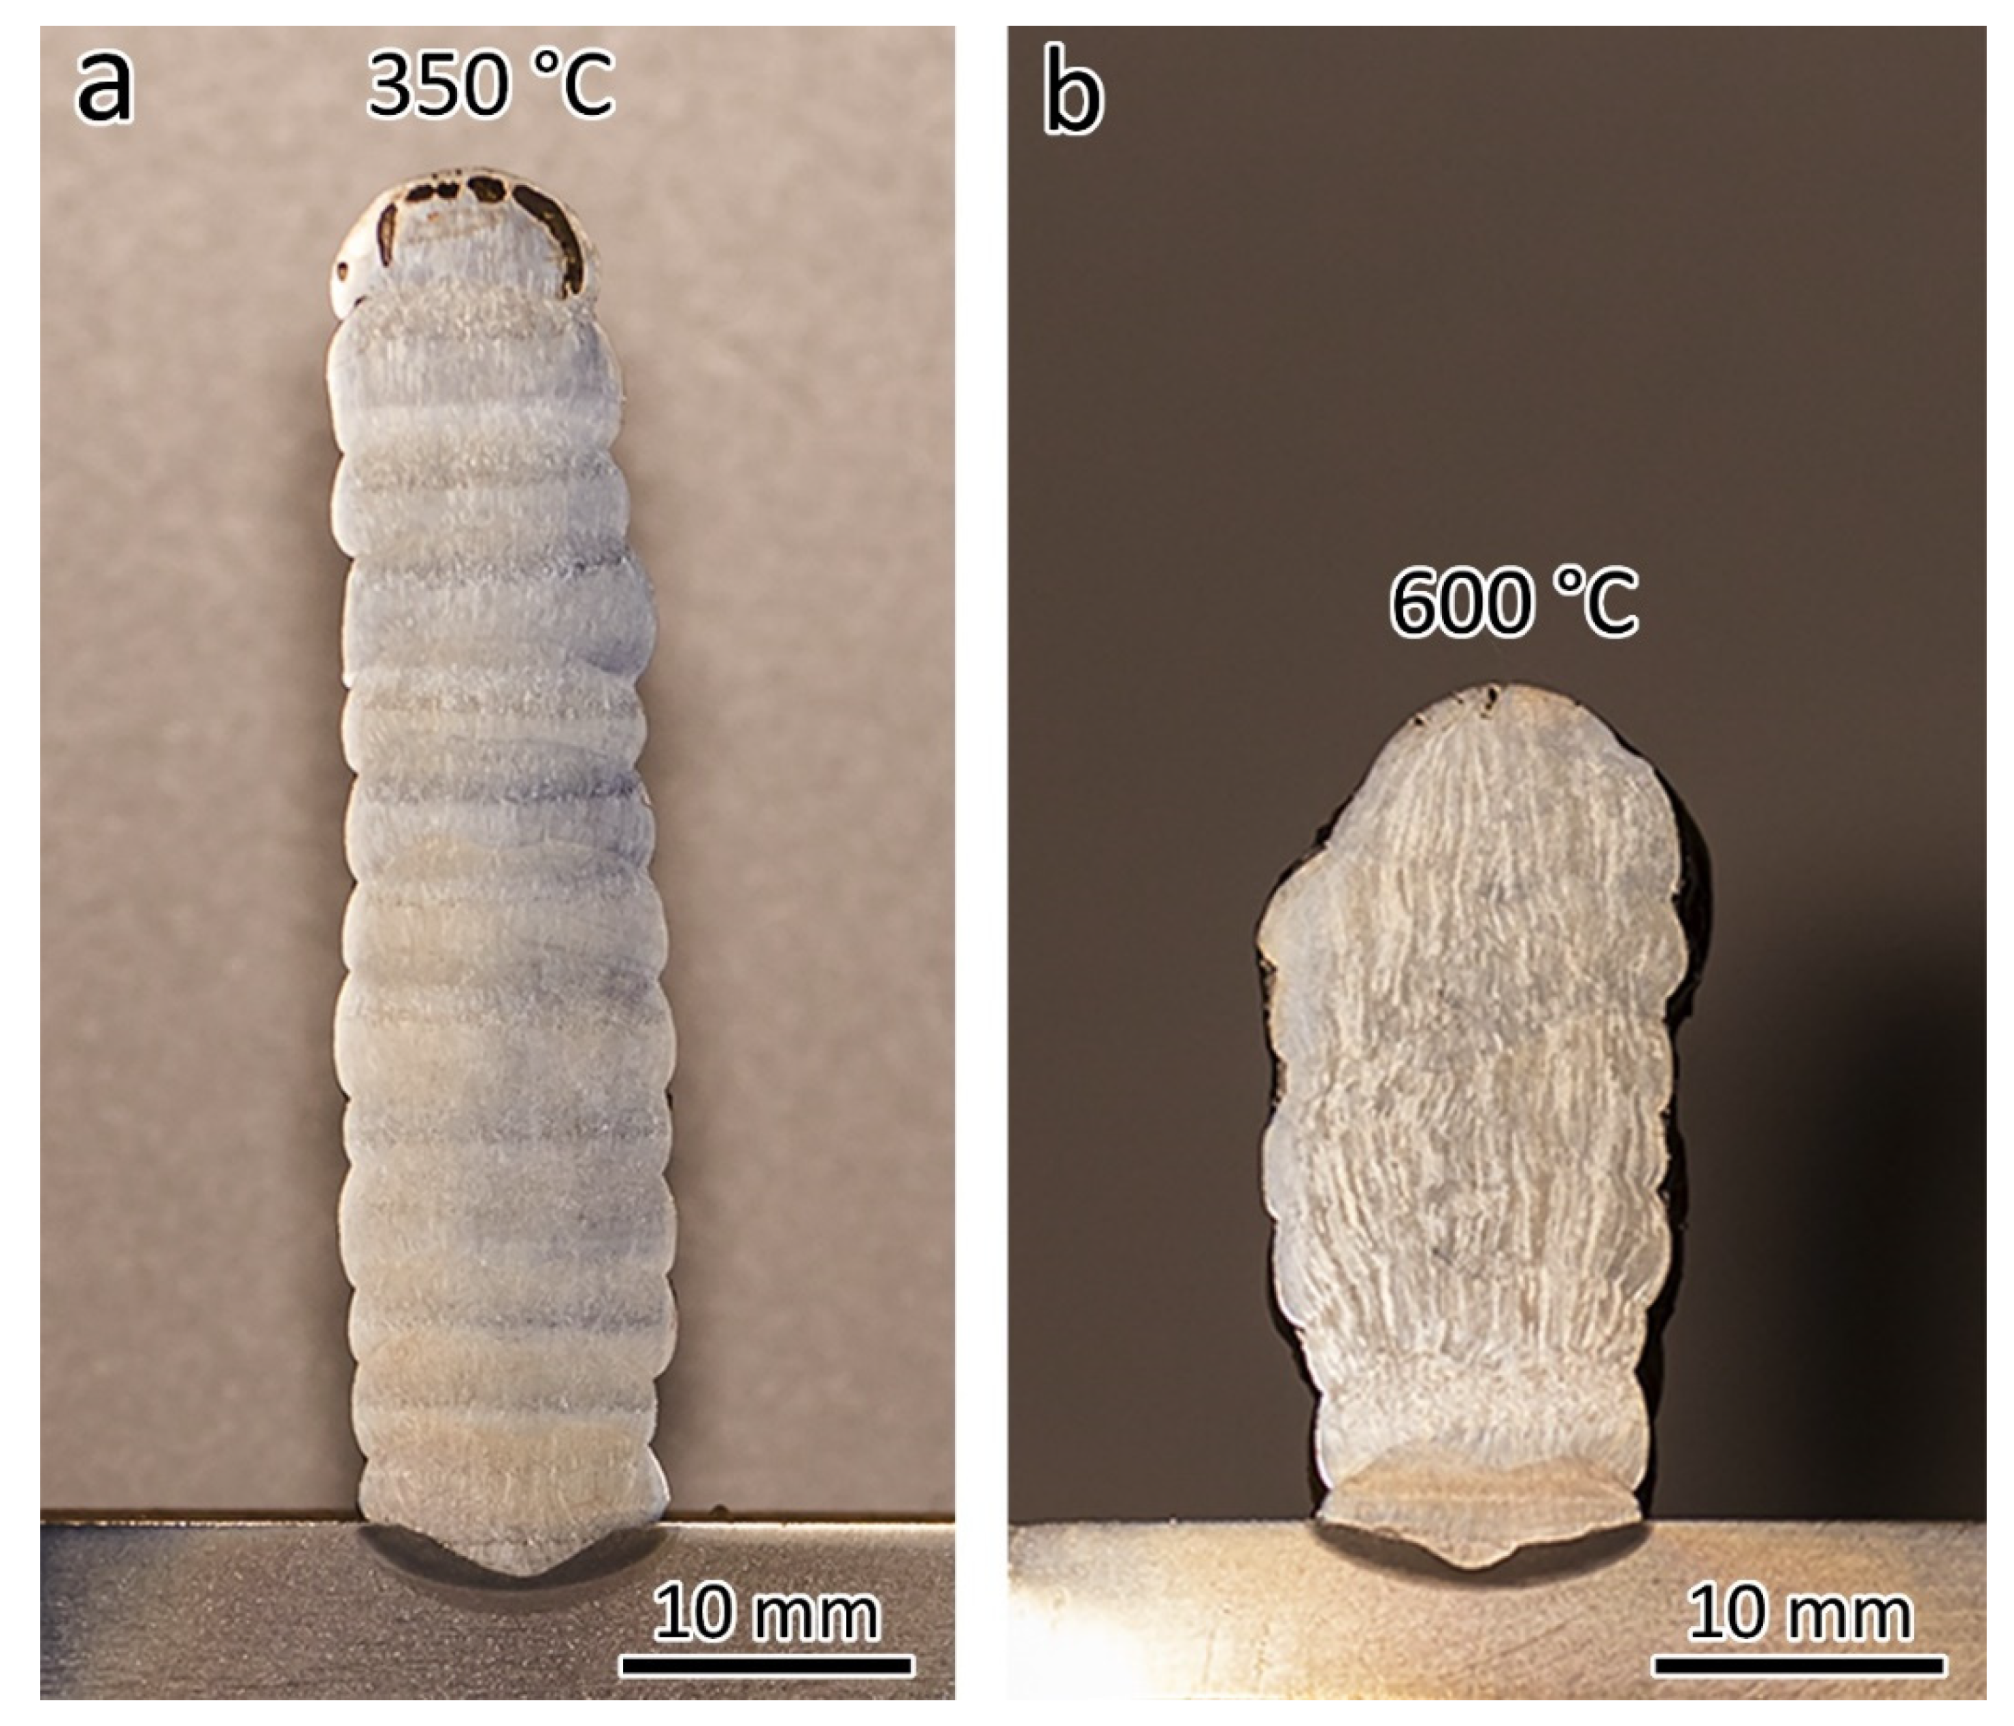
The upper limit of interpass temperature is found to be 350 °C. The highest interpass temperature of 600 °C leads to a collapse of the deposited material.

Author Contributions

Conceptualization, W.Z. (Wengang Zhai) and W.Z. (Wei Zhou); methodology, W.Z. (Wengang Zhai), N.W. and W.Z. (Wei Zhou); validation, W.Z. (Wengang Zhai), N.W. and W.Z. (Wei Zhou); formal analysis and investigation, W.Z. (Wengang Zhai) and W.Z. (Wei Zhou); data curation, W.Z. (Wengang Zhai); writing—original draft preparation, W.Z. (Wengang Zhai); writing—review and editing, W.Z. (Wengang Zhai), N.W. and W.Z. (Wei Zhou); visualization, W.Z. (Wengang Zhai); supervision, W.Z. (Wei Zhou); project administration, W.Z. (Wei Zhou). All authors have read and agreed to the published version of the manuscript.

Funding

This research was funded by LUX Photonics Consortium and Precision Laser Solutions Pte. Ltd. through grants #020408-00002 and #020408-00003.

Institutional Review Board Statement

Not applicable.

Informed Consent Statement

Not applicable.

Data Availability Statement

Not applicable.

Acknowledgments

The authors would like to thank the School of Mechanical and Aerospace Engineering, Nanyang Technological University for the research support.

Conflicts of Interest

The authors declare no conflict of interest.

References

  1. Zhai, W.; Zhu, Z.; Zhou, W.; Nai, S.M.L.; Wei, J. Selective laser melting of dispersed TiC particles strengthened 316L stainless steel. Compos. Part B Eng. 2020, 199, 108291. [Google Scholar] [CrossRef]
  2. Yan, J.; Zhou, Y.; Gu, R.; Zhang, X.; Quach, W.M.; Yan, M. A Comprehensive Study of Steel Powders (316L, H13, P20 and 18Ni300) for Their Selective Laser Melting Additive Manufacturing. Metals 2019, 9, 86. [Google Scholar] [CrossRef] [Green Version]
  3. Zhai, W.; Wang, P.; Ng, F.L.; Zhou, W.; Nai, S.M.L.; Wei, J. Hybrid manufacturing of γ-TiAl and Ti–6Al–4V bimetal component with enhanced strength using electron beam melting. Compos. Part B Eng. 2021, 207, 108587. [Google Scholar] [CrossRef]
  4. Weng, F.; Chew, Y.; Zhu, Z.; Yao, X.; Wang, L.; Ng, F.L.; Liu, S.; Bi, G. Excellent combination of strength and ductility of CoCrNi medium entropy alloy fabricated by laser aided additive manufacturing. Addit. Manuf. 2020, 34, 101202. [Google Scholar] [CrossRef]
  5. Bhowmik, A.; Yang, Y.; Zhou, W.; Chew, Y.; Bi, G. On the heterogeneous cooling rates in laser-clad Al-50Si alloy. Surf. Coat. Technol. 2021, 408, 126780. [Google Scholar] [CrossRef]
  6. Shen, C.; Pan, Z.; Ma, Y.; Cuiuri, D.; Li, H. Fabrication of iron-rich Fe–Al intermetallics using the wire-arc additive manufacturing process. Addit. Manuf. 2015, 7, 20–26. [Google Scholar] [CrossRef]
  7. Li, K.; Klecka, M.A.; Chen, S.; Xiong, W. Wire-arc additive manufacturing and post-heat treatment optimization on microstructure and mechanical properties of Grade 91 steel. Addit. Manuf. 2021, 37, 101734. [Google Scholar] [CrossRef]
  8. Wu, B.; Pan, Z.; Ding, D.; Cuiuri, D.; Li, H.; Xu, J.; Norrish, J. A review of the wire arc additive manufacturing of metals: Properties, defects and quality improvement. J. Manuf. Process. 2018, 35, 127–139. [Google Scholar] [CrossRef]
  9. Schlagradl, T.; Schneider, R.; Posch, G.; Schnitzer, R. Investigation of the hardness–toughness relationship of a welded joint after different heat treatment cycles. Weld. World 2013, 57, 113–121. [Google Scholar] [CrossRef]
  10. Bourlet, C.; Zimmer-Chevret, S.; Pesci, R.; Bigot, R.; Robineau, A.; Scandella, F. Microstructure and mechanical properties of high strength steel deposits obtained by Wire-Arc Additive Manufacturing. J. Manuf. Process. Technol. 2020, 285, 116759. [Google Scholar] [CrossRef]
  11. Zhai, W.; Zhou, W.; Nai, S.M.L. In-situ formation of TiC nanoparticles in selective laser melting of 316L with addition of micronsized TiC particles. Mater. Sci. Eng. A 2022, 829, 142179. [Google Scholar] [CrossRef]
  12. Zhai, W.; Zhou, W.; Nai, S.M.L. Grain refinement and strengthening of 316L stainless steel through addition of TiC nanoparticles and selective laser melting. Mater. Sci. Eng. A 2022, 832, 142460. [Google Scholar] [CrossRef]
  13. Rodrigues, T.A.; Duarte, V.; Miranda, R.M.; Santos, T.G.; Oliveira, J.P. Current Status and Perspectives on Wire and Arc Additive Manufacturing (WAAM). Materials 2019, 12, 1121. [Google Scholar] [CrossRef] [PubMed] [Green Version]
  14. Köhler, M.; Hensel, J.; Dilger, K. Effects of Thermal Cycling on Wire and Arc Additive Manufacturing of Al-5356 Components. Metals 2020, 10, 952. [Google Scholar] [CrossRef]
  15. Li, F.; Chen, S.; Shi, J.; Zhao, Y.; Tian, H. Thermoelectric Cooling-Aided Bead Geometry Regulation in Wire and Arc-Based Additive Manufacturing of Thin-Walled Structures. Appl. Sci. 2018, 8, 207. [Google Scholar] [CrossRef] [Green Version]
  16. Chen, W.; Chen, Y.; Zhang, T.; Wen, T.; Yin, Z.; Feng, X. Effect of Ultrasonic Vibration and Interpass Temperature on Microstructure and Mechanical Properties of Cu-8Al-2Ni-2Fe-2Mn Alloy Fabricated by Wire Arc Additive Manufacturing. Metals 2020, 10, 215. [Google Scholar] [CrossRef] [Green Version]
  17. Wang, L.; Xue, J.; Wang, Q. Correlation between arc mode, microstructure, and mechanical properties during wire arc additive manufacturing of 316L stainless steel. Mater. Sci. Eng. A 2019, 751, 183–190. [Google Scholar] [CrossRef]
  18. Rodrigues, T.A.; Duarte, V.; Avila, J.A.; Santos, T.G.; Miranda, R.M.; Oliveira, J.P. Wire and arc additive manufacturing of HSLA steel: Effect of thermal cycles on microstructure and mechanical properties. Addit. Manuf. 2019, 27, 440–450. [Google Scholar] [CrossRef]
  19. Shen, C.; Pan, Z.; Cuiuri, D.; Ding, D.; Li, H. Influences of deposition current and interpass temperature to the Fe3Al-based iron aluminide fabricated using wire-arc additive manufacturing process. Int. J. Adv. Manuf. Technol. 2016, 88, 2009–2018. [Google Scholar] [CrossRef]
  20. Ma, Y.; Cuiuri, D.; Shen, C.; Li, H.; Pan, Z. Effect of interpass temperature on in-situ alloying and additive manufacturing of titanium aluminides using gas tungsten arc welding. Addit. Manuf. 2015, 8, 71–77. [Google Scholar] [CrossRef]
  21. Farren, J.; DuPont, J. Microstructural Evolution and Mechanical Properties of Welds in a New High Strength Steel. In Proceedings of the MS&T Conference, Pittsburgh, PA, USA, 26–28 October 2009; ASM International: Materials Park, OH, USA, 2009. [Google Scholar]
  22. Yin, J.; Li, L.; Tao, W.; Zhang, X. Weld Microstructure Characteristics of Dual Laser Beam Multi-Layer Welded High Strength Steel with Filler Wire. Chin. J. Lasers 2010, 37, 1361–1367. [Google Scholar] [CrossRef]
  23. Rafieazad, M.; Nasiri, A.M. Microstructural Evolution and Mechanical Properties of a High-Strength Low Alloy Steel Produced by Wire Arc Additive Manufacturing. In Proceedings of the CANWELD Conference, Winnipeg, MB, Canada, 12–13 September 2018. [Google Scholar]
  24. Babu, S.S.; David, S.A.; Vitek, J.M.; Mundra, K.; DebRoy, T. Development of macro- and microstructures of carbon–manganese low alloy steel welds: Inclusion formation. Mater. Sci. Technol. 2013, 11, 186–199. [Google Scholar] [CrossRef]
  25. Wu, B.; Pan, Z.; Ding, D.; Cuiuri, D.; Li, H.; Fei, Z. The effects of forced interpass cooling on the material properties of wire arc additively manufactured Ti6Al4V alloy. J. Manuf. Process. Technol. 2018, 258, 97–105. [Google Scholar] [CrossRef] [Green Version]
Figure 1. Schematic of the WAAM system.
Metals 12 00212 g001
Figure 2. Temperature–time curve showing the cooling rate of the process.
Metals 12 00212 g002
Figure 3. Optical images showing the cross-section microstructures of deposited materials using the interpass temperature of (ac) 150 °C, (df) 350 °C, and (gi) 600 °C with different magnifications. (a,d,g) After polishing but before etching; (b,c,e,f,h,i) after etching.
Metals 12 00212 g003
Figure 4. (a) SEM-BSE image showing the distribution of oxide particles in a sample prepared using interpass temperature of 600 °C. (b,c) EDS line scan showing the chemical composition of the oxide particles observed.
Metals 12 00212 g004
Figure 5. XRD patterns of the WAAM deposited materials with different interpass temperatures.
Metals 12 00212 g005
Figure 6. SEM images showing the microstructure of the WAAM deposited materials using the interpass temperatures of (a,b) 150 °C, (c,d) 350 °C, and (e,f) 600 °C.
Metals 12 00212 g006
Figure 7. EBSD results of the WAAM deposited materials using the interpass temperature of (a,d,g) 150 °C, (b,e,h) 350 °C, and (c,f,i) 600 °C. (ac) Orientation maps. (df) Grain size distributions. (gi) Grain boundary maps.
Metals 12 00212 g007
Figure 8. Pole figures of the WAAM deposited materials using the interpass temperature of (a) 150 °C, (b) 350 °C, and (c) 600 °C.
Metals 12 00212 g008
Figure 9. (a) Tensile curves of the WAAM deposited materials and (b) a summary of yield strength, ultimate tensile strength, and elongation with different interpass temperatures.
Metals 12 00212 g009
Figure 10. Photos showing cross-sections of the WAAM deposited materials with the interpass temperature of (a) 350 °C and (b) 600 °C.
Metals 12 00212 g010
Figure 11. Photos showing (a) no collapse for the interpass temperature of 150 °C; (b) minor and severe collapse for the interpass temperature of 350 °C and 600 °C; (c) a glance of the interpass temperature of 600 °C; (d) severe collapse during the interpass temperature of 600 °C.
Metals 12 00212 g011
Table 1. Deposition rates for major fusion-based AM processes for steels [1,3,13].
AM ProcessSLMEBMLMDWAAM
Deposition rate (grams per hour)40–100100–300150–2400500–10,000
Table 2. Process parameters for WAAM deposition.
Average current255 A
Average arc voltage16.5 V
Torch travel speed0.9 m/min
Wire feed speed8 m/min
Wire diameter1.2 mm
Shielding gas20 L/min
Interpass temperature150 °C
350 °C
600 °C
Table 3. Yield strength, ultimate tensile strength, elongation, and microhardness of the WAAM deposited low-alloy high-strength steel.
Interpass Temperature (°C)Yield Strength (MPa)Ultimate Tensile Strength (MPa)Elongation (%)Microhardness (HV)
150776.8 ± 79.01011.5 ± 6.721.4 ± 2.9294.1 ± 7.4
350674.9 ± 53.51075.9 ± 70.216.6 ± 3.9324.4 ± 19.8
600671.8 ± 30.4921.2 ± 46.519.0 ± 1.2291.0 ± 6.9
Table 4. Summary of microstructural factors and yield strength at the three interpass temperatures.
Interpass Temperature (°C)Grain Size (µm)Fraction of LAGB (%)Texture IndexYield Strength (MPa)
1503.9 ± 0.125.52.9776.8 ± 79.0
3504.1 ± 0.125.93.8674.9 ± 53.5
6004.9 ± 0.224.13.6671.8 ± 30.4
Publisher’s Note: MDPI stays neutral with regard to jurisdictional claims in published maps and institutional affiliations.

