Article

Effects of Pressure on Homogeneous Nucleation and Growth during Isothermal Solidification in Pure Al: A Molecular Dynamics Simulation Study

1
State Key Laboratory for Advanced Metals and Materials, University of Science and Technology Beijing, Beijing 100083, China
2
CAEP Software Center for High Performance Numerical Simulation, Beijing 100088, China
3
Institute of Applied Physics and Computational Mathematics, Beijing 100088, China
4
School of Materials Science and Engineering, University of Science and Technology Beijing, Beijing 100083, China
5
Xi’an Key Laboratory of Clean Energy, Xi’an University of Architecture & Technology, Xi’an 710055, China
*
Author to whom correspondence should be addressed.
Metals 2022, 12(12), 2101; https://doi.org/10.3390/met12122101
Submission received: 18 October 2022 / Revised: 25 November 2022 / Accepted: 2 December 2022 / Published: 7 December 2022
(This article belongs to the Special Issue Microstructure and Mechanical Properties of Nanocrystalline Metals)

Abstract

:
Effects of different pressures on the isothermal-solidification process of pure Al were studied by molecular dynamics (MD) simulation using the embedded-atom method (EAM). Al was first subjected to a rapid-cooling process, and then it was annealed under different pressures conditions. Mean first-passage times (MFPT) method, Johnson-Mehl-Avrami (JMA) law, and X-ray diffraction (XRD) simulation analysis method were used to qualify the solidification- kinetic processing. Nucleation rate, critical-nucleus size, Avrami exponent, growth exponent, and crystallite size were calculated. Results show that the nucleation rate increases as the pressure increases. The change of critical-nucleation size is not obvious as the pressure increases. With the pressure increasing, growth exponent decreases, indicative of decreased grain-growth rate. It was also found that with the pressure increasing, the Avrami exponent decreases, indicating that the increased pressure has an effect on growth modes during solidification, which changes from three-dimensional growth to one-dimensional growth. Results of XRD simulation shows that with pressure increasing, crystallite size decreases.

1. Introduction

Changing the thermodynamic conditions during solidification to refine grains is one of the innovations in manufacturing. As a key thermodynamic factor, pressure is of great research interest. Effects of pressure on the crystallization process has been studied for a long time and has many practical applications, especially in supercooled melts [1,2,3]. Effects of pressure on the structure and properties of matter were first studied by P.W. Bridgman [4]. Bridgman developed techniques for high pressure (~10 GPa) and investigated effects of pressure on thermal and electrical conductivity, melting, reaction kinetics, viscosity, compressibility, tensile strength, and various other properties and phenomena. His research demonstrates the importance of pressure for studying continuous and discontinuous changes in the structure and properties of matter [5]. According to the high-pressure solidification theory, increasing the pressure reduces the nucleation-activation energy, thereby increasing the nucleation rate, and also increases the atomic-diffusion- activation energy, and thus, it restrains atomic diffusion [6]. As a result, this increases the activation energy for crystal growth and reduces the crystal growth rate [7,8,9]. Celik et al. [10] investigated the crystallization and nucleation processes of Pt50–Rh50 model alloy from liquid phase to solid phase at the nano-scale using molecular-dynamics simulation under different pressures. The effects of pressure on the crystal kinetics and the melting point of the system have been examined that the melting point of the alloy increases with increasing pressure and that the process of homogenous-nucleation formation and the calculations are consistent with the classical nucleation theory. Han et al. [11] investigated the solidification microstructure of Al-5.4% Cu alloy, which was solidified under high pressure, and found that the dendrite size was reduced evidently. Zhao et al. [12] investigated the effect of high pressure on the solidification microstructure, and reported that high- pressure solidification produces significantly refined Mg alloy structures. For pure Al, Mahata et al. [13] studied the homogeneous nucleation of Al melts under 0 MPa with million-atom MD simulations. Initially, isothermal-crystal nucleation from undercooled melt was studied at different constant temperatures, and later superheated Al melt was quenched with different cooling rates. Sarkar et al. [14] investigated the effects of pressure on the rapid solidification of Al by using MD simulation study based on the EAM potential. The radial distribution function (RDF) was used to characterize the structure of the Al solidified under different pressures. It was indicated that a high pressure leads to strong crystallization tendency during cooling. Unfortunately, nucleation rate and critical nucleation size during solidification under pressure for Al were not reported.
So far, there are few studies focusing on effects of pressure on the solidification process for pure Al. In this work, MD simulation was used to study effects of pressure on nucleation and grain growth of pure Al during the isothermal-solidification process. Nucleation rate and critical-nucleus size were calculated under different pressures using the MFPT method. Growth exponent was determined to study effects of different pressures on grain growth. In addition, the Avrami exponent was calculated to study effects on growth modes during solidification under different pressure conditions.

2. Methods

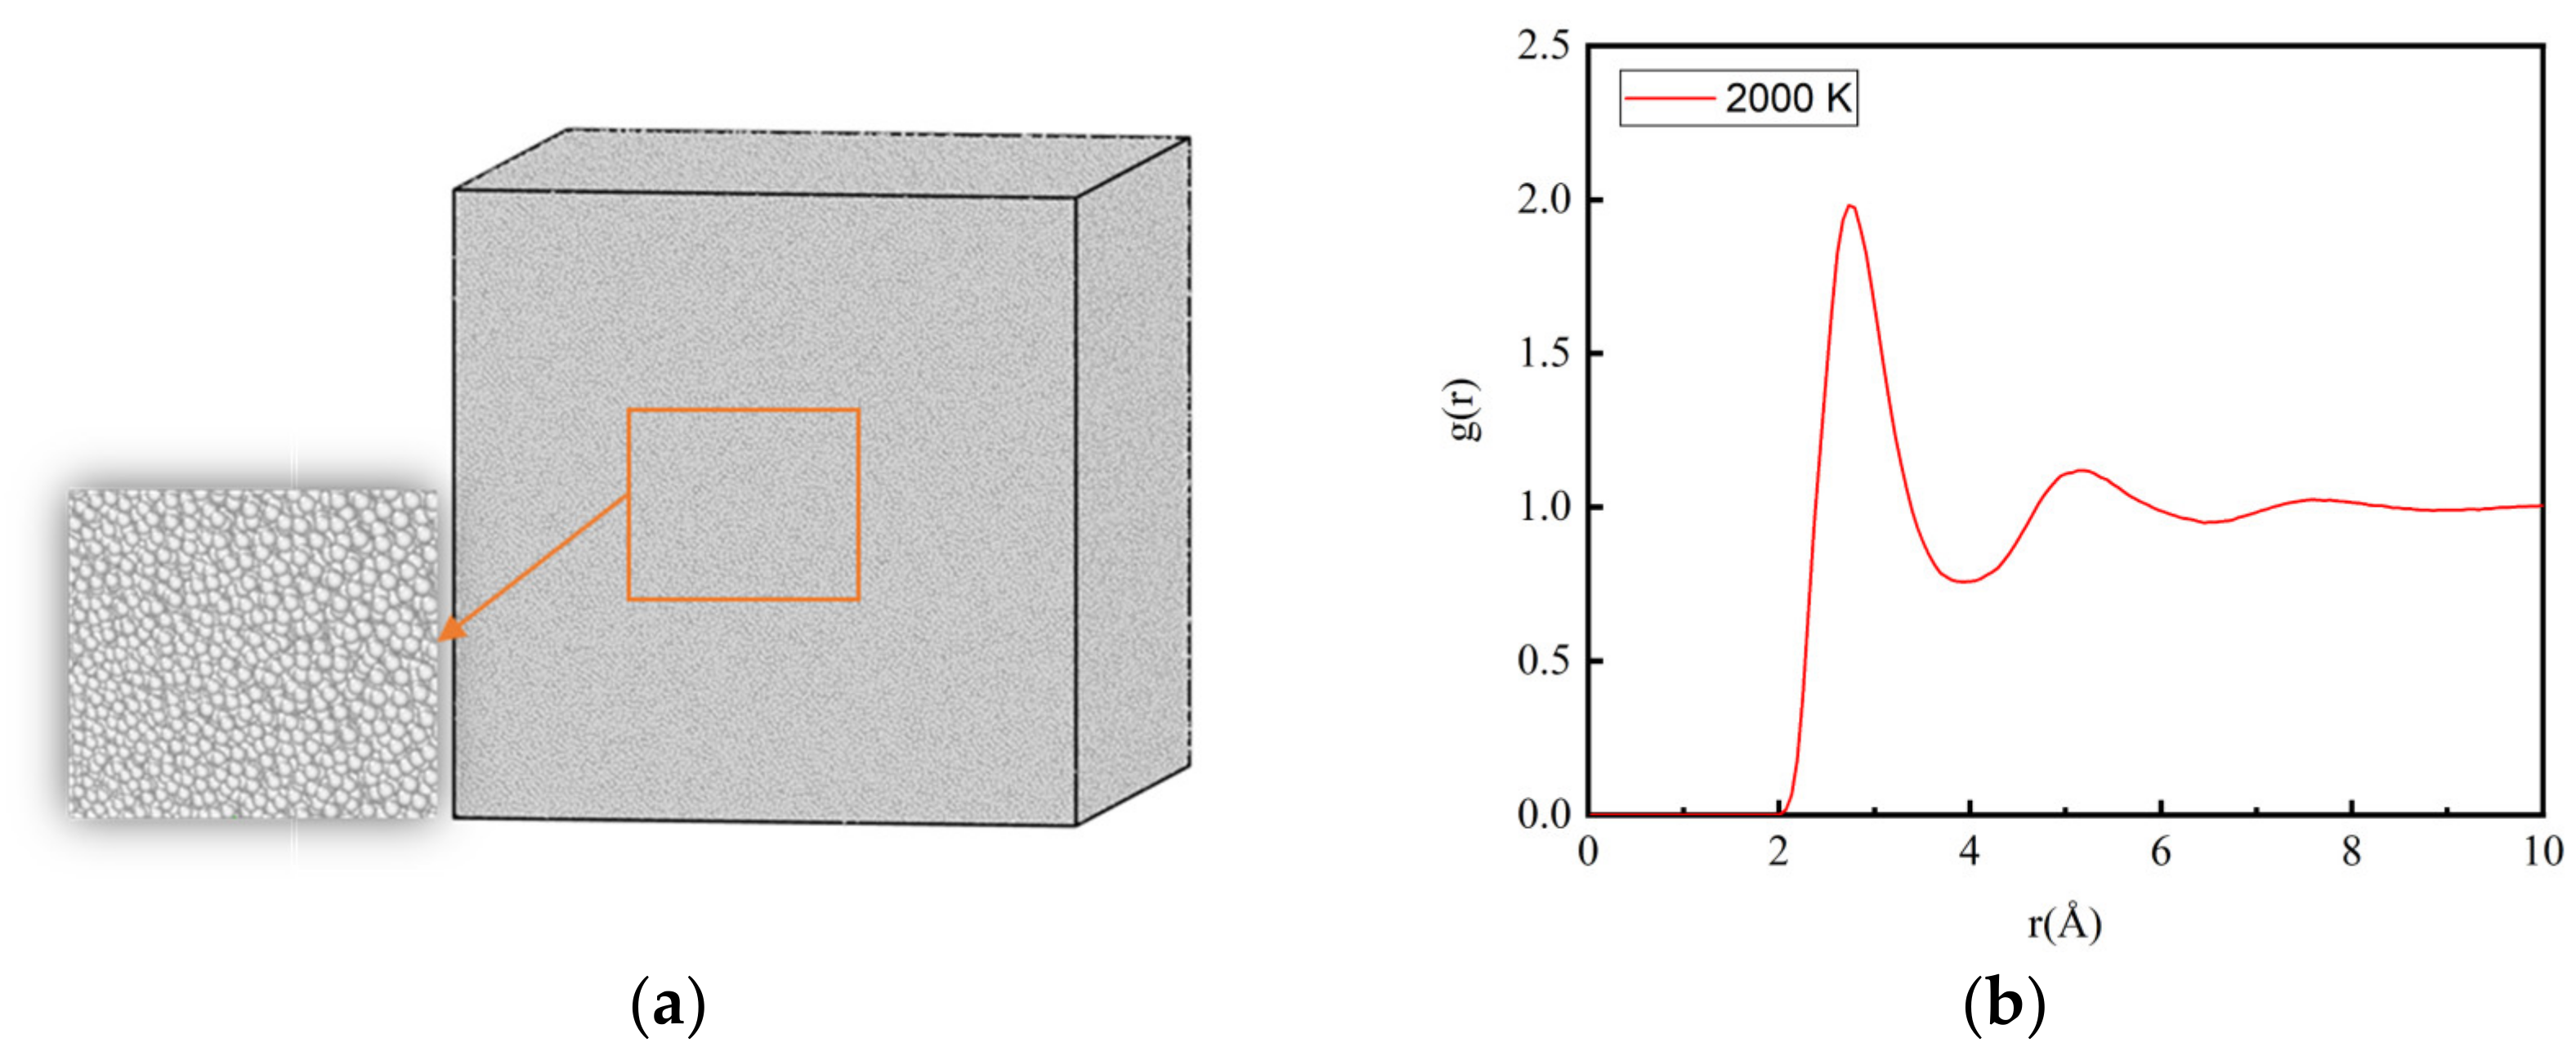
2.1. Simulation Model and Interatomic Potential

MD simulations were performed using the LAMMPS (Large-scale Atomic/Molecular Massively Parallel Simulator) software (Sandia National Laboratories, Livermore, CA, USA). Previous studies have shown that when the scale of simulation reaches millions of atoms, effects of simulation size on various nucleation parameters are convergent, and simulation results are more accurate [13]. In this work, all simulations were conducted with a box of 293 Å × 251 Å × 251 Å containing 1,008,000 atoms. EAM potential developed by Mendelev et al. [15] was used in this study. In EAM potential [16], the total energy E i is given by
E i = F α j i ρ β r i j + 1 2 j i ϕ α β r i j
where F is the embedding energy which is a function of the atomic-electron density ρ , ϕ is a paired potential interaction, and α and β are the element types of atoms i and j. This potential predicts the melting-point temperature T m of Al is 926 K, which is close to the experimental value. Periodic-boundary conditions were applied in all three dimensions and the integration time step was set to 5 fs. The constant pressure-temperature ensemble (NPT) was applied. Temperature is controlled with a Noose-Hoover thermostat and pressure via volume scaling. Since time and space scales are finite in MD simulations and the nucleation of metal melts is a random event, independent runs are required to obtain statistically meaningful results. In this work, each simulation was repeated 50 times. For each statistical run, the random number seed for assigning initial velocities in NPT simulations was varied.

2.2. Simulation Details

Initially, a perfect Al-single crystal was heated from solid state at 300 K to liquid state at 2000 K. The liquid was subsequently cooled with 2.0 × 10¹³ K/s cooling rate down to 600 K and then kept at 600 K for 1000 ps. We did the solidification simulation under 0, 100, 200, 300, 500, and 1000 MPa, and found that the microstructure after solidification under 500 and 1000 MPa is mostly amorphous, which is not conducive to the study of nucleation and growth processes. Therefore, the pressures selected for this work are 0, 100, 200, and 300 MPa. In order to obtain the crystallite size, XRD simulation was introduced.
The microstructural evolution during solidification was observed using the visualization software, OVITO (Open visualization tool) [17]. A common neighbor analysis (CNA) [18] was performed to identify structures. The adaptive CNA with variable cutoff distances precisely identifies atomic structures into FCC (face-centered cubic), HCP (hexagonal closed pack), BCC (body-centered cubic), ICO (icosahedron), and unknown (“other”) coordination structures. In CNA, red, green, and grey atoms represent atoms with HCP, FCC, and the “other” structure. Simulations of the melting process have been done in detail in our previous work [19]. Figure 1 shows the Al-melt model at 2000 K and its RDF curve. As shown in Figure 1a, the atoms in the Al melt are all identified to be an ICO-liquid structure (grey). Its RDF is shown in Figure 1b, and there are no long-range peaks, which proves that Al was completely melted at 2000 K.
Section 3.1 presents typical structure evolution under different pressures during the isothermal-solidification process through a single typical simulation chosen from 50 simulations. Section 3.2 displays the methodology and data analysis for MFPT, in which effects of different pressures on the nucleation rate and critical-nucleus size were discussed. Growth exponents and Avrami exponents were calculated in Section 3.3 and Section 3.4, respectively. MFPT, growth exponents, and JMA results were obtained statistically through 50 simulations. Section 3.5 indicates effects of different pressures on the crystallite size by XRD simulation.

3. Results and Discussion

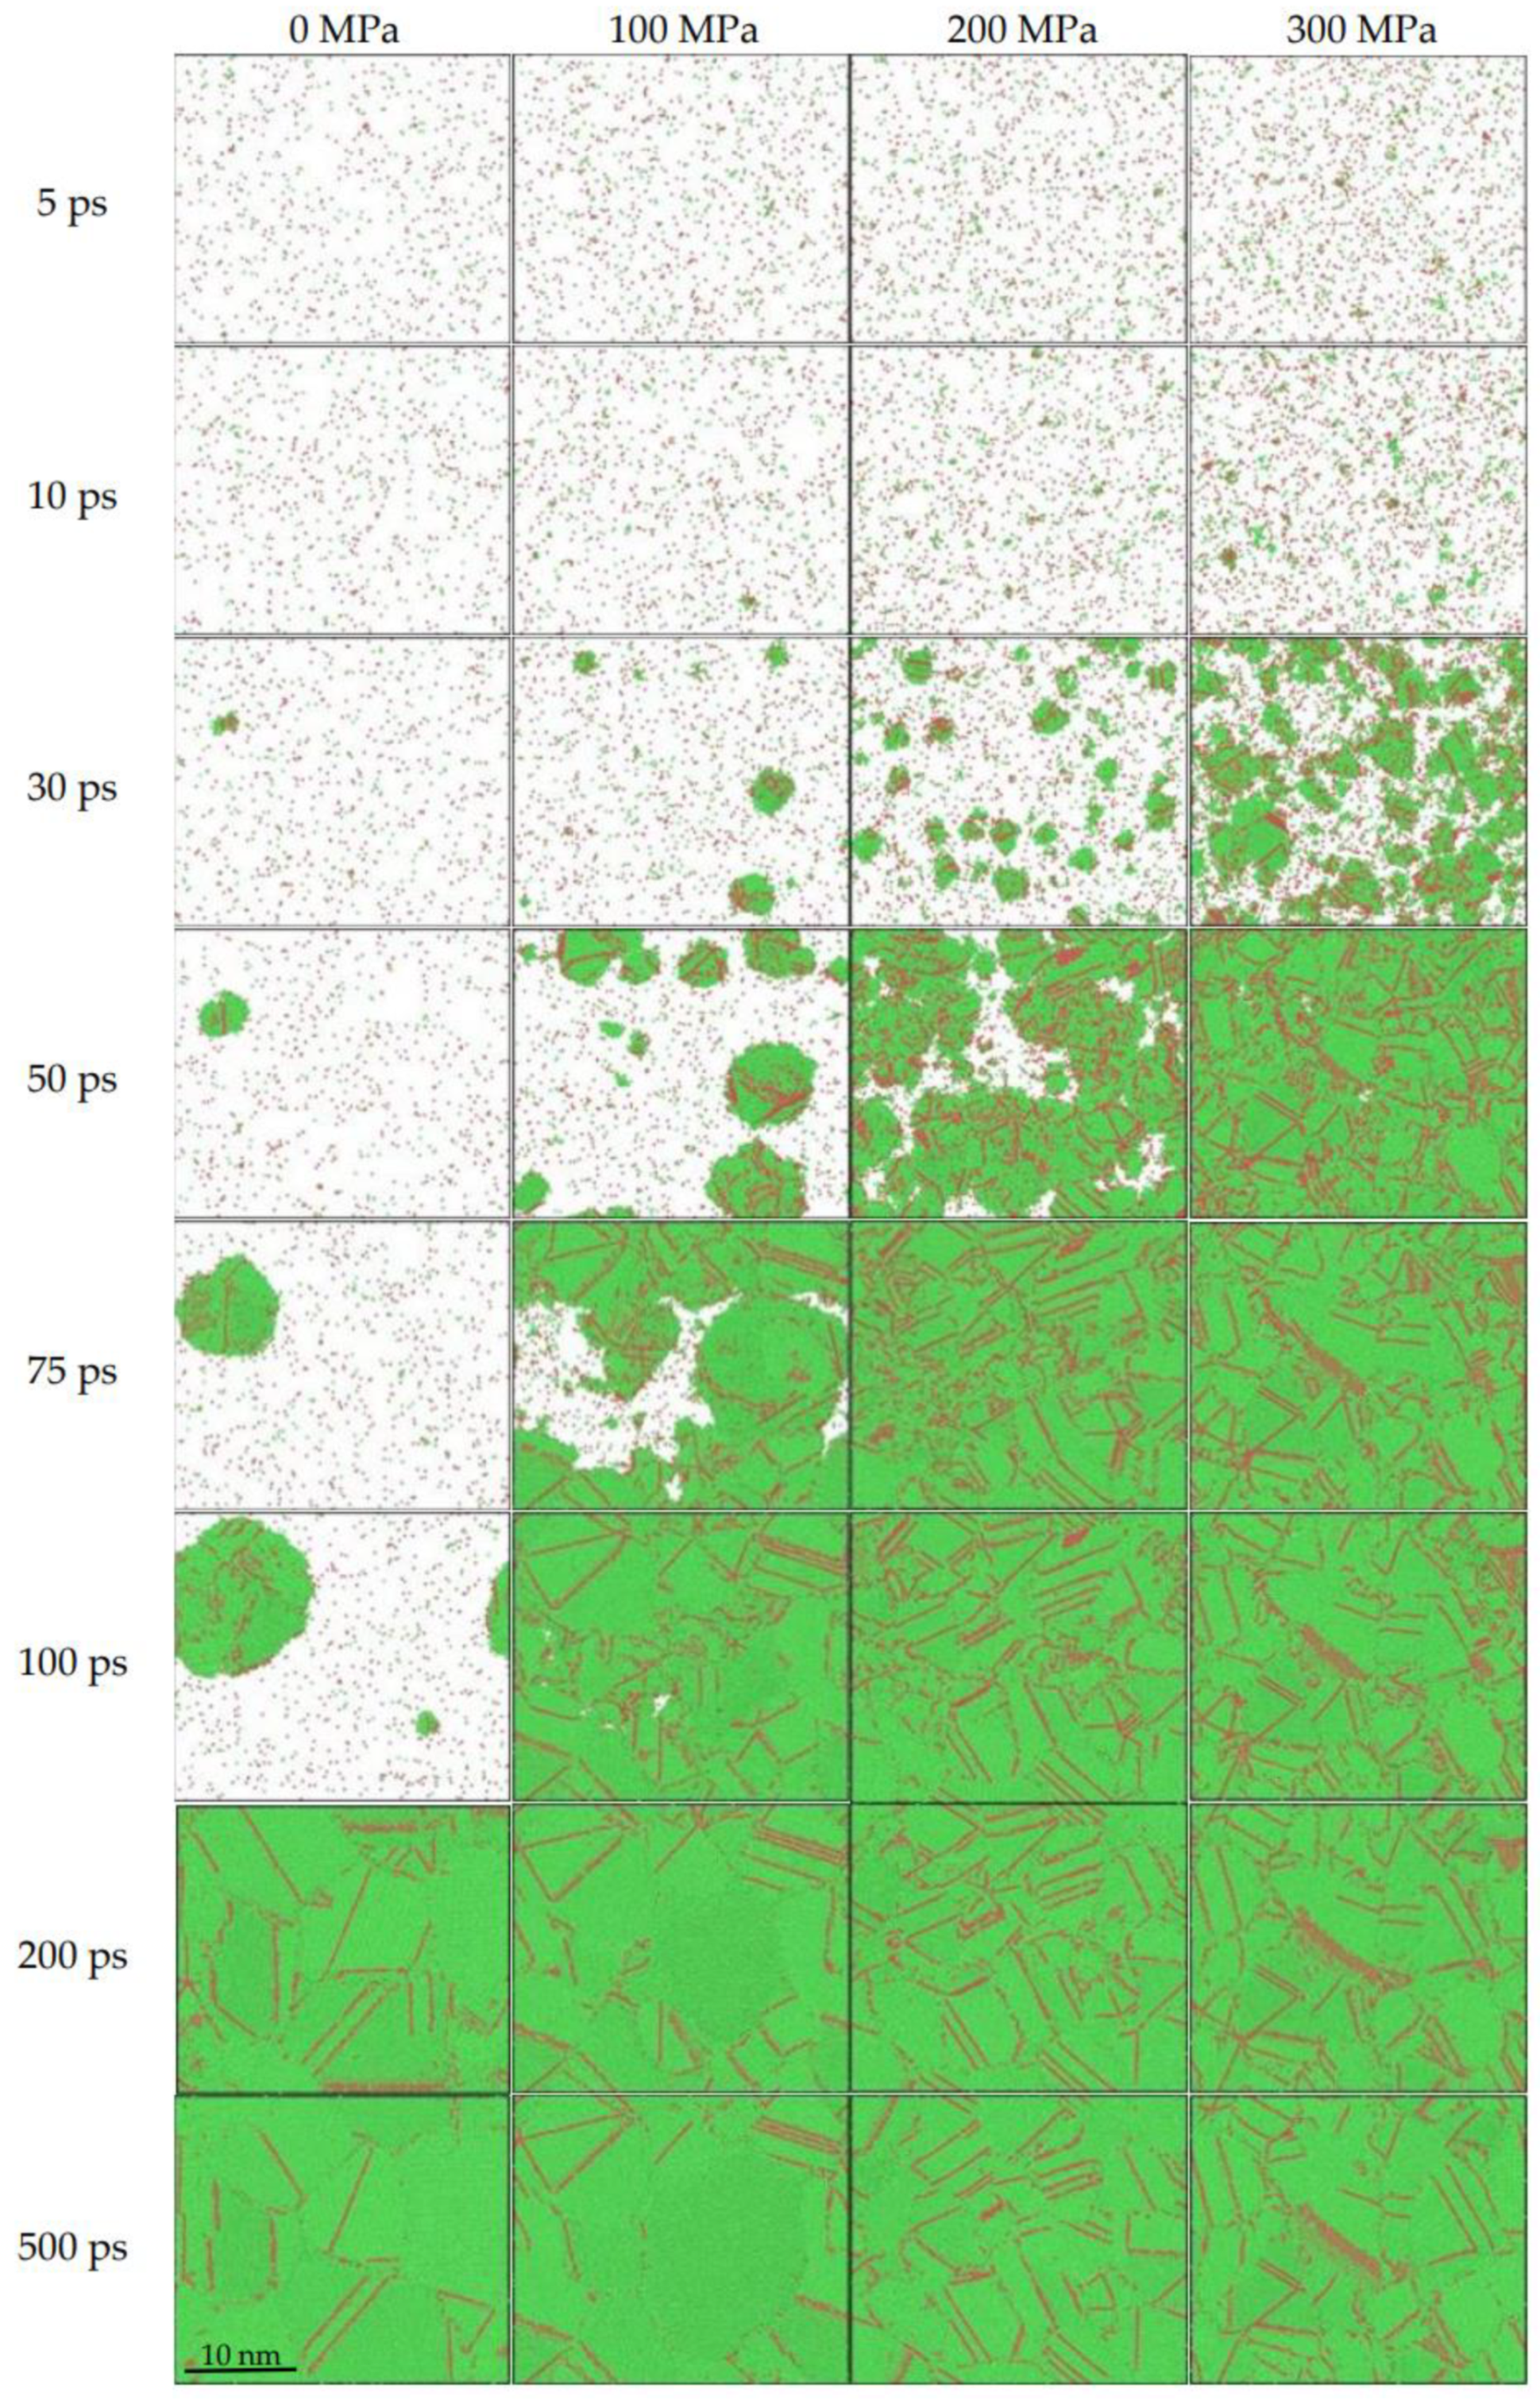
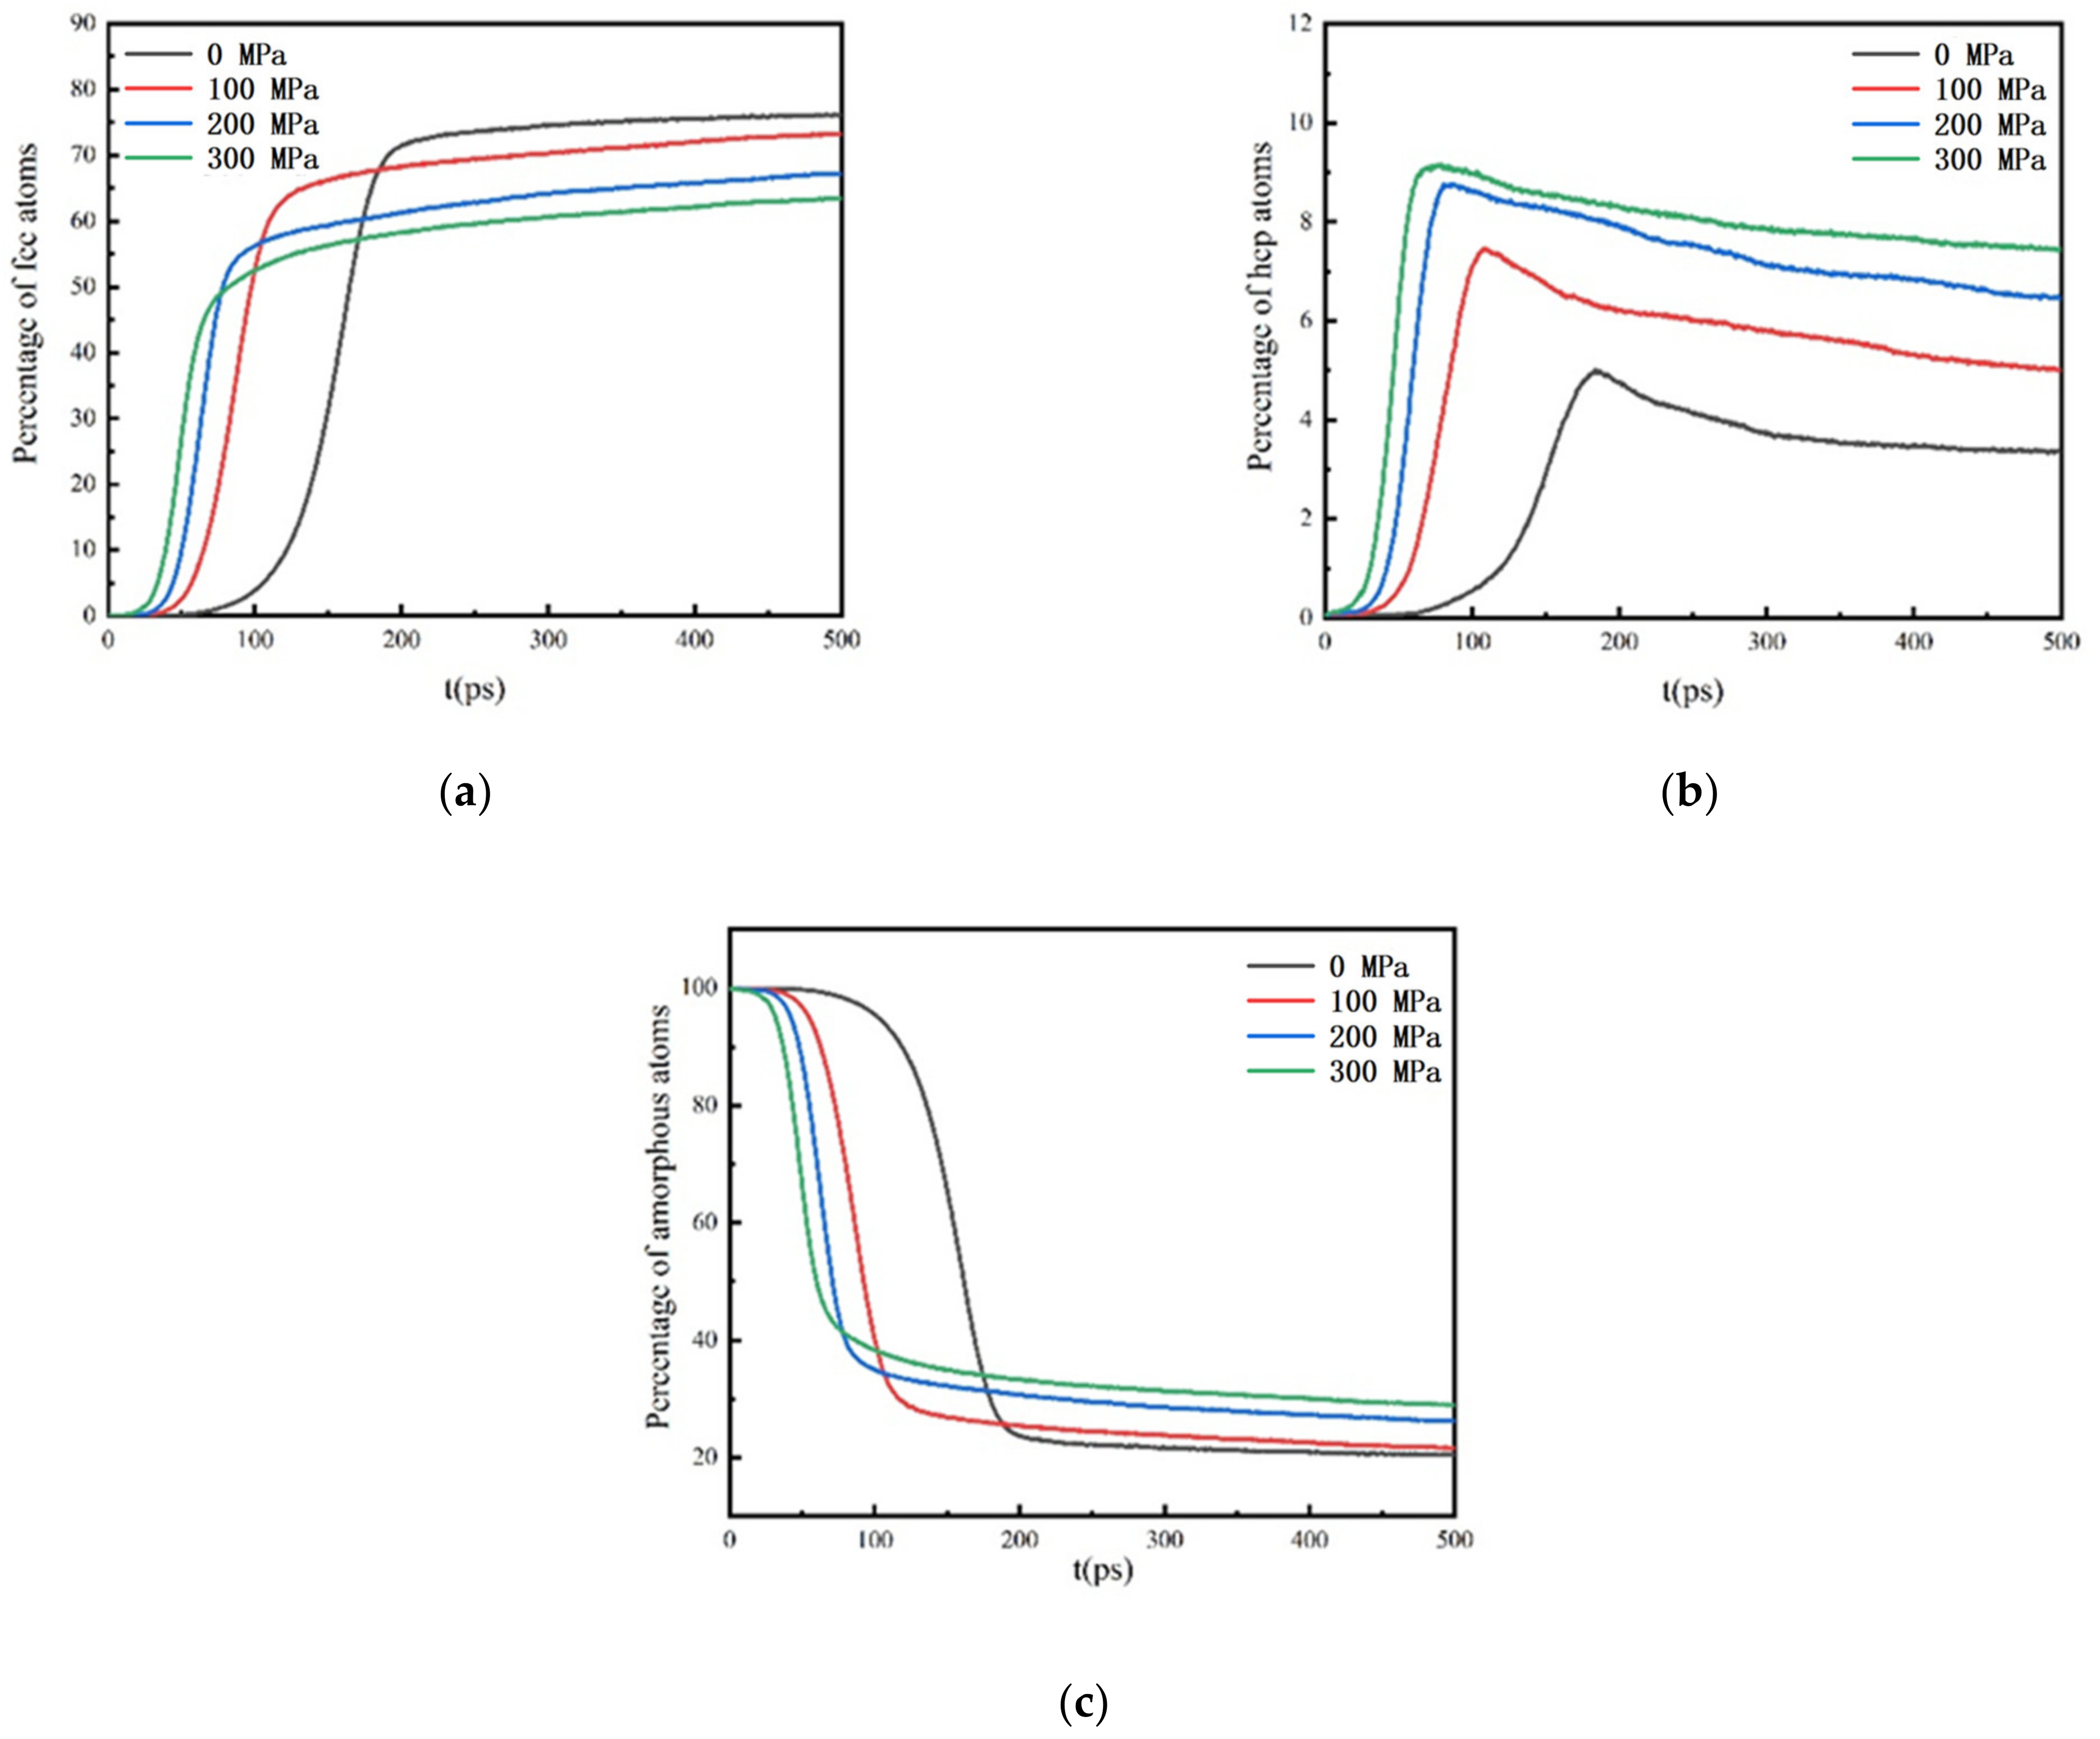
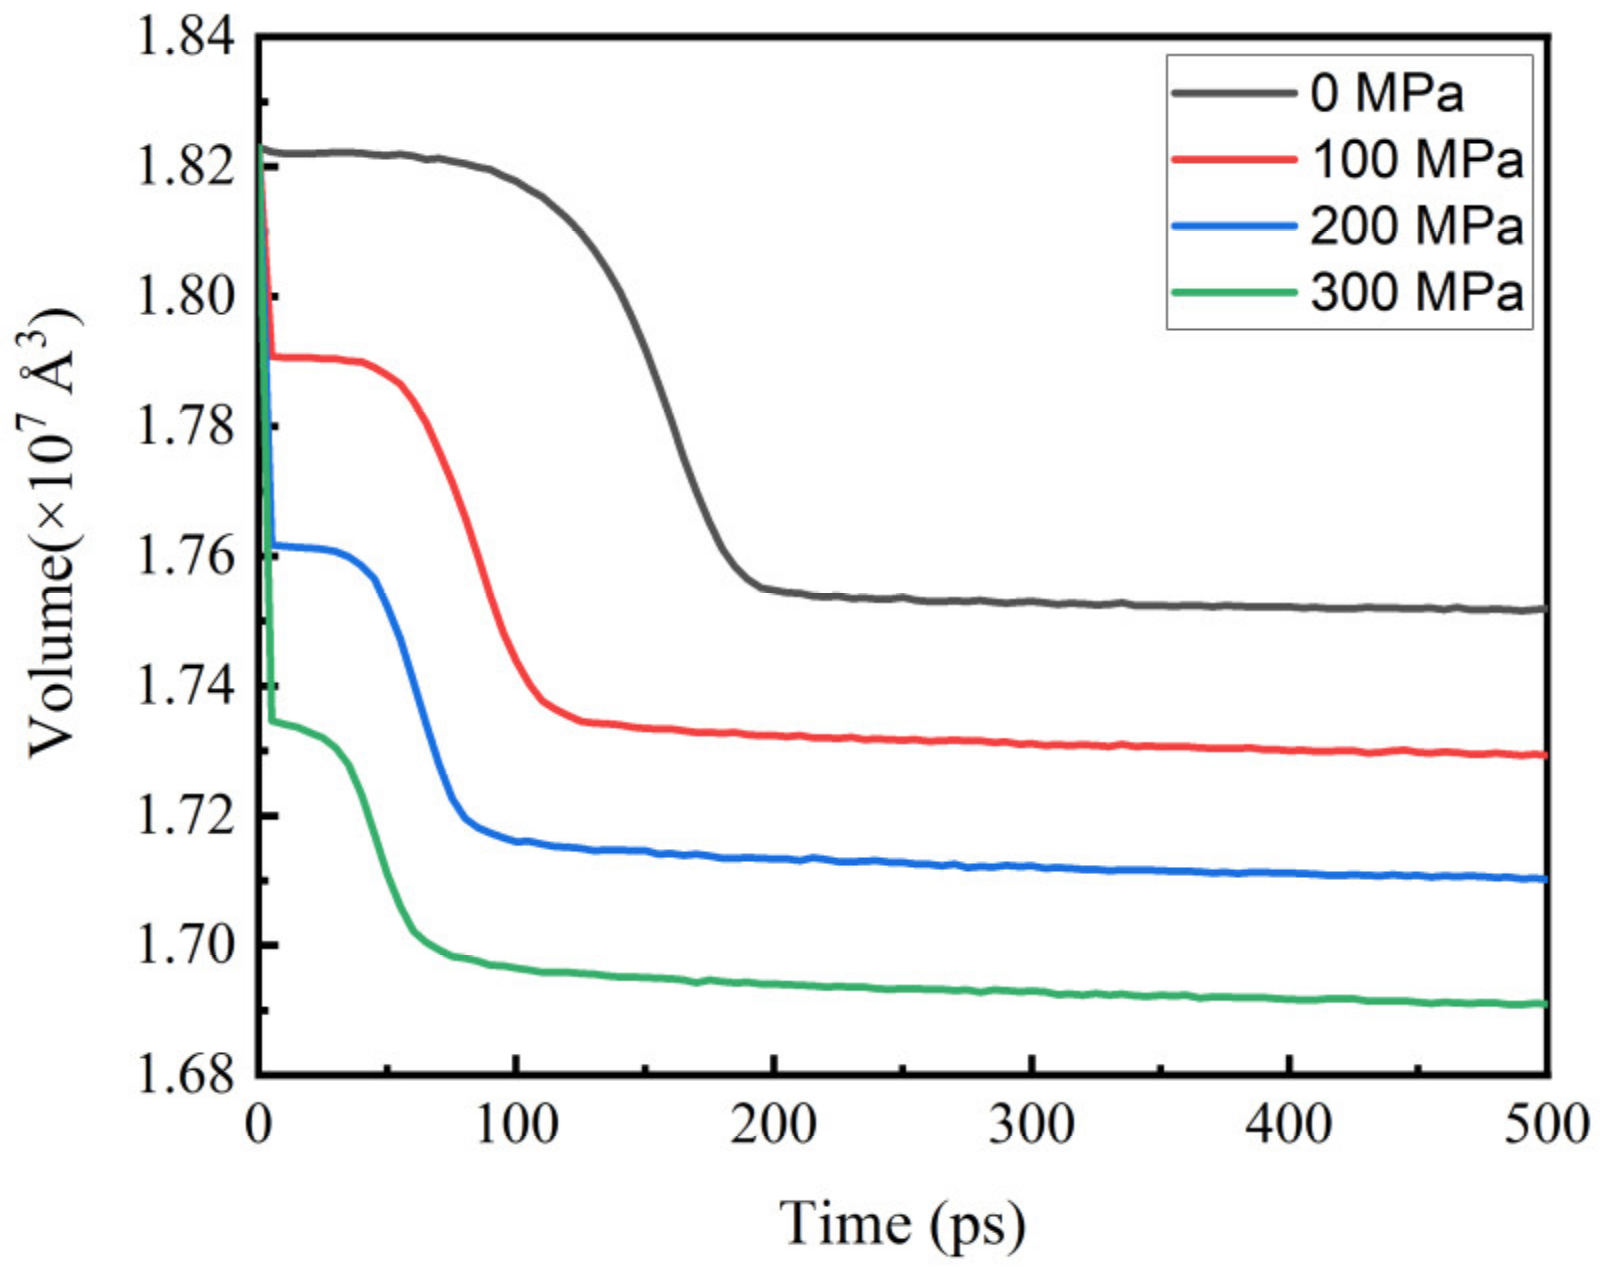
3.1. Structure Evolution under Different Pressures during Isothermal Solidification Process

Nucleation occurs in Al melts in the isothermal process. As nucleation is a random event, we counted the histograms of nucleation-incubation time under different pressures, as shown in Figure 2. In the case of 0 MPa, nucleation-incubation times are between 11 and 220 ps, which is mainly concentrated in 30 to 50 ps; in the case of 100 MPa, nucleation-incubation times are between 9 and 42 ps, which is mainly concentrated in 12 to 18 ps; in the case of 200 MPa, nucleation-incubation times are between 6 and 13 ps, which is mainly concentrated in 8 to 11 ps; in the case of 300 MPa, nucleation incubation times are between 5 and 10 ps, which is mainly concentrated in 7 to 9 ps. It can be found that the nucleation-incubation time becomes shorter with the increase of pressure during the solidification process.
We selected one simulation run under each pressure condition as visual observation, as shown in Figure 3. In general, more than 99% atoms are defined as the “other” (i.e., liquid) structure before nucleation starts. It agrees well with the results both from experimental [20] and computational [21] approaches that icosahedral ordering is a dominant component for structures of most undercooled melts.
As shown in Figure 3, in the case of 0 MPa, one nucleus is nucleated and grows into circular grain in the melt at 30 ps and continues to grow as time goes by. At 100 ps, the second nucleus appears. Over time, the two nuclei grow and come into contact with each other. It can be seen that the FCC atoms serve as the matrix, and the HCP atoms exist in the forms of grain boundaries, twin boundaries, and stacking faults inside the FCC atoms. Between 200 and 500 ps, the grains coarsen and part of the “other” atoms and HCP atoms transform into FCC atoms, as shown in Figure 4. In the case of 100 MPa, one nucleus is nucleated and grows into a circular grain in the melt at 10 ps. At 30 ps, there are four larger nuclei. These nuclei grow and are accompanied by the formation of new nuclei as time goes by. At 100 ps, nuclei grow and come into contact with each other, occupying almost the entire simulation cell. Between 200 and 500 ps, no new crystal nucleus forms, only the grains engulf each other and coarsen. According to Figure 4, it can be also seen that the “other” atoms and HCP atoms are gradually replaced by FCC atoms, and the proportion of HCP atoms becomes smaller. In the case of 200 MPa, there are many small nuclei in the simulation cell at 10 ps. At 30 ps, these small nuclei become bigger and come into contact with each other at 50 ps. Solid atoms occupy almost the entire simulation cell at 75 ps. Between 100 and 500 ps, some of the “other” atoms and HCP atoms are replaced by FCC atoms, as shown in Figure 4. In the case of 300 MPa, several small nuclei appear in the simulation cell at 5 ps. At 30 ps, there are already many nuclei in the simulation cell. At 75 ps, solid-state atoms basically occupy the simulation cell. Between 75 and 500 ps, number of FCC atoms increase, while numbers of the “other” atoms and HCP atoms decrease, as shown in Figure 4.
By comparing, as the pressure increases, the nucleation-incubation time becomes short, and the number of nuclei increases and becomes small. With the increase of pressure, the number of HCP atoms in the system increases by observing the structures of 500 ps (Figure 3). After the solid-liquid transition is completed, the solidification process does not end, as shown in the microstructure evolution in the blue-circle regions in Figure 4. As the isothermal process proceeds, the “other” and HCP atoms are gradually replaced by FCC atoms; some grains become large, and the concave and sharp boundaries of the grains gradually become smooth, which are typical characteristics of the grain coarsening. Large grains engulf small grains and the concave surfaces become smooth, which is consistent with the theory that grain-boundary energy decreases during grain coarsening [6].
Figure 5 shows the time dependence of fractions of atoms with FCC, HCP and the “other” structures during the isothermal-solidification process under different pressures. It can be found that curves in the figure can roughly divided into three stages, namely the relaxation stage, the bulk-nucleation stage, and the grain-coarsening stage. From Figure 5a, the curve for the FCC atoms is “S”-shaped. As the pressure increases, the time for FCC atoms to emerge decreases, and the fraction of FCC atoms decreases at 500 ps. In Table 1, it can be found that with the increase of pressure, the time for the nuclei to appear becomes short, which explains why the FCC curve enters the second stage faster with pressure increasing. Figure 5b shows the time dependence of fractions of HCP atoms in the isothermal-solidification process. Different from Figure 5a, for HCP atoms, the fraction first increases and then decreases. As the pressure increases, the time for the HCP curve to reach the peak fraction shortens, the peak becomes higher, and the fraction of HCP atoms at 500 ps also increases. These show that increasing the pressure will promote the generation of HCP atoms. In Figure 5, the fraction of HCP atoms decreases because some HCP atoms convert into FCC atoms in the late stage of solidification. As the isothermal time increases, the grain boundaries and twin boundaries are continuously ablated, resulting in a slow decrease in the number of HCP atoms. The number of HCP atoms is positively related to the pressure, which means that more grain boundaries, twins, and stacking faults exist. The curve of the “other” atoms also contains three stages, which are in the “S” shape; contrary to the trend of curve for FCC atoms, the fraction of the “other” atoms decreases with the increase of pressure.

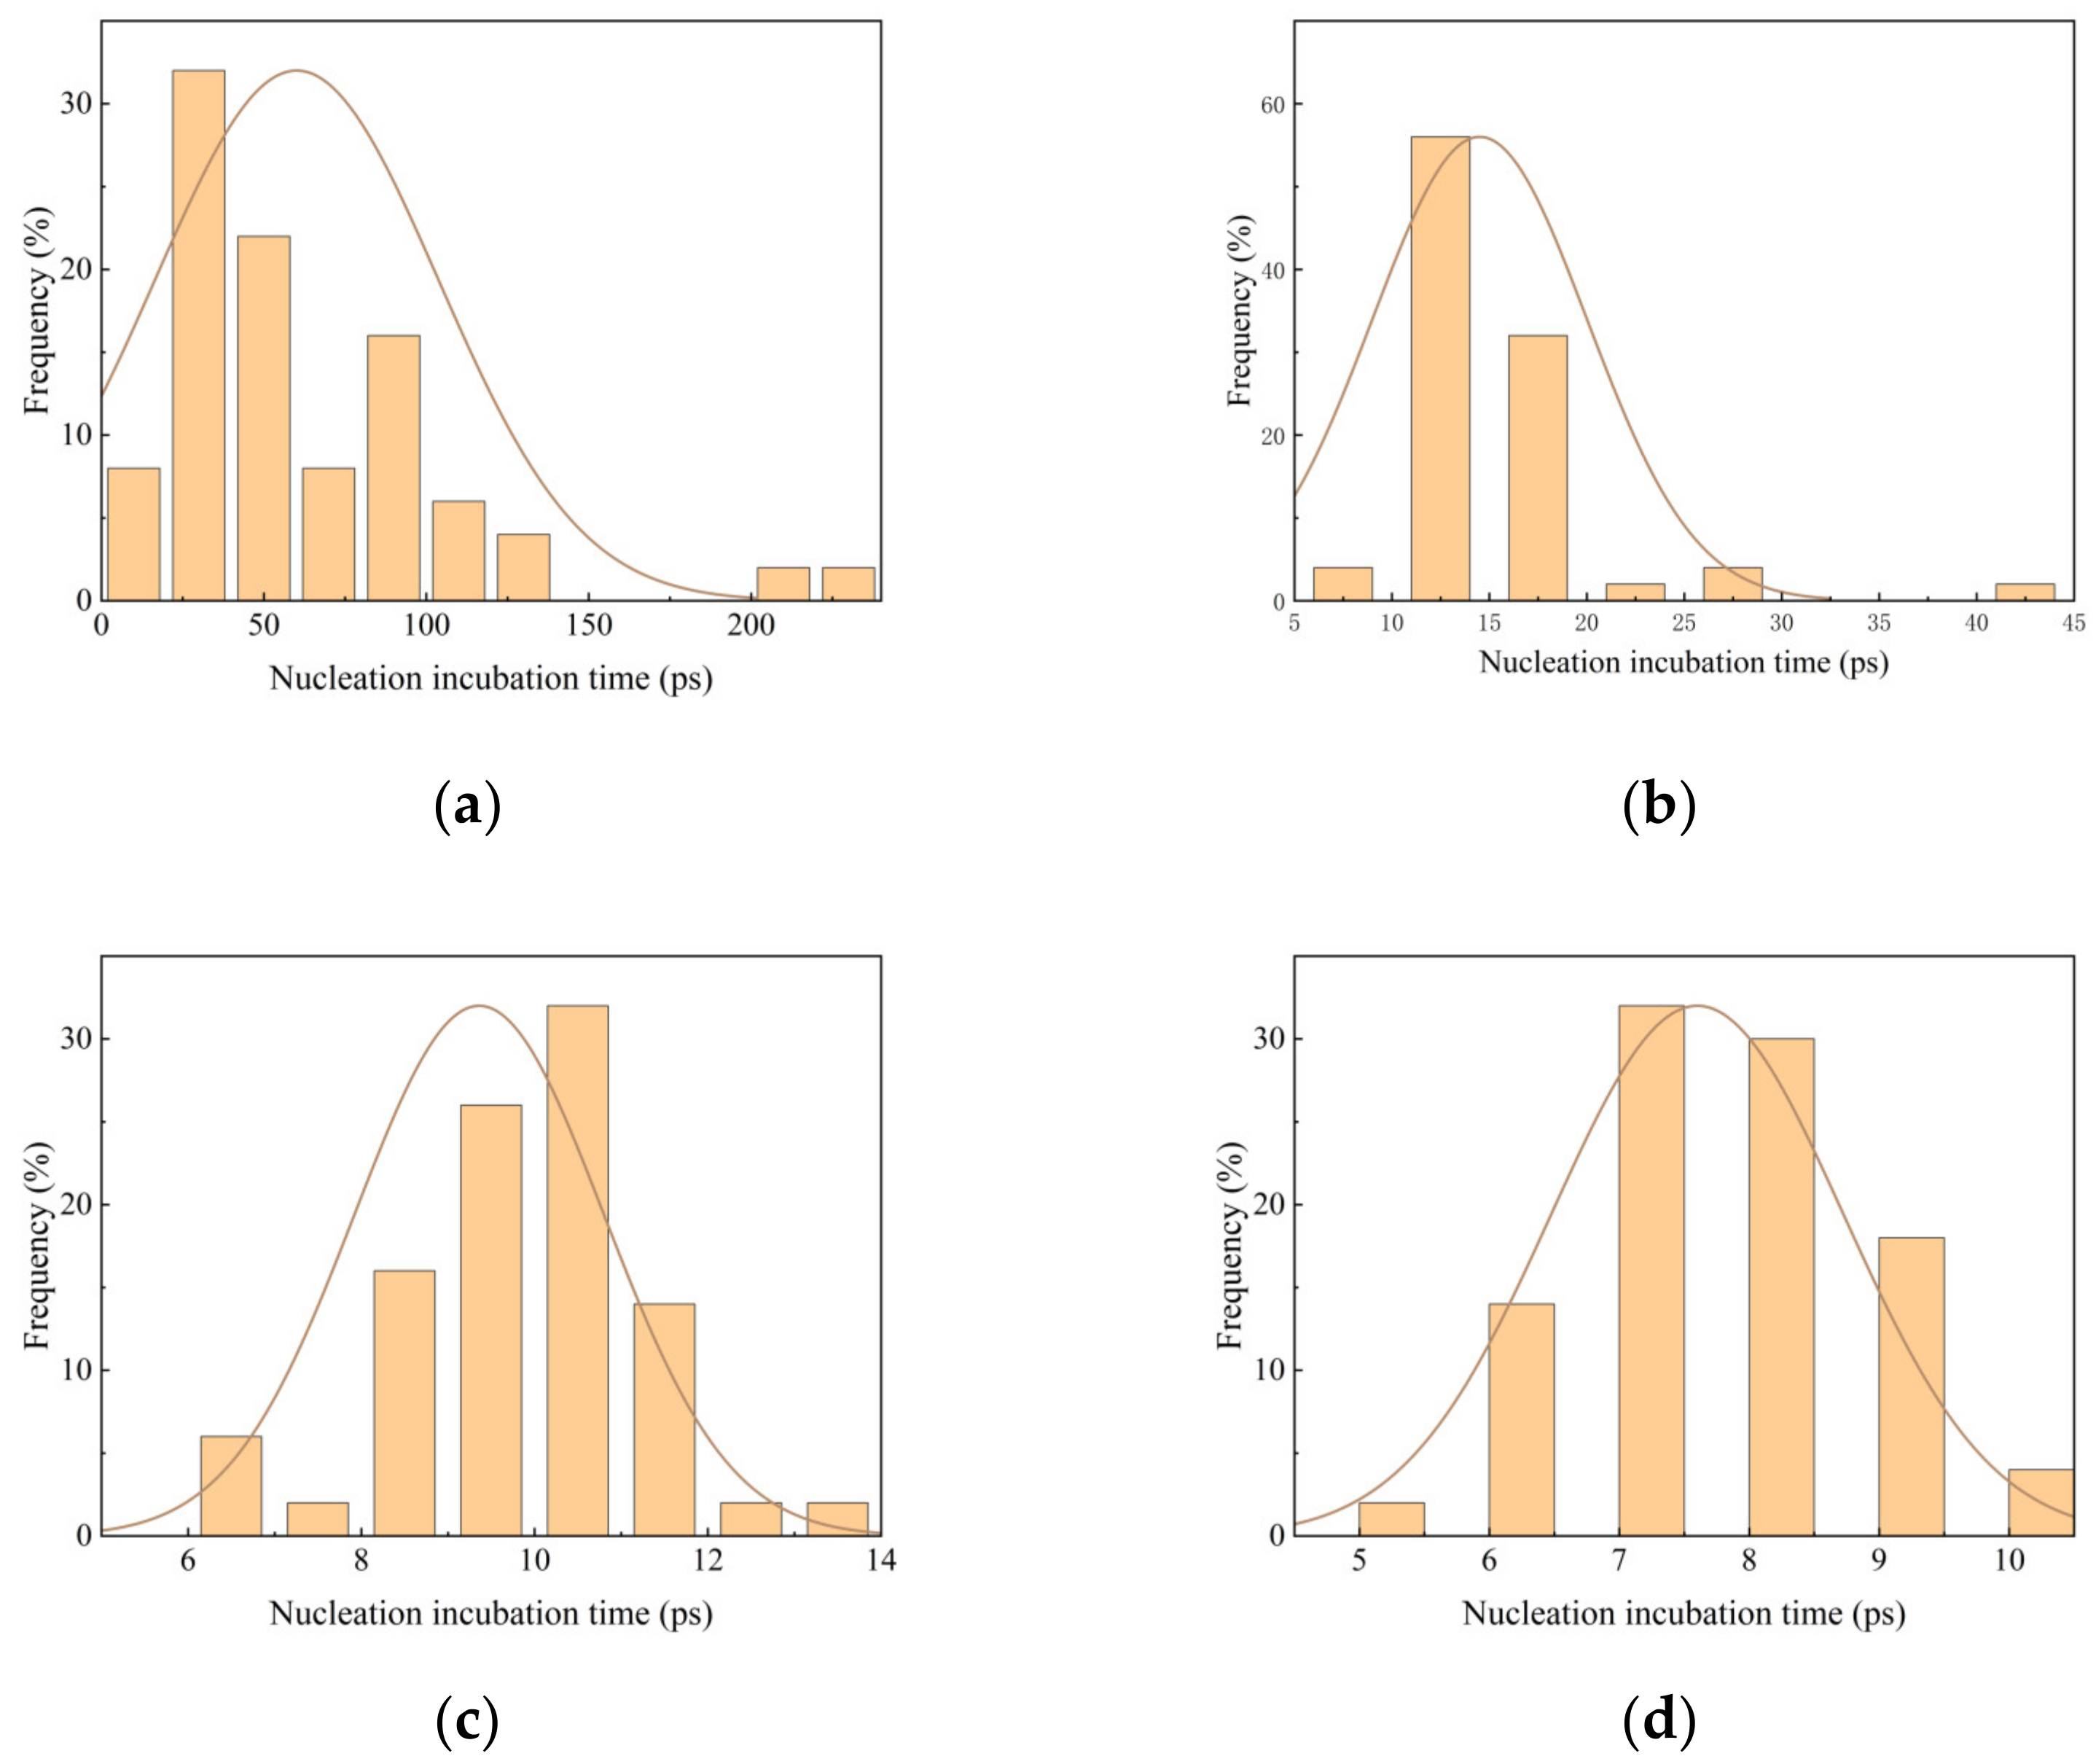
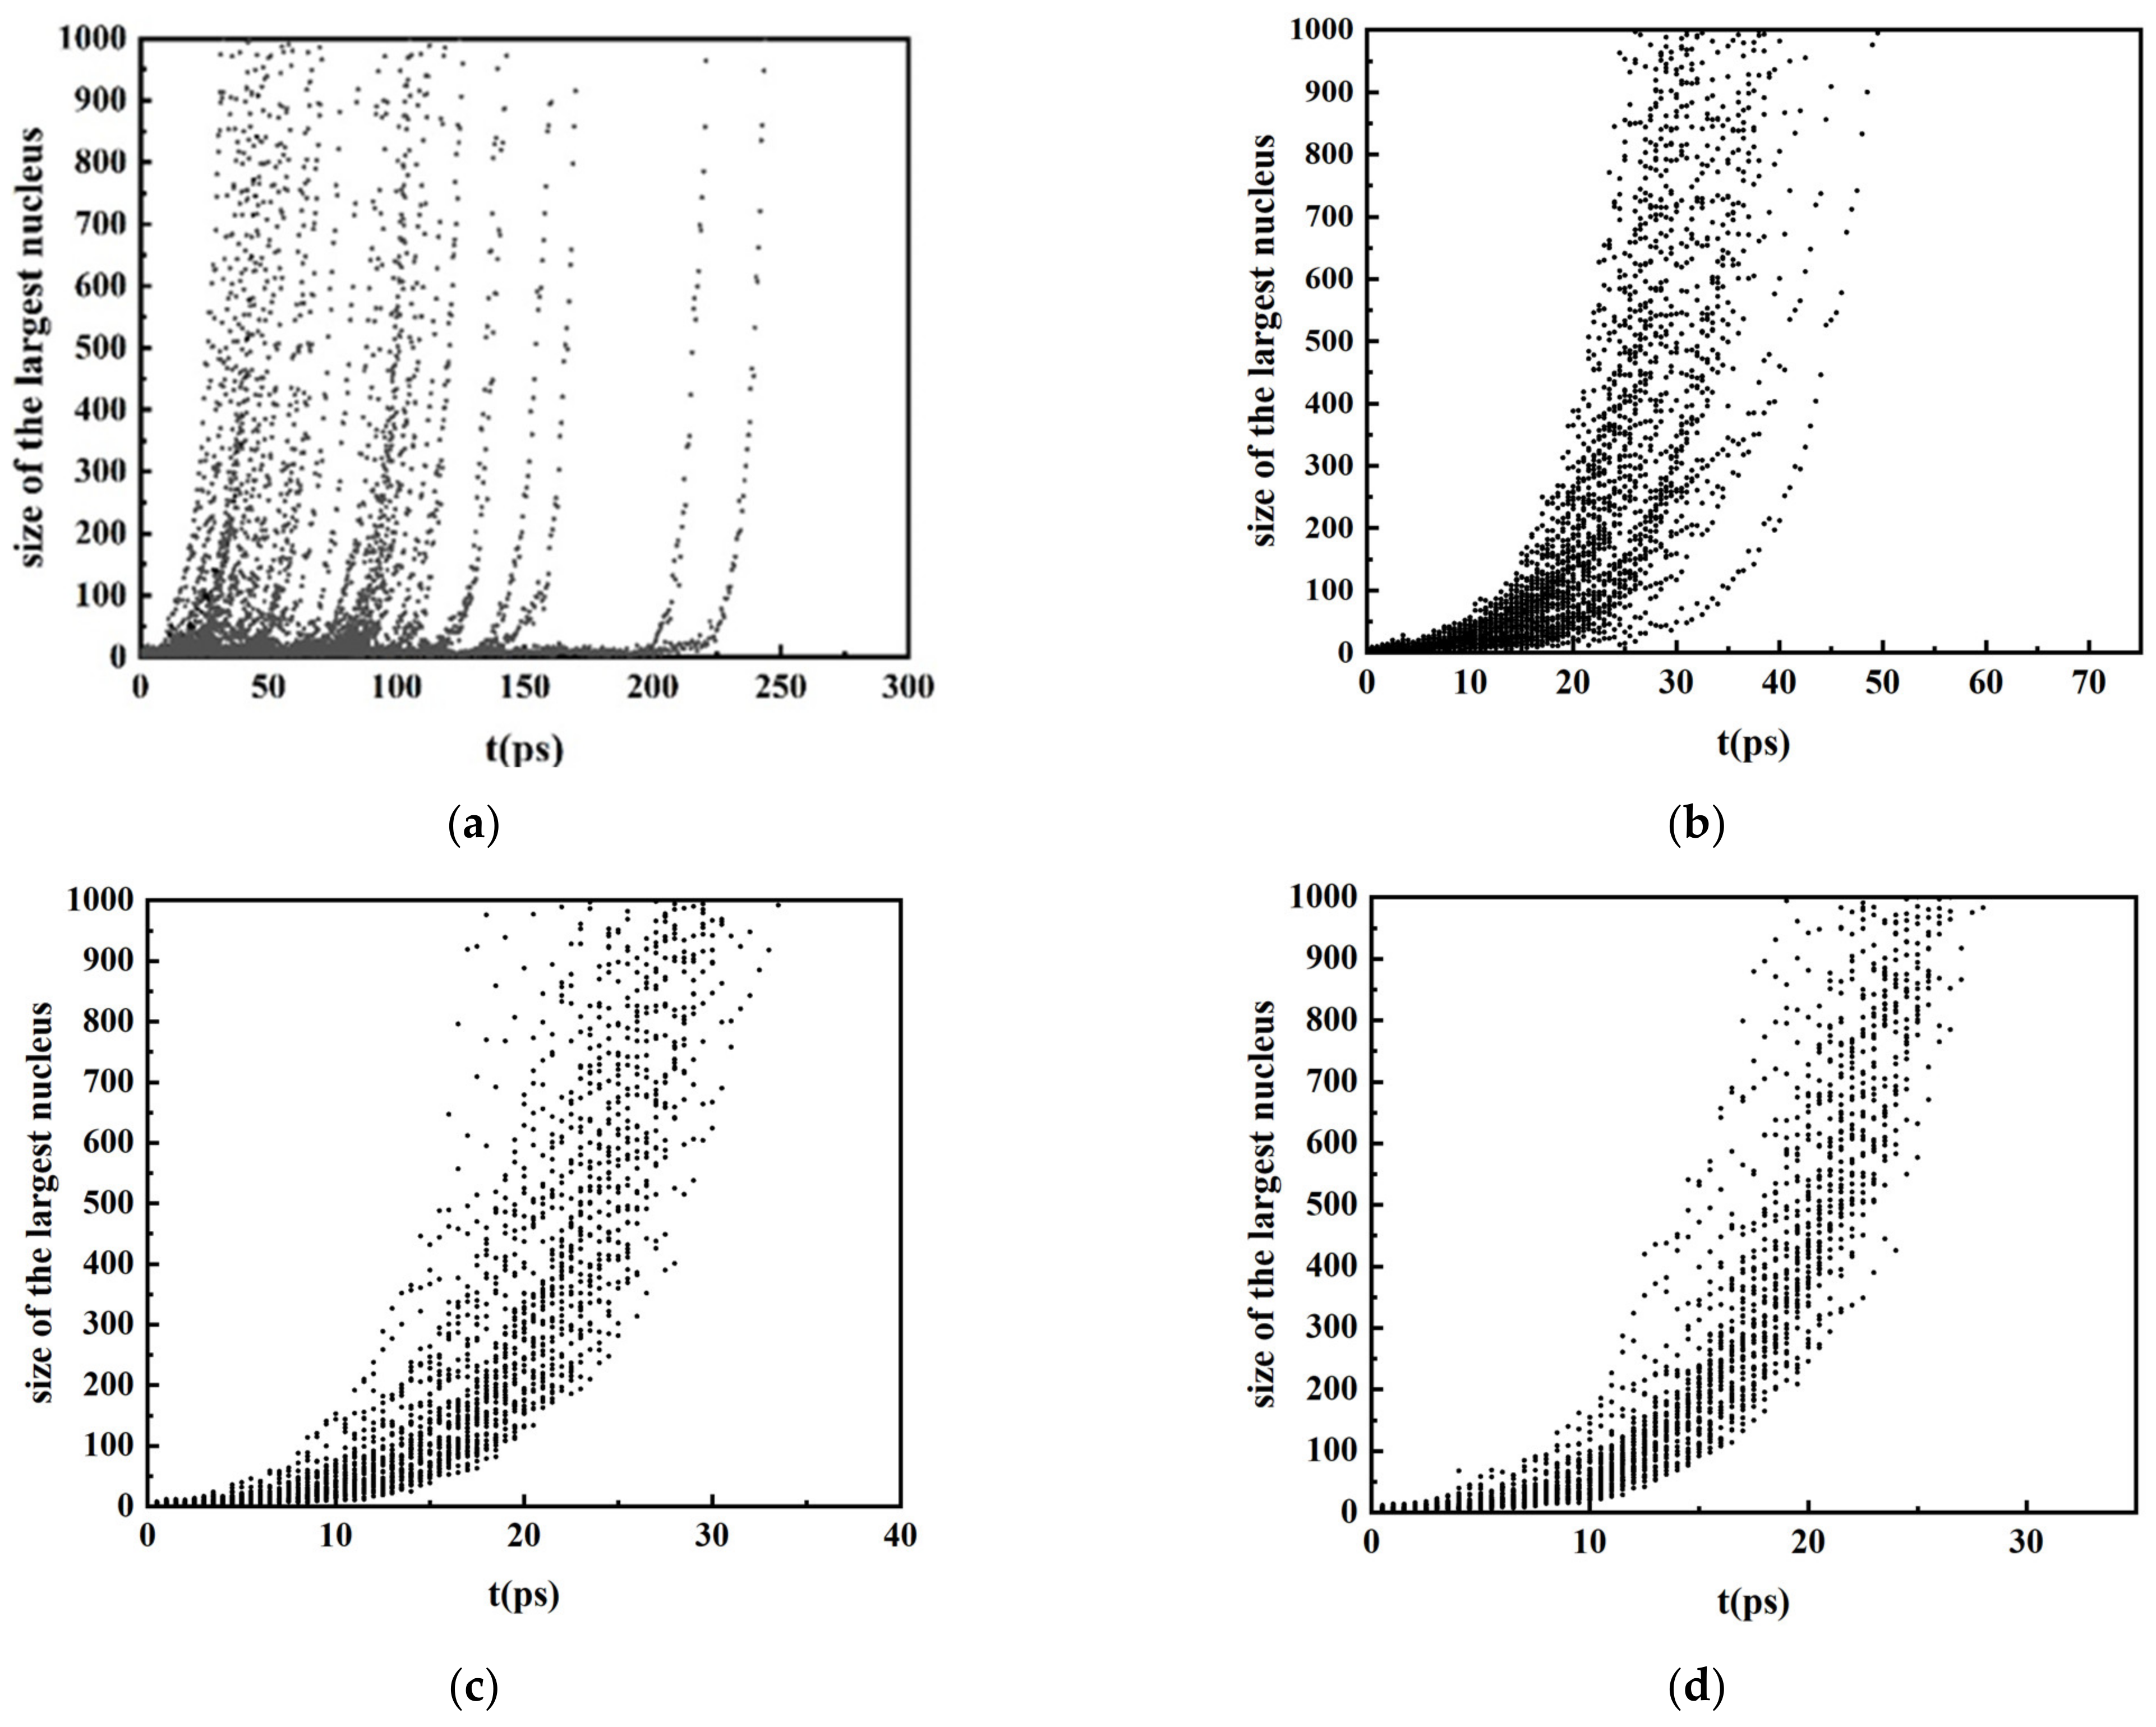
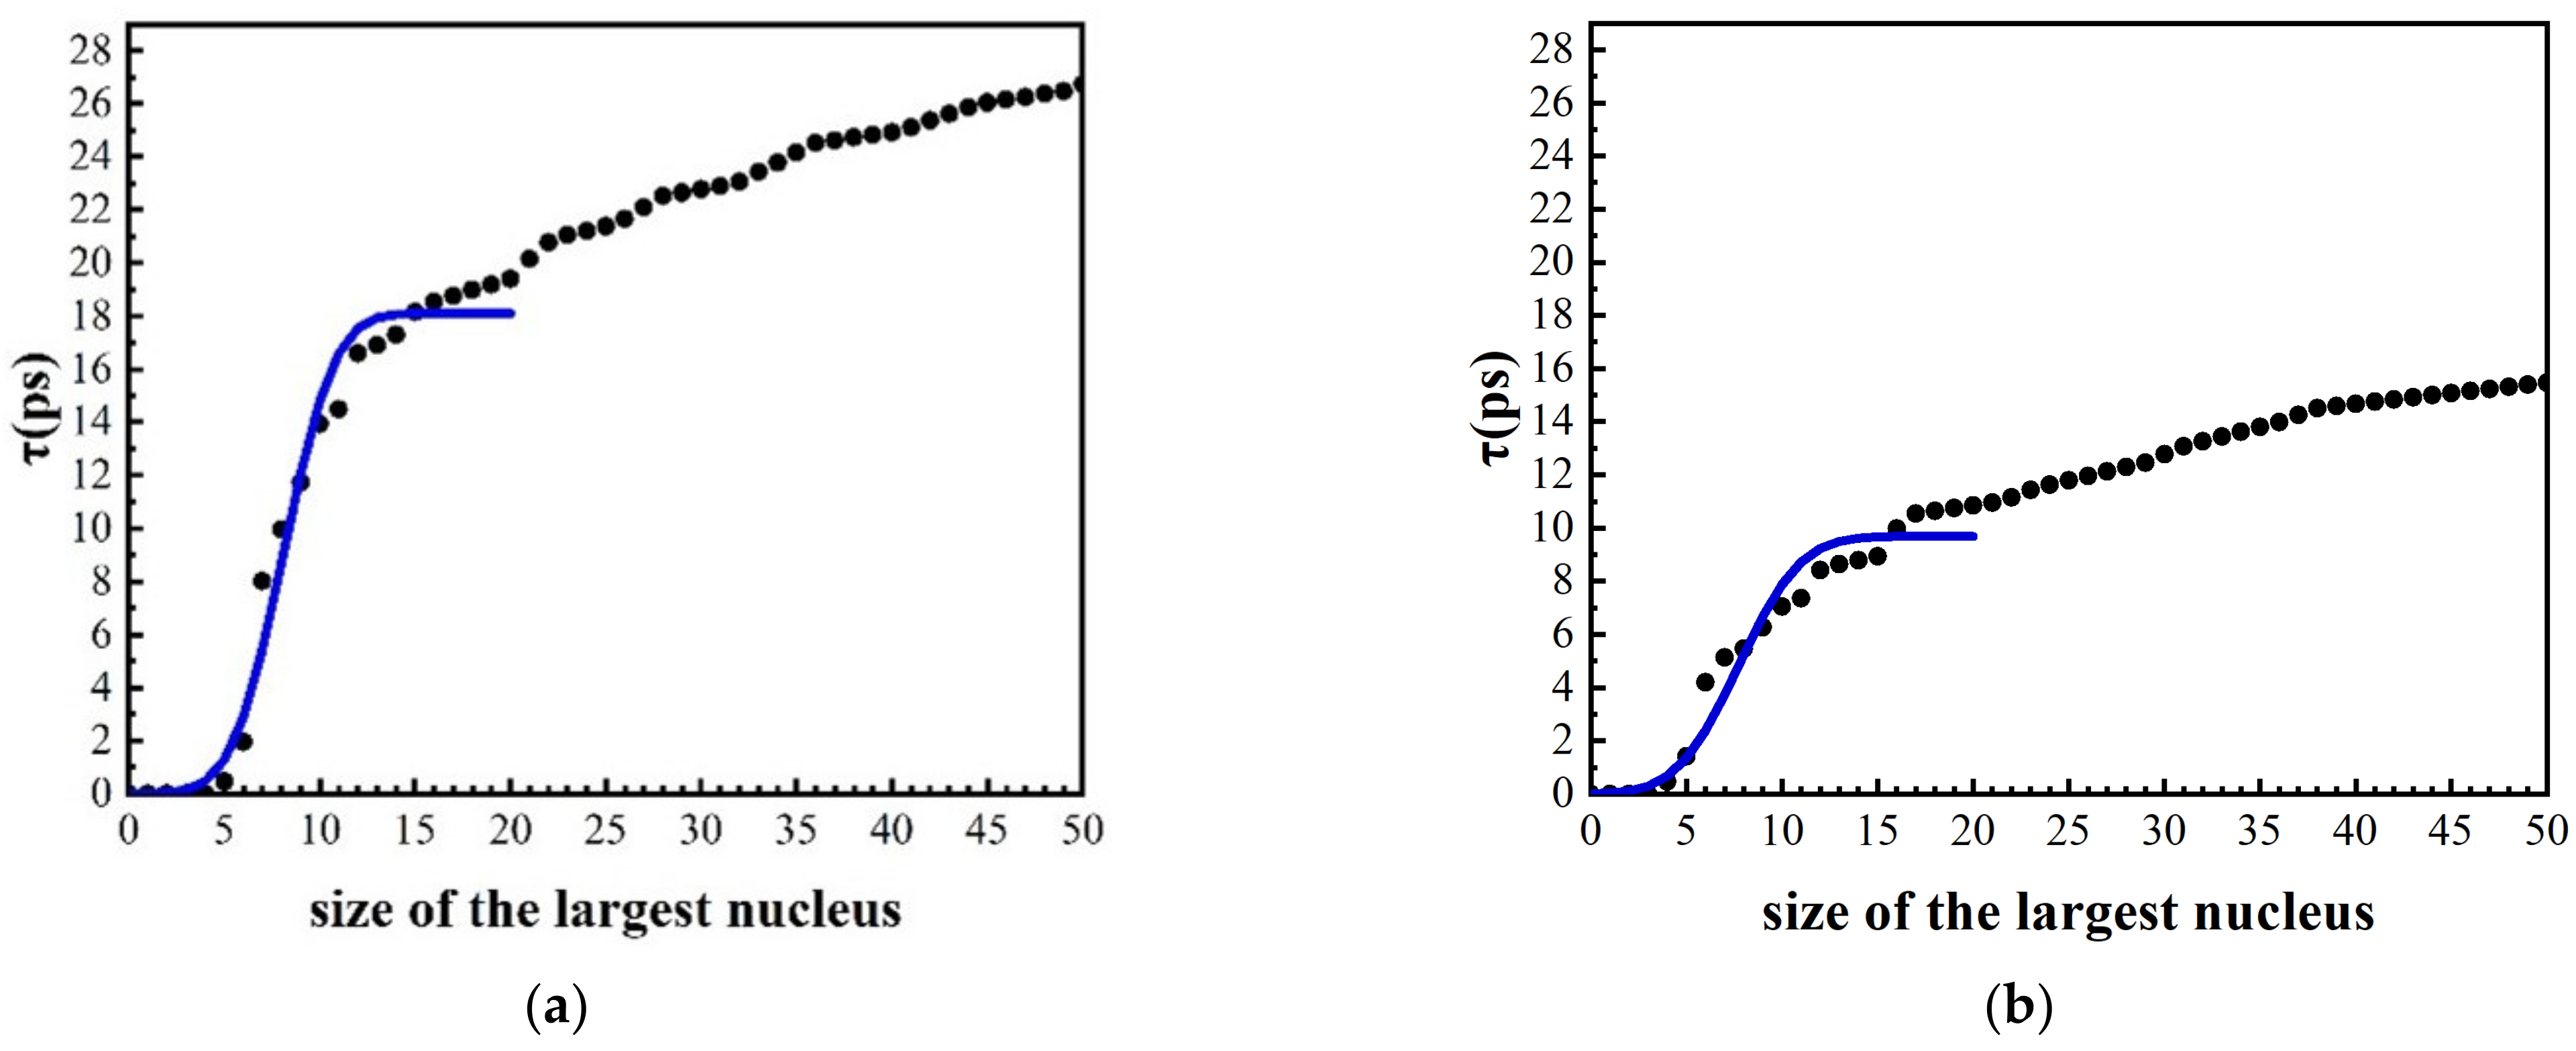
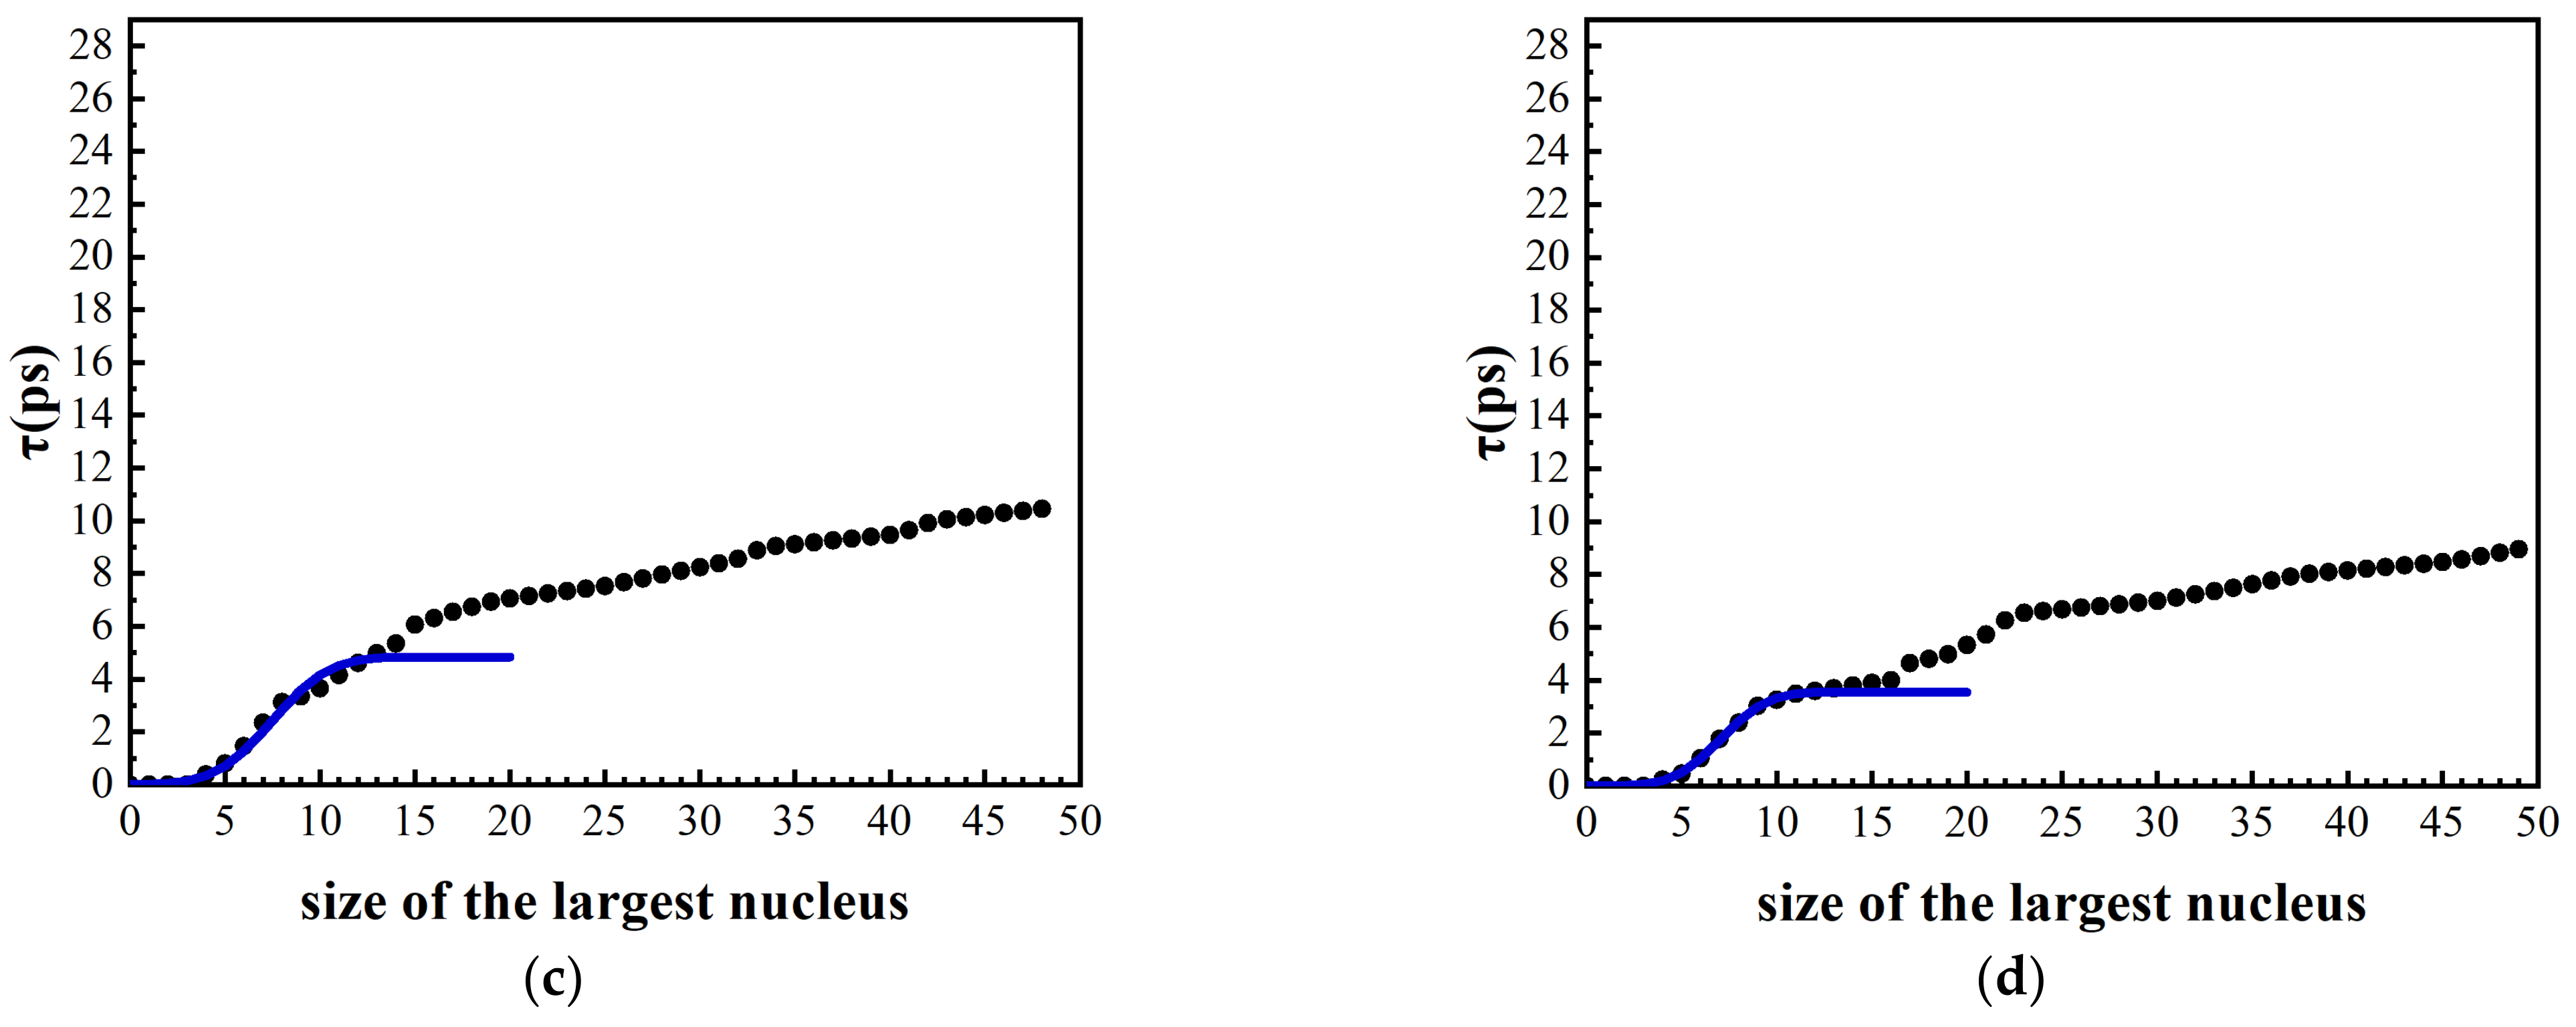
3.2. Effects of Different Pressures on the Nucleation Rate and Critical Nucleus Size

Figure 6 shows the volume of atoms-vs.-time curves under different pressures. It can be found that initially there is a sudden change in volume due to the applied pressure. Over time, the volume remains stable, then decreases rapidly, which indicates that nucleation starts. It can be found that the magnitude of the pressure has an impact on the inflection point of the volume curve. As the pressure increases, the volume transition accelerates, indicating that the formation of nuclei accelerates. Finally, the volume stabilizes.
The MFPT method was relatively well established for extracting nucleation information in different physical processes [22,23,24,25,26]. For crystallization processes, the steady state nucleation or barrier-crossing rate J , the critical-nucleus size n * , and the Zeldovich factor Z can be obtained from
τ n m a x = τ J 2 1 + e r f n m a x n * c
Here, τ J is related to the steady-state transition rate as τ J = 1 / V J , where V is the system volume under consideration; n m a x is the size of the largest nucleus; c denotes the local curvature at the top of the barrier, and Z = c / π . τ n m a x can be obtained statistically from N (here, N = 50) independent runs.
In the MFPT method, only the number of atoms in the largest cluster in a certain time and the average time of its appearance need to be counted. Figure 7 shows the time dependence of the number of atoms contained in the largest cluster during the isothermal process under different pressures, which are the results of 50 independent simulations, respectively.
Figure 8 shows the MFPT curves of the largest cluster during the isothermal-solidification process with different pressures, the X axis is the number of atoms in the largest cluster, and the Y axis is the average time. The black points are the average time for the largest cluster to appear in the 50 simulations, and the blue curve denotes MFPT curve fitted with Equation (2).
Calculated nucleation parameters are listed in Table 1. It can be found that, with the increase of pressure, the nucleation rate gradually increases, which is consistent with that obtained by Gutzow et al. [27]. The order of magnitude of the nucleation rate is about 1033–1034 m−3s−1. In the study of Mahata et al. [14], the nucleation rate of Al at 600 K is 3.51 × 1035 m−3s−1, which is two orders of magnitude larger than ours. The reason for the difference in nucleation rate may be that the different calculation methods and potential used. In addition, Eisenstein et al. [28] calculated the nucleation rate of Cu by the MFPT method. The nucleation rate is about 4 × 1032 m−3s−1, which is close to our results. It can be also found that, the nucleation rate increases as the pressure increases. However, the change of the critical-nucleus size is not obvious as the pressure increases, which is between 0.32 and 0.31 nm. The reason may be that the pressure gradient was too small. The nucleation rate is sensitive to pressure change, but the critical-nucleation radius is not. Celik et al. [10] shows that for Pt50–Rh50 alloy when pressure increases from 0 GPa to 6 GPa, the critical- nucleation size changes from 0.221 nm to 0.207 nm, which is at the same order as that for Al in this work.

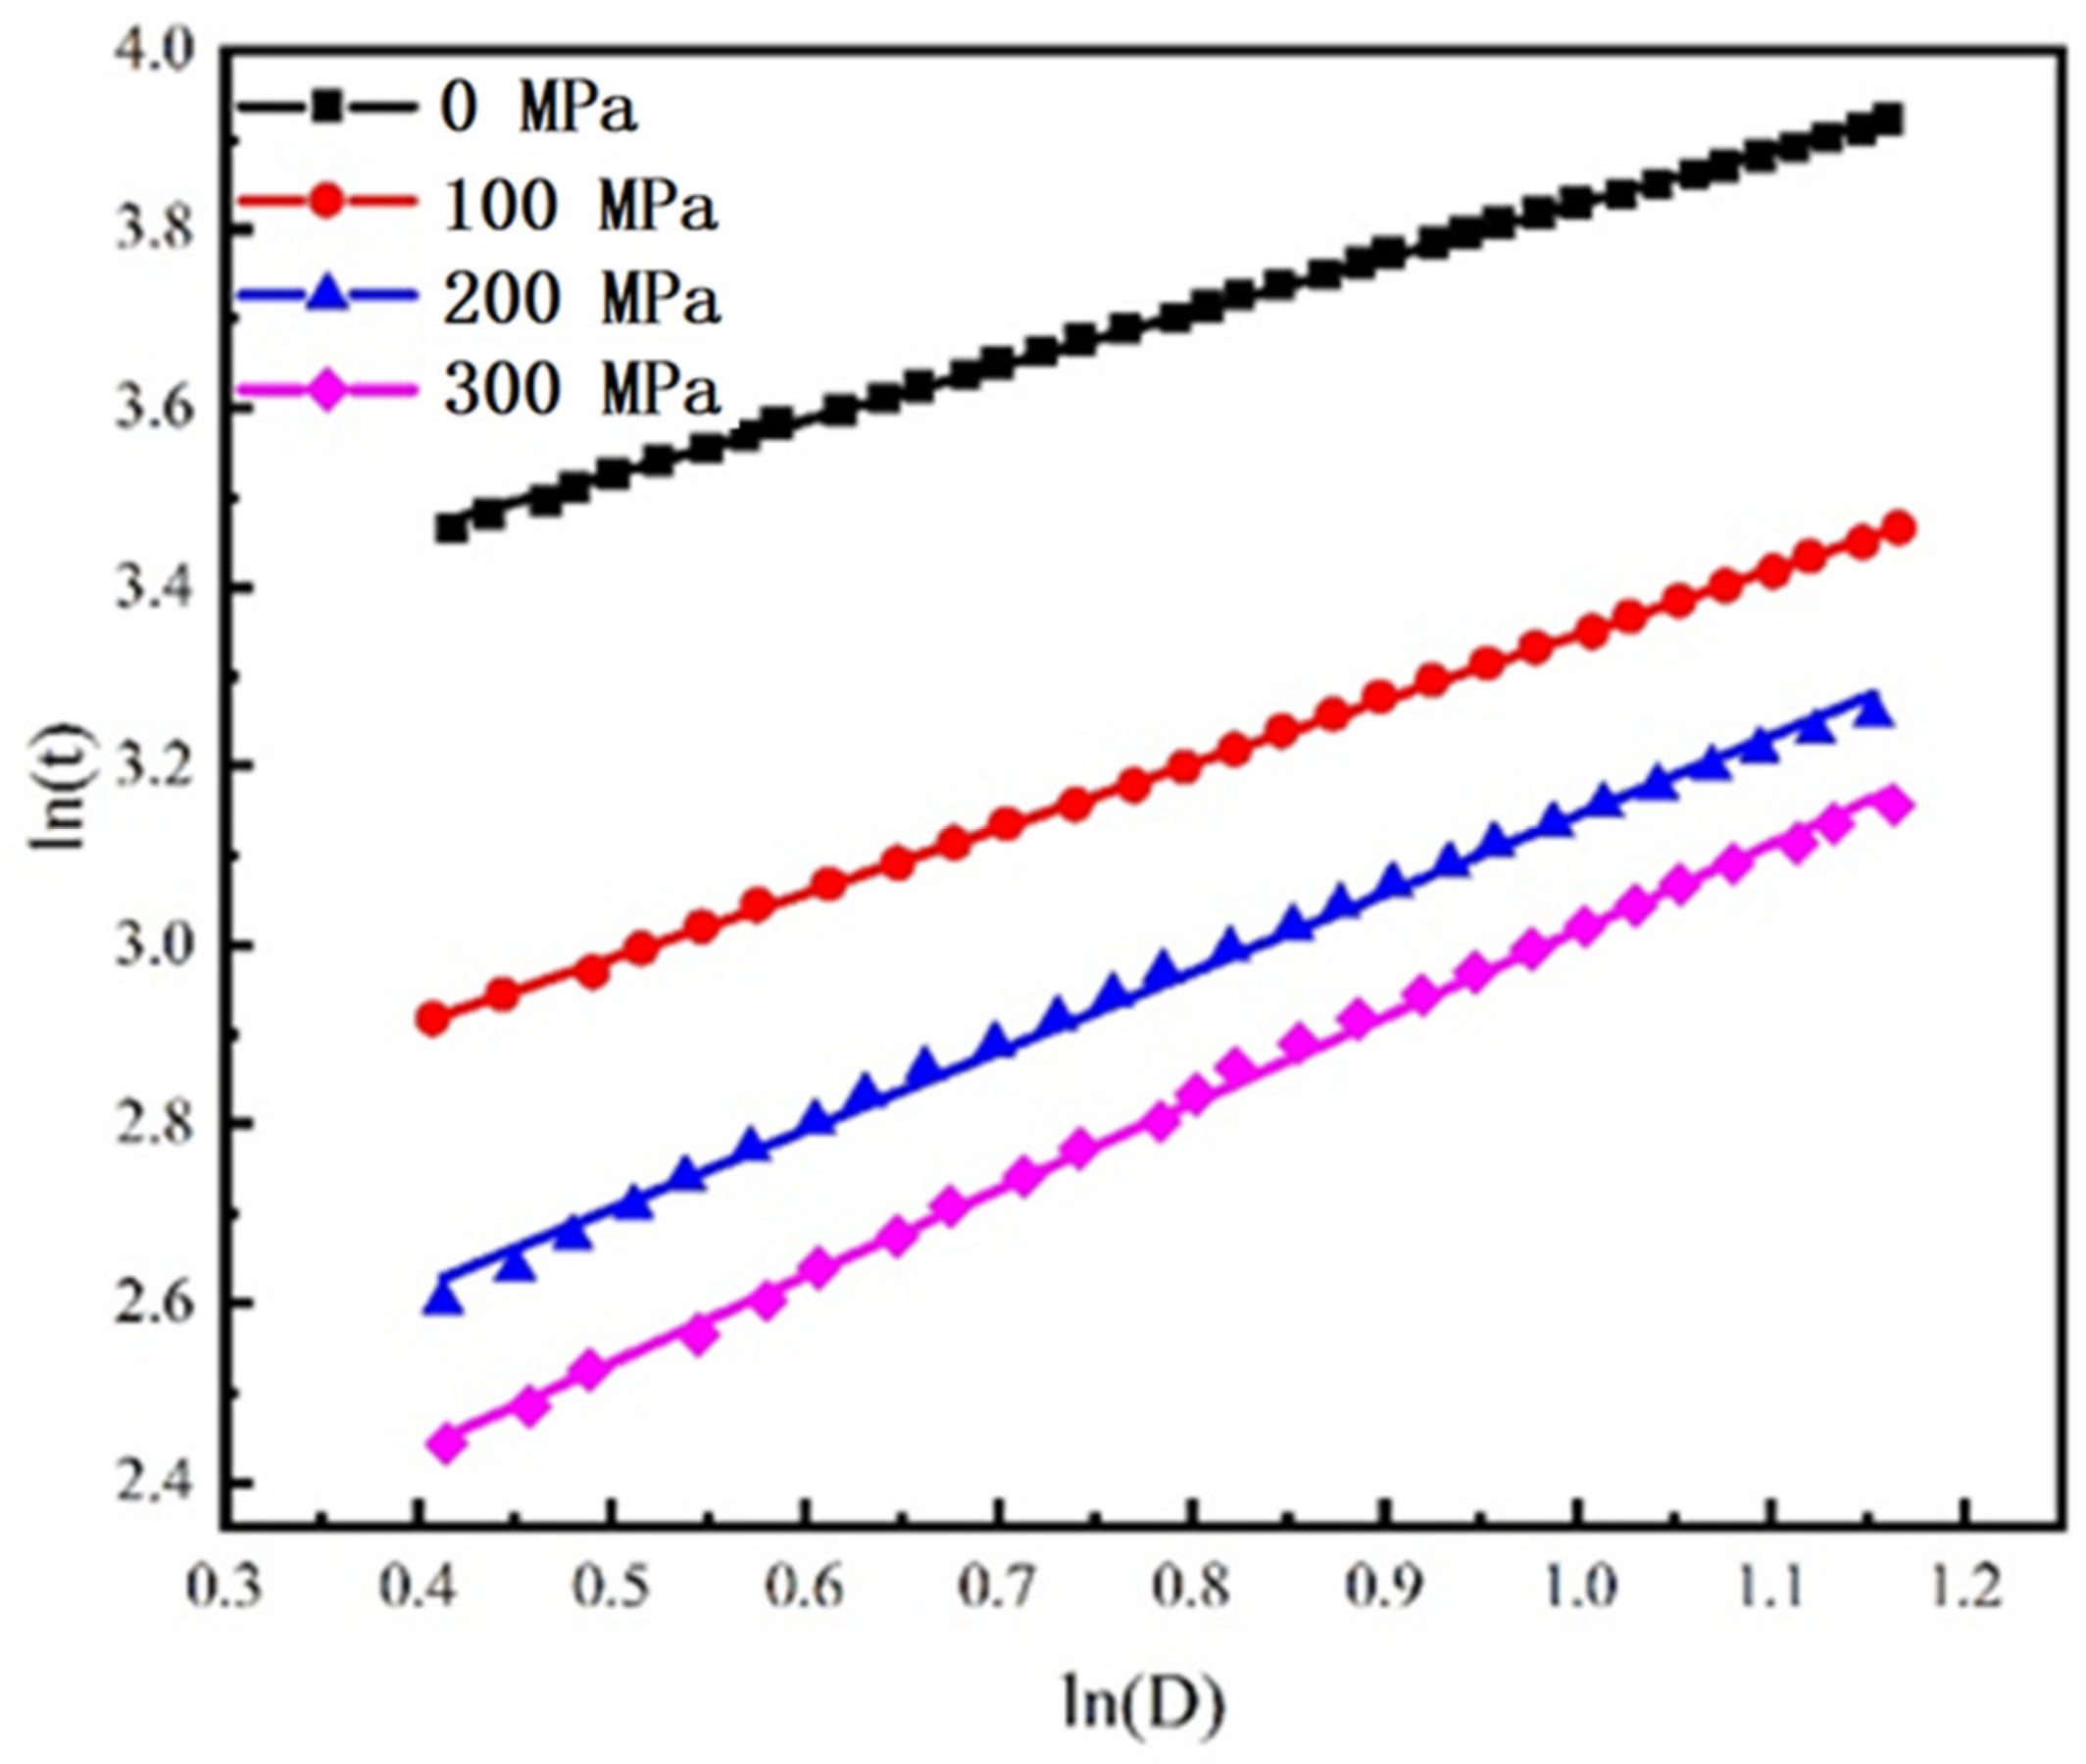
3.3. Effects of Pressure on Grain Growth Rate during Isothermal Solidification Process

When the cluster reaches the critical-nucleation radius, it starts to grow continuously. The grain-growth kinetics can be described as [29,30,31].
D 1 n = k 1 t ,
here, D is the grain diameter at time t ; k 1 is a constant; n is the growth exponent. The crystal growth rate can be obtained by a straight line fitted to a logarithmic curve, where 1 n is the slope and l n k 1 is the intercept. The growth rate of grains is related to the value of n . The larger the n , the faster the grain grows. Taking the logarithm of both sides of Equation (3), we obtain
l n t + l n k 1 = 1 n l n D
In this work, the grain diameter D was obtained by calculating the equivalent radius of the largest cluster in 50 simulations.
Figure 9 shows the l n t vs. l n D curves under different pressures during the isothermal-solidification processes. According to the Equation (4), the grain-growth exponents n are calculated to be 1.65, 1.38, 1.14, and 1.04 during isothermal solidification under pressures of 0 MPa, 100 MPa, 200 MPa, and 300 MPa, respectively. It can be seen that with the increase of pressure, the grain-growth exponent decreases, revealing that the grain growth slows down. On one hand, the increase of pressure will reduce the free energy of the solid-liquid interface [10], which makes the solid-liquid interface move easier and the grains grow faster. On the other hand, the increase in pressure will reduce the volume of the system and increase the viscosity, which will prevent the growth of grains. Therefore, it can be deduced that under the pressure below 300 MPa, the influence of the increase of viscosity on the grain growth is much greater than that of the decrease of the solid-liquid interface energy.

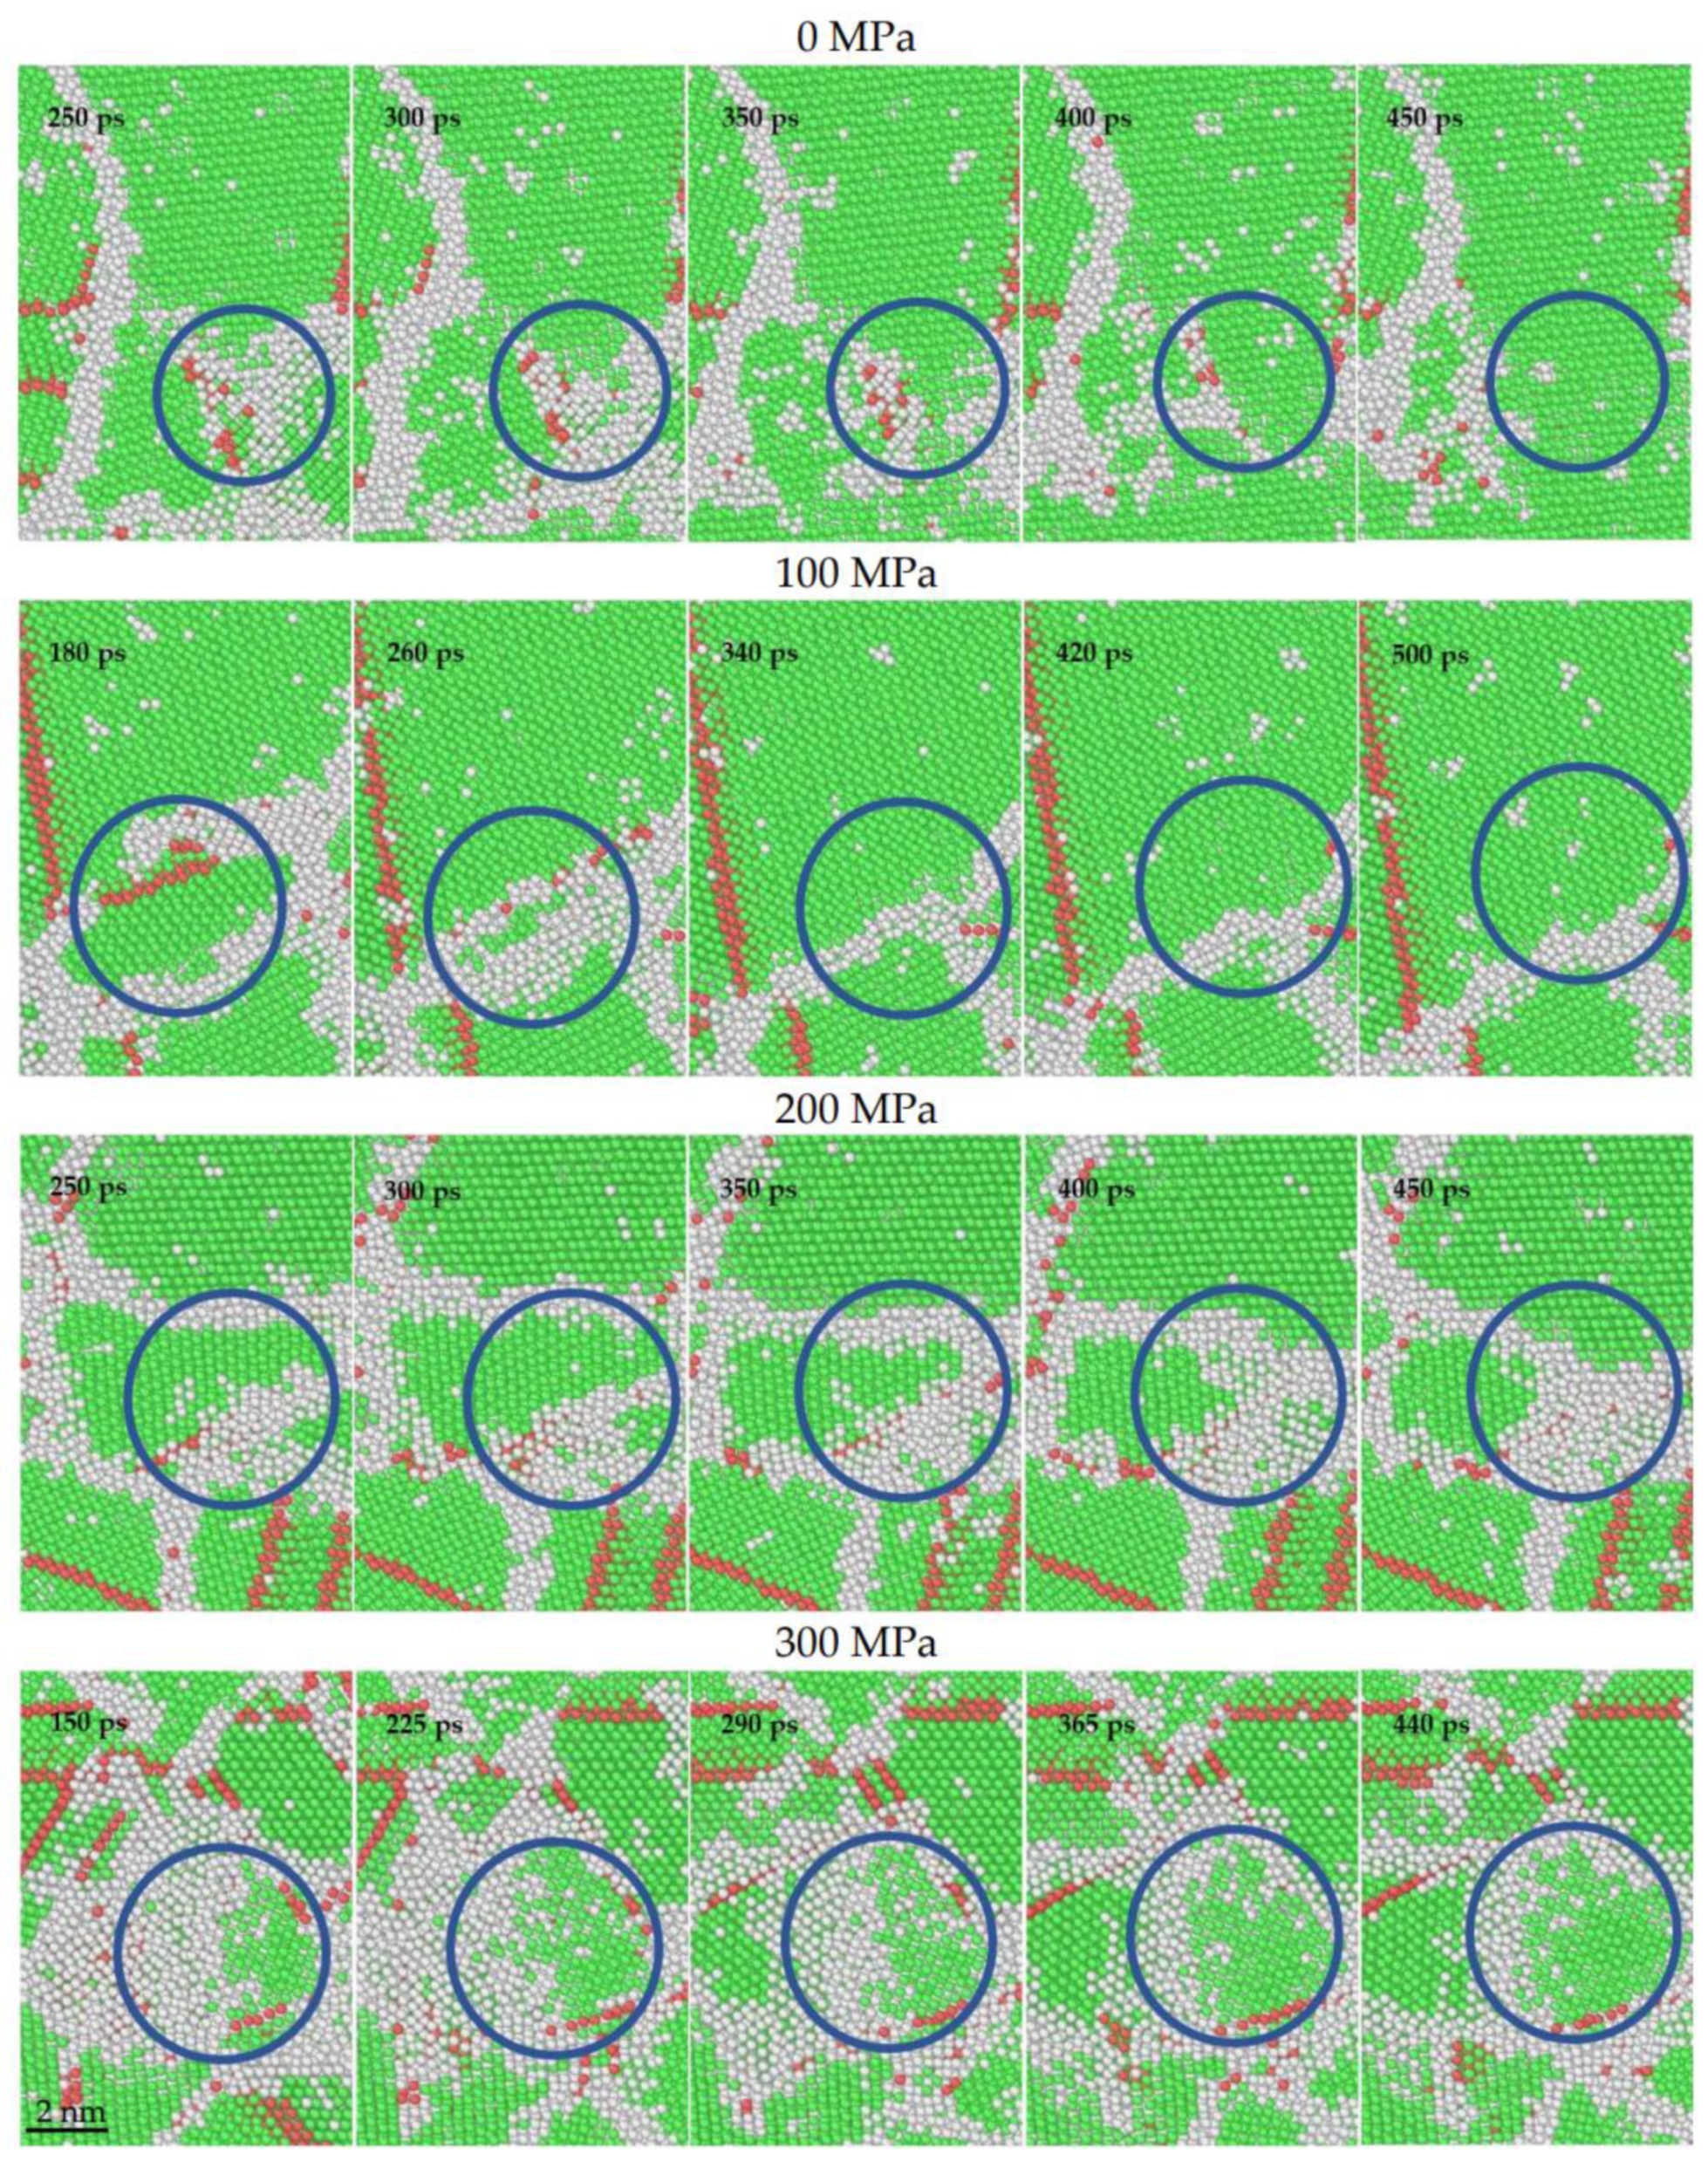
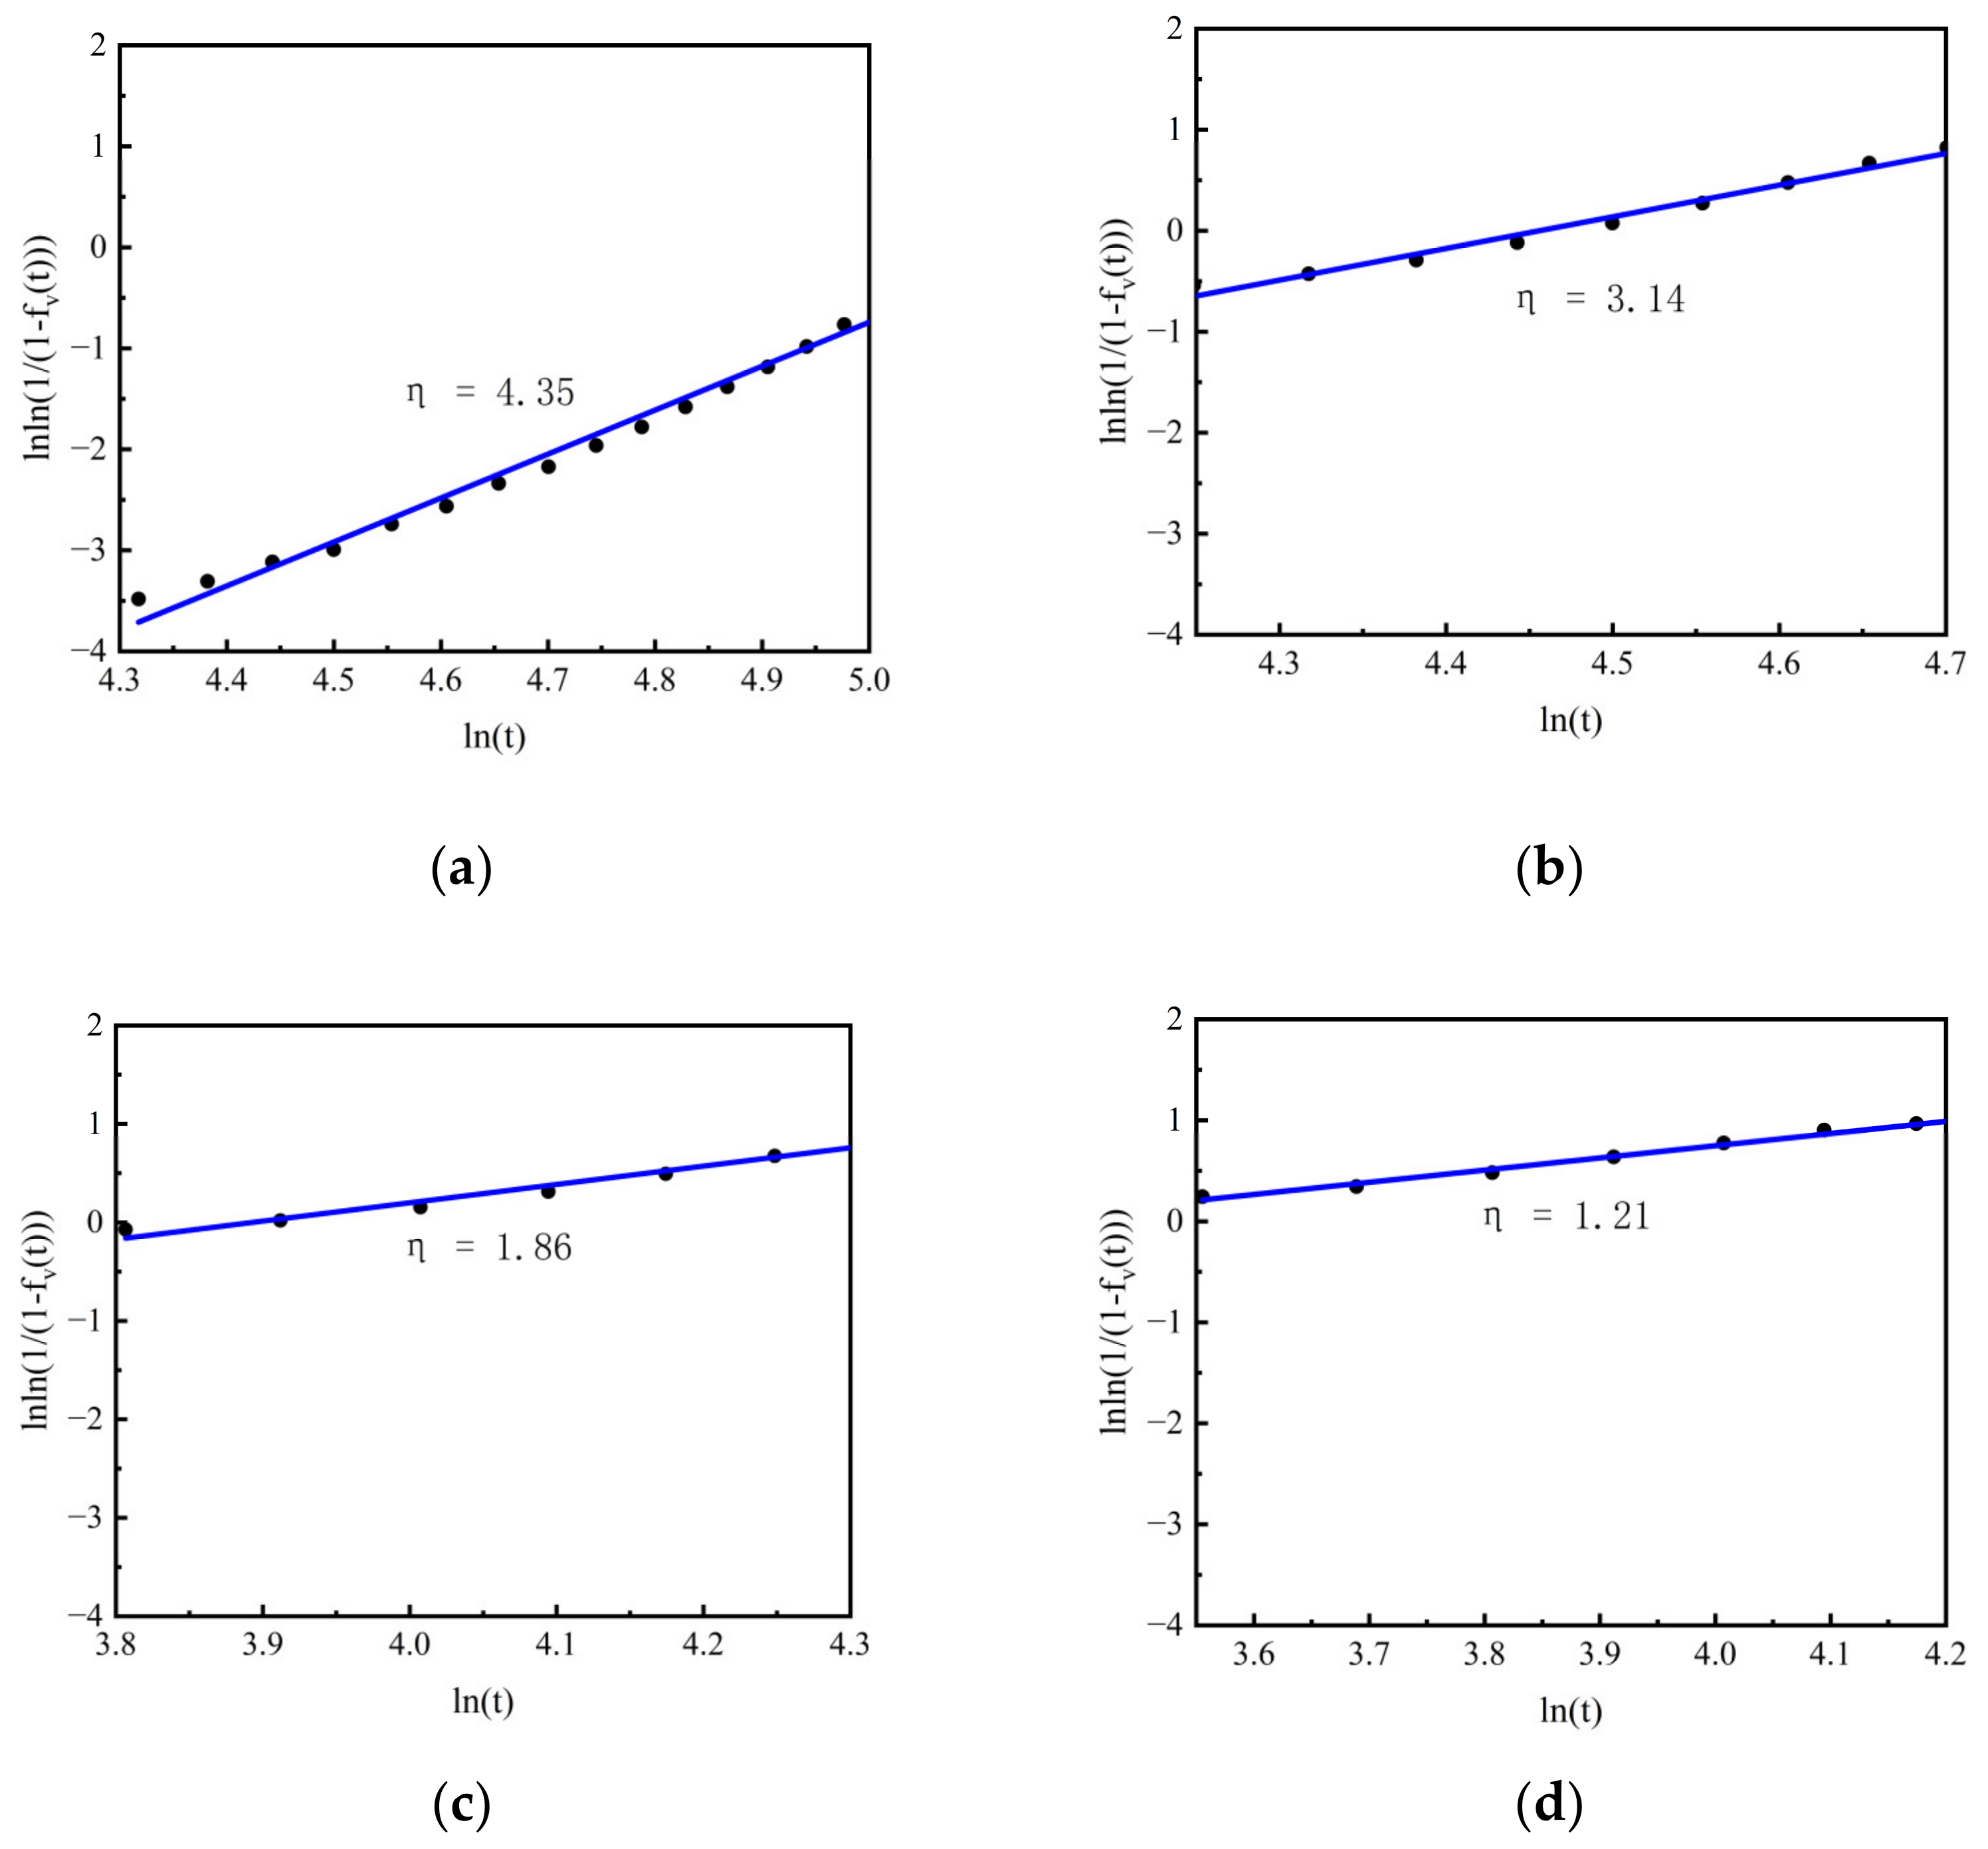
3.4. Effects of Different Pressures on Growth Modes during Isothermal Solidification Process

To study the effects of different pressures on the crystallization kinetics, the JMA method was used to quantify phase-transition kinetics [32,33]. Avrami exponent has been used to discuss nucleation and growth modes during phase transitions, not just in metallurgy [34] but also various matters of physical chemistry [35]. Volume fraction f V t of the daughter phase as a function of time t is described as
f V t = 1 e x p k 2 t η ,
where k 2 is a prefactor and η is the characteristic growth or Avrami exponent. The volume fraction of crystallites within a liquid is computed from the evolution curves of atomic volume during the isothermal-solidification process.
f V t = V l i q u i d V t V l i q u i d V s o l i d ,
where V t is the volume of the system at time t . V l i q u i d and V s o l i d are volumes of the system at the beginning and end of solidification, respectively. Equation (6) can be rewritten as
l n l n 1 / 1 f v t = η l n t + l n k 2 .
Therefore, the Avrami exponent can be estimated from a slope in the Avrami plot of l n l n 1 / 1 f v t vs. l n t .
Figure 10 shows the Avrami plot as the relation of l n l n 1 / 1 f v t vs. l n t , where a linear relation is clearly observed in each case. From the slope, the Avrami exponents are estimated to be 4.35, 3.14, 1.86, and 1.21 during isothermal solidification at 0 MPa, 100 MPa, 200 MPa, and 300 MPa, respectively. It is empirically known that the values of Avrami exponents are between 1 and 4 depending on nucleation and growth modes [34]. Regarding the homogeneous nucleation, it is known that the Avrami exponent has a value of 4 during the three-dimensional growth, 3 during the two-dimensional growth, and 2 during the one-dimensional growth. Since there is often not a single growth mechanism during crystallization process, the Avrami exponent is not necessarily an integer. According to our results, in the case of 0 MPa, the Avrami exponent is 4.35, which means that a complete three-dimensional growth occurs during solidification at 0 MPa. With the pressure increasing, the Avrami exponent changes to 3.14 at 100 MPa, indicating that two-dimensional growth occurs at 100 MPa. With the pressure increasing, the Avrami exponents decrease to 1.86 and 1.21 at 200 MPa and 300 MPa, respectively, indicating that incomplete one-dimensional growth occurs when the pressure exceeds 200 MPa.

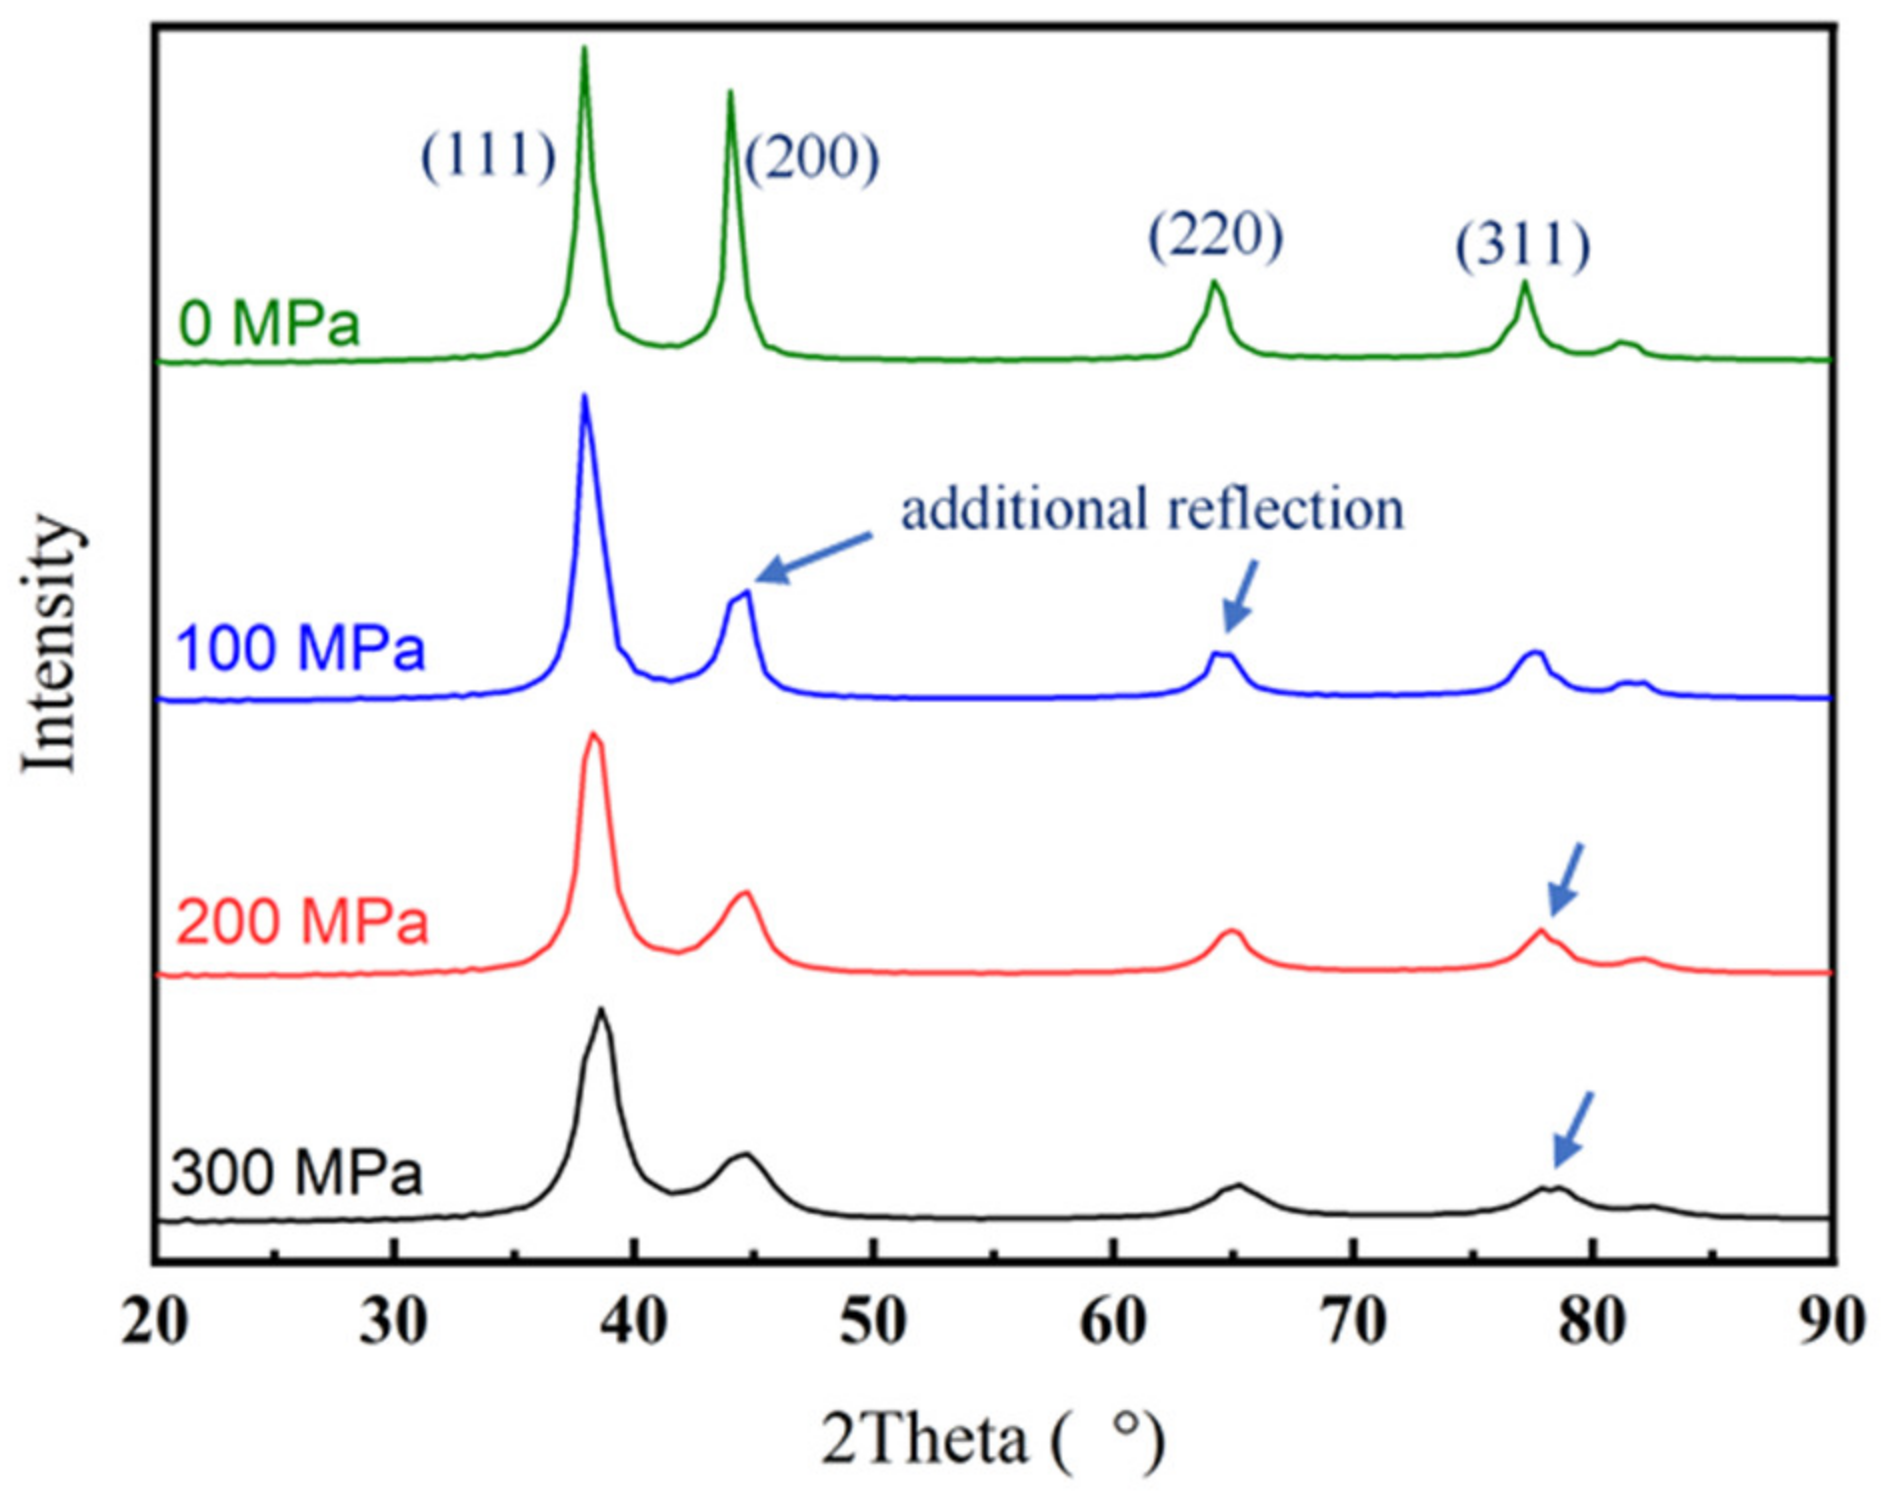
3.5. Effects of Different Pressures on the Crystallite Size

Figure 11 shows XRD curves after the isothermal-solidification process with different pressures. The characteristic peaks in the figure are consistent with those of pure Al. Peaks are at 37.99, 44.01, 64.66, and 77.25 degrees, corresponding to (111), (200), (220), (311), and (222) planes of Al, respectively. According to Debye-Scherrer equation [36,37], crystallite size d is expressed as
d = K λ β cos θ .
where, K is the shape factor (here, K = 1), λ is the X-ray wavelength (1.541828 Å), β is the full width at half maximum (FWHM), θ is the diffraction angle. The crystallite size after the isothermal-solidification process under different pressures are shown in Table 2. Crystallite size is 12.01, 9.45, 8.01, and 7.29 nm at pressure of 0, 100, 200, and 300 MPa, respectively. With the pressure increasing, the nucleation rate increases, as listed in Table 1. The number of crystal nuclei increases, and the crystallite size decreases after grain growth, as observed in Figure 2.
It should be noted that X-ray diffraction peaks were shifted toward the right and there was evidence for a structural-phase transition in Al judged by the presence of additional weak peaks when applying pressure. In the diffraction patterns taken at 100 MPa, additional weak peaks were observed around 2 θ of 44.5 and 64.8 degrees, respectively [see arrows in Figure 11]. In the case of 200 MPa, diffraction pattern shows an additional weak peak around 2 θ of 77.4 degrees. In the case of 300 MPa, an additional weak peak around 2 θ of 77.5 degrees can be clearly seen. Peak shift was originated from distortion lattice under pressure. Existence of additional weak peaks may be originated from metastable phase formed due to extremely distorted lattice under pressure, which are consistent with the results of Takemura’s study [38].

4. Conclusions

Effects of pressure on the isothermal solidification of pure Al were studied by MD simulation. Conclusions are as follows.
  • With pressure increasing, nucleation starts earlier and the number of nuclei also increases during the isothermal-solidification process. The nucleation parameters are estimated by the MFPT method. As the pressure increases, the nucleation rate increases and the change of critical nucleation size is not obvious, which are between 0.32 and 0.31 nm.
  • With the increase of the pressure, the grain-growth exponent n decreases, indicating that the grain growth slows down with the increase in pressure. In order to confirm the different growth modes, Avrami exponents are estimated for the isothermal-solidification process under different pressures. With the pressure increasing, the Avrami exponent decreases.
  • XRD-simulation analysis reveals that with the pressure increasing, crystallite size decreases, indicating that grain can be refined under pressure. In addition, high pressure can lead to lattice deformation and even metastable-phase formation.

Author Contributions

Conceptualization, X.C. and Z.W.; methodology, W.F., W.J. and D.L.; software, W.J. and S.J.; validation, X.C. and Z.W.; formal analysis, W.J., W.F. and S.J.; investigation, W.F.; resources, W.F. and W.J.; data curation, W.J.; writing—original draft preparation, X.C., W.F. and S.J.; writing—review and editing, X.C. and W.F.; visualization, W.F.; supervision, X.C. and D.L. All authors have read and agreed to the published version of the manuscript.

Funding

This research received no external funding.

Data Availability Statement

The data presented in this study are available upon request from the corresponding author.

Acknowledgments

The authors thank the support of the State Key Laboratory of Advanced Metals and Materials and the National Supercomputing Guangzhou Center/Guangzhou Supercomputing Center.

Conflicts of Interest

The authors declare no conflict of interest.

References

  1. Denisov, M.S. Modeling of Processes of Solidification of Metals under Conditions Imposing Pressure. Mater. Sci. Forum 2019, 945, 941. [Google Scholar]
  2. Tong, X.; Zhang, D.C.; Wang, K.; Lin, J.G.; Liu, Y.Y.; Shi, Z.M.; Li, Y.C.; Lin, J.X.; Wen, C. Microstructure and mechanical properties of high-pressure-assisted solidification of in situ Al-Mg2Si composites. Mater. Sci. Eng. A 2018, 733, 10. [Google Scholar] [CrossRef]
  3. Luo, X.; Wang, Y.; Li, Y. Role of hydrostatic pressure and wall effect in solidification of TC8 alloy. NPJ Microgravity 2019, 5, 23. [Google Scholar] [CrossRef] [PubMed] [Green Version]
  4. Bridgman, P.W. The Physics of High Pressures; Bell G. and Sons: London, UK, 1931. [Google Scholar]
  5. Sobczak, J.J.; Drenchev, L.; Asthana, R. Effect of pressure on solidification of metallic materials. Int. J. Cast Met. Res. 2012, 25, 7. [Google Scholar] [CrossRef]
  6. Fan, Z.B.; Lin, X.P.; Xu, R.; Dong, Y.; Wen, B.; Wang, L.; Zhao, S.S. Electron back-scattering diffraction preliminary analysis of heterogeneous nuclei in magnesium alloy during solidification process under GPa high pressure. J. Rare Earths 2018, 36, 185. [Google Scholar] [CrossRef]
  7. Liu, M.P.; Jiang, T.H.; Xie, X.F.; Liu, Q.; Li, X.F.; Roven, H.J. Microstructure evolution and dislocation configurations in nanostructured Al-Mg alloys processed by high pressure torsion. Trans. Nonferrous Met. Soc. China 2014, 24, 3850. [Google Scholar] [CrossRef]
  8. Andreau, O.; Gubicza, J.; Zhang, N.X.; Huang, Y.; Jenei, P.; Langdon, T.G. Effect of short-term annealing on the microstructures and flow properties of an Al-1% Mg alloy processed by high-pressure torsion. Mater. Sci. Eng. A 2014, 615, 232. [Google Scholar] [CrossRef]
  9. Wang, Z.X.; Lu, J.B.; Xi, Y.J.; Fan, J.W. Phase transitions of Cu-based alloys under high pressure. J. Alloys Compd. 2010, 492, 530. [Google Scholar] [CrossRef]
  10. Celik, F.A.; Yildiz, A.K. Molecular dynamics simulation of crystallization kinetics and homogenous nucleation of Pt-Rh alloy. J. Non-Cryst. Solids 2015, 415, 36. [Google Scholar] [CrossRef]
  11. Han, Y.S.; Lee, H.I.; Kim, D.H.; Kim, Y.G. Effect of applied pressure during solidification on the microstructural refinement in an Al-Cu alloy. Scr. Metall. Mater. 1994, 31, 1624. [Google Scholar] [CrossRef]
  12. Zhao, S.S.; Peng, Q.M.; Li, H.; Liu, B.Z. Effects of super-high pressure on microstructures, nano-mechanical behaviors and corrosion properties of Mg-Al alloys. J. Alloys Compd. 2014, 584, 58. [Google Scholar] [CrossRef]
  13. Mahata, A.; Zaeem, M.A. Size effect in molecular dynamics simulation of nucleation process during solidification of pure metals: Investigating modified embedded atom method interatomic potentials. Model. Simul. Mater. Sci. Eng. 2019, 27, 85015. [Google Scholar] [CrossRef]
  14. Sarkar, A.; Barat, P.; Mukherjee, P. Molecular dynamics simulation of rapid solidification of aluminum under pressure. Int. J. Mod. Phys. B 2008, 22, 2781–2785. [Google Scholar] [CrossRef] [Green Version]
  15. Mendelev, M.I.; Kramer, M.J.; Becker, C.A.; Asta, M. Analysis of semi-empirical interatomic potentials appropriate for simulation of crystalline and liquid Al and Cu. Philos. Mag. 2008, 88, 1725. [Google Scholar] [CrossRef]
  16. Daw, M.S.; Baskes, M.I. Embedded-atom method: Derivation and application to impurities, surfaces, and other defects in metals. Phys. Rev. B. 1984, 29, 6445. [Google Scholar] [CrossRef] [Green Version]
  17. Stukowski, A. Visualization and analysis of atomistic simulation data with OVITO-the Open Visualization Tool. Model. Simul. Mater. Sci. Eng. 2009, 18, 15012. [Google Scholar] [CrossRef]
  18. Stukowski, A. Structure identification methods for atomistic simulations of crystalline materials. Model. Simul. Mater. Sci. Eng. 2012, 20, 45021. [Google Scholar] [CrossRef] [Green Version]
  19. Chen, X.H.; Fan, W.J.; Jiang, W.W.; Lin, D.Y.; Wang, Z.D.; Hui, X.D.; Wang, Y.L. Effects of Cooling Rate on the Solidification Process of Pure Metal Al: Molecular Dynamics Simulations Based on the MFPT Method. Metals 2022, 12, 1504. [Google Scholar] [CrossRef]
  20. Kelton, K.F.; Gangopadhyay, A.K.; Kim, T.H.; Lee, G.W. A case for local icosahedral order in undercooled metallic liquids and the influence on the nucleation barrier. J. Non-Cryst. Solids 2006, 352, 5318. [Google Scholar] [CrossRef]
  21. Zhang, Q.; Wang, J.C.; Tang, S.; Wang, Y.J.; Li, J.J.; Zhou, W.Q.; Wang, Z.J. Molecular dynamics investigation of the local structure in iron melts and its role in crystal nucleation during rapid solidification. Phys. Chem. Chem. Phys. 2019, 21, 4125. [Google Scholar] [CrossRef]
  22. Zheng, L.Q.; An, Q.; Xie, Y.; Sun, Z.H.; Luo, S.N. Homogeneous nucleation and growth of melt in copper. J. Chem. Phys. 2007, 127, 164503. [Google Scholar] [CrossRef] [PubMed]
  23. Cai, Y.; Wu, H.A.; Luo, S.N. Cavitation in a metallic liquid: Homogeneous nucleation and growth of nanovoids. J. Chem. Phys. 2014, 140, 214317. [Google Scholar] [CrossRef] [PubMed] [Green Version]
  24. Wedekind, J.; Strey, R.; Reguera, D. New method to analyze simulations of activated processes. J. Chem. Phys. 2007, 126, 134103. [Google Scholar] [CrossRef] [PubMed]
  25. Bartell, L.S.; Wu, D.T. A new procedure for analyzing the nucleation kinetics of freezing in computer simulation. J. Chem. Phys. 2006, 125, 194503. [Google Scholar] [CrossRef] [Green Version]
  26. Wedekind, J.; Reguera, D.; Strey, R. Finite-size effects in simulations of nucleation. J. Chem. Phys. 2006, 125, 214505. [Google Scholar] [CrossRef]
  27. Gutzow, I.; Durschang, B.; Russel, C. Crystallization of glassforming melts under hydrostatic pressure and shear stress: Part I Crystallization catalysis under hydrostatic pressure: Possibilities and limitations. J. Mater. Sci. 1997, 32, 5390. [Google Scholar]
  28. Eisenstein, J.C.; Wang, L.; Cai, Y.; Wu, H.A.; Luo, S.N. Crystallization in supercooled liquid Cu: Homogeneous nucleation and growth. J. Chem. Phys. 2015, 142, 64704. [Google Scholar]
  29. Farag, S.; Konyashin, I.; Ries, B. The influence of grain growth inhibitors on the microstructure and properties of submicron, ultrafine and nano-structured hardmetals—A review. Int. J. Refract. Met. Hard Mater. 2018, 77, 20. [Google Scholar] [CrossRef]
  30. Guo, E.Y.; Shuai, S.S.; Kazantsev, D.; Karagadde, S.; Phillion, A.B.; Jing, T.; Li, W.Z.; Lee, P.D. The influence of nanoparticles on dendritic grain growth in Mg alloys. Acta Mater. 2018, 152, 130. [Google Scholar] [CrossRef]
  31. Najafkhani, F.; Kheiri, S.; Pourbahari, B.; Mirzadeh, H. Recent advances in the kinetics of normal/abnormal grain growth: A review. Arch. Civ. Mech. Eng. 2021, 21, 29. [Google Scholar] [CrossRef]
  32. Avrami, M. Kinetics of Phase Change. II Transformation-Time Relations for Random Distribution of Nuclei. J. Chem. Phys. 1940, 8, 212. [Google Scholar] [CrossRef]
  33. Cahn, J.W. The kinetics of grain boundary nucleated reactions. Acta Metall. 1956, 4, 449. [Google Scholar] [CrossRef]
  34. Christian, J.W. The Theory of Transformation in Metals and Alloys; Pergamon Press: Oxford, UK, 2002. [Google Scholar]
  35. Khanna, Y.P.; Taylor, T.J. Comments and recommendations on the use of the Avrami equation for physico-chemical kinetics. Polym. Eng. Sci. 1988, 28, 1042. [Google Scholar] [CrossRef]
  36. Mustapha, S.; Ndamitso, M.M.; Abdulkareem, A.S.; Tijani, J.O.; Shuaib, D.T.; Mohammed, A.K.; Sumaila, A. Comparative study of crystallite size using Williamson-Hall and Debye-Scherrer plots for ZnO nanoparticles. Adv. Nat. Sci Nanosci. Nanotechnol. 2019, 10, 45013. [Google Scholar] [CrossRef]
  37. Mustapha, S.; Tijani, J.O.; Ndamitso, M.M.; Abdulkareem, A.S.; Shuaib, D.T.; Amigun, A.T.; Abubakar, H.L. Facile synthesis and characterization of TiO2 nanoparticles: X-ray peak profile analysis using Williamson-Hall and Debye-Scherrer methods. Int. Nano Lett. 2021, 11, 244. [Google Scholar] [CrossRef]
  38. Takemura, K. Effect of pressure on the lattice distortion of indium to 56 GPa. Phys. Rev. B 1991, 44, 545. [Google Scholar] [CrossRef]
Figure 1. Al-melt model at 2000 K and its RDF curve [19]. (a) MD model. The left inset is the magnified view of the center part of Al melt. (b) RDF curve.
Metals 12 02101 g001
Figure 2. Histograms of nucleation-incubation time under (a) 0 MPa; (b) 100 MPa; (c) 200 MPa; (d) 300 MPa.
Metals 12 02101 g002
Figure 3. Nucleation and growth during the isothermal-solidification process under different pressures. Red and green atoms represent atoms with HCP and FCC structure, which are defined by the adaptive CNA. Atoms defined as the “other” structure are not shown in the snapshots for clarity.
Metals 12 02101 g003
Figure 4. Snapshots of microstructures evolution under different pressures.
Metals 12 02101 g004
Figure 5. Time dependence of atomic fractions for (a) FCC, (b) HCP and (c) the “other” structures during the isothermal-solidification process under different pressures.
Metals 12 02101 g005
Figure 6. Volume of atoms-vs.-time curves under different pressures.
Metals 12 02101 g006
Figure 7. Time dependence of the number of atoms in the largest cluster during the isothermal-solidification process at (a) 0 MPa, (b) 100 MPa, (c) 200 MPa, and (d) 300 MPa, respectively.
Metals 12 02101 g007
Figure 8. The mean first-passage time ( τ ) vs. the size of the largest nucleus ( n m a x ) during the isothermal-solidification process at (a) 0 MPa, (b) 100 MPa, (c) 200 MPa, and (d) 300 MPa, respectively.
Metals 12 02101 g008aMetals 12 02101 g008b
Figure 9. l n t vs. l n D curves under different pressures during the isothermal-solidification processes.
Metals 12 02101 g009
Figure 10. Avrami plot (time evolution of the solid fraction f V t plotted as the relation of l n l n 1 / 1 f v t vs. l n t ) during the isothermal-solidification process at (a) 0 MPa, (b) 100 MPa, (c) 200 MPa, and (d) 300 MPa, respectively.
Metals 12 02101 g010
Figure 11. XRD curves during the isothermal-solidification process with different pressures.
Metals 12 02101 g011
Table 1. Critical size n * , nucleation rate J and critical nucleus radius r * during the isothermal-solidification processes under different pressures.
Pressure (MPa) n * J (m−3s−1) r *   ( nm )
08.093.05 × 1033~0.32
1007.755.77 × 1033~0.32
2007.491.17 × 1034~0.31
3007.071.62 × 1034~0.31
Table 2. Crystallite size after the isothermal-solidification process with different pressures.
Pressure (MPa)Crystallite Size (nm)
012.01
1009.45
2008.01
3007.29
Publisher’s Note: MDPI stays neutral with regard to jurisdictional claims in published maps and institutional affiliations.

