Article

Control of Bismuth and Manganese Sulfide Inclusions in Free-Cutting Steels of Different Classes

1
Scientific and Technical Complex “New Technologies and Materials”, Peter the Great St. Petersburg Poly-technic University, 195251 St. Petersburg, Russia
2
Institute of Machinery, Materials, and Transport, Peter the Great St. Petersburg Polytechnic University, 195251 St. Petersburg, Russia
*
Author to whom correspondence should be addressed.
Metals 2022, 12(12), 2076; https://doi.org/10.3390/met12122076
Submission received: 31 August 2022 / Revised: 25 November 2022 / Accepted: 25 November 2022 / Published: 2 December 2022

Abstract

:
The paper investigates the behavior of bismuth and sulfur in modern free-cutting steels. It is shown that today there are no mutually consistent thermodynamic data for calculating the solubility of bismuth in a multi-component steel system. Based on the processing of data from separate works, mutually consistent dependences of the solubility of bismuth in pure iron, as well as Wagner interaction parameters for calculation for steels, were obtained. An attempt was made to model the formation of bismuth simultaneously with manganese sulfides during solidification based on the Ohnaka segregation model. Comparison with experimental data shows acceptable convergence of calculations and experiments.

1. Introduction

In modern engineering, parts are produced on automatic cutting machines, which require high processing speeds, good tool life, the absence of long wavy chips, and compliance with modern environmental requirements [1]. Alloying with sulfur, phosphorus, tellurium, or lead makes it possible to solve machinability problems [2,3,4,5,6,7,8], but these elements provoke many problems with quality, such as hot cracks, segregations, and reduction and anisotropy of mechanical properties [9,10,11,12,13,14,15,16,17,18].
The most promising element for use in automatic steels is bismuth (Bi) [2], which has similar chemical and physical properties to lead [1]. It is much more environmentally friendly, and its maximum allowable concentration in the working area is 50 times higher than that of lead. Today, bismuth-containing steels are quite actively produced on a laboratory and semi-industrial scale, and Bi content ranges from 0.005 to 0.15% [2,6,19,20,21,22]. Bismuth addition experiments in structural and high-strength, corrosion-resistant steels are known. This made it possible to significantly improve machinability and surface quality after cutting and ensure the high mechanical properties of steels in almost all cases. In some works, the authors tried to add pure bismuth and bismuth with sulfur additions. A positive effect was achieved in all cases, and this is due precisely to the addition of bismuth.
Nevertheless, despite the wide coverage of bismuth-containing steels in the literature, many problems remain. A characteristic feature of bismuth is its low boiling point, which causes difficulties during the injection of bismuth into liquid steel [23]. Despite the fact that one of the first hypotheses about the use of bismuth was to alloy steel with its particles at the time of pouring the steel so that the bismuth particles are melted and instantly captured by the crystallization front [20], apparently, bismuth is dissolved in liquid steel followed by the formation of an independent phase. This confirms that the bismuth particles in the studies are always located with manganese sulfides. However, thermodynamic data are not systematized, and there are no works in which a full-scale modeling of the behavior of bismuth during melting and solidification, taking into account cooling conditions and the influence of alloying elements, has been carried out. There are also no studies evaluating the tendency of bismuth to form macrosegregations to predict its behavior in industrial continuously cast billets.
Therefore, the purpose of this work was to develop a thermodynamic description of the behavior of bismuth in liquid and crystallizing steel based on the calculation of the solubility of bismuth in liquid steel and the determination of the temperature of formation of particles by it depending on the initial concentration and solidification conditions, taking into account possible boiling, and experimental study of its behavior in real ingots.

2. Materials and Methods

In this work, laboratory ingots produced in an open induction furnace were investigated. The melting was carried out using steel scrap with the required carbon content, metallic manganese and chromium, ferrosilicon, and aluminum wire for deoxidation. Scrap was loaded into the furnace; after complete melting, steel temperature was corrected. After the temperature of 1650 °C was reached, manganese and silicon were added, and then the steel was deoxidized with aluminum. After that, the steel was poured from the furnace into a ladle. Bismuth was added in 0.5–2 mm pieces through a dosing tube under the liquid steel flow during pouring when the ladle was 25% full. The casting of steel from a ladle was carried out at a temperature of 1550 °C into an iron mold with a cross section of 90–80 mm (reverse taper) and a height of 275 mm. At the top, the form was lined with quartz sand on a liquid glass binder. The mass of each ingot was 12 kg. The chemical composition of the experimental ingots was determined using an optical emission spectrometer (Table 1). The bismuth content was determined by the atomic absorption method. The content of phosphorus and other impurities in all heats did not exceed 0.01%. The following steels were studied (according to Table 1):
Medium alloy steel 0.4C-Cr (37Cr4 (EN 10083)):
  • With different content of bismuth (lines 1 and 2);
  • With bismuth and high sulfur content (line 3).
Low carbon steel 0.14C (9SMn28 (EN10277-3)):
  • With bismuth (line 4).
A longitudinal template was taken from the ingots for the study of inclusions and structure. By etching in hot concentrated hydrochloric acid, the dendritic structure was revealed. This was necessary to determine the parameters of ingot solidification. The assessment of non-metallic inclusions was carried out on samples from the upper horizon of the ingot, located on the edge near the cooling surface, in the center of the ingot, and also on samples from the top, where solidification proceeded the slowest. The study of the top of the ingot made it possible to obtain information on the nature of the formed macrosegregations for predicting the behavior of bismuth in an industrial continuously cast billet.
The cutting of samples from ingots was carried out on a band saw machine. Further cutting to obtain sections for metallographic studies was carried out on a BUEHLER ABRASIMET-2 machine (Buehler, USA). The samples were pressed into a phenolic compound, ground, and polished. Metallographic studies were carried out using a Meiji optical microscope (Meiji Techno, Japan) equipped with a Thixomet image analyzer (Russia, Saint-Petersburg) [24]. The study of the volume fraction of inclusions was carried out by the field-to-field method according to the ASTM E 1245-03 standard. The volume fraction V, %; the average number of inclusions, 1/mm2; the average Feret diameter d, μm; and the maximum Feret diameter of the largest inclusion dmax, μm, were estimated. The composition of the inclusions was determined using a Tescan electron microscope (Tescan, Brno, Czech Republic) with an attachment for EDS analysis.
The modeling of the formation of inclusions was carried out using a thermodynamic approach based on the calculation of the equilibrium constants of chemical reactions taking into account the apparatus of interaction parameters according to Wagner [25]. The segregation was calculated according to the models of Sheil and Ohnaka [26,27].

3. Results and Discussion

3.1. Description of the Model for the Formation of Bismuth Particles and Manganese Sulfides

In the present work, aluminum-killed steels were studied. Therefore, it was assumed that all primary and secondary inclusions consist only of corundum [28], and only the formation of bismuth and manganese sulfide during solidification was modeled.

3.1.1. Thermodynamics of Formation of Bismuth Particles

The initial data for calculating the solubility of bismuth in steel are the empirical dependences of the solubility of bismuth in pure liquid iron [22,23,29]. Since one of the main problems in the thermodynamics of bismuth is the absence of mutually consistent thermodynamic constants, the data of [22,29] were used, since in these works both an equation for describing the solubility of bismuth and some data on the influence of third elements on it were obtained.
When describing the behavior of bismuth in liquid iron, two main reactions must be taken into account. The first is the balance of liquid and bismuth dissolved in iron (1):
BiLiq = [𝐵𝑖]
Since bismuth boils in the temperature range of steelmaking, the behavior of its solubility in an open system will be nonmonotonic. Therefore, it is necessary to consider equilibrium (1) together with the reaction of the transition of bismuth from a liquid state to a gaseous state (2):
𝐵𝑖Liq = {𝐵𝑖}
The temperature dependence of the change in the Gibbs energies of reactions (1) and (2) is described by the expressions (3) and (4) [29]:
ΔG1 = 123 966.9 − 51.52∙T
ΔG2 = 172 000 − 93.63∙T
Then, in order to describe the solubility of bismuth at temperatures above its boiling point, one should describe the equilibrium of dissolved bismuth with saturated bismuth vapor at a given temperature (5) [23]:
{Bi}sat = [Bi]
Subtracting expression (4) from expression (3), the temperature dependence of the Gibbs energy of reaction (5) is obtained:
ΔG3 = −48033.1 + 42.108∙T
Thus, Equations (3) and (6) make it possible to describe the behavior of bismuth in an open melt at temperatures below and above the boiling point of bismuth, which can be found by equating expressions (3) and (6) and solving them with respect to temperature. However, the considered dependences, although suitable for calculating the solubility of bismuth for pure iron, cannot be used to calculate the solubility in steel containing various alloying elements, such as silicon, manganese, chromium, and carbon. Therefore, the apparatus of interaction parameters using the Wagner formalism [25] was used, according to which the activity of bismuth can be estimated as
a B i = f B i [ B i ]  
l o g f B i = e B i i · [ j ]
where aBi is bismuth activity, f B i is the bismuth activity coefficient, e B i i is the first-order interaction parameter, [Bi] is the bismuth concentration in liquid steel.
Using the data of [21,23,29], according to the method presented in [25], the values of the first-order interaction parameters were obtained (Table 2, line 1).
The dependence of interaction parameters on temperature was taken into account using the expression [30]
e j i = ( 2538 T 0.355 ) e j   ( a t   1873 K ) i
where e j i is the first-order interaction parameter at a given temperature; e j ( a t   1873 K ) i is the first-order interaction parameter at temperature 1873К.
Thus, the dependences of solubility on temperature were calculated taking into account the phase transformations of bismuth. Figure 1 shows the calculation results for pure iron (FePure), for experimental medium-alloyed and low-carbon steels 0.4C-Cr and 0.14C, and for more alloyed model steels Cr13 and 18–10 steel.
As the temperature decreases from 1650 to 1564 °C, the solubility increases monotonically for all steels, since the saturation vapor pressure decreases, and its absolute value depends on the amount of alloying elements and is determined by the sign and number of the interaction parameter. The inflection on the curve shows the achievement of the maximum solubility of bismuth at a temperature of 1564 °C. With a further decrease in temperature, the solubility of bismuth does not depend on its vapor pressure, but on equilibrium with liquid bismuth, and decreases. The maximum solubility of bismuth is 0.147% for pure iron, 0.156% for 0.14C, 0.140% for 0.4C-Cr, 0.463% for 18–10, and 0.123% for Cr13. These data can be used to create various free-cutting steels with bismuth.

3.1.2. Thermodynamics of the Formation of Manganese Sulfide

To take into account the formation of manganese sulfide, which also makes it possible to increase machinability, the reaction of its formation is considered:
[Mn] + [S] = (MnS)
The equilibrium constant of reaction (10) is expressed as follows:
K P = 1 [ M n ] · f M n · [ S ] · f S  
where [Mn] and [S] are the concentrations of manganese and sulfur, respectively, in liquid steel; fMn and fs are the activity coefficients of manganese and sulfur, respectively.
The temperature dependence of the Gibbs energy of this reaction can be described by the expression [30]
Δ G = 16724 · 103 + 88.49 · T
The first-order interaction parameters of elements for sulfur and manganese are from [30] and are also given in Table 2 (lines 2 and 3).

3.1.3. Calculation of Segregation during Solidification

Since it is known from experiments that bismuth particles are most often located with sulfide inclusions, and the most typical bismuth concentration of 0.1% is significantly lower than the calculated solubility (Figure 1), bismuth is formed as an independent phase during solidification due to segregation. In this work, a calculation using the Ohnaka model was performed [27]:
C L i = C L ( 1 Г · f S 1 Г · ( f S + Δ f S ) 1 k Г  
Г = 1 4 α k 1 + 4 α      
α = 4 D S t f ( λ 2 ) 2
where C L i is the element concentration at the current step of the calculation; C L is the concentration of the element at the previous step of calculation; fs is the solid fraction; Δfs is the solid phase increment; k is the equilibrium partition coefficient of an element; Г is the auxiliary variable; α is the Brody–Flemmings back-diffusion coefficient [26]; Ds is the diffusion coefficient in a solid; tf is the local solidification time; and λ2 is the secondary dendritic arms spaces (SDAS), μm.
The local solidification time was determined as the ratio of the solidification interval to the cooling rate, which, in turn, was estimated based on the experimental determination of SDAS. The relationship of SDAS with the cooling rate and the local solidification time was taken into account using the verified equation from [27], using the expressions (16) for steels with a carbon content below 0.15% and (17) for high carbon contents:
λ 2 = ( 1691 7209   C 0 )   V C o o l 0.4935
λ 2 = 1439   C 0 ( 0.550.1 1.96 C 0 )   V C o o l 0.3616    
where C0 is the carbon concentration, wt.%; VCool is the cooling rate, °C/s.
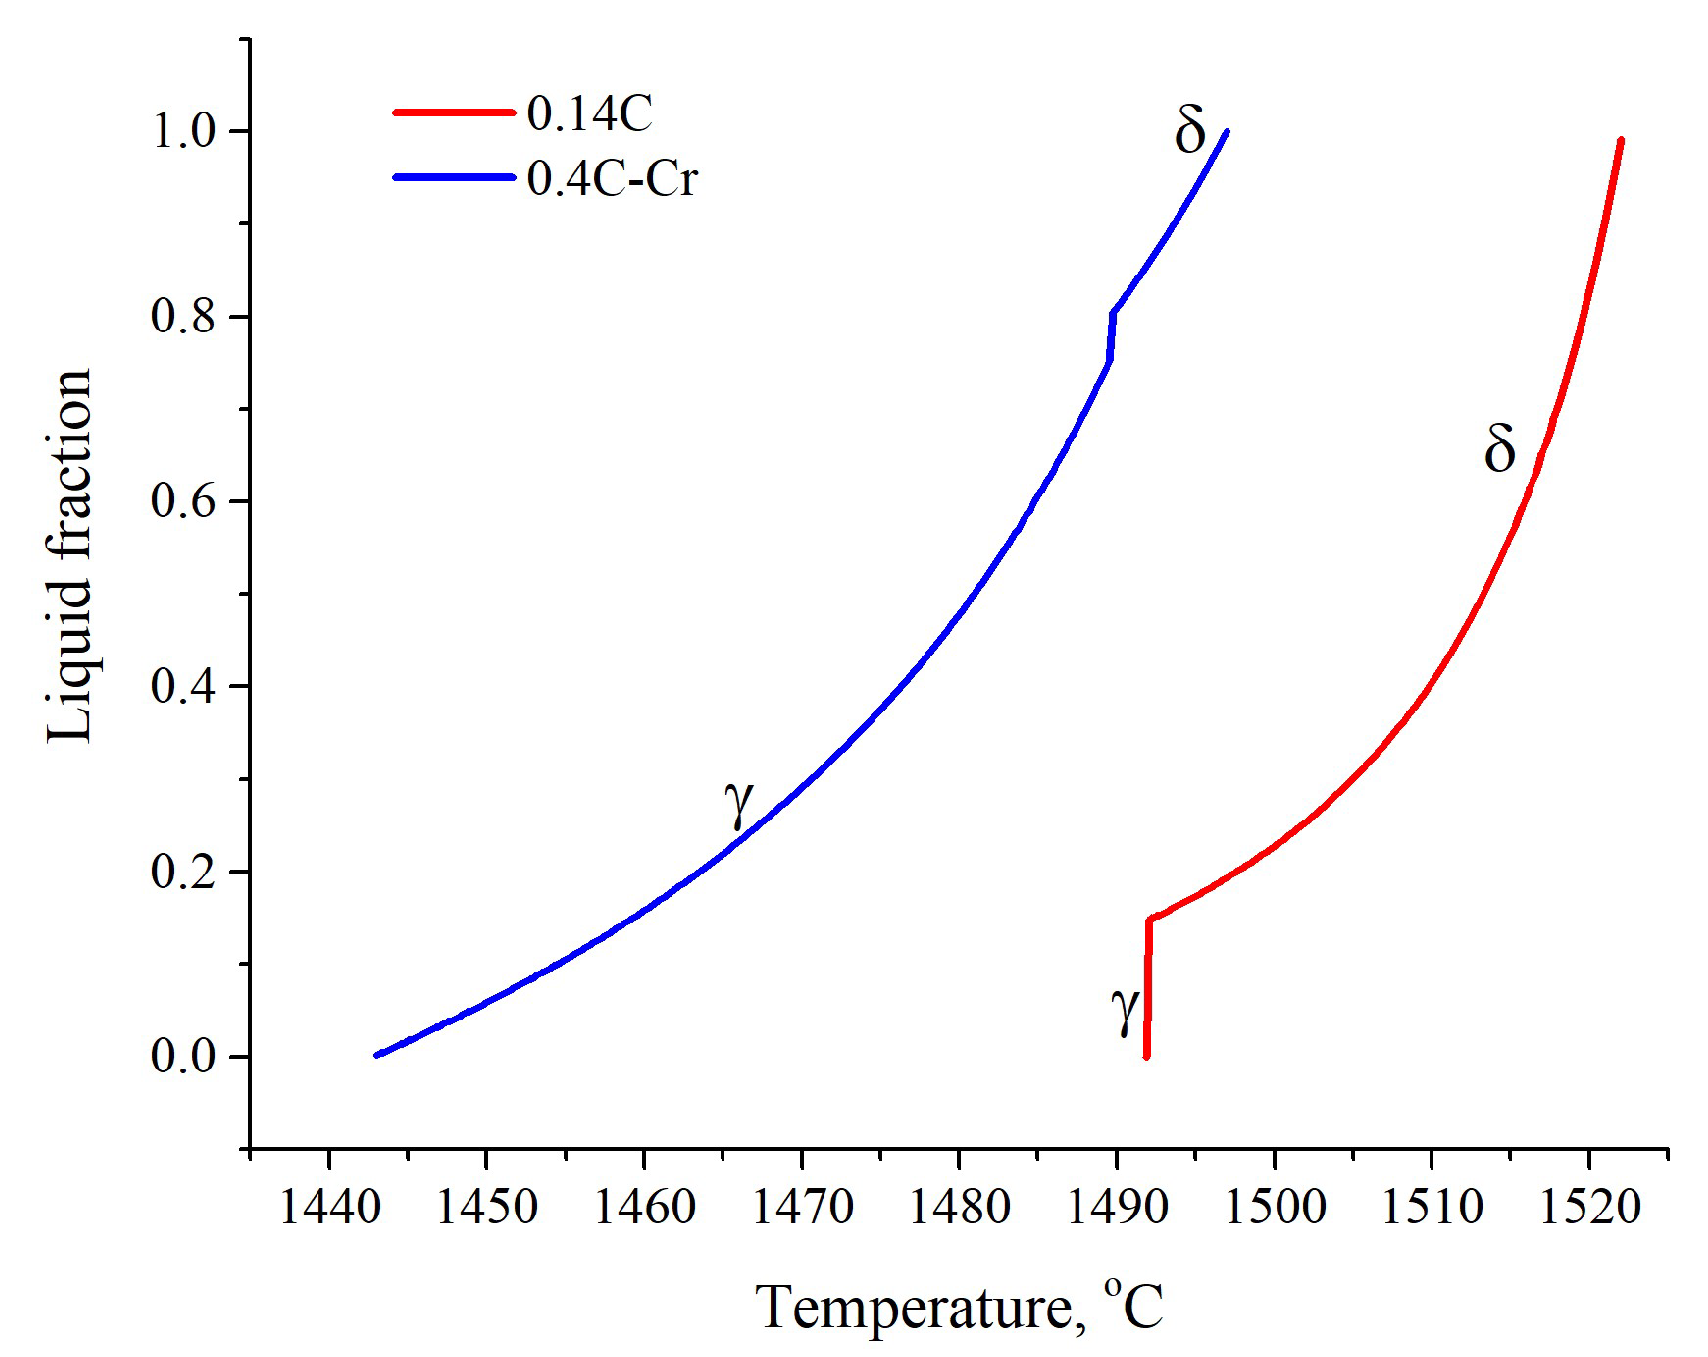
The calculation is organized in a cycle by changing the solid phase. In the beginning, the initial data were loaded, then the increment for the solid phase was set and the concentrations of all elements were calculated using expressions 13–15. The dependence of the solid phase on temperature (Figure 2) was obtained by carrying out preliminary calculations in ThermoCalc with TCFE database (Sweden).
The peritectic transformation was taken into account in a formal way, using the equilibrium partition coefficients and temperature dependences of the diffusion coefficients for δ and γ iron (Table 3). The equilibrium partition coefficients for carbon, silicon, manganese, and other elements are well known [27,31,32]. The partition coefficient of bismuth was estimated in this work based on three sources. The first source is the calculated phase diagrams of Fe-Bi [33], based on which kBi was 0.14. The second is the results of estimating the solubility of bismuth in austenite at high temperatures [23] at 0.18. The third source is [29], according to which the coefficient is 0.12. Thus, averaging the results of different authors, this work used the value of 0.14. It should also be noted that the partition coefficient of bismuth in δ and γ iron was considered to be constant, and the diffusion of bismuth in solid iron was suppressed. Thus, the calculation for bismuth is reduced to the Sheil equation [26].
To determine the temperature of formation and the amount of particles of bismuth and manganese sulfide at each step, the actual concentration of bismuth and the actual value of the product of the activities of manganese and sulfur (9) were compared with the corresponding equilibrium values for these temperatures. If the actual values were higher, then the formation of particles was calculated. The mass of bismuth m B i L i q which formed at each step was determined by the expression.
m B i L i q = B i 0 [ B i ] · F L ( 1 F l ) · [ B i ] · k B i · B i 0    
To determine the mass of manganese sulfide, the equilibrium concentrations of sulfur and manganese were preliminarily determined using expressions 19–22:
[ S ] e q = ( [ S ] f a c t · A M n A S [ M n ] f a c t ) ±   ( [ M n ] f a c t [ S ] f a c t ·   A M n A S ) 2 + 4 · A A S ·   1 f s · f M n · K e q 2 · A M n A S  
( S ) s = S 0 F l · [ S ] f a c t 1 F l    
( M n ) s = M n 0 F l · [ M n ] f a c t ( 1 F l )
[ M n ] e q = [ M n ] f a c t ( [ S ] f a c t [ S ] e q ) · A M n A S    
where [Mn]fact and [S]fact are the actual concentrations in the liquid phase, AMn = 54.94 and AS = 32.06 are the atomic masses of manganese and sulfur, (S)s is the current sulfur concentration in the solid phase, S0 is the initial sulfur concentration in steel, (Mn)s is the current concentration of manganese in the solid phase, Mn0 is the initial concentration of manganese in steel, and [Mn]eq and [S]eq are the equilibrium values of manganese and sulfur.
The amount of manganese sulfide was calculated according to Equation (23):
m M n S = S 0 F l · [ S ] e q ( 1 F l ) · ( S ) S + M n 0 F l · [ M n ] e q ( 1 F l ) · ( M n ) S      
Crystallization was calculated until the carbon concentration reached 6.67%, which corresponds to the formation of pure cementite, after which the calculation was stopped.

3.1.4. Modeling Results

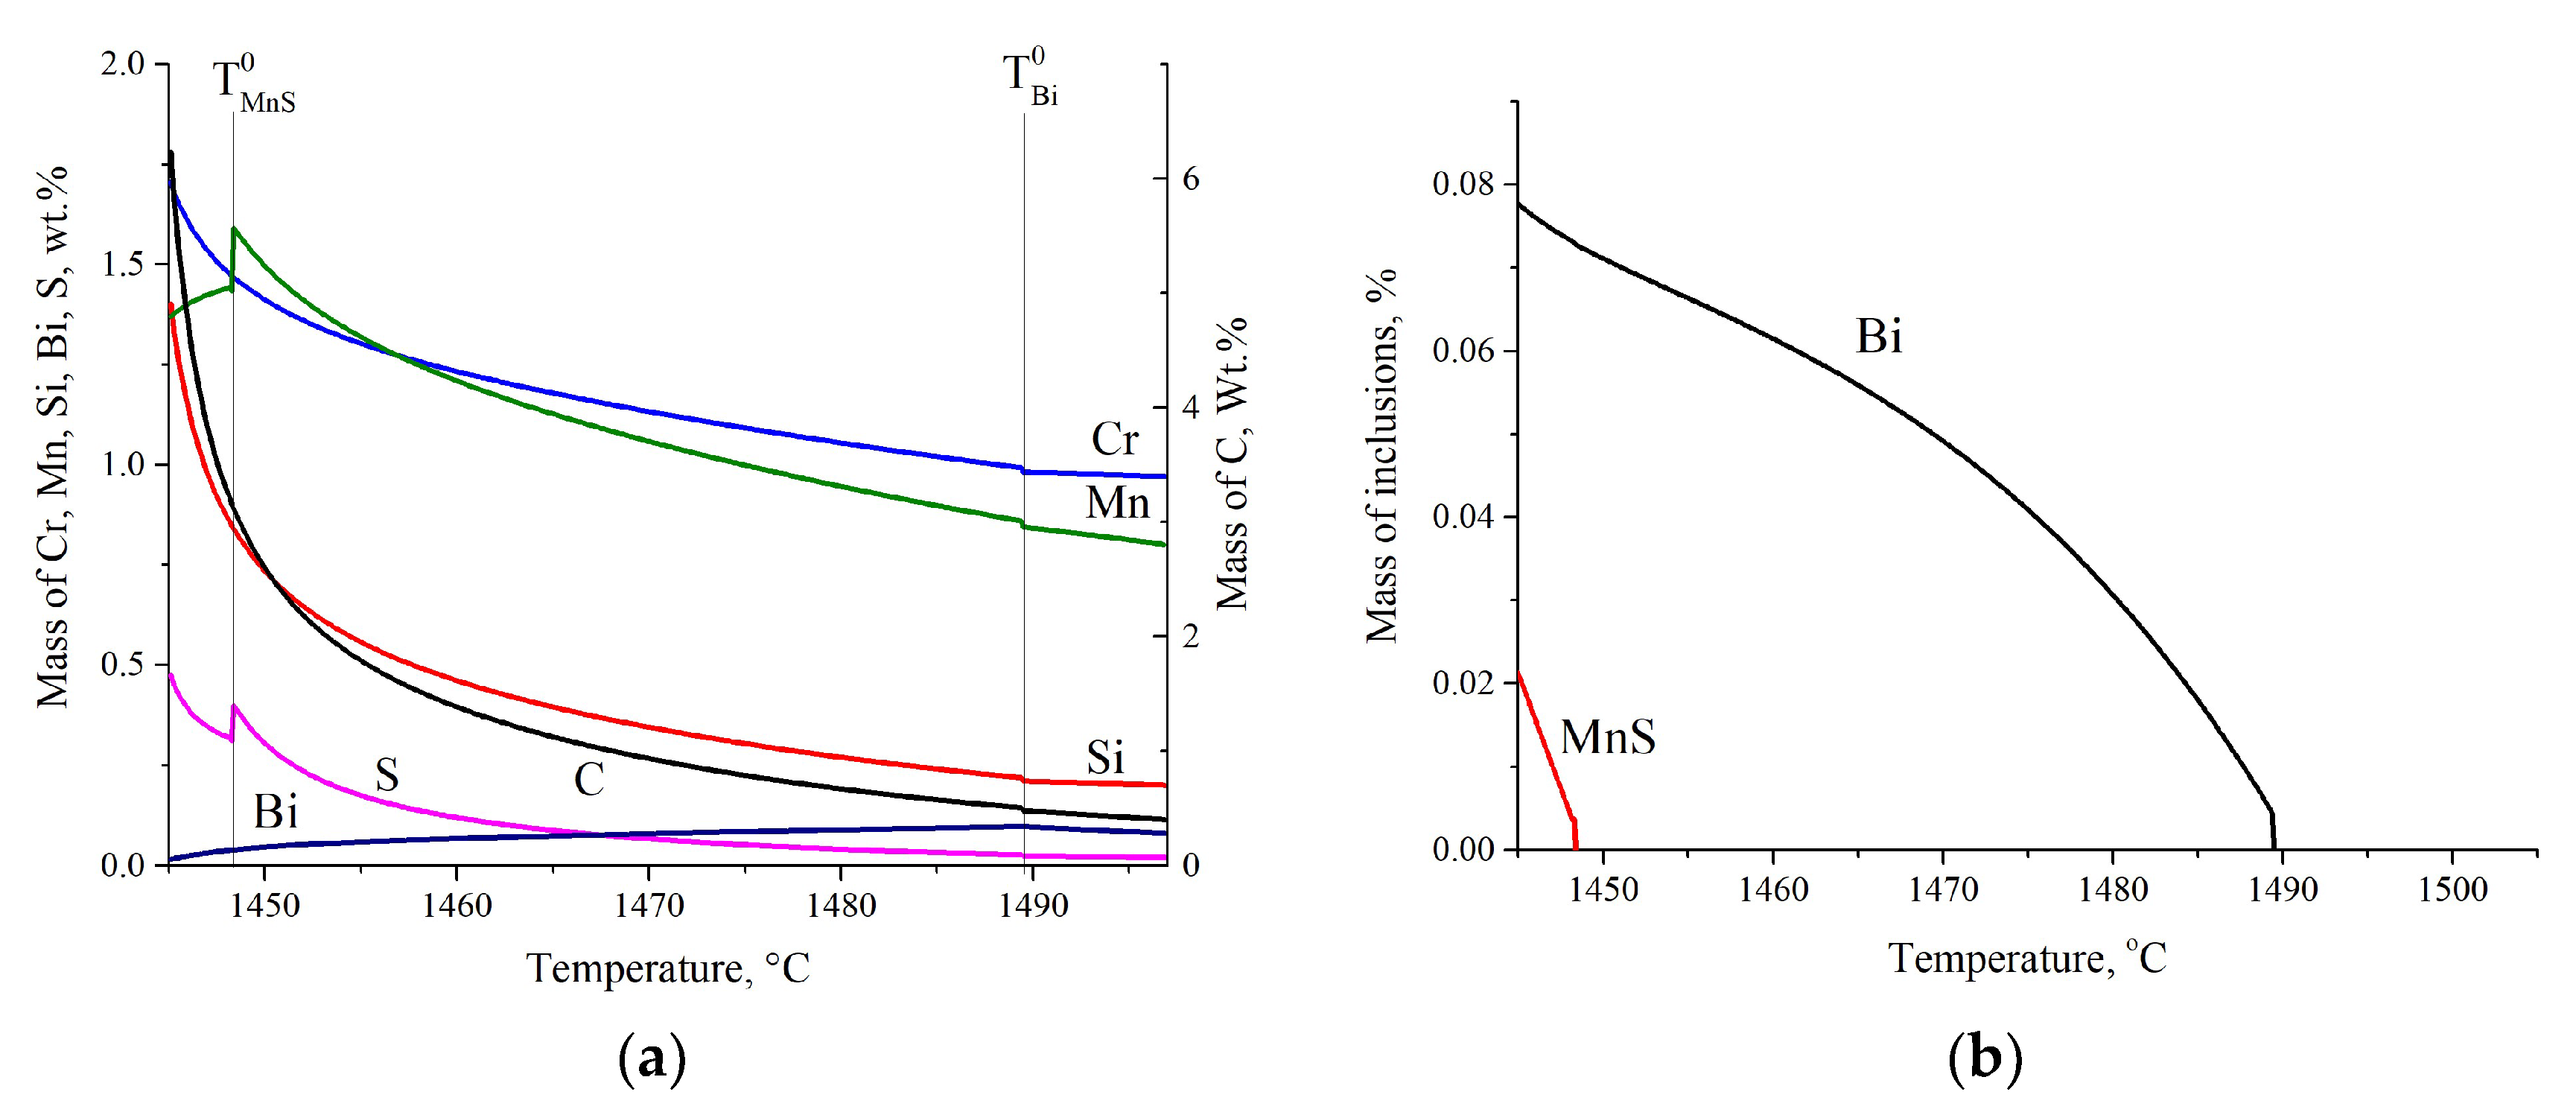
Figure 3 shows an example of a calculation for steel 0.4C-Cr alloyed with 0.08% bismuth. As the solidification proceeds, the residual concentration of all elements increases (Figure 3a). In the region of the peritectic point, there is a change in slope due to changes in partition coefficients and diffusion coefficients at this temperature. An increase in the bismuth content occurs until its solubility is reached, after which its concentration in the liquid decreases, and the fraction of precipitated particles increases (Figure 3b). Note that this calculation shows a sharp increase in the concentration of bismuth in liquid steel, and as a result, the beginning of its precipitation occurs at the moment the formation of austenite dendrites begins and is caused by a significant difference in the solubility of the remaining alloying elements in γ and δ iron, which has a strong influence on the amount of solubility. The concentration of sulfur and manganese increases continuously, and as soon as the product of sulfur and manganese reaches the equilibrium value (T = 1455 °C, Fl = 0.1), the formation of manganese sulfide begins, and the concentration of sulfur and manganese begins to fall.
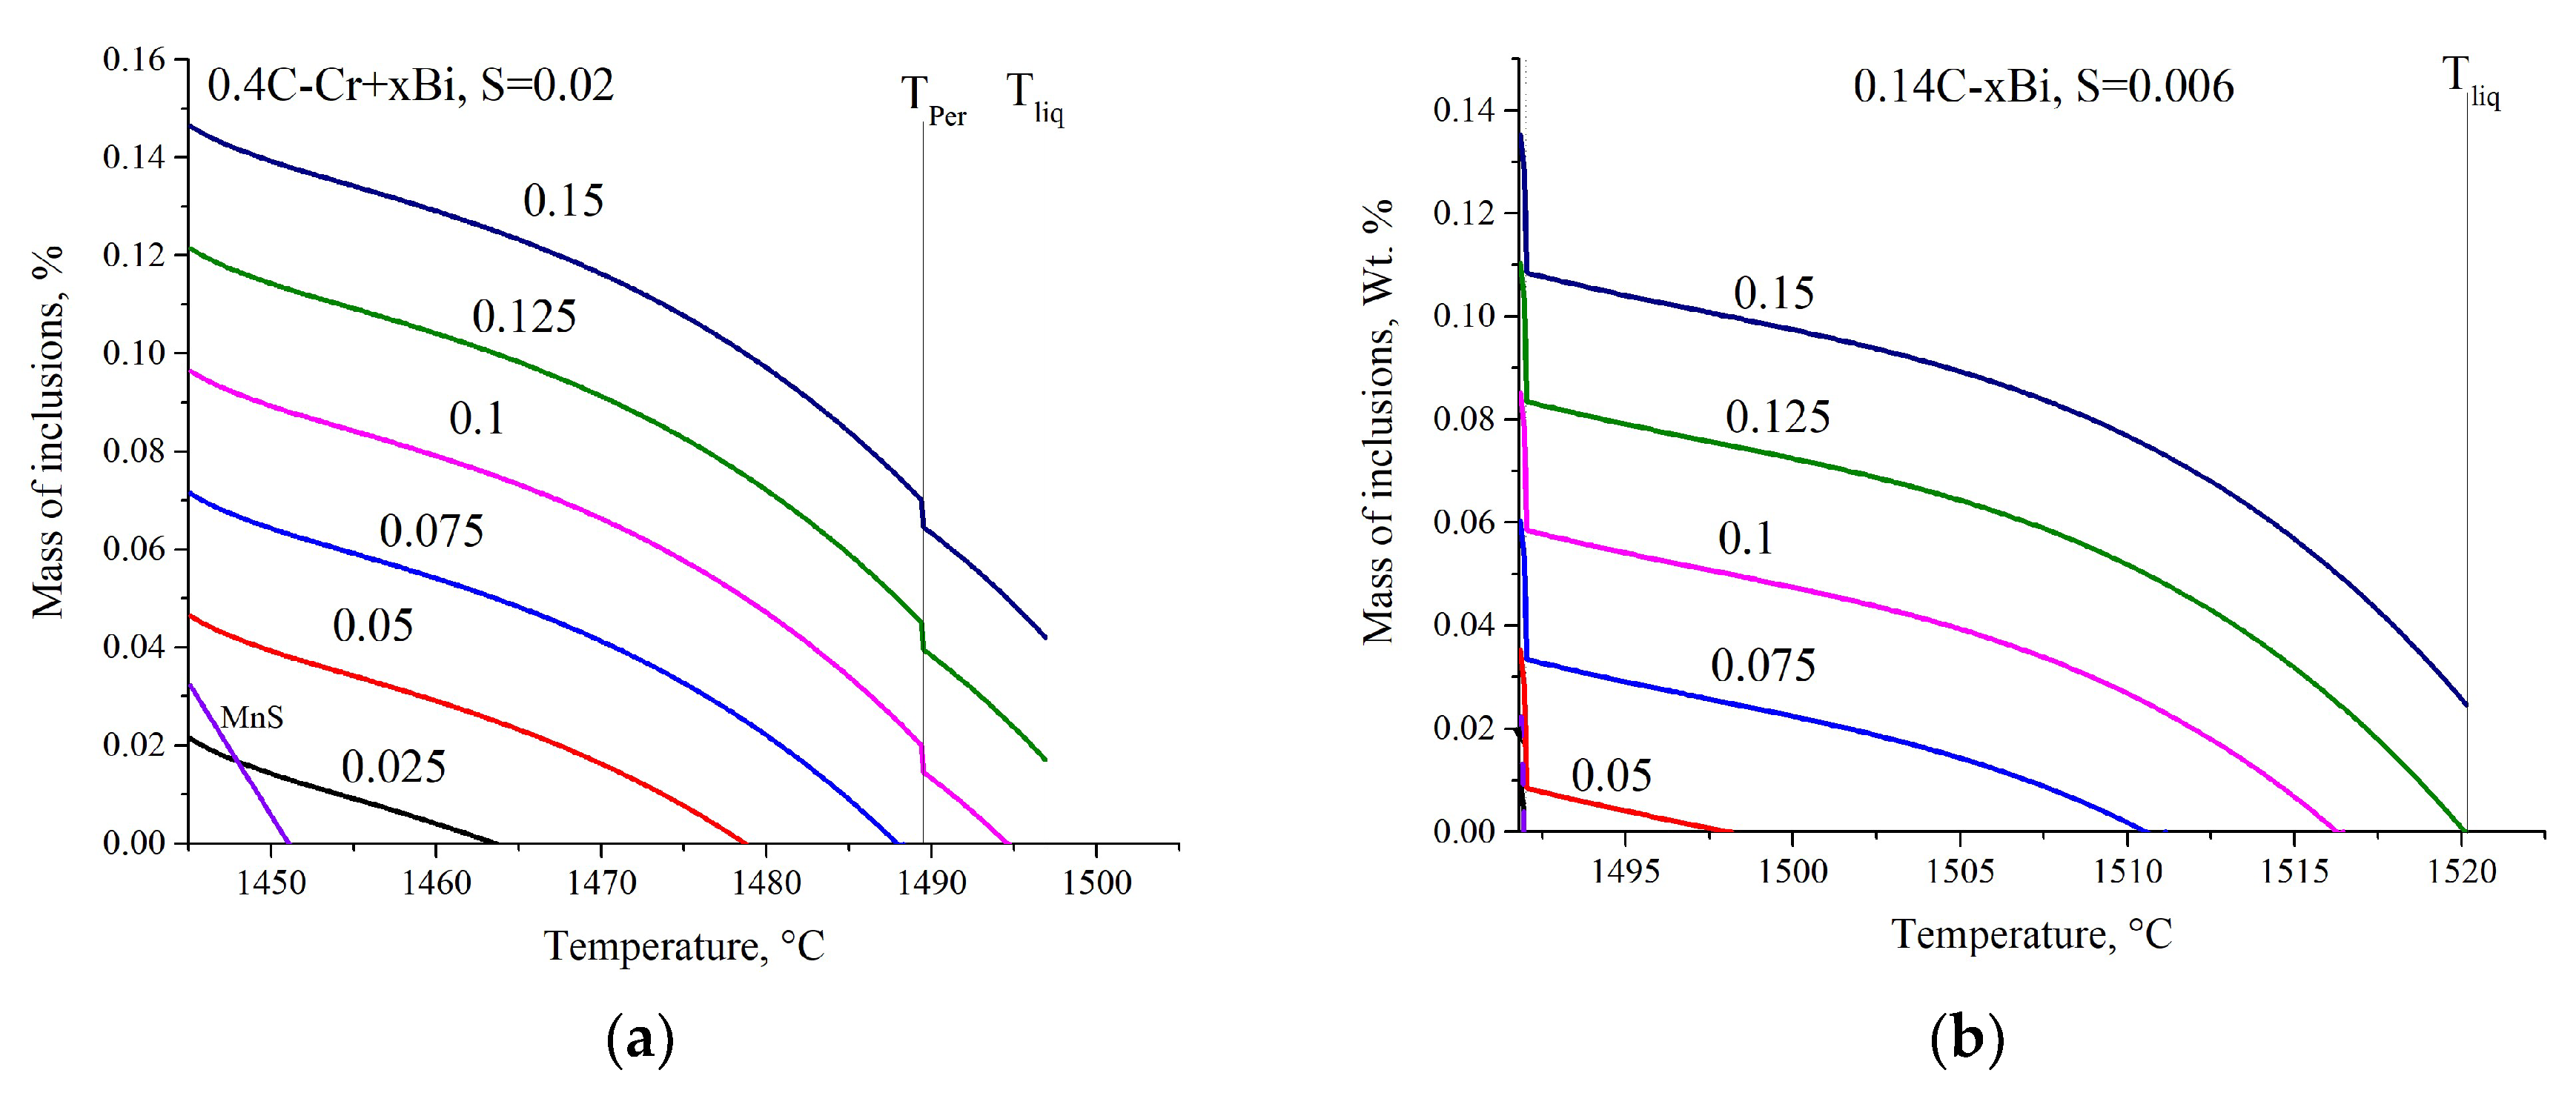
To analyze the behavior of the phases depending on the chemical composition, a series of calculations was carried out (Figure 4) for 0.4C-Cr and 0.14C steels with different contents of bismuth and sulfur. In both model steels, the trends in the behavior of bismuth during solidification are similar. At concentrations of bismuth less than 0.025%, it is not formed into an independent phase in the solidification interval, and with an increase in the initial concentration of bismuth, the temperature of the beginning of its formation rises. For steel 0.4C-Cr, the solubility limit of bismuth is lower than for steel 0.14C; therefore, already at a concentration of 0.125% Bi at the time of the beginning of solidification, bismuth is present in the form of pre-crystallization inclusions, the number of which increases with a further increase in its initial content. For 0.14C steel, this is observed at high bismuth contents. Both steels are also characterized by a sharp increase in the content of formed bismuth at the time of peritectic transformation. The formation of manganese sulfide in 0.4C-Cr steel occurs at the end of solidification.

3.2. Investigation of Laboratory Ingots

Real ingots, even of a relatively small size, are characterized by significant structural and chemical inhomogeneity. In this work, all ingots were obtained with the same technological parameters; therefore, let us consider in detail the structure of one of them, assuming that the structure is the same in the rest. Figure 5 shows an image of the dendritic structure in 0.4C-Cr steel alloyed with bismuth and sulfur.
The macrostructure presents all the main structural zones found in ingots (Figure 5a): equiaxed small crystals, columnar crystals, and misoriented and equiaxed crystals in the center.
The dendritic structure from the edge of the ingot (Figure 5b) is characterized by a columnar morphology due to growth along the direction of predominant heat removal to the cast iron mold under conditions of a high temperature gradient [26,34], as well as relatively small secondary dendritic arm spaces at 218 µm with a range of 158–360 µm. The local solidification time for this part of the ingot can be estimated from expression (17) at 92 s. In the central part of the ingot, the dendrites are misoriented (Figure 5c) since their formation occurs at a low temperature gradient under conditions of strong concentration supercooling [26]. Due to the longer local solidification time (208 s) in this part of the ingot, the average values of SDAS of 293 μm are greater in a range of 179–450 μm. The detected range of measured SDAS both at the edge of the ingot and in its center is associated with uneven processes of diffusion coalescence of dendritic arms [35,36]. The coarsest dendritic structure was found in the top part of the ingot, where the SDAS reaches an average value of 316 μm in a range of 240–450 μm. The local solidification time is 256 s.
The results of the evaluation of inclusions of sulfides and bismuth are shown in Table 4. Since they are formed during solidification, their distribution over experimental ingots depends on the features of the cast structure [34]. All ingots are characterized by an increase in the volume fraction of inclusions from the edge to the center and to the top; however, depending on the addition of elements to improve machinability, these dependencies are somewhat different.
So, in steel 0.4C-Cr without sulfur (Table 4, lines 1 and 2), from the edge of the ingot to its center and then to the upper part, the volume fraction V, %, increases; the distribution density N, 1/mm2, slightly decreases; and the average size d, μm, of inclusions and the size dmax, μm, of the largest inclusions increase. This is fully consistent with the concept of the nucleation and growth of inclusions, when, as the solidification time increases, and, as a result, the SDAS increases too, the intensity of nucleation decreases, and the growth time of inclusions increases [37,38]. In the upper parts of ingots made of these steels, the volume fraction is much higher, and, apparently, its value is determined not only by the conditions of steel cooling and solidification, but also by the movement of bismuth particles along with liquid steel flows [39]. In addition, when measuring the volume fraction at the top, there was the largest measurement error, which is associated with a highly inhomogeneous distribution of inclusions in these metal volumes [40].
There is a different nature of the distribution in the ingot of steel 0.4C-Cr, alloyed with both bismuth and sulfur (Table 4, line 3). There are many more inclusions in this ingot, primarily due to the intensive formation of sulfides. The increase in the volume fraction, distribution density, and size of inclusions is more visible, which is associated with a significantly stronger segregation of sulfur [34], compared to other elements, and with its lowest partition coefficient (Table 3).
In 0.14C steel under the same cooling conditions, due to the lower carbon concentration, SDAS values are much lower [27] (Table 4). However, despite this, the number, size, and nature of the distribution of inclusions are practically the same as those in 0.4C-Cr steel alloyed with different amounts of bismuth.
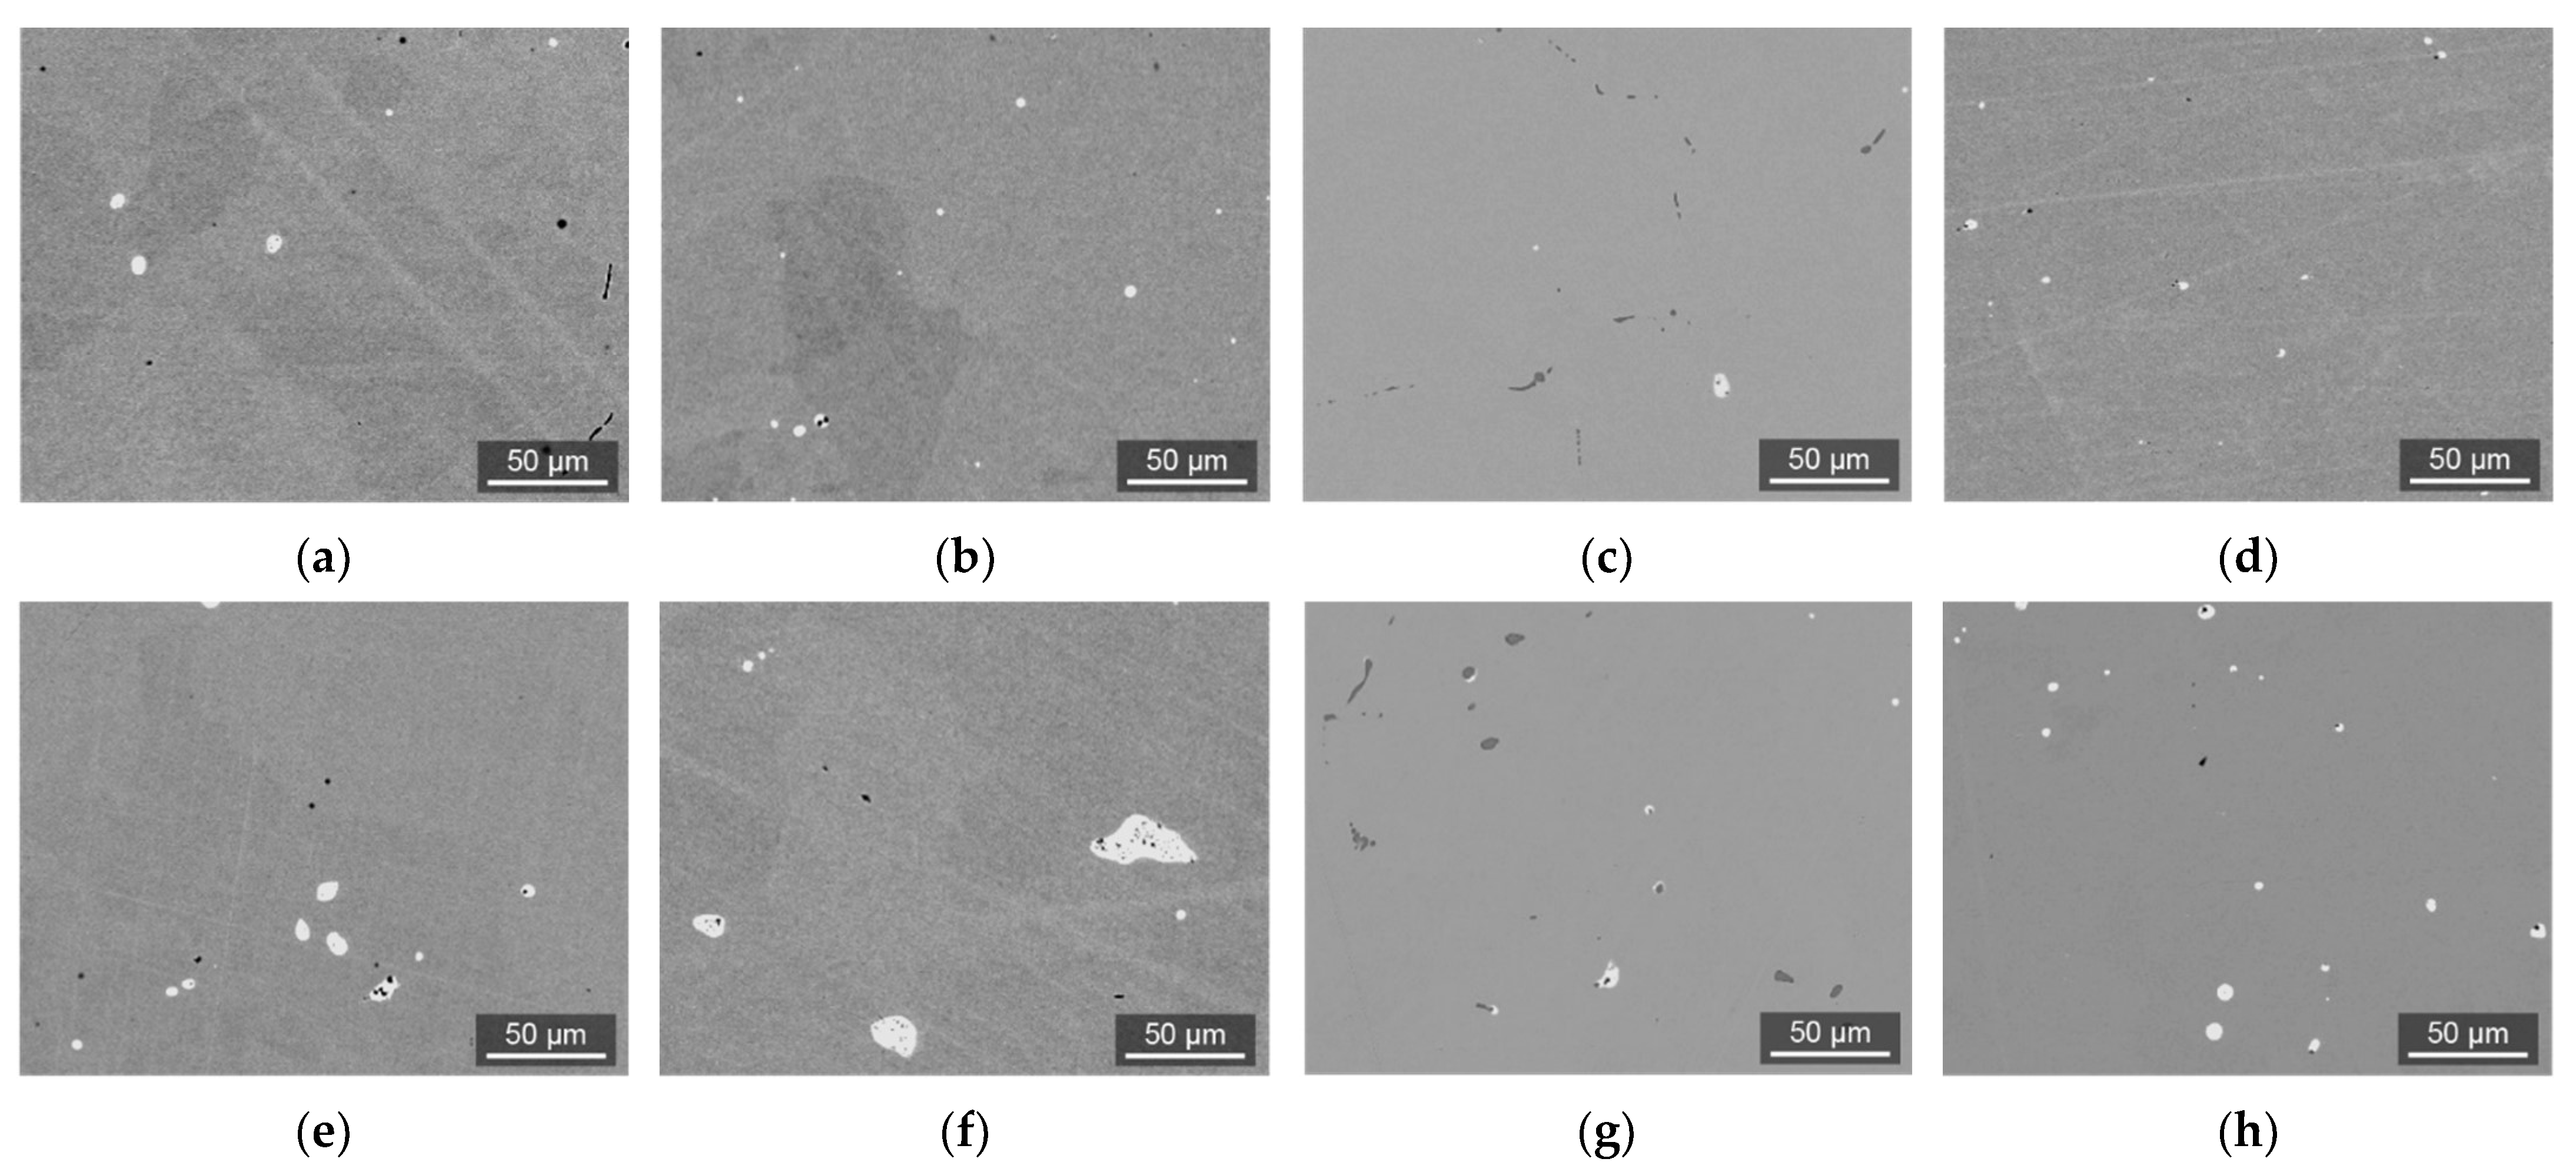
Depending on the position in the ingot, there are changes in not only the number and size of inclusions, but also their morphology. The morphology of inclusions was analyzed using an electron microscope in the back-scattered electron mode, in which heavy bismuth particles look lighter than the matrix, while the remaining inclusions are darker (Figure 6). In 0.4C-Cr steel with a different bismuth content, the morphology of inclusions in different parts of the ingot is almost the same (Figure 6a,b,e,f). Inclusions are mostly rounded. In steel 0.4C-Cr with bismuth and sulfur (Figure 6c,g), light inclusions of bismuth are located next to sulfides located in chains along the boundaries of cast grains. In the top part of this ingot, eutectic precipitates of sulfides are found. In steel 0.14C (Figure 6d,h), bismuth inclusions are globular throughout the ingot.
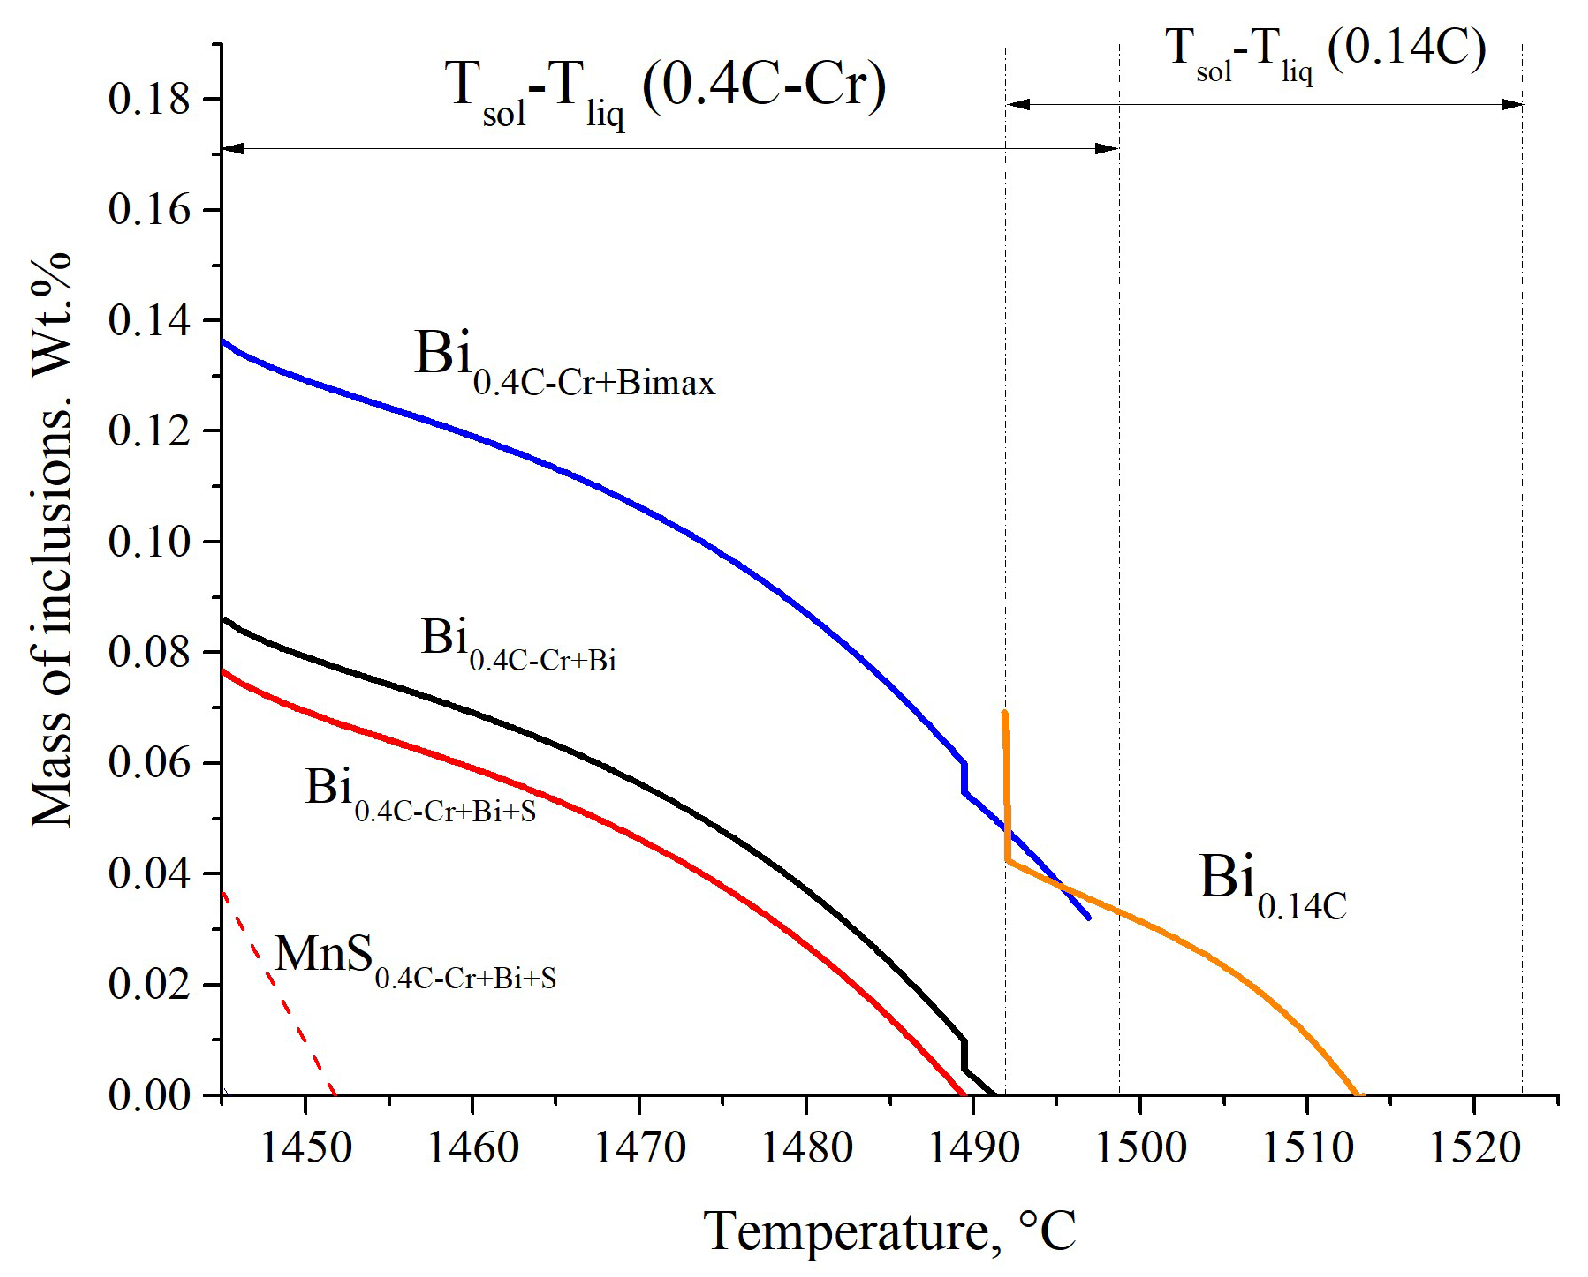
Let us analyze the obtained results together with the results of thermodynamic modeling for experimental steels (Figure 7) and consider the process of formation of bismuth and sulfides in various modifications of 0.4C-Cr steel.
In steel 1 with a bismuth content of 0.08%, the formation of its particles occurs at the beginning of crystallization at the stage of formation of δ-ferrite dendrites (black line in Figure 7). When the peritectic transformation temperature is reached, bismuth is formed abruptly, after which the increase in its amount occurs almost monotonously. At the end of solidification, the mass of the formed bismuth is 0.088%. In steel 2 (0.4C-Cr + Bimax) containing 0.14% Bi, the formation of bismuth particles occurs at a temperature higher than the liquidus temperature since its solubility in liquid steel is exceeded. Therefore, even though for this steel the predicted amount of bismuth at the end of solidification is 0.135% (blue line in Figure 7), which is higher than for steel 1 with 0.08% bismuth, the actually measured volume fraction of bismuth in these steels is almost the same. Apparently, with the addition of such high contents of bismuth, which forms an independent phase before the onset of solidification, the nature of the distribution of these primary and secondary inclusions is determined not only by the conditions of solidification and the features of the cast structure, but also by the conditions of mixing of liquid steel [20]. Particles formed at high temperatures can be easily entrapped by convective steel flows [40,41] and redistributed over the volume of the ingot, forming macrosegregations. This hypothesis is confirmed by the fact that large particles of bismuth were found in the upper part of the 0.4C-Cr + Bimax ingot, the nature of which is directly related to the technology of adding bismuth under the flow of poured metal into the ladle (Figure 8). Inside a large inclusion in steel with the largest amount of added bismuth, Al2O3 inclusions were found. The mechanism for the formation of these inclusions is as follows: A large fragment of bismuth shot, falling into liquid steel, is captured by steel flows and is carried deep into the ladle. After its melting, it does not have time to leave, but coagulates with corundum inclusions existing after deoxidation, which are enveloped in bismuth due to surface tension forces.
In steel 0.4C-Cr + Bi + S (red lines in Figure 7) with 0.08% bismuth and 0.02% sulfur, the formation of bismuth into an independent phase occurs at the moment of peritectic transformation, and the formation of manganese sulfide at the end of solidification, when there is enough segregation of sulfur and manganese, takes place to an exact extent. In this steel, up to 0.04% MnS is formed, which explains the high volume fraction of inclusions.
In steel 0.14C (yellow line in Figure 7) with 0.08% bismuth, the formation of bismuth particles started in the middle of solidification, and this is due to the low temperature of the peritectic transformation, at which time 0.055% bismuth is formed, and the remaining part proceeds at the very last moment of crystallization, and this process is partially suppressed [27].
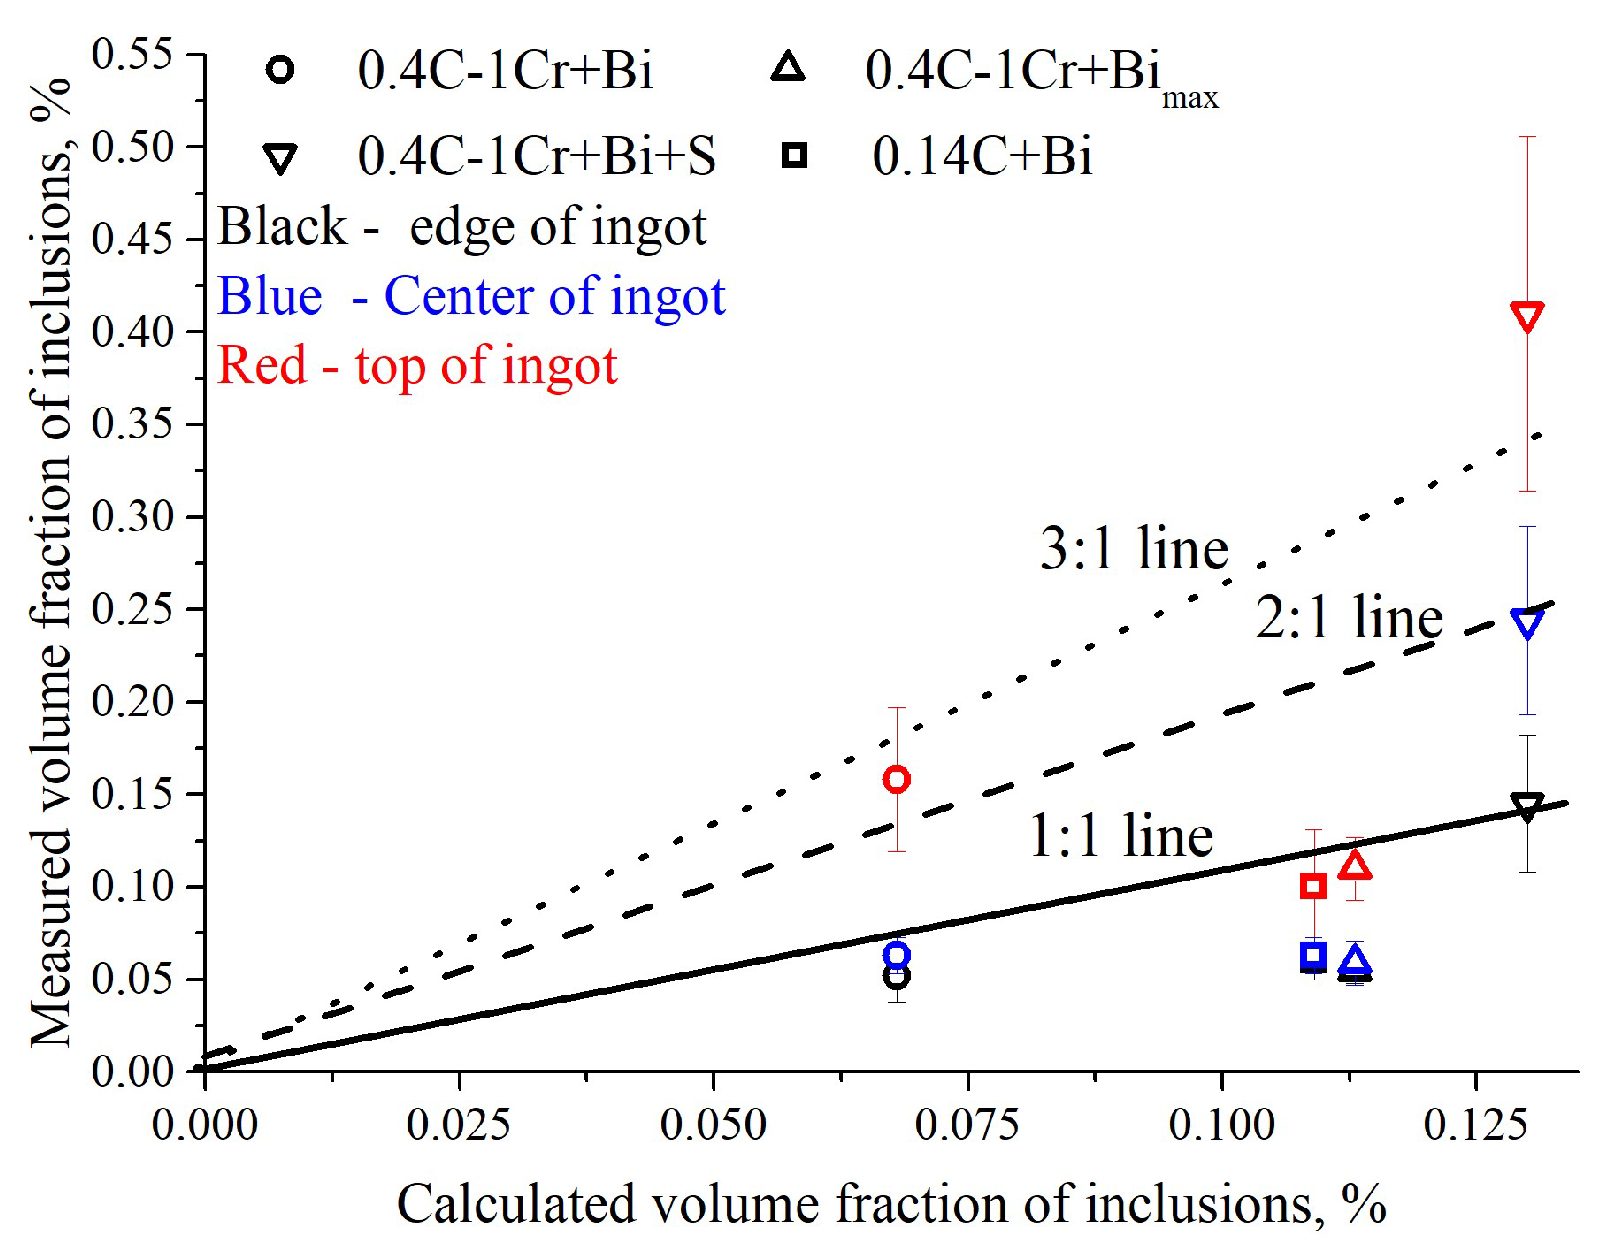
In order to more fully assess the predictive capability of the developed model, the results of estimating the volume fraction in ingots with the modeling results were compared. For this, the total mass of inclusions in Figure 7 for each steel was recalculated into volume fraction, taking into account the density of manganese sulfide and bismuth, and these values are compared in Figure 9.
For samples from the edge of the ingot and from the center of the ingot in the upper horizon, in general, the model reliably predicts the number of formed inclusions. Note that an increase in SDAS does not greatly affect the total number of inclusions, since this increases both the local solidification time and, accordingly, the back-diffusion time. The experimental points are somewhat below the 1:1 line since the selection of inclusions is not completely compared to the prediction. Thus, the Ohnaka and Sheil models are suitable for describing the microsegregation in steel with bismuth, taking into account its formation into an independent phase, but further experimental refinement of the equilibrium distribution coefficient of bismuth for δ-ferrite and austenite, as well as refinement of its diffusion coefficient, is required.
At the same time, in the top part of the ingot, there are many more inclusions, and their distribution is highly non-uniform. In this part of ingot, the local solidification time is much higher, and the influence is exerted by the mixing conditions of the metal, as well as the fact that in this part there are the last portions of liquid steel from the pouring ladle, where bismuth with greater density can descend.
Therefore, the general trend towards an increase in the number of inclusions in the top part with an increase in the forecast values remains, but the absolute value is 2 or 3 times higher. These experimental data can serve to predict the behavior of bismuth in commercial ingots and billets, but for more reliable modeling, it is necessary to implement specific models that take into account the convective transfer of particles within the melt, as well as macrosegregation models.

4. Conclusions

In this paper, a thermodynamic model was developed to predict the behavior of bismuth and manganese sulfide in liquid and solidifying steel. This makes it possible to obtain the required particle content in free-cutting steel to improve machinability.
  • An analysis of the known thermodynamic data on the solubility of bismuth and on the influence of other elements included in steels with improved machinability was carried out. Based on this analysis, mutually consistent thermodynamic data were obtained, making it possible to predict the solubility of bismuth not only in pure iron, but also in multicomponent steel. In addition, the partition coefficient of bismuth during solidification was estimated.
  • These data were used to create a thermodynamic model for the formation of bismuth into an independent phase during solidification in the Ohnaka model for steel components and in the Sheil equation for bismuth. The model also takes into account the formation of manganese sulfide.
  • The series of calculations carried out shows how the solubility of bismuth and the amount of bismuth formed as an independent phase change depending on the composition of the steel, on the amount of alloying elements, and on the amount of added bismuth and sulfur.
  • An experiment was carried out to obtain steels with bismuth and sulfur, and a comparison of the results of this experiment with the forecast of the developed model was performed.
  • Modeling adequately describes the behavior of bismuth during solidification and makes it possible to predict its amount. However, for the upper part of the ingot, where the formation of macrosegregation occurs, the model is not suitable, but the experimental data obtained make it possible to predict the appearance of large bismuth inclusions in industrial continuously cast billets.

Author Contributions

Conceptualization, A.Z.; methodology, A.Z., A.R., N.S. and S.R.; software, A.R. and S.R.; validation, A.R., N.S., A.A. and A.Z., investigation A.R., D.N. and A.A.; formal analysis, A.Z., N.S. and A.A.; writing—original draft preparation, A.R., S.R., N.S. and A.A.; writing—review and editing, A.Z.; visualization, A.R. and D.N.; project administration, A.A. and N.S.; funding acquisition, N.S. All authors have read and agreed to the published version of the manuscript.

Funding

This research was partially funded by the Ministry of Science and Higher Education of the Russian Federation under the strategic academic leadership program “Priority 2030” (agreement 075-15-2021-1333, dated 30 September 2021).

Institutional Review Board Statement

Not applicable.

Informed Consent Statement

Not applicable.

Data Availability Statement

Not applicable.

Conflicts of Interest

The authors declare no conflict of interest.

References

  1. Grigoriev, S.N.; Bobrovskij, N.M.; Melnikov, P.A.; Bobrovskij, I.N.; Levitskih, O.O. Ecological and Toxicological Characteristics of Metalworking Fluids Used in Finishing Processing in Russian Federation. IOP Conf. Ser. Earth Environ. Sci. 2017, 66, 012012. [Google Scholar] [CrossRef] [Green Version]
  2. Luiz, N.E.; Machado, A.R. Development trends and review of free-machining steels. J. Eng. Manuf. 2008, 222, 347–360. [Google Scholar] [CrossRef]
  3. Xie, J.; Fan, T.; Zeng, Z.; Sun, H.; Fu, J. Bi-Sulfide Existence in 0Cr18Ni9 Steel: Correlation with Machinability and Mechanical Properties. J. Mater. Res. Technol. 2020, 9, 9142–9152. [Google Scholar] [CrossRef]
  4. Hashimura, M.; Mizuno, A.; Miyanishi, K. Development of Low-Carbon Lead-Free Free-Cutting Steel Friendly to Environment. Nippon. Steel Tech. Rep. 2007, 96, 45–49. [Google Scholar]
  5. Shen, P.; Yang, Q.; Zhang, D.; Yang, S.; Fu, J. The Effect of Tellurium on the Formation of MnTe-MnS Composite Inclusions in Non-Quenched and Tempered Steel. Metals 2018, 8, 639. [Google Scholar] [CrossRef] [Green Version]
  6. Wang, F.; Guo, H.; Liu, W.; Yang, S.; Zhang, S.; Li, J. Control of MnS Inclusions in High- and Low-Sulfur Steel by Tellurium Treatment. Materials 2019, 12, 1034. [Google Scholar] [CrossRef] [Green Version]
  7. Zivkovic, D.; Štrbac, N.; Ekinovic, S.; Begović, E. Lead-free free-cutting steels as modern environmentally friendly materials. Ecologica 2011, 18, 451–456. [Google Scholar]
  8. POSCO Succeeds in Mass-Producing Clean Steel. Available online: https://www.azovpromstal.com/news/one/id/8299 (accessed on 25 August 2022).
  9. You, D.; Michelic, S.; Wieser, G.; Bernhard, C. Modeling of Manganese Sulfide Formation during the Solidification of Steel. J. Mater. Sci. 2017, 52, 1797–1812. [Google Scholar] [CrossRef] [Green Version]
  10. Kontanistov, M.E.; Terletskii, S.V.; Shatilo, V.A. The influence of the chemical composition of steel, the state of melts equipment and casting process parameters on the occurrence of surface and internal defects of continuous casting billets. Litye I Met. Foundry Prod. Metall. 2013, 1, 28–31. [Google Scholar]
  11. Maciejewski, J. The Effects of Sulfide Inclusions on Mechanical Properties and Failures of Steel Components. J. Fail. Anal. Preven 2015, 15, 169–178. [Google Scholar] [CrossRef] [Green Version]
  12. Biswas, D.K.; Venkatraman, M.; Narendranath, C.S.; Chatterjee, U.K. Influence of Sulfide Inclusion on Ductility and Fracture Behavior of Resulfurized HY-80 Steel. Metall. Mater. Trans. A 1992, 23, 1479–1492. [Google Scholar] [CrossRef]
  13. DeArdo, A.J.; Hamburg, E.G. Influence of elongated inclusions on the mechanical properties of high strength steel plate, in Sulfide Inclusions in Steel. In Proceedings of an International Symposium; American Society for Metals: Novelty, OH, USA, 1975. [Google Scholar]
  14. Bellot, J.; Gantois, M. The influence of ‘sulfide-type’ inclusions on the mechanical properties of construction steels. Trans. Iron Steel Inst. 1978, 18, 546–553. [Google Scholar] [CrossRef] [Green Version]
  15. Spitzig, W.A. Effect of Sulfides and Sulfide Morphology on Anisotropy of Tensile Ductility and Toughness of Hot-Rolled C-Mn Steels. Metall. Mater. Trans. A 1983, 14, 471–484. [Google Scholar] [CrossRef]
  16. Xiao, G.; Dong, H.; Wang, M.; Hui, W. Effect of Sulfur Content and Sulfide Shape on Fracture Ductility in Case Hardening Steel. J. Iron Steel Res. 2011, 18, 58–64. [Google Scholar] [CrossRef]
  17. For instance, “Guideline for Honda Green Purchase”. Purchase Center, Honda Motor Co., Ltd.: Tokyo, Japan, 2001.
  18. Tellurium-Futures Contract-Prices|2017-2022 Data|2023-2024 Forecast. Available online: https://ru.tradingeconomics.com/commodity/tellurium (accessed on 25 August 2022).
  19. Wang, Z.; Shao, Z.; Li, Z.; Zhang, H.; Wang, J.; Zhang, H.; Yuan, J. Making of Free Cutting Austenitic Stainless Steels with Additions of Sulfur. Rare Earth Bismuth 2015. [Google Scholar] [CrossRef] [Green Version]
  20. Ryabov, A.V.; Povolotsky, D.Y.; Ryabov, V.V. Bismuth assimilation during alloying of machine steel in the process of siphon casting. Izv. Chelyabinskogo Nauchnogo Tsentra News Chelyabinsk Sci. Cent. 2001, 1, 81–90. [Google Scholar]
  21. Ryabov, A.V.; Chumanov, I.V. Possibility of Making New Easy-to-Cut Corrosion-Resistant Steel. Russ. Metall. 2012, 12, 1065–1067. [Google Scholar] [CrossRef]
  22. Ryabov, A.V. Solubility of fusible, oxidizing and volatile elements in iron-based alloys. Vestnik Yuzhno-Uralskogo gosudarstvennogo universiteta Seriya. Metallurgiya 2014, 14, 3. [Google Scholar]
  23. Liu, H.; Chen, W.; Li, W.; Yu, Y. Solubility of Bismuth in Liquid Bi-S Based Free Cutting Steel. High Temp. Mater. Process. 2014, 33, 187–191. [Google Scholar] [CrossRef]
  24. Kazakov, A.; Kiselev, D. Industrial application of Thixomet image analyzer for quantitative description of steel and alloy’s microstructure. Metallogr. Microstruct. Anal. 2016, 5, 294–301. [Google Scholar] [CrossRef]
  25. Grigoryan, V.A. Physical and Chemical Calculations of Electric Steelmaking Processes; Textbook for Universities; Metallurgiya (Metallurgy): Barnaul, Russia, 1989; p. 288. [Google Scholar]
  26. Kurz, W.; Fisher, D.J. Fundamentals of Solidification; Trans Tech Publications: Wollerau, Switzerland, 1984; ISBN 0-87849-523-3. [Google Scholar]
  27. Young-Mok, W.; Brian, G.T. Simple Model of Microsegregation during Solidification of Steels. Metall. Mater. Trans. 2001, 32, 1755. [Google Scholar]
  28. Zhitenev, A.; Salynova, M.; Shamshurin, A.; Ryaboshuk, S.; Kolnyshenko, V. Database Clustering after Automatic Feature Analysis of Nonmetallic Inclusions in Steel. Metals 2021, 11, 1650. [Google Scholar] [CrossRef]
  29. Ryabov, A.V. Solubility of bismuth and lead in liquid and solid iron. Vestnik YuUrGU. Seriya Metall. 2013, 13, 2. [Google Scholar]
  30. Liu, H.; Hu, D.; Fu, J. Analysis of MnS Inclusions Formation in Resulphurised Steel via Modeling and Experiments. Materials 2019, 12, 2028. [Google Scholar] [CrossRef] [Green Version]
  31. Shu, Q.; Visuri, V.-V.; Alatarvas, T.; Fabritius, T. Model for Inclusion Precipitation Kinetics During Solidification of Steel Applications in MnS and TiN Inclusions. Metall. Mater. Trans. B 2020, 51, 2905–2916. [Google Scholar] [CrossRef]
  32. Shmrga, L. Solidification and crystallization of steel ingots; Metallurgiya (Metallurgy): Barnaul, Russia, 1985. [Google Scholar]
  33. FactSage.Com. Available online: https://www.factsage.com/ (accessed on 25 August 2022).
  34. Kazakov, A.A.; Zhitenev, A.I.; Kovalev, P.V. Distribution Pattern of Nonmetallic Inclusions on a Cross Section of Continuous-Cast Steel Billets for Rails. Microsc. Microanal. 2015, 21 (Suppl. 3), 1751–1752. [Google Scholar] [CrossRef] [Green Version]
  35. Golod, V.M.; Emelyanov, K.I. System analysis of morphological evolution of dendritic structure of steel. Chernyye Met. 2014, 4, 988. [Google Scholar]
  36. Golod, V.M. Evolution of filtration permeability of dendrite structure in the conditions of capillary-diffusion coalescency of the secondary side branches. Eur. Phys. J. Spec. Top. 2020, 229, 225–237. [Google Scholar] [CrossRef]
  37. Luo, S.; Wang, B.; Wang, Z.; Jiang, D.; Wang, W.; Zhu, M. Morphology of Solidification Structure and MnS Inclusion in High Carbon Steel Continuously Cast Bloom. ISIJ Int. 2017, 57, 2000–2009. [Google Scholar] [CrossRef] [Green Version]
  38. You, D.; Michelic, S.K.; Bernhard, C.; Loder, D.; Wieser, G. Modeling of Inclusion Formation during the Solidification of Steel. ISIJ Int. 2016, 56, 1770–1778. [Google Scholar] [CrossRef] [Green Version]
  39. Gu, J.P.; Beckermann, C. Simulation of Convection and Macrosegregation in a Large Steel Ingot. Metall. Mater. Trans. Vol. 1999, 30, 1357. [Google Scholar] [CrossRef] [Green Version]
  40. Kazakov, A.A.; Zhitenev, A.I.; Salynova, M.A.; Kolpishon, E.Y. Nonmetallic inclusions quantitative assessment for forgings made from super large steel ingot. Chernye Met. 2018, 12, 50–56. [Google Scholar]
  41. Zhang, C.; Loucif, A.; Jahazi, M.; Morin, J.-B. FE Modelling and Prediction of Macrosegregation Patterns in Large Size Steel Ingots: Influence of Filling Rate. Metals 2022, 12, 29. [Google Scholar] [CrossRef]
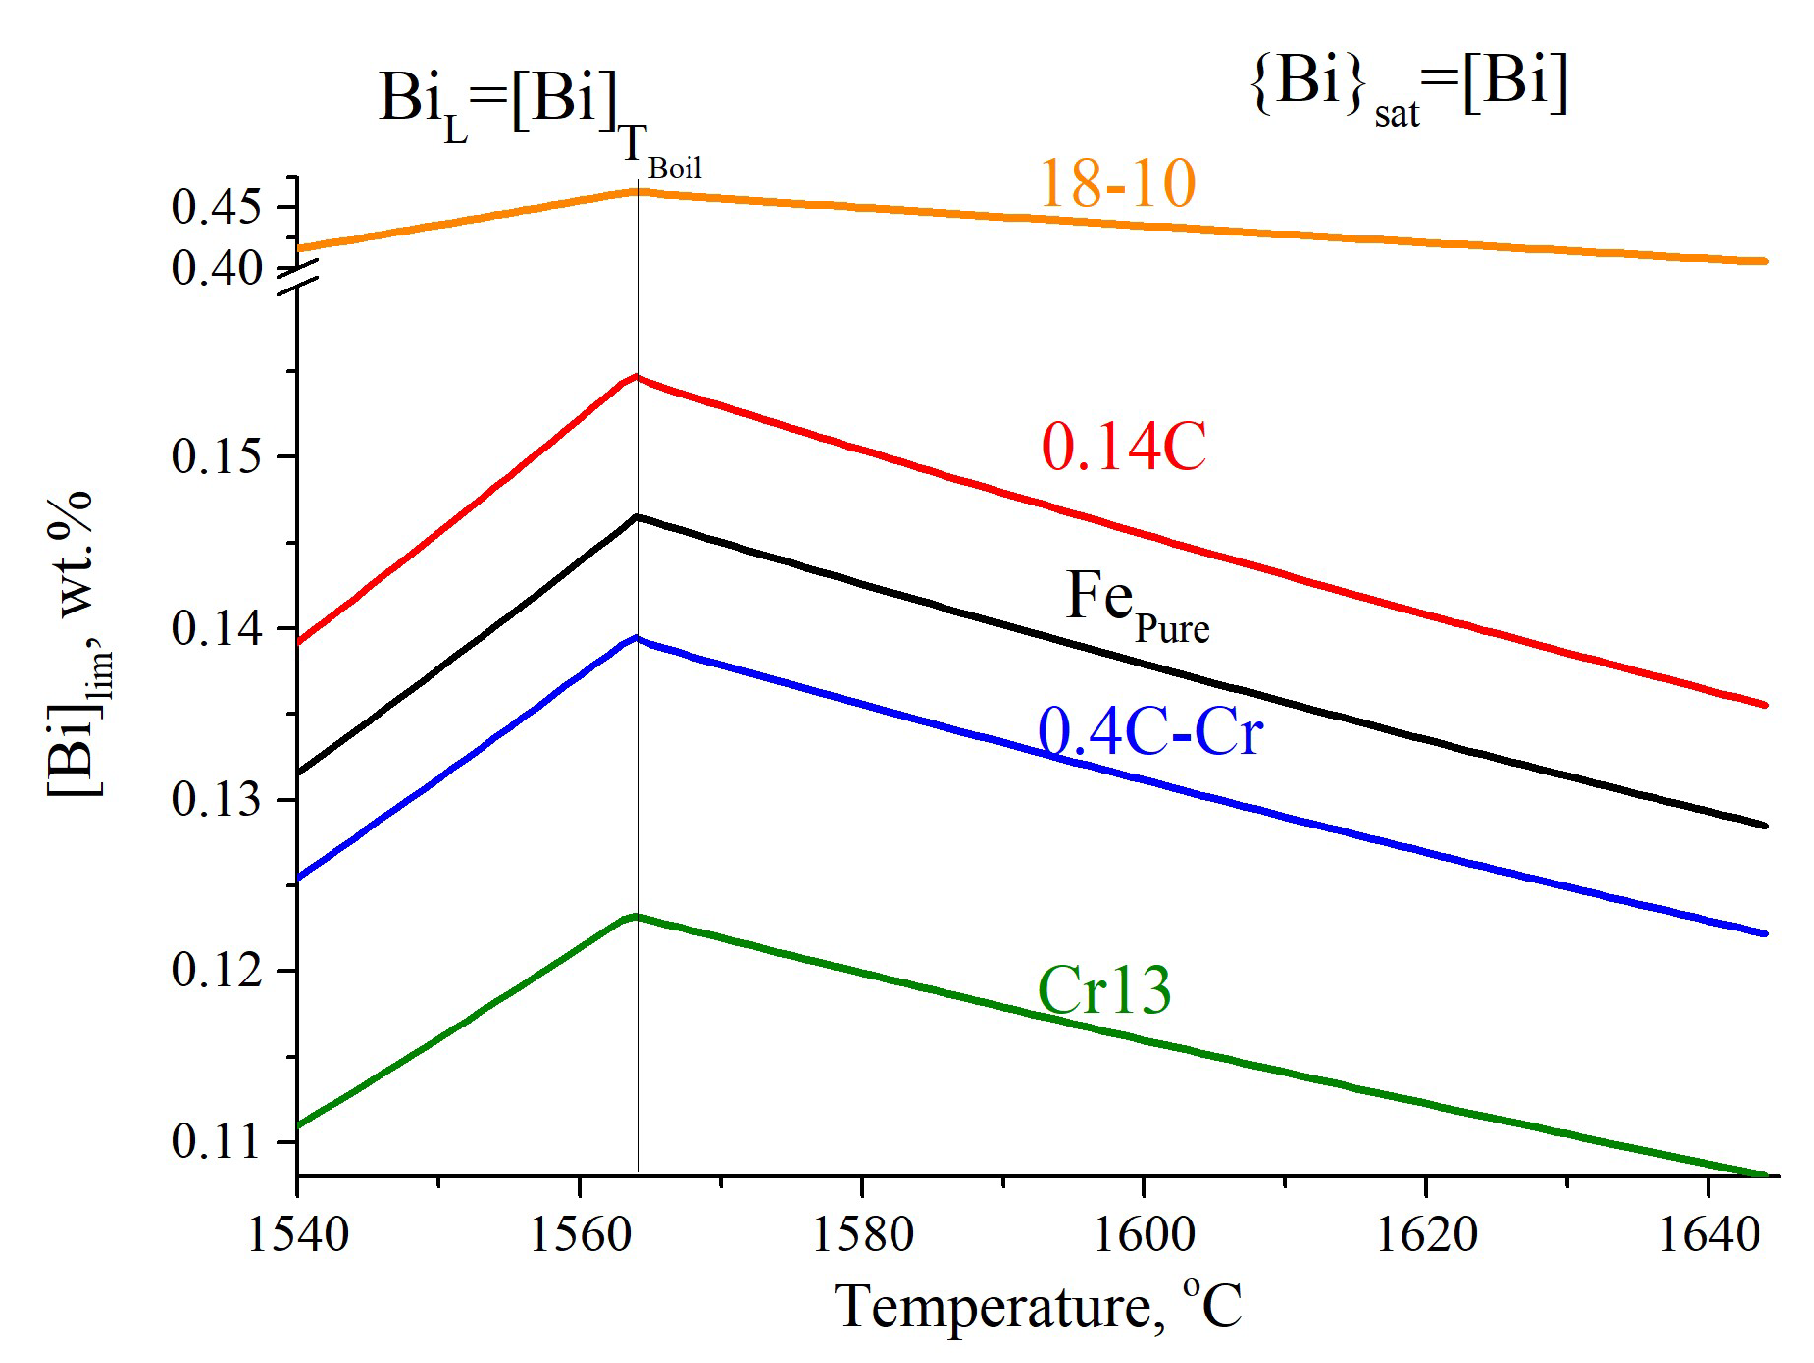
Figure 1. The influence of temperature on the bismuth solubility.
Metals 12 02076 g001
Figure 2. The influence of temperature on the liquid steel fraction (by ThermoCalc).
Metals 12 02076 g002
Figure 3. The dependence of the content of alloying elements in steel 0.4C-Cr + 0.08Bi (a) and the amount of formed bismuth and manganese sulfide (MnS) (b) on temperature.
Metals 12 02076 g003
Figure 4. Influence of the initial concentration of bismuth and sulfur on the formation of bismuth and sulfide particles in steel 0.4C-Cr (a) and 0.14C (b). The numbers near the curves are the corresponding concentrations of bismuth.
Metals 12 02076 g004
Figure 5. Macrostructure of 0.4C-Cr + Bi + S steel ingot. Full profile longitudinal template (a); columnar (b) and misoriented and equiaxed (c) crystals. Ingot (a) diameter is 90 mm on top and 80 mm on bottom.
Metals 12 02076 g005
Figure 6. Manganese sulfides (dark) and bismuth (light) in the experimental ingots on the edge (ad) and on central parts (eh) for steel 0.4C-Cr + Bi (a,e), 0.4C-Cr + Bimax (b,f), 0.4C-Cr + Bi + S (c,e), and 0.14C + Bi (d,h).
Metals 12 02076 g006
Figure 7. The dependence of the temperature of formation and the amount of formed particles of bismuth and manganese sulfide in experimental steels.
Metals 12 02076 g007
Figure 8. Al2O3-Bi complex inclusion and concentration maps of aluminum, bismuth, and oxygen in steel 0.4C-Cr.
Metals 12 02076 g008
Figure 9. Comparison of calculation and measurement results.
Metals 12 02076 g009
Table 1. The chemical composition of experimental steels.
SteelGradeElement, wt.%
CSiMnCrAlSBi
0.4C-Cr + Bi37Cr4 (EN 10083)0.360.190.710.940.060.00480.09
0.4C-Cr + Bimax0.360.270.740.930.0370.00550.14
0.4C-Cr + Bi + S0.400.250.780.970.050.0220.08
0.14C + Bi9SMn28 (EN10277-3)0.130.070.780.10.030.00580.08
Table 2. First-order interaction parameters.
Headinge(i, j)Element
CSiMnCrNiS
1Bi0.0884 10.1148 2−0.0512 20.0011 2−0.052 2-
2S0.11 30.063 3−0.026 3−0.011 30 3−0.028 3
3Mn−0.07 30 30 3--−0.048 3
1—[21], 2—[23], 3—[30]
Table 3. Equilibrium partition coefficients of elements and temperature dependences of diffusion coefficients.
Element kδkƳDδ (10−4m2/s)DƳ (10−4m2/s)
C0.200.350.0127exp(−81 379/RT)0.15exp(−143 511/RT)
Si0.770.528.0exp(−248 700/RT)0.30exp(−251 218/RT)
Mn0.760.780.76exp(−224 430/RT)0.055exp(−249 366/RT)
S0.050.0354.56exp(−214 434/RT)2.4exp(−212 232/RT)
Cr0.950.862.4exp(−239 800/RT)0.0012exp(−219 000/RT)
Bi0.14Diffusion suppressed
Table 4. Results of evaluation of the parameters of the cast structure and inclusions in experimental ingots.
#Steel GradeEdge CenterTop
V, %N,
1/mm2
d,
μm
dmax,
μm
V, %N,
1/mm2
d,
μm
dmax,
μm
V,
%
N,
1/mm2
d,
μm
dmax,
μm
λ2 = 218 μmλ2 = 293 μmλ2 = 316 μm
10.4C-Cr + Bi0.051172.65,80.061152.96.90.165891.727
20.4C-Cr + Bimax0.061252.3140.061062.5160.114571.717
30.4C-Cr + Bi + S0.152442.7210.246682.1190.4164120.814
λ2 = 88 μmλ2 = 132 μmλ2 = 146 μm
40.14C + Bi0.061512150.061502160.104601.49
Publisher’s Note: MDPI stays neutral with regard to jurisdictional claims in published maps and institutional affiliations.