Author Contributions
Conceptualisation, A.G. and U.M.; investigation, A.G. and U.M.; methodology, A.G. and U.M.; formal analysis, A.G. and U.M.; visualisation, A.G. and V.L.B.; data curation, A.G. and V.L.B.; writing—original draft, A.G. and U.M.; writing—review and editing, A.G., U.M. and V.L.B.; supervision, P.C. All authors have read and agreed to the published version of the manuscript.
Figure 1.
Scheme of the heat treatment cycle performed on the specimens (RT—Room Temperature, 20 °C).
Figure 2.
Technical drawing of the finished ground and polished specimen.
Figure 3.
(a) Scheme of the eight stations rotating fatigue machine; (b) clamping system for the specimen.
Figure 4.
Microstructure analysis: (a) core microstructure example of nitrided and untreated specimen 500×; (b) compound layer and diffusion zone 200×; (c) compound layer detail with nitriding lamellae generated 500× after Nital 2% etching; (d) core microstructure of the untreated material specimen 500× after Nital 2% etching.
Figure 5.
Nitriding depth curves for the ground and polished section (black line) and the not-final ground section (blue dashed line).
Figure 6.
Complete staircase results of untreated specimens.
Figure 7.
Complete staircase results of nitrided specimens.
Figure 8.
S/N curve of untreated and nitrided specimens.
Figure 9.
Surface fracture analysis: (a) example of final fracture surface for the untreated specimen, stereoscopic image 10×; (b) 25×; (c) detail of the morphology of the broken crash area within the fatigue propagation zone (identified by the white arrow in (b)).
Figure 10.
(a) Brittle fracture at the core of the untreated specimen. (b) Ductile fracture of the tensile specimen with few brittle zones.
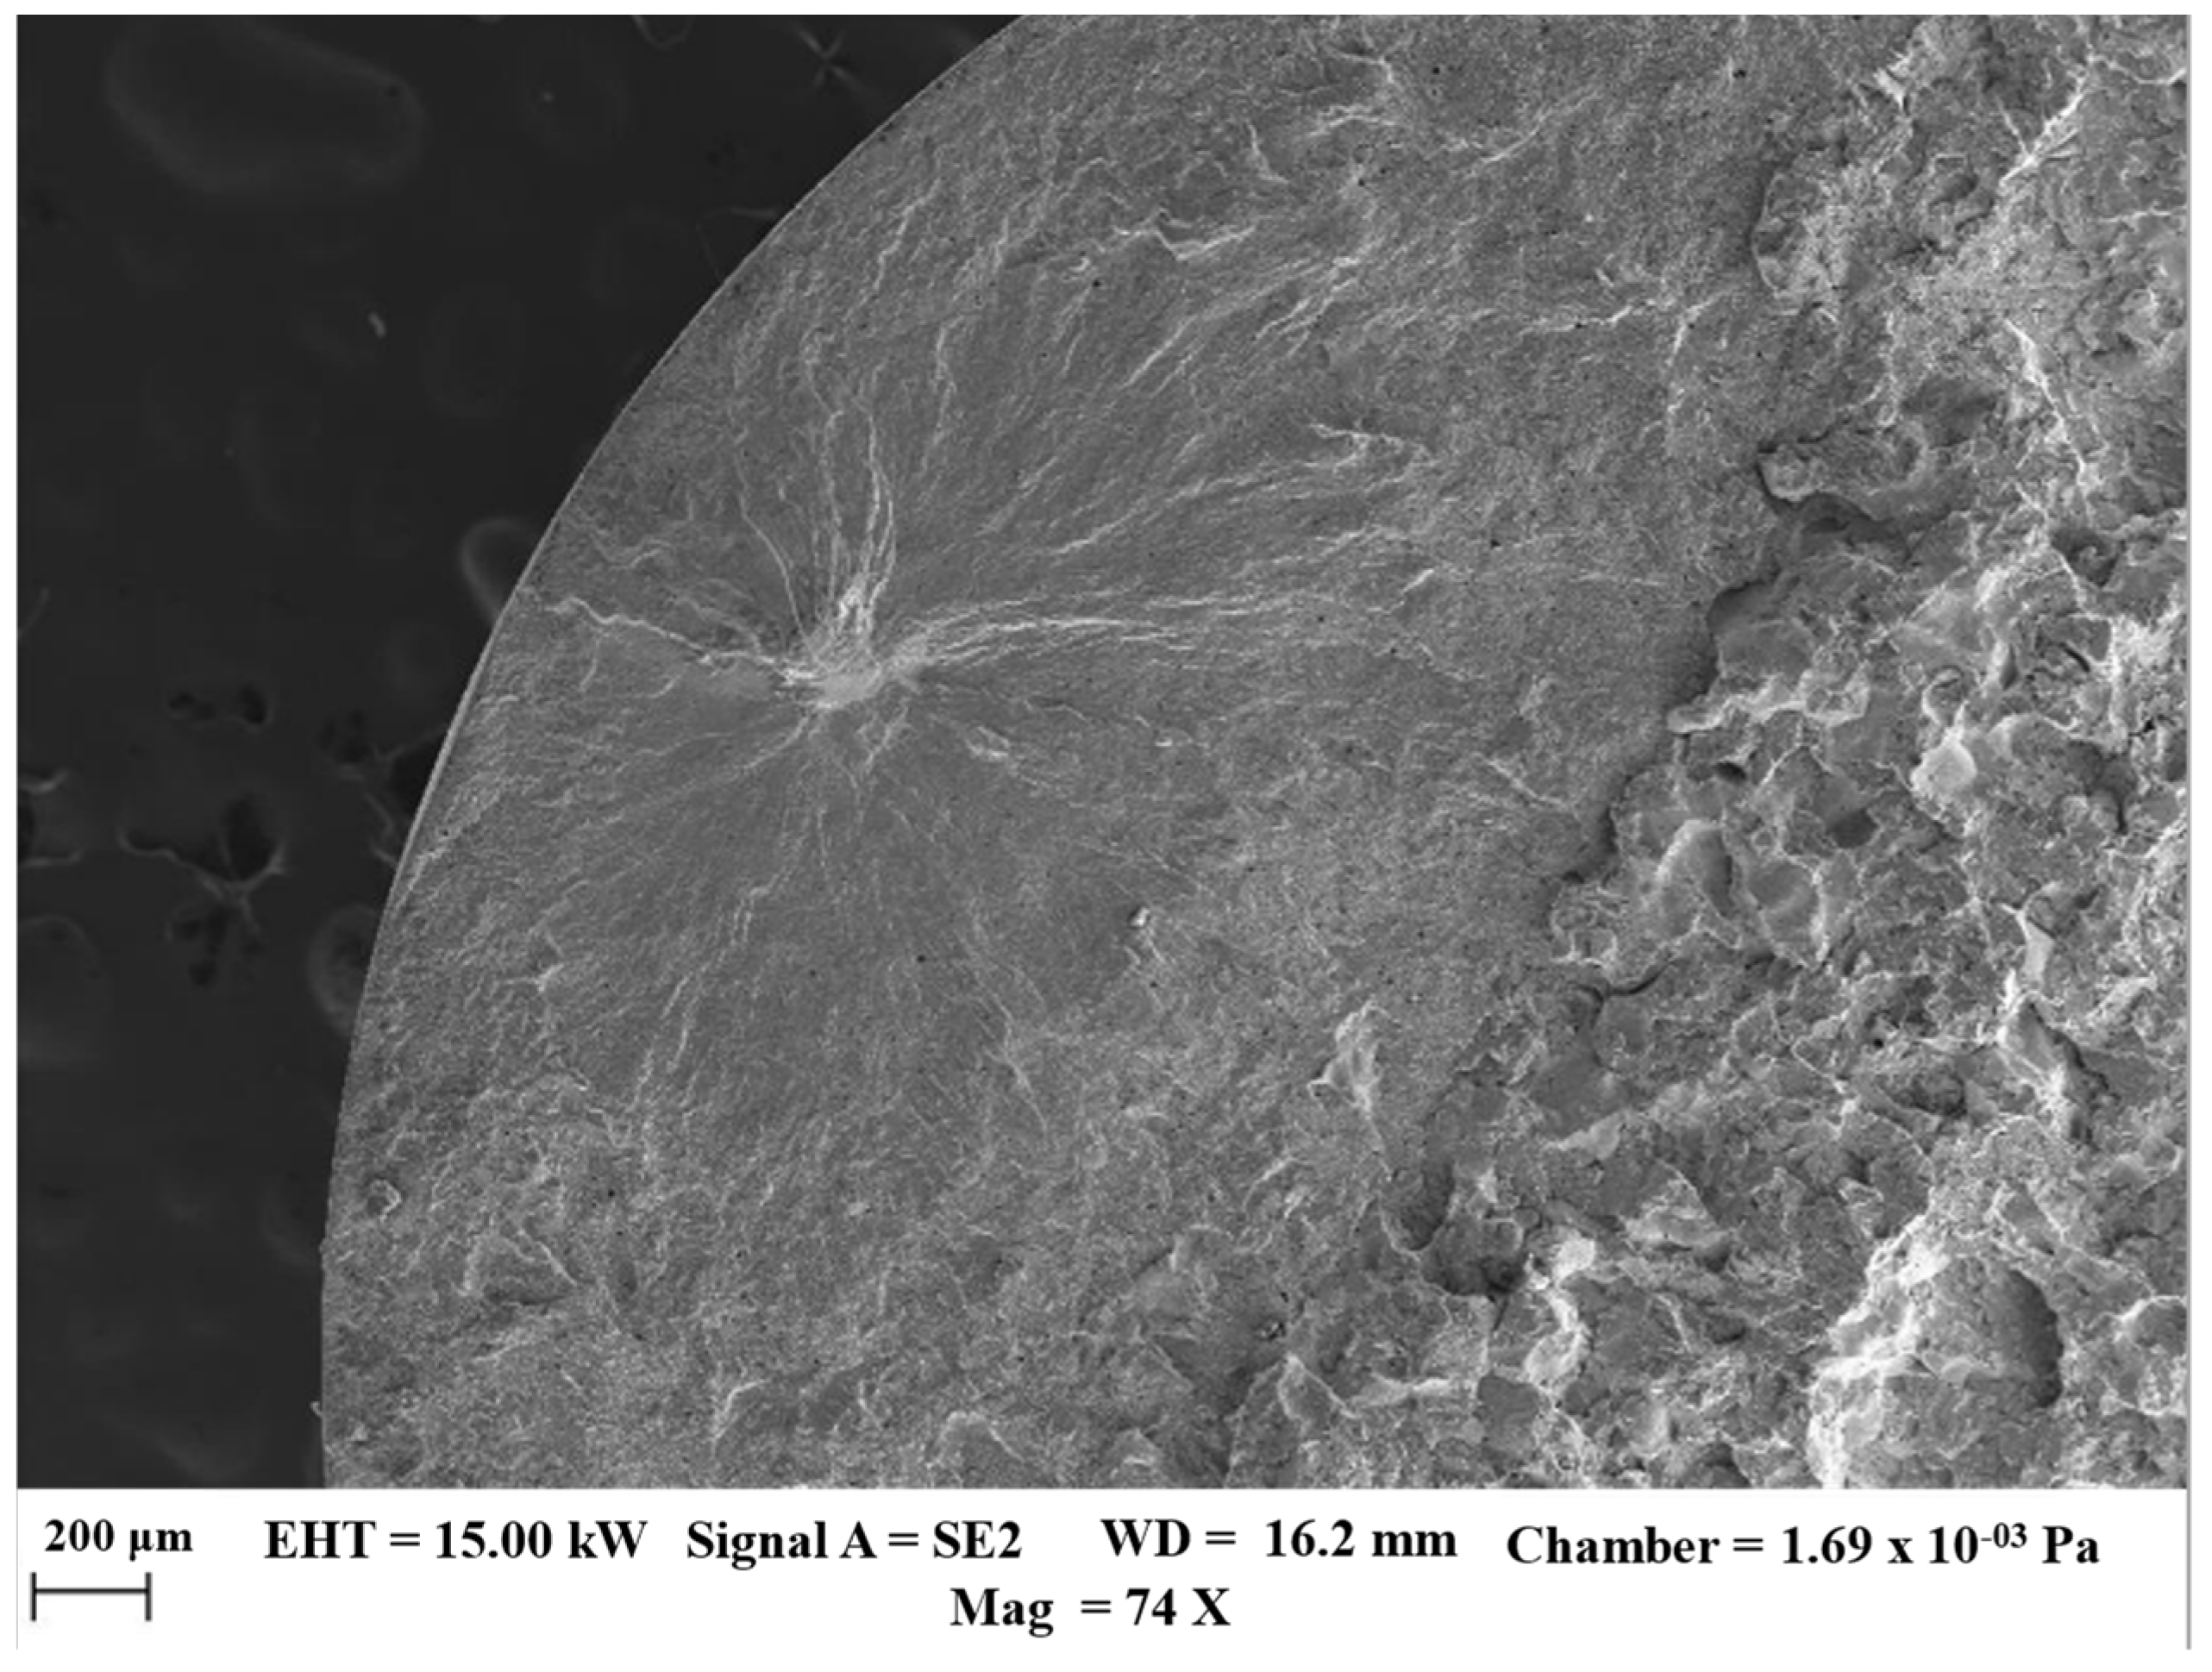
Figure 11.
(a) example of the final fracture surface of the nitrided material specimen; 10× stereoscopic image. (b) Example of subsurface fatigue propagation of nitrided material specimen; note fish-eye nucleation with ODA; 25× stereoscopic image. (c) Fish-eye nucleation example. (d) Matrix failure detail.
Figure 12.
EDS analysis of the fish-eye nucleation zone.
Figure 13.
(a) Brittle fracture at the core of the material; (b) nitriding case nearby final failure with brittle fracture; (c) nitriding nearby fatigue nucleation with brittle transgranular fracture; (d) fatigue propagation in the fish-eye zone (white line) and crash breaks in the heart zone (red left margin) and nitrided zone (red right margin).
Figure 14.
Scatter Plot of the correlation between fish-eye area and number of cycles.
Figure 15.
Scatter Plot of the correlation between fish-eye area and test load.
Figure 16.
Crack initiation in the metallic matrix and limited fatigue propagation.
Figure 17.
Morphology of the nitrided area near crack initiation.
Figure 18.
Residual stress in the nitriding zone at different depth levels.
Figure 19.
Comparison of residual stresses on external surface for nitride (blue bars) and not nitride (black hatched bars) specimen obtained by XRD.
Table 1.
Chemical composition of the steel used in this study (wt.%).
| Composition | wt% |
|---|
| C | 0.16 |
| Mn | 1.48 |
| Si | 0.97 |
| Cr | 1.43 |
| S | 0.05 |
| Ni | 0.18 |
| Mo | 0.14 |
| Cu | 0.23 |
| Others | 0.17 V |
| Fe | Bal. |
Table 2.
Mechanical characteristics of steel after heat treatments cycle.
| Characteristic | Value |
|---|
| Proof strength Rp0.2 [MPa] | 952 |
| Tensile strength Rm [MPa] | 1124 |
| Percentage elongation | 18 |
Table 3.
Roughness parameters measured on the calibrated zone of samples.
| Characteristic | Ra [µm] | Rz [µm] | Std. dev. Ra | Std. dev. Rz |
|---|
| Untreated specimens | 0.09 | 0.76 | 0.016 | 0.174 |
| Nitrided specimens | 0.10 | 0.79 | 0.021 | 0.206 |
Table 4.
Core hardness and nitriding depth measurements at various references.
| Headings | Not Ground Zone | Ground and Polished Zone |
|---|
| Core HV | 375 | 375 |
| Depth 525 HV | 0.41 mm | 0.36 mm |
| Depth core + 100 HV | 0.43 mm | 0.39 mm |
| Depth core + 50 HV | 0.48 mm | 0.43 mm |
| Depth core + 10% hardness HV | 0.50 mm | 0.46 mm |
Table 5.
Fatigue limits reached by untreated specimens after staircase fatigue test.
| Heading | 10th of Survival | 50th of Survival | 90th of Survival |
|---|
| Fatigue limit [MPa] | 652 | 626 | 601 |
Table 6.
Stress and cycles by each test of the staircase of the untreated specimens.
| Test n° | Stress [MPa] | Cycles |
|---|
| 1 | 650 | 6.079 × 10⁵ |
| 2 | 625 | 4.367 × 10⁵ |
| 3 | 600 | runout |
| 4 | 625 | 2.358 × 10⁶ |
| 5 | 600 | Runout |
| 6 | 625 | 2.972 × 10⁶ |
| 7 | 600 | runout |
| 8 | 625 | runout |
| 9 | 650 | 1.381 × 10⁵ |
| 10 | 625 | runout |
| 11 | 650 | runout |
| 12 | 675 | 3.619 × 10⁵ |
| 13 | 650 | 3.430 × 10⁶ |
| 14 | 625 | runout |
| 15 | 650 | 5.690 × 10⁵ |
| 16 | 625 | 3.692 × 10⁵ |
| 17 | 600 | runout |
| 18 | 625 | 5.238 × 10⁵ |
| 19 | 600 | runout |
| 20 | 625 | 9.911 × 10⁵ |
Table 7.
Fatigue limits reached by nitrided specimens after staircase fatigue test.
| Heading | 10th of Survival | 50th of Survival | 90th of Survival |
|---|
| Fatigue limit [MPa] | 723 | 706 | 690 |
Table 8.
Stress and cycles by each test of the staircase of the nitrided specimens.
| Test n° | Stress [MPa] | Cycles |
|---|
| 1 | 850 | 1.805 × 10⁶ |
| 2 | 825 | 1.780 × 10⁶ |
| 3 | 800 | 1.397 × 10⁶ |
| 4 | 775 | 3.995 × 10⁶ |
| 5 | 750 | 6.865 × 10⁶ |
| 6 | 725 | 3.053 × 10⁶ |
| 7 | 700 | 7.369 × 10⁶ |
| 8 | 675 | runout |
| 9 | 700 | runout |
| 10 | 725 | 2.316 × 10⁶ |
| 11 | 700 | runout |
| 12 | 725 | 5.668 × 10⁶ |
| 13 | 700 | runout |
| 14 | 725 | 1.793 × 10⁶ |
| 15 | 700 | 7.310 × 10⁶ |
| 16 | 675 | 5.359 × 10⁶ |
Table 9.
Stress and fatigue propagation by each test of the staircase of the nitrided specimens.
| Test n° | Stress [MPa] | Fatigue Propagation [mm] |
|---|
| 1 | 650 | 1.886 |
| 2 | 625 | 1.887 |
| 4 | 625 | 1.794 |
| 6 | 625 | 1.872 |
| 9 | 650 | 2.010 |
| 13 | 650 | 1.982 |
| 15 | 650 | 1.888 |
| 16 | 625 | 1.714 |
| 18 | 625 | 1.705 |
| 20 | 625 | 2.262 |
| 13 | 650 | 1.982 |
| 15 | 650 | 1.888 |
| 16 | 625 | 1.714 |
Table 10.
Fatigue nucleation depth and equivalent stress evaluated at the nucleating point.
| Test n° | Fatigue Nucleation Depth [mm] | Equivalent Stress at the Nucleation [MPa] |
|---|
| 1 | 0.748 | 618 |
| 2 | 0.532 | 664 |
| 3 | 0.492 | 656 |
| 4 | 0.709 | 574 |
| 5 | 0.574 | 593 |
| 6 | 0.457 | 604 |
| 7 | 0.533 | 564 |
| 10 | 0.580 | 571 |
| 12 | 0.650 | 553 |
| 14 | 0.780 | 519 |
| 15 | 0.544 | 561 |
| 16 | 0.647 | 516 |
Table 11.
Fish-eye area evaluation.
| Test n° | Fish-Eye Area [mm2] |
|---|
| 1 | 0.65 |
| 2 | 0.87 |
| 3 | 0.74 |
| 4 | 0.84 |
| 5 | 1.16 |
| 6 | 1.35 |
| 7 | 1.42 |
| 8 | 1.40 |
| 9 | 1.47 |
| 10 | 1.69 |


