


Electrochemical Fabrication of Inverse Opals of Silver with Cyanide-Free Electrolytes

 , ,
, ,  and
and
Abstract
:1. Introduction
2. Materials and Methods
3. Results and Discussion
4. Conclusions
Author Contributions
Funding
Data Availability Statement
Conflicts of Interest
References
- Jeon, S.-W.; Kwon, K.; Han, S.-W.; Kim, Y.-S.; Cho, Y.-W.; Lim, H.-T.; Moon, S.; Shin, H.; Jung, H. Diamond Photonic Crystal Mirror with a Partial Bandgap by Two 2D Photonic Crystal Layers. Opt. Express 2020, 28, 39048. [Google Scholar] [CrossRef] [PubMed]
- Scherbakov, A.V.; Akimov, A.V.; Golubev, V.G.; Kaplyanskii, A.A.; Kurdyukov, D.A.; Meluchev, A.A.; Pevtsov, A.B. Optically Induced Bragg Switching in Opal-VO2 Photonic Crystals. Phys. E Low-Dimens. Syst. Nanostructures 2003, 17, 429–430. [Google Scholar] [CrossRef]
- Armstrong, E.; O’Dwyer, C. Artificial Opal Photonic Crystals and Inverse Opal Structures–Fundamentals and Applications from Optics to Energy Storage. J. Mater. Chem. C 2015, 3, 6109–6143. [Google Scholar] [CrossRef] [Green Version]
- Amrehn, S.; Wu, X.; Wagner, T. Tungsten Oxide Photonic Crystals as Optical Transducer for Gas Sensing. ACS Sens. 2018, 3, 191–199. [Google Scholar] [CrossRef] [PubMed] [Green Version]
- Fathi, F.; Rashidi, M.-R.; Pakchin, P.S.; Ahmadi-Kandjani, S.; Nikniazi, A. Photonic Crystal Based Biosensors: Emerging Inverse Opals for Biomarker Detection. Talanta 2021, 221, 121615. [Google Scholar] [CrossRef]
- Gupta, A.; Gadia, R.; Singh, A.; Singh, R.K.; Tiwari, A. Design Analysis of Multisample Single-Analyte Surface Plasmon Resonance Biosensor Based on D-Shape Photonic Crystal Fibers. Plasmonics 2022, 17, 143–151. [Google Scholar] [CrossRef]
- Wu, L.; Wang, W.; Zhang, W.; Su, H.; Liu, Q.; Gu, J.; Deng, T.; Zhang, D. Highly Sensitive, Reproducible and Uniform SERS Substrates with a High Density of Three-Dimensionally Distributed Hotspots: Gyroid-Structured Au Periodic Metallic Materials. NPG Asia Mater. 2018, 10, e462. [Google Scholar] [CrossRef] [Green Version]
- Wang, J.; Duan, G.; Liu, G.; Li, Y.; Dai, Z.; Zhang, H.; Cai, W. Gold Quasi Rod-Shaped Nanoparticle-Built Hierarchically Micro/Nanostructured Pore Array via Clean Electrodeposition on a Colloidal Monolayer and Its Structurally Enhanced SERS Performance. J. Mater. Chem. 2011, 21, 8816. [Google Scholar] [CrossRef]
- Li, M.; Cushing, S.K.; Wu, N. Plasmon-Enhanced Optical Sensors: A Review. Analyst 2014, 140, 386–406. [Google Scholar] [CrossRef] [Green Version]
- Semenova, A.A.; Goodilin, E.A.; Brazhe, N.A.; Eremina, E.A.; Maksimov, G.V.; Tretyakov, Y.D. Silica Microsphere Decoration with Silver Nanoparticles by an Impregnation and Reduction Technique. Mendeleev Commun. 2011, 21, 77–79. [Google Scholar] [CrossRef]
- Pilot, R.; Signorini, R.; Durante, C.; Orian, L.; Bhamidipati, M.; Fabris, L. A Review on Surface-Enhanced Raman Scattering. Biosensors 2019, 9, 57. [Google Scholar] [CrossRef] [PubMed] [Green Version]
- Van Duyne, R.P.; Hulteen, J.C.; Treichel, D.A. Atomic Force Microscopy and Surface-enhanced Raman Spectroscopy. I. Ag Island Films and Ag Film over Polymer Nanosphere Surfaces Supported on Glass. J. Chem. Phys. 1993, 99, 2101–2115. [Google Scholar] [CrossRef] [Green Version]
- Ding, S.-Y.; Yi, J.; Li, J.-F.; Ren, B.; Wu, D.-Y.; Panneerselvam, R.; Tian, Z.-Q. Nanostructure-Based Plasmon-Enhanced Raman Spectroscopy for Surface Analysis of Materials. Nat. Rev. Mater. 2016, 1, 16021. [Google Scholar] [CrossRef]
- Cesiulis, H.; Ziomek-Moroz, M. Electrocrystallization and Electrodeposition of Silver on Titanium Nitride. J. Appl. Electrochem. 2000, 30, 1261–1268. [Google Scholar] [CrossRef]
- Kolbasov, G.; Kublanovsky, V.; Bersirova, O.; Sakhnenko, M.; Ved, M.; Kuntyi, O.; Reshetnyak, O.; Posudievsky, O. ELECTROCHEMISTRY OF FUNCTIONAL MATERIALS AND SYSTEMS (EFMS). Ukr. Chem. J. 2021, 87, 61–76. [Google Scholar] [CrossRef]
- Cesiulis, H.; Bersirova, O.; Valiūnienė, A.; Prosyčevas, I.; Baltrūnas, G. Structural and Morphological Study of Silver Electrodeposits. Mater. Sci. 2004, 10, 142–146. [Google Scholar]
- Kal’nyi, D.B.; Kokovkin, V.V.; Mironov, I.V. Sodium Sulfite: A Promising Reagent in the Electrochemical Oxidation of Metallic Silver. Russ. J. Gen. Chem. 2011, 81, 793–798. [Google Scholar] [CrossRef]
- Cintra, S.; Abdelsalam, M.E.; Bartlett, P.N.; Baumberg, J.J.; Kelf, T.A.; Sugawara, Y.; Russell, A.E. Sculpted Substrates for SERS. Faraday Discuss. 2006, 132, 191–199. [Google Scholar] [CrossRef]
- Martynova, N.A.; Goldt, A.E.; Maslakov, K.I.; Savilov, S.V.; Grigorieva, A.V. Electroplating of Porous Gold Films for SERS Analysis of Heme Derivatives. J. Mater. Sci. 2018, 53, 7953–7962. [Google Scholar] [CrossRef]
- Napolskii, K.S.; Sapoletova, N.A.; Gorozhankin, D.F.; Eliseev, A.A.; Chernyshov, D.Y.; Byelov, D.V.; Grigoryeva, N.A.; Mistonov, A.A.; Bouwman, W.G.; Kvashnina, K.O.; et al. Fabrication of Artificial Opals by Electric-Field-Assisted Vertical Deposition. Langmuir 2010, 26, 2346–2351. [Google Scholar] [CrossRef] [Green Version]
- Martynova, N.A.; Goldt, A.E.; Grigorieva, A.V. Au-Au Composites with Inverse Opal Structure for Surface-Enhanced Raman Spectroscopy. Gold Bull. 2018, 51, 57–64. [Google Scholar] [CrossRef]
- Sanders, C.E.; Verreault, D.; Frankel, G.S.; Allen, H.C. The Role of Sulfur in the Atmospheric Corrosion of Silver. J. Electrochem. Soc. 2015, 162, C630–C637. [Google Scholar] [CrossRef]
- Kelf, T.A.; Sugawara, Y.; Cole, R.; Baumberg, J.J.; Abdelsalam, M.; Cintra, S.; Mahajan, S.; Russell, A.; Bartlett, P.N. Localized and Delocalized plasmons in metallic nanovoids. Phys. Rev. B 2006, 74, 245415. [Google Scholar] [CrossRef] [Green Version]
- Bartlett, P.N.; Baumberg, J.J.; Coyle, E.; Abdelsalam, M.E. Optical properties of nanostructured metal films. Faraday Discuss. 2004, 125, 117–132. [Google Scholar] [CrossRef]


| Substrate | Electrolyte | Element | At. % |
|---|---|---|---|
| glass/ITO/Au | Rhodanic | Ag | 59.2 ± 11.8 |
| Si | 11.2 ± 2.2 | ||
| Ca | 2.1 ± 0.4 | ||
| Al | 2.0 ± 0.4 | ||
| In | 8.5 ± 1.7 | ||
| Au | 17.0 ± 3.4 | ||
| glass/ITO/Au | Sulfitic | Ag | 35.8 ± 2.9 |
| Si | 21.4 ± 1.3 | ||
| Ca | 4.0 ± 0.1 | ||
| In | 13.3 ± 0.6 | ||
| Au | 25.5 ± 1.0 |
| Substrate | Electrolyte | Binding Energy, eV (Ag 3d5/2) | Valence State of Ag | At. % (of All States of Ag) |
|---|---|---|---|---|
| glass/ITO | Rhodanic | 368.0, 368.4 | Ag | 68.3 |
| entry 2 | data | 368.6 | Ag (I) (Ag2S) | 31.7 |
| glass/ITO/Ag | Rhodanic | 368.1, 368.5 | Ag | 43.3 |
| 368.8 | Ag (I) (Ag2S) | 56.7 | ||
| ITO/glass | Sulfite | 368.1 | Ag | 50.0 |
| 368.7 | Ag (I) (Ag2S) | 33.3 | ||
| 367.8 | Ag (I) (Ag2SO4) | 16.7 | ||
| Ag/ITO/glass | Sulfite | 368.2, 368.3 | Ag | 40.0 |
| 368.8 | Ag (I) (Ag2S) | 43.3 | ||
| 367.9 | Ag (I) (Ag2SO4) | 16.7 |
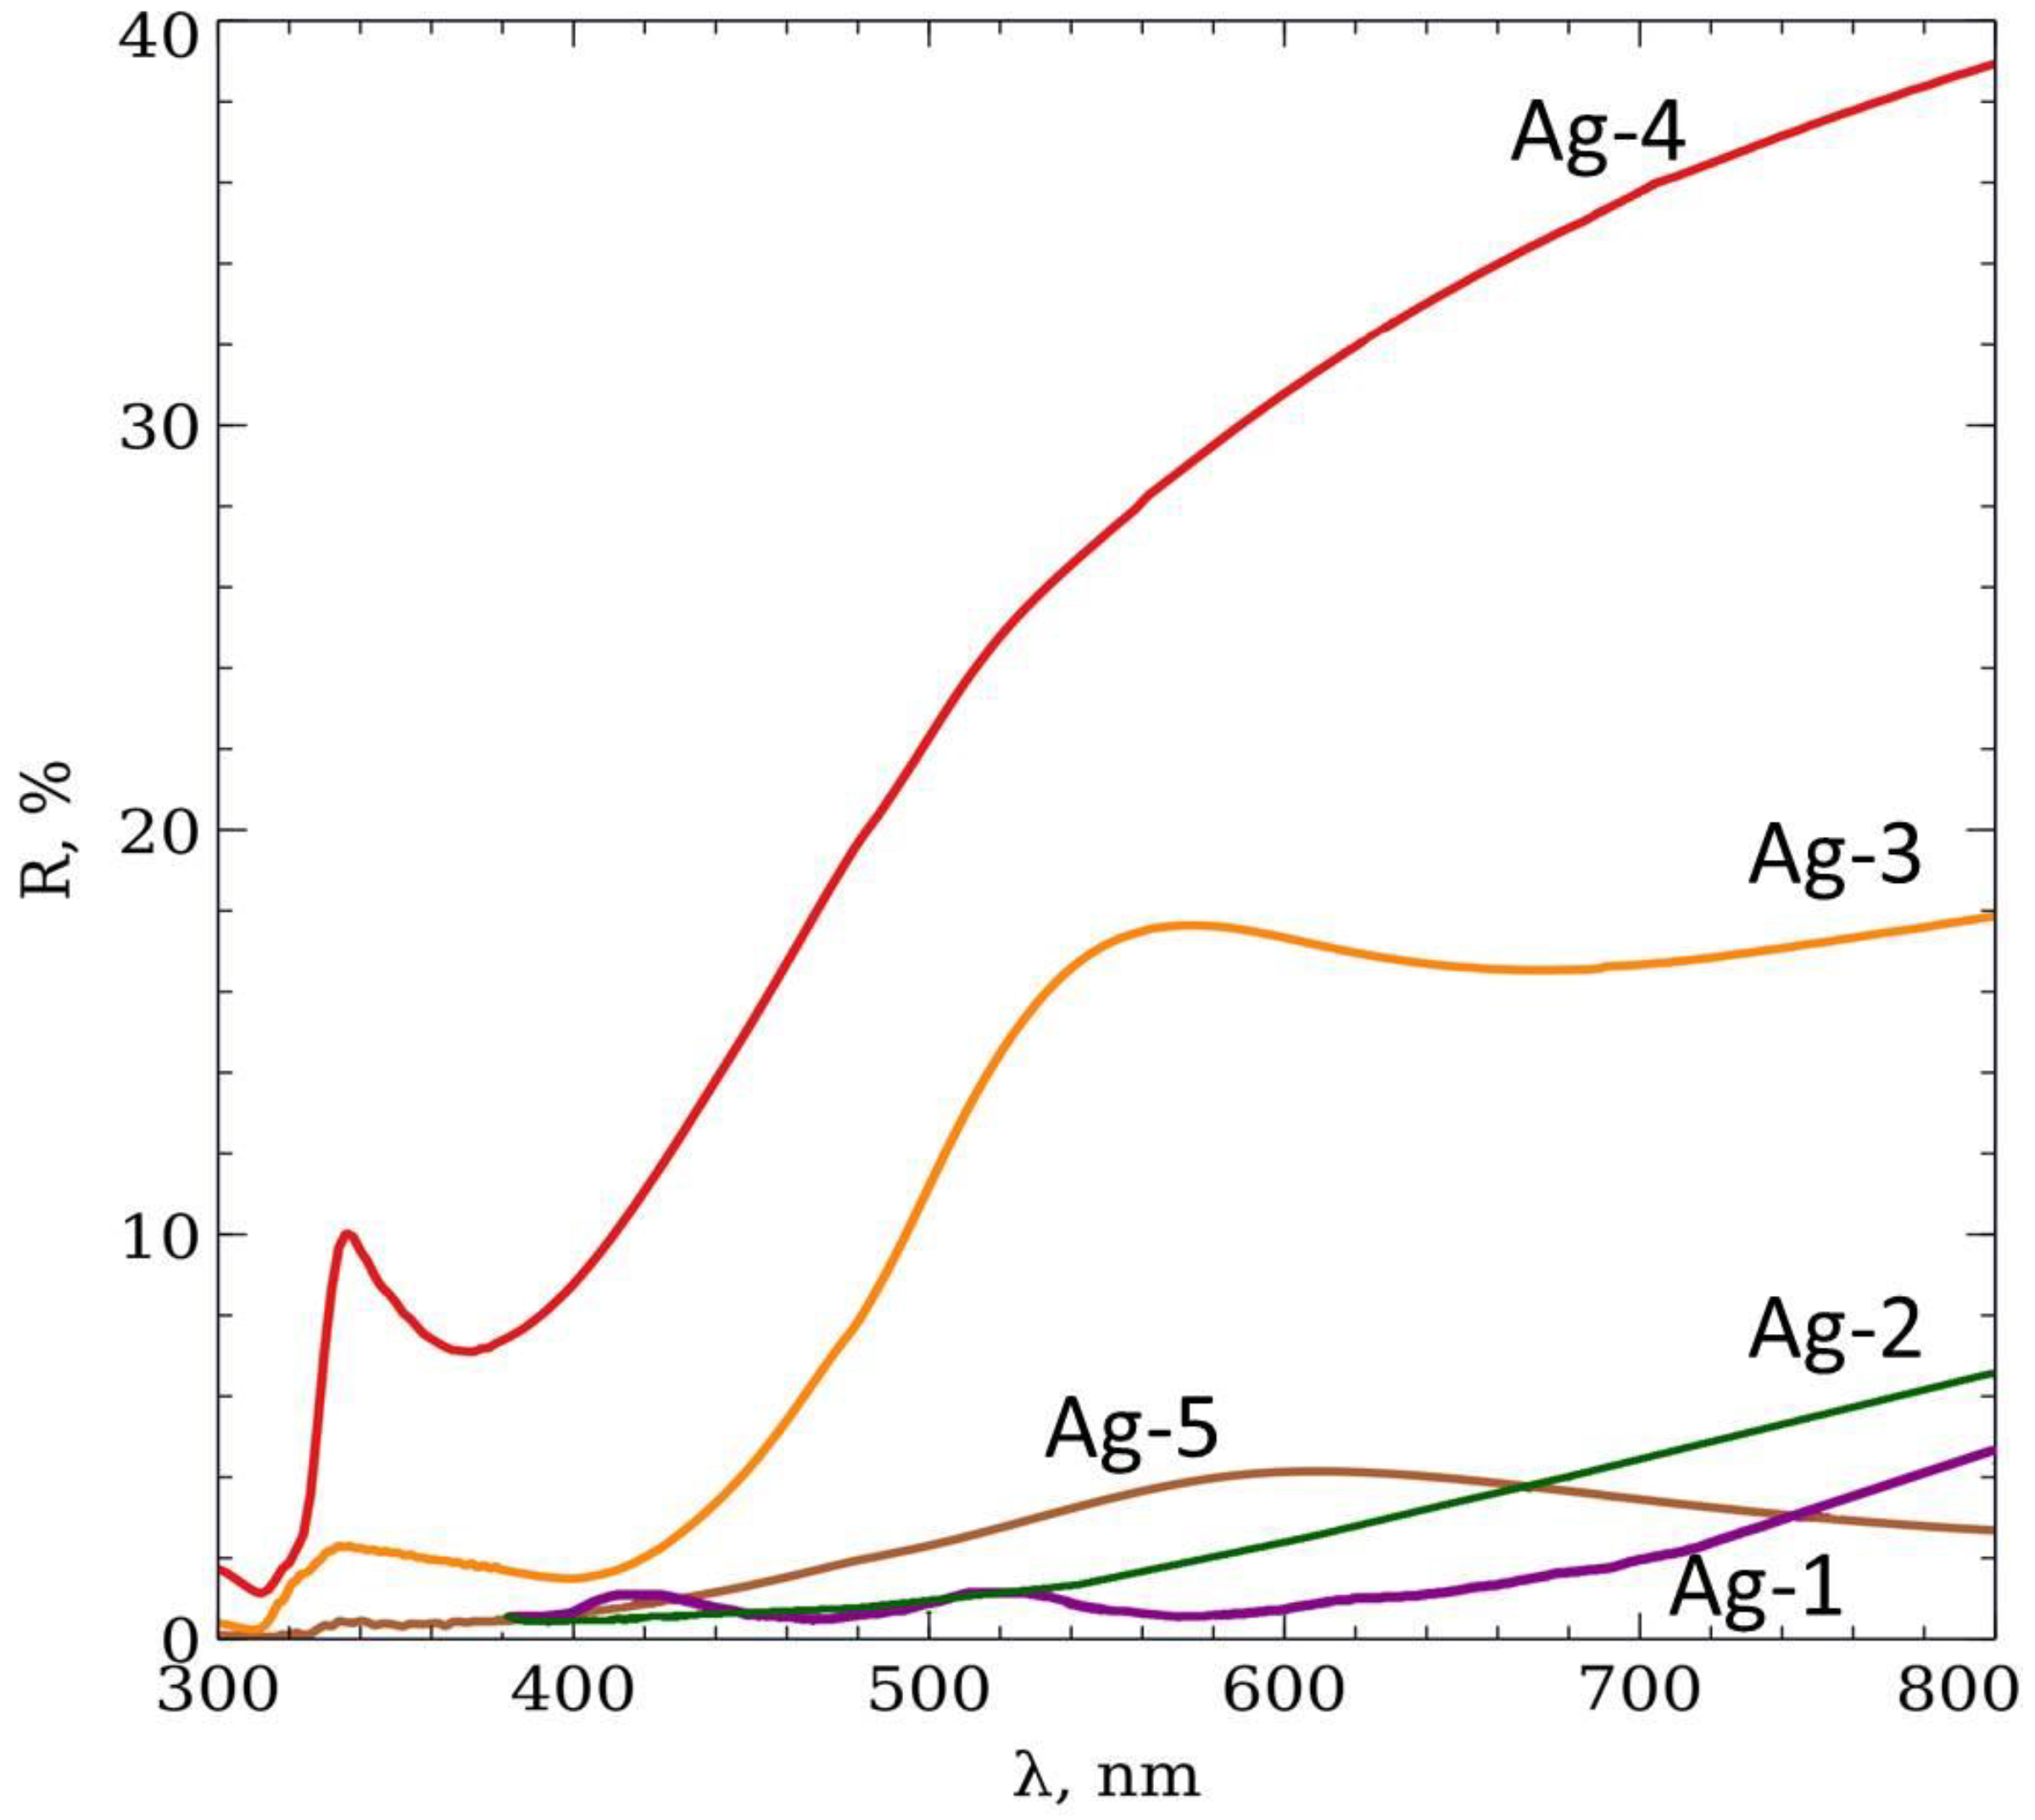
| Name | Ag-1 | Ag-2 | Ag-3 | Ag-4 | Ag-5 |
|---|---|---|---|---|---|
| Electrolyte | Rhodanic | Rhodanic | Rhodanic | Rhodanic | Sulfitic |
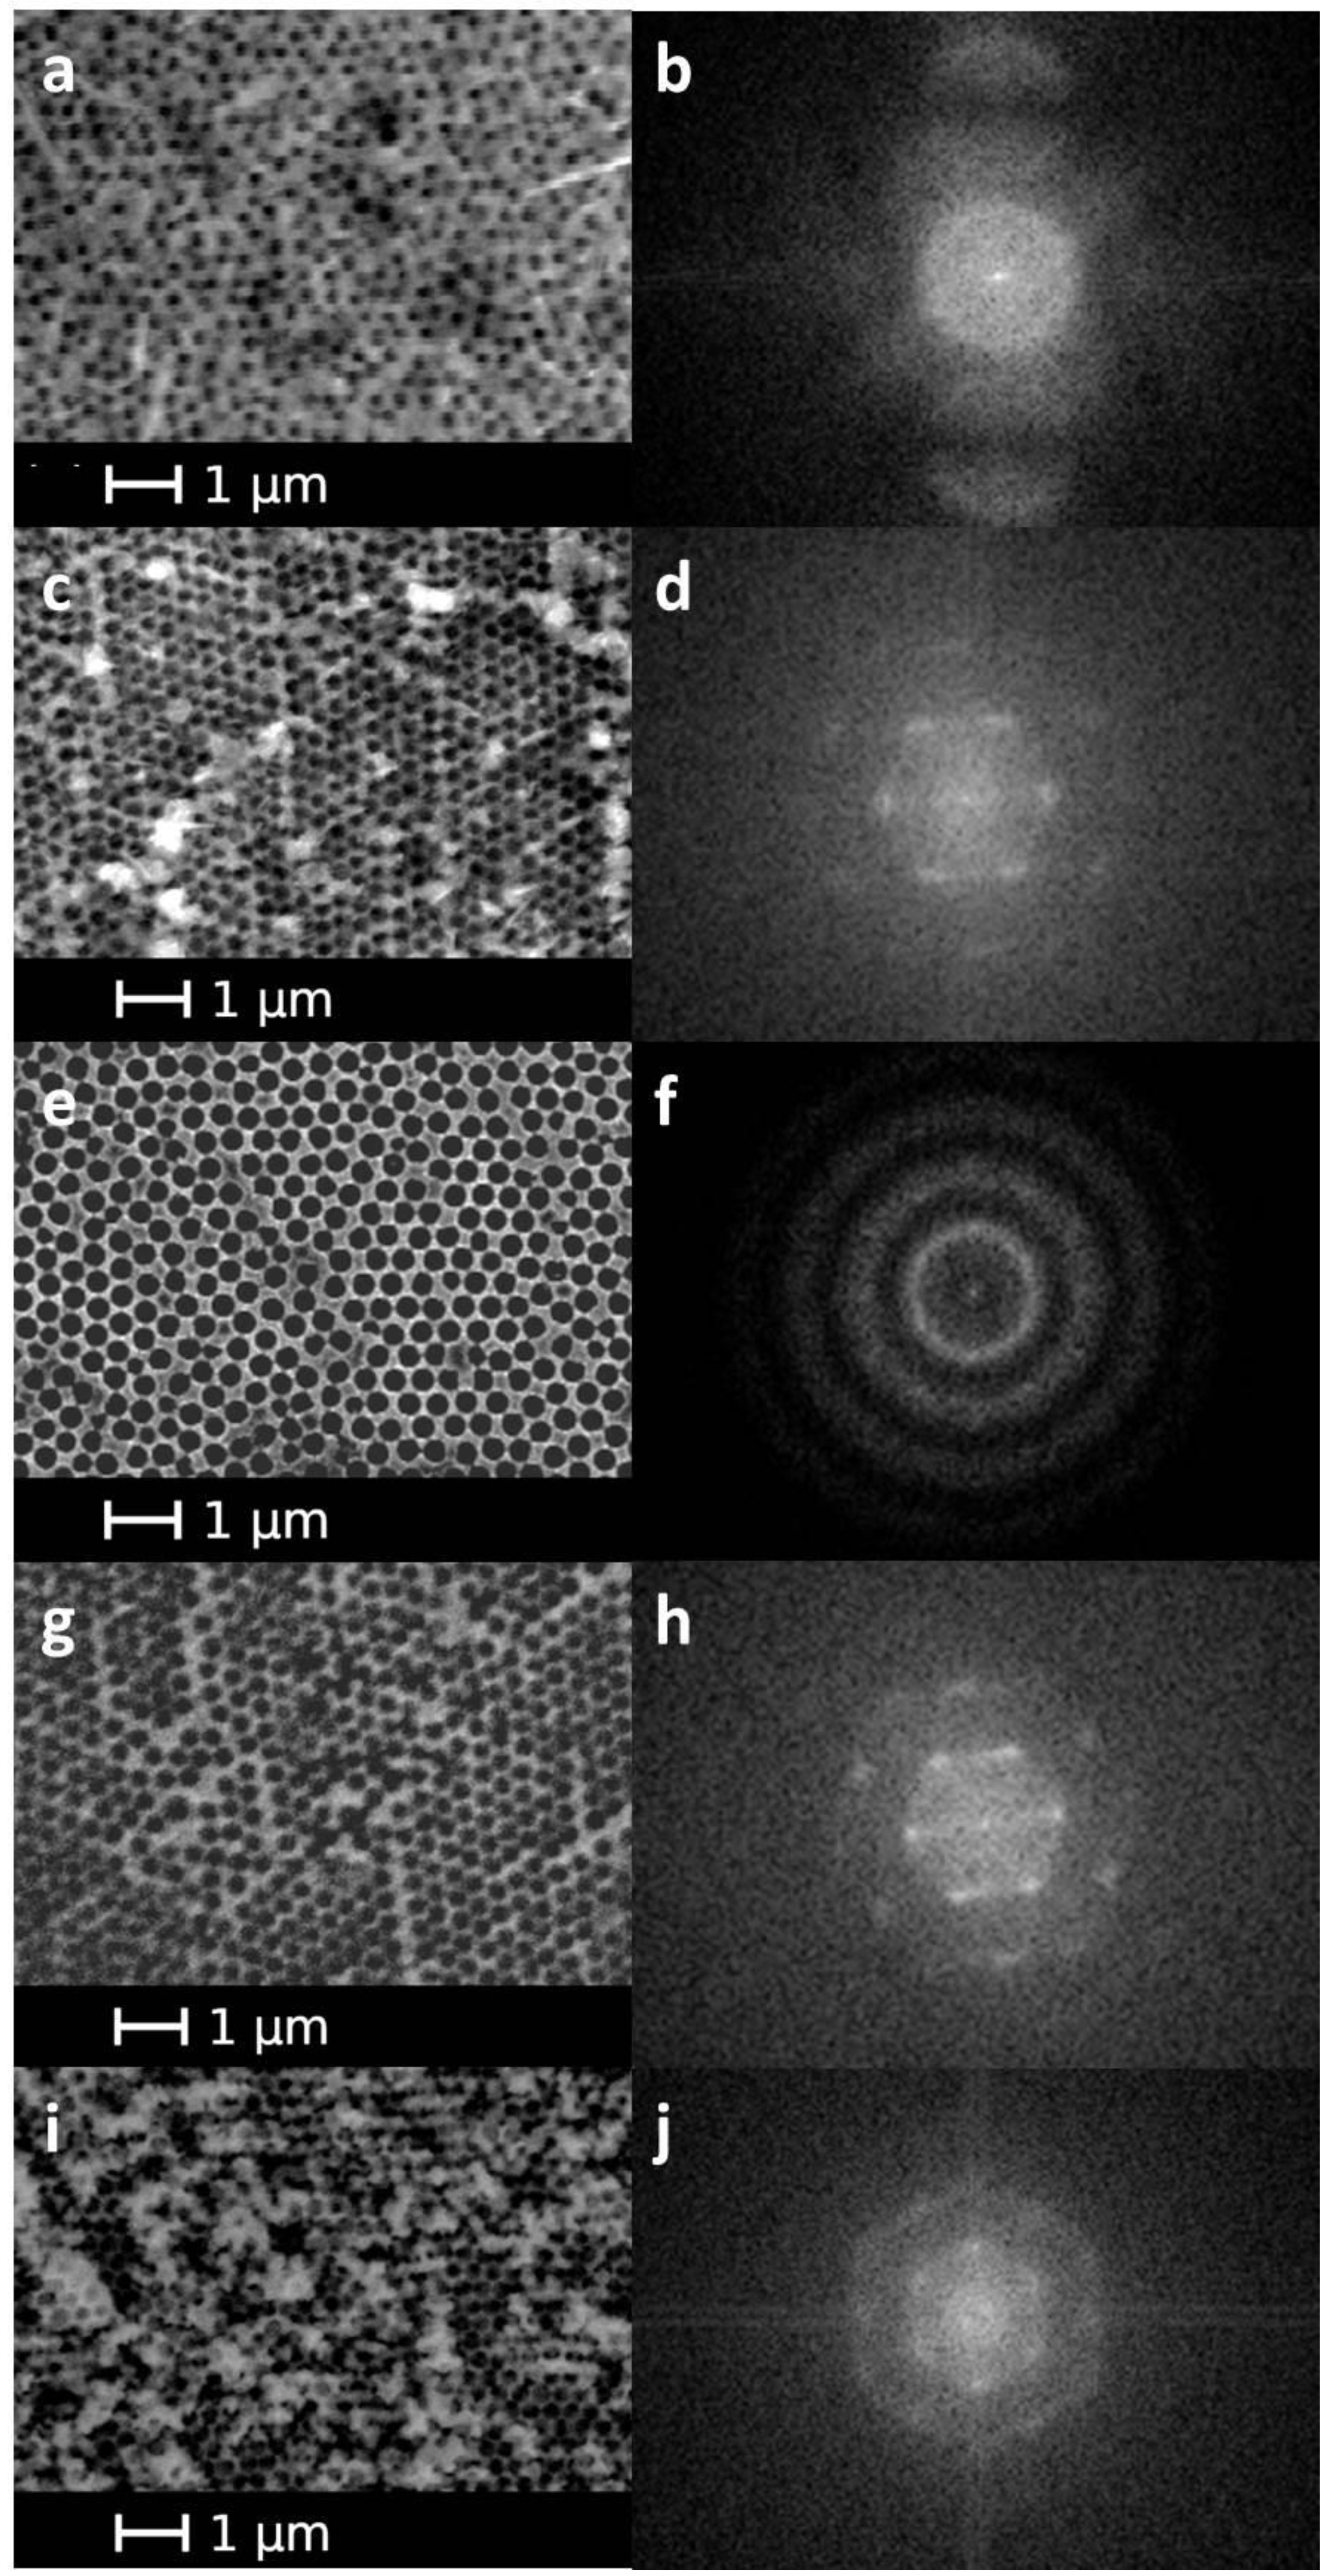
| dexp, nm | 247 ± 19 | 256 ± 35 | 385 ± 55 | 263 ± 16 | 249 ± 17 |
| D, nm | 340 ± 15 | 340 ± 15 | 440 ± 20 | 350 ± 30 | 350 ± 30 |
| Charge, mC - | −16 | −211 | −181 | −11 | −133 |
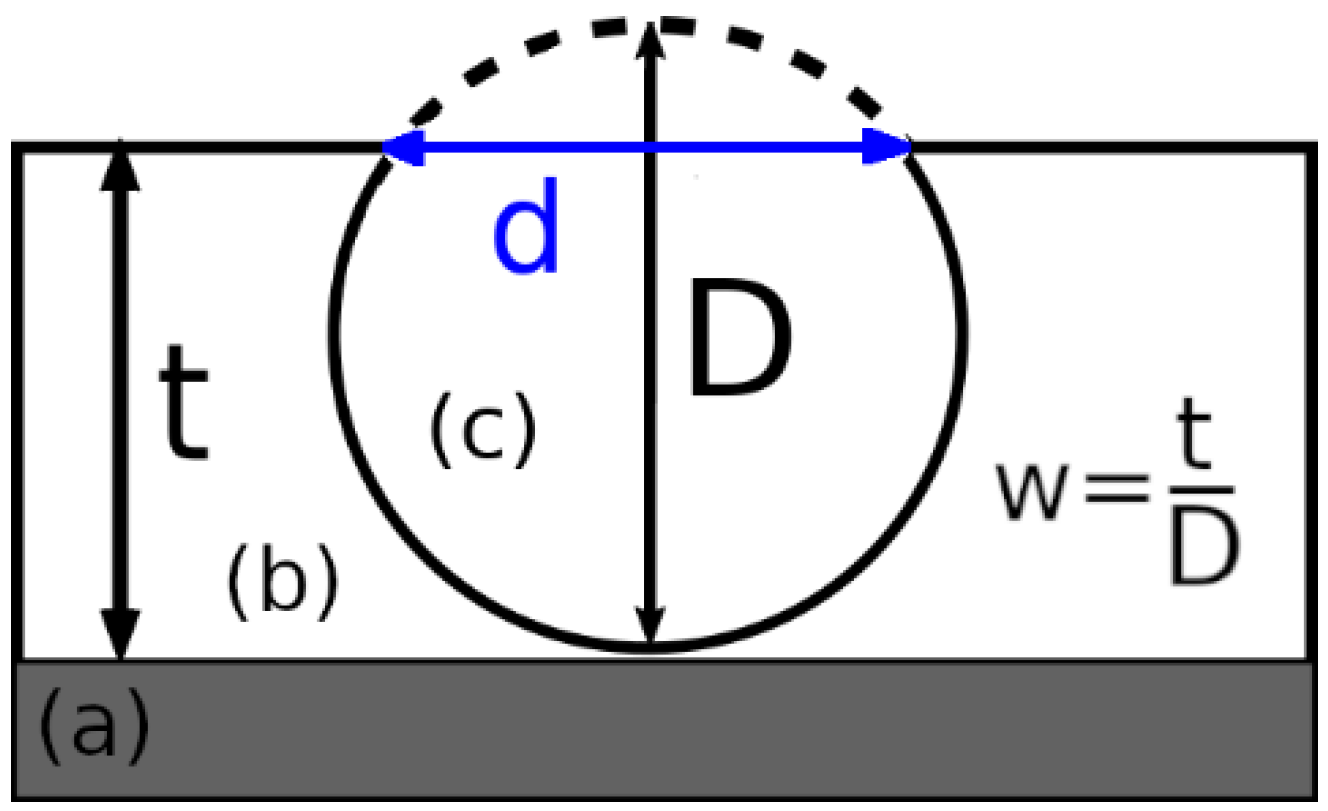
| Theoretical w = ttheor/D | 0.2 | 0.5 | 1 | 0.7 | 0.7 |
| Experimental w = texp/D | 0.2 | 0.2 | 0.7 | 0.8 | 0.9 |
| Δw/wtheor * (Δw = |wtheor − wexp|) | 0 | 0.6 | 0.3 | 0.14 | 0.29 |
Publisher’s Note: MDPI stays neutral with regard to jurisdictional claims in published maps and institutional affiliations. |
© 2022 by the authors. Licensee MDPI, Basel, Switzerland. This article is an open access article distributed under the terms and conditions of the Creative Commons Attribution (CC BY) license (https://creativecommons.org/licenses/by/4.0/).
Share and Cite
Arabov, R.I.; Komarova, M.Y.; Astafurov, M.O.; Knotko, A.V.; Maslakov, K.I.; Savilov, S.V.; Grigorieva, A.V. Electrochemical Fabrication of Inverse Opals of Silver with Cyanide-Free Electrolytes. Metals 2022, 12, 2042. https://doi.org/10.3390/met12122042
Arabov RI, Komarova MY, Astafurov MO, Knotko AV, Maslakov KI, Savilov SV, Grigorieva AV. Electrochemical Fabrication of Inverse Opals of Silver with Cyanide-Free Electrolytes. Metals. 2022; 12(12):2042. https://doi.org/10.3390/met12122042
Chicago/Turabian StyleArabov, Rustam I., Maria Y. Komarova, Mikhail O. Astafurov, Alexander V. Knotko, Konstantin I. Maslakov, Serguei V. Savilov, and Anastasia V. Grigorieva. 2022. "Electrochemical Fabrication of Inverse Opals of Silver with Cyanide-Free Electrolytes" Metals 12, no. 12: 2042. https://doi.org/10.3390/met12122042
APA StyleArabov, R. I., Komarova, M. Y., Astafurov, M. O., Knotko, A. V., Maslakov, K. I., Savilov, S. V., & Grigorieva, A. V. (2022). Electrochemical Fabrication of Inverse Opals of Silver with Cyanide-Free Electrolytes. Metals, 12(12), 2042. https://doi.org/10.3390/met12122042