Article

Synthesis and Catalytic Studies of Nanoalloy Particles Based on Bismuth, Silver, and Rhenium

1
Faculty of Non-Ferrous Metals, AGH University of Science and Technology, Mickiewicza Ave. 30, 30-059 Krakow, Poland
2
Academic Centre for Materials and Nanotechnology, AGH University of Science and Technology, al. A. Mickiewicza 30, 30-059 Krakow, Poland
3
Department of Chemistry, Higher Polytechnic Engineering School, University of Lleida, 25002 Lleida, Spain
4
School of Engineering, University of Warwick, Coventry CV4 7AL, UK
5
School of Chemical Engineering and Advanced Materials, The University of Adelaide, Adelaide 5005, Australia
*
Author to whom correspondence should be addressed.
Metals 2022, 12(11), 1819; https://doi.org/10.3390/met12111819
Submission received: 19 September 2022 / Revised: 22 October 2022 / Accepted: 23 October 2022 / Published: 26 October 2022
(This article belongs to the Special Issue Advances in Nanostructured Metallic Materials)

Abstract

:
The work reports the synthesis and characterization of ternary nanoalloy catalysts of silver, bismuth, and rhenium from alkaline solutions containing L–cysteine as a complexing agent and sodium borohydride as a reducing agent. UV–Vis spectra and dynamic light scattering (DLS) analyses of the obtained colloids were performed. Additionally, high-resolution transmission electron microscope (HR–TEM) analysis assisted the former investigations. The influence of a stabilizer (PVA) was demonstrated for bismuth nanoparticles reaching an average size of 8 nm with PVA, whereas they grew large, 514 nm, in the case of synthesis without stabilizing agent. AgReBi nanoalloy particles reach an average size of 19 nm with PVA. The presence of two absorption maxima in the UV–Vis spectrum suggests shape anisotropy of these nanoparticles. TEM micrographs demonstrate the crystal structure of AgReBi nanoparticles. Cyclic voltamaperometry allows for deciphering of the catalytic properties for hydrogen peroxide electro-reduction. Both bismuth and AgReBi nanoalloy catalysts showed relatively high catalytic activity in H2O2 electro-reduction in the amperometric tests.

1. Introduction

The synthesis of alloy or multi-material nanoparticles, such as metal–metal oxide [1,2,3], core–shell nanoparticles [4,5,6], or Janus nanoparticles [7,8] is widely investigated in the synthesis of materials for electronic and catalytic applications [1,5,9].
As is well known, such structures often show a synergistic effect compared to pure, single components. Especially in the case of catalysis, where the carrier of catalytically active metal often plays an additional role in the catalyzed reaction occurring primarily at the supported metal [10,11,12].
In the case of bulk materials, there are severe limitations in combining different materials down to the atomic level. Classical methods cannot mix metals that do not alloy with each other. To some extent, powder metallurgy is practical here [13,14,15,16]. However, this process almost always requires an elevated temperature. Thus, materials with different thermal properties or thermally unstable materials cannot be joined this way.
The synthesis of materials at the nanoscale can solve this problem for particular applications, especially for catalysis, asking for a large surface area that nano-sized materials can provide.
Using chemical synthesis methods, nanoparticles with a complex composition can be synthesized [17,18,19,20]. The formation of core–shell particles allows the combination of materials that have entirely different properties and do not form solid solutions. However, this connection is purely mechanical, meaning such nanoparticles do not have the structure or properties of the alloy as intended here.
Obtaining solid metal solutions requires, among other things, the same crystallographic structure of components of the solution. The crystallographic structure is a physical property of the metal; it cannot be forced to crystallize in a different crystallographic structure while casting the bulk metal. As a result, it is impossible to obtain alloys from metals that naturally crystallize with a different crystallographic structure.
As a concept to the above, studies show that during the synthesis of materials on the nanoscale via chemical reduction, mechanisms can be used to obtain alloy nanoparticles from metals that do not show solubility in bulk.
The synthesis of nanoparticles by chemical methods is a multi-stage process controlled by many factors. The first stage, which is the nucleation of nanoparticles, follows the thermodynamic model presented by La`Mer (1) [21]:
r = 2 γ L S v k T l n S
where r is the minimal radius of a stable nanoparticle nucleus (nm), γLS is the surface tension at the nanoparticle-solution interface (mN/m), v is the the molar volume of precursor molecules (cm3/mol), while S is the ratio of the concentrations of the reactants at the time of mixing to their equilibrium concentrations.
The following stages of the nanoparticle growth process, such as aggregation and coalescence of particles, run towards minimum energy, going through many intermediate states [22,23]. In synthesizing nanomaterials by chemical methods, there is usually greater control of the process than in other methods. This is because, in chemical synthesis, it is possible to set many parameters of this process over a wide range. These parameters include the concentration of the precursor and stabilizers, temperature, oxygenation of the solution, hydrodynamic conditions, pH [24], reaction duration time [25], or the addition of substances influencing the ionic strength in the solution [26]. Contrary to physical methods, which are usually based on the use of high energy in the synthesis process, the other conditions most often result from the parameters of the energy source and the dispersing medium used [27]. The course of the chemical synthesis is influenced by a number of factors that can be controlled at the level of preparation of the reaction mixture, which gives the possibility of capturing and even stopping the process on one of the intermediate products. This has been proven in an article reporting on silver nanoparticles synthesized by chemical reduction [28]. By limiting the diffusion rate of the components in the system, the authors of this work obtained a mixture of silver nanoparticles with the standard FCC structure and an untypical silver hexagonal crystallographic structure. The nucleation mechanism of silver nanoparticles probably promotes the formation of a hexagonal structure in the first stages. As a result of maturation, it transforms into a stable FCC structure, as is known for bulk silver. Capturing the stage in which the forming silver particles have a hexagonal structure and freezing them in this form allows for the obtaining of a material untypical for the bulk silver crystallographic structure. This is confirmed by the work in which silver was also obtained with a hexagonal structure in the form of thin foils [29]. In this case, crystallization in a structure unusual for silver was forced by controlling the reaction by electrochemical methods.
This phenomenon marks a new direction in the preparation of nanomaterials. Motivated thereby, we investigate here the co-reduction of several types of ions in one solution, aiming to stop at the intermediate state of nucleation, forming a solid solution. This could allow us to prepare and study unprecedented material. For example, silver nanoparticles with a hexagonal transition structure can alloy with a metal of the same structure, achieving minimum energy via a different path and creating nanoalloy particles with a hexagonal structure.
In this way, it is possible to obtain an alloy from metallic components that are not obtainable in the bulk version. The synthesis of nano-alloys opens up new possibilities in this field.
The literature review shows that nanomaterials [30,31], and especially nanoparticles [32,33,34,35], can be successfully applied as H2O2 sensors due to their large surface–volume ratio, and, in consequence, effective catalysis. Noble metals are well-known for their catalytic properties. However, the dissolution of silver nanoparticles can be enhanced by the presence of strong oxidizers such as H2O2 [36,37]. This phenomenon can be used in the tracking of this compound in live cells during its secretion. After the detection of H2O2, nanoparticles decomposed for O2 and H2O as final products. The nanoparticle hybrids of noble metals with non-noble ones show an increase in catalytic activity [38]. By controlling their size, shape, and composition, physical and chemical properties of the hybrid noble metal nanomaterials can be adjusted. The sensing and control of hydrogen peroxide are significantly important due to its multiple applications, e.g., water treatment [39], the food industry [40], and human health [41,42]. This highlights the importance of investigating new materials characterized by good sensitivity and selectivity for the detection of H2O2.
This paper presents the synthesis of ternary nanoalloy catalysts consisting of bismuth, silver, and rhenium by chemical reduction from alkaline L-cysteine solutions in the presence of PVA as a stabilizer and sodium borohydride as a reducing agent. The metal ions are simultaneously reduced to form alloy nanoparticles. Rhenium has a hexagonal crystallographic structure. Silver, as discussed above, may exist in the hexagonal form under certain transition states. A trigonal crystallographic structure characterizes bismuth, but due to its lower redox potential compared to silver and rhenium, it can be reduced to a metallic form at later stages. This gives it a chance to obtain core–shell or other composite structures. The obtained colloids were subjected to spectral analysis on the UV–Vis, DLS, and TEM structural analyses to allow a mechanistic understanding of the performance goal: catalytic activity in the electro-reduction of hydrogen peroxide.
L-cysteine was used in the experiments since, under the conditions of the experiments, it forms relatively stable complexes with bismuth [43,44], silver [45,46], and rhenium [47].

2. Experimental

The nanoparticle synthesis process was performed as follows. First, a 0.1 M L-cysteine (Alfa Aesar, 98%) stock solution in 0.1 M sodium hydroxide (Chempur p.a. Karlsruhe, Germany) was prepared. Solutions of bismuth, silver, and rhenium were prepared by dissolving bismuth oxide (III) (Sigma Aldrich, p.a. St. Louis, MO, USA), silver nitrate (Avantor Materials, p.a. Radnor, PA, USA), and ammonium perrhenate (KGHM Metraco, p.a. Legnica, Poland) in 0.1 M L-cysteine alkaline solutions, respectively. Next, the volume of the solution was standardized using a volumetric flask. Dissolution of AgNO3 was carried out in an ultrasonic bath due to the precipitation of an intermediate compound. The concentration of metals, as well as L-cysteine in the obtained solutions, was 1 × 10⁻² M. The bismuth (III)–L-cysteine complex solution is bright yellow, the silver (I)–L-cysteine complex is a pale yellow, while the Re(VII)–L-cysteine ions mixture is colorless. The solutions were freshly prepared every day due to their limited shelf life (c.a. 48 h).
One w/v % aqueous solution of polyvinyl alcohol (PVA, Sigma Aldrich, MW = 67000, p.a.) solution was prepared as a stabilizer. Immediately before the nanoparticle synthesis, one wt.% solution of sodium borohydride (Fluka, p.a. Buchs, Switzerland) in 0.1 M NaOH was prepared.
Then, the synthesis of nanoparticles from alkaline L–cysteine solutions was carried out with the use of sodium borohydride in a version with the addition of PVA and without the addition of stabilizing agent. The experiments were carried out in glass top-screw jars with a capacity of about 10 cm3. A measured amount of the base solution of the cysteine-metal complex with a concentration of metal ions of 1 × 10⁻² M was transferred to the vessel. Then 1 cm3 of stabilizer solution in the form of 1% PVA was added. The solution was made up of an appropriate amount of distilled water. The amounts of added water and the metal ions stock solution were calculated so that the total solution had the assumed concentration, that is 1 × 10⁻³ M or 1 × 10⁻⁴ M, depending on the experiment. The sample prepared in this way was mixed with 1 cm3 of a fresh solution of sodium borohydride at a concentration of 1% while stirring on a magnetic stirrer at 500 rpm. The synthesis with single metal and alloy nanoparticles was repeated analogously.
The concentration of metals in the systems prepared in this way was, respectively, 1 × 10⁻⁴ M or for selected series 1 × 10⁻³ M, the concentration of L-cysteine was 1 × 10⁻³ M, pH about 8, and the reaction temperature was approximately 20 °C. The solutions after reduction were allowed to equilibrate for 48 h.
The UV–Vis spectra of the obtained suspensions were examined on a Shimadzu UV–2401 PC spectrophotometer (Shimadzu Corp., Kyoto, Japan) in the 200–900 nm range. Quartz cuvettes were used (Hellma Analytics). The particle size distribution in the obtained colloids was measured by DLS (Dynamic Light Scattering) using Malvern Instruments Zetasizer Nano (Malvern Panalytical, Malvern, UK).
The electrocatalytic properties of nanoparticles were measured using SP–300 potentiostat Bio-Logic (Seyssinet-Pariset, France). The cyclic voltammetry and chronoamperometric measurements were carried out in a three-electrode cell. The working electrode was prepared by spreading and evaporating 30 μL of nanoparticles colloidal suspension on a freshly polished glass-like carbon. The Saturated Calomel Electrode (SCE) was applied as the reference electrode and the platinum foil as the anode. Electrocatalytic reduction of hydrogen peroxide was carried out in PBS solution. Hydrogen peroxide and all reagents used to prepare the PBS solution were analytically pure.
HR–TEM analysis was performed using an FEI TECNAI TF 20 X–TWIN microscope (FEI Co., Hillsboro, OR, USA). For this purpose, 10 μL of prepared Ag–Re–Bi colloidal suspension was placed on a copper grid covered with a 20–30 nm amorphous carbon film. Then, the sample was left to dry at room temperature (ca. 20 °C).
The images from HR–TEM were analyzed using ImageJ version 1.52 v. Images from the microscope were analyzed using several steps of protocol related to image preparation. First, the scale was registered. Next, the image was cut to remove the scale bar as well as the text box. Next, the image was filtered using an FFT bandpass filter. The settings of the filter were as follows: filter large structures down to 40 pixels, filter small structures up to 3 pixels, suppress stripes none, tolerance of direction 5%. Next, the particle size was determined as follows: using threshold setup, alloy nanoparticles were detected, and the image was converted to black and white. Using an analyze particles tool, the surface areas of carbon quantum dots were determined. The following parameters were selected: size nm2 from 1 to infinity. This allows for the removal of single pixels and artifacts from the image. Next, circularity was selected in the range of 0.5–1. This allows the exclusion from analysis particles that are stuck together. At and from the surface area of single carbon quantum dots, the diameter was calculated, and the histograms were plotted.
XRD analysis was performed using the Rigaku MiniFlex instrument (Rigaku Corp., Tokyo, Japan). For this purpose, obtained colloids were evaporated on the glass substrate. Next, the obtained deposit on the glass substrate was analyzed. To obtain an efficient amount of materials, 10 mL of the sample was evaporated.

3. Results and Discussion

When the precursor solutions were mixed with the sodium borohydride solution, reactions were immediately observed, and the color of the solution changed. Depending on the precursor metal, the color of the colloid was light beige for bismuth, orange–red for silver colloids, and light yellow for rhenium. Solutions of nanoparticles obtained from solutions containing precursors of various metals took on analogous colors, but with greater intensity, up to a dark cherry color.
However, in individual cases, especially for series containing rhenium, the color oscillation reactions lasted even several minutes. After this time, the colloid was in equilibrium, as evidenced by no further color change.

3.1. Synthesis of Bismuth Nanoparticles

Figure 1 shows the UV–Vis spectra of the obtained solutions after the reduction of the L-cysteine complex of bismuth with sodium borohydride, in the presence of, and without, a stabilizer in the form of PVA.
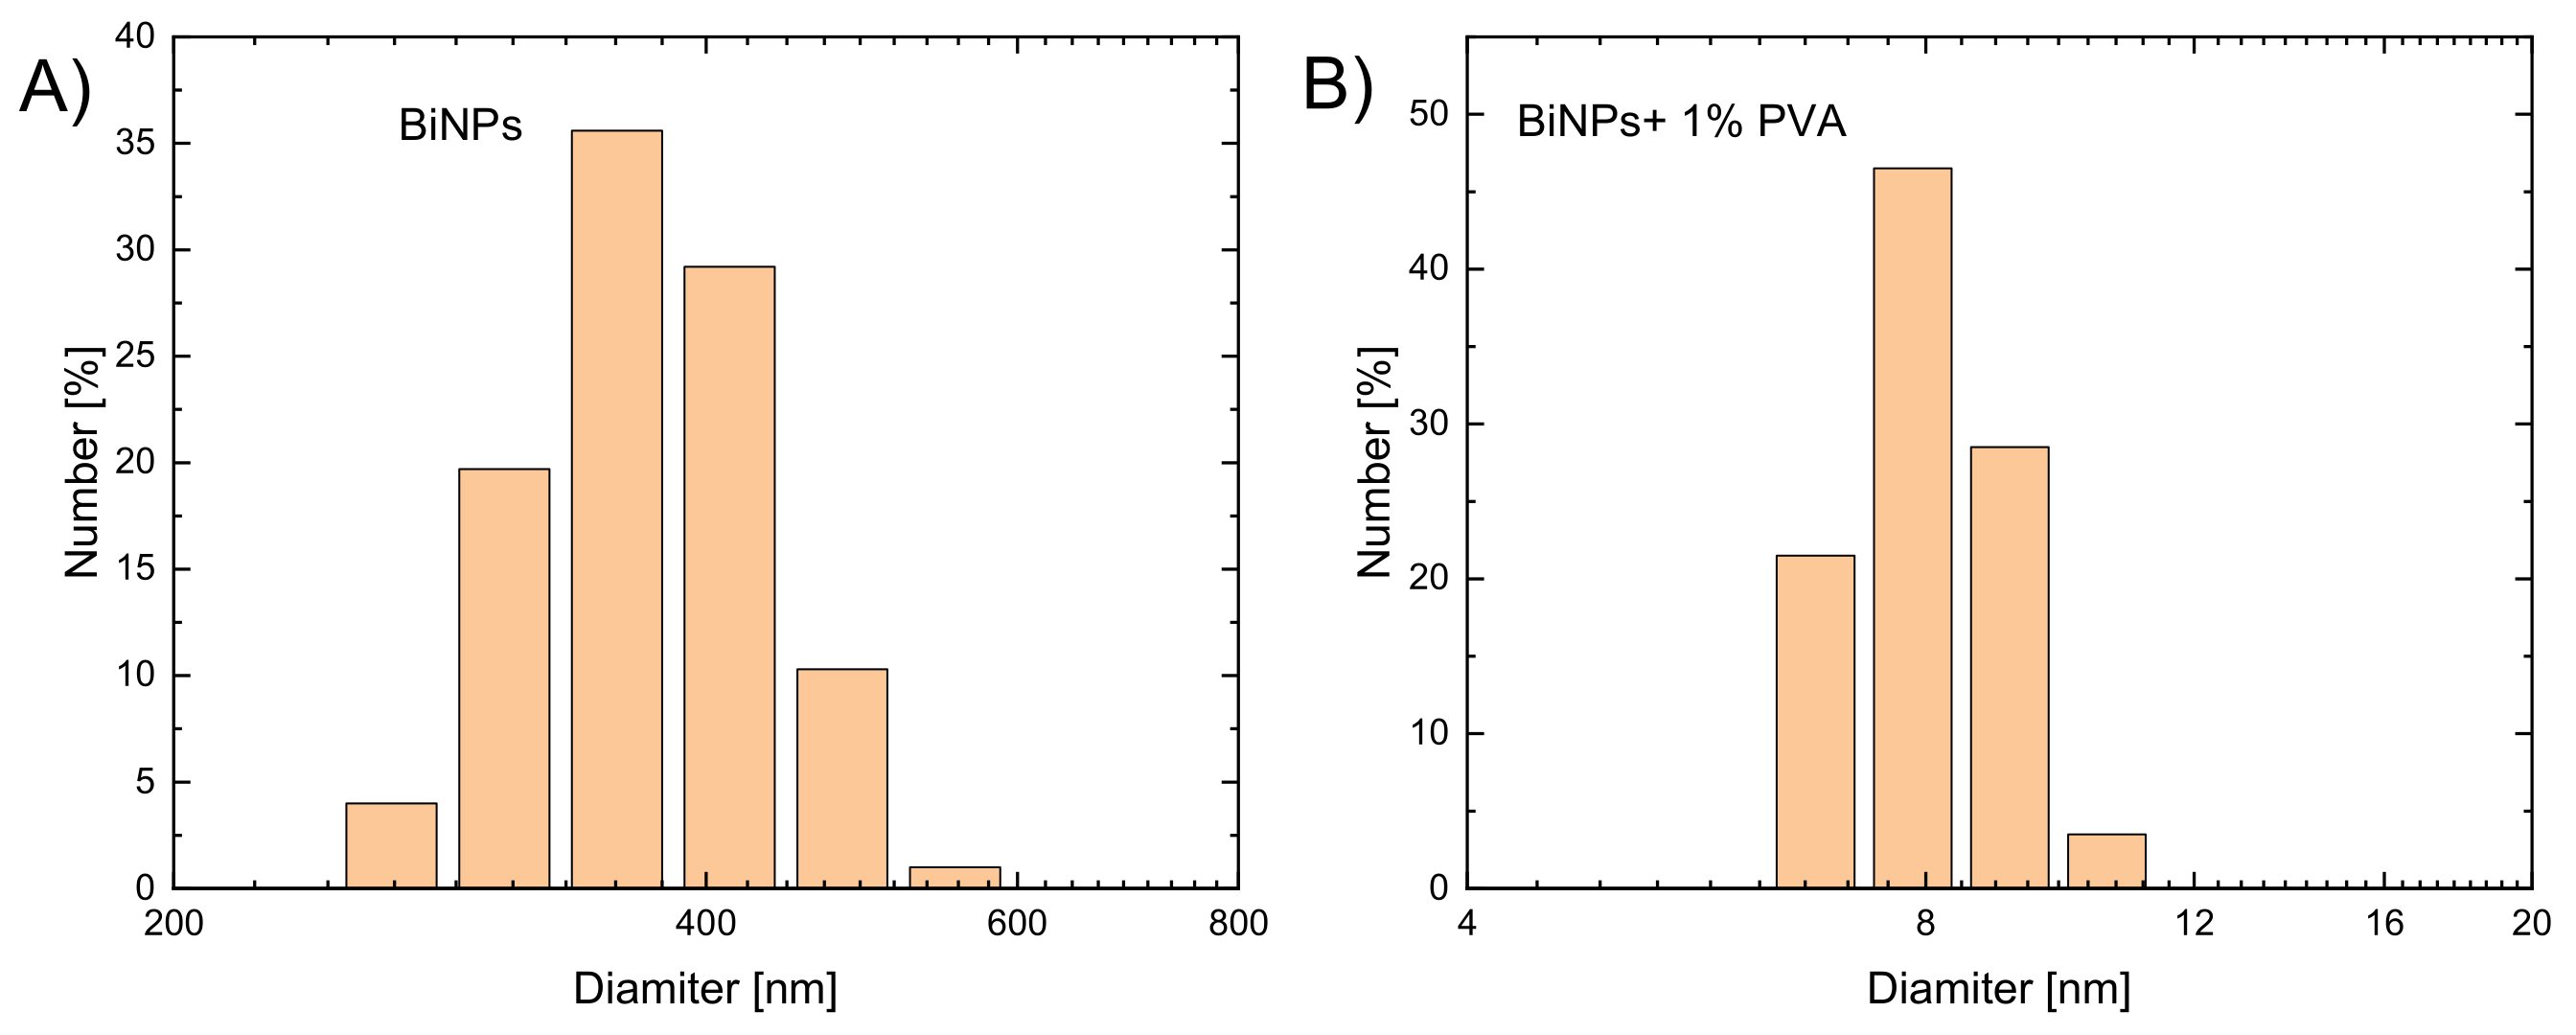
The adsorption spectrum for BiNPs synthesized without adding a stabilizer shows an apparent maximum absorption at the wavelength 232 nm. The absorption maximum is shifted towards the longer wavelengths, 224 nm, when PVA is present during the synthesis. DLS analysis (see Figure 2) shows that the observed peak comes from bismuth nanoparticles with a wide distribution. The dominant fraction is BiNPs, with a size of 514 nm.
The spectrum obtained for the colloid in which the reduction took place in the presence of PVA suggests that the stabilizer significantly influences the course of the process. The elevation of the spectrum is much greater than the sample without PVA. This can be explained by the multi-particle light scattering model developed by Rayleigh [48]. According to this theorem, the intensity of light scattering depends on the size and number of particles and the wavelength of the light. A large number of small particles scatter electromagnetic waves better than a small number of large particles. Moreover, shorter wavelengths of light are scattered more than longer wavelengths. This means that the greater the fragmentation of matter, the more effective the scattering of light is, especially light with shorter wavelengths. These dependencies are described in the following formula (2).
k s 2 π 5 3 m n 2 1 n 2 + 2 2 d 6 λ 4
  • where:
    ks–Rayleigh scattering coefficient
    m–number of scattering particles,
    d–particle diameter (nm),
    n–refractive index,
    λ–wavelength (nm)
The DLS analysis (see Figure 2) shows that the average size of nanoparticles in the colloid is about 8 nm. Similar results were obtained in the literature. Mahiuddin and Ochiai [49] report the synthesis of bismuth nanoparticles with an average size of about 8–30 nm via green synthesis, using lemon juice as a reducing agent.
As can be seen, BiNPs obtained in the system with the addition of PVA are several dozen times smaller than the bismuth nanoparticles present in the sample in which no stabilizer was used.
It was a preliminary assumption that using the L-cysteine–bismuth complex would enable the synthesis of nanoparticles without the need for other stabilizers. Wojnicki et al. report that L-cysteine could be used as a stabilizing agent and complexing agent for Ag+ ions in the AgNPs synthesis method [50]. It was expected that L-cysteine–Bi(III) could form stable complexes in the used pH range.
Thermodynamic calculations using HSC v. 5.11 software showed a higher affinity of Bi for oxygen than Bi for sulfur −119 kcal, and −33 kcal, respectively, at 20 °C. Thus, it can be concluded that PVA, which contains hydroxyl groups in its structure, is a better stabilizer than L-cysteine with a thiol functional group. This observation is reflected in the size of the nanoparticles obtained in the presence of PVA.
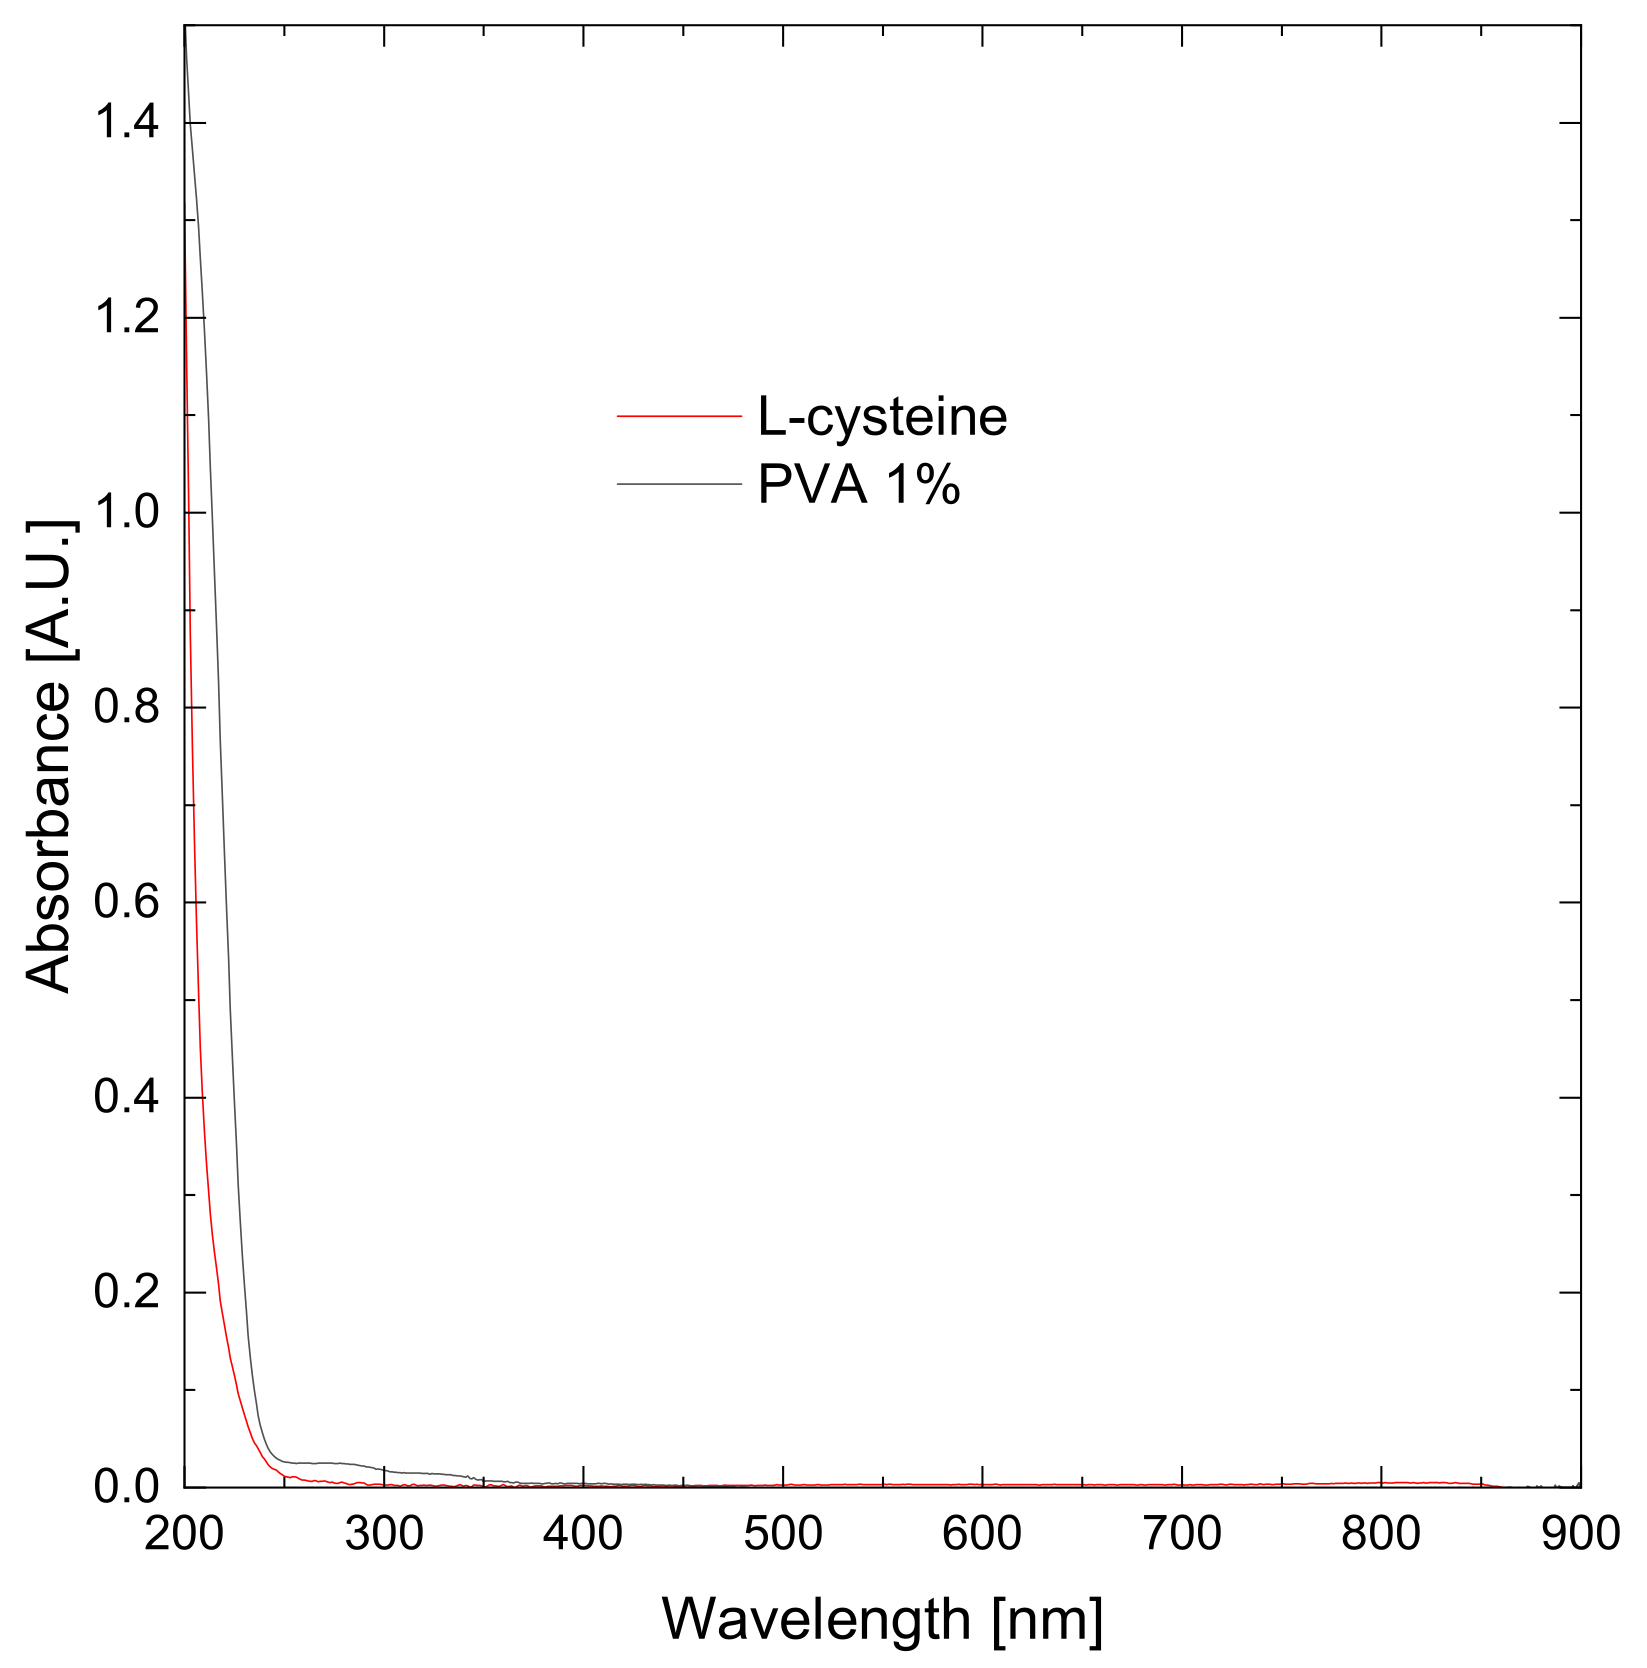
The presence of PVA and free L-cysteine in the solution does not affect the absorption spectra of the obtained colloids, which is confirmed by the UV–Vis analysis carried out for these pure components (see Figure 3).

3.2. Synthesis of Bismuth–Silver Nanoparticles

The UV–Vis analysis of the solutions obtained in the next stage of the work is shown in Figure 4. In this case, the experiment aimed to obtain bimetallic nanoparticles containing silver and bismuth (BiAgNPs). The maximum absorption peak for the nanoparticles obtained without a stabilizer is in the same range as BiNPs, which is 233 nm. However, the values of this maximum are different because the peak for bismuth–silver nanoparticles is lower than for the corresponding bismuth nanoparticle absorption spectrum (see Figure 1).
It is significant that in the case of the spectrum of the colloid synthesized with the addition of PVA, the maximum absorption is not observed. The quenching of the plasmon may be related to the absorption of the stabilizer on the surface of the nanoparticles. The OH- hydroxyl groups present in PVA can form a bond with bismuth atoms. The unpaired electron on the bismuth valence shell responsible for the occurrence of plasmon resonance is shared with an electron from the OH group, which results in the extinction of the plasmon in the molecule.
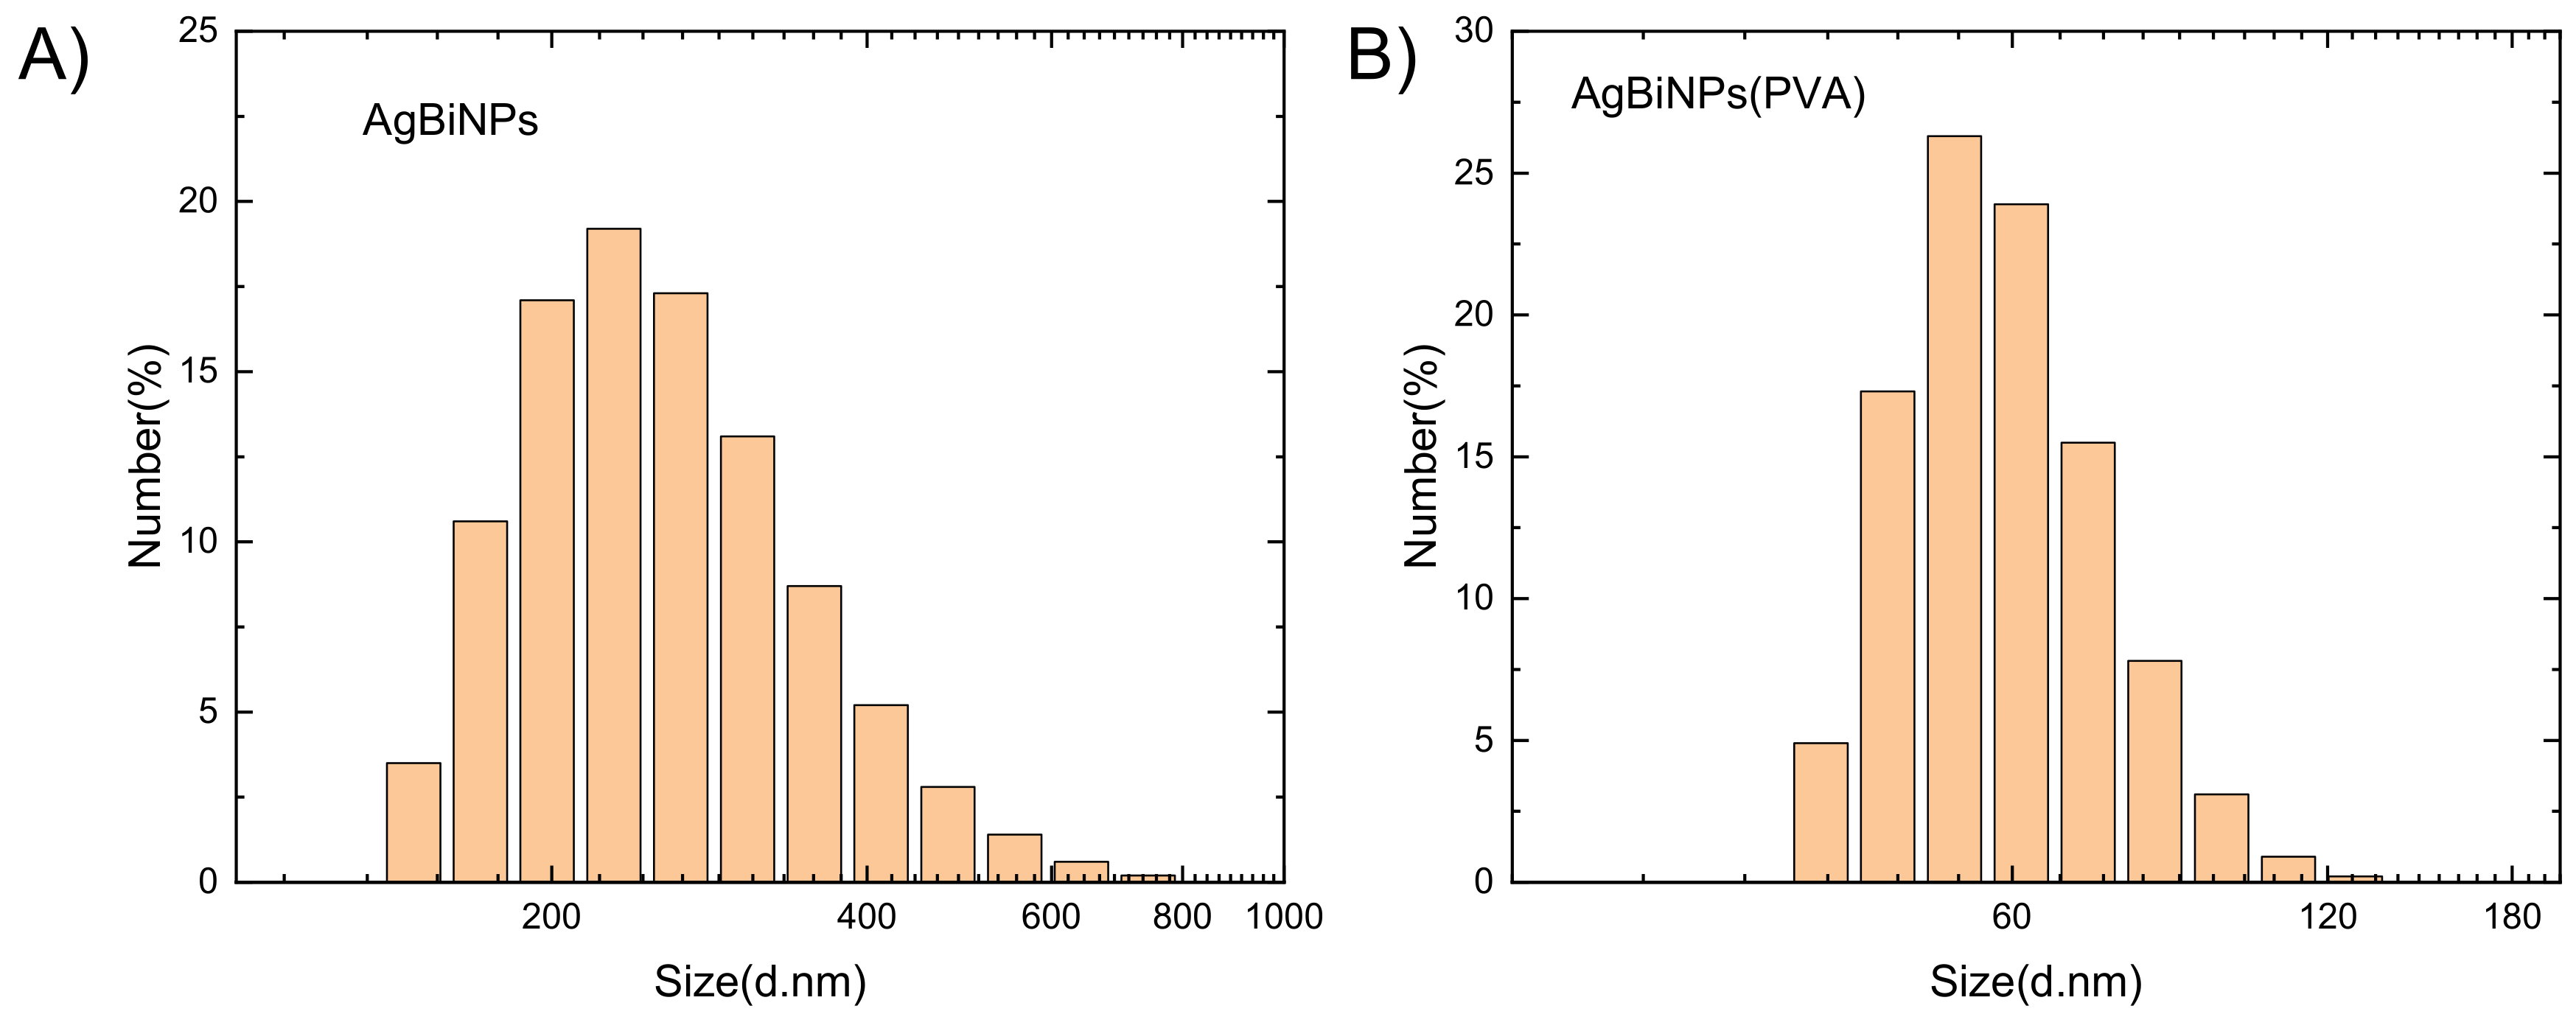
Based on the DLS analysis results (see Figure 5), the BiAgNPs particle sizes obtained in the synthesis process with and without PVA can be compared. In the case of the alloyed nanoparticles obtained without a stabilizing agent, their hydrodynamic diameter was 245 nm. The sample showed a broad size distribution. The use of PVA reduces the mean particle size to 58 nm. This is a relatively large particle size compared to other work on BiAg alloy nanoparticles. The authors of a study [51] report that using the same synthesis conditions as in this manuscript, they obtained BiAgNPs with an average particle size of 10–30 nm.
The positions of the maximum absorption peaks for the spectra of the bismuth–silver colloid (see Figure 4) are subtly shifted relative to each other. On the molecular level, this can be explained by forming a nanoalloy from the metals present in the reaction system or by chemical adsorption of rhenium, silver, or bismuth molecules to each other. The second variant is more probable from the point of view of the reaction path because the formation of a nanoalloy is much rarer and more difficult to obtain. The occurrence of bonding between nanoparticles present in the solution, including the adsorption of a chemical compound on the surface of given particles, is a more common phenomenon. It changes the properties of such nanoparticles. This changes quantum effects, resulting in a plasmon shift of the molecule being studied. This is observed in the form of a change in the position of the maximum absorption peak.

3.3. Synthesis of Bismuth–Rhenium Nanoparticles

The course of the UV–Vis (see Figure 6) shows almost identical correlations that were observed in the comparative analysis of the BiNPs and BiAgNPs series. An accurate interpretation of the obtained spectra shows that the maximum absorption for the spectrum of the BiReNPs sample synthesized without adding a stabilizer reaches much higher values than the corresponding BiAgNPs or BiNPs samples. In this case, similarly to the AgBiNPs, the disappearance of the maximum absorption is also observed for the colloid synthesized from PVA. Similarly, it may also result from the quenching of plasmon resonance by adsorption of PVA on the surface of nanoparticles and the formation of bonds of molecules with hydroxyl groups.
Considering the results obtained during the DLS analysis (see Figure 7), it can be concluded that using the stabilizer does not reduce the mean particle size in this case. Both in the sample with and without PVA, BiReNPs with a size of about 14 nm were the dominant fraction.
The maximum absorption for the spectrum of the BiReNPs sample synthesized without the addition of a stabilizer reaches significantly higher values than the corresponding BiAgNPs or BiNPs samples. In this case 231 nm. As can be seen in the UV–Vis spectra (see Figure 6), the maximum position also clearly shifts concerning the other colloids towards the lower wavelengths. It is probably caused by the formation of a nanoalloy, or adsorption of the components present in the system. A model of the formation of chemical bonds in the form of oxygen bridges between metallic bismuth and the perrhenate ions (ReO4) present in the solution is very likely, due to the high chemical affinity of bismuth for oxygen.

3.4. Synthesis of Silver–Rhenium Nanoparticles

The UV–Vis spectra of the colloids obtained at this stage show the same course in the case of the reaction system with and without the stabilizer (see Figure 8). Both recorded absorption charts showed no clear highs.
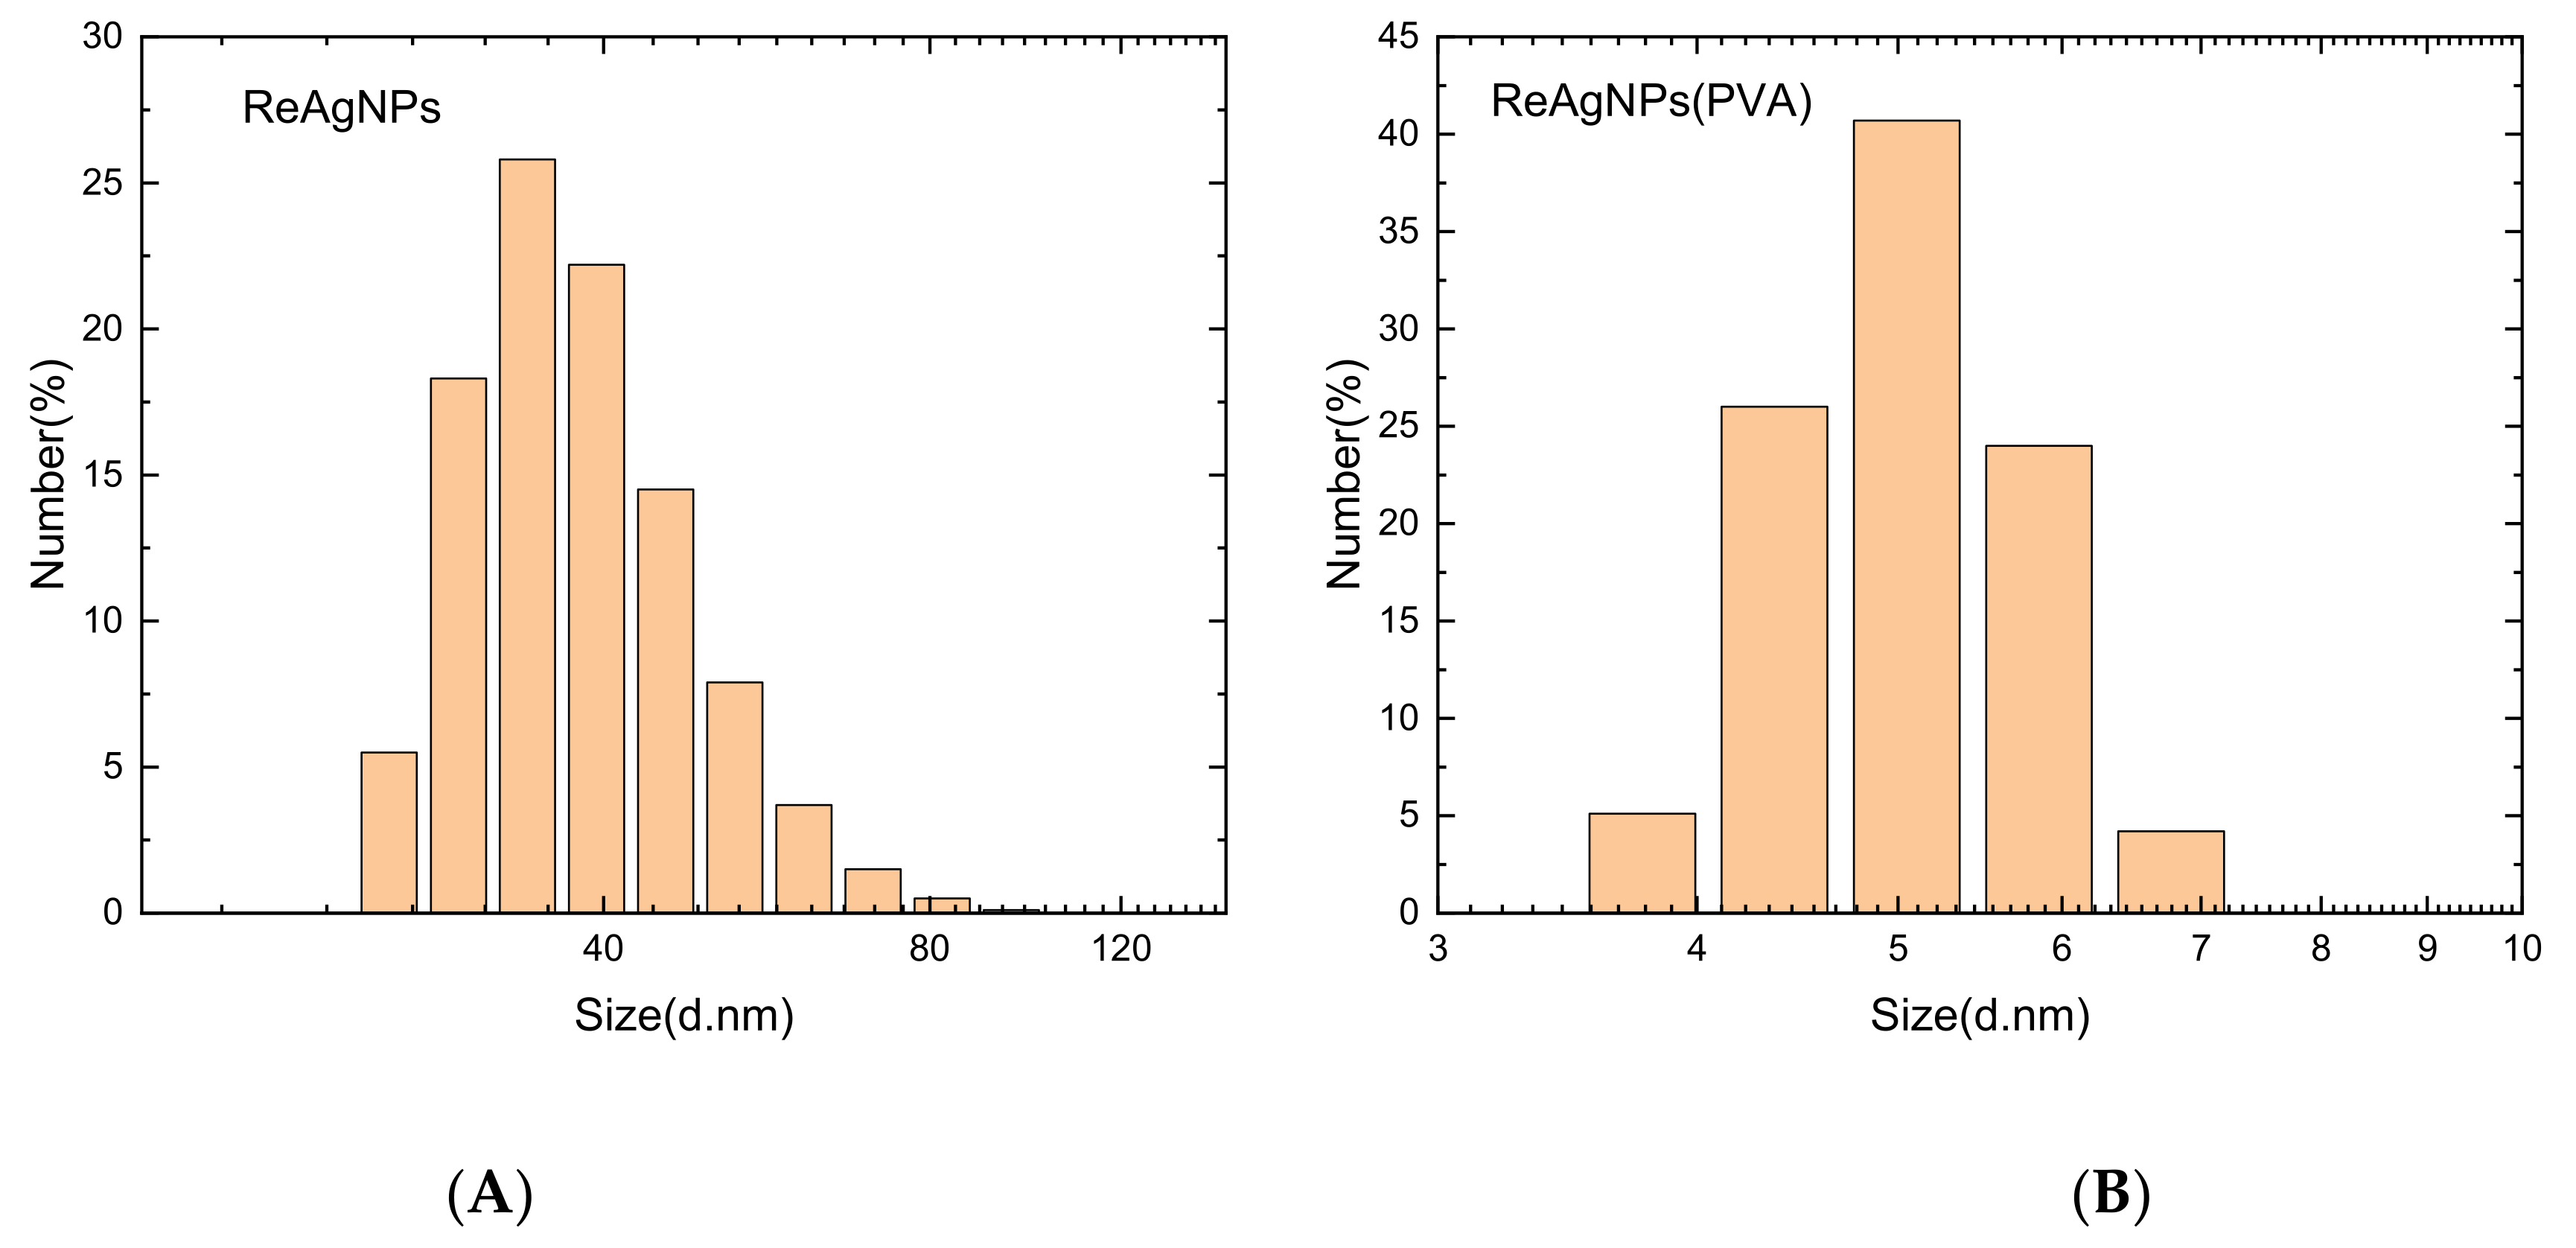
DLS analysis (see Figure 9) also shows deviations from the trends observed for the remaining series. For the sample without PVA, the obtained colloid had particles about eight times smaller (5 nm) than for the stabilizer system (40 nm).
In this experimental series, the absorption maximum is much lower than for the other colloids. It should be noted here that this is a series in which no bismuth is present in the reaction. This may suggest that the peak of maximum absorbance in the previous graphs comes from this metal, and the subtle shifts come from the admixtures in the form of silver and rhenium.
Another explanation for this is the quenching of rhenium observed for other plasmon samples. For example, silver has a plasmon in the range of 350–500 nm, depending on its particle size. However, none of the spectra of silver-containing colloids obtained during the research show a peak in this area. This supports the hypothesis that rhenium can extinguish a plasmon from another metal. On the other hand, obtaining larger nanoparticles for the system with a stabilizer may be caused by the formation of ReAgNPs clusters and the stabilizer, which resulted in an effect contrary to the intended one.

3.5. Synthesis of Bismuth–Silver-Rhenium Nanoparticles

Finally, experimental series were carried out using all three metals: bismuth, silver, and rhenium in the variant with and without PVA. The concentration of metal ions, in this case, was variable depending on the measurement series and was 1 × 10⁻⁴ M for silver and from 1 × 10⁻⁴ M to 1 × 10⁻³ M for rhenium and bismuth.
The use of a higher concentration of rhenium and bismuth did not significantly affect the course of the absorption spectra. On the other hand, the use of a stabilizer in the form of PVA resulted in a significant reduction in the intensity of the absorption peaks.
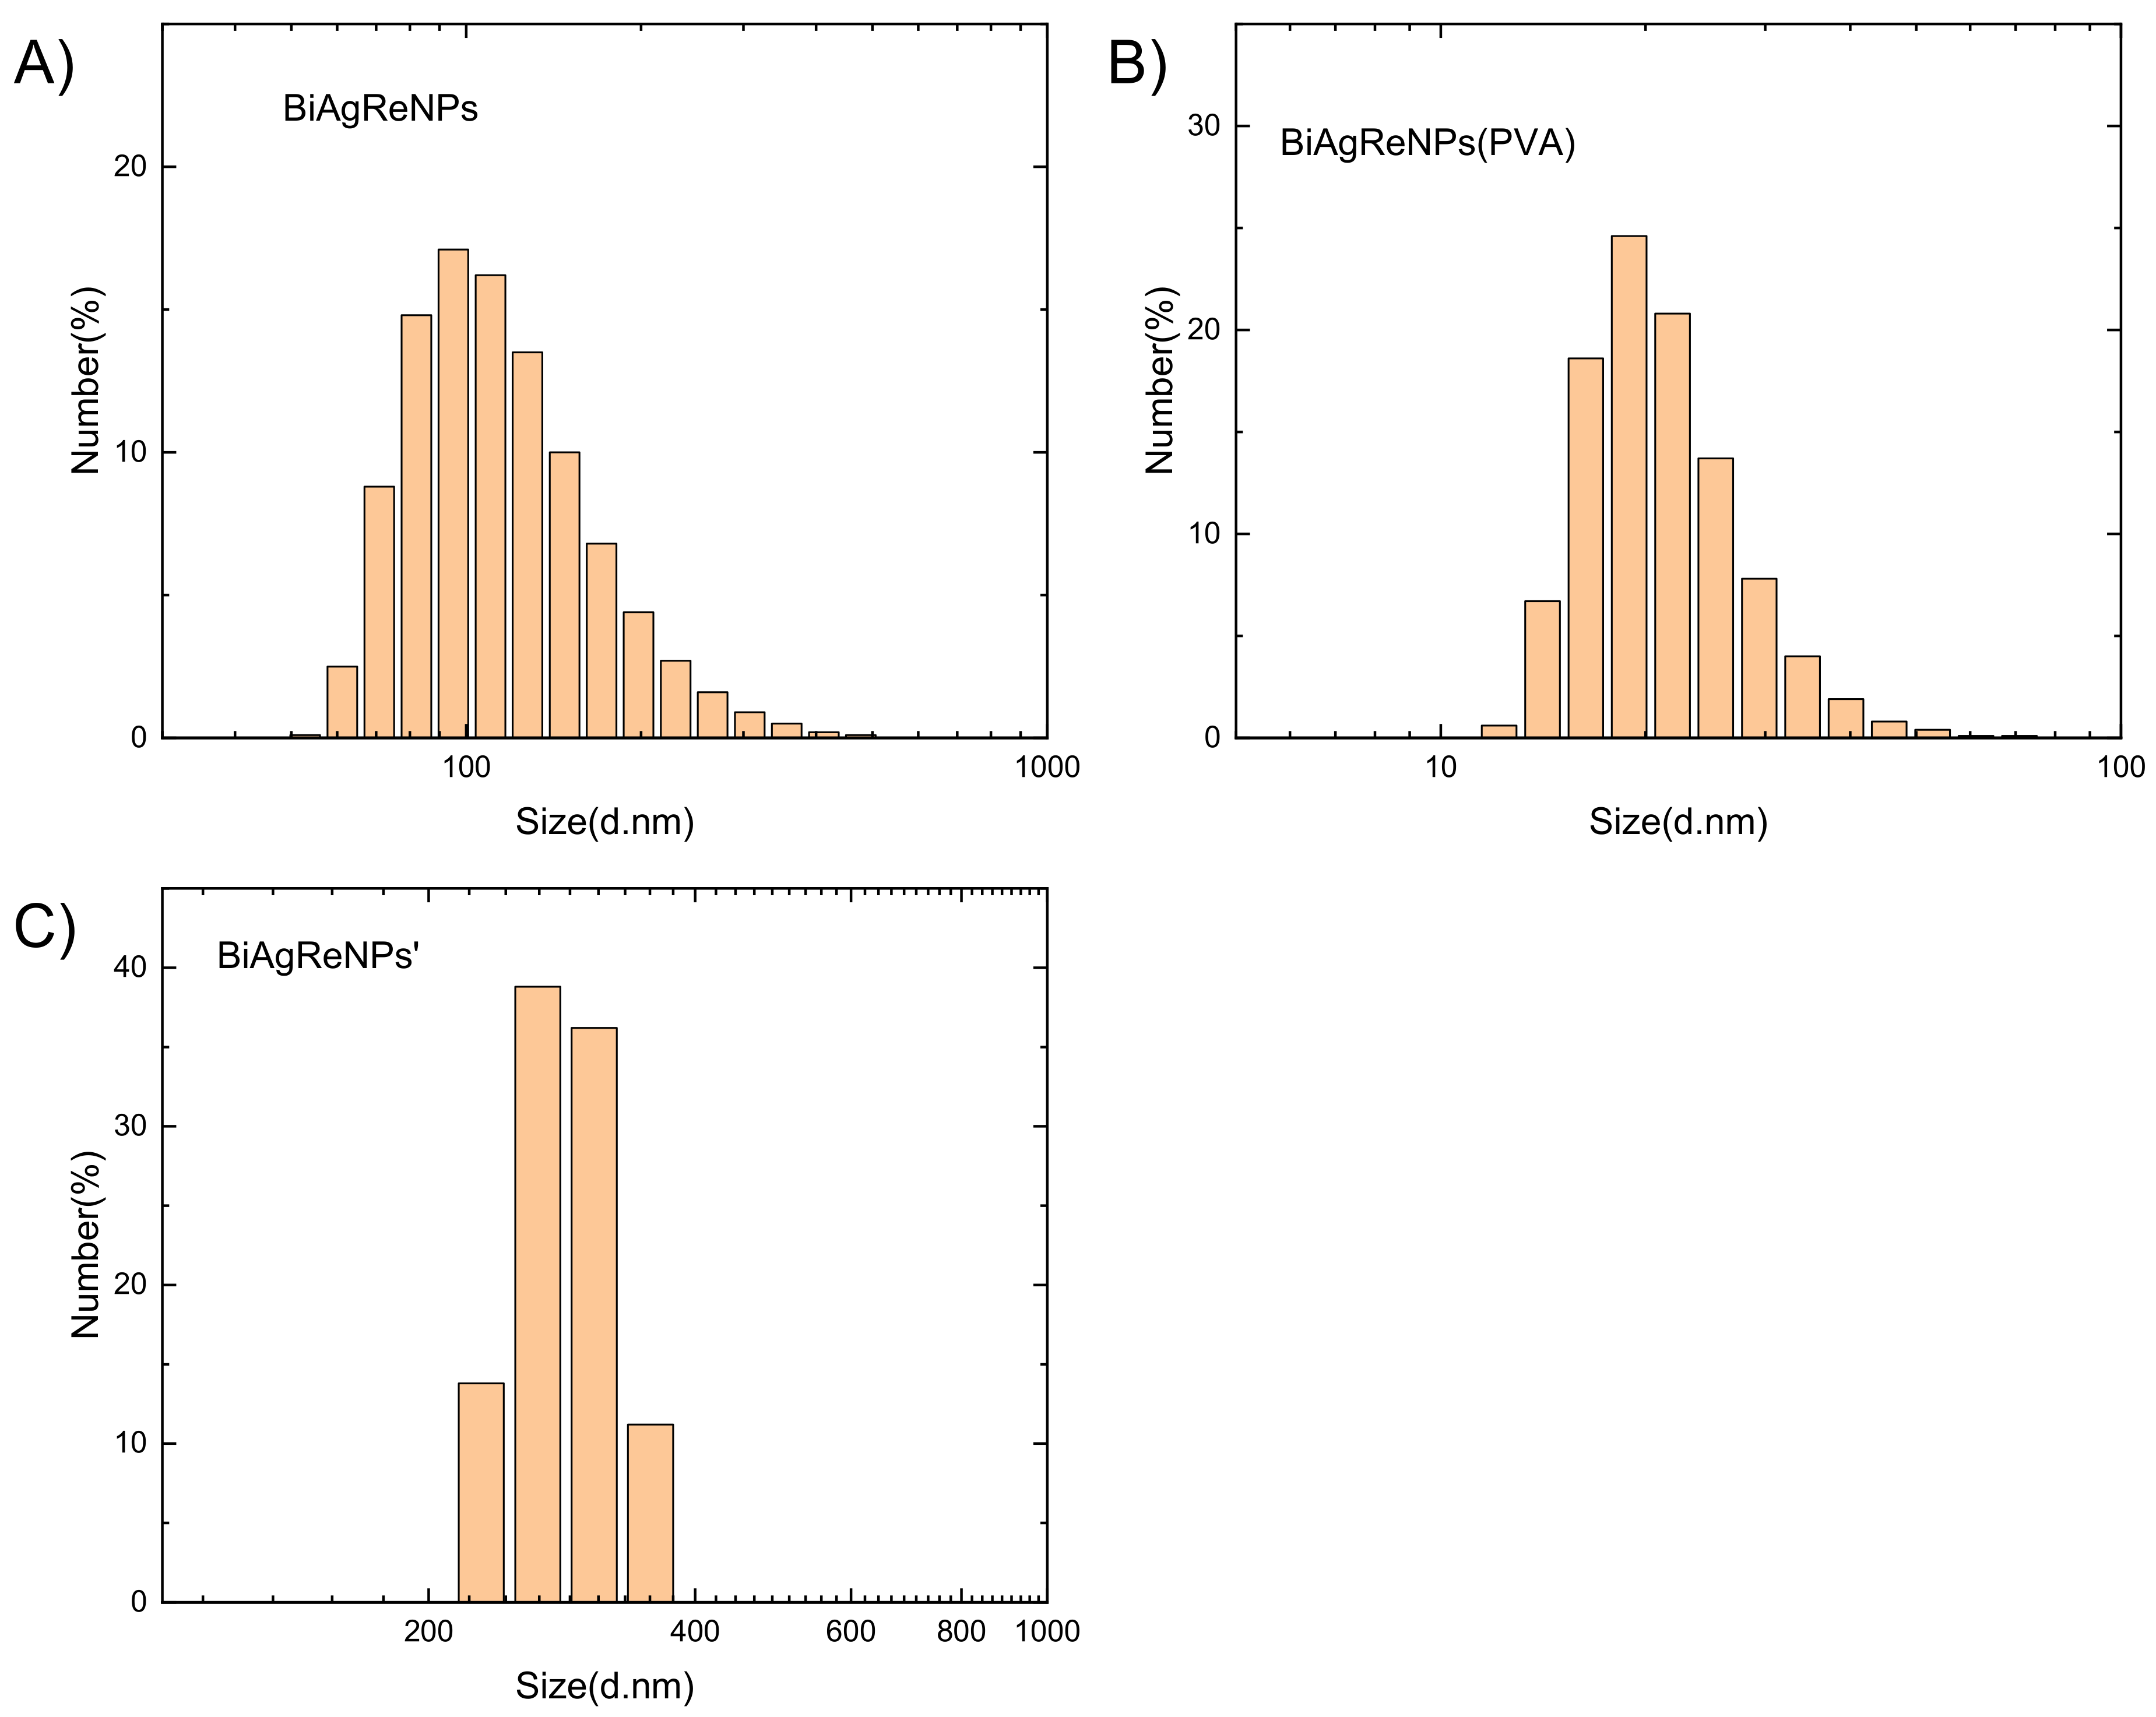
However, DLS analysis (see Figure 10) indicates that BiReAgNPs synthesized from a solution with an equal concentration of all precursors of 1 × 10⁻⁴ M, without a stabilizer, are 132 nm in size. At the same time, in the reaction with a higher concentration of rhenium and bismuth without PVA, the dominant fraction are particles with a size of 354 nm. The use of a PVA stabilizer for an increased concentration of bismuth rhenium ions, on the other hand, leads to a significant reduction of the average particle size to 19 nm, with a relatively narrow size distribution. In this case, the influence of the use of a stabilizer is visible.
Figure 11 shows the absorbance spectra for the colloids obtained with different concentrations of metal ions. The maximum absorption can be observed in the wavelength range of 230–235 nm for each tested colloid. One should also pay attention to the appearance of a second distinct maximum, around 320 nm. This suggests the obtainment of BiReAgNPs in a shape other than spherical or the appearance of two types of plasmon–endowed nanoparticles in solution.
The particle size obtained from the DLS study (see Figure 10) differs from the results obtained from the HR-TEM photomicrograph (see Figure 12). This is because DLS measures the hydrodynamic diameter of the particles. As a result, the measured quantity may be overstated in this case. In the analysis of the image obtained with HR-TEM, the actual size of the observed particles is measured.
In Figure 12, the histogram of Ag-Bi-Re nanoparticles is shown.
To determine the shape and form of occurrence (alloy, core-shell, aggregates) of the synthesized nanoparticles, TEM microscopic analysis was performed. The analysis was performed for the samples for the experimental series samples with the concentration of precursors 1 × 10⁻³ M for bismuth and rhenium and 1 × 10⁻⁴ M for silver in the presence of PVA. The results of the analysis are presented in Figure 13.
The TEM analysis showed that the nanoparticles obtained in this experimental series have a spherical or oval shape (see Figure 13). Moreover, they exhibit a crystalline structure. The average particle size is in agreement with the DLS analysis results. More detailed analyses are required to determine the crystal structure. It was originally assumed that due to the large differences in redox potentials, core–shell nanoparticles may be formed. However, as can be seen, this is not the case. The lack of characteristic plasmon resonance peak in the UV–Vis spectrum for AgNPs confirms that Ag is bonded in the alloy. Preliminary research results (FFT analysis of HR-TEM) have ruled out that the nanoparticles have an FCC structure.

3.6. XRD Analysis of Ag–Bi–Re Nanoparticles

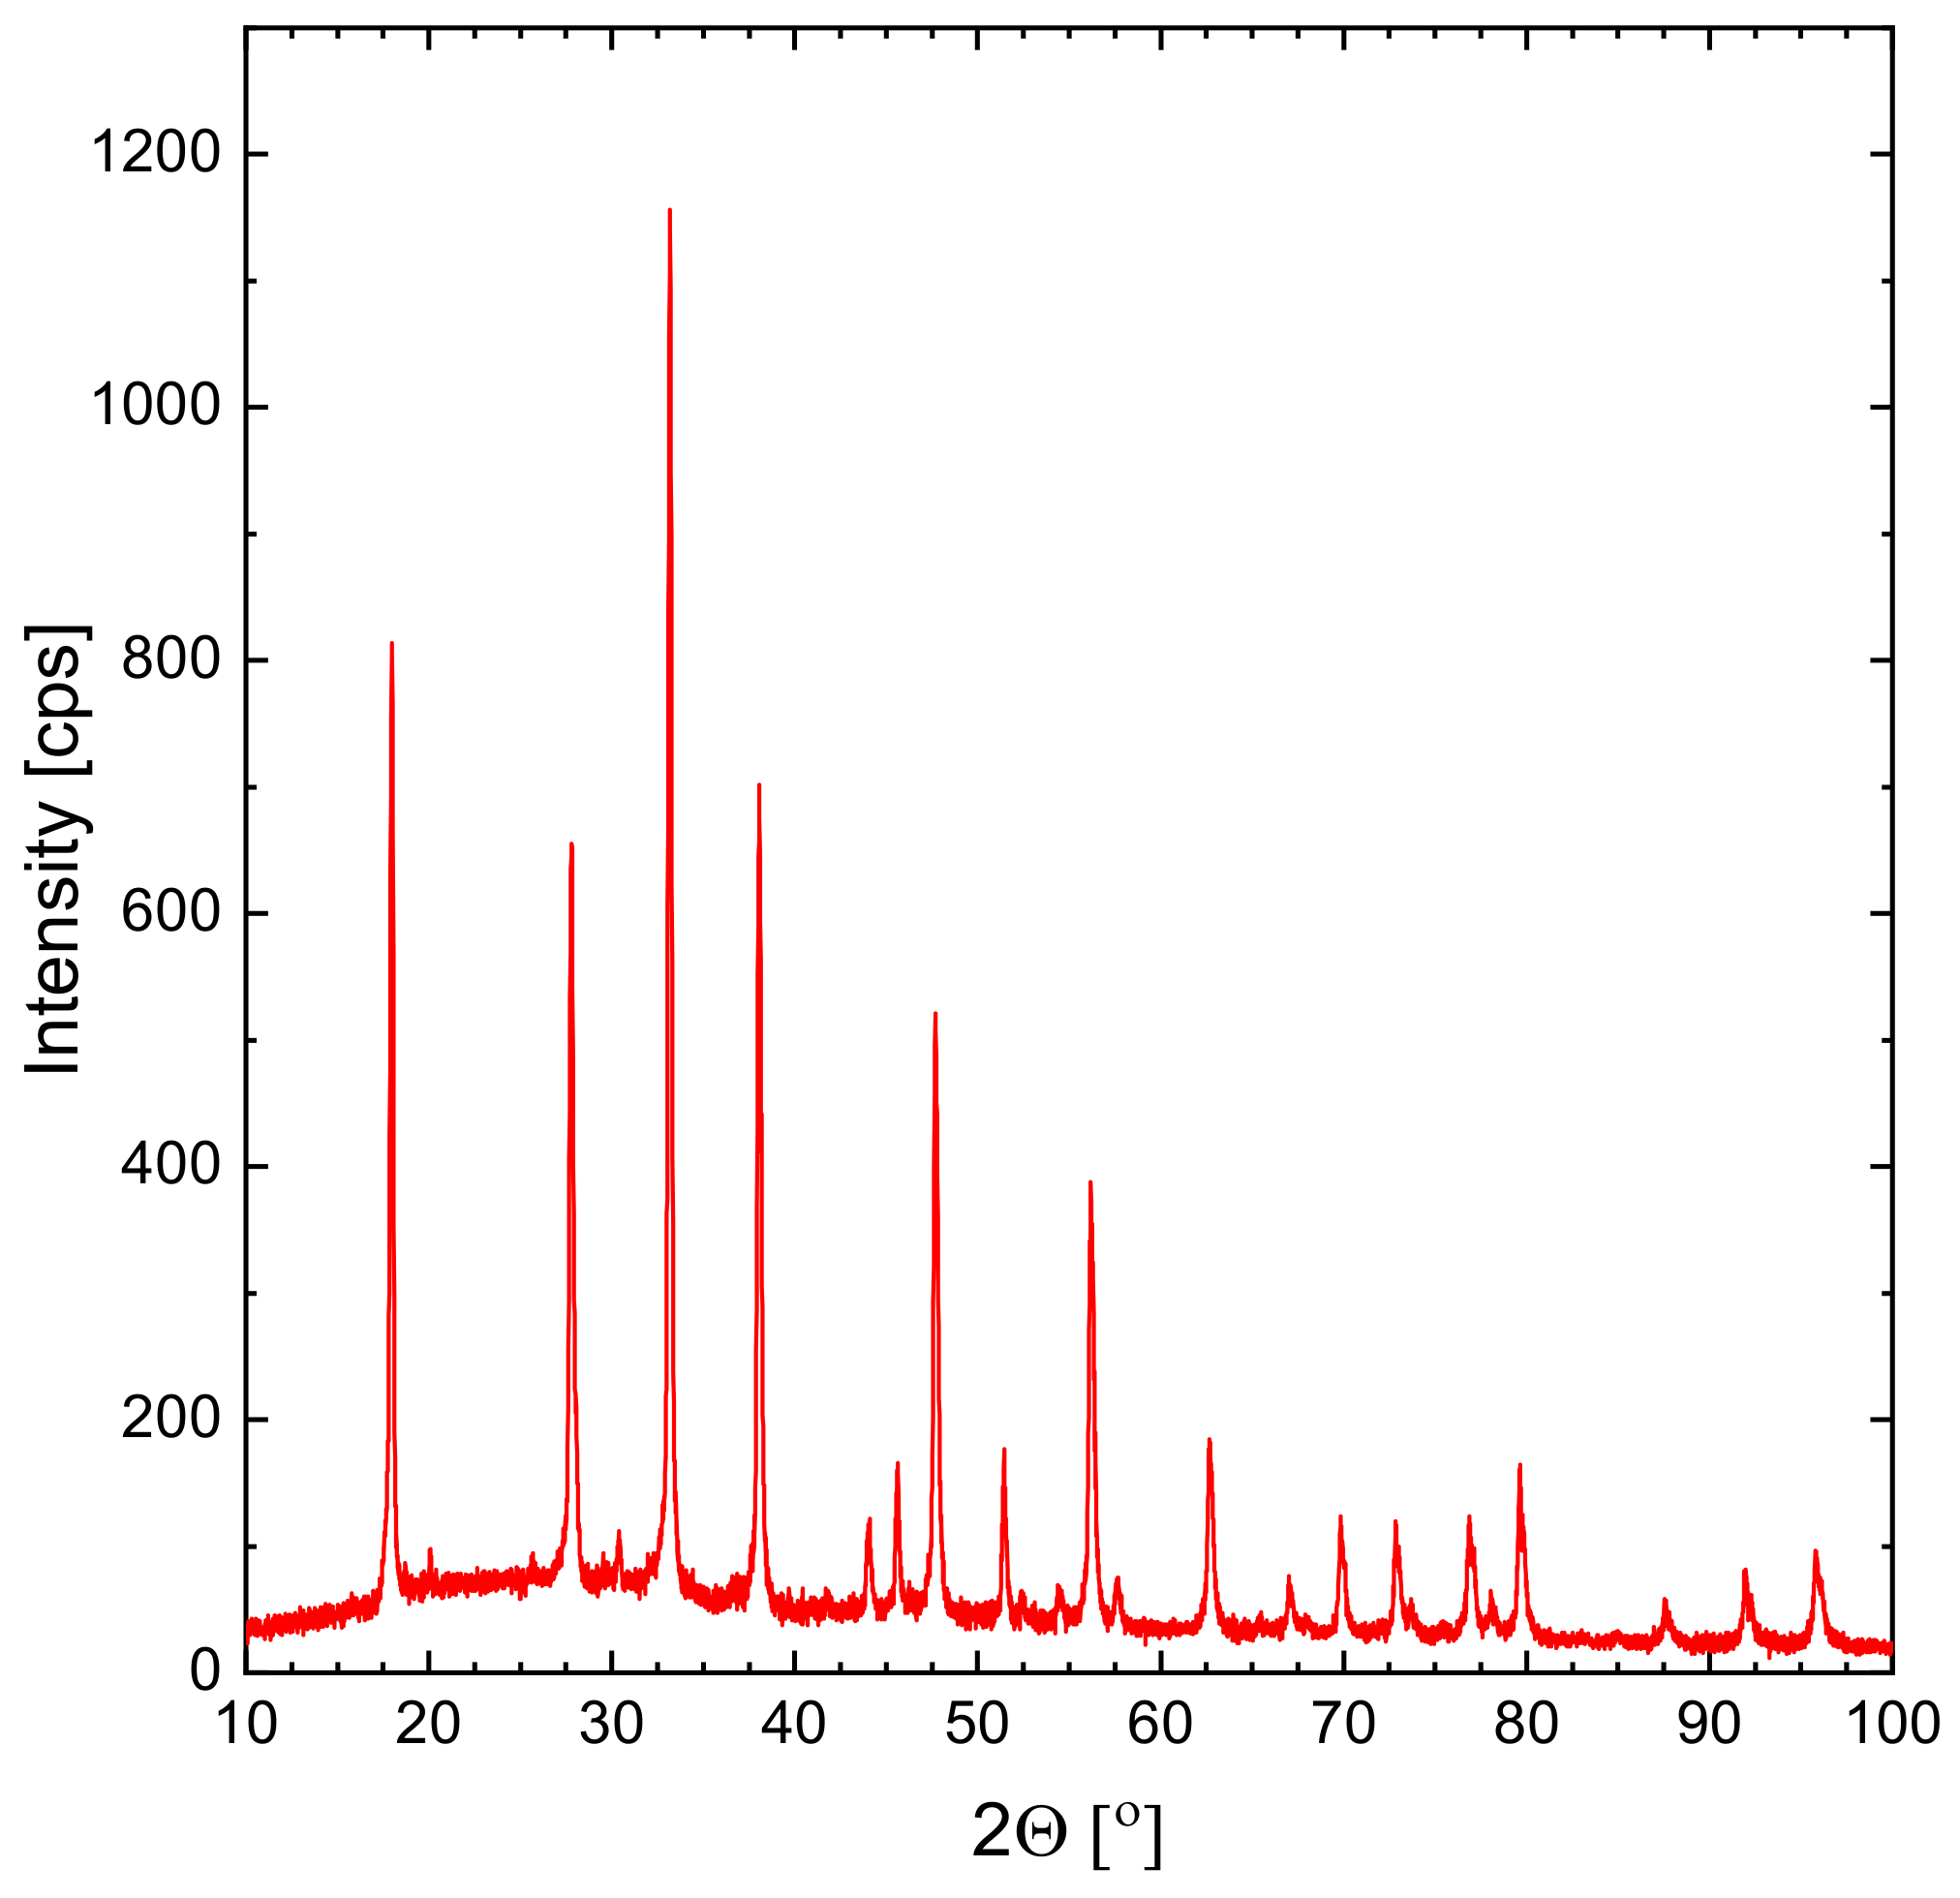
The XRD analysis of BiReAg nanoparticles was performed. Obtained results are shown in Figure 14.
The database does not contain information on the existence of the Ag–Bi–Re alloy. Therefore, confirming whether a nanoalloy has been obtained requires more detailed research. At this stage, it was possible to exclude the following groups of compounds: metallic bismuth, metallic rhenium, metallic silver, bismuth oxides, rhenium oxides, silver oxides, silver–bismuth alloy, sodium metaborate, sodium hydroxide, sodium nitrate.
Using the Scherer equation, it is possible to calculate crystal size.
d = K · λ β · c o s Θ
where: K–dimensionless shape factor (here: 0.95), λ–wavelength of Cu radiation, Q–Bragg angle, β–line broadening at half of the peak maximum; the size of single crystallite d was calculated. The obtained value for the highest peak was 56.0 nm. We also performed calculations for the first 19 peaks. The calculated mean value is 60.6 ± 19 nm.
The particle size obtained from the HRTEM study differs from the results obtained by XRD analysis. This suggests a polydispersity of the sample. In this case, the mathematical analysis preferentially indicates the presence of larger particles.
The low peaks and the wide peaks are derived from small particle sizes. High and narrow peaks, on the other hand, from large particles. As is well known, the sum of Gaussian functions also gives the Gaussian function. Therefore, in the case of the sum of the peaks from small and large particles, we get the average value, where the contribution of the peaks of the large particles is much greater.

3.7. Catalytic Properties Studies

Electrocatalytic reduction of hydrogen peroxide was carried out for selected colloids to study their catalytic properties. Electrocatalytic tests were carried out for silver, rhenium, bismuth nanoparticles and nanoparticles synthesized from a solution containing 1 × 10⁻³ M of rhenium and bismuth ions and 1 × 10⁻⁴ M of silver ions. Only colloids synthesized in the presence of a PVA stabilizer were used for the research.
It was necessary first to determine their specific surface area to determine and compare the electrocatalytic abilities of the synthesized nanoparticles. Thanks to this, it will be possible to standardize the results. This step assumes that all metallic precursors have been reduced to nanoparticles. This way, the specific surface area of nanoparticles per colloid volume was calculated based on the initial concentration and the mean particle size obtained from the DLS analysis. First, the number of nanoparticles per colloid volume was counted using Equation (4). For the calculations, it was assumed that the entire amount of precursors present in the solution had been reduced to a zero oxidation state [52].
N i = C 0 , A u I I I · V · M m , A u · F r i ρ A u · 4 3 · π R i 3  
N i = C 0 , B i I I I / A g I / R e V I I · V · M m , B i / A g / R e · F r i ρ B i / A g / R e · 4 3 · π R i 3
  • where:
    Ni–number of particles in Ri radius
    Mm,Bi/Ag/Re−molar mass of metal precursor
    C0,Bi(III)/Ag(I)/Re(VII)–initial concentration of precursor salt
    V–the value of suspension used in the synthesis of the electrode (in this case 30 µL)
    ρ Bi/Ag/Re–density of the metal precursor
    Ri–radius of “i” fraction of nanoparticles
    Fri–a fraction of nanoparticles in %
Then, the number of particles as a function of their radius was used to determine the surface area of the electrode taking into account the size distribution of those particles. The following equation was used (3) [52]. Table 1 shows the calculation results for the tested colloids.
S = i 1 n ( N t 4 π R i 2 )
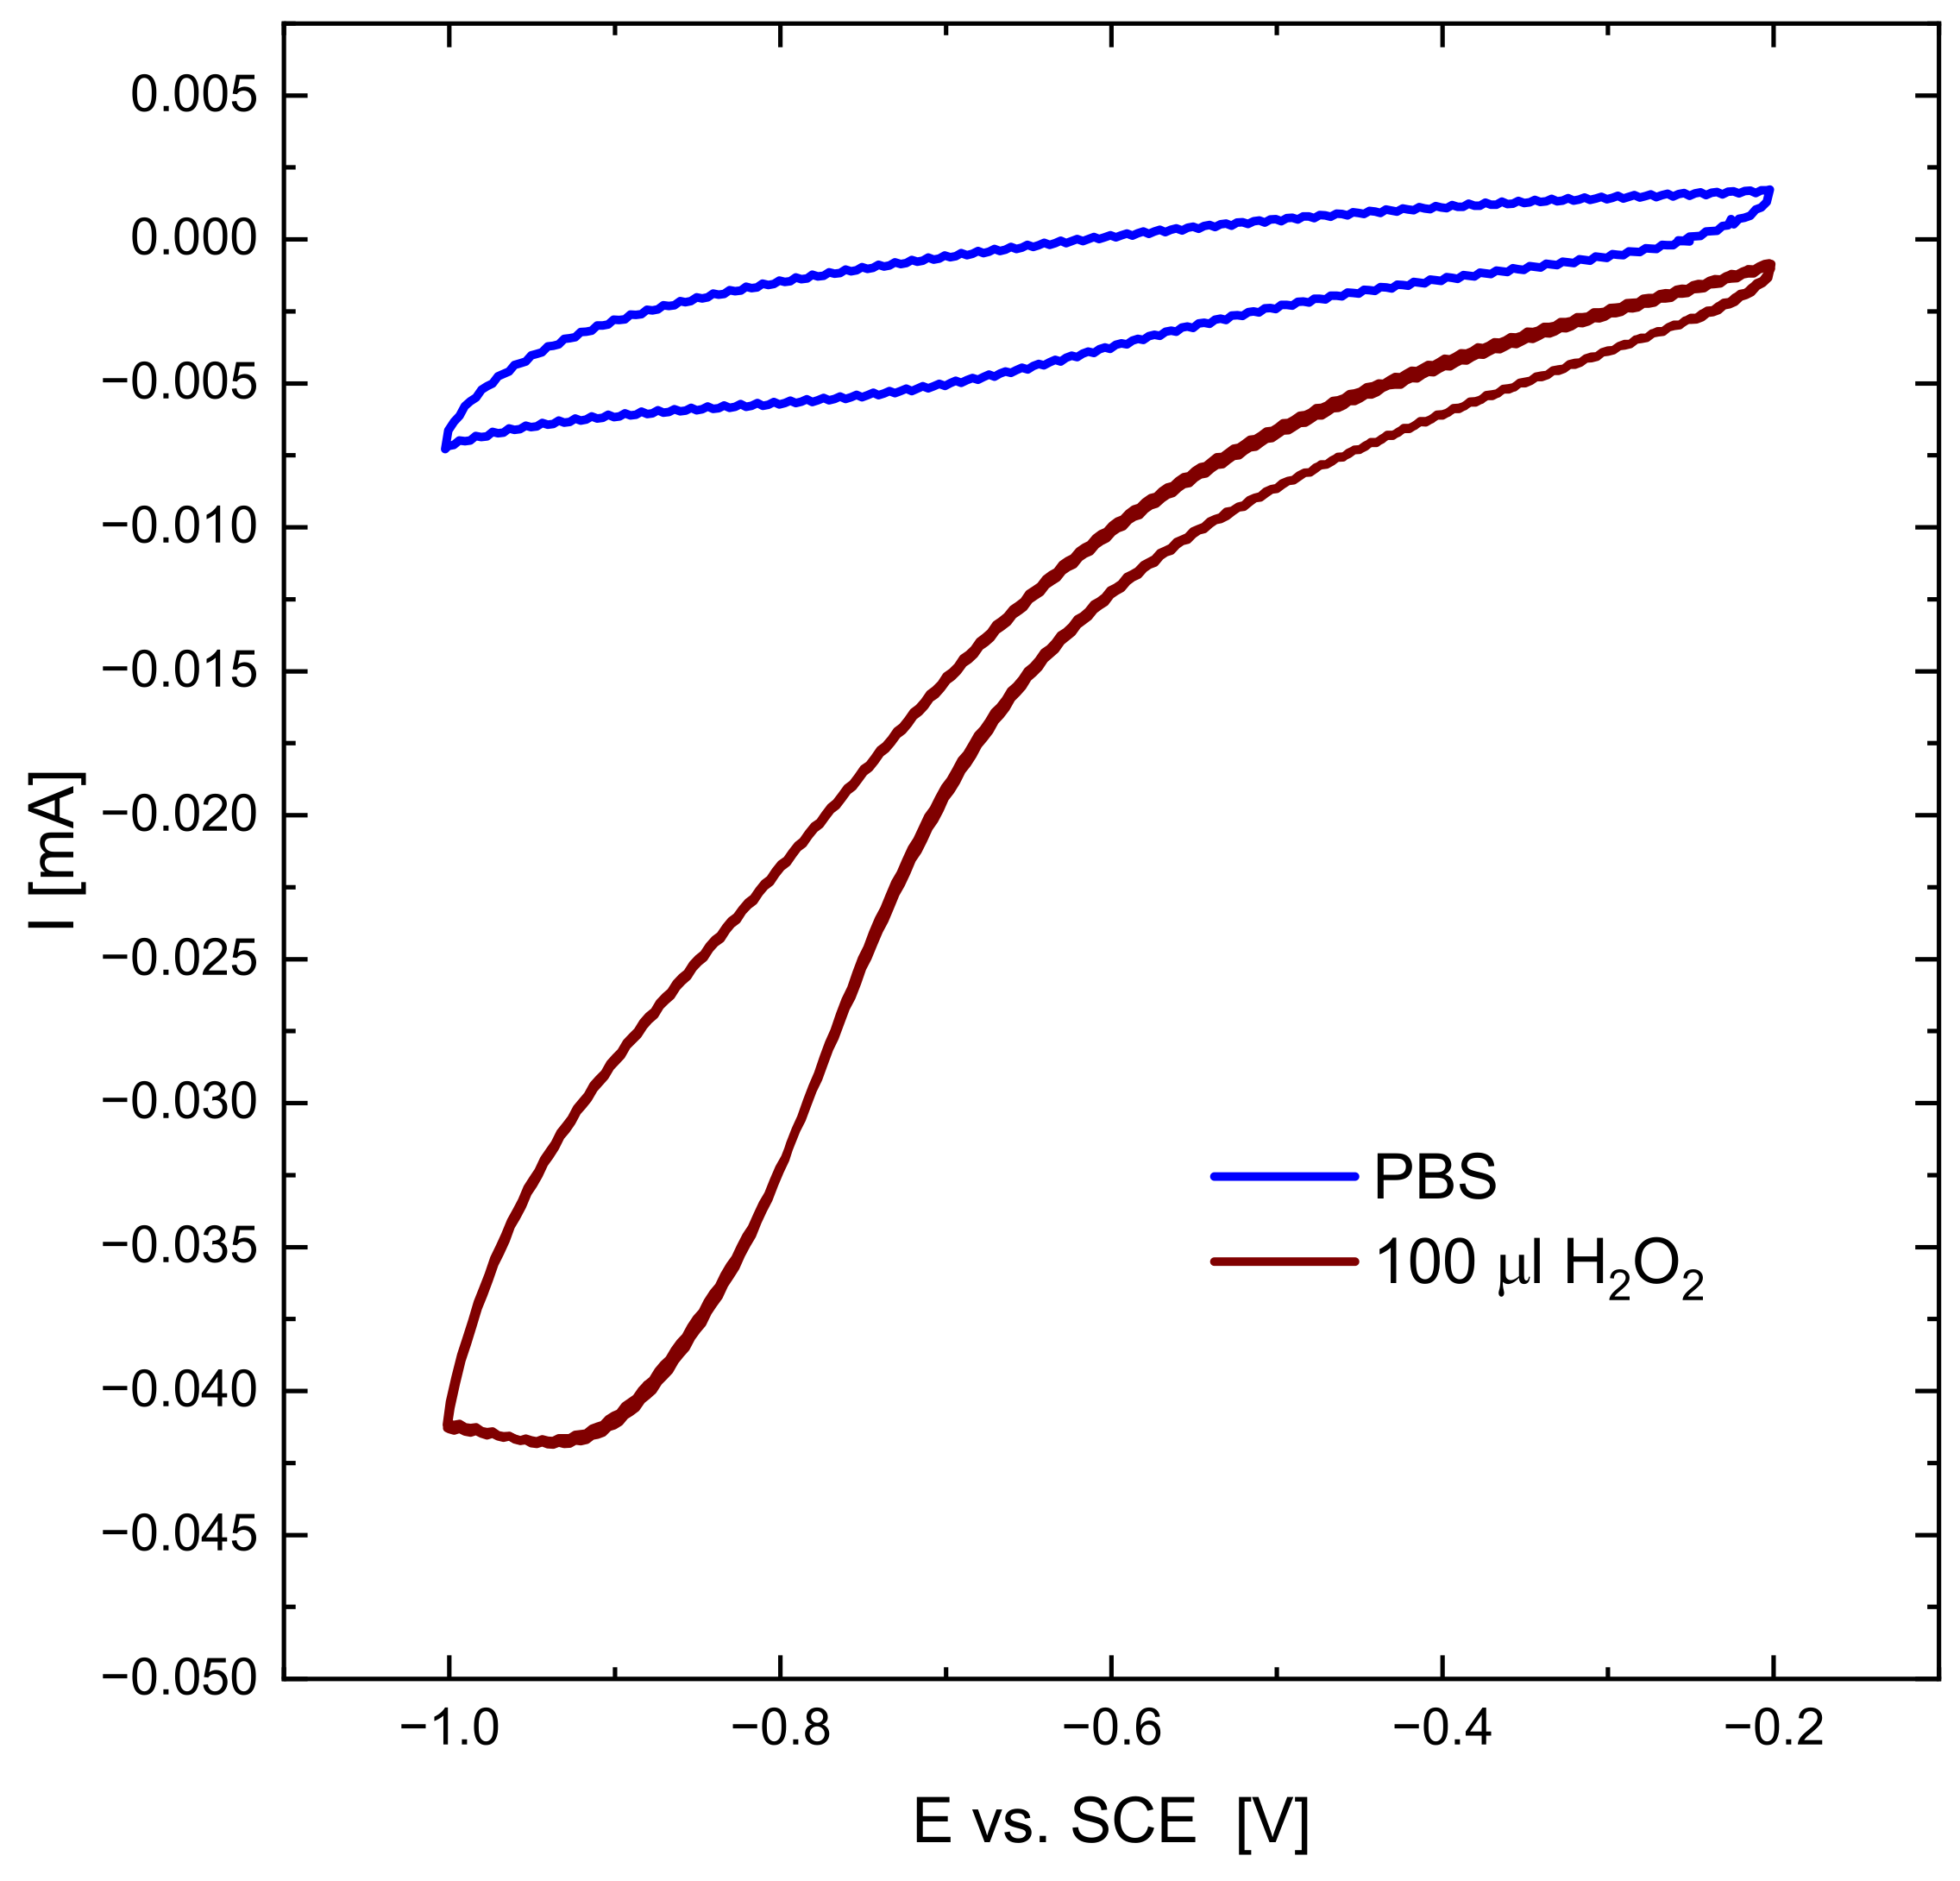
To evaluate the catalytic activity, firstly, cyclic voltammetry measurements were carried out for PBS solution in the presence and absence of hydrogen peroxide (see Figure 15).
In the solution with the addition of H2O2, the strong peak connected with the reduction of the hydrogen peroxide appeared centered at −0.8 V vs. SCE.
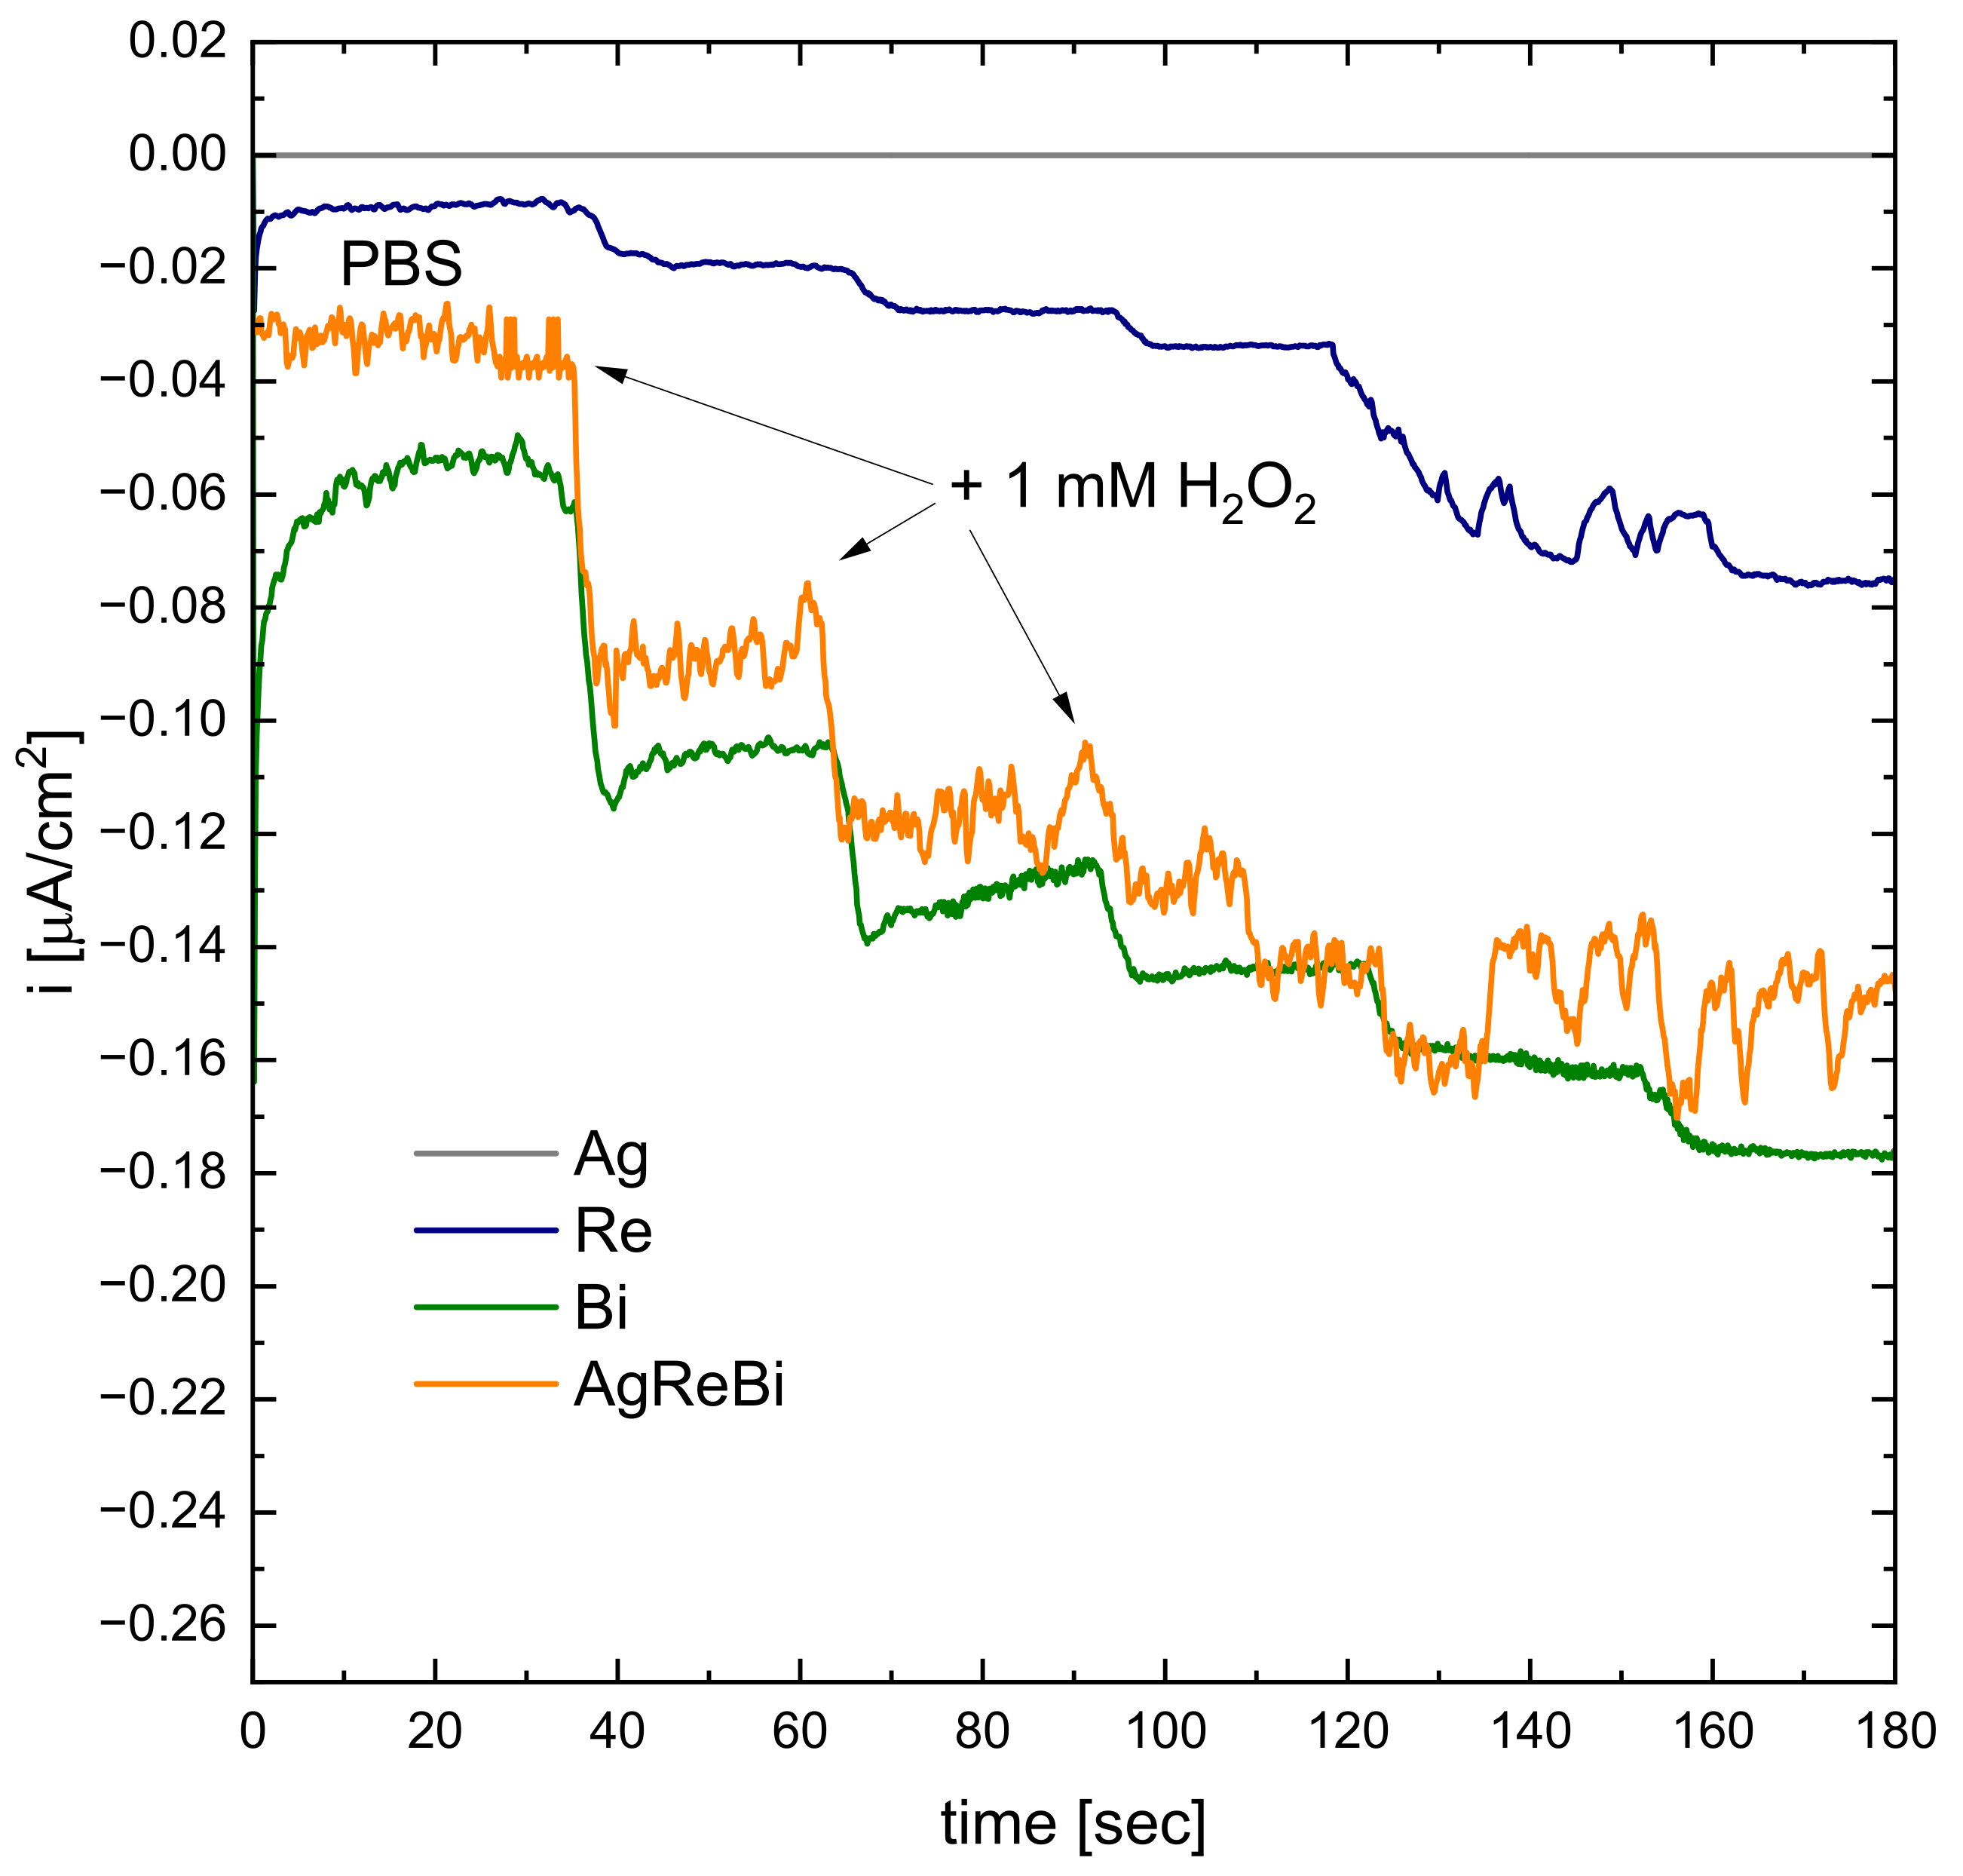
The amperometric response to hydrogen peroxide of Ag, Re, Bi, and the AgReBi alloy was recorded by consecutive additions of 100 μL H2O2 to 0.1 M PBS solution. The solution was stirred continuously. The results are shown in Figure 16.
It can be concluded that Bi and AgReBi nanoparticles exhibit more significant catalytic activity towards H2O2 than Ag and Re ones. After the subsequent additions of hydrogen peroxide, the current density decreased stepwise. However, this performance is not stable over time, especially for AgReBi nanoparticles, which is confirmed by the strong character of the curve. The current response was observed the longest for Bi nanoparticles. The recorded response of Ag to H2O2 is negligible, especially in comparison with other nanoparticles. Nevertheless, they are recordable values (see Figure 17).
It is significant that according to the literature [53,54,55,56,57] silver nanoparticles should show high electrocatalytic values.
It is suspected that the weak electrocatalytic properties of silver nanoparticles result from the presence of L-cysteine in the solution. This amino acid contains a sulfur atom in its structure. Silver has a high affinity for sulfur; therefore, it can bind with L-cysteine molecules when reduced to a metallic form. In this way, silver nanoparticles are somehow poisoned by the sulfur present in L-cysteine, which drastically weakens their electrocatalytic properties. This phenomenon is confirmed in the literature [58,59].
As can be noticed in Figure 18, the dependency between the current density and H2O2 concentration is linear in the range of 0.001 M to 0.003 M. Based on recorded curves, the sensitivity of nanoparticles was estimated to be the following: 8.02407 μAcm−2M−1 for Re nanoparticles, 18.22217 μAcm−2M−1 for Bi nanoparticles, and 22.49875 μAcm−2M−1 for AgReBi nanoparticles, respectively. This means that alloy nanoparticles are 1.2 times more sensitive than Bi nanoparticles and 2.8 than Re ones for the mentioned range of hydrogen peroxide concentration.

4. Summary

The above work allows for the determination of the potential of application L-cysteine complexes of bismuth, silver, and rhenium in synthesizing nanomaterials. The average size of the obtained nanoparticles was investigated, and electrocatalytic tests were carried out to reduce hydrogen peroxide.
Based on the conducted research, it has been shown that it is possible to obtain nanoparticles of bismuth, silver, and rhenium and their combinations by reduction with sodium borohydride from alkaline solutions containing L-cysteine. The use of a stabilizer (PVA) in this system during the synthesis significantly reduces the average size of the obtained nanoparticles. BiNPs synthesized without PVA reached the size of 514 nm, while in the presence of PVA, they reached 8 nm. BiNPs, BiAgNPs, and BiReNPs solutions show similar patterns of absorption spectra, both for the reaction with and without the stabilizer. In the case of reduction without PVA, maximum absorbance is observed for each plot for a wavelength of 230–235 nm. However, the peaks are subtly shifted relative to each other and show different absorption values, possibly due to the formation of nanoalloys or the presence of chemical bonds between the colloid components. BiReAgNPs synthesized from a solution with an increased concentration of rhenium and bismuth (1 × 10⁻³ M) ions in respect to silver (1 × 10⁻⁴ M) reached an average size of 19 nm and showed two absorption maxima. This phenomenon suggests the shape anisotropy of BiReAgNPs, which is confirmed by TEM microscopic analysis.
Studies of catalytic properties have shown that silver nanoparticle colloids show negligible electrocatalytic activity in relation to the reduction of hydrogen peroxide. It has been suggested that this is due to the modification of the surface of silver nanoparticles with L-cysteine, present in the solution during synthesis. Rhenium nanoparticles show higher catalytic abilities in the tested system compared to AgNPs. However, these values are still relatively low. Bismuth nanoparticles, as well as AgReBiNPs, exhibit significantly higher catalytic activity.

5. Conclusions

The obtained results suggest that by using the chemical method of synthesis, it is possible to obtain alloys from metals that do not form solid solutions in bulk. This may allow for the synthesis of entirely new materials with unusual chemical and physical properties. Moreover, it has been shown that L-cysteine can modulate the surface of bismuth and silver nanoparticles, influencing their catalytic properties.

Author Contributions

Conceptualization, K.W. and M.W.; methodology, M.W. and K.S.; writing—original draft preparation, K.W., M.E.-G., F.C. and T.T.; writing—review and editing, K.W.; supervision, V.H.; All authors have read and agreed to the published version of the manuscript.

Funding

This research received no external funding.

Institutional Review Board Statement

Not applicable.

Informed Consent Statement

Not applicable.

Data Availability Statement

The datasets used and/or analyzed during the current study are available from K. Wojtaszek ([email protected]) upon reasonable request.

Acknowledgments

The research was financed from the own funds of the Faculty of Non-Ferrous Metals of AGH in Krakow.

Conflicts of Interest

The authors declare no conflict of interest.

References

  1. Ray, C.; Pal, T. Retracted Article: Recent advances of metal–metal oxide nanocomposites and their tailored nanostructures in numerous catalytic applications. J. Mater. Chem. A 2017, 5, 9465–9487. [Google Scholar] [CrossRef]
  2. Pachaiappan, R.; Rajendran, S.; Show, P.L.; Manavalan, K.; Naushad, M. Metal/metal oxide nanocomposites for bactericidal effect: A review. Chemosphere 2021, 272, 128607. [Google Scholar] [CrossRef] [PubMed]
  3. Yadav, S.; Rani, N.; Saini, K. A review on transition metal oxides based nanocomposites, their synthesis techniques, different morphologies and potential applications. IOP Conf. Ser. Mater. Sci. Eng. 2022, 1225, 012004. [Google Scholar] [CrossRef]
  4. Ghosh Chaudhuri, R.; Paria, S. Core/shell nanoparticles: Classes, properties, synthesis mechanisms, characterization, and applications. Chem. Rev. 2012, 112, 2373–2433. [Google Scholar] [CrossRef]
  5. Gawande, M.B.; Goswami, A.; Asefa, T.; Guo, H.Z.; Biradar, A.V.; Peng, D.L.; Zboril, R.; Varma, R.S. Core–shell nanoparticles: Synthesis and applications in catalysis and electrocatalysis. Chem. Soc. Rev. 2015, 44, 7540–7590. [Google Scholar] [CrossRef] [PubMed]
  6. Csapó, E.; Oszkó, A.; Varga, E.; Juhász, Á.; Buzás, N.; Kőrösi, L.; Majzik, A.; Dékány, I. Synthesis and characterization of Ag/Au alloy and core(Ag)–shell(Au) nanoparticles. Colloids Surf. A Physicochem. Eng. Asp. 2012, 415, 281–287. [Google Scholar] [CrossRef]
  7. Safaie, N.; Ferrier, R.C., Jr. Janus nanoparticle synthesis: Overview, recent developments, and applications. J. Appl. Phys. 2020, 127, 170902. [Google Scholar] [CrossRef]
  8. Song, Y.; Chen, S. Janus nanoparticles: Preparation, characterization, and applications. Chem. Asian J. 2014, 9, 418–430. [Google Scholar] [CrossRef]
  9. Ismail, A.M.; Csapó, E.; Janáky, C. Correlation between the work function of Au–Ag nanoalloys and their electrocatalytic activity in carbon dioxide reduction. Electrochim. Acta 2019, 313, 171–178. [Google Scholar] [CrossRef]
  10. Ermolov, L.V.; Slinkin, A.A. Strong metal-carrier interaction and its role in catalysis. Russ. Chem. Rev. 1991, 60, 331–344. [Google Scholar] [CrossRef]
  11. Kim, S.M.; Lee, H.; Park, J.Y. Charge Transport in Metal–Oxide Interfaces: Genesis and Detection of Hot Electron Flow and Its Role in Heterogeneous Catalysis. Catal. Lett. 2015, 145, 299–308. [Google Scholar] [CrossRef]
  12. Bonura, G.; Arena, F.; Mezzatesta, G.; Cannilla, C.; Spadaro, L.; Frusteri, F. Role of the ceria promoter and carrier on the functionality of Cu-based catalysts in the CO2-to-methanol hydrogenation reaction. Catal. Today 2011, 171, 251–256. [Google Scholar] [CrossRef]
  13. Guttikonda, M.; Dey, A.; Pandey, K.; Maity, S. Fabrication of metal matrix composites by powder metallurgy: A review. AIP Conf. Proc. 2018, 1952, 020041. [Google Scholar]
  14. Meiyanathan, M.; Ravichandran, M. Synthesis of Metal Matrix Composites via Powder Metallurgy Route: A Review. Mech. Mech. Eng. 2018, 22, 65–76. [Google Scholar]
  15. Idris, J.; Kabir, M.A. Powder Metallurgy Development for The Production of Metal Matrix Composite. In Proceedings of the Processing and Fabrication of Advanced Materials VIII, Singapore, 8–10 September 1999; pp. 921–931. [Google Scholar]
  16. Somani, N.; Sharma, N.; Sharma, A.; Gautam, Y.K.; Khatri, P.; Solomon, J. Allanson Agnal, Fabrication of Cu-SiC Composites using Powder Metallurgy Technique. Mater. Today Proc. 2018, 5 Pt 2, 28136–28141. [Google Scholar] [CrossRef]
  17. Shahbazi, M.-A.; Faghfouri, L.; Ferreira, M.P.A.; Figueiredo, P.; Maleki, H.; Sefat, F.; Hirvonen, J.; Santos, H.A. The versatile biomedical applications of bismuth-based nanoparticles and composites: Therapeutic, diagnostic, biosensing, and regenerative properties. Chem. Soc. Rev. 2020, 49, 1253–1321. [Google Scholar] [CrossRef] [Green Version]
  18. Abbas, M.; Hachemaoui, A.; Yahiaoui, A.; Mourad, A.-H.I.; Belfedal, A.; Cherupurakal, N. Chemical synthesis of nanocomposites via in-situ polymerization of aniline and iodoaniline using exchanged montmorillonite. Polym. Polym. Compos. 2020, 29, 982–991. [Google Scholar] [CrossRef]
  19. Pozdnyakov, A.A.-O.; Emel’yanov, A.I.; Korzhova, S.A.; Kuznetsova, N.P.; Bolgova, Y.I.; Trofimova, O.M.; Semenova, T.A.; Prozorova, G.-O. Green Synthesis of Stable Nanocomposites Containing Copper Nanoparticles Incorporated in Poly-N-vinylimidazole. Polymers 2021, 13, 3212. [Google Scholar] [CrossRef]
  20. Khanna, P.K.; Singh, N.; Charan, S.; Subbarao, V.V.V.S.; Gokhale, R.; Mulik, U.P. Synthesis and characterization of Ag/PVA nanocomposite by chemical reduction method. Mater. Chem. Phys. 2005, 93, 117–121. [Google Scholar] [CrossRef]
  21. Thanh, N.T.K.; Maclean, N.; Mahiddine, S. Mechanisms of Nucleation and Growth of Nanoparticles in Solution. Chem. Rev. 2014, 114, 7610–7630. [Google Scholar] [CrossRef]
  22. Woehl, T.J.; Evans, J.E.; Arslan, I.; Ristenpart, W.D.; Browning, N.D. Direct in Situ Determination of the Mechanisms Controlling Nanoparticle Nucleation and Growth. ACS Nano 2012, 6, 8599–8610. [Google Scholar] [CrossRef] [Green Version]
  23. Polte, J. Fundamental growth principles of colloidal metal nanoparticles—A new perspective. CrystEngComm 2015, 17, 6809–6830. [Google Scholar] [CrossRef]
  24. Mech, K.; Wojnicki, M.; Mania, I.; Gajewska, M.; Marzec, M. Influence of Experimental Conditions on Deposition of Silver Nanoparticles onto Surface of Graphene Oxide/Wpływ Warunków Eksperymentalnych Na Proces Osadzania Nanocząstek Srebra Na Powierzchni Tlenku Grafenu. Arch. Metall. Mater. 2015, 60, 2631–2635. [Google Scholar]
  25. Wojnicki, M.; Tokarski, T.; Hessel, V.; Fitzner, K.; Luty-Błocho, M. Continuous, monodisperse silver nanoparticles synthesis using microdroplets as a reactor. J. Flow Chem. 2019, 9, 1–7. [Google Scholar] [CrossRef] [Green Version]
  26. Iravani, S.; Korbekandi, H.; Mirmohammadi, S.V.; Zolfaghari, B. Synthesis of silver nanoparticles: Chemical, physical and biological methods. Res. Pharm. Sci. 2014, 9, 385–406. [Google Scholar] [PubMed]
  27. Gomez, C.; Hallot, G.; Pastor, A.; Laurent, S.; Brun, E.; Sicard-Roselli, C.; Port, M. Metallic bismuth nanoparticles: Towards a robust, productive and ultrasound assisted synthesis from batch to flow-continuous chemistry. Ultrason. Sonochem. 2019, 56, 167–173. [Google Scholar] [CrossRef] [PubMed]
  28. Wojnicki, M.; Tokarski, T.; Hessel, V.; Fitzner, K.; Luty-Błocho, M. 2H and 4H silver colloidal suspension synthesis, as a new potential drug carrier. Chem. Eng. J. 2020, 382, 122922. [Google Scholar] [CrossRef]
  29. Chakraborty, I.; Shirodkar, S.N.; Gohil, S.; Waghmare, U.V.; Ayyub, P. The nature of the structural phase transition from the hexagonal (4H) phase to the cubic (3C) phase of silver. J. Phys. Condens. Matter 2014, 26, 115405. [Google Scholar] [CrossRef]
  30. Brzózka, A.; Szeliga, D.; Kurowska-Tabor, E.; Sulka, G.D. Synthesis of copper nanocone array electrodes and its electrocatalytic properties toward hydrogen peroxide reduction. Mater. Lett. 2016, 174, 66–70. [Google Scholar] [CrossRef]
  31. Skibińska, K.; Kutyła, D.; Kula, A.; Gajewska, M.; Marzec, M.M.; Żabiński, P. Hydrogen evolution reaction (HER) activity of conical Co–Fe alloy structures and their application as a sensitive and rapid sensor for H2O2 detection. Arch. Civ. Mech. Eng. 2022, 22, 76. [Google Scholar] [CrossRef]
  32. Zhao, L.Y.; Li, J.G.; Chen, X.L.; Cheng, D.; Zhang, J.Y.; Yang, H.X. Highly Sensitive Electrochemical Detection of Hydrogen Peroxide Based on Polyethyleneimine-Au Nanoparticles-Zinc Protoporphyrin. J. Electrochem. Soc. 2019, 166, B631. [Google Scholar] [CrossRef]
  33. Wang, Q.Q.; Zhang, X.M.; Chai, X.Y.; Wang, T.Q.; Cao, T.L.; Li, Y.N.; Zhang, L.Y.; Fan, F.Q.; Fu, Y.; Qi, W. An Electrochemical Sensor for H2O2 Based on Au Nanoparticles Embedded in UiO-66 Metal–Organic Framework Films. ACS Appl. Nano Mater. 2021, 4, 6103–6110. [Google Scholar] [CrossRef]
  34. Chen, S.H.; Yuan, R.; Chai, Y.Q.; Hu, F.X. Electrochemical sensing of hydrogen peroxide using metal nanoparticles: A review. Microchim. Acta 2013, 180, 15–32. [Google Scholar] [CrossRef]
  35. Xu, L.; Lian, M.L.; Chen, X.; Lu, Y.L.; Yang, W.S. Amperometric sensing of hydrogen peroxide via an ITO electrode modified with gold nanoparticles electrodeposited on a CoMn-layered double hydroxide. Microchim. Acta 2017, 184, 3989–3996. [Google Scholar] [CrossRef]
  36. Loza, K.; Diendorf, J.; Sengstock, C.; Ruiz-Gonzalez, L.; Gonzalez-Calbet, J.M.; Vallet-Regi, M.; Köller, M.; Epple, M. The dissolution and biological effects of silver nanoparticles in biological media. J. Mater. Chem. B 2014, 2, 1634–1643. [Google Scholar] [CrossRef] [Green Version]
  37. Liu, H.; Weng, L.; Yang, C. A review on nanomaterial-based electrochemical sensors for H2O2, H2S and NO inside cells or released by cells. Microchim. Acta 2017, 184, 1267–1283. [Google Scholar] [CrossRef]
  38. Xi, J.B.; Zhang, Y.; Wang, N.; Wang, L.; Zhang, Z.Y.; Xiao, F.; Wang, S. Ultrafine Pd Nanoparticles Encapsulated in Microporous Co3O4 Hollow Nanospheres for In Situ Molecular Detection of Living Cells. ACS Appl. Mater. Interfaces 2015, 7, 5583–5590. [Google Scholar] [CrossRef]
  39. Teodoro, K.B.R.; Migliorini, F.L.; Christinelli, W.A.; Correa, D.S. Detection of hydrogen peroxide (H2O2) using a colorimetric sensor based on cellulose nanowhiskers and silver nanoparticles. Carbohydr. Polym. 2019, 212, 235–241. [Google Scholar] [CrossRef]
  40. Verma, N.; Singh, M. A disposable microbial based biosensor for quality control in milk. Biosens. Bioelectron. 2003, 18, 1219–1224. [Google Scholar] [CrossRef]
  41. Han, C.Y. Roles of Reactive Oxygen Species on Insulin Resistance in Adipose Tissue. Diabetes Metab. J. 2016, 40, 272–279. [Google Scholar] [CrossRef]
  42. Liu, H.; Ding, Y.N.; Yang, B.C.; Liu, Z.X.; Liu, Q.Y.; Zhang, X. Colorimetric and ultrasensitive detection of H2O2 based on Au/Co3O4-CeOx nanocomposites with enhanced peroxidase-like performance. Sens. Actuators B Chem. 2018, 271, 336–345. [Google Scholar] [CrossRef]
  43. Burford, N.; Eelman, M.D.; Mahony, D.E.; Morash, M. Definitive identification of cysteine and glutathione complexes of bismuth by mass spectrometry: Assessing the biochemical fate of bismuth pharmaceutical agents. Chem. Commun. 2003, 146–147. [Google Scholar] [CrossRef] [PubMed]
  44. Cheek, G.T.; Peña, D. Electrochemical Investigations of L-Cysteine Interactions with Bismuth Ions. J. Electrochem. Soc. 2020, 167, 155522. [Google Scholar] [CrossRef]
  45. Alekseev, V.; Semenov, A.; Pakhomov, P. Complexation of Ag+ Ions with L-Cysteine. Russ. J. Inorg. Chem. 2012, 57, 1041–1044. [Google Scholar] [CrossRef]
  46. Leung, B.O.; Jalilehvand, F.; Mah, V.; Masood, P.; Wu, Q. Silver(I) complex formation with cysteine, penicillamine, and glutathione. Inorg. Chem. 2013, 52, 4593–4602. [Google Scholar] [CrossRef] [Green Version]
  47. Kirsch, S.; Jankowsky, R.; Fau-Leibnitz, P.; Leibnitz, P.; Fau-Spies, H.; Spies, H.; Fau-Johannsen, B.; Johannsen, B. Crystal and solution structure of oxo rhenium(V) complexes with cysteine and cysteine methyl ester. J. Biol. Inorg. Chem. 1999, 4, 48–55. [Google Scholar] [CrossRef]
  48. Young, A.T. Rayleigh scattering. Appl. Opt. 1981, 20, 533–535. [Google Scholar] [CrossRef]
  49. Mahiuddin, M.; Ochiai, B. Green synthesis of crystalline bismuth nanoparticles using lemon juice. RSC Adv. 2021, 11, 26683–26686. [Google Scholar] [CrossRef]
  50. Wojnicki, M.; Luty-Błocho, M.; Kotańska, M.; Wytrwal, M.; Tokarski, T.; Krupa, A.; Kołaczkowski, M.; Bucki, A.; Kobielusz, M. Novel and effective synthesis protocol of AgNPs functionalized using L-cysteine as a potential drug carrier. Naunyn Schmiedebergs Arch. Pharmacol. 2018, 391, 123–130. [Google Scholar] [CrossRef] [Green Version]
  51. Van der Horst, C.; Silwana, B.; Iwuoha, E.; Somerset, V. Synthesis and Characterization of Bismuth-Silver Nanoparticles for Electrochemical Sensor Applications. Anal. Lett. 2015, 48, 1311–1332. [Google Scholar] [CrossRef]
  52. Wojnicki, M.; Luty-Błocho, M.; Dobosz, I.; Grzonka, J.; Pacławski, K.; Kurzydłowski, K.J.; Fitzner, K. Electro-Oxidation of Glucose in Alkaline Media on Graphene Sheets Decorated with Gold Nanoparticles. Mater. Sci. Appl. 2013, 2013, 162–169. [Google Scholar] [CrossRef] [Green Version]
  53. Maji, S.K.; Dutta, A.K.; Srivastava, D.N.; Paul, P.; Mondal, A.; Adhikary, B.; Adhikary, U. Electrocatalytic activity of silver nanoparticles modified glassy carbon electrode as amperometric sensor for hydrogen peroxide. J. Nanosci. Nanotechnol. 2013, 13, 4969–4974. [Google Scholar] [CrossRef]
  54. Bui, M.-P.; Pham, X.-H.; Han, K.; Li, C.; Kim, Y.S.; Seong, G. Electrocatalytic reduction of hydrogen peroxide by silver particles patterned on single-walled carbon nanotubes. Sens. Actuators B Chem. 2010, 150, 436–441. [Google Scholar] [CrossRef]
  55. Campbell, F.W.; Belding, S.R.; Baron, R.; Xiao, L.; Compton, R.G. Hydrogen Peroxide Electroreduction at a Silver-Nanoparticle Array: Investigating Nanoparticle Size and Coverage Effects. J. Phys. Chem. C 2009, 113, 9053–9062. [Google Scholar] [CrossRef]
  56. Brzózka, A.; Brudzisz, A.; Jeleń, A.; Kozak, M.; Wesół, J.; Iwaniec, M.; Sulka, G.D. A comparative study of electrocatalytic reduction of hydrogen peroxide at carbon rod electrodes decorated with silver particles. Mater. Sci. Eng. B 2021, 263, 114801. [Google Scholar] [CrossRef]
  57. Lin, D.-H.; Jiang, Y.-X.; Wang, Y.; Sun, S.-G. Silver Nanoparticles Confined in SBA-15 Mesoporous Silica and the Application as a Sensor for Detecting Hydrogen Peroxide. J. Nanomater. 2008, 2008, 473791. [Google Scholar] [CrossRef] [Green Version]
  58. Csapó, E.; Patakfalvi, R.; Hornok, V.; Tóth, L.T.; Sipos, Á.; Szalai, A.; Csete, M.; Dékány, I. Effect of pH on stability and plasmonic properties of cysteine-functionalized silver nanoparticle dispersion. Colloids Surf. B Biointerfaces 2012, 98, 43–49. [Google Scholar] [CrossRef]
  59. Khalkho, B.R.; Kurrey, R.; Deb, M.K.; Shrivas, K.; Thakur, S.S.; Pervez, S.; Jain, V.K. L-cysteine modified silver nanoparticles for selective and sensitive colorimetric detection of vitamin B1 in food and water samples. Heliyon 2020, 6, e03423. [Google Scholar] [CrossRef]
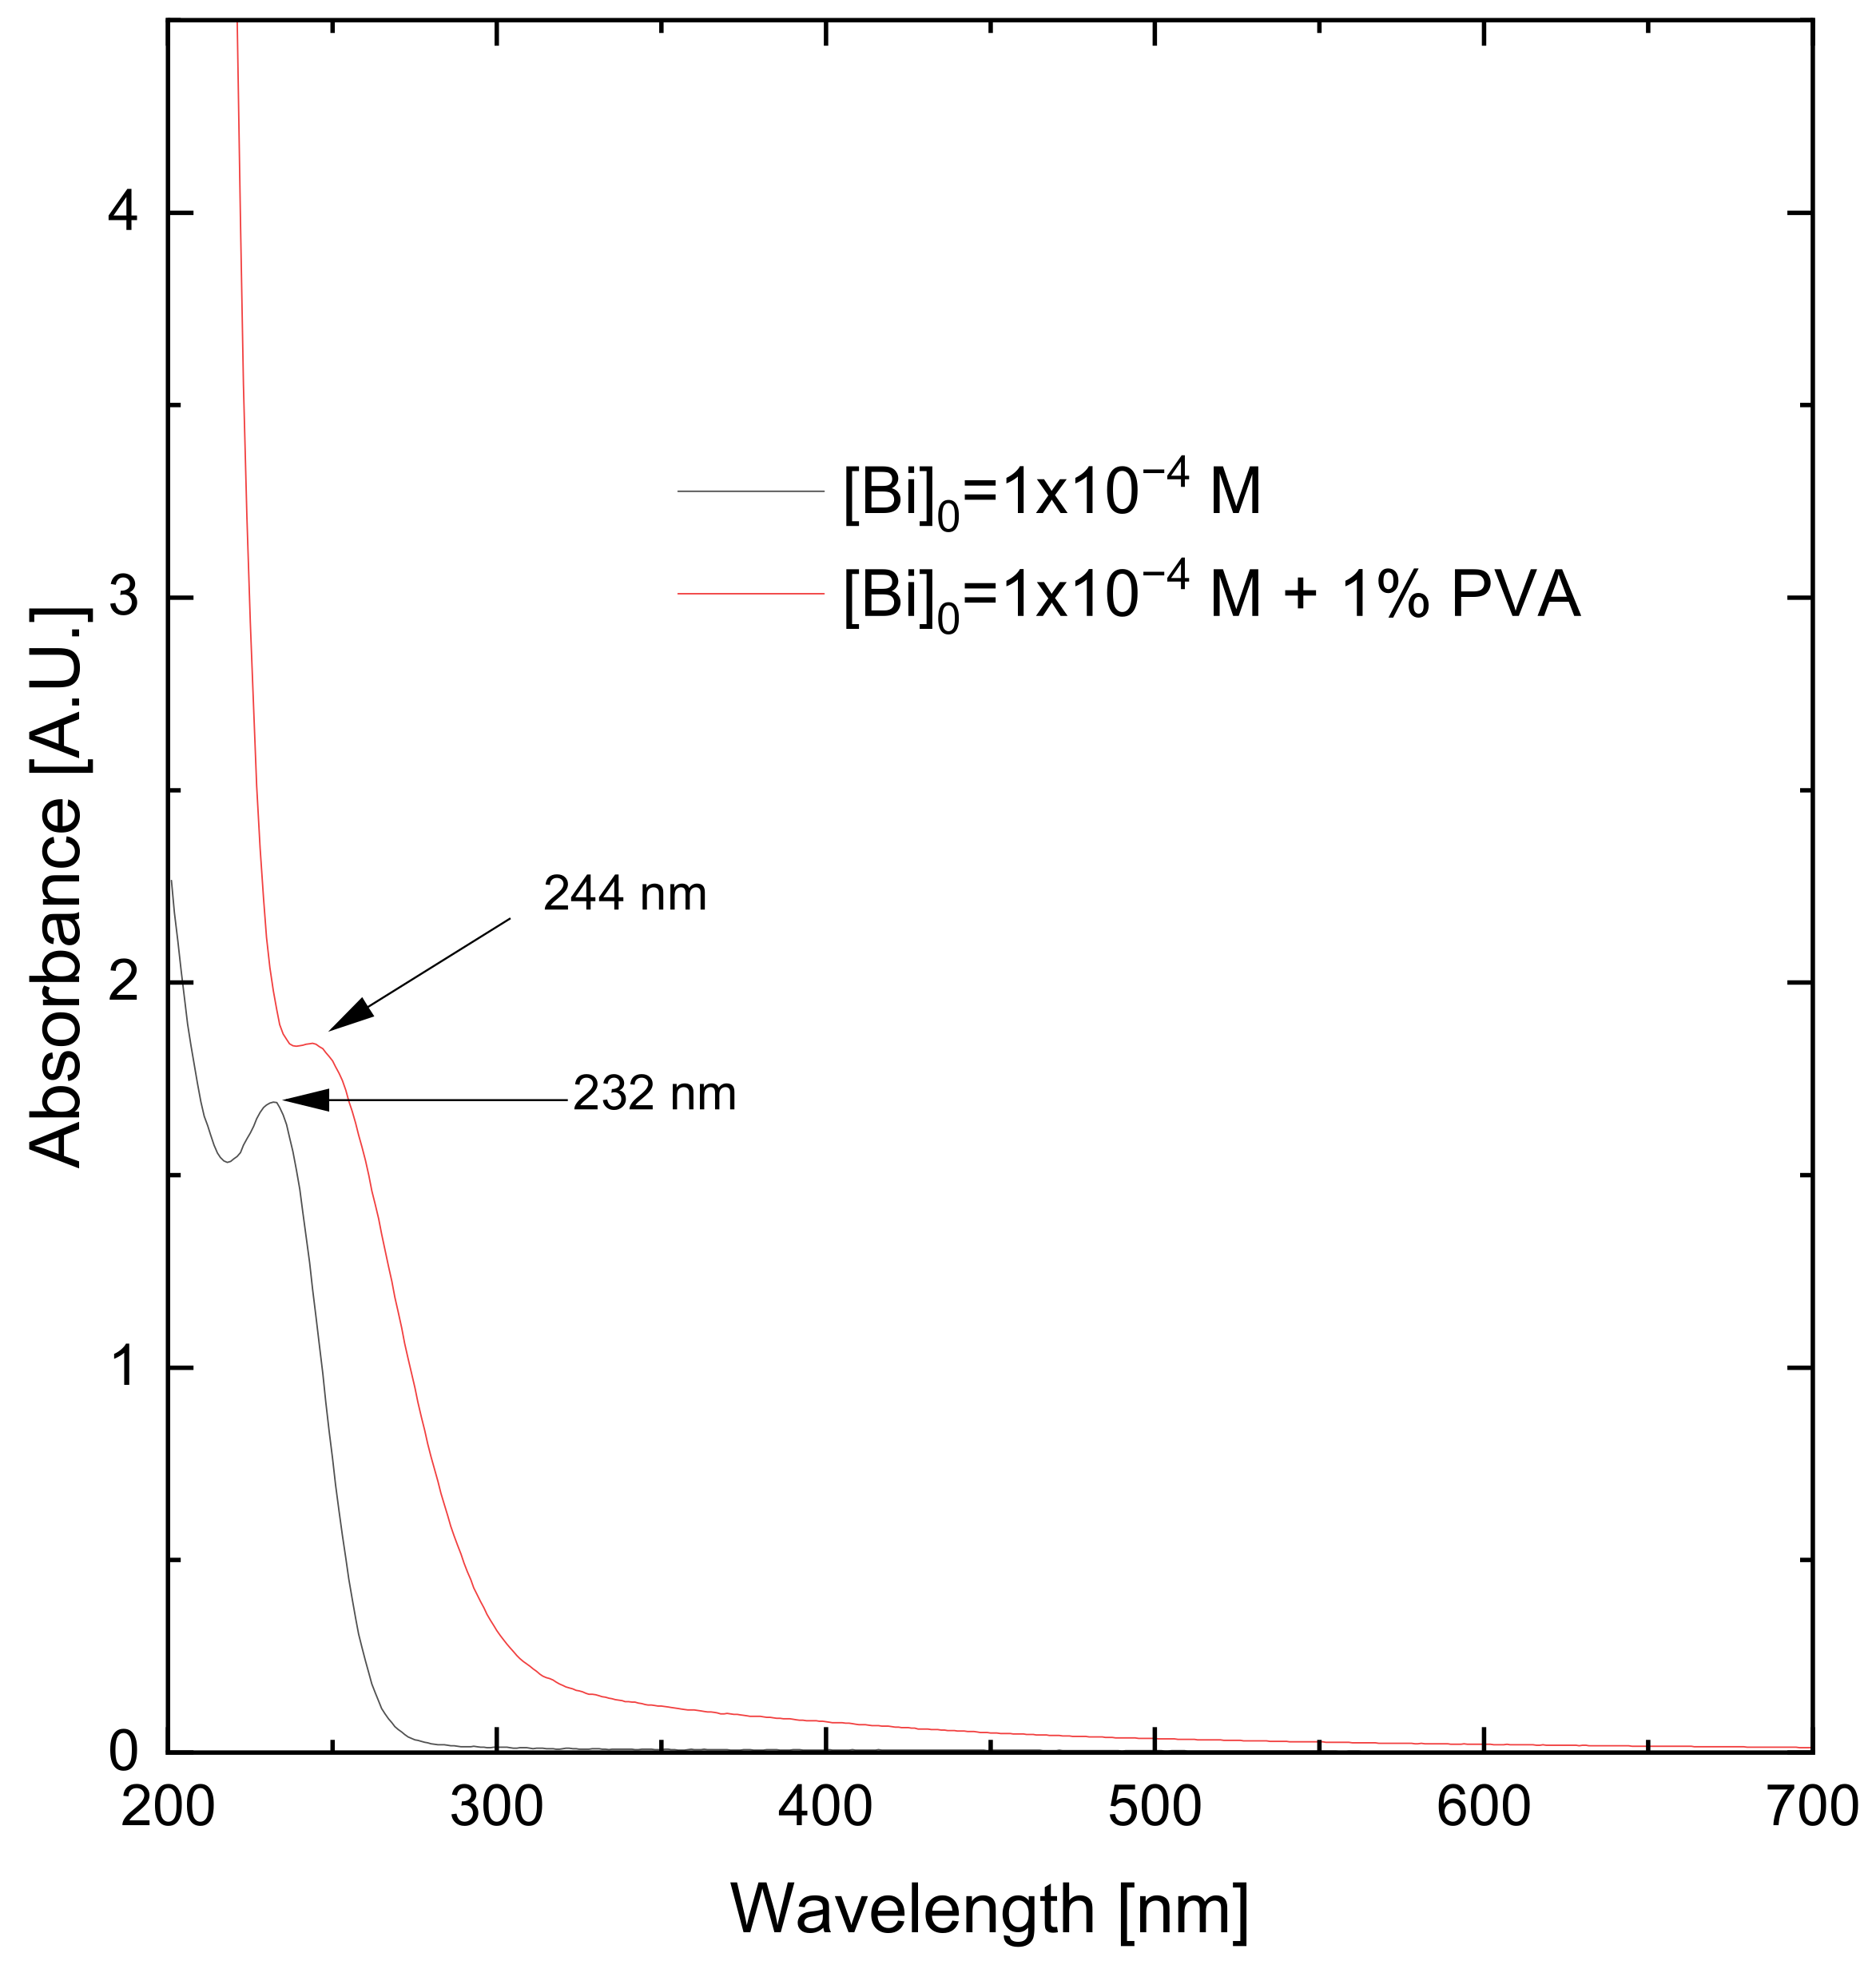
Figure 1. UV–Vis spectra of solutions of synthesized bismuth nanoparticles in the presence and absence of a stabilizer (PVA), at a bismuth concentration of 1 × 10 −4 M.
Metals 12 01819 g001
Figure 2. DLS analysis results in the form of particle size histograms according to distribution for (A) a solution of bismuth nanoparticles synthesized without a stabilizer (PVA) and (B) a solution of bismuth nanoparticles synthesized in the presence of a stabilizer. The bismuth concentration in both cases was 1 × 10⁻⁴ M.
Metals 12 01819 g002
Figure 3. UV–Vis spectra of PVA solution with a concentration of 1%, and L–cysteine alkaline solution with a concentration of 0.1 M.
Metals 12 01819 g003
Figure 4. UV–Vis spectra of solutions of synthesized silver–bismuth nanoparticles in the presence and absence of a stabilizer (PVA), at both silver and bismuth concentrations of 1 × 10 −4 M.
Metals 12 01819 g004
Figure 5. DLS analysis results in the form of particle size histograms according to distribution for (A) a solution of silver–bismuth nanoparticles synthesized without a stabilizer (PVA). (B) A solution of silver–bismuth nanoparticles synthesized in the presence of a stabilizer. Both silver and bismuth concentrations were 1 × 10⁻⁴ mol/dm3.
Metals 12 01819 g005
Figure 6. UV–Vis spectra of solutions of synthesized rhenium–bismuth nanoparticles in the presence and absence of a stabilizer (PVA), at both rhenium and bismuth concentrations of 1 × 10 −4 M.
Metals 12 01819 g006
Figure 7. DLS analysis results in the form of particle size histograms according to distribution for (A) a solution of rhenium–bismuth nanoparticles synthesized without a stabilizer (PVA). (B) A solution of rhenium–bismuth nanoparticles synthesized in the presence of a stabilizer. Both rhenium and bismuth concentrations were 1 × 10⁻⁴ mol/dm3.
Metals 12 01819 g007
Figure 8. UV–Vis spectra of solutions of synthesized silver–rhenium nanoparticles in the presence and absence of a stabilizer (PVA), at both silver and rhenium concentrations of 1 × 10 −4 M.
Metals 12 01819 g008
Figure 9. DLS analysis results in the form of particle size histograms according to distribution for (A) a solution of rhenium–silver nanoparticles synthesized without a stabilizer (PVA). (B) A solution of rhenium–silver nanoparticles synthesized in the presence of a stabilizer. Both rhenium and silver concentrations were 1 × 10⁻⁴ mol/dm3.
Metals 12 01819 g009
Figure 10. DLS analysis results in the form of particle size histograms according to distribution for (A) a solution of silver–rhenium–bismuth nanoparticles synthesized without a stabilizer (PVA), (B) a solution of silver–rhenium–bismuth nanoparticles synthesized in the presence of a stabilizer. Silver, rhenium, and bismuth concentration was 1 × 10⁻⁴ mol/dm3, (C) silver–rhenium–bismuth synthesized in the presence of a stabilizer. Both rhenium and bismuth concentrations were 1 × 10⁻³ mol/dm3, while silver concentration was 1 × 10⁻⁴ mol/dm3.
Metals 12 01819 g010
Figure 11. UV–Vis spectra of solutions of synthesized bismuth–silver–rhenium nanoparticles in the presence and absence of a stabilizer (PVA), at a silver concentration of 1 × 10⁻⁴ M and bismuth and rhenium concentrations in the range of 1 × 10⁻³ M and 1 × 10⁻⁴ M.
Metals 12 01819 g011
Figure 12. Particle size distribution calculated using HR-TEM images.
Metals 12 01819 g012
Figure 13. (A) HR-TEM image of nanoparticle, (B) FFT analysis of the image.
Metals 12 01819 g013
Figure 14. XRD analysis of the obtained materials. The concentration of bismuth and rhenium in the solution was 1 × 10⁻³ M, and the concentration of silver was 1 × 10⁻⁴ M. The synthesis of nanoparticles was carried out in the presence of a PVA as a stabilizing agent.
Metals 12 01819 g014
Figure 15. Cyclic voltammetry measurement within the potential range from −0.2 V to −1 V vs. SCE in a 0.1 M PBS solution with and without the addition of 100 μL H2O2. The scan speed was 20 mV/sec.
Metals 12 01819 g015
Figure 16. Amperometric measurements of hydrogen peroxide reduction with selected nanoparticles.
Metals 12 01819 g016
Figure 17. Amperometric measurement of hydrogen peroxide reduction with silver nanoparticles.
Metals 12 01819 g017
Figure 18. The calibration curves between the current density and H2O2 concentration.
Metals 12 01819 g018
Table 1. Specific surface area of synthesized nanoparticles.
ColloidAgReBiAgReBi
Specific surface area (cm2/μL)4121192895
Publisher’s Note: MDPI stays neutral with regard to jurisdictional claims in published maps and institutional affiliations.