Article

Structure and Oxidation Behavior of NiAl-Based Coatings Produced by Non-Vacuum Electron Beam Cladding on Low-Carbon Steel

by
Tatiana S. Ogneva
1,
Alexey A. Ruktuev
1,
Daria V. Lazurenko
1,*,
Kemal I. Emurlaev
1,
Yulia N. Malyutina
1,
Mikhail G. Golkovsky
2,
Kirill D. Egoshin
1 and
Ivan A. Bataev
1
1
Faculty of Mechanical Engineering and Technologies, Novosibirsk State Technical University, K. Marx Ave. 20, 630073 Novosibirsk, Russia
2
Budker Institute of Nuclear Physics, Lavrentyev Ave. 11, 630090 Novosibirsk, Russia
*
Author to whom correspondence should be addressed.
Metals 2022, 12(10), 1679; https://doi.org/10.3390/met12101679
Submission received: 9 September 2022 / Revised: 3 October 2022 / Accepted: 5 October 2022 / Published: 8 October 2022
(This article belongs to the Special Issue Intermetallic-Based Materials and Composites)

Abstract

:
NiAl-based intermetallic coatings were obtained using non-vacuum electron beam cladding on low-carbon steel. The structure of the coatings was investigated using optical microscopy, scanning electron microscopy (SEM), energy dispersive X-ray spectroscopy (EDX), electron backscatter diffraction (EBSD), and X-ray diffraction (XRD). The coatings mostly consisted of grains elongated perpendicular to the substrates, with a strong <100> texture along the grain growth direction. The coatings contained about 14 at. % Fe, which appeared due to the partial melting of the steel substrate. At the bottom of the coatings, an inhomogeneous mixing zone with an increased concentration of Fe was formed; at the “substrate–coating” interface, a thick layer with a Fe50-Ni25-Al25 at. % composition was observed. The samples exhibited weight gains of 0.1, 0.8, 2.14, and 3.4 mg/cm2 after 100 h of oxidation at 700, 800, 900, and 1000 °C, respectively. The oxide layer contained α-Al2O3 and θ-Al2O3, and the presence of iron atoms contributed to the formation of a small amount of spinel. During the oxidation process, a layer with a high Fe content (~60 at. %) formed along the boundary between the oxide film and the NiAl-based material, which had a positive effect on the formation of a non-porous “oxide–coating” interface.

1. Introduction

In industries such as aviation and rocketry, oil refining, and nuclear power, many products and components, as a rule, operate under aggressive conditions. Heat-resistant NiAl-based intermetallics are known to be excellent candidates for use as protective barrier coatings for nickel and titanium alloys, as well as for steel products exposed to oxidizing environments at elevated temperatures [1,2]. NiAl-based alloys possess high hardness, wear resistance, corrosion resistance, and thermal stability; this favorable combination of properties explains an increased interest in NiAl-based alloys over the past few decades.
The intensive development of industry requires the use of highly efficient methods for the production of coatings with thicknesses ranging from several hundred micrometers to several millimeters. Today, many techniques for producing intermetallic coatings have been developed, including such advanced methods as magnetron sputtering [1,3,4,5,6], plasma spraying [7,8,9], and detonation spraying [10,11,12,13], as well as traditional methods, for instance, electric arc surfacing [9,14,15] and laser cladding [16,17]. However, many of them are low efficiency and suitable only for surfacing on small-sized items. Some processes may also require the use of vacuum or shielding gas. In this work, coatings were produced by melting the cladding material with a beam of relativistic electrons ejected into an air atmosphere. Compared with other methods, including those noted above, electron beam surfacing makes it possible to clad large areas in a short time and obtain a coating thickness of up to 2 mm in one pass [18,19,20,21]. Low-carbon steel is the most widely used structural material, with good strength properties and low cost. As a rule, the substrate always interacts with the melted coating during the surfacing process. However, as of today, the authors did not find publications that show the influence of this process on the oxidation behavior of cladded NiAl on steel. However, most steels exhibit poor oxidation resistance at elevated temperatures. For this reason, protective and barrier layers are often applied to the surface of steels.
When melting NiAl powder on a steel substrate, it is expected that some of the substrate material may dissolve in the coating; thus, NiAl coating will be alloyed with Fe. Some evidence of a positive effect of Fe additions on the properties of NiAl-based coatings has been discovered. For instance, Yuan et al. noted that the presence of Fe leads to a decrease in the number of cracks in NiAl-based coatings, while maintaining wear resistance and microhardness at a high level [22]. Chen et al. concluded that the addition of Fe and Pt effectively slows down the formation of cavities at the interface between the oxide and NiAl layers and improves the spallation resistance of oxide films during oxidation tests [23].
In the previously published works dedicated to NiAl-based coatings obtained via a liquid-phase process, almost no attention was paid to the study of the structure at the “coating–substrate” interface. The interaction between the substrate and the coating is of great importance since the adhesion of the coating and its durability greatly depend on the structure of the transition layer at the “coating–substrate” interface. Without understanding the processes of its formation, it is difficult to assess the possibility of practically applying coatings. In particular, when melting NiAl-based powders on steel, special attention should be paid to the dissolution of Fe in the intermetallic layer and the effect of this process on the structural, mechanical, and operational properties of the coating.
Thus, today, there are gaps in the understanding of the structure and properties of NiAl-based protective coatings on steel, which this article is devoted to filling. In addition, so far, there have been no publications devoted to the production of NiAl-based coatings using the technique of non-vacuum electron beam cladding. This technique makes it possible to effectively obtain thick coatings on large-sized workpieces and is promising for industrial use.

2. Materials and Methods

The samples were prepared by non-vacuum electron beam cladding NiAl intermetallic powder on flat workpieces of low-carbon steel containing 0.2 at. % C (grade “steel 20”) with a thickness of 10 mm and an area of 50 × 100 mm2. In the initial state, the low-carbon steel was hot-rolled and had a typical ferritic–pearlitic structure with a grain size of about 20 μm. The composition of the substrate material is presented in Table 1. The powder particles had an average size of ~90 µm (Figure 1). Before cladding, the surface of the steel workpieces was milled to a roughness of Ra ~6.4 µm and cleaned with acetone. Experiments were carried out at the Budker Institute of Nuclear Physics at the industrial electron beam accelerator ELV6. This experimental facility has high initial electron energy (1.4 MeV) and a high beam power (up to 100 kW), which makes it possible to melt thick layers of powder mixtures in one pass. The distance from the accelerator outlet to the workpiece was 90 mm; the beam diameter at this distance was 12 mm. To increase the treating area to 50 mm in width and provide the uniform melting of the powder material in one pass, an electromagnetic sweep of the electron beam at ±21° with a frequency of 50 Hz was used. A scheme of a typical cladding experiment and a more detailed description of the ELV6 accelerator and the principle of its operation are provided in [24].
The coating and the substrate were protected from the atmosphere by CaF2 flux. To prevent the reaction of the molten material with air, the NiAl powder was evenly mixed with CaF2 flux powder. CaF2 is widely used as a flux in various welding and cladding technologies. Its main task is to create slag on the surface of the melt pool to prevent its interaction with air and eliminate existing oxides. At high temperatures, which are common for the cladding process, Fe3O4 and Fe2O3 oxides are thermally unstable. At temperatures of 1538 and 1562 °C, they are converted into the lower oxide FeO, which is stable up to a temperature of 3400 °C and must be removed from the melt pool. The fluoride fluxes eliminate FeO oxide according to the following reactions: FeO + CaF2 = FeF2 + CaO, FeO + CaF2 = FeF3 + CaO + Fe. The particle sizes of CaF2 powder varied in a range from 1 to 20 μm; the average size was about 7 μm [25]. Then, the mixture of NiAl powder and flux was distributed over the steel workpiece; the workpiece with the mixture was placed on a computer-controlled table, which provided the movement of the sample relative to the electron beam at a given speed. After the experiment, a slag crust formed on the surface of the coating, which was easily removed. The regimes of the experiment are provided in Table 2.
For further investigation, the samples were cut into pieces using a Struers Discotom-100 (Struers LLC, Cleveland, OH, USA) disk-cutting machine and a Sodick AG400L (Sodick Europe Ltd., Warwick, UK) wire discharge machine. To perform metallographic studies, the specimens were ground on abrasive papers with a grain size of P300-P2500 and diamond suspensions of 9–1 µm and polished on an alumina suspension of 3 µm and a silica suspension of 40 nm. The substrate material was etched with a 3% solution of HNO3 in ethanol.
The microstructure was characterized using a Carl Zeiss Axio Observer Z1m (Zeiss Microscopy, Munich, Germany) optical microscope and Carl Zeiss EVO 50 XVP (National Institute of Materials Physics, Bucharest-Magurele, Romania), scanning electron microscope (SEM), equipped with an Oxford Instruments X-Act (United Kingdom) energy dispersive X-ray spectrometer (EDX). EDX was used for point analysis as well as for elemental mapping.
EBSD analysis was carried out using a Carl Zeiss Sigma 300 SEM equipped with an Oxford Instruments HKL Channel 5 system. Before the investigations, the specimens for EBSD analysis were mechanically ground on sandpaper, polished on colloidal silicon oxide, and, in the final stage, polished for 30 min by an Ar ion beam with an energy of 10 keV using a Technoorg LINDA SemPrep2 (Technoorg Linda Co. Ltd., Budapest, Hungary) apparatus.
The phase composition of the samples before and after the oxidation tests was determined using a Thermo Fisher Scientific ARL X’TRA X-ray θ-θ diffractometer (LabMaklaar Benelux B.V., Zevenhuizen, Netherlands) using Mo Kα1,2 radiation. The dwell time per point was 5 s; the scanning step (Δ2θ) was 0.05°.
The Vickers microhardness of the coatings and substrate was measured using a Wolpert Group 402MVD (YUMP, Diepoldsau, Switzerland) tester. The measurements were carried out in the vertical cross-section of the sample with a load on the diamond indenter of 0.098 N.
To carry out oxidation experiments, samples of 26 × 10 × 0.7 mm3 in size were cut out from the coating layer, ground on abrasive paper with a grain size of P1000, and cleaned for 20 min in an ultrasonic bath in acetone. Oxidation was carried out in a muffle furnace in an air atmosphere for 100 h at temperatures of 700, 800, 900, and 1000 °C. During oxidation, the specimens were placed in ceramic crucibles. Weighing of the specimens was carried out together with the crucible on a precision balance with an accuracy of 0.0001 g. Before weighing, the crucible with the sample was removed from the furnace and cooled to room temperature. After the measurements, the crucible with the sample was returned to the furnace. The rate of oxidation was estimated from the weight gain of the sample per unit area. During the first 20 h of the experiment, the weight was monitored every 5 h; then, when the mass gain slowed down, the weighting was performed every 10 h.
The top surface of the oxide scales after oxidizing the samples at 800, 900, and 1000 °C was studied using a Carl Zeiss Sigma 300 SEM. The element composition of oxide scales was investigated using EDX analysis. The specimen oxidized at 1000 °C was cut by an ion beam at an angle of 30° on a Technoorg LINDA SemPrep2 device; the scheme of the cut is shown in Figure 2. The use of an ion beam enabled the gentle removal of the material, which made it possible to preserve the fragile oxide layer and obtain a clean-cut surface. In addition, the angled cut made it possible to increase the cross-sectional area of the thin oxide scale and study its composition in more detail.

3. Results and Discussions

3.1. Structure of NiAl Coatings on Steel Substrate

3.1.1. Structure of the Coating and Substrate in the Cross-Section

Coatings with a thickness of ~1.5 mm were formed by cladding NiAl powder on steel workpieces. A typical cross-section of the obtained specimen is shown in Figure 3a. Several specific areas in the structure of the sample can be distinguished: the area of the main coating (1), the area of the intensive mixing of the coating material with the base material (2), the heat-affected zone (HAZ) of the steel substrate (3), and the steel substrate with the initial structure (4). During the non-vacuum electron beam surfacing, the temperature of cladded materials usually varies between 2000–3000 °C. The temperature at the interface between the substrate and a coating during the fabrication process was about the melting temperature of the low-carbon steel substrate, which is 1280 °C. In the HAZ, the temperature during electron beam processing decreased gradually in the direction from the coating to the substrate. Thus, depending on the heating effect, the structure of low-carbon steel smoothly changed (Figure 3b–e). For instance, on the top of the HAZ, a needle-shaped Widmanstatten structure formed due to heating the material to a temperature considerably higher than that of an α→γ transformation (Figure 3c). At a greater distance from the coating, the structure of the HAZ became equiaxed and fine-grained due to the recrystallization of α-Fe. At ~2.5 mm, the structure of the coating gradually became more similar to the initial structure of the substrate, which was a mixture of ferrite grains and pearlite colonies elongated due to rolling (Figure 3f).
According to the XRD study, the coating consisted solely of the NiAl-based phase (Figure 4). However, EDX analysis showed that the main part of the coating material contained about 14 at. % Fe, which appeared due to the partial melting of the steel substrate (Table 3). Fe was distributed evenly in the main part of the coating, but closer to the steel substrate (approx. at the distance of 350 μm from the substrate), its concentration gradually increased (Figure 3g); the average content of Fe in this area was 27 at. % (Table 3). According to the EDX analysis data, some amount of elements such as Cr, Mn, and Si also passed into the coating from the steel substrate.

3.1.2. Structure of NiAl-Based Coatings

EDX maps of the main part of the coating (Figure 5b–f) indicate that Fe predominantly concentrates in the interdendritic space. According to the phase diagram of the Ni-Al-Fe system [26], when cooling from a liquid state, the ordered NiAl β-phase is practically free of Fe precipitates first. Then, when cooling to lower temperatures, Fe-enriched phases crystallize. Depending on Al content, Fe-based disordered bcc solid solution (which has similar lattice parameters as NiAl) or Ni-based disordered fcc solid solution could crystallize in Fe-enriched zones. Note that, according to EDX maps, Al was deficient in the Fe-rich regions; such a composition more likely corresponds to the fcc phase. Even so, the volume fraction of these inclusions was too small to be identified by XRD analysis. In addition, small segregations of the second phase, which mainly consisted of Fe and Cr, can be seen between the interdendritic regions (indicated by arrows in Figure 5b).

3.1.3. Structure of NiAl-Based Coatings near the “Coating–Substrate” Interface

A different structure can be observed at ~350 μm from the “coating–substrate” interface (Region 2 in Figure 3a). As mentioned above, this area has a higher Fe content than the main part of the coating. When considering the EDX maps of these areas in detail (Figure 6), the Fe-enriched mixing zones of the melted substrate in the NiAl coating are clearly revealed. The term “mixing zone” is used hereinafter to refer to that part of the coating, where the NiAl and the melted steel substrate were mixed during cladding. The heterogeneity of elements in mixing zones can be related to the melt pool convection before solidification.
Table 4 shows the element content at the points marked in Figure 6a. The wavy interlayer along the interface with a clearly distinguished concentration boundary consists of ~50 at. % Fe and ~20–25 at. % Ni and Al, respectively (Points 6 and 7 in Figure 6a). Hereinafter, this layer is referred to as the Fe50-Ni-25-Al25 layer. This interlayer can be observed on metallographic images as a beige-colored line (Figure 7a). Inhomogeneous mixing between the Fe50-Ni-25-Al25 layer and the main part of the NiAl coating led to different gradient compositions in some local zones (for example, Points 3 and 4 in Figure 6a). Concerning the EDX maps of other alloying elements, it is noticeable that the Si opposite to the Cr and Mn has more intensive spectra in the substrate area than in the coating. Therefore, Si passes into the coating less actively than Cr and Mn. In some areas of the mixing zone, the segregation of elements can also be observed. The blue spots observed in Figure 7a correspond to the Al-enriched and Mn- and Cr-depleted zones. Apparently, the bottom areas were heated to a lower temperature in comparison to the upper layers, which was not enough for the complete homogenization of the melt and the uniform dissolution of all the alloying elements from the steel. Thus, one can observe traces of the former NiAl particles, in which Mn and Cr did not have time to dissolve. Fe and Ni were distributed uniformly in these regions, and their concentration is similar to the main dendritic grains in the coating.

3.1.4. EBSD Analysis Results

EBSD analysis of the main part of the NiAl-based coating revealed the formation of columnar grains with a <100> direction predominantly oriented perpendicular to the substrate, which is a typical situation for the crystallization of bcc metals (Figure 8a). At the top area of the coating, coarse equiaxed grains of ~100–200 μm were formed when the surface of the melt was cooled due to convection and radiation. In the mixing area, the inhomogeneous element distribution promoted nucleation and the growth of numerous small, randomly oriented grains of about 30–50 μm in size. The interdendritic, Fe-enriched regions of the coating were indistinguishable using the EBSD method due to their small sizes.
The IPF map evidences that the NiAl coating and a substrate were recognized as the same phase (Figure 8b) since both NiAl and α-Fe have the same bcc structure with a lattice parameter of 2.87 Å. Along the “coating–substrate” interface, a layer of grains of about 100 μm in thickness was observed. As shown before, this area corresponds to the Fe50-Ni25-Al25 at. % composition. This layer was also identified by EBSD analysis as having a bcc crystal lattice similar to NiAl and α-Fe. According to the phase diagram of the Ni-Al-Fe system [26], the alloy with this content corresponds to the disordered bcc + ordered bcc region.
Note that all boundaries between the grains in the Fe50-Ni25-Al25 layer are oriented perpendicular to the interface and continue in the substrate (indicated by the arrows and highlighted by the dotted lines in Figure 8b). Obviously, when cooling from the melt, this layer in the coating crystallized first because of the heat dissipating deep into the sample. The solidification temperature of an alloy with such a composition, according to the phase diagram [26], is about 1367 °C; thus, at the moment of crystallization, the low-carbon steel substrate was in an austenitic state, and the oriented grain nucleation occurred on its surface. After the substrate was cooled down to the temperature of a γ→α transformation, a lot of smaller α-Fe grains formed inside the primary austenitic grains. The newly formed α-Fe grains no longer had common vertical boundaries with the Fe50-Ni25-Al25 layer. Thus, it can be concluded that the grain size of the Fe50-Ni25-Al25 layer is mainly determined by the grain size of the steel substrate in the austenitic state at the moment of crystallization.

3.1.5. Microhardness Measurements

The microhardness of the low-carbon steel substrate (Figure 9) varied within 180–200 HV and practically did not change at various points along the sample cross-section. The microhardness of the obtained NiAl-based coating ranged from 400 to 500 HV; this level is within the typical range of microhardness values for NiAl compounds. It can be seen that the microhardness near the top surface of the coating, where, according to the EBSD maps, large equiaxed grains formed, is ~30 HV less than in the main region of the coating with elongated grains. The equiaxed grains on the top had no preferred orientation, while the elongated grains, as shown above, had a crystallization texture. Thus, this difference could be explained due to the anisotropy of the properties of the NiAl compound in different crystallographic directions. The Fe-enriched phase has higher microhardness; therefore, closer to the “coating–substrate” interface, the microhardness of the intermetallic layer increased from 450 to 500 HV.

3.2. Oxidation Test Results

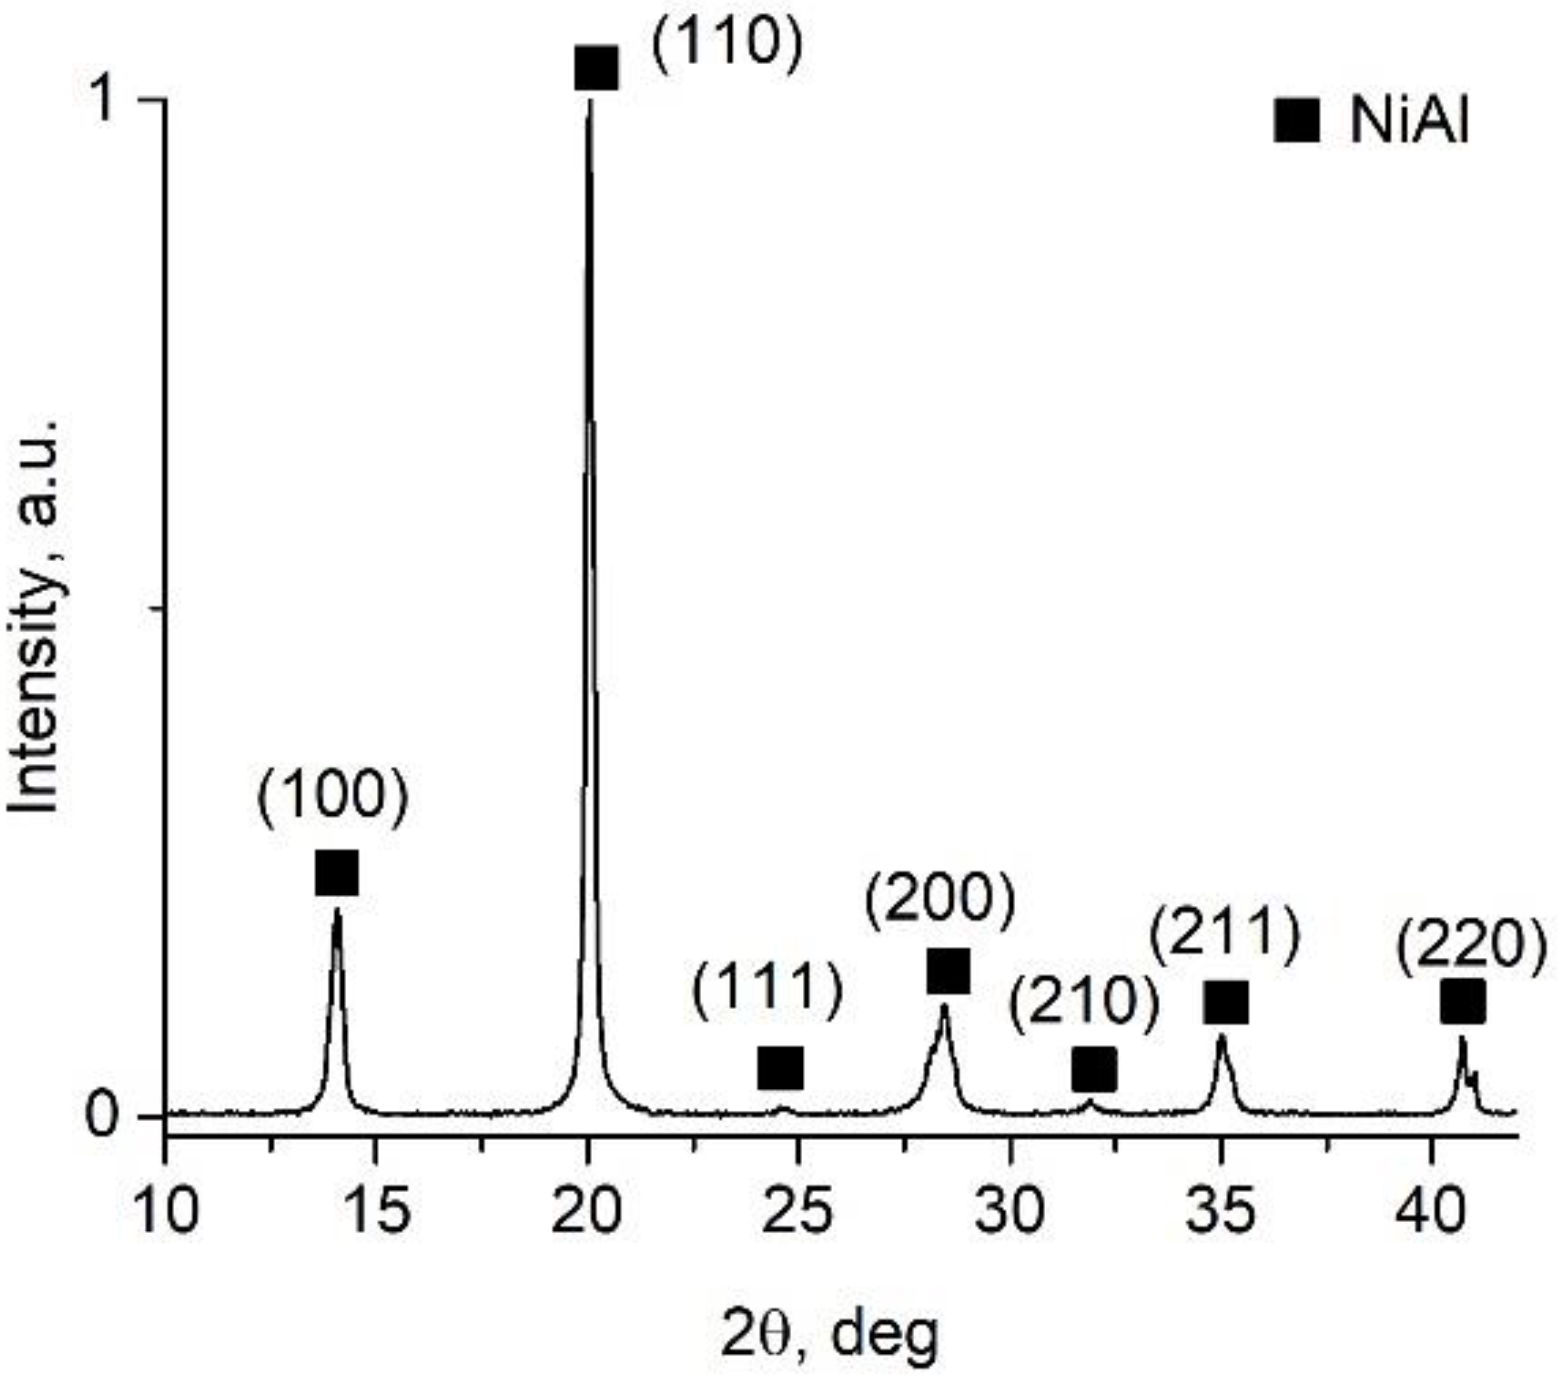
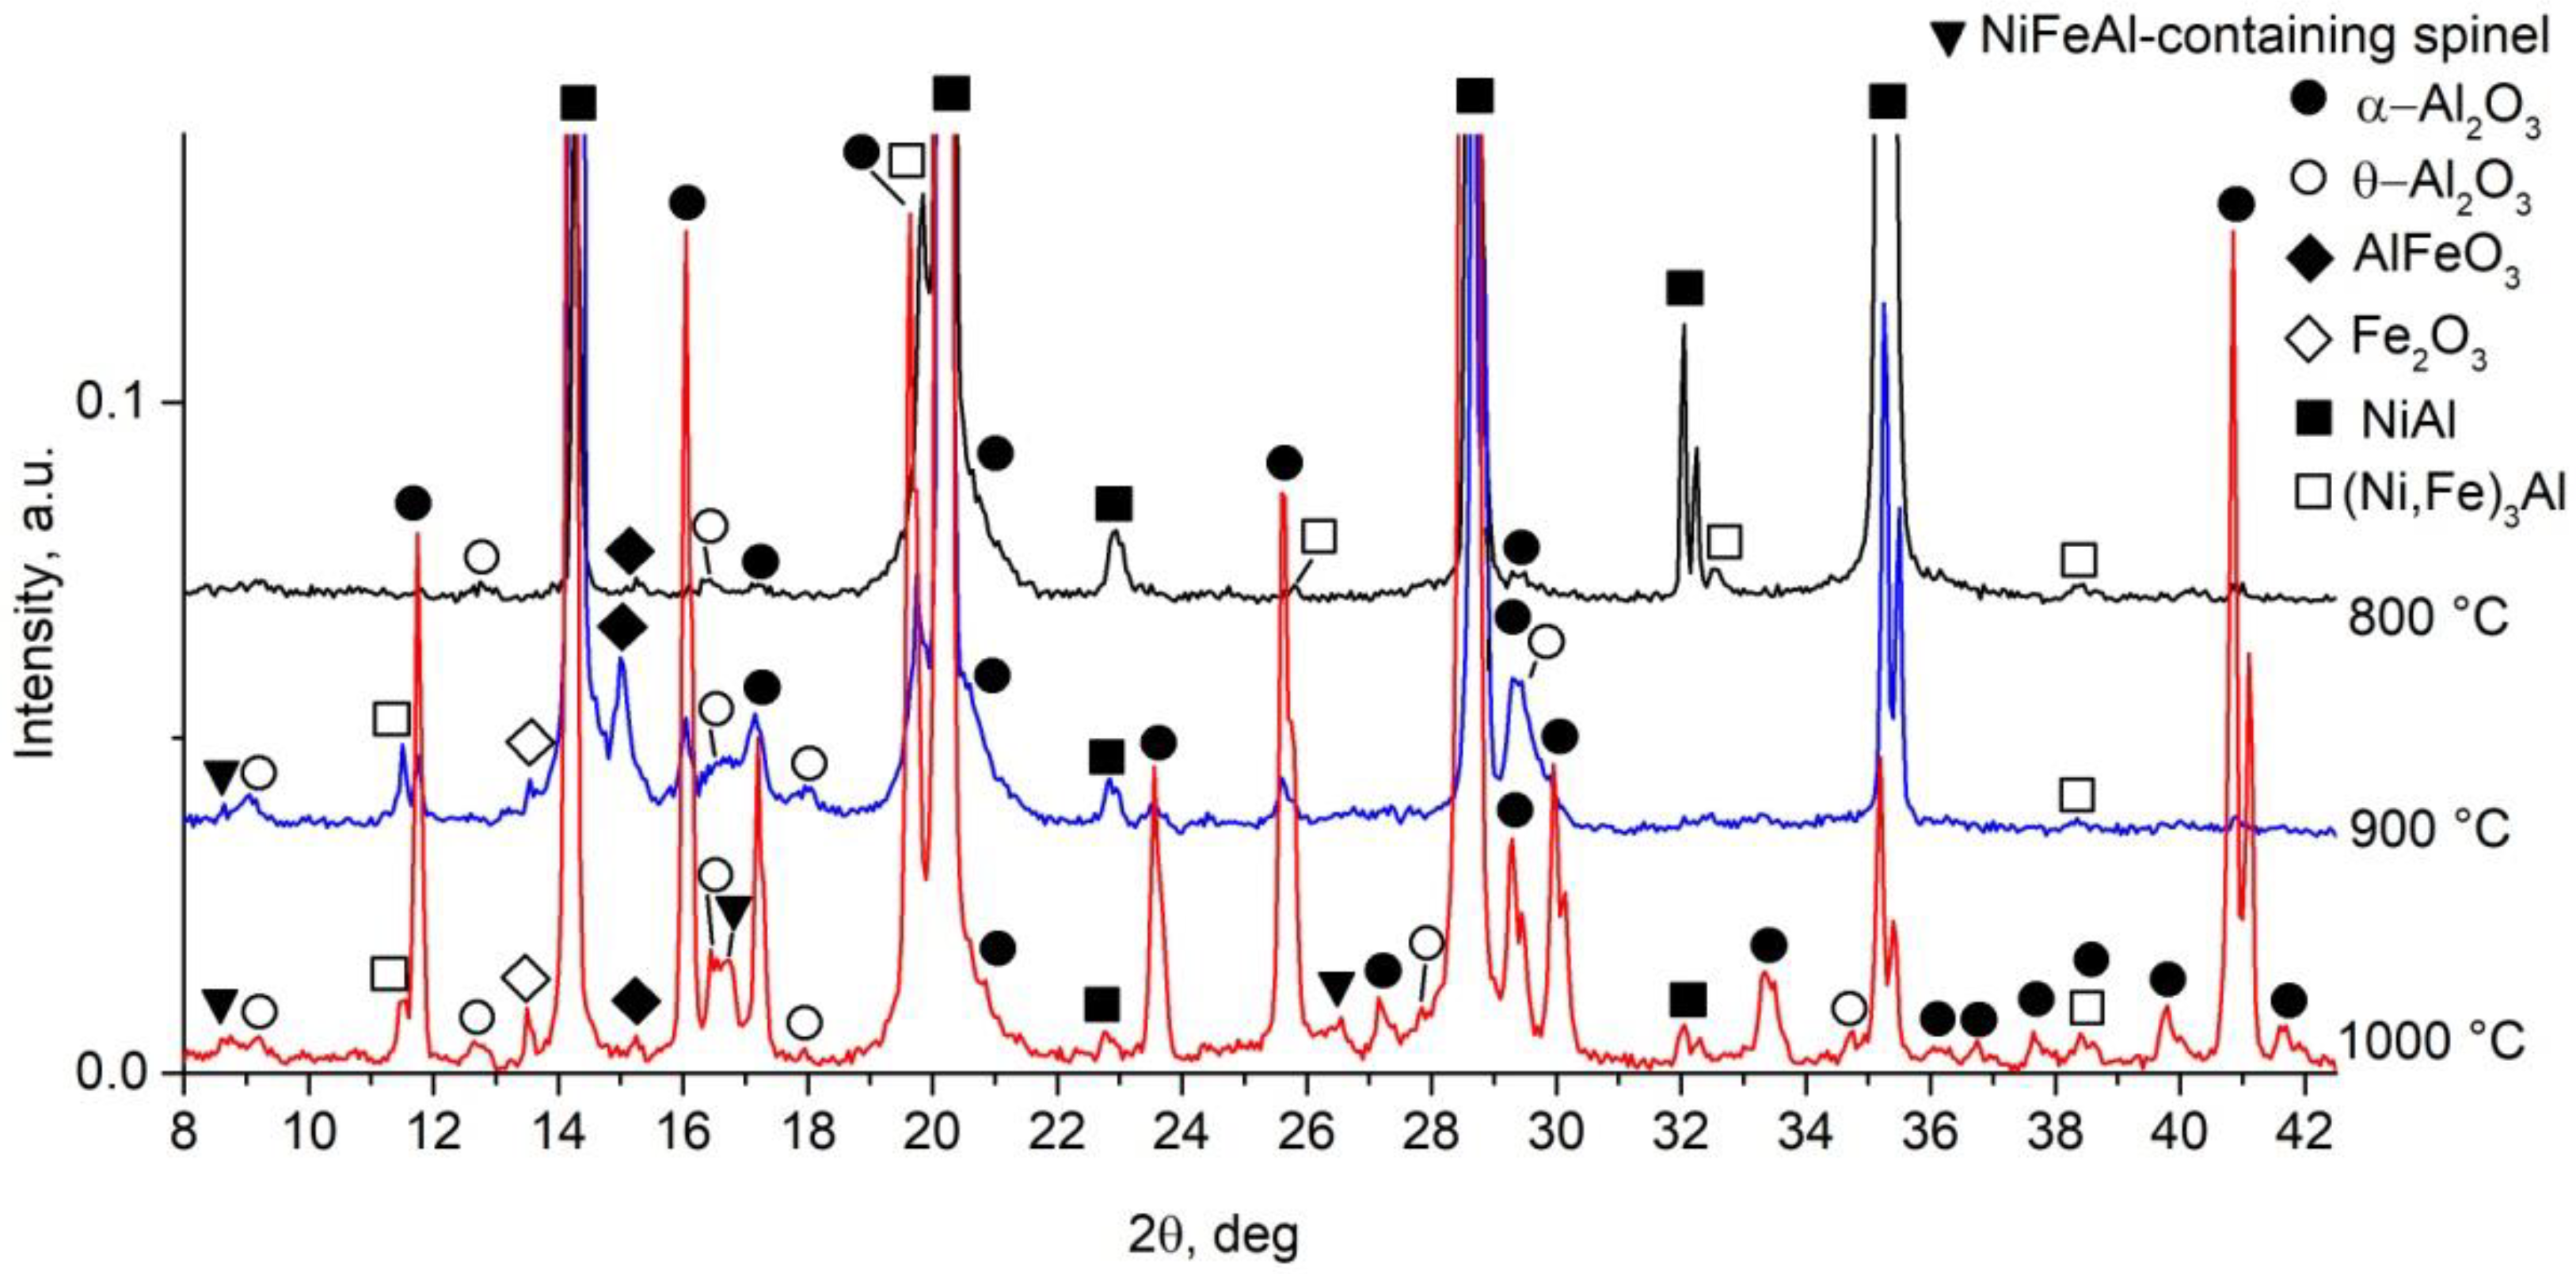
3.2.1. XRD Analysis of the Oxide Scales

The coatings were cut off the substrate and oxidized in an air atmosphere at 700, 800, 900, and 1000 °C for 100 h. Oxide scales were studied using XRD analysis (except for the scale formed at 700 °C due to its very small thickness). The XRD patterns illustrate that the phase composition of the oxide scales after 100 h of oxidation contained α-Al2O3 and θ-Al2O3 phases (Figure 10). According to classical ideas about the oxidation of NiAl, an increase in temperature leads to more active α-Al2O3 growth; at the same time, the formation of θ-Al2O3 is suppressed [20,27,28,29,30,31,32,33,34]. This trend can be clearly seen in the obtained XRD patterns: The intensity of α-Al2O3 reflections increases with the temperature increase, while the intensity of the θ-Al2O3 phase does not change significantly. At 900 and 1000 °C, weak reflections of spinel were revealed. In accordance with the PDF-4 database, Ni-Al-Fe-containing spinel has a cubic crystal lattice belonging to the Fd-3 m space group. The content of each element in Ni-Al-Fe-based spinel can vary within a certain range. The spinel appears due to the presence of Fe in the coating. Alloying NiAl with Fe could also contribute to the formation of a small amount of Fe2O3 and AlFeO3. However, only traces of the most intense reflections of these phases (at ~13.5 and ~15 degrees 2θ, respectively) can indicate their possible presence. A small amount of a compound with a (Ni,Fe)3Al-type lattice formed most likely due to the consumption of Al for the growth of Al2O3 and the corresponding deficiency of Al in NiAl near the “oxide scale–NiAl” interface, which has been repeatedly observed in studies on the oxidation of NiAl [29,35].

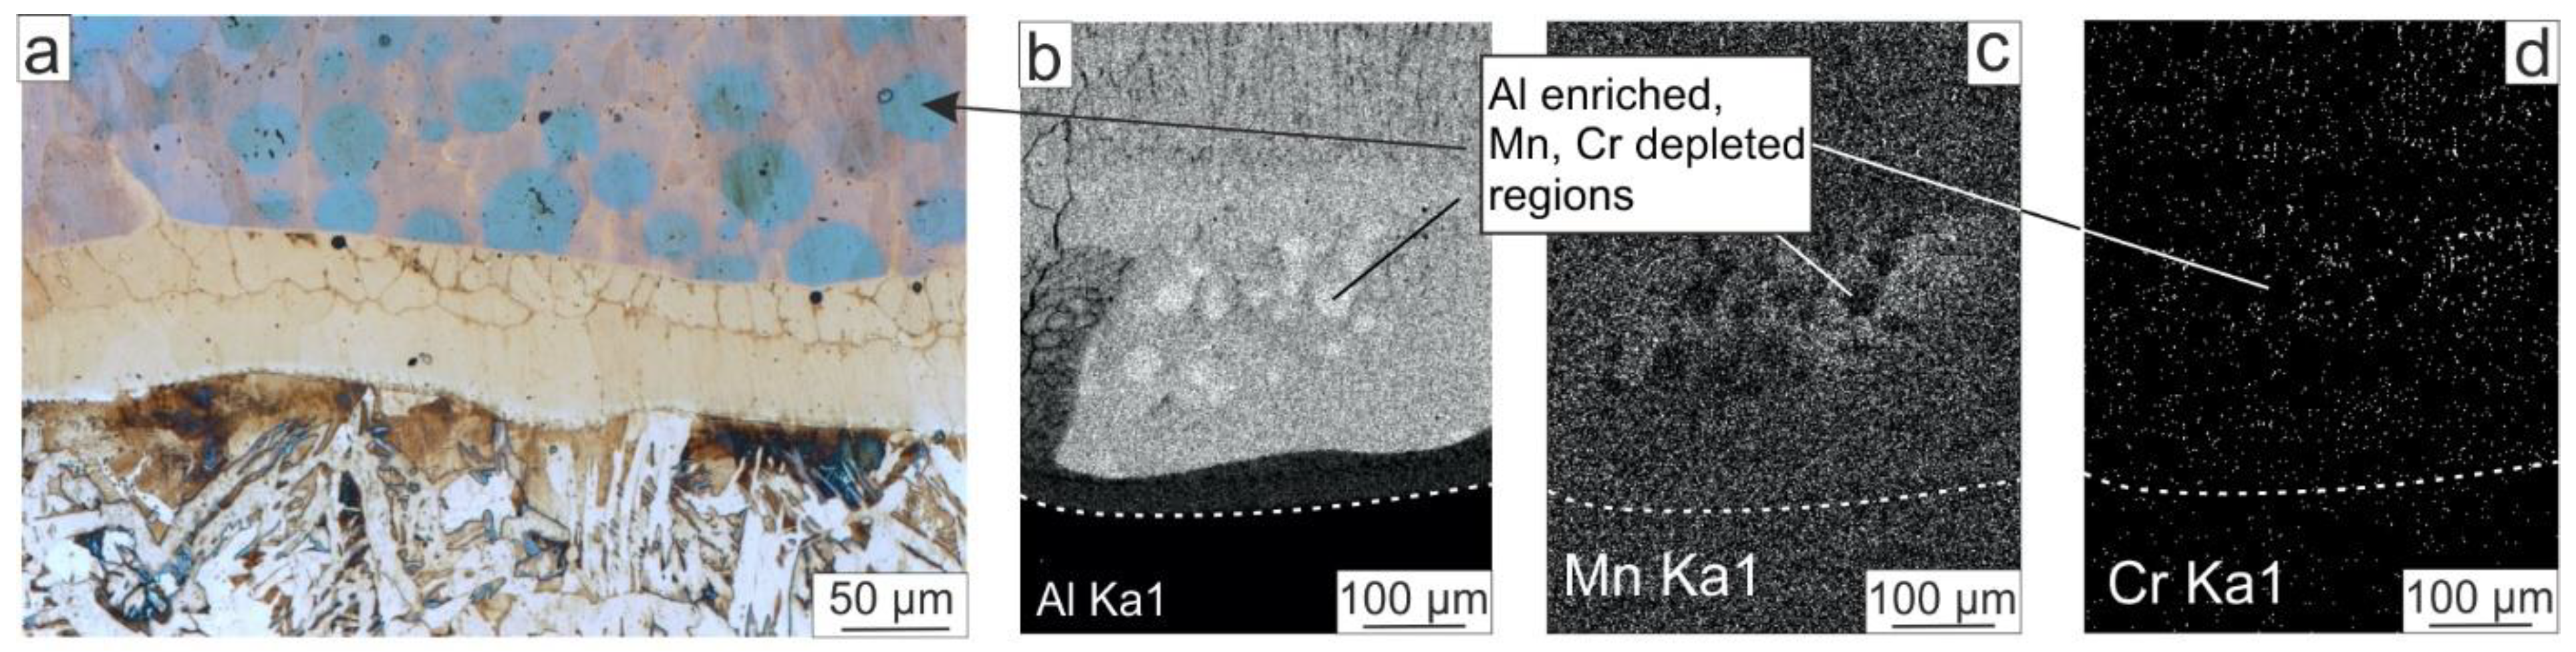
3.2.2. EDX Analysis of Oxide Scales

Figure 11 shows the distribution of elements over the cross-section of the oxide scales. The oxide scale grown at 700 °C is very thin and cannot be detected by SEM either in the cross-section or when observing the oxide scale top surface. At 800 °C, the thickness of the oxide scale reached 3 μm; the scale mostly consisted of oxygen and aluminum. Fe-enriched interdendritic regions that were observed in as-cladded samples can also be seen after oxidation at 800 °C, but their area became smaller, which indicates the partial dissolution of Fe in NiAl. After 100 h of oxidation at 900 °C and 1000 °C, the Fe-enriched regions completely dissolved, and the coatings became homogeneous (Figure 11b,c). The thickness of the oxide film after 100 h of oxidation at 900 °C was 12 µm. The Fe and Cr-containing inclusions, which were present inside the interdendritic space of as-cladded samples, were clearly visible only in the oxide scale (Figure 11b). Obviously, their solubility in the oxide film is lower compared with the NiAl matrix. The size of inclusions in the oxide film is indeed smaller than in the coating before oxidation. During the growth of the oxide film at elevated temperatures, the Fe- and Cr-containing inclusions gradually dissolved, and by the time they were absorbed by the oxide film, their dimensions became smaller.
The thickness of the scale after oxidation for 100 h at 1000 °C was about 26 μm. Note that the distribution of elements in the cross-section of the oxide scale was not uniform (Figure 11c). Particular attention should be paid to an interlayer with high Fe content formed between the oxide film and the coating. For a more detailed study of the composition of the oxide scale, the specimen was cut by an ion beam at an angle of 30° to the coating plane (the scheme is shown in Figure 2). EDX maps from the cut surface are presented in Figure 12b–e. Table 5 contains the results of an EDX analysis of the points marked in Figure 12f. Inside the oxide scale, two areas with different compositions were revealed; the composition of bright areas in the cut plane (Points 1, 3, and 5 in Figure 12f) corresponds to the Ni,Fe,Al-containing spinel, and the composition of the dark areas (Points 2 and 4) corresponds to Al2O3. According to EDX analysis, Cr, Mn, and Si were basically concentrated in the spinel; Al2O3 almost did not contain these minor elements. The interlayer with high Fe content contained 20 at. % Ni, 7 at. % Al, and 60 at. % Fe (Points 9, 10, and 12 in Figure 12f) and, according to the EDX maps, almost did not contain oxygen (Figure 11c and Figure 12e). In addition, this layer contained 1.2–1.4 at. % Cr and ~0.9 at. % Si, which is slightly higher than in the coating (see Table 3 and Table 4) and the oxide scale (Table 5). The composition in Point 7 corresponds to the composition of (Ni,Fe)3Al; Points 8, 9, and 11 have the composition of the Fe-rich layer. The color and contrast in the SEM image in Points 8, 9, and 11 in comparison to 7 in Figure 12f do not differ. This is explained by the absence of oxygen and the similar atomic numbers of Fe (Z = 26) and Ni (Z = 28).
The increased diffusion of Fe into the oxide scale and its inhomogeneous distribution at 1000 °C are also explained by the spinel formation, which is confirmed by the XRD patterns shown in Figure 10 and the SEM images of the surface shown in Figure 13. The greater diffusion at the 1000 °C temperature compared with 800 and 900 °C can be explained by the nonlinear increase in the diffusion rate; the increase in diffusion rate with the temperature is typical of most systems, which is a direct consequence of the Arrhenius law. For instance, the rate of oxygen diffusion increases nonlinearly with the increase in temperature from 700 to 1000 °C, which can be indirectly estimated from the slopes of the weight gain curves in Figure 14.
The diffusion mechanism during the oxidation of NiAl is well-studied and has been described in detail in other studies [2,29,34,36,37]. The following diffusion mechanism is considered generally acceptable. Due to the high activity of aluminum, NiAl forms only Al2O3 oxide during high-temperature oxidation. The growth of α-Al2O3 occurs via the outward diffusion of Al3+ and the inward diffusion of oxygen, mainly along the boundaries of oxide grains, which leads to lateral growth and buckling. During isothermal oxidation, the scale is dense and very adherent despite the formation of voids between Al2O3 and NiAl. Therefore, diffusion-controlled oxidation can be expected to follow a parabolic rate law [27,37].
Let us consider in more detail the processes that contribute to the formation of the interlayer with high Fe content during oxidation. Firstly, the NiAl regions near the oxide film are usually characterized by a lack of Al, which is consumed in the formation of Al2O3 and leads to an increased concentration of Ni. According to EDX analysis, the Ni/Al ratio in these regions was approximately 3:1. This is typical for the oxidation process of pure NiAl because the outward diffusion of Al to the “oxide scale–NiAl” interface is greater compared with the inward diffusion of Ni into the NiAl layer. Therefore, oxide scale growth is accompanied by the Al depletion of NiAl near the “oxide–coating” interface and the formation of a thin layer of Ni3Al [33,35,38]. However, in this study, the NiAl contained ~14 at. % Fe. Fe atoms in the NiAl crystal lattice occupy the positions of Ni and have a stronger chemical bond with Al than Ni [39,40]. For this reason, the inward diffusion of Fe atoms at the “oxide scale–e-alloyed NiAl” interface was less than that of the Ni atoms. This condition led to a very high concentration of Fe in this region (in our case, about 60 at. %).
Furthermore, no porosity was observed on the “oxide scale–Fe-alloyed NiAl” interface. Typically, Kirkendall voids appear on the “oxide scale–pure NiAl” interface because the inward diffusion of Ni is less active than the outward diffusion of Al, which results in Kirkendall drift. Voids on the “oxide scale–pure NiAl” interface, as a rule, have a negative effect on the spallation resistance of the oxide scales [23,27]. Chen et al. showed that NiAl with additions of 5 and 10 at. % Fe had increased spallation resistance compared with pure NiAl [23]. The authors of [28,41,42,43,44,45] noted that the higher diffusion of Al reduces Kirkendall drift during the oxidation of NiAl alloyed with Fe. Jeong and Lee found that Fe diffused outward and partially sealed off the voids at the “oxide scale–Fe-alloyed NiAl” interface, which also evidences a positive effect of Fe on the exfoliation resistance of the oxide scale [46].

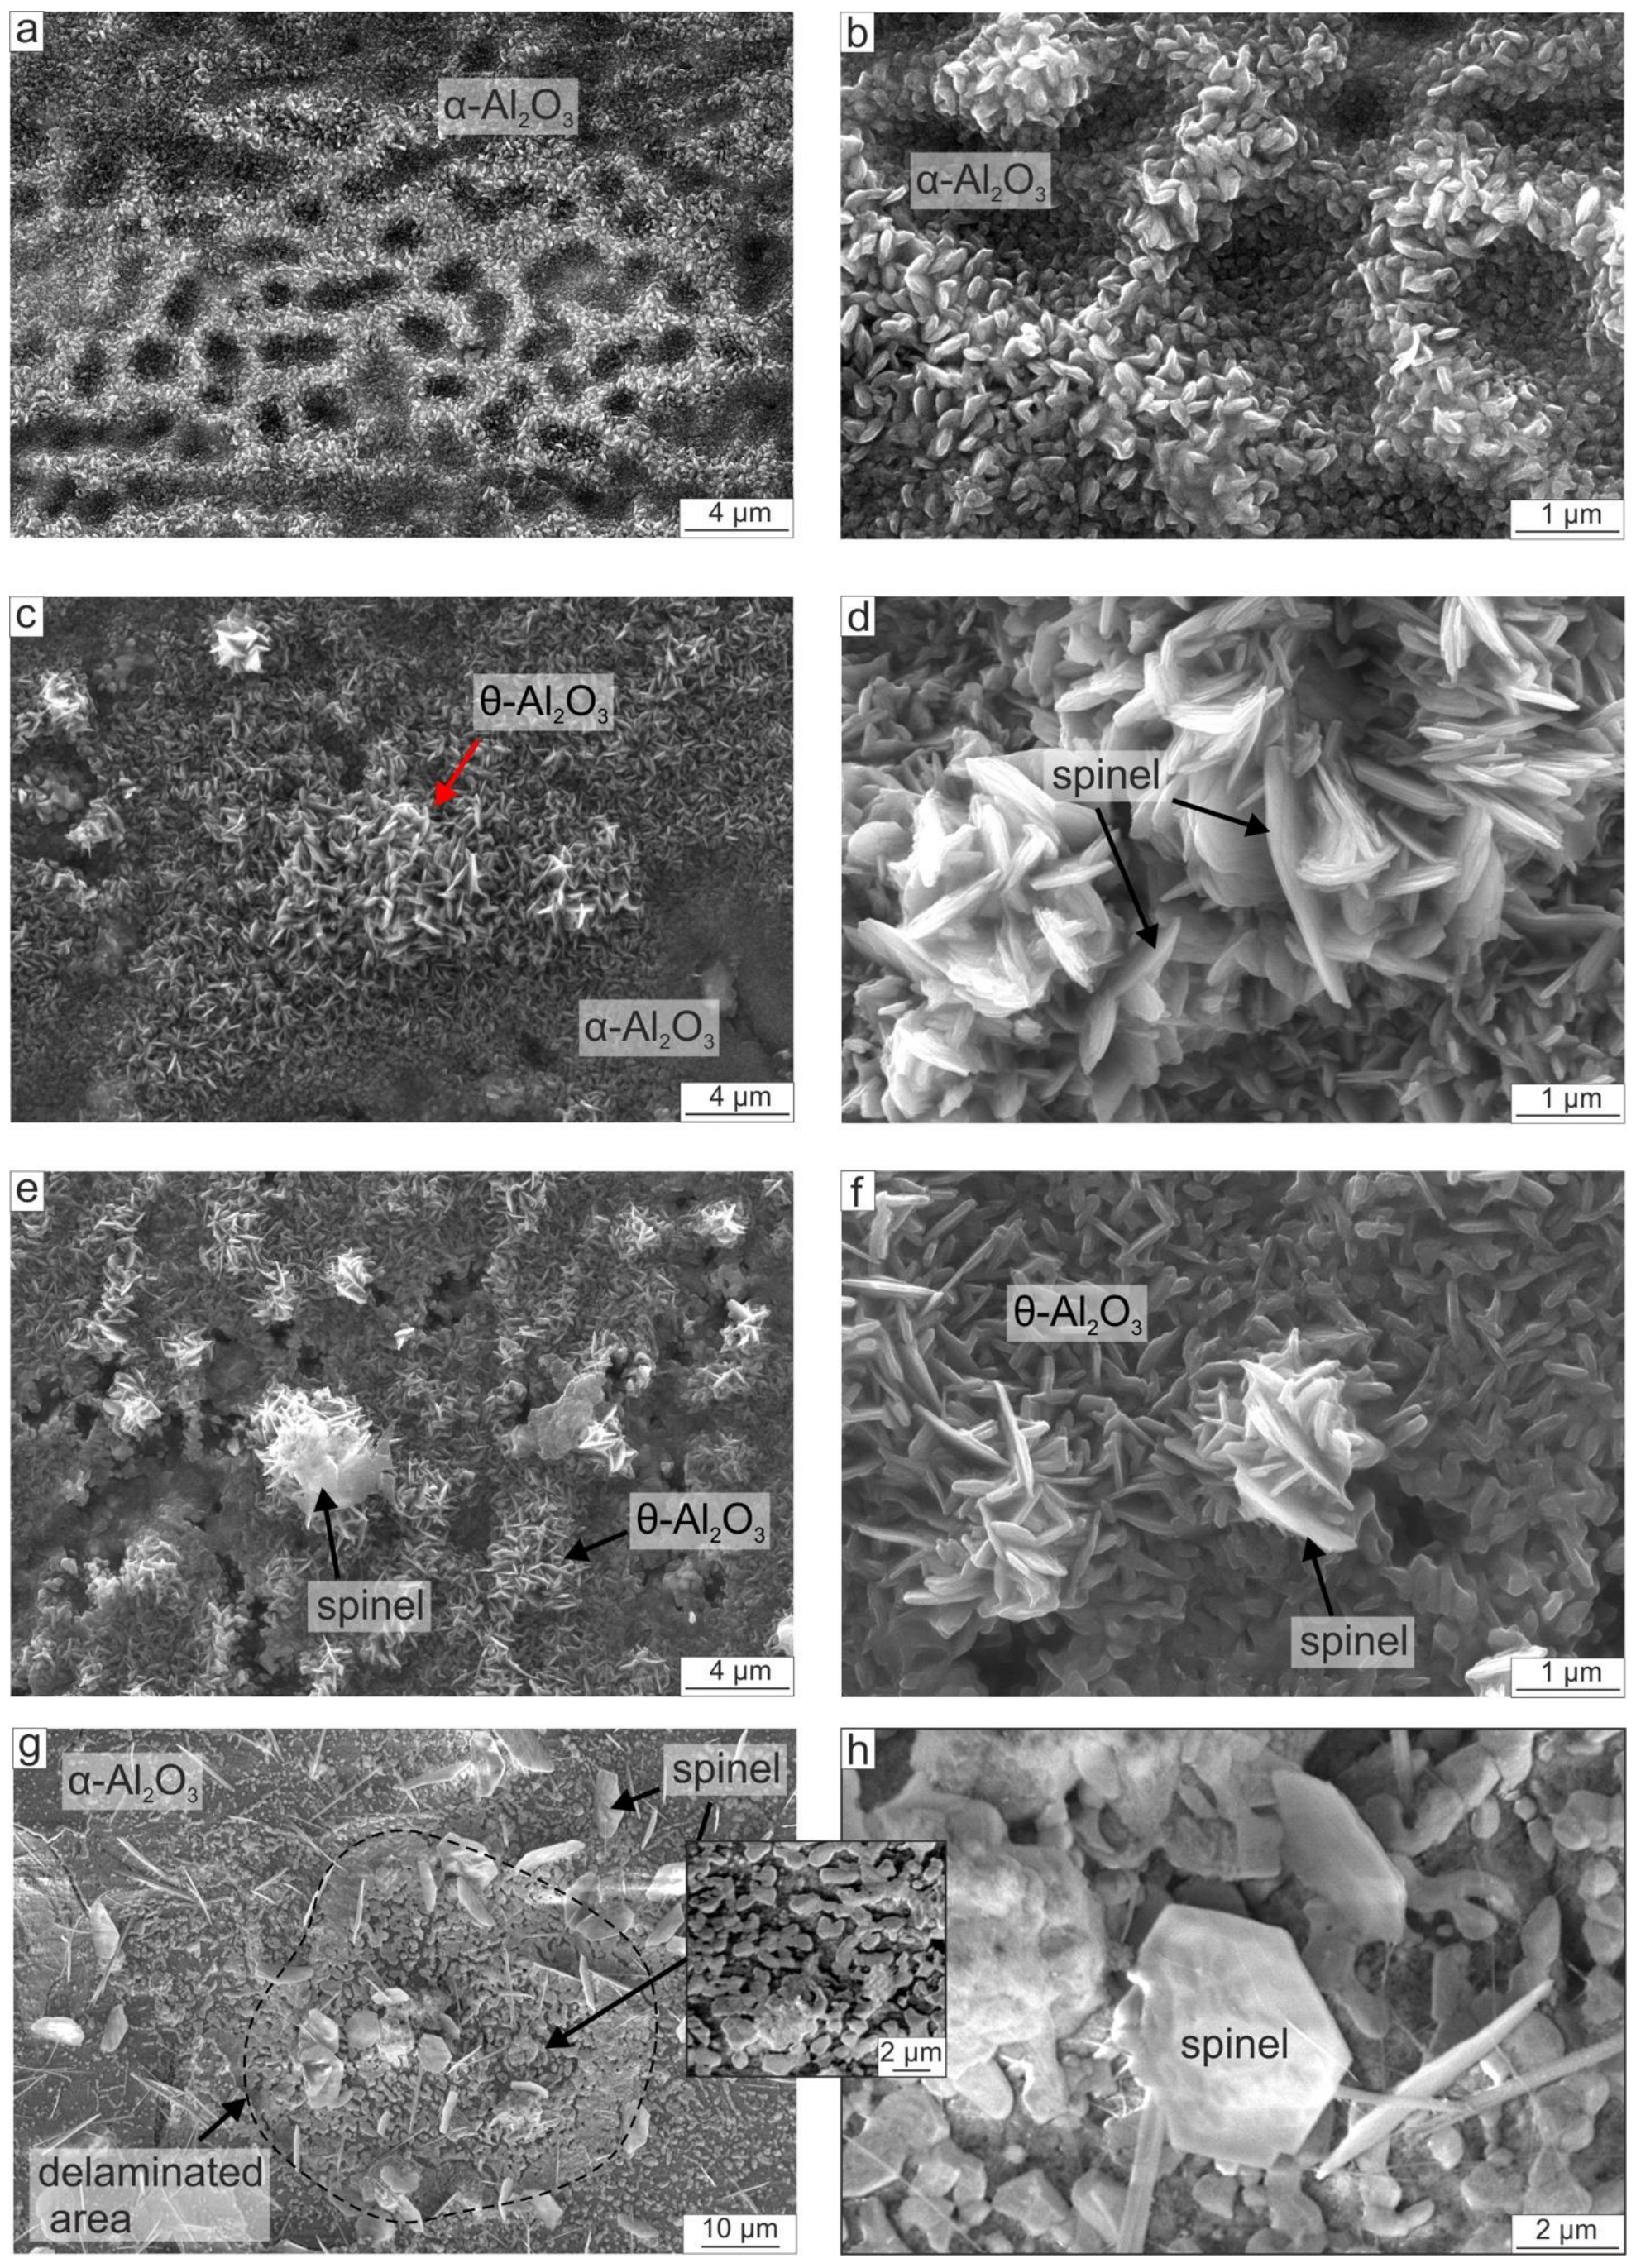
3.2.3. Top Surface Morphology of the Oxide Films

The top surface morphology of the oxide films after oxidation at 800, 900, and 1000 °C is presented in Figure 13. The structure of the oxide film is characterized by α-Al2O3 nanograins with a size of less than 200 nm (Figure 13a,b). After 800 °C, the oxide film has a relief of ridges and troughs about 2 µm wide. The formation of ridges and troughs is typical for the initial stages of oxidation in NiAl; the mechanism of formation of such morphology is described in detail in [47,48,49]. At 800 °C, the oxide film grows rather slowly, which is not enough for a complete flattening of the relief even after 100 h of oxidation.
At 900 °C (Figure 13c) and 1000 °C (Figure 13e), the oxide films grew faster, and the top surface of the oxide film had enough time to flatten. Aside from nanosized grains, a lot of lamellar inclusions of one-to-several micrometers in size were found on the oxide surface (Figure 13c–f). As a rule, grains with a lamellar, needle-shaped morphology belong to the θ-Al2O3 phase [23]. However, XRD analysis indicates that the predominant phase in the oxide scale is α-Al2O3; the reflections of θ-Al2O3 are quite weak. This is explained by the fact that θ-Al2O3 is metastable and only located on the top surface of the oxide layer, but under the surface, the θ-Al2O3 transforms into α-Al2O3 [31,47,50].
Spinel grains precipitated in the form of hexagonal thin plates approximately 5 μm in diameter (Figure 13g,h). Note that the oxide scales formed at 900 °C and 1000 °C were partly exfoliated, revealing deeper areas with ridges and cavities, which were located under the top layers (Figure 13g). On the exposed areas, further growth of the oxide phases occurred. The same morphology of the oxide films in the same temperature range was observed in [23,28,30,32,34,38,45,50,51,52,53]. Its formation was explained by the growth of the outward and inward ridges during the first stage of oxidation, which is associated with the counter-diffusion of aluminum and oxygen.

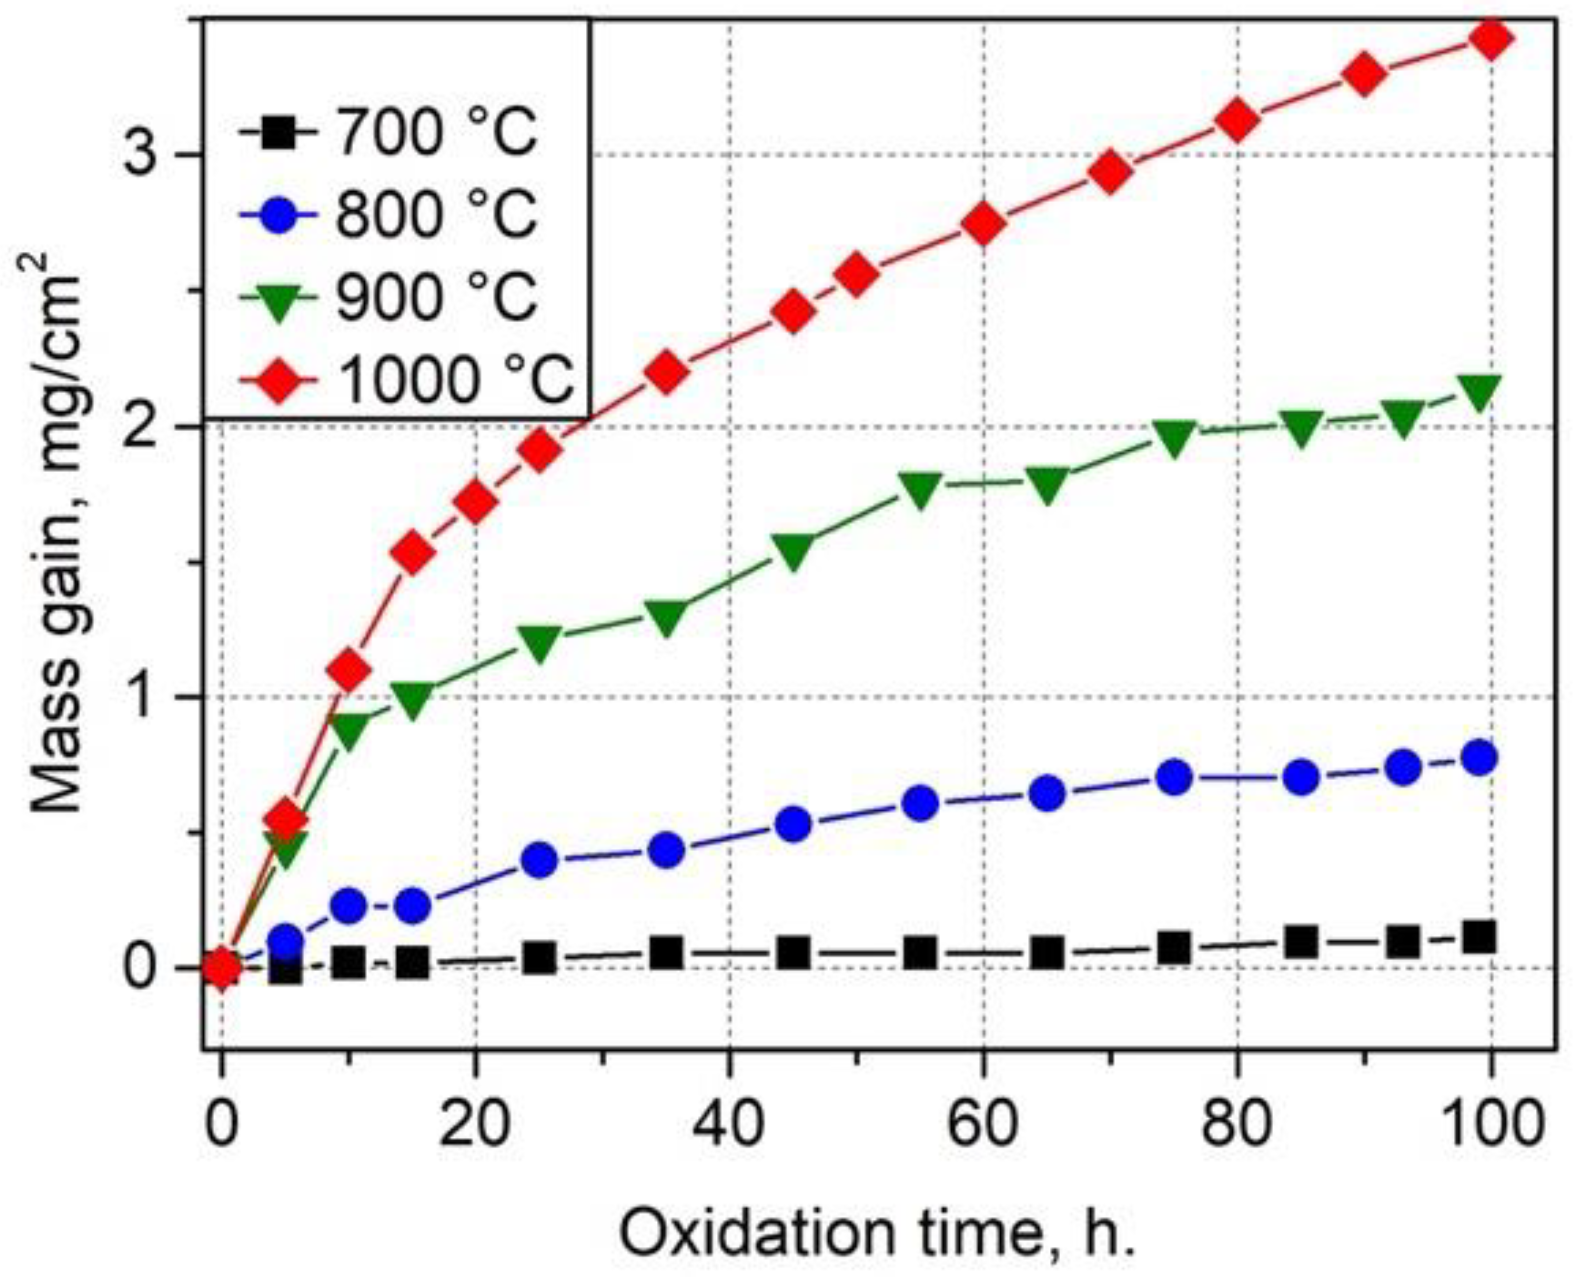
3.2.4. The Oxidation Rate of the NiAl-Based Coatings

The mass gain plots of the specimens during oxidation tests are shown in Figure 14. Since NiAl contained 14 at. % Fe, the mass gain, as expected, exceeded the mass gain values of pure NiAl under similar conditions of oxidation. In this study, isothermal oxidation was performed at a temperature ranging from 700 to 1000 °C for 100 h. In papers devoted to the oxidation of pure NiAl and Fe-alloyed NiAl, experiments with the same time–temperature conditions were not found. Nevertheless, it is possible to compare the obtained data with some of the results of other researchers (Table 6). According to the given data, the weight gain of pure NiAl after 100 h of oxidation varies in a range from 0.27 to 0.8 mg/cm2 depending on the oxidation temperature and conditions of sample preparation [38,42,45,46,53,54]. Alloying NiAl with Fe led to an increase in the mass gain from 0.2 to 0.3 mg/cm2 after 48 h of oxidation at 1000 °C [46]. In the current study, the Fe content was several times higher than in [46]; therefore, the mass gain was several times greater (up to 2.3 mg/cm2) at the same oxidation time and temperature. In [40], the mass gain of samples oxidized at 600 °C for 100 h was 0.2 mg/cm2; the oxidation rate grew with the increase in the volume fraction of FeAl and reached 1 mg/cm2 for pure FeAl in the same oxidation conditions. In the current study, even at 700 °C, the mass gain did not exceed 0.2 mg/cm2 due to lower Fe content. Thus, our experimental data are in good agreement with the set of data obtained in previous studies.

4. Conclusions

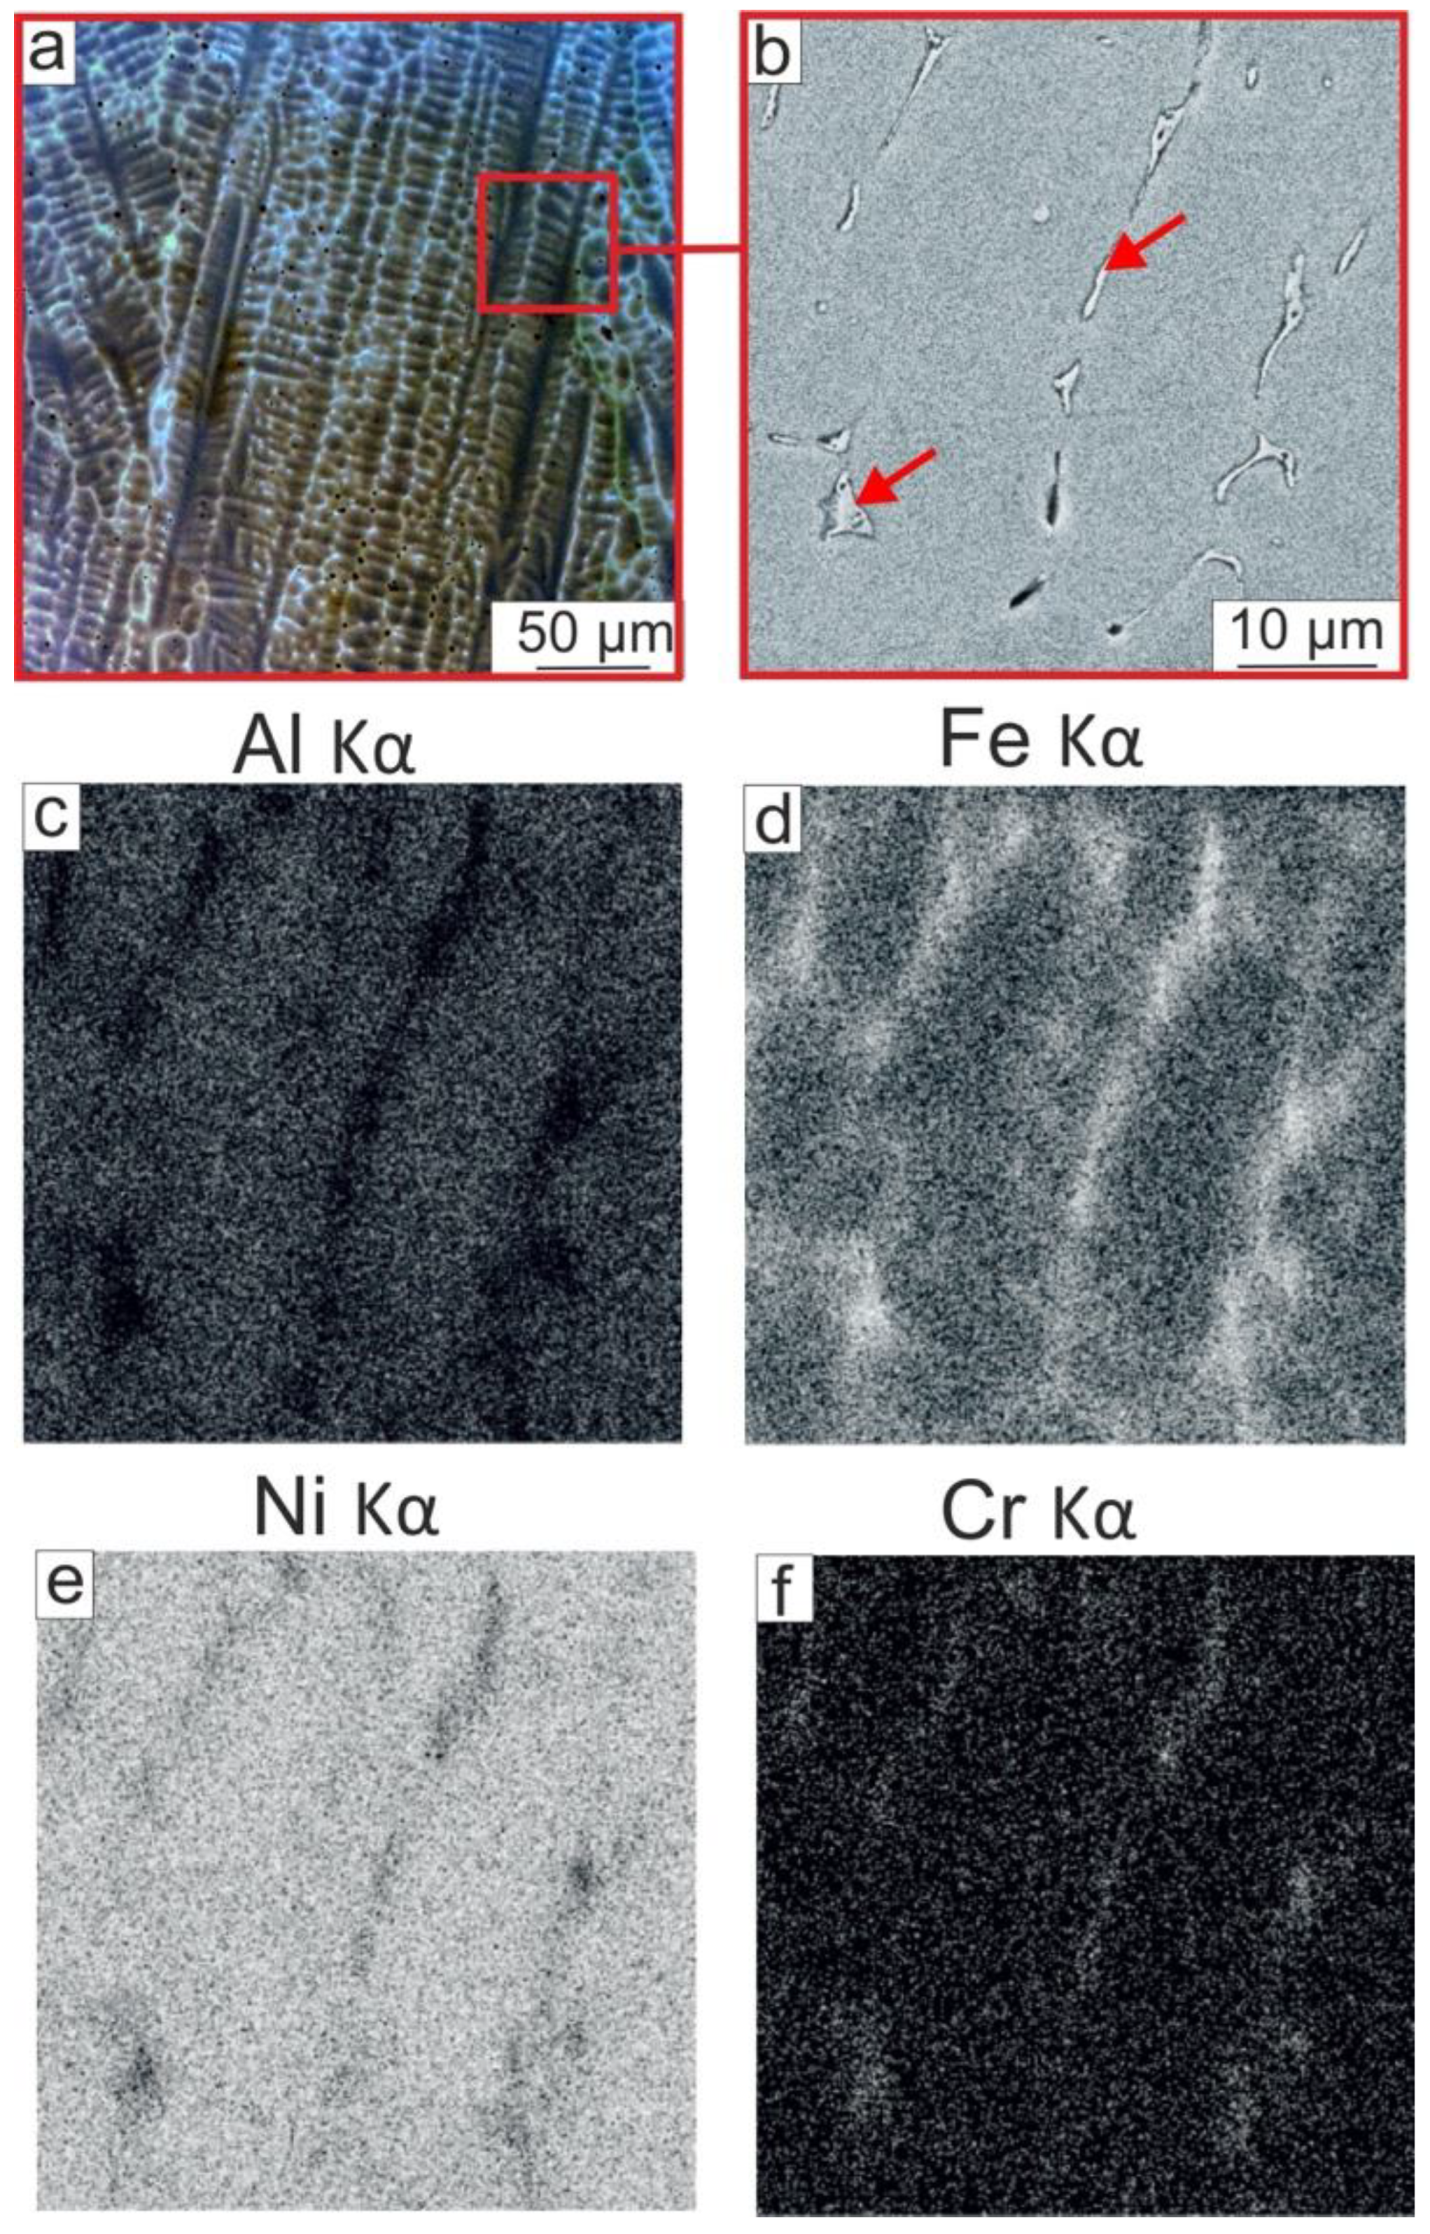
  • NiAl-based coatings of 1.5 mm thickness were produced by non-vacuum electron beam cladding NiAl powder on low-carbon steel substrates. The coating had a dendritic structure with elongated grains with a <100> crystallographic direction oriented along the growth direction and perpendicular to the surface of the substrate. The partial melting of the steel substrate and its mixing with the coating led to the dissolution of about 14 at. % Fe in NiAl. In addition to Fe, a minor amount of Cr, Mn, and Si passed out of the substrate to the coating. In the main part of the coating, Fe was predominantly concentrated in the interdendritic space due to the lower crystallization temperature of Fe-containing NiAl compounds. During the annealing of the coating at 900 °C for 100 h, Fe-enriched areas dissolved in NiAl, and the homogenization of the NiAl-based coating occurred.
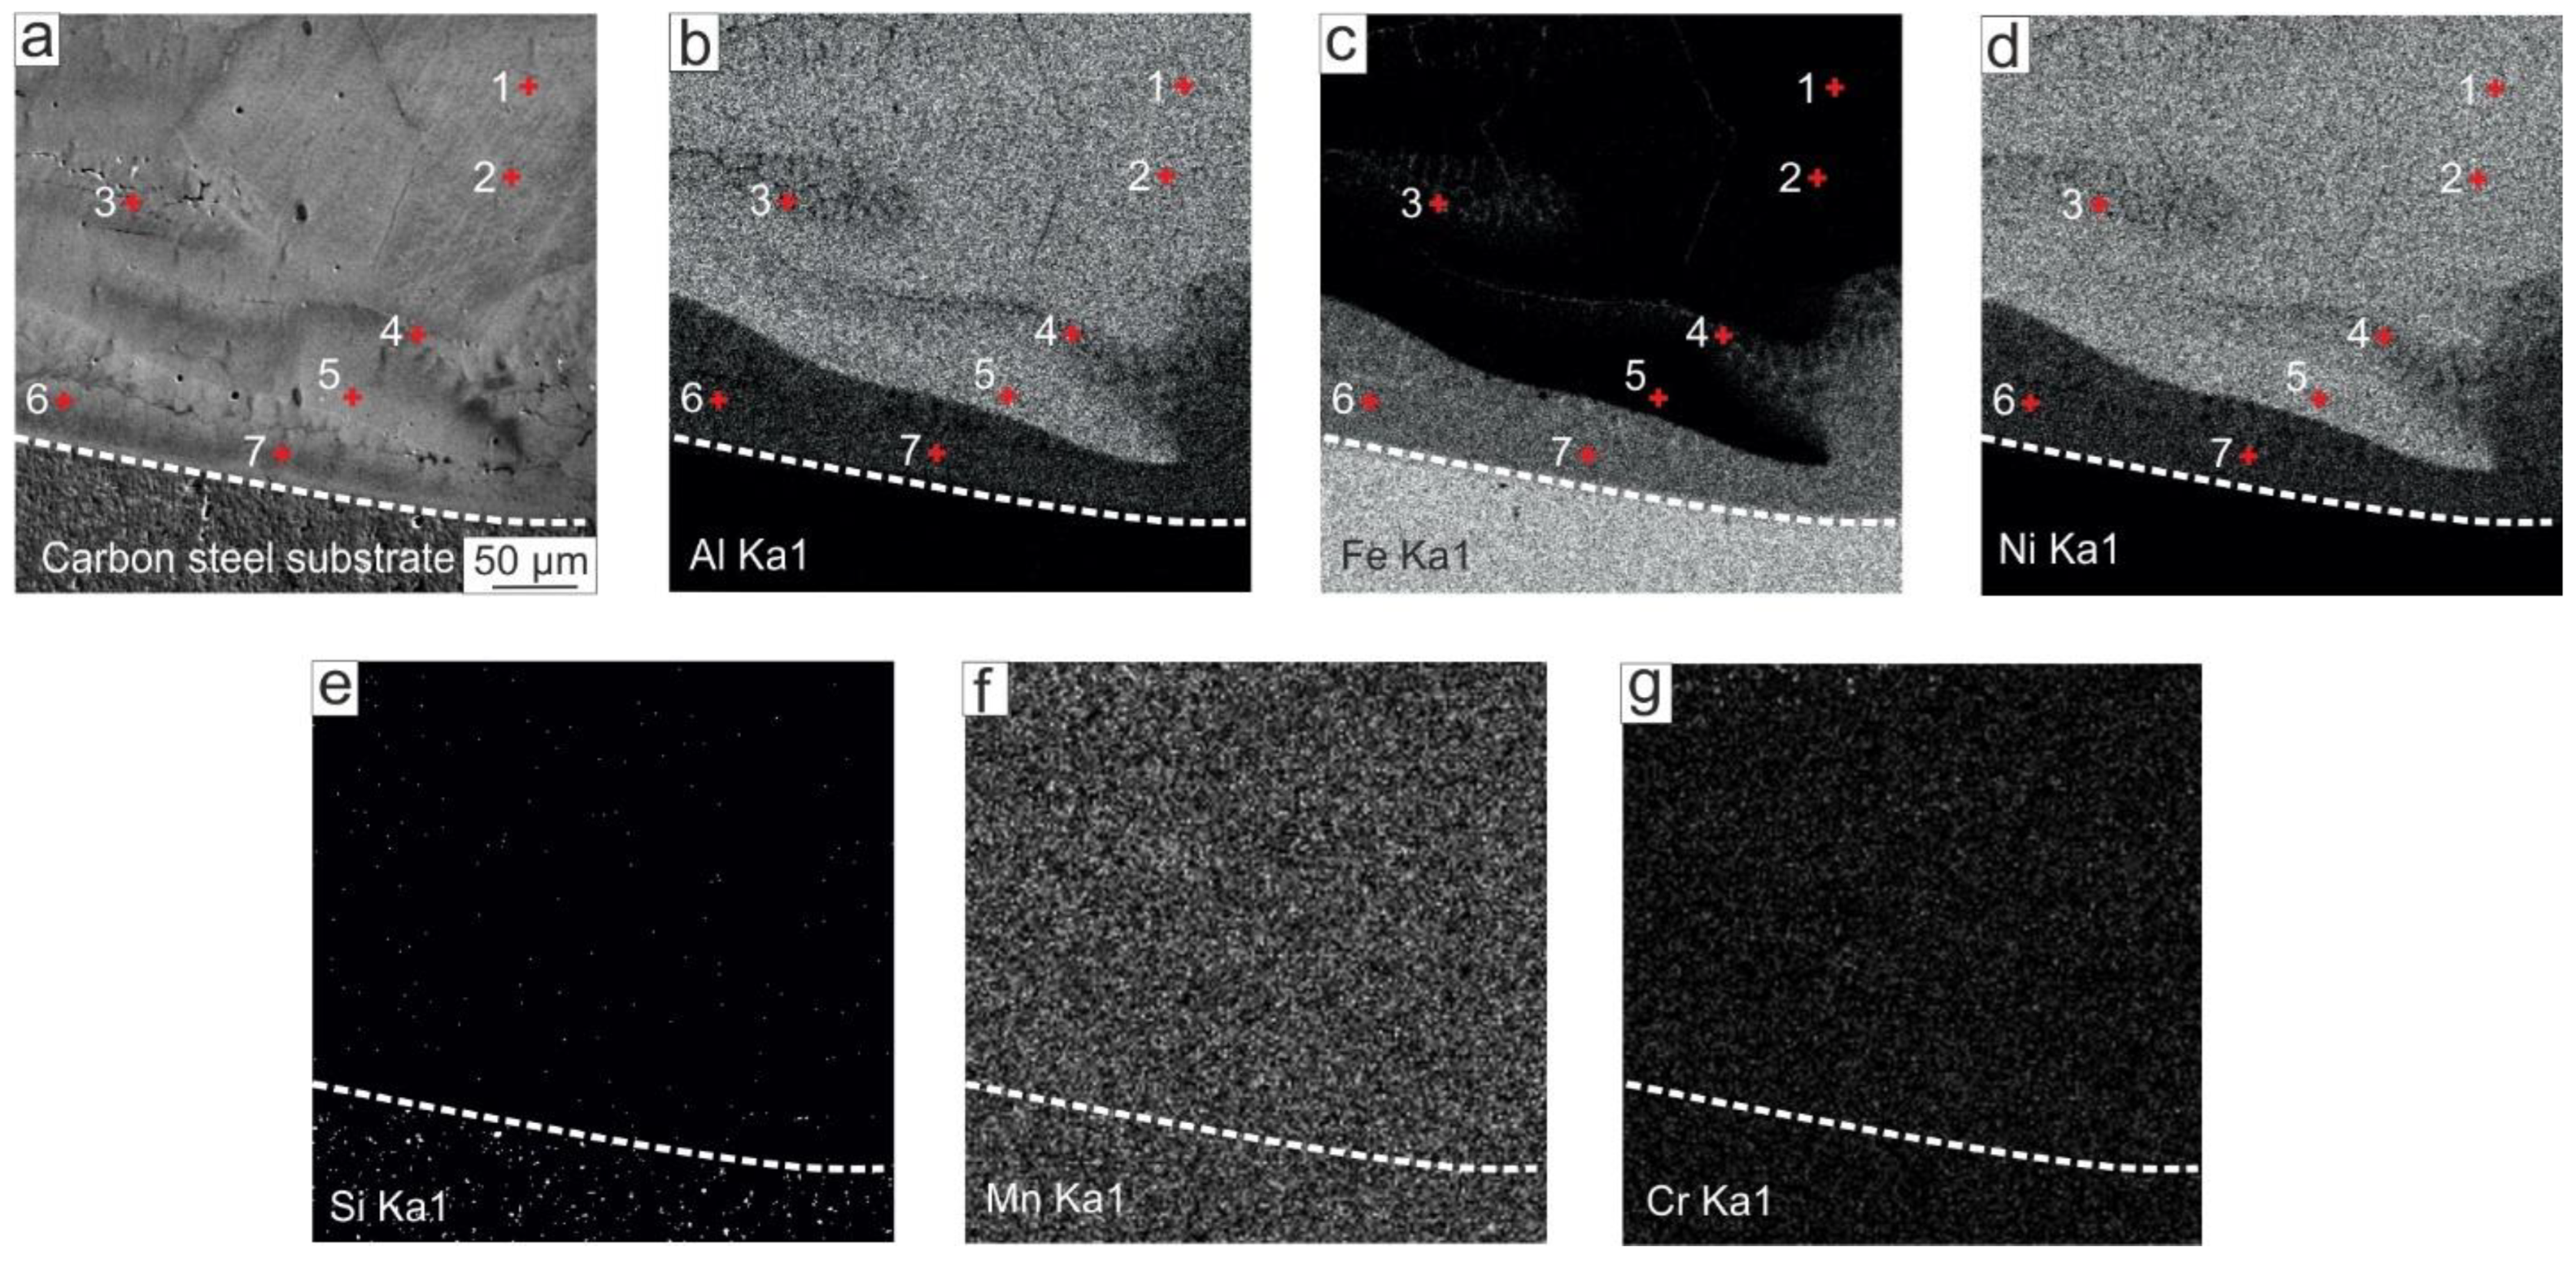
  • Closer to the bottom part of the coating, the Fe content gradually increased; the average Fe content in the area within the distance 350 μm to the substrate was ~27 at. %. Along the “coating–substrate” interface, the layer of Fe50-Al25-Ni25 at. % a 50–100 μm thickness was formed, separated from the rest of the coating by a clearly distinguished boundary. The average microhardness in the area with increased Fe content was 500 HV, which was 50 HV higher than in the main part of the coating.
  • The mass gains of the coatings after 100 h of oxidation at 700, 800, 900, and 1000 °C were 0.1, 0.8, 2.14, and 3.4 mg/cm2, respectively. Due to the presence of Fe, the oxidation rate of the obtained Fe-alloyed NiAl was several times higher compared with the pure NiAl oxidation rate observed by other researchers. Oxide scales predominantly consisted of α-Al2O3 nanograins and a certain amount of θ-Al2O3; the presence of Fe also contributed to the formation of a small amount of spinel.
  • The porosity typical of oxidized pure NiAl was not observed at the “oxide scale–Fe-alloyed NiAl” interface due to the presence of Fe. It was found that, after oxidation at 1000 °C, a layer consisting of 60 at. % Fe, 20 at. % Ni, and 7 at. % Al formed in the coating on the side adjacent to the oxide scale. Its formation is explained by a stronger chemical bond between Fe and Al atoms compared with Ni and Al ones. Thus, the outward diffusion of Fe atoms at the “oxide scale–Fe-alloyed NiAl” interface occurred less intensively than that of the Ni atoms. This discovered feature confirms the suggestion of other researchers that the addition of Fe to NiAl reduces Kirkendall drift during oxidation, and the tendency to form Kirkendall voids in the “oxide scale—NiAl” interface decreases. Thus, the presence of Fe in NiAl is a positive factor in terms of improving the spallation resistance of the oxide scales.

Author Contributions

Conceptualization, T.S.O.; methodology, A.A.R., M.G.G. and K.D.E.; investigation, A.A.R., D.V.L., Y.N.M., K.I.E., I.A.B. and T.S.O.; writing—original draft preparation, T.S.O. and I.A.B.; writing—review and editing, A.A.R., D.V.L. and I.A.B.; supervision, T.S.O.; project administration, T.S.O.; funding acquisition, T.S.O. All authors have read and agreed to the published version of the manuscript.

Funding

This research was supported by a grant from the Russian Science Foundation, No. 22-23-20192, https://rscf.ru/project/22-23-20192/, and grant No. p-31 from the Government of the Novosibirsk Region.

Institutional Review Board Statement

Not applicable.

Informed Consent Statement

Not applicable.

Data Availability Statement

The data that support the findings of this study are available from the corresponding author upon reasonable request.

Acknowledgments

Research was conducted at the core “Structure, mechanical and physical properties of materials” facility of Novosibirsk State Technical University (agreement with the Ministry of Science and Higher Education of the Russian Federation, No. 13.CKP.21.0034, 075-15-2021-698).

Conflicts of Interest

The authors declare no conflict of interest.

References

  1. Simões, S.; Viana, F.; Ramos, A.S.; Vieira, M.T.; Vieira, M.F. Anisothermal Solid-State Reactions of Ni/Al Nanometric Multilayers. Intermetallics 2011, 19, 350–356. [Google Scholar] [CrossRef]
  2. Miracle, D.B. Overview No. 104 The Physical and Mechanical Properties of NiAl. Acta Metall. Mater. 1993, 41, 649–684. [Google Scholar] [CrossRef]
  3. Mi, D.-M.; Zhu, S.-L.; Liang, Y.-Q.; Li, Z.-Y.; Cui, Z.-D.; Yang, X.-J.; Inoue, A. Zr55Al10Ni5Cu30 Amorphous Alloy Film Prepared by Magnetron Sputtering Method. Rare Met. 2021, 40, 2237–2243. [Google Scholar] [CrossRef]
  4. Lee, J.; Hui, K.N.; Hui, K.S.; Cho, Y.R.; Chun, H.-H. Low Resistivity of Ni-Al Co-Doped ZnO Thin Films Deposited by DC Magnetron Sputtering at Low Sputtering Power. Appl. Surf. Sci. 2014, 293, 55–61. [Google Scholar] [CrossRef]
  5. Edelstein, A.S.; Everett, R.K.; Richardson, G.Y.; Qadri, S.B.; Altman, E.I.; Foley, J.C.; Perepezko, J.H. Intermetallic Phase Formation during Annealing of Al/Ni Multilayers. J. Appl. Phys. 1994, 76, 7850–7859. [Google Scholar] [CrossRef] [Green Version]
  6. Zhong, D.; Moore, J.J.; Sutter, E.; Mishra, B. Microstructure, Composition and Oxidation Resistance of Nanostructured NiAl and Ni–Al–N Coatings Produced by Magnetron Sputtering. Surf. Coat. Technol. 2005, 200, 1236–1241. [Google Scholar] [CrossRef]
  7. Brunetti, C.; Belotti, L.P.P.; Miyoshi, M.H.H.; Pintaúde, G.; D’Oliveira, A.S.C.M.S.C.M. Influence of Fe on the Room and High-Temperature Sliding Wear of NiAl Coatings. Surf. Coat. Technol. 2014, 258, 160–167. [Google Scholar] [CrossRef] [Green Version]
  8. Javadi, M.M.; Edris, H.; Salehi, M. Plasma Sprayed NiAl Intermetallic Coating Produced with Mechanically Alloyed Powder. J. Mater. Sci. Technol. 2011, 27, 816–820. [Google Scholar] [CrossRef]
  9. Poliarus, O.; Morgiel, J.; Umanskyi, O.; Pomorska, M.; Bobrowski, P.; Szczerba, M.J.; Kostenko, O. Microstructure and Wear of Thermal Sprayed Composite NiAl-Based Coatings. Arch. Civ. Mech. Eng. 2019, 19, 1095–1103. [Google Scholar] [CrossRef]
  10. Dudina, D.V.; Batraev, I.S.; Ulianitsky, V.Y.; Bulina, N.V.; Korchagin, M.A.; Lomovsky, O.I. Detonation Spraying of Ti–Al Intermetallics: Phase and Microstructure Development of the Coatings. Mater. Manuf. Proc. 2015, 30, 724–729. [Google Scholar] [CrossRef]
  11. Senderowski, C.; Bojar, Z.; Wołczyński, W.; Pawłowski, A. Microstructure Characterization of D-Gun Sprayed Fe–Al Intermetallic Coatings. Intermetallics 2010, 18, 1405–1409. [Google Scholar] [CrossRef]
  12. Dudina, D.V.; Korchagin, M.A.; Zlobin, S.B.; Ulianitsky, V.Y.; Lomovsky, O.I.; Bulina, N.V.; Bataev, I.A.; Bataev, V.A. Compositional Variations in the Coatings Formed by Detonation Spraying of Ti3Al at Different O2/C2H2 Ratios. Intermetallics 2012, 29, 140–146. [Google Scholar] [CrossRef]
  13. Ulianitsky, V.Y.; Dudina, D.V.; Shtertser, A.A.; Smurov, I. Computer-Controlled Detonation Spraying: Flexible Control of the Coating Chemistry and Microstructure. Metals 2019, 9, 1244. [Google Scholar] [CrossRef] [Green Version]
  14. Xu, L.; Jia, Y.D.; Zhang, L.B.; Wang, G. Fabrication of NiAl Intermetallic Alloy Integrated Materials Chips with Continuous One-Dimensional Composition Gradients by Plasma Spray Deposition and Laser Remelting. Mater. Lett. 2021, 284, 128944. [Google Scholar] [CrossRef]
  15. Jia, Q.; Li, D.; Li, S.; Zhang, Z.; Zhang, N. High-Temperature Oxidation Resistance of NiAl Intermetallic Formed in Situ by Thermal Spraying. Coatings 2018, 8, 292. [Google Scholar] [CrossRef] [Green Version]
  16. Guan, H.; Chai, L.; Wang, Y.; Xiang, K.; Wu, L.; Pan, H.; Yang, M.; Teng, C.; Zhang, W. Microstructure and Hardness of NbTiZr and NbTaTiZr Refractory Medium-Entropy Alloy Coatings on Zr Alloy by Laser Cladding. Appl. Surf. Sci. 2021, 549, 149338. [Google Scholar] [CrossRef]
  17. Xiang, K.; Chai, L.; Zhang, C.; Guan, H.; Wang, Y.; Ma, Y.; Sun, Q.; Li, Y. Investigation of Microstructure and Wear Resistance of Laser-Clad CoCrNiTi and CrFeNiTi Medium-Entropy Alloy Coatings on Ti Sheet. Opt. Laser Technol. 2022, 145, 107518. [Google Scholar] [CrossRef]
  18. Dolique, V.; Thomann, A.L.; Brault, P.; Tessier, Y.; Gillon, P. Thermal Stability of AlCoCrCuFeNi High Entropy Alloy Thin Films Studied by In-Situ XRD Analysis. Surf. Coat. Technol. 2010, 204, 1989–1992. [Google Scholar] [CrossRef] [Green Version]
  19. Lazurenko, D.V.; Alferova, G.I.; Golkovsky, M.G.; Emurlaev, K.I.; Emurlaeva, Y.Y.; Bataev, I.A.; Ogneva, T.S.; Ruktuev, A.A.; Stepanova, N.V.; Bataev, A.A. Formation of Wear-Resistant Copper-Bearing Layers on the Surfaces of Steel Substrates by Non-Vacuum Electron Beam Acladding Using Powder Mixtures. Surf. Coat. Technol. 2020, 395, 125927. [Google Scholar] [CrossRef]
  20. Santana, D.A.; Koga, G.Y.; Wolf, W.; Bataev, I.A.; Ruktuev, A.A.; Bolfarini, C.; Kiminami, C.S.; Botta, W.J.; Jorge, A.M. Wear-Resistant Boride Reinforced Steel Coatings Produced by Non-Vacuum Electron Beam Cladding. Surf. Coat. Technol. 2020, 386, 125466. [Google Scholar] [CrossRef]
  21. Lazurenko, D.V.; Bataev, I.A.; Laptev, I.S.; Ruktuev, A.A.; Maliutina, I.N.; Golkovsky, M.G.; Bataev, A.A. Formation of Ti-Al Intermetallics on a Surface of Titanium by Non-Vacuum Electron Beam Treatment. Mater. Charact. 2017, 134, 202–212. [Google Scholar] [CrossRef]
  22. Yuan, J.; Wang, Q.; Liu, X.; Lou, S.; Li, Q.; Wang, Z. Microstructures and High-Temperature Wear Behavior of NiAl/WC-Fex Coatings on Carbon Steel by Plasma Cladding. J. Alloys Compd. 2020, 842, 155850. [Google Scholar] [CrossRef]
  23. Chen, W.; Shan, X.; Li, J.; Guo, Y.; Guo, F.; Zhao, X.; Ni, N.; Xiao, P. Effects of Iron and Platinum on the Isothermal Oxidation of β-NiAl Overlay Coatings Fabricated by Spark Plasma Sintering. Surf. Coat. Technol. 2020, 382, 125178. [Google Scholar] [CrossRef]
  24. Ruktuev, A.A.; Golkovski, M.G.; Lazurenko, D.V.; Bataev, V.A.; Ivanov, I.V.; Thömmes, A.; Bataev, I.A. TiTaNb Clads Produced by Electron Beam Surface Alloying in Regular Air at Atmospheric Pressure: Fabrication, Structure, and Properties. Mater. Charact. 2021, 179, 111375. [Google Scholar] [CrossRef]
  25. Golkovsky, M. Hardening and Surfacing with a Beam of Relativistic Electrons; LAP LAMBERT Academic Publishing: Sunnyvale, CA, USA, 2013. (In Russian) [Google Scholar]
  26. Hao, S.M.; Takayama, T.; Ishida, K.; Nishizawa, T. Miscibility Gap in Fe-Ni-Al and Fe-Ni-Al-Co Systems. Metall. Trans. A 1984, 15, 1819–1828. [Google Scholar] [CrossRef]
  27. Grabke, H.J. Oxidation of NiAl and FeAl. Intermetallics 1999, 7, 1153–1158. [Google Scholar] [CrossRef]
  28. Kaplin, C.; Ivanov, R.; Paliwal, M.; Jung, I.H.; Brochu, M. The Effect of Nanostructure on the Oxidation of NiAl. Intermetallics 2014, 54, 209–217. [Google Scholar] [CrossRef]
  29. Brumm, M.W.; Grabke, H.J.; Wagemann, B. The Oxidation of NiAl-III. Internal and Intergranular Oxidation. Corros. Sci. 1994, 36, 37–53. [Google Scholar] [CrossRef]
  30. Doychak, J.; Smialek, J.L.; Mitchell, T.E. Transient Oxidation of Single-Crystal β-NiAl. Metall. Trans. A 1989, 20, 499–518. [Google Scholar] [CrossRef]
  31. Yang, J.C.; Schumann, E.; Levin, I.; Rühle, M. Transient Oxidation of NiAl. Acta Mater. 1998, 46, 2195–2201. [Google Scholar] [CrossRef]
  32. Smialek, J.L. Oxide Morphology and Spalling Model for NiAl. Metall Trans. A 1978, 9A, 309–320. [Google Scholar] [CrossRef]
  33. Grabke, H.J.; Brumm, M.W.; Wagemann, B. The Oxidation of NiAl. Mater. Corros. 1996, 677, 675–677. [Google Scholar] [CrossRef]
  34. Pint, B.A. The Oxidation Behavior of Oxide-Dispersed β-NiAl: I. Short-Term Performance at 1200 °C. Oxid. Met. 1998, 49, 531–559. [Google Scholar] [CrossRef]
  35. Zhang, Z.; Gleeson, B.; Jung, K.; Li, L.; Yang, J.C. A Diffusion Analysis of Transient Subsurface Γ′-Ni3Al Formation during β-NiAl Oxidation. Acta Mater. 2012, 60, 5273–5283. [Google Scholar] [CrossRef]
  36. Brumm, M.W.; Grabke, H.J. Oxidation Behaviour of NiAl—II. Cavity Formation beneath the Oxide Scale on NiAl of Different Stoichiometries. Corros. Sci. 1993, 34, 547–561. [Google Scholar] [CrossRef]
  37. Brumm, M.W.; Grabke, H.J. The Oxidation Behaviour of NiAl-I. Phase Transformations in the Alumina Scale during Oxidation of NiAl and NiAl-Cr Alloys. Corros. Sci. 1992, 33, 1677–1690. [Google Scholar] [CrossRef]
  38. Yang, S.; Wang, F.; Jeong, S.; Lee, D.; Yang, S.; Wang, F. Effect of Microcrystallization on the Oxidation Behavior of β-NiAl at 1000 °C in Air. Jinshu Xuebao/Acta Metall. Sin. 2000, 36, 511–516. [Google Scholar]
  39. Gleeson, B.; Wang, W.; Hayashi, S.; Sordelet, D.J. Effects of Platinum on the Interdiffusion and Oxidation Behavior of Ni-Al-Based Alloys. Mater. Sci. Forum 2004, 461–464, 213–222. [Google Scholar] [CrossRef]
  40. Bai, Y.; Zhou, J.; Li, J.; Yang, Z. B2-Ordered NiAl Content on Microstructure, Mechanical and Oxidation Properties of FeAl Intermetallic Compounds. J. Mater. Res. Technol. 2022, 16, 1875–1888. [Google Scholar] [CrossRef]
  41. Ford, S.; Kartono, R.; Young, D.J. Oxidation Resistance of Pt-Modified γ/Γ′ Ni-Al at 1150 °C. Surf. Coat. Technol. 2010, 204, 2051–2054. [Google Scholar] [CrossRef]
  42. Svensson, H.; Christensen, M.; Knutsson, P.; Wahnström, G.; Stiller, K. Influence of Pt on the Metal–Oxide Interface during High Temperature Oxidation of NiAl Bulk Materials. Corros. Sci. 2009, 51, 539–546. [Google Scholar] [CrossRef]
  43. Pint, B.A. Experimental Observations in Support of the Dynamic-Segregation Theory to Explain the Reactive-Element Effect. Oxid. Met. 1996, 45, 1–37. [Google Scholar] [CrossRef]
  44. Grabke, H.J.; Wiemer, D.; Viefhaus, H. Segregation of Sulfur during Growth of Oxide Scales. Appl. Surf. Sci. 1991, 47, 243–250. [Google Scholar] [CrossRef]
  45. Brumm, M.W.; Grabke, H.J. ChemInform Abstract: Oxidation Behavior of NiAl. Part 2. Cavity Formation Beneath the Oxide Scale on NiAl of Different Stoichiometries. ChemInform 2010, 24, 541–547. [Google Scholar] [CrossRef]
  46. Jeong, S.; Lee, D. Effect of Fe on the High Temperature Oxidation of NiAl Alloys. Met. Mater. Int. 2005, 11, 313–317. [Google Scholar] [CrossRef]
  47. Schumann, E. The Effect of Y-Ion Implantation on the Oxidation of β-NiAl. Oxid. Met. 1995, 43, 157–172. [Google Scholar] [CrossRef]
  48. Smeltzer, W.W. Growth and Microstructure of A-ALOa on B -NiAI. Solid State Sci. Technol. 1980, 127, 5–10. [Google Scholar]
  49. Tolpygo, V.K.; Clarke, D.R. Microstructural Evidence for Counter-Diffusion of Aluminum and Oxygen during the Growth of Alumina Scales. Mater. High Temp. 2003, 20, 261–271. [Google Scholar] [CrossRef]
  50. Pint, B.A.; Treska, M.; Hobbs, L.W. The Effect of Various Oxide Dispersions on the Phase Composition and Morphology of Al2O3 Scales Grown on β-NiAl. Oxid. Met. 1997, 47, 1–20. [Google Scholar] [CrossRef]
  51. Schumann, E.; Sarioglu, C.; Blachere, J.R.; Pettit, F.S.; Meier, G.H. High-Temperature Stress Measurements during the Oxidation of NiAl. Oxid. Met. 2000, 53, 259–272. [Google Scholar] [CrossRef]
  52. Pint, B.A.; More, K.L.; Wright, I.G. Effect of Quaternary Additions on the Oxidation Behavior of Hf-Doped NiAl. Oxid. Met. 2003, 59, 257–283. [Google Scholar] [CrossRef]
  53. Li, D.; Guo, H.; Wang, D.; Zhang, T.; Gong, S.; Xu, H. Cyclic Oxidation of β-NiAl with Various Reactive Element Dopants at 1200 °C. Corros. Sci. 2013, 66, 125–135. [Google Scholar] [CrossRef]
  54. Chen, W.; Shan, X.; Guo, Y.; Li, J.; Zou, Z.; Guo, F.; Zhao, X.; Xiao, P. The Effect of Reactive Element Species and Concentrations on the Isothermal Oxidation of β-NiAl Coating Fabricated by Spark Plasma Sintering. Surf. Coat. Technol. 2019, 357, 841–848. [Google Scholar] [CrossRef]
Figure 1. SEM of NiAl powder used as a cladding material.
Metals 12 01679 g001
Figure 2. Scheme of ion beam cutting of oxide scale on an oxidized NiAl-based specimen.
Metals 12 01679 g002
Figure 3. (a) Cross-section of NiAl-based coating obtained by non-vacuum electron beam cladding; (be) structures of HAZ; (f) initial structure of the low-carbon steel substrate; (g) the concentration of elements in the coating along the dotted line in Figure (a) were measured by EDX.
Metals 12 01679 g003
Figure 4. XRD pattern of NiAl-based coating obtained by non-vacuum electron beam cladding.
Metals 12 01679 g004
Figure 5. The structure of the NiAl-based coating: (a) The dendritic structure of the NiAl-based coating revealed by optical metallography; (b) SEM of the coating area marked with a red frame in (a); (cf) EDX maps for the area shown in (b).
Metals 12 01679 g005
Figure 6. EDX analysis of NiAl-based coating near the steel substrate: (a) SEM image; (bg) EDX maps showing the distribution of elements. The numbers in Figure (a) indicate the points for EDX analysis. The composition of the points is presented in Table 4.
Metals 12 01679 g006
Figure 7. (a) Optical microscopy of the “coating–substrate” interface; (bd) EDX maps of the spotted zones.
Metals 12 01679 g007
Figure 8. (a) IPF map of NiAl-based coating and pole figures of this area, illustrating the formation of a <100> texture; (b) IPF map of the specimen at the “coating–substrate” interface.
Metals 12 01679 g008
Figure 9. (a) Microhardness of NiAl-based coatings on low-carbon steel substrates in the cross-section; (b) Scheme of measurements.
Metals 12 01679 g009
Figure 10. XRD patterns of NiAl-based coatings after oxidation tests of 100 h at 800, 900, and 1000 °C.
Metals 12 01679 g010
Figure 11. EDX analysis of the oxide film of NiAl-based coating in cross-sections after oxidation for 100 h at (a) 800; (b) 900; (c) 1000 °C. SEM images (left pictures), and corresponding EDX maps.
Metals 12 01679 g011
Figure 12. (a,f) EDX analysis of the oxide film of the NiAl-based coating after oxidation for 100 h at 1000 °C (SEM image). The sample was prepared by Ar ion cutting at a 30-degree angle to the top surface; (be) EDX maps of element distribution for image in Figure (a); the composition of points indicated in Figure (f) is presented in Table 5.
Metals 12 01679 g012
Figure 13. Morphology of the oxide films formed on NiAl-based coating after oxidation for 100 h at (a,b) 800; (c,d) 900; (eh) 1000 °C.
Metals 12 01679 g013
Figure 14. The weight gain of the NiAl-based coatings during 100 h of oxidation at 700, 800, 900, and 1000 °C.
Metals 12 01679 g014
Table 1. Chemical composition of low-carbon steel substrate (at. %).
CSiMnNiSPCrCuAs
0.17–0.240.17–0.370.35–0.65up to 0.3up to 0.04up to 0.035up to 0.25up to 0.3up to 0.08
Table 2. The regimes of the non-vacuum electron beam surfacing.
Content of Powder MixtureMass of Powder Mixture per Unit Area (g/cm2)Beam
Current, (mA)
Table
Velocity, (cm/s)
Energy
Density (J/cm2)
PowderMass (g)wt. %
NiAl28700.832156.0
CaF21230
Table 3. EDX results of the areas marked in Figure 3a.
Area #Ni, at. %Al, at. %Fe, at. %Mn, at. %Cr, at. %Si, at. %
Average value for areas #1–443.541.214.10.40.30.5
Area #536.534.727.10.50.30.9
Table 4. EDX analysis at local points in Figure 6a.
# of PointNi, at. %Al, at. %Fe, at. %Mn, at. %Cr, at. %Si, at. %
148.251.50.3---
249.5500.5---
345.842.910.50.60.2-
441.537.520.00.60.30.3
547.050.31.00.70.30.7
621.820.356.30.60.30.7
725.423.649.70.50.20.6
Table 5. EDX analysis in a 30-degree cut plane of the oxide scale formed at 1000 °C (Figure 12f) (the values for the oxygen and carbon content are provided for reference).
EDX Point #Corresponding PhaseNi, at.
%
Al, at. %Fe, at. %Mn, at. %Cr, at. %Si, at. %O, at. %C, at. %
1spinel6.98.8160.70.30.762.54.1
2Al2O31.430.53.9---62.41.8
3spinel7.98.816.20.60.5-61.94.1
4Al2O30.834.12.7---60.22.2
5spinel6.09.715.90.50.6-62.84.5
7(Ni,Fe)3Al40.128.223.30.60.20.5-7.1
8Fe-rich layer21.07.759.30.51.30.9-9.3
9Fe-rich layer20.67.458.60.51.30.9-10.7
11Fe-rich layer19.846.1862.090.491.40.83-9.17
Table 6. Comparison of weight gain results with results from other studies.
Test Mode
(Cyclic/Isothermal)
Composition of the MaterialOxidation Temperature, °COxidation Time, hWeight Gain, mg/cm2Reference
IsothermalNiAl + 14 at. % Fe700
800
900
1000
500.05
0.6
1.6
2.3
This study
IsothermalNiAl + 14 at. % Fe700
800
900
1000
1000.1
0.8
2.1
3.4
This study
IsothermalNiAl1000
1200
1400
480.2
0.5
3.8
[46]
IsothermalNiAl + 3.5 at. % Fe1000
1200
1400
480.3
0.7
4.8
[46]
Cyclic (cycle 1 h)NiAl
(magnetron sputtering)
1000 0.7
0.8
[38]
IsothermalNiAl1150151.5[54]
Cyclic (cycle 1 h)NiAl1200100
300
2.8
7.5
[53]
Cyclic
(cycle 1 h)/Isothermal
NiAl
Different Ni/Al ratios
1000–1400 °C
900
1200
20
60
0.1
0.6
[45]
IsothermalFeAl 60% NiAl
FeAl 100%
6001000.2
1
[40]
IsothermalNiAl10501000.27[42]
Publisher’s Note: MDPI stays neutral with regard to jurisdictional claims in published maps and institutional affiliations.

