Abstract
The effect of dilute solute additions on growth restriction in Cu-, Al-, Mg- and Ti-based binary and ternary alloys was assessed by means of the heuristic growth restriction parameter (β) modelling framework. The CALPHAD (calculation of phase diagrams) methodology was used to calculate β values from the m and k values, at first approximation, as well as from the liquid-to-solid fraction to obtain true β values. Grain size values from the literature were plotted against the corresponding true β values, showing a negative or inverse correlation between the two.
1. Introduction
Grain refinement is necessary not only to enhance the mechanical properties of cast and wrought products [1], but also to mitigate casting or solidification defects, of which numerous studies have been reported in the literature. A few examples are orange peel-like shrinkage in oxygen-free copper wire produced by upcast [2], coarse grains extending all the way through-thickness in tube casts in the conventional Upcast® technology [3], hot-tearing in Al [4,5], Mg [6,7] and welded Ti [8] alloys and epitaxial grain growth in additive manufactured Ti-, Al-, Fe-, Ni- and Co-based alloy systems [9].
It is well-established that grain refinement requires a combination of both nucleant particles and the growth restriction effect of solutes [10]. From the point of view of grain initiation, effective grain refinement requires a sufficient number of highly dispersed, efficient particles with the required size distribution during solidification under high undercooling conditions [11,12,13,14]. From the point of view of solute growth restriction, the type of solute can affect undercooling, the nucleation potency of the liquid/nucleant interface and the grain growth restriction of a columnar front competing with equiaxed solidification [15]. A new concept for growth restriction during solidification has been proposed by Fan et al. [10]. This work has yielded several important findings, some of which will be summarised below. Reference should be made to the original publication [10]. Furthermore, a detailed review and overview of the effect of solutes on grain refinement leading to the identification of near-future challenges was recently published by Fan et al. [16].
Fan et al. [10] defined the growth restriction parameter (β) to account for its dependence on the slope of the liquidus (m), the solute concentration (CO), the equilibrium distribution coefficient (k) and a fixed undercooling during solidification (ΔT):
where the conventional Q is:
By replacing ΔT = m(CO − CL) and k = CS/CL into Equation (1), the heuristic solution was obtained for the accurate calculation of true β values for a binary system (Equation (3)), which extended to multicomponent systems by the linear addition of each binary system βi (Equation (4)), assuming no interactions between solutes [10].
Equation (1) captures the phase diagram of the alloy system. Therefore, the accuracy of the β values calculated from Equation (1) depends not only on the solute–solute interactions, but also on the resolution of the binary phase diagram and the values of m and k, which are not expected to be constant as they can vary with the alloy composition and the temperature [7,17,18]. Equation (3) indicates that the physical meaning of β is the liquid-to-solid phase fraction, as suggested in the work from which Equation (3) was derived [10].
For eutectic systems, k < 1; then, the difference between β calculated from Equation (1) and that calculated from Equation (3) is small and Equation (1) is a good estimate of the values of β. However, for peritectic systems, when k > 1, such a difference is larger and the calculation of β from the ratio of the liquid to the solid fraction (Equation (3)) is more accurate [10]. This accuracy is also dependent on the accuracy of the m and k values.
The growth restriction coefficient (2/λ2) was also derived in their work [10], which is shown in Equation (5) and which applies for spherical growth during solidification.
Note that, since an equiaxed grain structure in the cross-section of the cast is not sine qua non of an equiaxed grain structure in the longitudinal direction [16], care has to be exercised in being in the equiaxed grain growth regime in the longitudinal solidification direction.
Furthermore, a direct relationship between β and the solute supersaturation (α) was determined [10]:
The critical solute concentration C* (Equation (7)) for different solute types could be calculated by rearranging Equation (1) at β = 0 [10].
The physical meaning of C* is the onset of growth restriction for a given undercooling [10] in that:
If CO < C*, there is no growth restriction of the solute;
If CO > C*, there is growth restriction of the solute, the degree of which increases with increasing CO as described by Equation (1).
This procedure was also briefly described in our previous study on the role of dilute solute additions on growth restriction in binary copper alloys [19], in which the conceptual, heuristic growth restriction parameter (β) modelling framework [10] was applied. In binary alloys, values lower than a threshold of 10 at.% are generally classified as dilute alloys, while those greater than that are classified as concentrated binary alloys [20]. This paper extends our previous study on the effect of dilute solute additions on growth restriction to other dilute alloys: Cu-based binary alloys, Al- and Mg-based binary and ternary alloys and Ti-based binary alloys.
The CALPHAD methodology [21] has been used to calculate the heuristic growth restriction parameter (β) for different solutes in Cu-, Al-, Mg- and Ti-based alloys at a constant ΔT value of 0.5 K from the m and k values as well as from the liquid-to-solid fraction. Data from 65 solutes for Cu-based alloys, 18 solutes for Al-based alloys, 18 solutes for Mg-based alloys and 26 solutes for Ti-based alloys were input in the calculations as follows. True β values for over 500 solidification cooling curves were determined.
2. Growth Restriction Parameter β
The CALPHAD methodology has been used to calculate β values from the m and k values, at first approximation, as well as from the liquid-to-solid fraction to obtain true β values. In the first approximated β case, the heuristic growth restriction parameter β was calculated for each amount of solute present in the binary Cu, Al, Mg and Ti alloys studied in this investigation using the methodology originally described by Fan et al. [10]. This procedure was also briefly described in our previous work [19]. Values of m and k for binary copper alloys were calculated and were reported in [22], from which β. values were determined in the present investigation. Other values of m and k for binary copper alloys that are not available in [22] were taken from [23] (calculated from binary alloy phase diagrams [24]). Those for binary Al [25,26,27,28], Mg [29,30] and Ti [9,31] alloys were also obtained from valuable databases available in the literature. Note that the m and k values for the Al-B binary alloy were calculated in this work.
In the true β case, the evolution of the phase fractions of the liquid and the solid was calculated based on the Gulliver–Scheil cooling conditions for a temperature step of 0.01K using the software package Pandat (version 2021) [32]. Cooling was calculated from the thermodynamic databases available in the literature for binary Cu alloys as cited in our previous works [19,33] and an extension to binary Cu alloys with Ge, Pt, Li and Sc solute additions [34,35,36,37]. Cooling was calculated from the thermodynamic databases from CompuTherm [38] for binary Al-, Mg- and Ti-based alloys. True β values were then thermodynamically calculated from the liquid-to-solid fraction (Equation (3)) at a constant ΔT value of 0.5 K for the primary phases fcc-Cu, fcc-Al, hcp-Mg and bcc-Ti.
3. Results and Discussion
The values of the growth restriction coefficient (2/λ2) are plotted over the ratio of the conventional Q. to ΔT and true β values for the Cu–X, Al–X, Mg–X and Ti–X binary alloys in Figure 1 and Figure 2, respectively. From Figure 1, it is clear that the intercept at the Q/ΔT axis corresponds to k as highlighted in the work described in [10]. From Figure 2, a direct relationship between 2/λ2 and β values has been found in this work in the Cu-, Al-, Mg- and Ti-based binary alloys, which is in agreement with results originally reported by Fan et al. [10]. Note that, in the Al system, the critical solute concentrations for individual solute additions of Mo, Zr and Mn at a ΔT of 0.5 K were calculated to be 0.17, 0.19 and 4.90 wt.% respectively. These are greater that the corresponding maximum concentrations of 0.1, 0.11 and 1.9 wt.% from which the m and k values were determined [25].
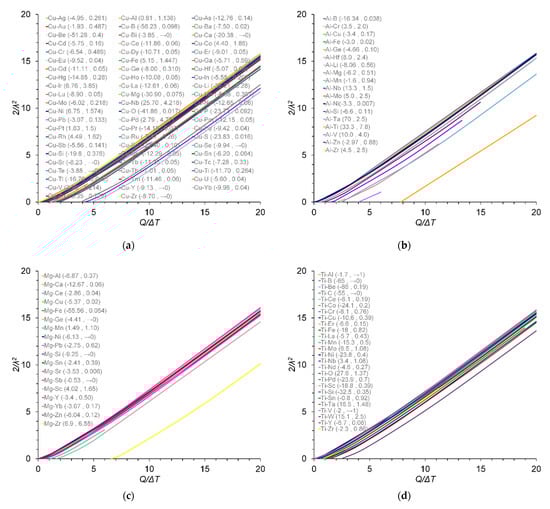
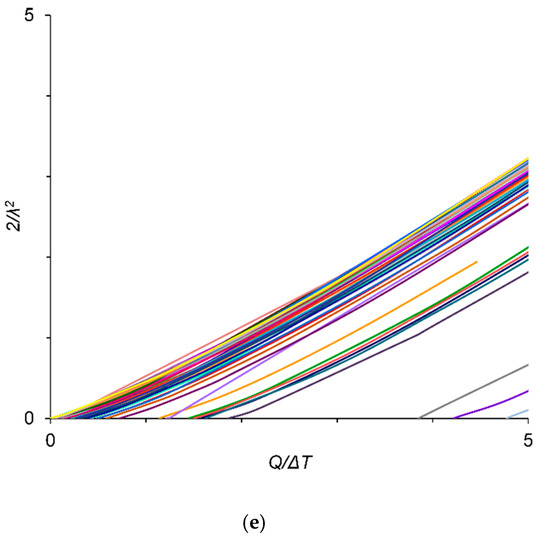
Figure 1.
Variation in 2/λ2 values with the ratio of Q. to ΔT at ΔT = 0.5 K for (a) Cu–X; (b) Al–X; (c) Mg–X; and (d) Ti–X binary alloys; (e) zoom-in region from (a). The m and k values are given in parentheses (m and k), data from [9,22,23,25,26,27,28,29,30,31]. The m and k values for the Al–B binary alloy were calculated in this work.
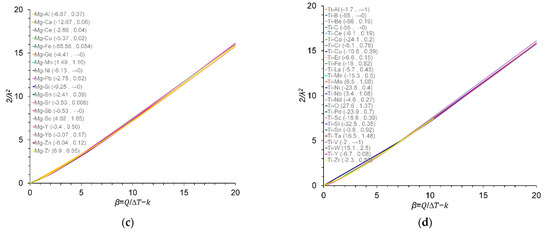
Figure 2.
Variation in 2/λ2 values with β at ΔT = 0.5 K for (a) Cu–X; (b) Al–X; (c) Mg–X; and (d) Ti–X binary alloys. The m and k values are given in parentheses (m and k), data from [9,22,23,25,26,27,28,29,30,31]. The m and k values for the Al–B binary alloy were calculated in this work.
Figure 3 compares the calculated β values from Equation (1), calculated from the liquidus slope (m) and the equilibrium distribution coefficient (k), and Equation (3), calculated from the liquid-to-solid fraction for Cu, Al-, Mg- and Ti-based binary alloy systems. Figure 3 shows good agreement between the approximated and true β values within the scatter of the results.
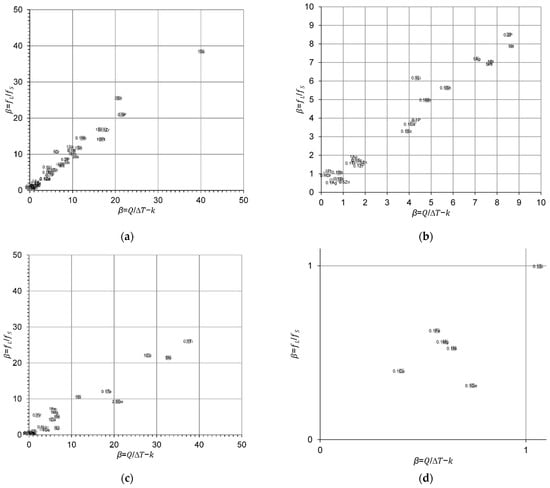
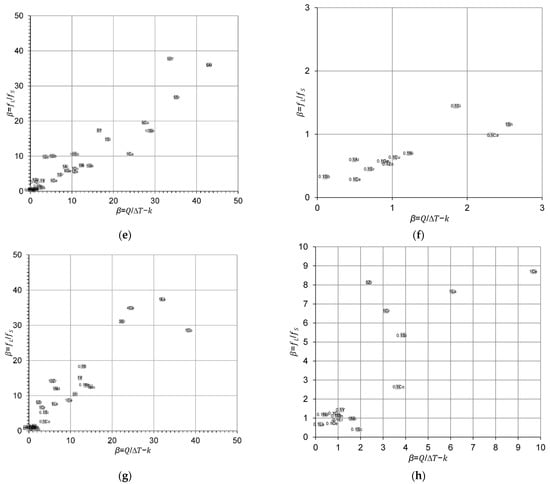
Figure 3.
Comparison between the approximated and true β values calculated from Equations (1) and (3), respectively, for (a,b) Cu–X; (c,d) Al–X; (e,f) Mg–X; and (g,h) Ti–X binary alloys and zoom-in regions. The reader is referred to the web version of this article for alloy compositions given in data-point labels.
Bustos and Reif [39] carried out an experimental screening study on the effect of different solute additions on grain refinement of Cu under a protective atmosphere of pure Ar (99.997%). Grain size measurements were reported for a constant solute addition of 0.1% and cast at 1160 °C followed by water quenching. A 220 g casting had a diameter of 30 mm and a height of 35 mm. Most of the casts exhibited a columnar structure in the range of 37–84%, and so would be expected to have β values < 1.14. A 100% equiaxed grain structure was observed in casts with individual additions of 0.1 wt.% of P, Sb, Bi, S, Se and Te. Moreover, critical solute concentrations for individual solute additions of Al, V, Ni and Zn were determined to be greater than the solute addition of 0.1 wt.% at a ΔT of 0.5 K [19]. In this case, there was no growth restriction (β = 0) by the solute additions, as the solidification became partitionless.
A feasibility study on the effect of dilute solute additions on grain size control in Al-based binary alloys with and without the addition of Al–5Ti–1B grain refiner for an inoculant addition of 0.01% Ti to Al (99.99 wt.% purity) was investigated under TP-1 casting conditions [40]. In the aforementioned study by Fan et al. [16], Spittle and Sadli’s grain size values with a grain refiner addition of 0.01% Ti were plotted against the calculated true β values at ΔT = 0.5 K, as shown in Figure 16 of [16]. It was found that all alloys with β < 1.14 exhibited a columnar grain structure. In contrast, all alloys with β > 1.14 had an equiaxed grain structure. From Figures 16–18 of [16], the criterion for a columnar-to-equiaxed transition (CET) at β = 1.14 under quasi-isothermal conditions has been demonstrated. Those grain size values have also been replotted against the calculated true β values in Figure 4 for comparative purposes. The initial columnar grain size of commercial purity (CP) Al with a grain refiner addition of 0.01% Ti, but without solute additions, was 1200 µm.
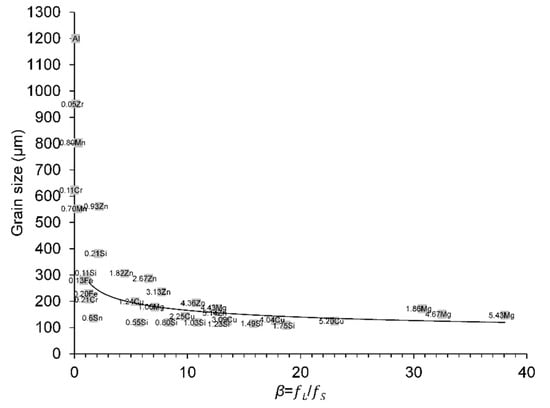
Figure 4.
Variation in grain size values from Spittle and Sadli, data from [40] with the true β values at ΔT = 0.5 K for different solute additions in binary Al alloys. The dashed line corresponds to the true β of 1.14, which was used as a criterion for CET under quasi-isothermal conditions [16]. All alloys with β < 1.14 (circle points) exhibited a columnar grain structure (see [16] for details). The Al circle point represents the initial columnar grain size of CP Al with a grain refiner addition of 0.01% Ti for reference. The reader is referred to the web version of this article for alloy compositions given in data-point labels.
The influence of dilute solute additions on growth restriction was also addressed in Al-based binary and ternary alloys under constant casting conditions [18]. The Al alloy melt was held at a constant superheat temperature of 100 °C for 30 min, then cast at a constant superheat of 60 °C. The measured cooling rates remained relatively constant in the range between 1.5 and 4 K/s. The cast ingots were 25 mm in diameter and 40 mm long. Metallographic sections were taken along the longitudinal direction. Non-dilute Al–Cu alloys with compositions greater than the threshold value of 10 at.%, were excluded from the grain size analysis, namely, Al–22.1Cu, Al–26.5Cu, Al–30.1Cu, Al–25.1Zn, Al–33.1Zn and Al–15Cu–15Zn (in wt.%). The grain size values given in [18] for dilute solute additions are plotted against the calculated true β values in Figure 5a. The initial columnar grain size of CP Al without solute additions was 2500 µm. Moreover, true β values calculated using Equation (3) for the ternary Al–XCu–YZn alloy systems of [18] are compared to those calculated using Equation (4) for the linear addition of each binary system, βAl-XCu and βAl-YZn, in Figure 5b, showing excellent agreement between the two approaches.
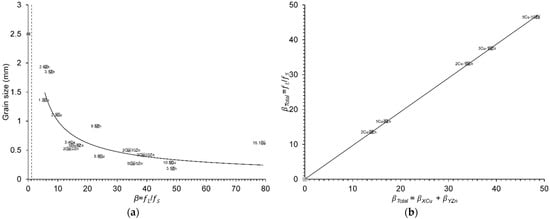
Figure 5.
(a) Variation in grain size values from Xu et al., data from [18] with the true β values at ΔT = 0.5 K for different solute additions in binary and ternary Al alloys. The dashed line corresponds to the true β of 1.14 (CET criterion) [16]. The Al circle point represents the initial columnar grain size of CP Al for reference; (b) comparison between true β values calculated using Equation (3) for the ternary Al–XCu–YZn alloy systems of [18] and those calculated using Equation (4) for the linear addition of each binary system, βAl-XCu and βAl-YZn. The reader is referred to the web version of this article for alloy compositions given in data-point labels.
The effect of increased amounts of solute additions in binary Mg-based alloys: 1–9 wt.% Al, 0.07–0.5 wt.% Si, 0.04–0.32 wt.% Zr, 0.14–0.78 wt.% Ca, 0.18–1 wt.% Zn and in ternary Mg–3Al- and Mg–9Al-based alloys having 0.01–1 wt.% Sr additions on the resulting grain size were assessed in CP Mg-based alloys (99.7%) at the edge, one-half radius and centre for each casting in two different studies [29,30]. From Figure 2 of [29], the grain structure of the Mg–1Al cast was in the CET region, and therefore it was excluded from the grain size analysis. The grain size values from the centre of each casting were represented in Figure 8 of [30] for the binary Mg-based alloys and in Figure 3 of [29] for the ternary Mg–3Al- and Mg–9Al-based alloys. Those grain size values have been plotted against the calculated true β values in Figure 6. The β values for Mg–0.07Si, Mg–0.04Zr and Mg–0.18Zn (circle points) were lower than the CET criterion of 1.14.
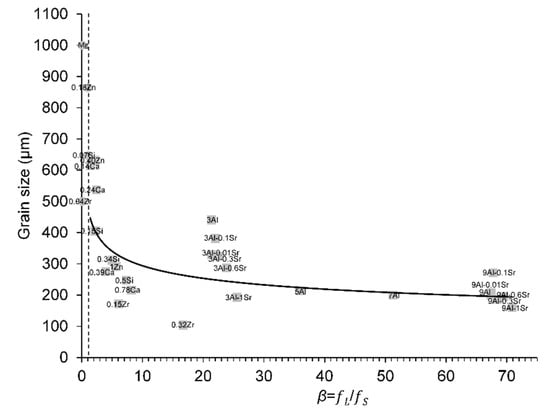
Figure 6.
Variation in grain size values from Lee et al., data from [29] with the true β values at ΔT = 0.5 K for different solute additions in binary and ternary Mg alloys. The dashed line corresponds to the true β of 1.14 (CET criterion) [16]. Circle points represent true β < 1.14. The Mg circle point represents the initial columnar grain size of CP Mg for reference. The reader is referred to the web version of this article for alloy compositions given in data-point labels.
The effect of three nominal levels of Fe (0.5, 1 and 2 wt.%) and Cr (1.5, 3 and 6 wt.%) on grain size control were examined in CP grade 2 titanium [31,41]. After casting, the samples were sectioned longitudinally. Those grain size values have also been plotted against the calculated true β values in Figure 7. Overall, from Figure 4, Figure 5a, Figure 6 and Figure 7, there was a correlation between grain size and true β values.
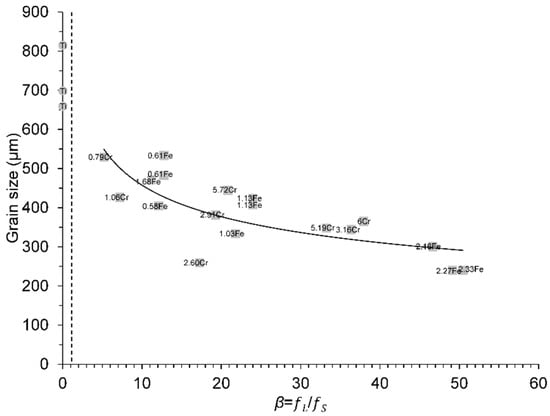
Figure 7.
Variation in grain size values from Bermingham et al. data from [41] with the true β values at ΔT = 0.5 K for different solute additions in binary Ti alloys. The dashed line corresponds to the true β of 1.14 (CET criterion) [16]. The Ti circle point represents the initial columnar grain size of CP grade 2 Ti for reference. The reader is referred to the web version of this article for alloy compositions given in data-point labels.
4. Conclusions
The heuristic growth restriction parameter (β) modelling framework has been applied to Cu-, Al-, Mg- and Ti-based binary and ternary alloys by using the CALPHAD approach. A direct relationship between the growth restriction coefficient (2/λ2) and the heuristic growth restriction parameter (β) was found in this work in dilute Cu-, Al-, Mg- and Ti-based binary alloys. As concluded in [10], this means that growth velocity is a unique function of the growth restriction parameter (β), which is dependent on the nature of the solutes, the solute concentrations and the solidification conditions. Grain size values from the literature were plotted against the corresponding true β values, showing a negative or inverse correlation between the two.
Author Contributions
All the authors contributed equally to this work. All authors have read and agreed to the published version of the manuscript.
Funding
The support of the EPSRC (UK) is gratefully acknowledged.
Data Availability Statement
Not applicable.
Conflicts of Interest
The authors declare no conflict of interest.
References
- Bagherian, E.R.; Bell, C.; Cooper, M.; Fan, Y.; Frame, B.; Abdolvand, A. Influence of Casting Speed on the Structure and Mechanical Properties of Continuous Cast DHP Copper Tube. In METAL 2014: 23rd International Conference on Metallurgy and Materials; EU. Ostrava: Brno, Czech Republic; TANGER: Ostrava, Czech Republic, 2014; pp. 1163–1168. [Google Scholar]
- Shihab, N.R.; Enab, T.A.; Galal, A.G.; Gatas, M.S. Effect of Grain Size on Orange Peel in Oxygen Free Copper Wire Produced by Upcast. Int. J. Sci. Eng. Res. 2016, 7, 1271–1275. [Google Scholar]
- UPCAST OY. New UPCAST® Developments Target Copper Tube Production and Environmental Benefits. Technol. News Int. 2010, 99, 28–29. [Google Scholar]
- Easton, M.; Wang, H.; Grandfield, J.; StJohn, D.; Sweet, E. An analysis of the effect of grain refinement on the hot tearing of aluminium alloys. Mater. Forum 2004, 28, 224–229. [Google Scholar]
- Eskin, D.G.; Suyitno; Katgerman, L. Mechanical properties in the semi-solid state and hot tearing of aluminium alloys. Prog. Mater. Sci. 2004, 49, 629–711. [Google Scholar] [CrossRef]
- Kim, S.K.; Seo, J.H. US Patent for Magnesium-Based Alloy with Superior Fluidity and Hot-Tearing Resistance and Manufacturing Method Thereof Patent—Korea Institute of Industrial Technology. U.S. Patent # 8,734,564, 27 May 2014. Available online: https://patents.justia.com/patent/8734561 (accessed on 18 August 2022).
- Zhou, L.; Huang, Y.; Mao, P.; Kainer, K.U.; Liu, Z.; Hort, N. Investigations on hot tearing of Mg-Zn-(Al) alloys. In Magnesium Technology; Sillekens, W.H., Agnew, S.R., Neelameggham, N.R., Mathaudhu, S.N., Eds.; Springer: San Diego, CA, USA, 2011; p. 126. [Google Scholar]
- Prokhorov, N.N. Hot cracking resistance of titanium alloys in welding. Weld. Int. 2010, 1, 570–572. [Google Scholar] [CrossRef]
- Zhang, D.; Prasad, A.; Bermingham, M.J.; Todaro, C.J.; Benoit, M.J.; Patel, M.N.; Qiu, D.; StJohn, D.H.; Qian, M.; Easton, M.A. Grain Refinement of Alloys in Fusion-Based Additive Manufacturing Processes. Metall. Mater. Trans. A 2020, 51, 4341–4359. [Google Scholar] [CrossRef]
- Fan, Z.; Gao, F.; Zhou, L.; Lu, S.Z. A new concept for growth restriction during solidification. Acta Mater. 2018, 152, 248–257. [Google Scholar] [CrossRef]
- Quested, T.E.; Greer, A.L. The effect of the size distribution of inoculant particles on as-cast grain size in aluminium alloys. Acta Mater. 2004, 52, 3859–3868. [Google Scholar] [CrossRef]
- Fan, Z. An epitaxial model for heterogeneous nucleation on potent substrates. Metall. Mater. Trans. A 2013, 44, 1409–1418. [Google Scholar] [CrossRef]
- Fan, Z.; Gao, F.; Jiang, B.; Que, Z. Impeding nucleation for more significant grain refinement. Sci. Rep. 2020, 10, 9448. [Google Scholar] [CrossRef]
- Gao, F.; Fan, Z. Effect of Nucleant Particle Agglomeration on Grain Size. Metall. Mater. Trans. A 2022, 53, 810–822. [Google Scholar] [CrossRef]
- Men, H.; Fan, Z. Effects of solute content on grain refinement in an isothermal melt. Acta Mater. 2011, 59, 2704–2712. [Google Scholar] [CrossRef]
- Fan, Z.; Gao, F.; Wang, Y.; Men, H.; Zhou, L. Effect of solutes on grain refinement. Prog. Mater. Sci. 2022, 123, 100809. [Google Scholar] [CrossRef]
- Cziegler, A.K.; Schumacher, P. Investigation of the correlation between growth restriction and grain size in Cu alloys. Int. J. Cast Met. Res. 2017, 30, 251–255. [Google Scholar] [CrossRef]
- Xu, H.; Xu, L.D.; Zhang, S.J.; Han, Q. Effect of the alloy composition on the grain refinement of aluminum alloys. Scr. Mater. 2006, 54, 2191–2196. [Google Scholar] [CrossRef]
- Balart, M.J.; Gao, F.; Patel, J.B.; Miani, F. On the role of dilute solute additions on growth restriction in binary copper alloys. Metallogr. Microstruct. Anal. 2020, 9, 825–832. [Google Scholar] [CrossRef]
- Yang, T.; Lu, C.; Velisa, G.; Jin, K.; Xiu, P.; Crespillo, M.L.; Zhang, Y.; Bei, H.; Wang, L. Effect of alloying elements on defect evolution in Ni-20X binary alloys. Acta Mater. 2018, 151, 159–168. [Google Scholar] [CrossRef]
- Kaufman, L.; Bernstein, H. Computer Calculation of Phase Diagrams; Academic Press: New York, NY, USA, 1970. [Google Scholar]
- Balart, M.J.; Patel, J.B.; Gao, F.; Fan, Z. Grain refinement of deoxidized copper. Metall. Mater. Trans. A 2016, 47, 4988–5011. [Google Scholar] [CrossRef]
- Cziegler, A.K. Aspects of Grain Refinement in Copper Alloys. Master’s Thesis, University of Leoben, Leoben, Austria, 2015; pp. 58–59. Available online: https://pure.unileoben.ac.at/portal/files/4712890/AC12632904.pdf (accessed on 27 April 2022).
- Massalski, T. (Ed.) Binary Alloy Phase Diagrams, 2nd ed.; ASM International, Materials Park: Novelty, OH, USA, 1990. [Google Scholar]
- Easton, M.A.; StJohn, D.H. An analysis of the relationship between grain size, solute content, and the potency and number density of nucleant particles. Metall. Mater. Trans. A 2005, 36, 1911–1920. [Google Scholar] [CrossRef]
- Mitrašinović, A.M.; Robles Hernández, F.C. Determination of the growth restriction factor and grain size for aluminum alloys by a quasi-binary equivalent method. Mater. Sci. Eng. A 2012, 540, 63–89. [Google Scholar] [CrossRef]
- Johnsson, M.; Bäckerud, L. The influence of composition on equiaxed crystal growth mechanisms and grain size in Al alloys. Z. Metallkd. 1996, 87, 216–220. [Google Scholar] [CrossRef]
- Greer, A.L. Solidification of alloys. In Solidification of Aluminum Alloys; Chu, M.G., Granger, A., Han, Q., Eds.; Warrendale, Pa.: Charlotte, NC, USA, 2004; p. 131. [Google Scholar]
- Lee, Y.C.; Dahle, A.K.; StJohn, D.H. The role of solute in grain refinement of magnesium. Metall. Mater. Trans. A 2000, 31, 2895–2906. [Google Scholar] [CrossRef]
- StJohn, D.H.; Qian, M.; Easton, M.A.; Cao, P.; Hildebrand, Z. Grain Refinement of Magnesium Alloys. Metall. Mater. Trans. A 2005, 36, 1669–1679. [Google Scholar] [CrossRef]
- Bermingham, M.J.; McDonald, S.D.; Dargusch, M.S.; StJohn, D.H. Grain-refinement mechanisms in titanium alloys. J. Mater. Res. 2008, 23, 97–104. [Google Scholar] [CrossRef]
- Pandat Software. Thermodynamic Calculations and Kinetic Simulations; CompuTherm LLC: Middleton, WI, USA, 2021. [Google Scholar]
- Balart, M.J.; Gao, F.; Patel, J.B.; Miani, F. Effects of superheat and solute additions on the grain size in binary copper alloys. Metallogr. Microstruct. Anal. 2019, 8, 566–572. [Google Scholar] [CrossRef]
- Wang, J.; Jin, S.; Leinenbach, C.; Jacot, A. Thermodynamic assessment of the Cu–Ge binary system. J. Alloy. Compd. 2010, 504, 159–165. [Google Scholar] [CrossRef]
- Abe, T.; Sundman, B.B.; Onodera, H. Thermodynamic assessment of the Cu−Pt system. J. Phase Equilib. Diffus. 2006, 27, 5–13. [Google Scholar] [CrossRef]
- Li, D.; Fürtauer, S.; Flandorfer, H.; Cupid, D.M. Thermodynamic assessment of the Cu–Li system and prediction of enthalpy of mixing of Cu–Li–Sn liquid alloys. Calphad 2016, 53, 105–115. [Google Scholar] [CrossRef]
- Bo, H.; Liu, L.B.; Jin, Z.P. Thermodynamic analysis of Al–Sc, Cu–Sc and Al–Cu–Sc system. J. Alloy. Compd. 2010, 490, 318–325. [Google Scholar] [CrossRef]
- CompuTherm Databases. Available online: https://computherm.com/databases (accessed on 18 August 2022).
- Bustos, O.L.; Reif, W. Kornfeinung von reinstkupfer durch chemische zusätze, teil 1. Z. Metallkd. 1993, 47, 1005–1014. [Google Scholar]
- Spittle, J.A.; Sadli, S. Effect of alloy variables on grain refinement of binary aluminium alloys with Al–Ti–B. Mater. Sci. Technol. 1995, 11, 533–537. [Google Scholar] [CrossRef]
- Bermingham, M.J.; McDonald, S.D.; StJohn, D.H.; Dargusch, M.S. Segregation and grain refinement in cast titanium alloys. J. Mater. Res. 2009, 24, 1529–1535. [Google Scholar] [CrossRef]
Publisher’s Note: MDPI stays neutral with regard to jurisdictional claims in published maps and institutional affiliations. |
© 2022 by the authors. Licensee MDPI, Basel, Switzerland. This article is an open access article distributed under the terms and conditions of the Creative Commons Attribution (CC BY) license (https://creativecommons.org/licenses/by/4.0/).