1. Introduction
Road transport, which accounts for about 12% of total carbon dioxide emissions, significantly impacts climate change. The international community seeks to reduce greenhouse gas emissions through improving the fuel efficiency of cars, increasing the use of alternative fuels, hybrid propulsion, and also reducing car weight. For 2021, the permitted emissions value is 95 g CO
2/km. By reducing the weight of the car by 12 kg, it is possible to achieve a reduction in emissions of 1 g CO
2/km. The exhaust system plays a role in reducing fuel consumption, reducing emissions, reducing noise levels caused by the ignition of gases, and regulating the volume and flow pressure of the gas. The above functions are performed by the following parts of the exhaust system: the exhaust manifold, the flex coupling, the catalytic converter, the muffler, the resonator, and the tailpipe [
1,
2,
3].
The exhaust system components between the engine and the tailpipe are connected by means of an exhaust pipe. As with all other vehicle parts, exhaust systems are subject to efforts aimed at increasing the life of their individual parts, at reduced weight among other factors. The service life of the exhaust system parts on the inside is affected by changes in temperature, in salt concentration, and in concentration of the alkaline and acid condensates. Condensates such as sulfurous acid, sulfuric acid, and low levels of hydrochloric acid, and critical pH values cause corrosion of the exhaust system parts on the inside. From the outside, the exhaust system must resist the effects of sand, gravel, water, salt, vibrations, and so on. Exhaust system materials must be resistant to these influences. Changing conditions in transport have also resulted in changed requirements for the materials of the individual parts of exhaust systems. Where low-carbon steel was used, the iron oxide coating in the exhaust system protected the components from atmospheric corrosion but not from the influence of road salt and condensates. Treatment of the exhaust system parts with an aluminum–silicone coating, producing so-called aluminized steel, partially improved their service life. Short trips do not cause the aluminum–silicone-coated exhaust system to heat up to a temperature at which all moisture from the exhaust system evaporates. Residual moisture causes corrosion and reduces the service life of internal exhaust system components. Due to tightening of emission standards and requirements to guarantee the service life of the exhaust system, stainless steels began to be used for the exhaust system parts (
Table 1) [
4].
The corrosion resistance of these steels is guaranteed by the chromium content, which accounts for at least 10.5% [
5,
6,
7]. When heated, chromium forms a protective coating of chromium oxide, which delays further oxidation. If this oxide layer is stable, the metal substrate is well protected against corrosion. Further improvement of the stainless-steel properties can be achieved by adding alloying elements (nickel, molybdenum, titanium, manganese, silicon, niobium, and nitrogen).
Stainless austenitic steels (AISI 304, AISI 309, AISI 316, etc.) and stainless ferritic steels (AISI 409, AISI 430) are most often used in exhaust system parts manufacturing. In addition to chromium and carbon, austenitic steels also contain 6 to 35% of nickel. The role of nickel is to stabilize the austenite and to improve the mechanical properties and weldability. Adding nickel to steel can also lead to an increase in the range of critical temperatures. In combination with nickel, chromium improves tensibility and toughness [
5].
Stainless ferritic steels such as AISI 409 and AISI 430 contain approximately 30% of chromium, less than 0.12% of carbon, and traces of nickel. Ferrite-soluble nickel does not form carbides and oxides, while the addition of chromium to steels can result in the formation of various hard chromium carbides. Adding chromium improves toughness and hardness and increases the critical temperature range [
6].
Among other things, emissions standards require that the individual exhaust system parts (manifold, converter, resonator, and muffler) are exhaust-gas-tight throughout the vehicle’s lifetime. The outer parts of these components are produced via processes of continuous pipe bending, conventional cold forming or hydroforming, and then they are joined into a single whole by edging or seam welding [
7,
8]. The edge joint is made of four overlapping layers of material stretching over no less than 8 mm. The end caps are recessed into the ends of the muffler and must have sufficient overlap for the seam lock or weld overlap. Overlapping the entire circumference means wasting material and increasing the weight of the exhaust system parts. Better joint tightness can be ensured, and seam overlap eliminated, by using laser welding.
In general, austenitic stainless steels of the AISI 304 type are highly weldable [
9]. The process of welding ferritic stainless steels is more complicated because grain growth occurs very quickly during welding [
10,
11,
12]. The coarse-grained structure in the weld zone and in the heat-affected zone of fusion welds is characterized by low toughness and tensibility, due to the absence of phase transformation [
12,
13,
14,
15]. The Schaeffler diagram [
16], the WRC-1992 diagram [
17], and the Balmforth diagram [
18] are used to predict the weldability of stainless-steel types. Calculations of phase diagrams (CALPHAD) are used to predict the multicomponent phase transformation based on thermodynamics [
19]. Tate et al. used the CALPHAD technique to analyze the solidification of metal during 21Cr-6Ni-9Mn stainless steel laser-beam welding [
20,
21]. Their results showed that the captured impurities and the high cooling rate led to a deviation from the primary solidification regime. The substantial usefulness of CALPHAD in the analysis of weldability was also pointed out by the authors in [
22]. In order to maintain competitiveness, individual final-product manufacturers are forced to address ever greater detail relating to the causes of errors and waste in production, reducing production costs, and reducing environmental impacts. One of the main goals of the process of thin-walled parts production by forming is that they are manufactured with zero defects and zero waste. In the production of thin-walled parts by cold forming, defects and waste are mainly caused by the limited formability of sheets and profiles. Despite the fact that the laser-formed joints are characterized by a narrow heat-affected zone (HAZ), the structure in the heat-affected zone and in the weld metal is different from the structure of the unaffected base material. Changes in the structure affect the resistance to corrosion, mechanical properties, and formability of the formed combined materials.
Formability is the ability of the material to permanently change its shape without breaking under certain thermomechanical conditions (temperature, stress, friction, and strain rate) [
23,
24]. Assessment of sheet formability is based on the mechanical properties (the yield strength
Re, the ultimate tensile strength
Rm, the tensibility
A80, the uniform tensibility
Ag, normal anisotropy ratio
r, and the strain-hardening exponent
n) and the combination thereof. In addition to the material properties, the formability also depends on the geometry and dimensions of the blank, the geometry of the active parts of the stamping tool, friction on the contact surfaces between the tool and the blank, the roughness of the contact surfaces, etc. Incorrect determination of these parameters may result in excessive thinning of the stamped part wall, stamped part failure, undesired wrinkling of the stamped part, or a change in the geometry of the finished stamped part due to springing back, even when materials with excellent formability are used.
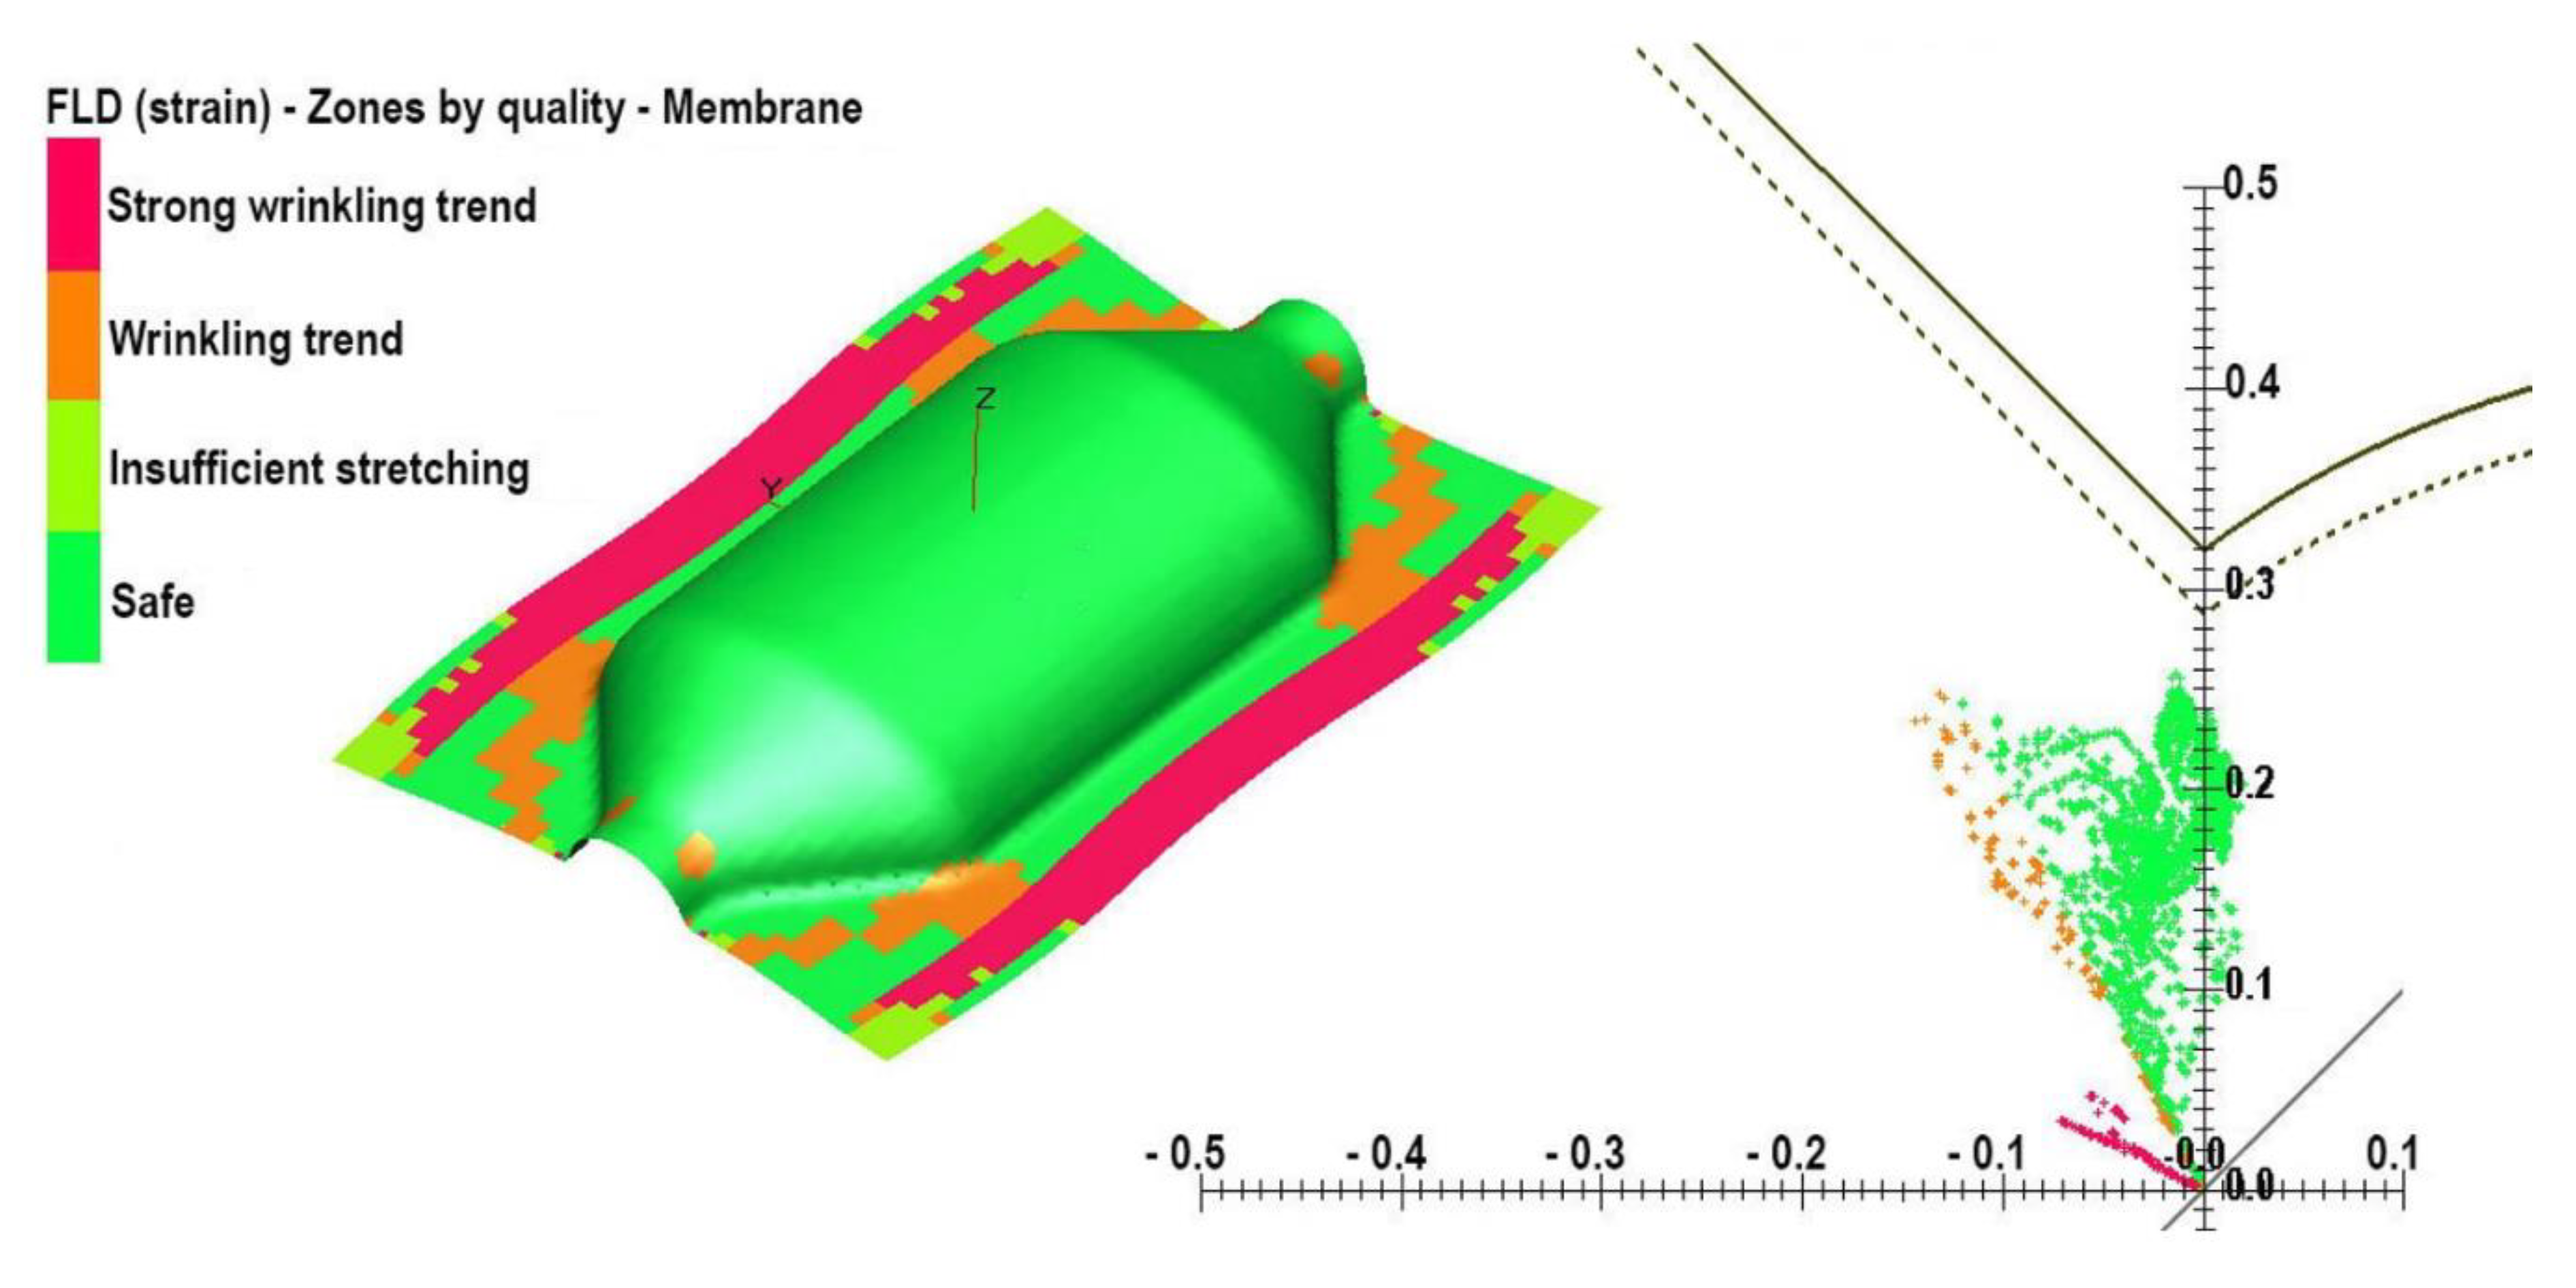
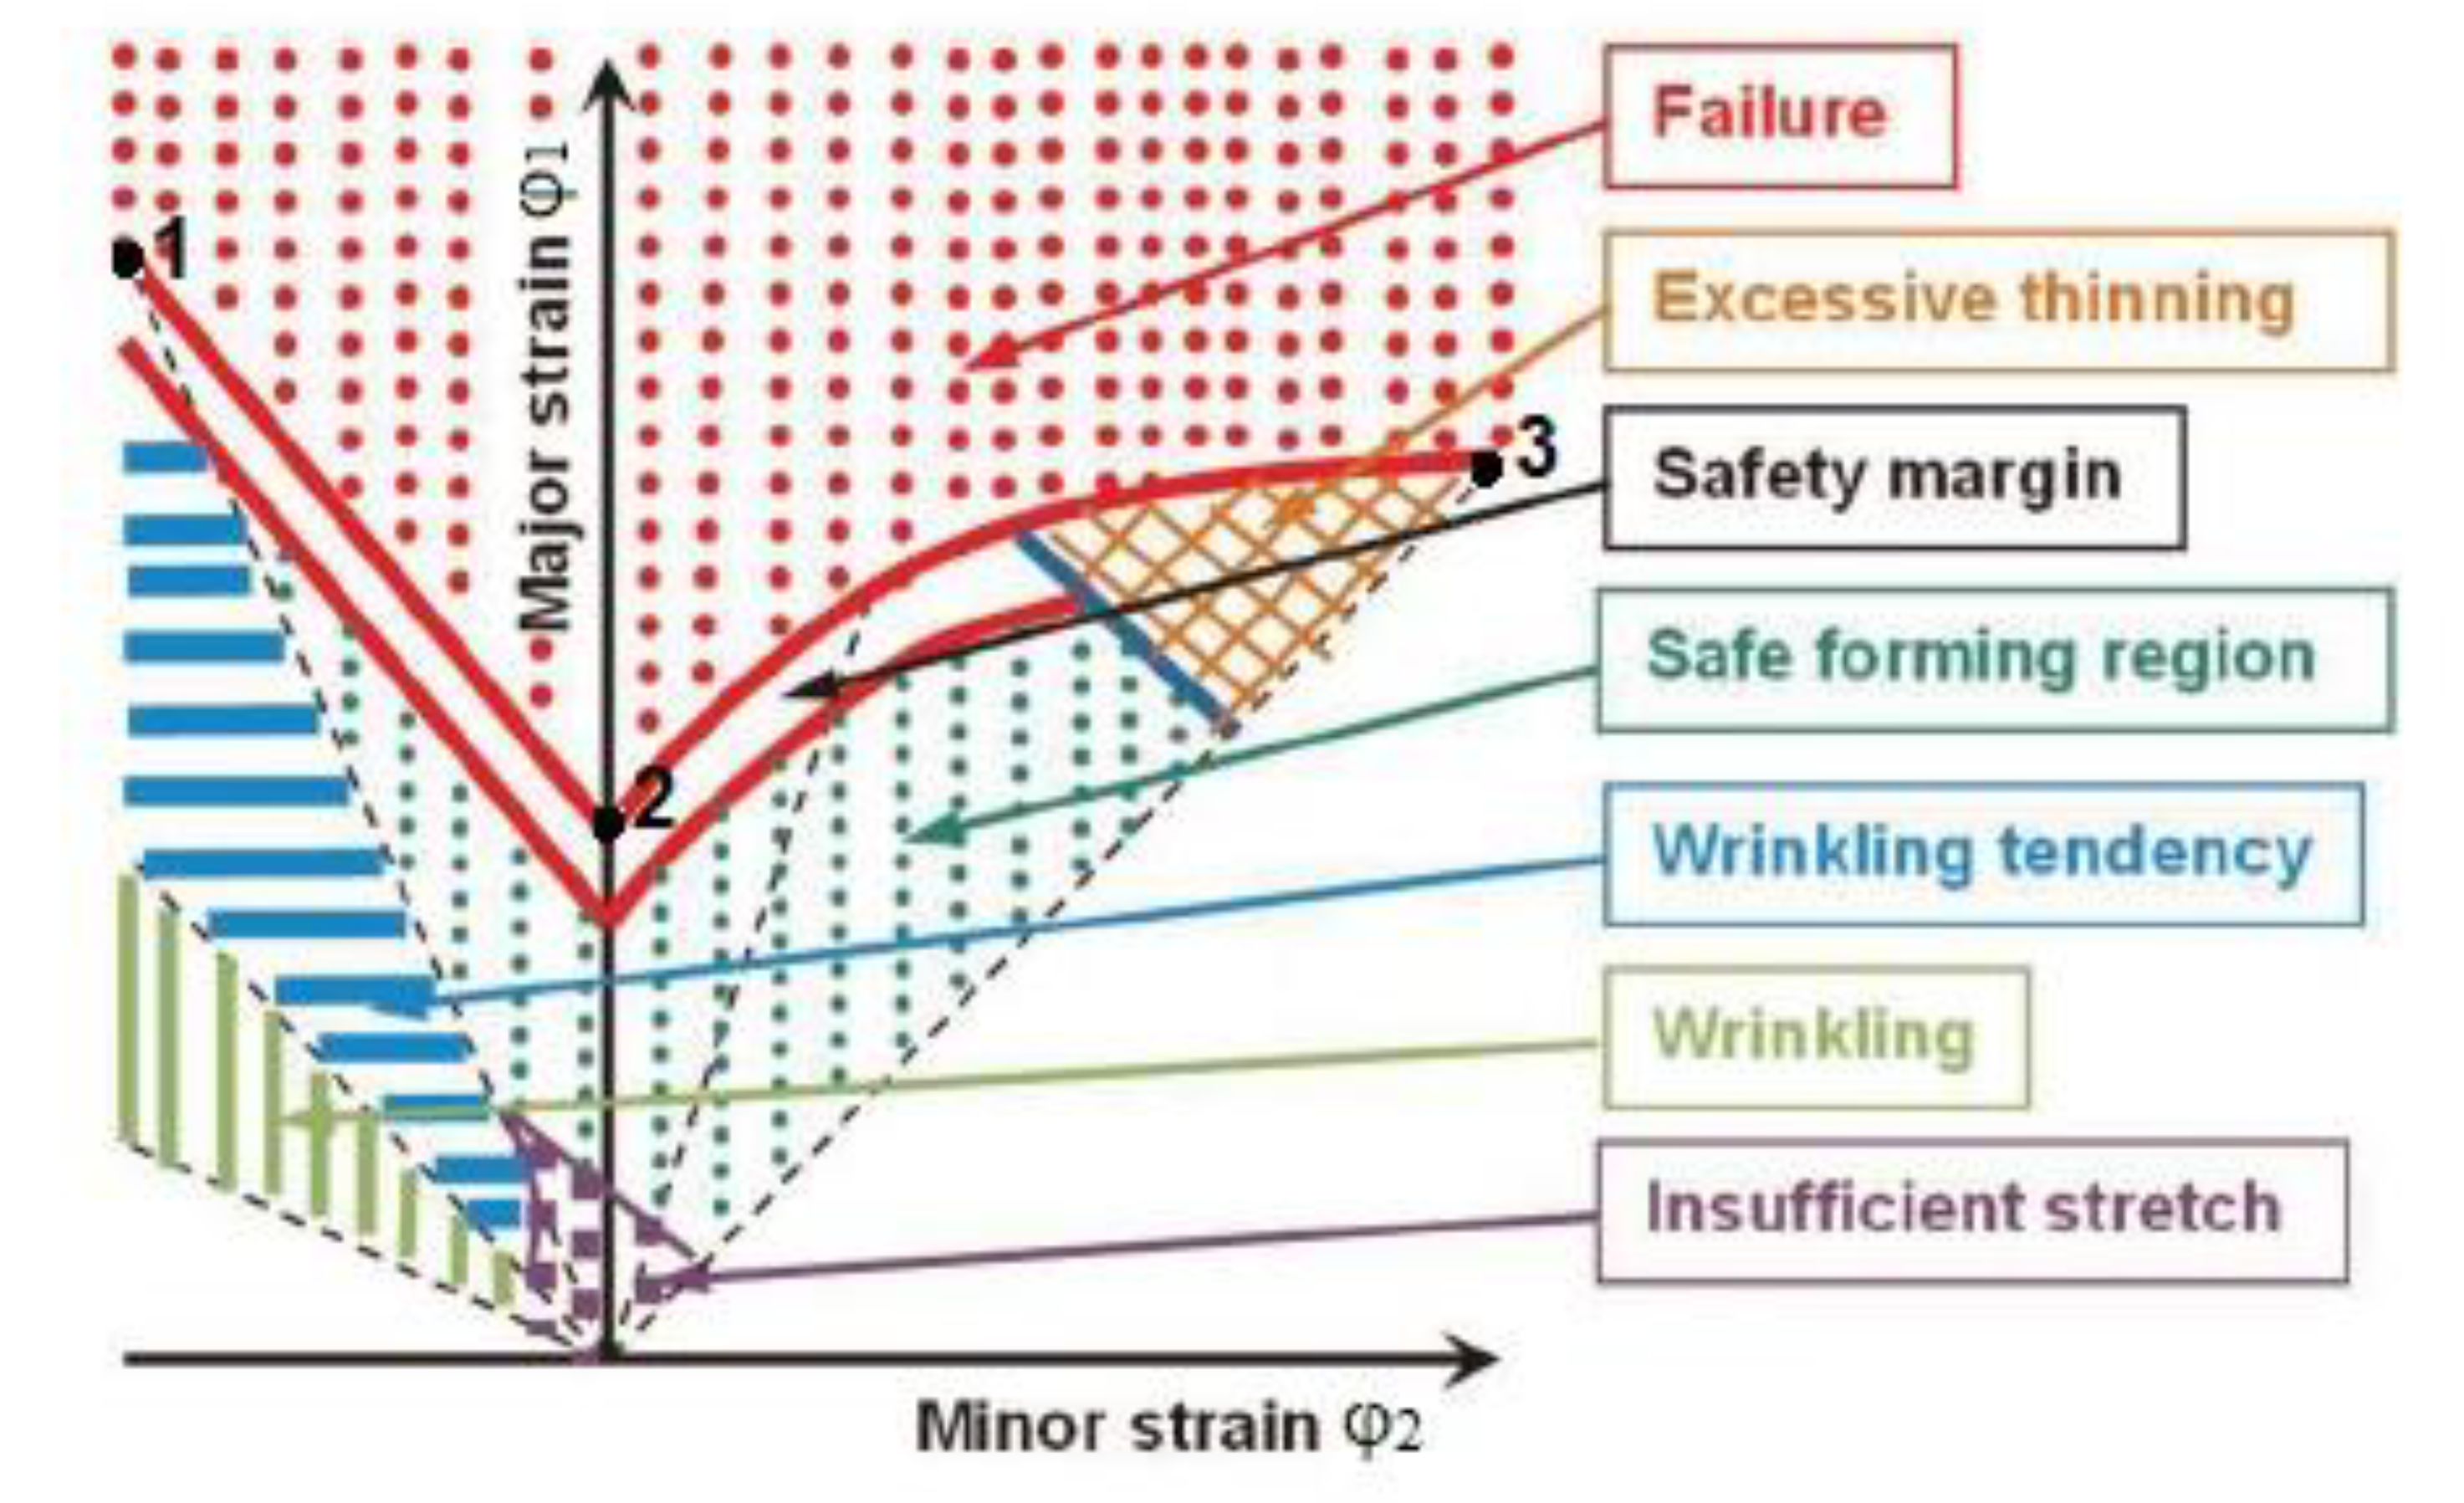
Forming limit curves (FLCs) are used to predict the manufacturability of stamped parts with no excessive thinning and no failure from sheets and profiles made by cold forming (
Figure 1) [
23,
24]. The forming limit diagram (FLD) consists of two quadrants. The first quadrant was described by Keeler for the region with
φ2 > 0, i.e., for the tension–tension stress, and the second quadrant was described by Goodwin for the region with
φ2 < 0, for the tension–compression stress. The values of the major strain
φ1 are plotted on the vertical axis and the values of the minor strain
φ2 are plotted on the horizontal axis. The FLCs in the FLD represent the limit values of the
φ1 strain for individual zones, depending on the strain (
Figure 1). The FLD is divided into an area of safe strains below the FLC and an area of strains above the FLC where excessive thinning or failure of the stamped part is likely to occur [
25]. Methods for determining FLCs are described in more detail in [
26,
27,
28,
29,
30,
31].
The aim of the research was to assess the influence of laser welding on the formability of laser-welded blanks of sheets and profiles made of austenitic stainless steel AISI 304 and ferritic stainless steel AISI 430, in terms of their application in parts of the exhaust system (the catalytic converter), based on their mechanical properties and FLCs. The parts considered were produced by hydroforming from pipes. The pipes were produced by continuous rolling and were subsequently laser-welded. In the manufacturability (formability) analysis of the mentioned parts, we used the major strain
φ1 and the minor strain
φ2 of the main strain in the plane of the parts. The major and minor strains in the plane of the stamped part were determined from the change in the area of the blank before any strain occurred, with respect to the same area after strain occurred. The stamped part and semi-finished product were modeled in CAD (SolidWorks), which allowed the weight, the area, and the volume of the stamped part to be determined. The area of the catalytic converter was
SC = 113,825 mm
2 and the assumed area of the blank for the production of the
S0C catalytic converter was 81,640 mm
2. Based on the above assumptions, the strain
φ12 (
φ12 =
φ1 +
φ2) in the plane of individual parts was calculated. The expected strain
φ12 in manufacturing of the catalytic converter is:
It is assumed that, in this case, the minor strain
φ2 will range from 0 to −0.1. Then, for
φ2 = −0.1, the major strain
φ1C in the manufacturing of the catalytic converter is:
and for
φ2 = 0 the major strain
φ1C is:
Figure 2 shows the prediction analysis of the catalytic converter using PAM-STAMP software 2020 (ESI Group, Rungis, France).
Figure 2 shows that during the production of the catalytic converter, the target value of the major strain
φ1C = 0.23 for
φ2 = −0.01, for
φ2 = −0.02 the target value
φ1C = 0.26, and for
φ2 = 0 the target value
φ1C = 0.26. This is essentially consistent with the data calculated according to Equations (1) and (2) (average value
φ1C = (0.23 + 0.31) / 2 = 0.27).
2. Materials and Methods
Steel sheets made of austenitic stainless steel AISI 304 and ferritic stainless steel AISI 430 with a thickness of 0.78 mm were used for the formability experiments. The chemical composition of the steels (
Table 2) was determined with a Belec Compact Port mobile spectrometer (Belec Spektrometrie Opto-Elektronik GmbH, Georgsmarienhütte, Germany). The strips of sheet metal were clamped in the jig before welding so that they did not deform when the weld solidified. The jig with the strip of sheet metal was attached to the workbench. Butt welding of the sheet-metal strips was performed with a YLS-5000 fiber laser (IPG Photonics, Oxford, MA, USA).
The welding parameters were optimized based on the analysis of porosity and weld root quality in the weld joint (
Table 3). The distance of the focusing lens from the focus spot was 250 mm and the focus spot distance was 2 mm above the surface of the welded part.
Samples were taken from weld-joint area, ground, polished, and then electrolytically etched in 10% aqueous CrO3 solution. The microstructure of the weld joint was analyzed perpendicularly to the weld line using an optical microscope Axio Observer 1M (Carl Zeiss Jena GmbH, Jena, Germany).
Welded samples were tested according to the common standard EN ISO 4136, by tensile testing of specimens with a transversal joint in the middle of their length by the method specified in the standard. The measured values of maximal force (Fm = 6910 N) and ultimate tensile strength (443 MPa) for the material AISI 430 were within the standard deviation of ±4 MPa compared to the base material. Elongation values were 4.5 mm smaller on average, representing a 5,5% reduction in ductility. For the AISI 304 LW material, the maximum force (Fm = 11762 N), the tensile strength (754 MPa), and the elongation were measured within the values of the standard deviations of the base material values.
The mechanical properties of the base material (without a welded joint), such as the yield strength Re, tensile strength Rm, uniform elongation Ag, and total elongation A80, and the special values important for numerical simulation of sheet-metal forming processes (strength constant K, strain hardening exponent n, and plastic strain ratio r) for the tested materials AISI 304 BM and AISI 430 BM were measured on specimens according to the conditions specified in standards ISO 6892-1, ISO 10113, and ISO 10275.
The results presented in [
32,
33] show that the widely used standards ISO 5817 and ISO 5178 have room for innovation to meet the needs of numerical simulations. In order to take into account the material inhomogeneity of welded joints in the formability analysis in the numerical simulation of laser welded blanks, using the finite element method (FEM), the basic mechanical properties and values of the material properties necessary for the simulation of the sheet-metal forming processes were determined (strength constant
K, strain hardening exponent
n, and plastic strain ratio
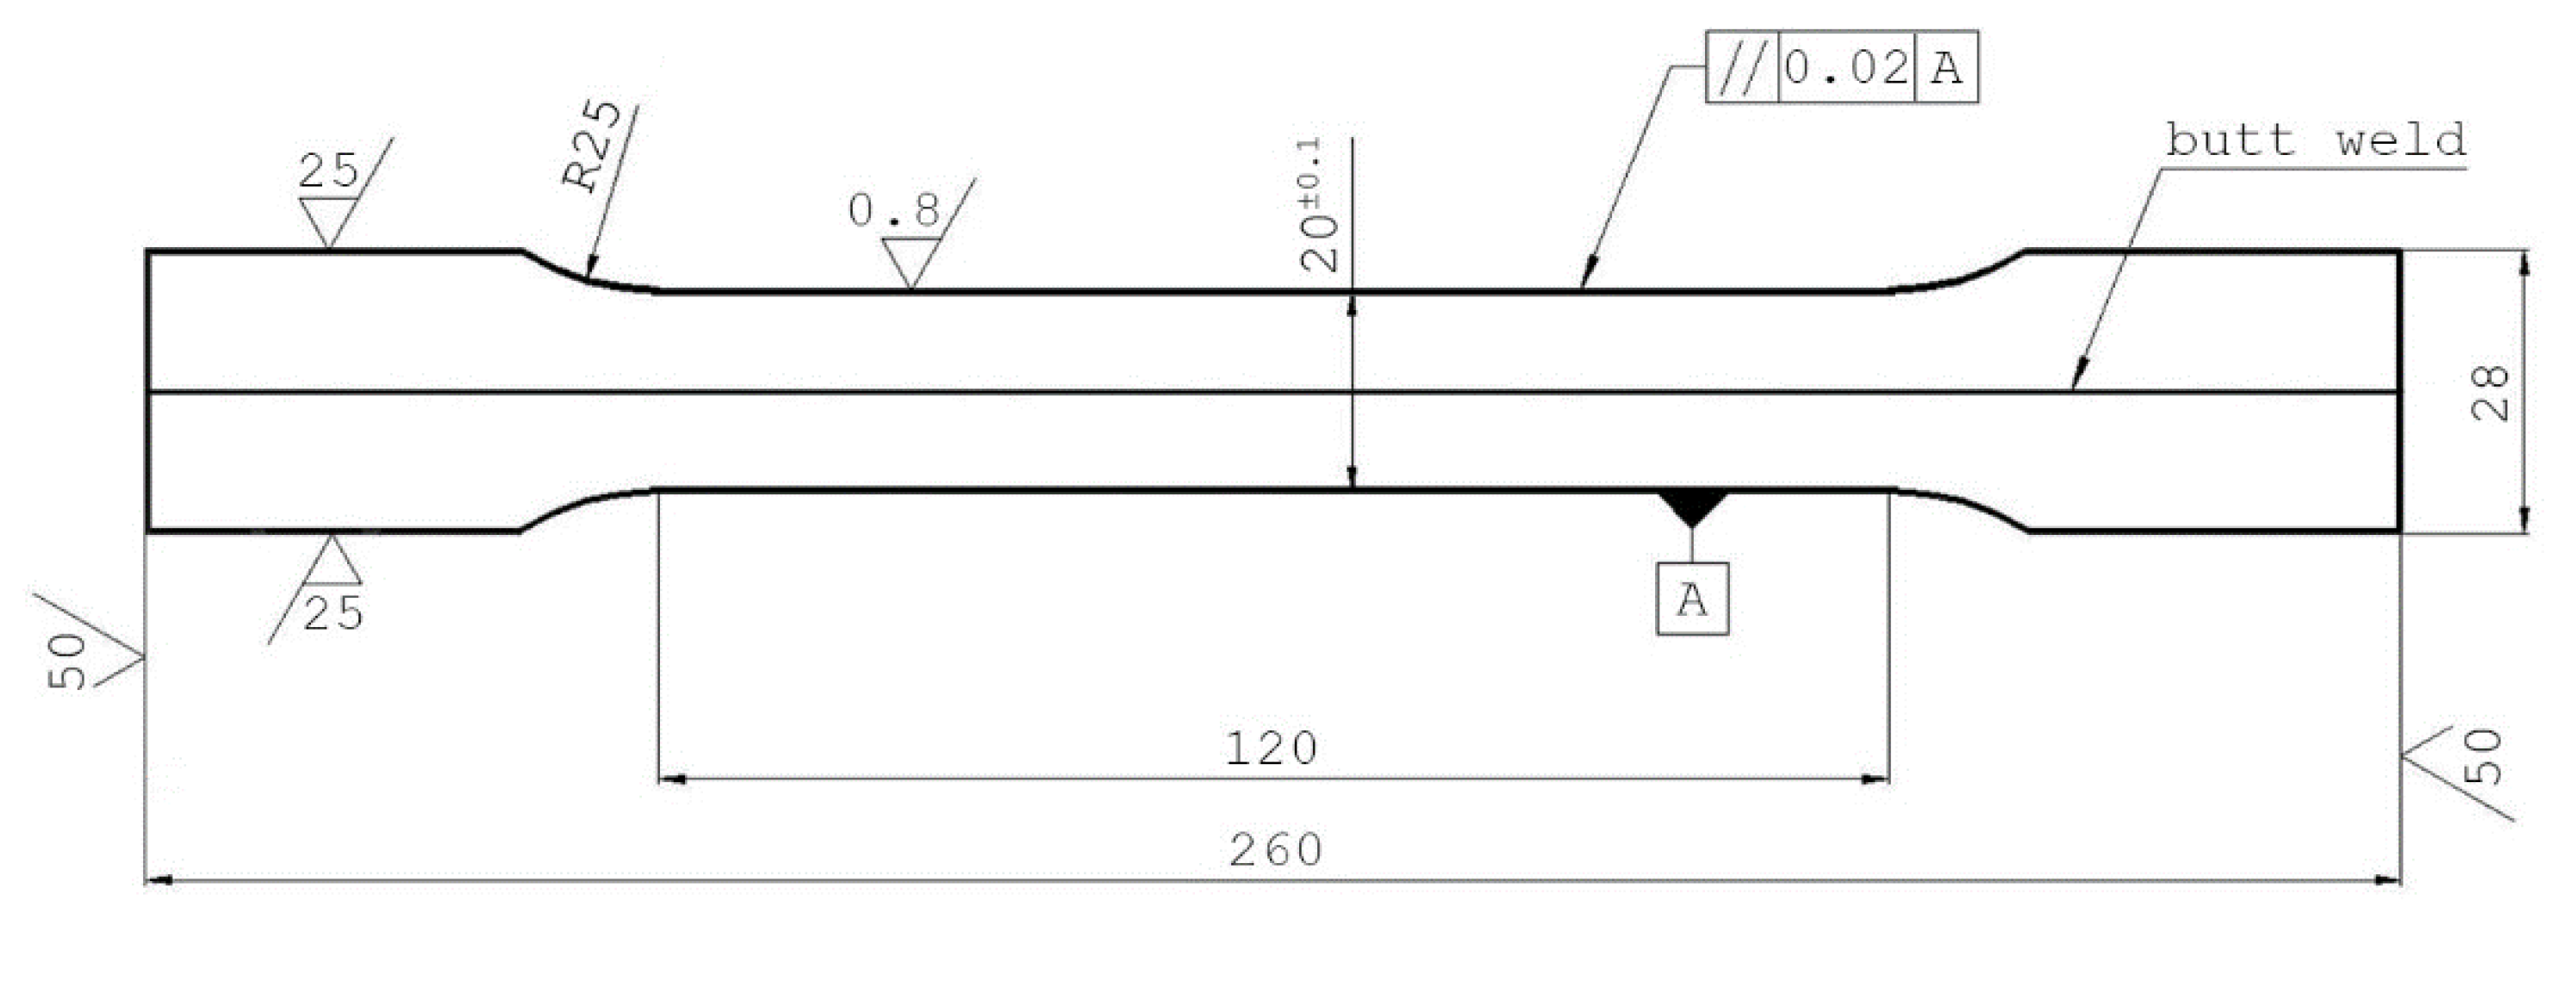
r) on specimens with a longitudinal laser weld. The shape and size of specimens made from AISI 304 LW and AISI 430 LW were as specified in the standard ISO 6892-1 (
Figure 3).
Tensile testing was performed using a TIRAtest 2300 testing machine (TIRA Maschinenbau GmbH, Rauenstein, Germany) under conditions in compliance with the standards. This testing machine is equipped with a force and elongation sensor. In
Table 4, the measured and calculated values of the material characteristics are shown at a strain rate of 0.0021 s
−1.
Microhardness was measured on a Shimadzu HMV-2 microhardness tester (Shimadzu, Kyoto, Japan). Twenty-five punctures were made in each sample: five punctures in the weld metal, five in the base material on the left side and five on the right side, and five punctures in the heat-affected zone on the left side and five on the right side of the weld. The punctures were spaced 3 diagonals apart in order not to affect each other.
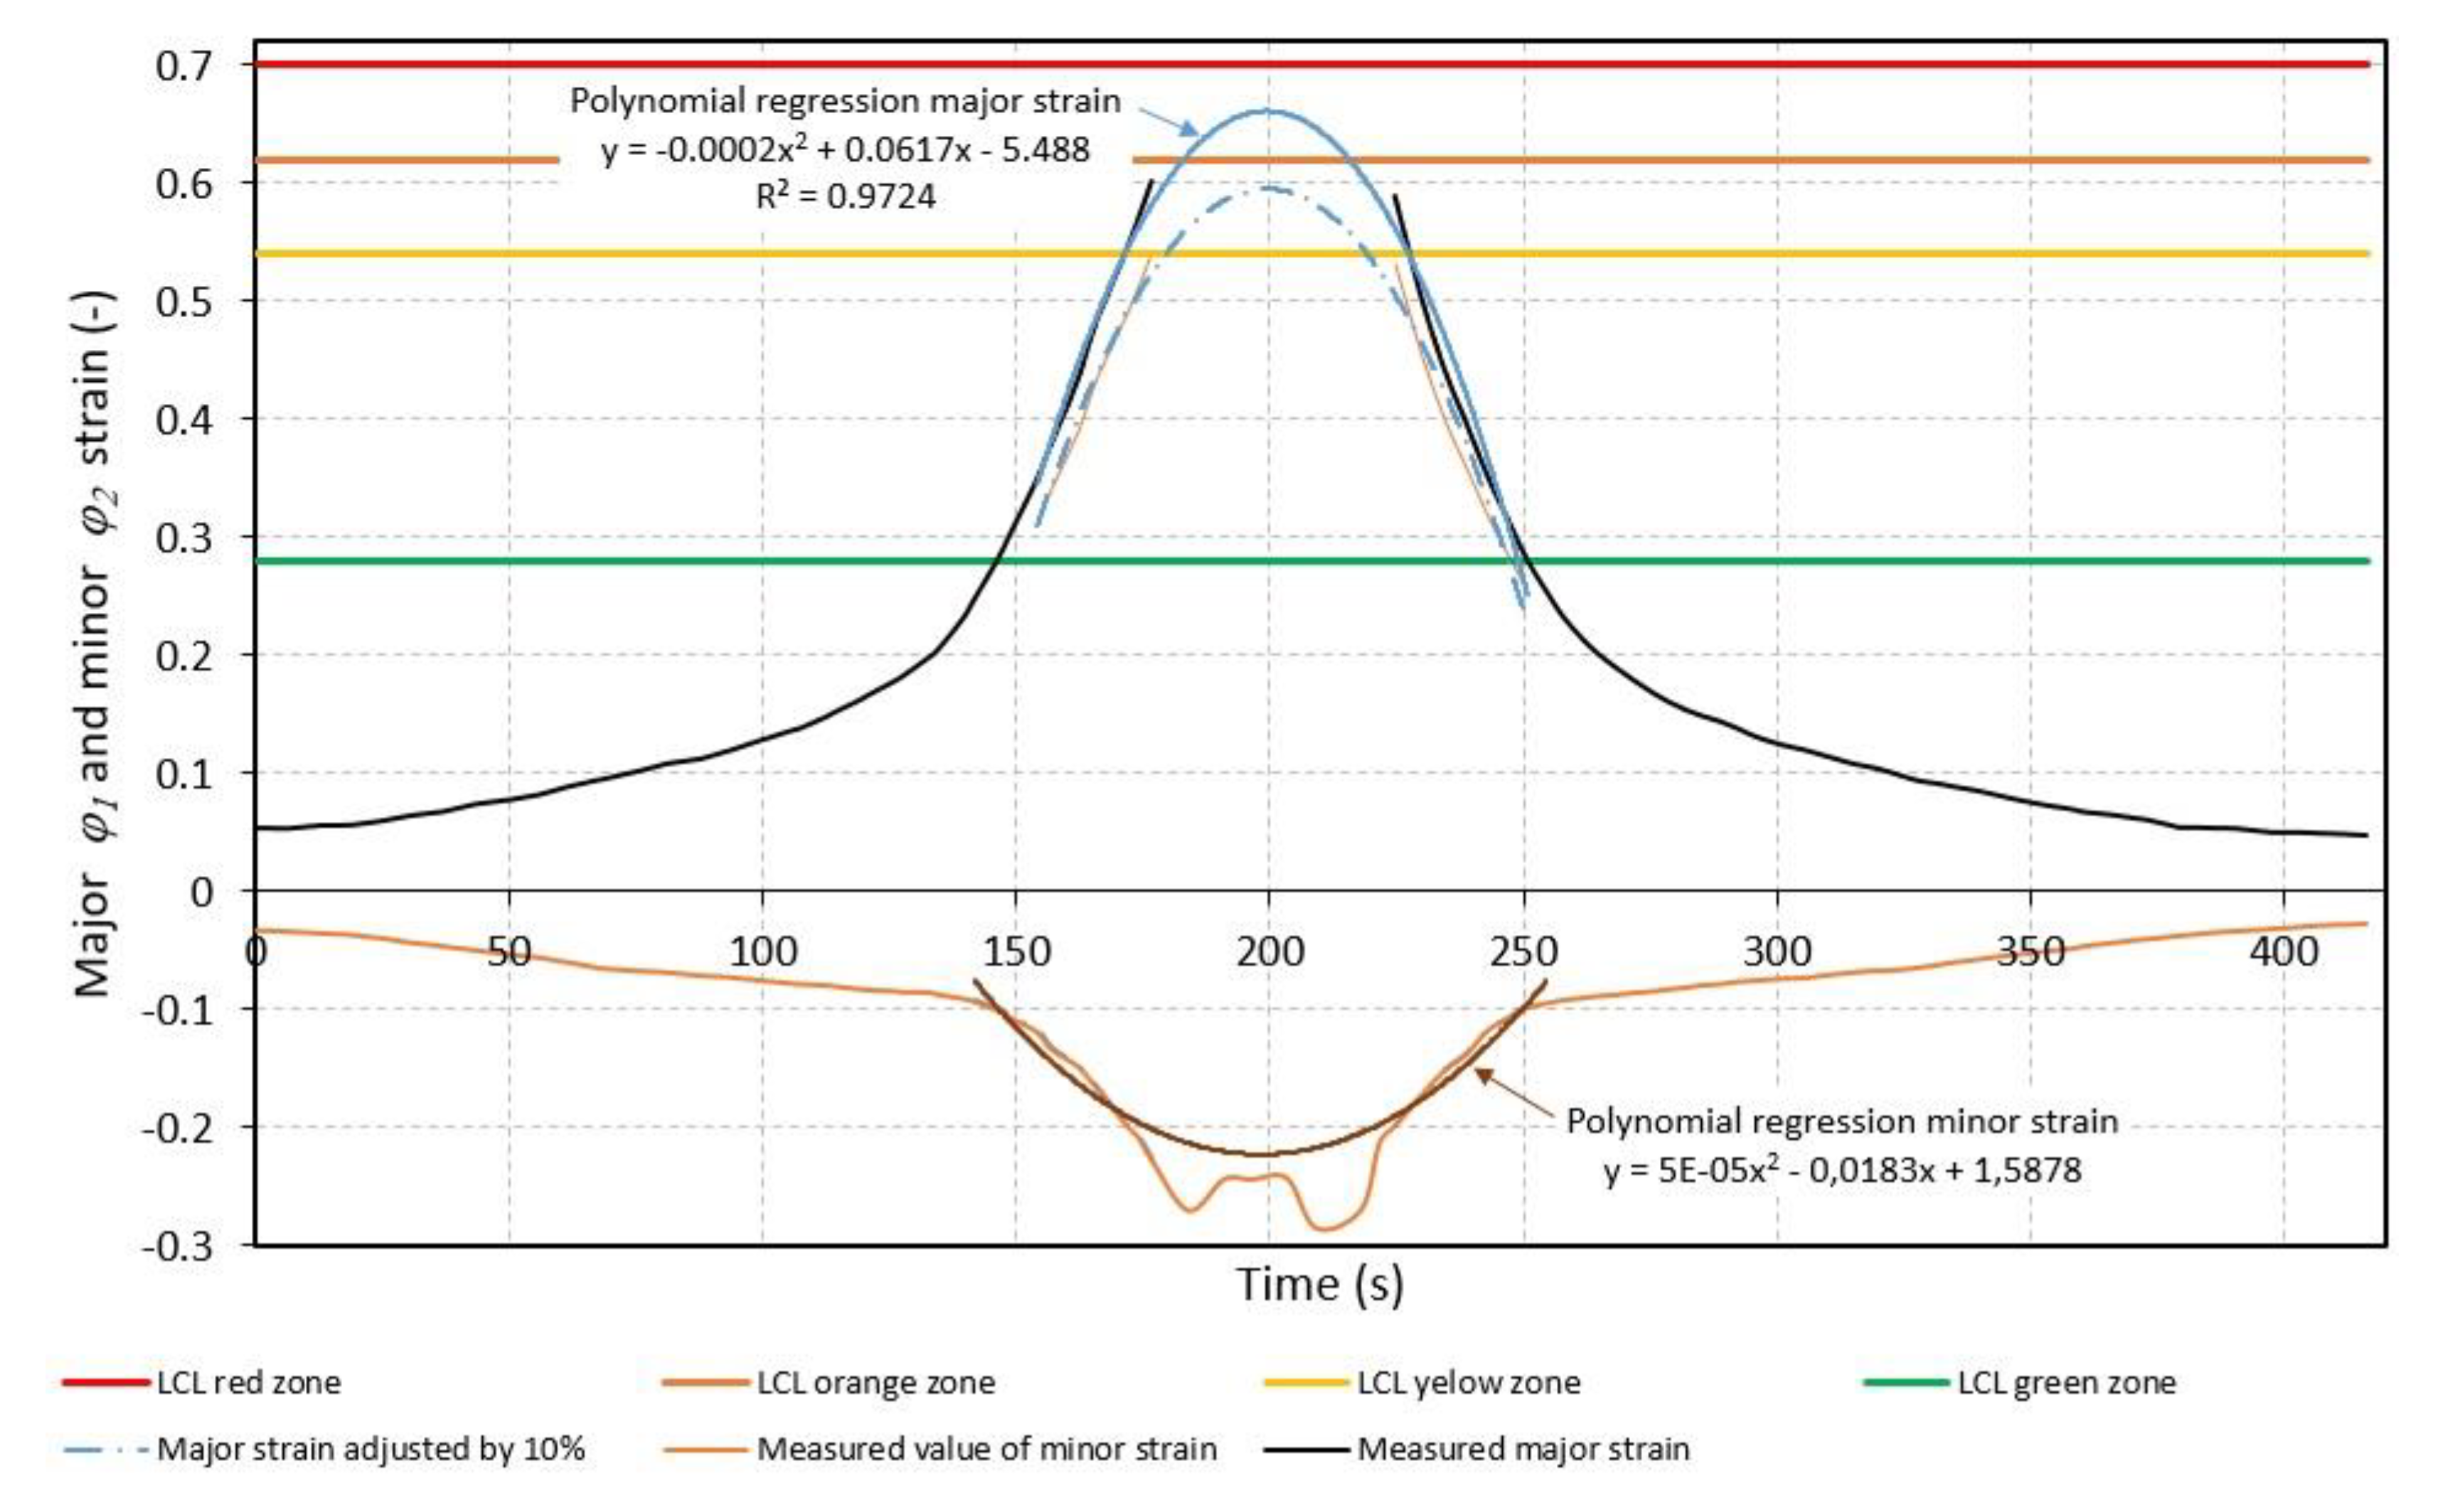
When choosing the method of determining the FLCs, we proceeded from the assumption that the values of the minor strain would range from 0 to −0.1 (i.e., in the second quadrant) (see
Figure 2). The strain state
β can be expressed as follows:
where
φ1i is the major strain in the plane of the sheet-steel blank and
φ2i is the minor strain in the plane of the sheet-steel blank.
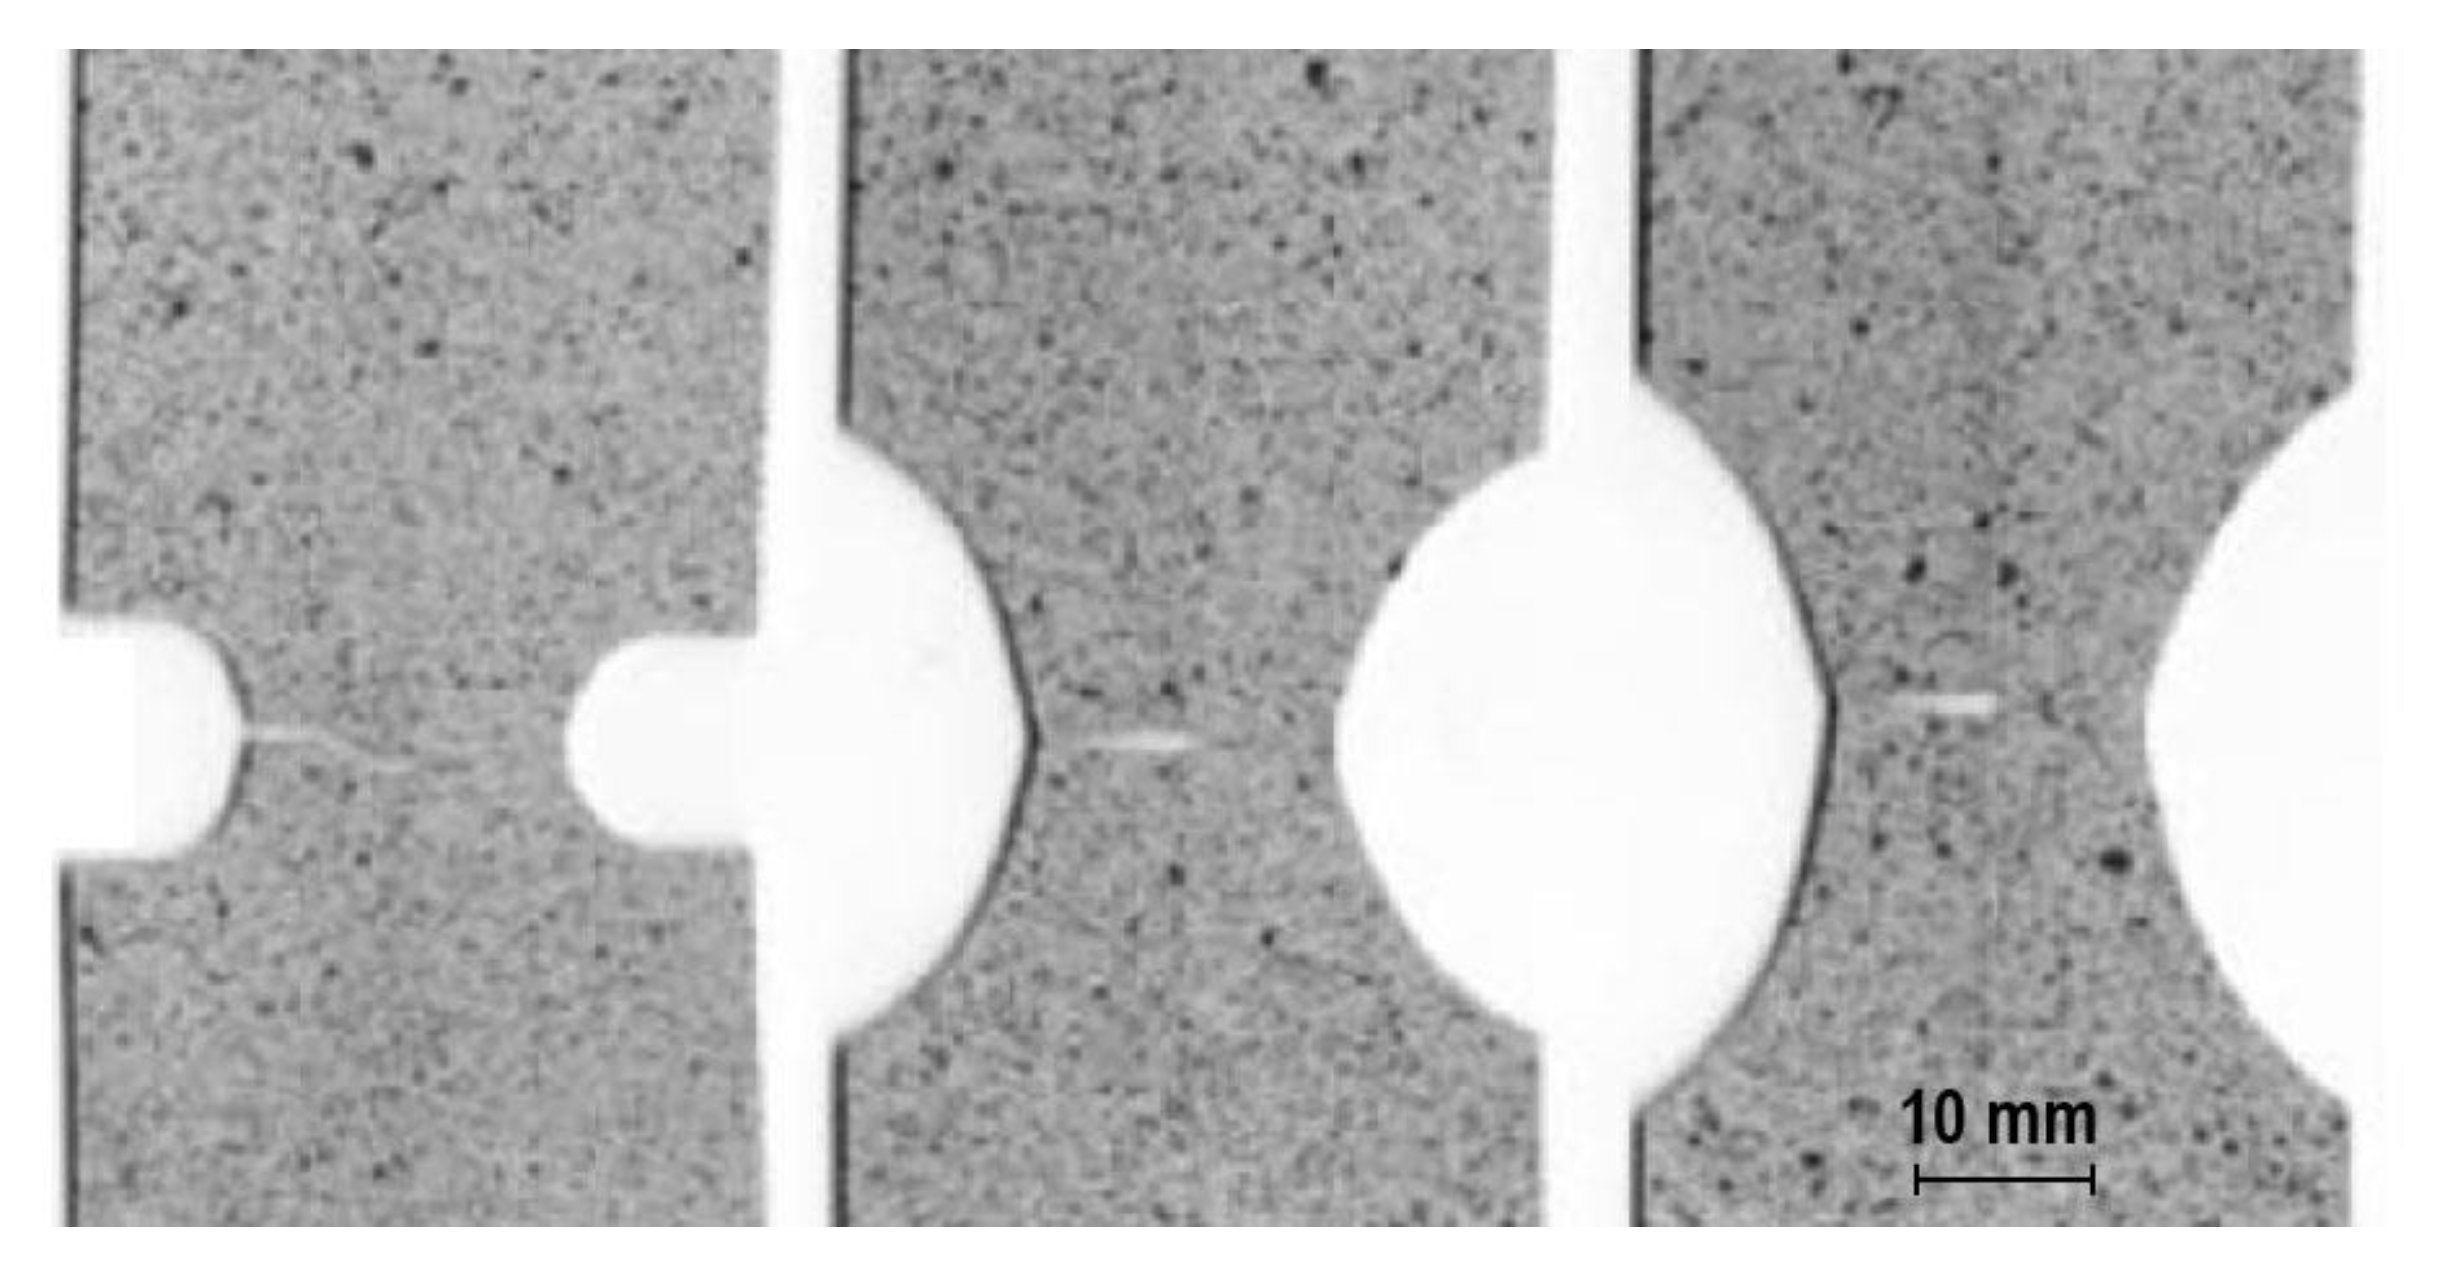
The strain state in the second quadrant
φ2 < 0 can be modeled via tensile testing using samples with different notch radii. Samples with notch radii of R5, R17, and R25 mm (
Figure 4) were made using wire electrical discharge machining AccuteX AU-500i (AccuteX Technologies Co., Ltd, Taichung City, Taiwan). The produced samples were degreased, and a pattern of black and white color was applied to their surface before the measurement, also called the pattern. The entire testing process was captured in real time using an ARAMIS 3D measurement system with two cameras (GOM GmbH, Braunschweig, Germany). The data were saved in a computer and then exported as a csv extension file.
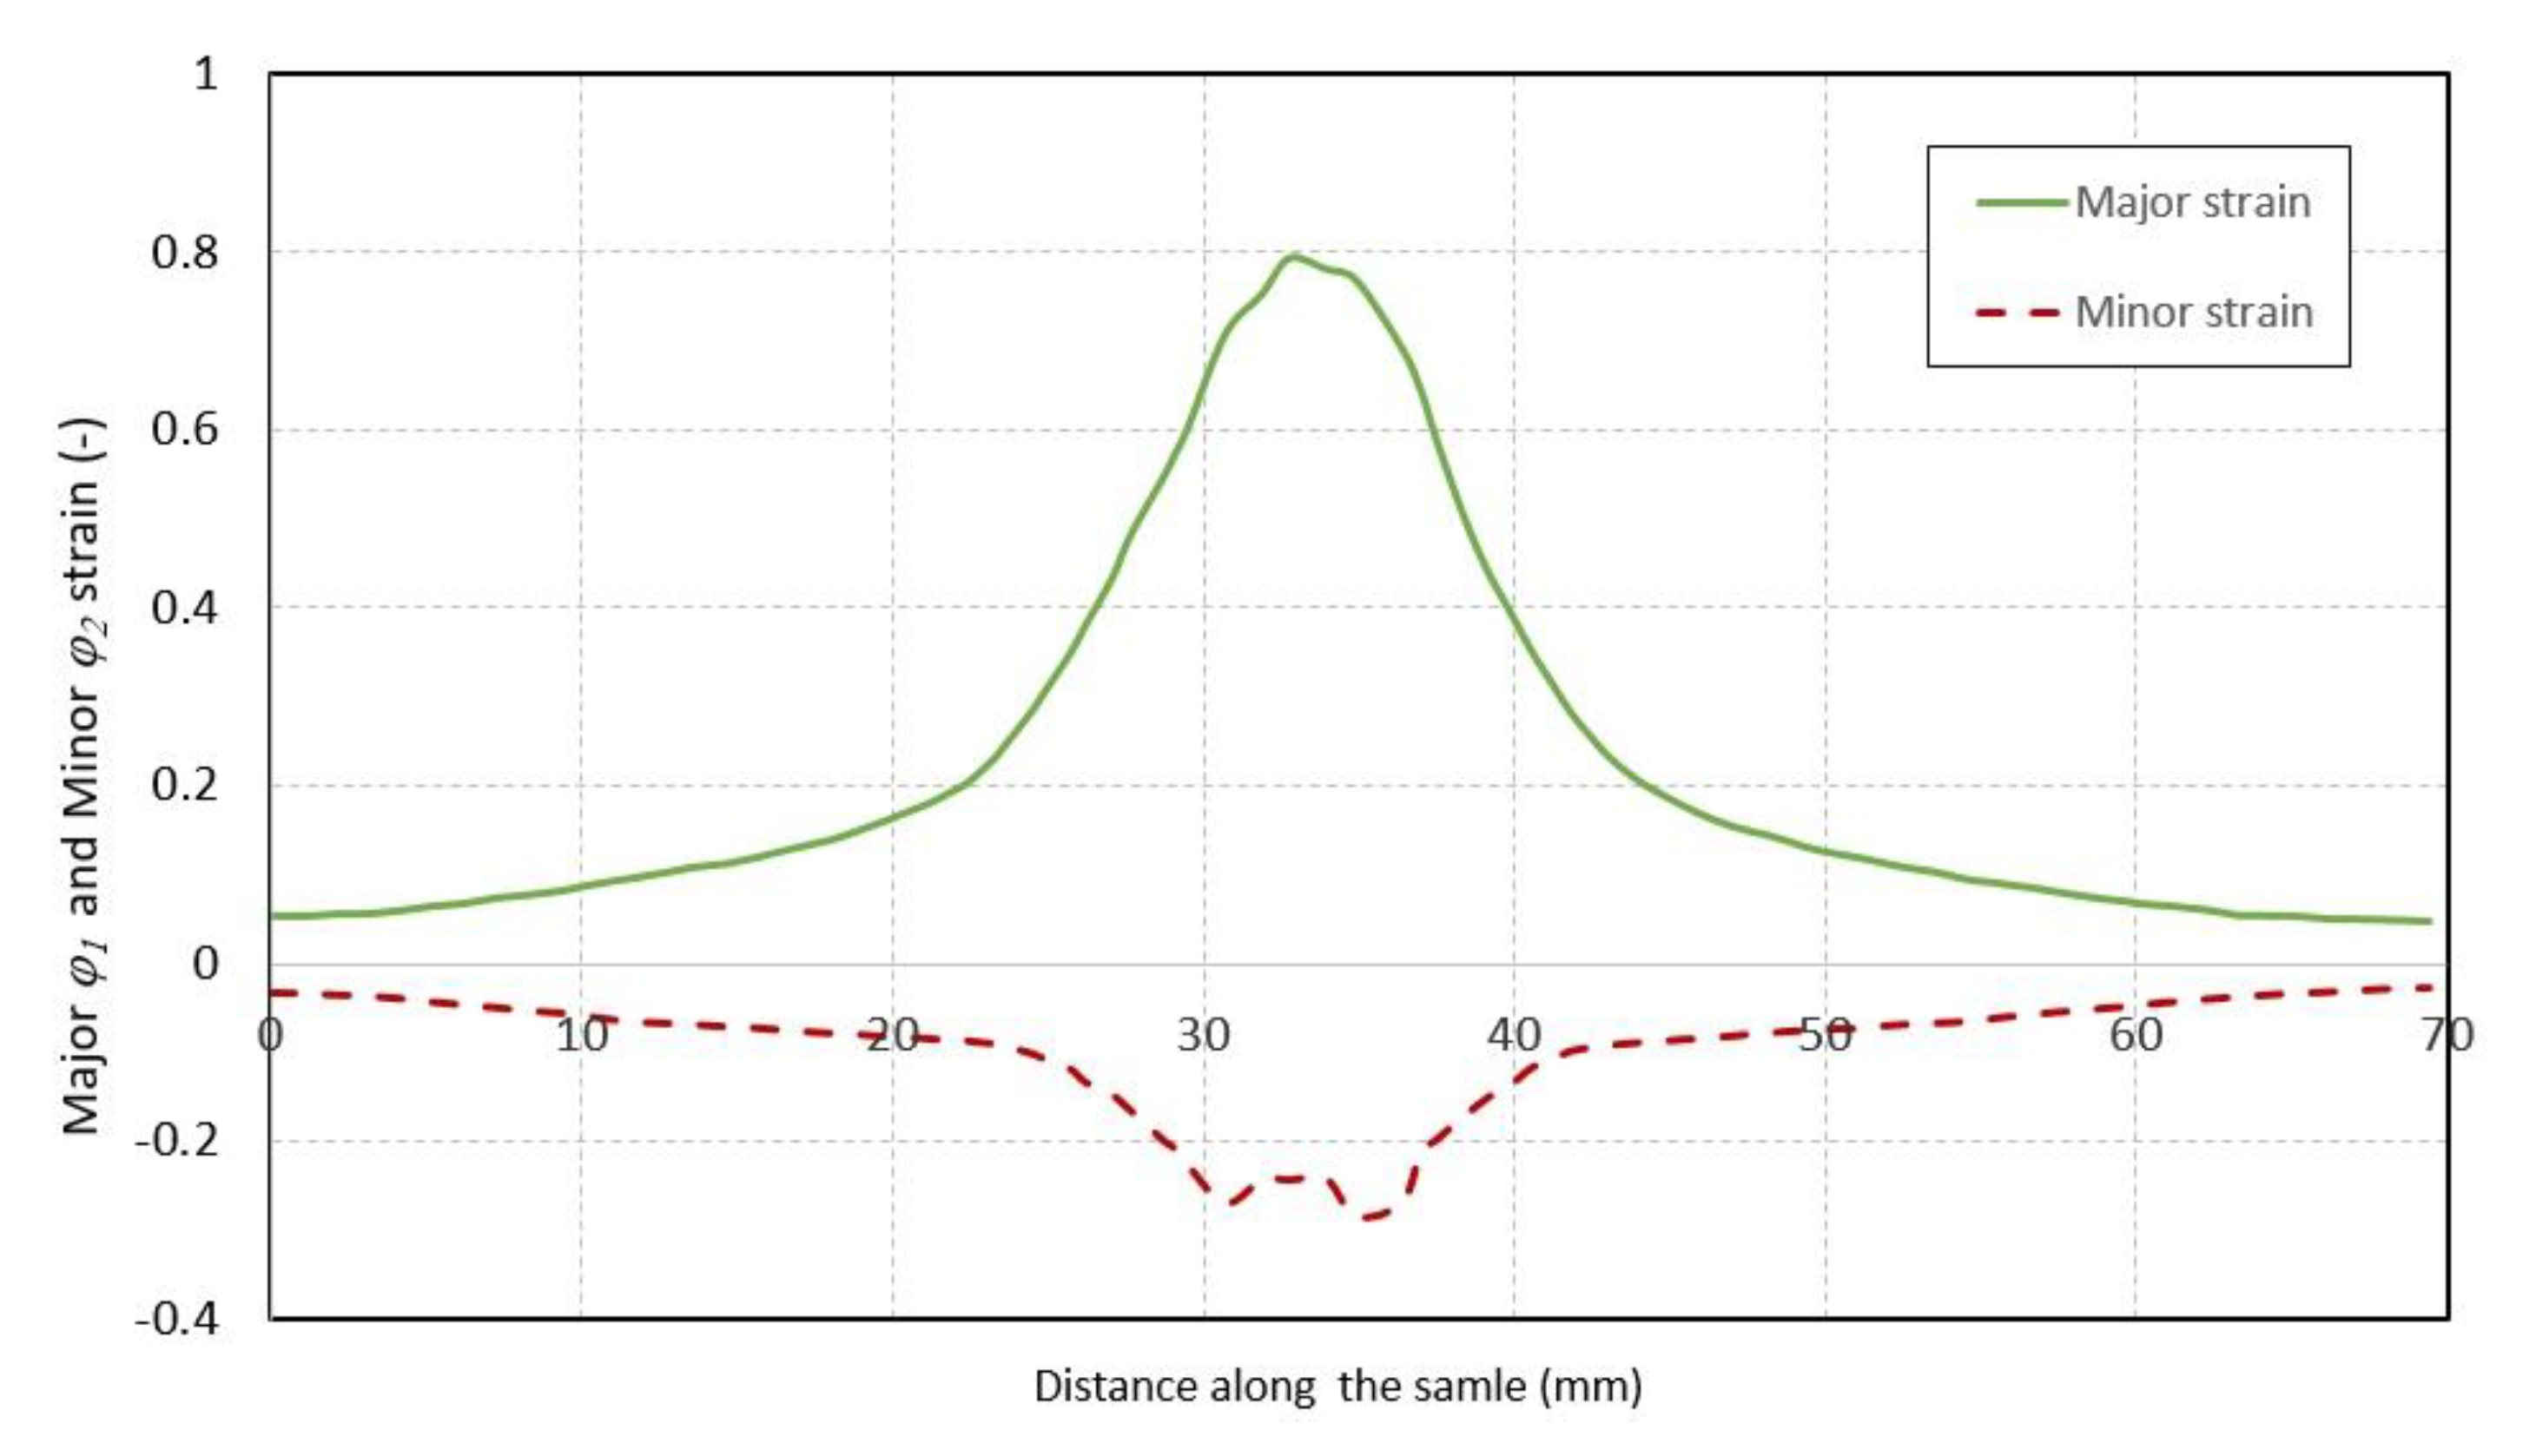
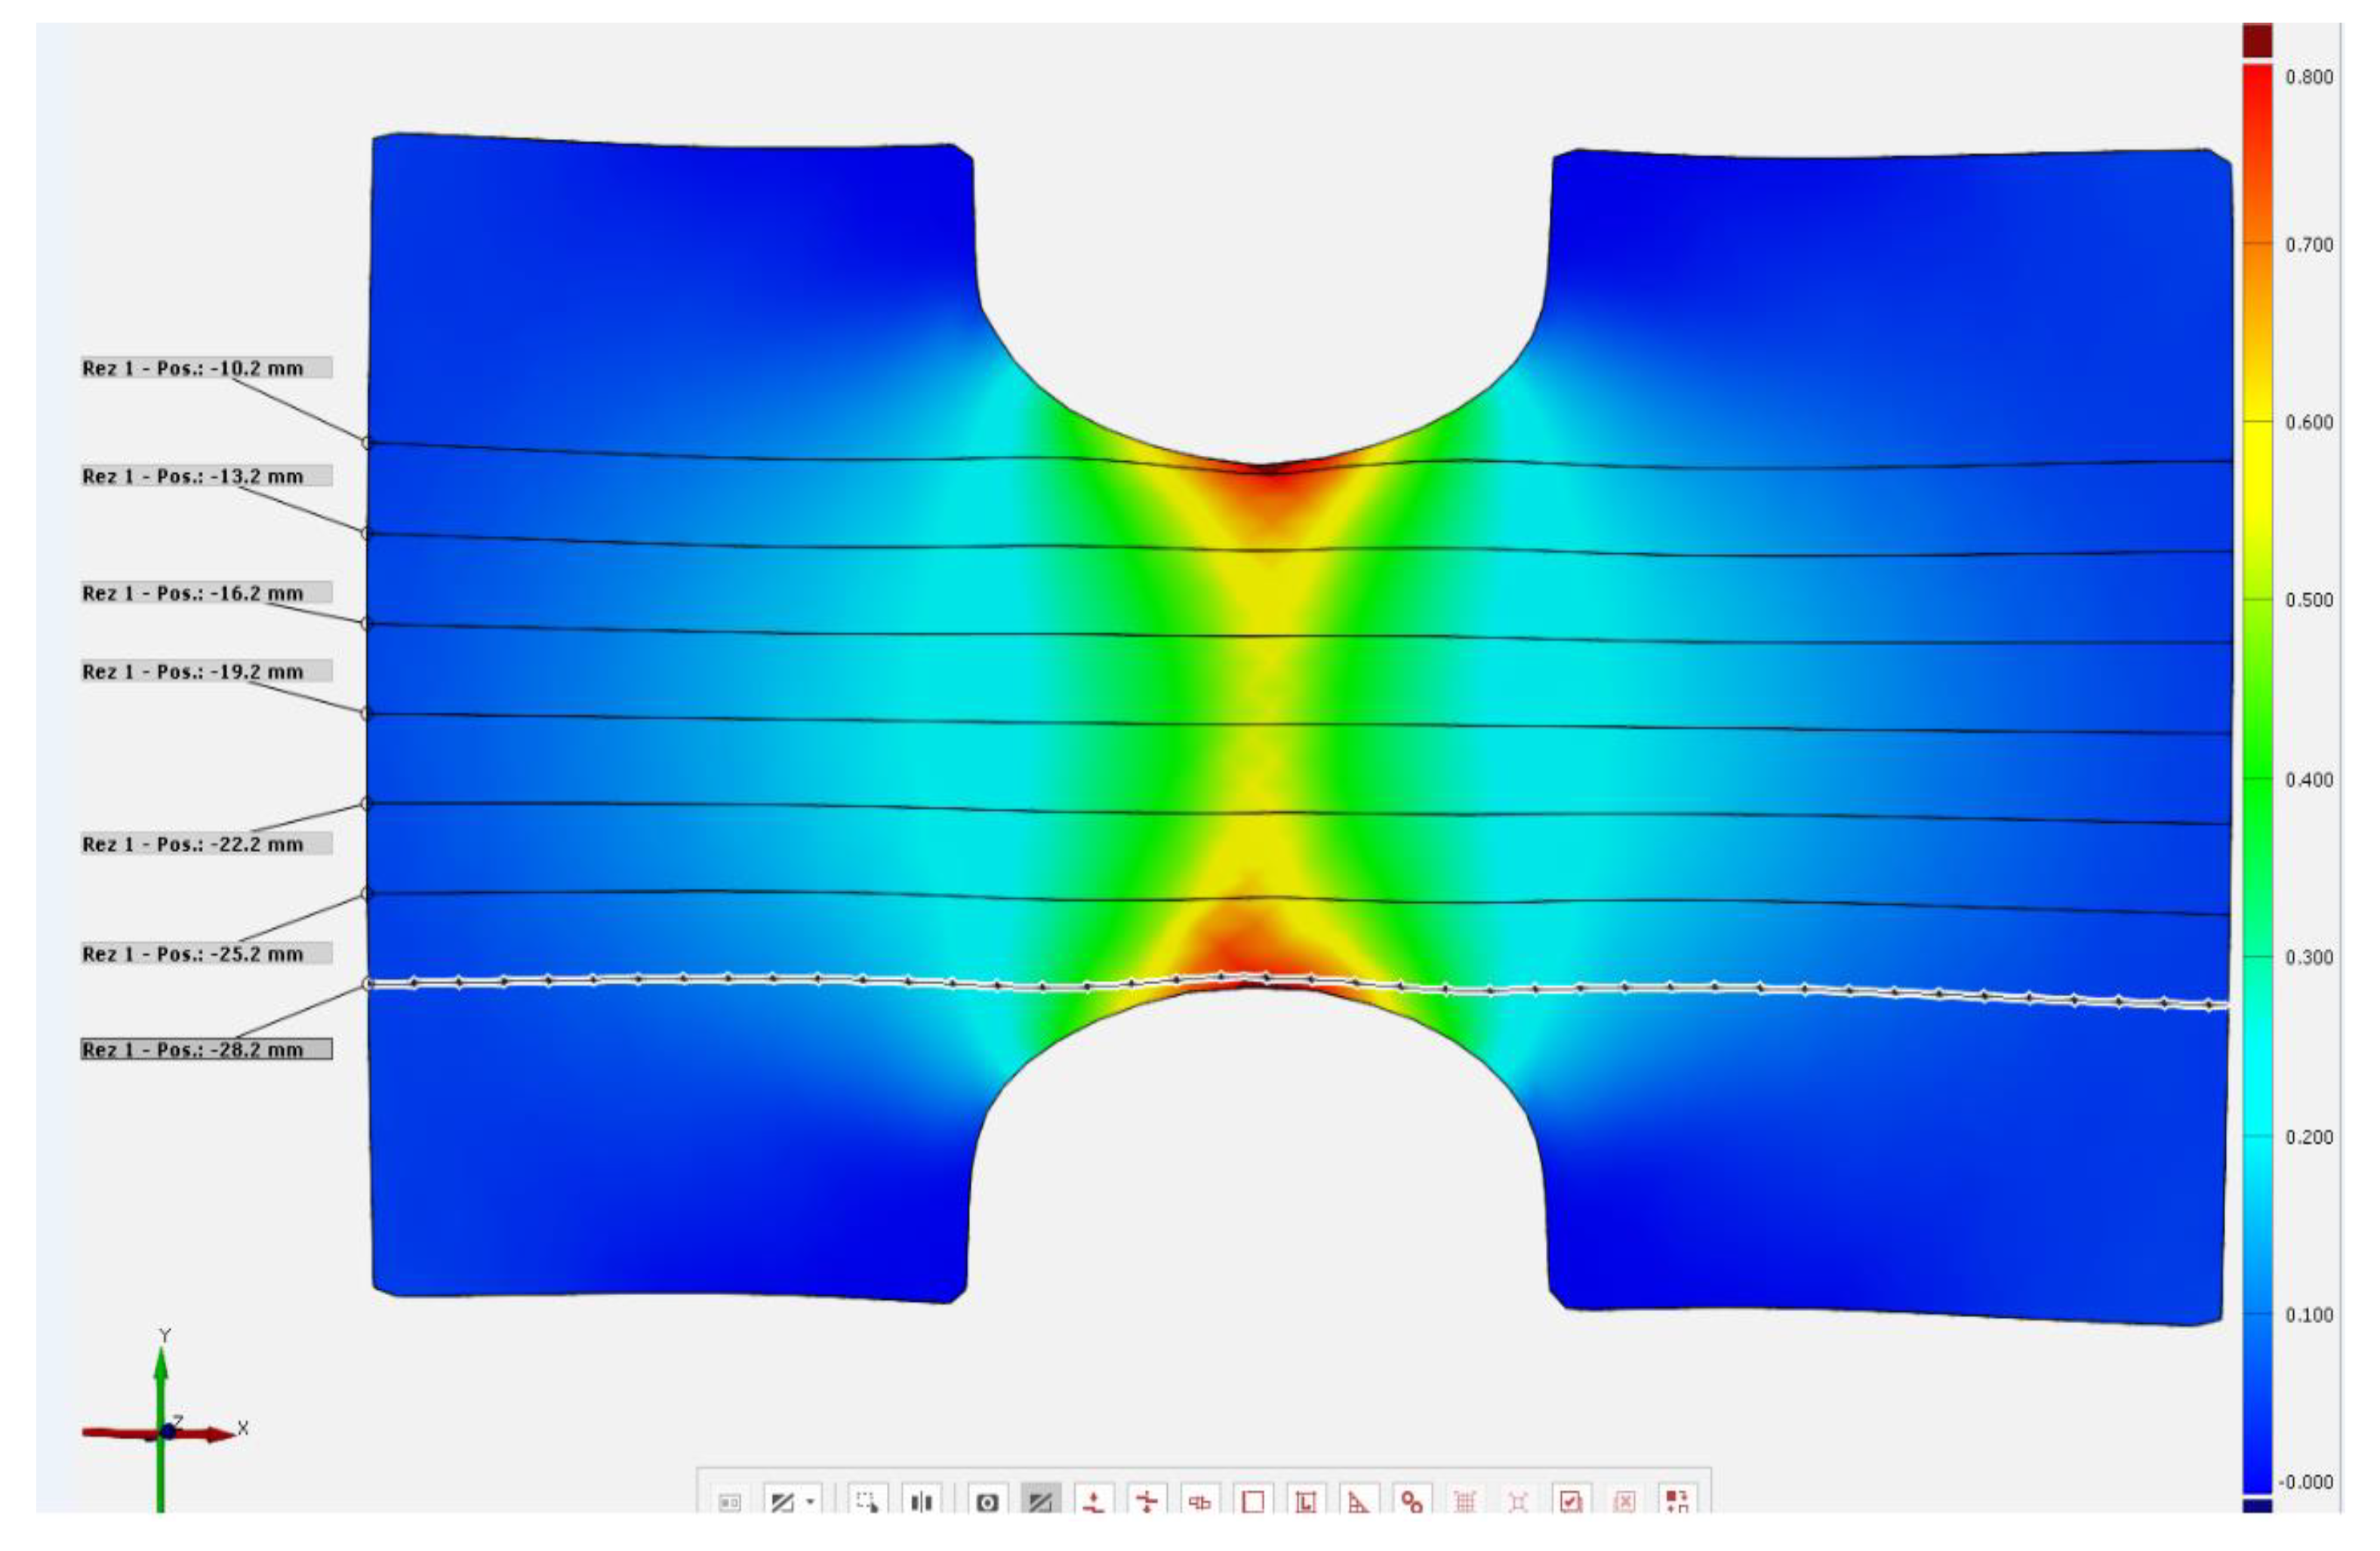
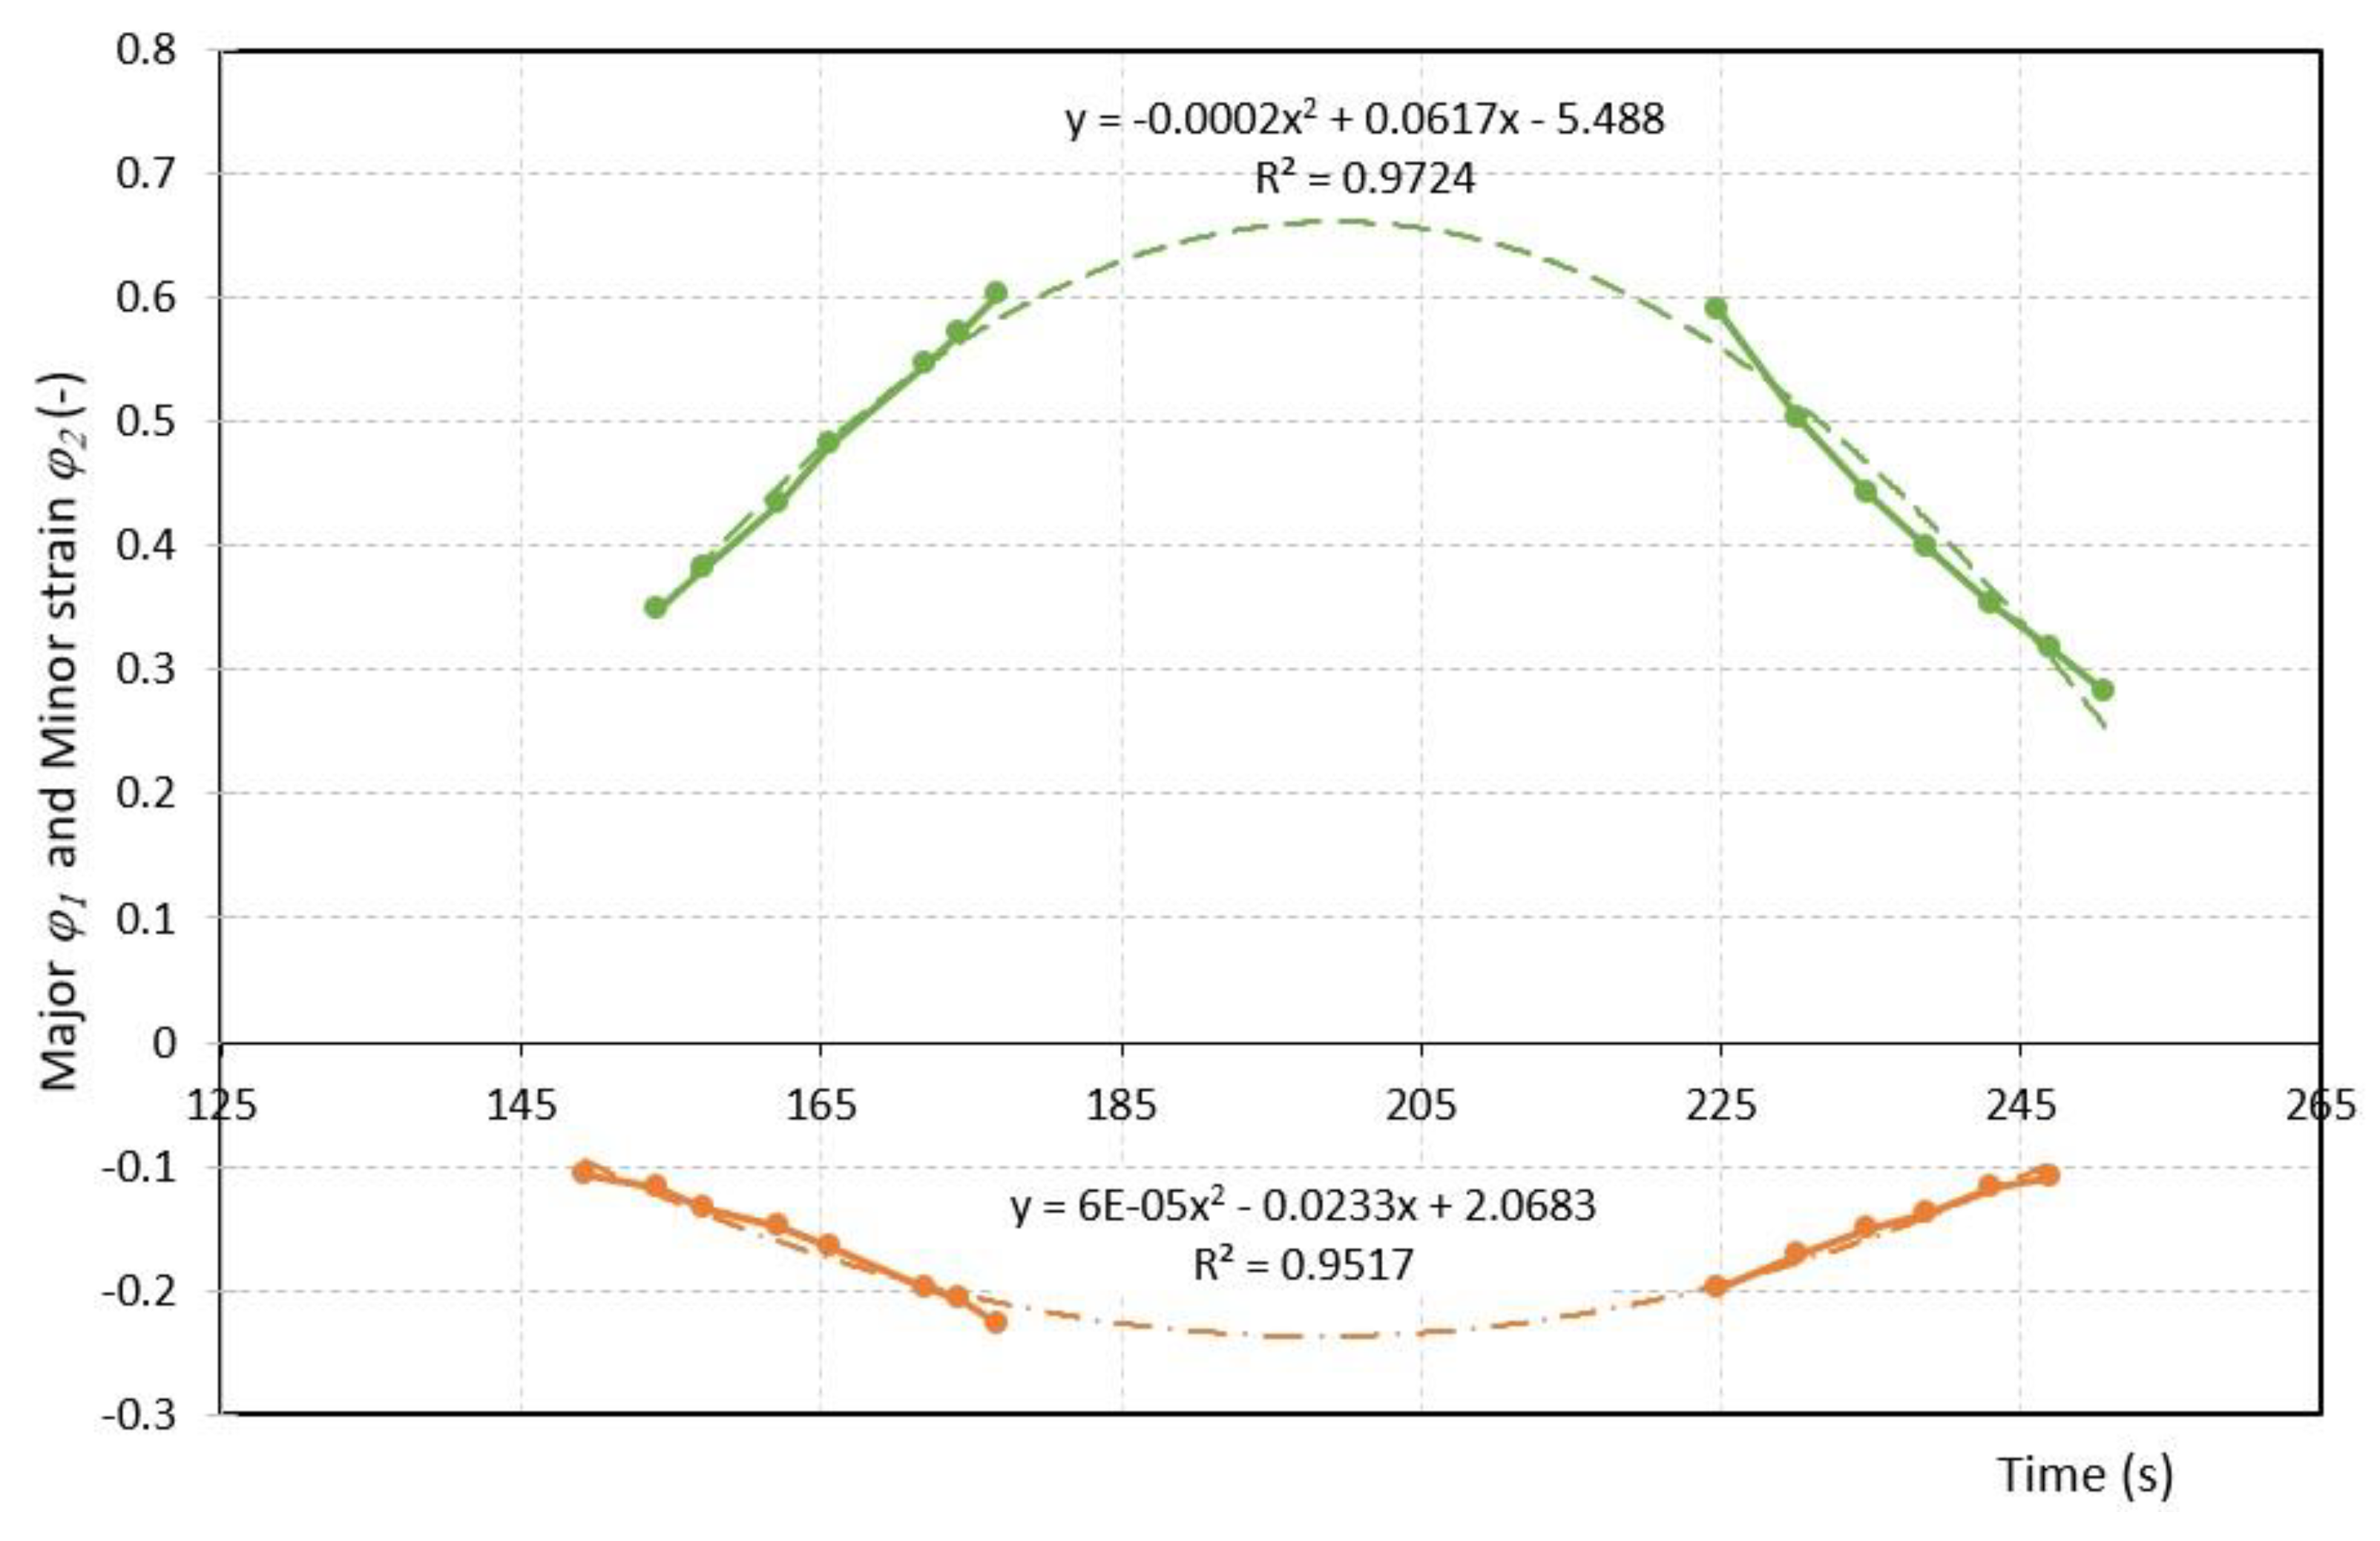
Evaluation of the major and minor strain magnitudes was performed in 7 sections of the sample image at the moment before the occurrence of failure (
Figure 5). In this paper, the evaluation procedure is described for one strain trace (one section at position 28.2 mm) only, on a sample made of AISI 304 material with a notch radius of R5 mm (
Figure 5). Along this section, the major strain
φ1 and the minor strain
φ2 were evaluated. Subsequently, the dependence of the major and minor strains on distance along the sample was found from the values measured (
Figure 6).
Various modifications of the methodologies for evaluating FLCs are described in [
30,
34]. These methodologies are widely accepted and are included in the standards (ISO 12004-1:2020 and ISO 12004-2:2008) for the evaluation of strains by the Aramis DIC system [
35,
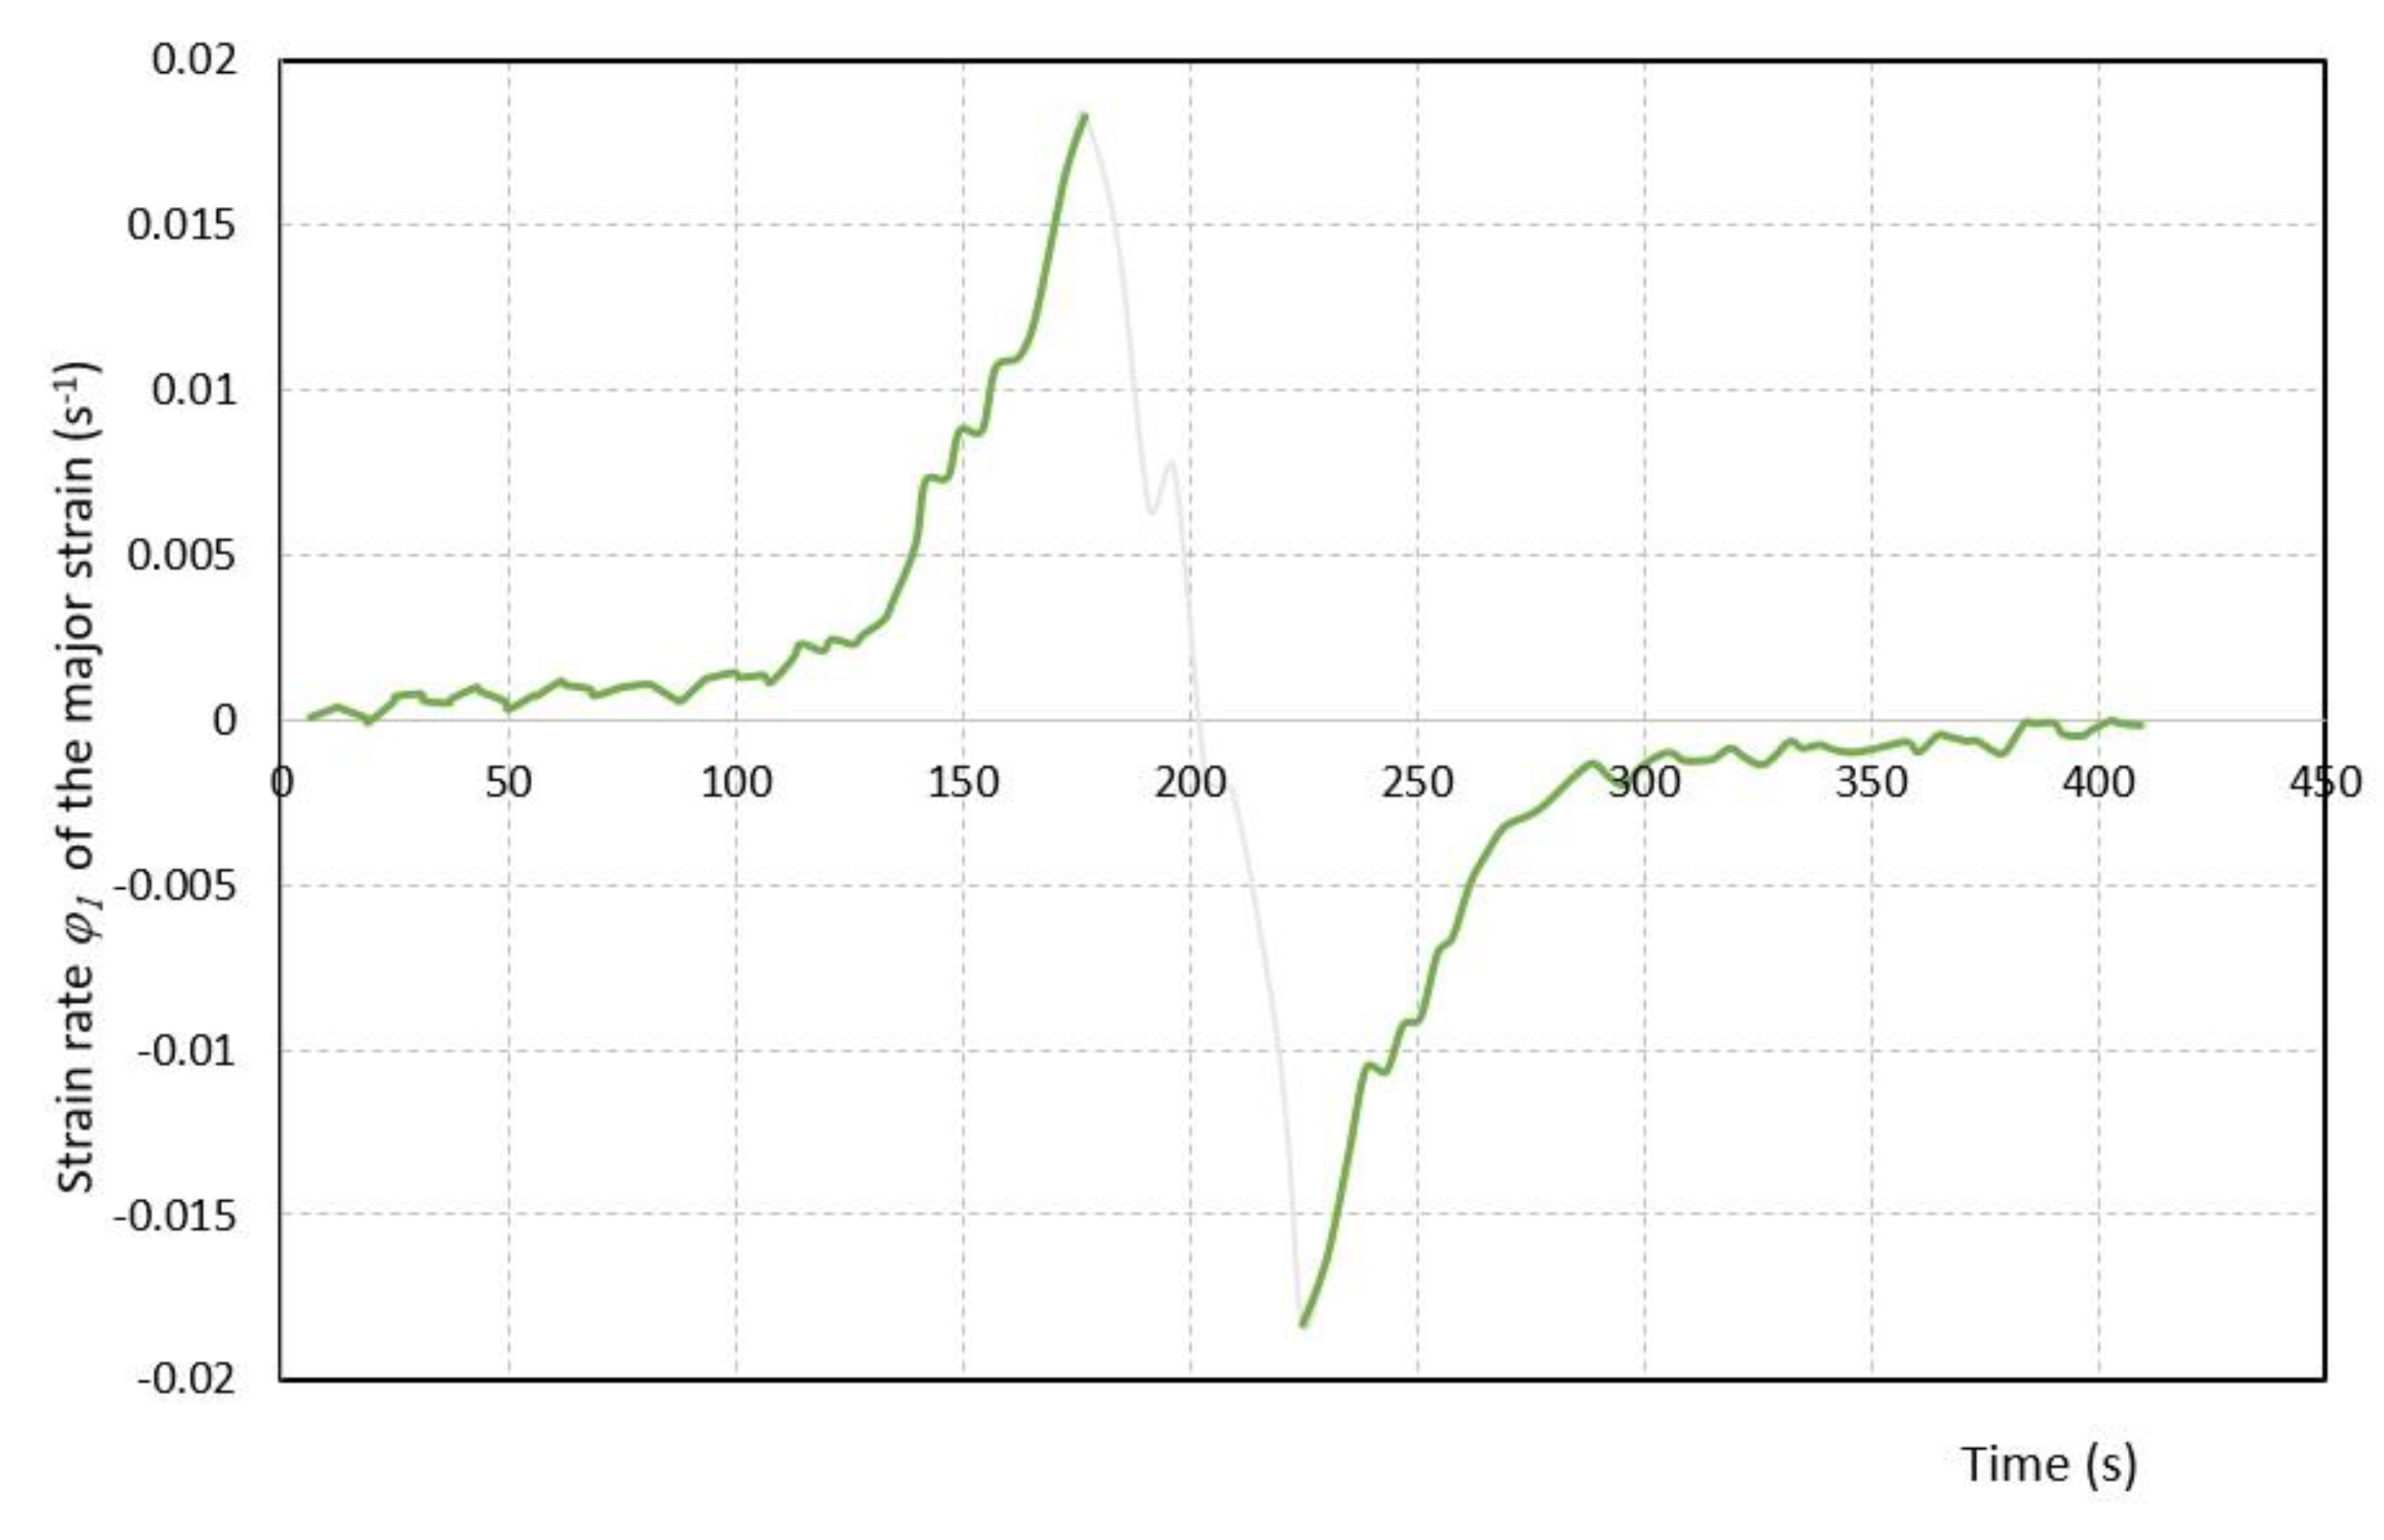
36]. To determine the limit state, it is necessary to determine the internal and external points on the curve. The internal points on the curve were determined as the local maxima of the dependence of the strain rate on time in the direction of the sample’s thickness, according to Equation (5).
The internal points on the curve correspond to the moment when the strain rate, in the direction of the sample’s thickness, reached the local maximum or minimum. These points were filtered out and were not included in the analysis (
Figure 7). The curve with the points filtered out is shown in
Figure 7 marked in gray.
Subsequently, the number of points on the outer left and outer right sides of the curve were determined according to Equations (6)–(8), which were also filtered out and not included in the analysis (
Figure 8). Evaluated values of major and minor strain are shown in
Table 5.
where:
w is the number of points to be included in the analysis;
φ1l, φ1r are the values of the inner point on the left (l) and right side (r) of the curve φ1;
φ2l, φ2r are the values of the inner point on the left (l) and right side (r) of the curve φ2;
φ1m, φ2m are the average values of the extreme points on the curves for φ1 and φ2.
Figure 8.
Dependence of the major and the minor strain on time without the filtered-out points.
Table 5.
Minimum strain values measured at the onset of fracture formation and at the onset of necking in the base material and the laser-welded material.
| Material | Plane Number |
|---|
| 5 | 15 | 25 |
|---|
| φ1 | φ2 | FLD0 | φ1 | φ2 | FLD0 | φ1 | φ2 | FLD0 |
|---|
| Base material AISI 304 | 0.560 | −0.200 | 0.360 | 0.515 | −0.180 | −0.335 | 0.470 | −0.125 | 0.320 |
| STDEV | 0.030 | 0.018 | – | 0.025 | 0.020 | – | 0.026 | 0.022 | – |
| Laser welded AISI 304 | 0.570 | −0.210 | 0.360 | 0.502 | −0.163 | −0.339 | 0.480 | −0.143 | 0.337 |
| STDEV | 0.025 | 0.015 | – | 0.024 | 0.021 | – | 0.028 | 0.020 | – |
| Base material AISI 430 | 0.355 | −0.165 | 0.190 | 0.350 | −0.150 | 0.200 | 0.260 | −0.065 | 0.195 |
| STDEV | 0.027 | 0.018 | – | 0.021 | 0.019 | – | 0.025 | 0.024 | – |
| Laser welded AISI 430 | 0.105 | −0.062 | 0.043 | 0.096 | −0.042 | 0.054 | 0.075 | −0.045 | 0.050 |
| STDEV | 0.025 | 0.015 | – | 0.020 | 0.016 | – | 0.019 | 0.020 | – |
3. Results and Discussion
These austenitic and ferritic stainless steels are most commonly used in the automotive industry for thin-walled exhaust-system components, but their applications in body components (body-in-white (B-I-W) components) are limited due to higher costs compared to conventional coated steels. From the manufacturability point of view, formability is an important characteristic. The aim of the research was to assess the influence of laser welding on the formability of austenitic stainless steel AISI 304 and ferritic stainless steel AISI 430.
The suitability of the applied welding modes was evaluated on the basis of the macrostructure, with a welding speed of 100 mm·s
−1 and power of 2500 W, a welding speed of 70 mm·s
−1 and power of 2100 W, and a welding speed of 50 mm·s
−1 and power of 1700 W, respectively. Of the welding modes applied, the most suitable for the AISI 304 material was found to be the mode with a speed of 50 mm·s
−1 at a laser power of 1700 W (
Table 3). Based on the results obtained, it can be stated that in terms of the welded joint quality, the most suitable welded joints were obtained under modes with lower power and lower welding speed.
As was mentioned in the introduction, the formability can be assessed from the values of the mechanical properties of yield strength, tensile strength, uniform tensibility, tensibility, strain-hardening exponent, and normal anisotropy ratio. The comparison of the mechanical properties given in
Table 4 shows that the laser-welded samples of AISI 430 LW produced higher values of yield strength, lower values of tensile strength, uniform tensibility and tensibility, and no significant changes in the normal anisotropy ratio and strain-hardening exponent compared to the values found in the base samples of AISI 430 BM. Sommer et al. [
37] observed a similar trend for AISI 430. After welding, the values of uniform tensibility and tensibility decreased. In the case of the study performed by Sommer et al. [
37], the differences in tensibility were not as significant as in our case. It should be noted that in our research, the samples of AISI 430 material were not thermomechanically processed before or after welding. In our case, we assume that the differences in tensibility may be due to the size of the grains, the amount of martensite formed, and differences in the conduction of the welded joints. Sommer et al. used samples where the weld ran across the sample, and in our case the weld ran alongside the sample. In samples made of AISI 304 LW, the changes in yield strength, tensile strength, uniform tensibility, tensibility, strain-hardening exponent, and the ratio were normal compared to the AISI 304 BM base material, within the scattering limit. It follows from the above that the formability of the AISI 304 LW material should not deteriorate after laser welding of the AISI 304 BM base material.
The true-stress–true-strain curves show a better prediction of the formability of the material than the agreed engineering characteristics of materials
Re, tensile strength
Rm, uniform tensibility, and tensibility. The actual stress can be calculated according to Equation (9) [
33,
38]:
and the actual strain according to Equation (10):
where
FTrue is the true force,
σTrue is the true stress in MPa,
φTrue is the true strain, and
εeng is the engineering strain.
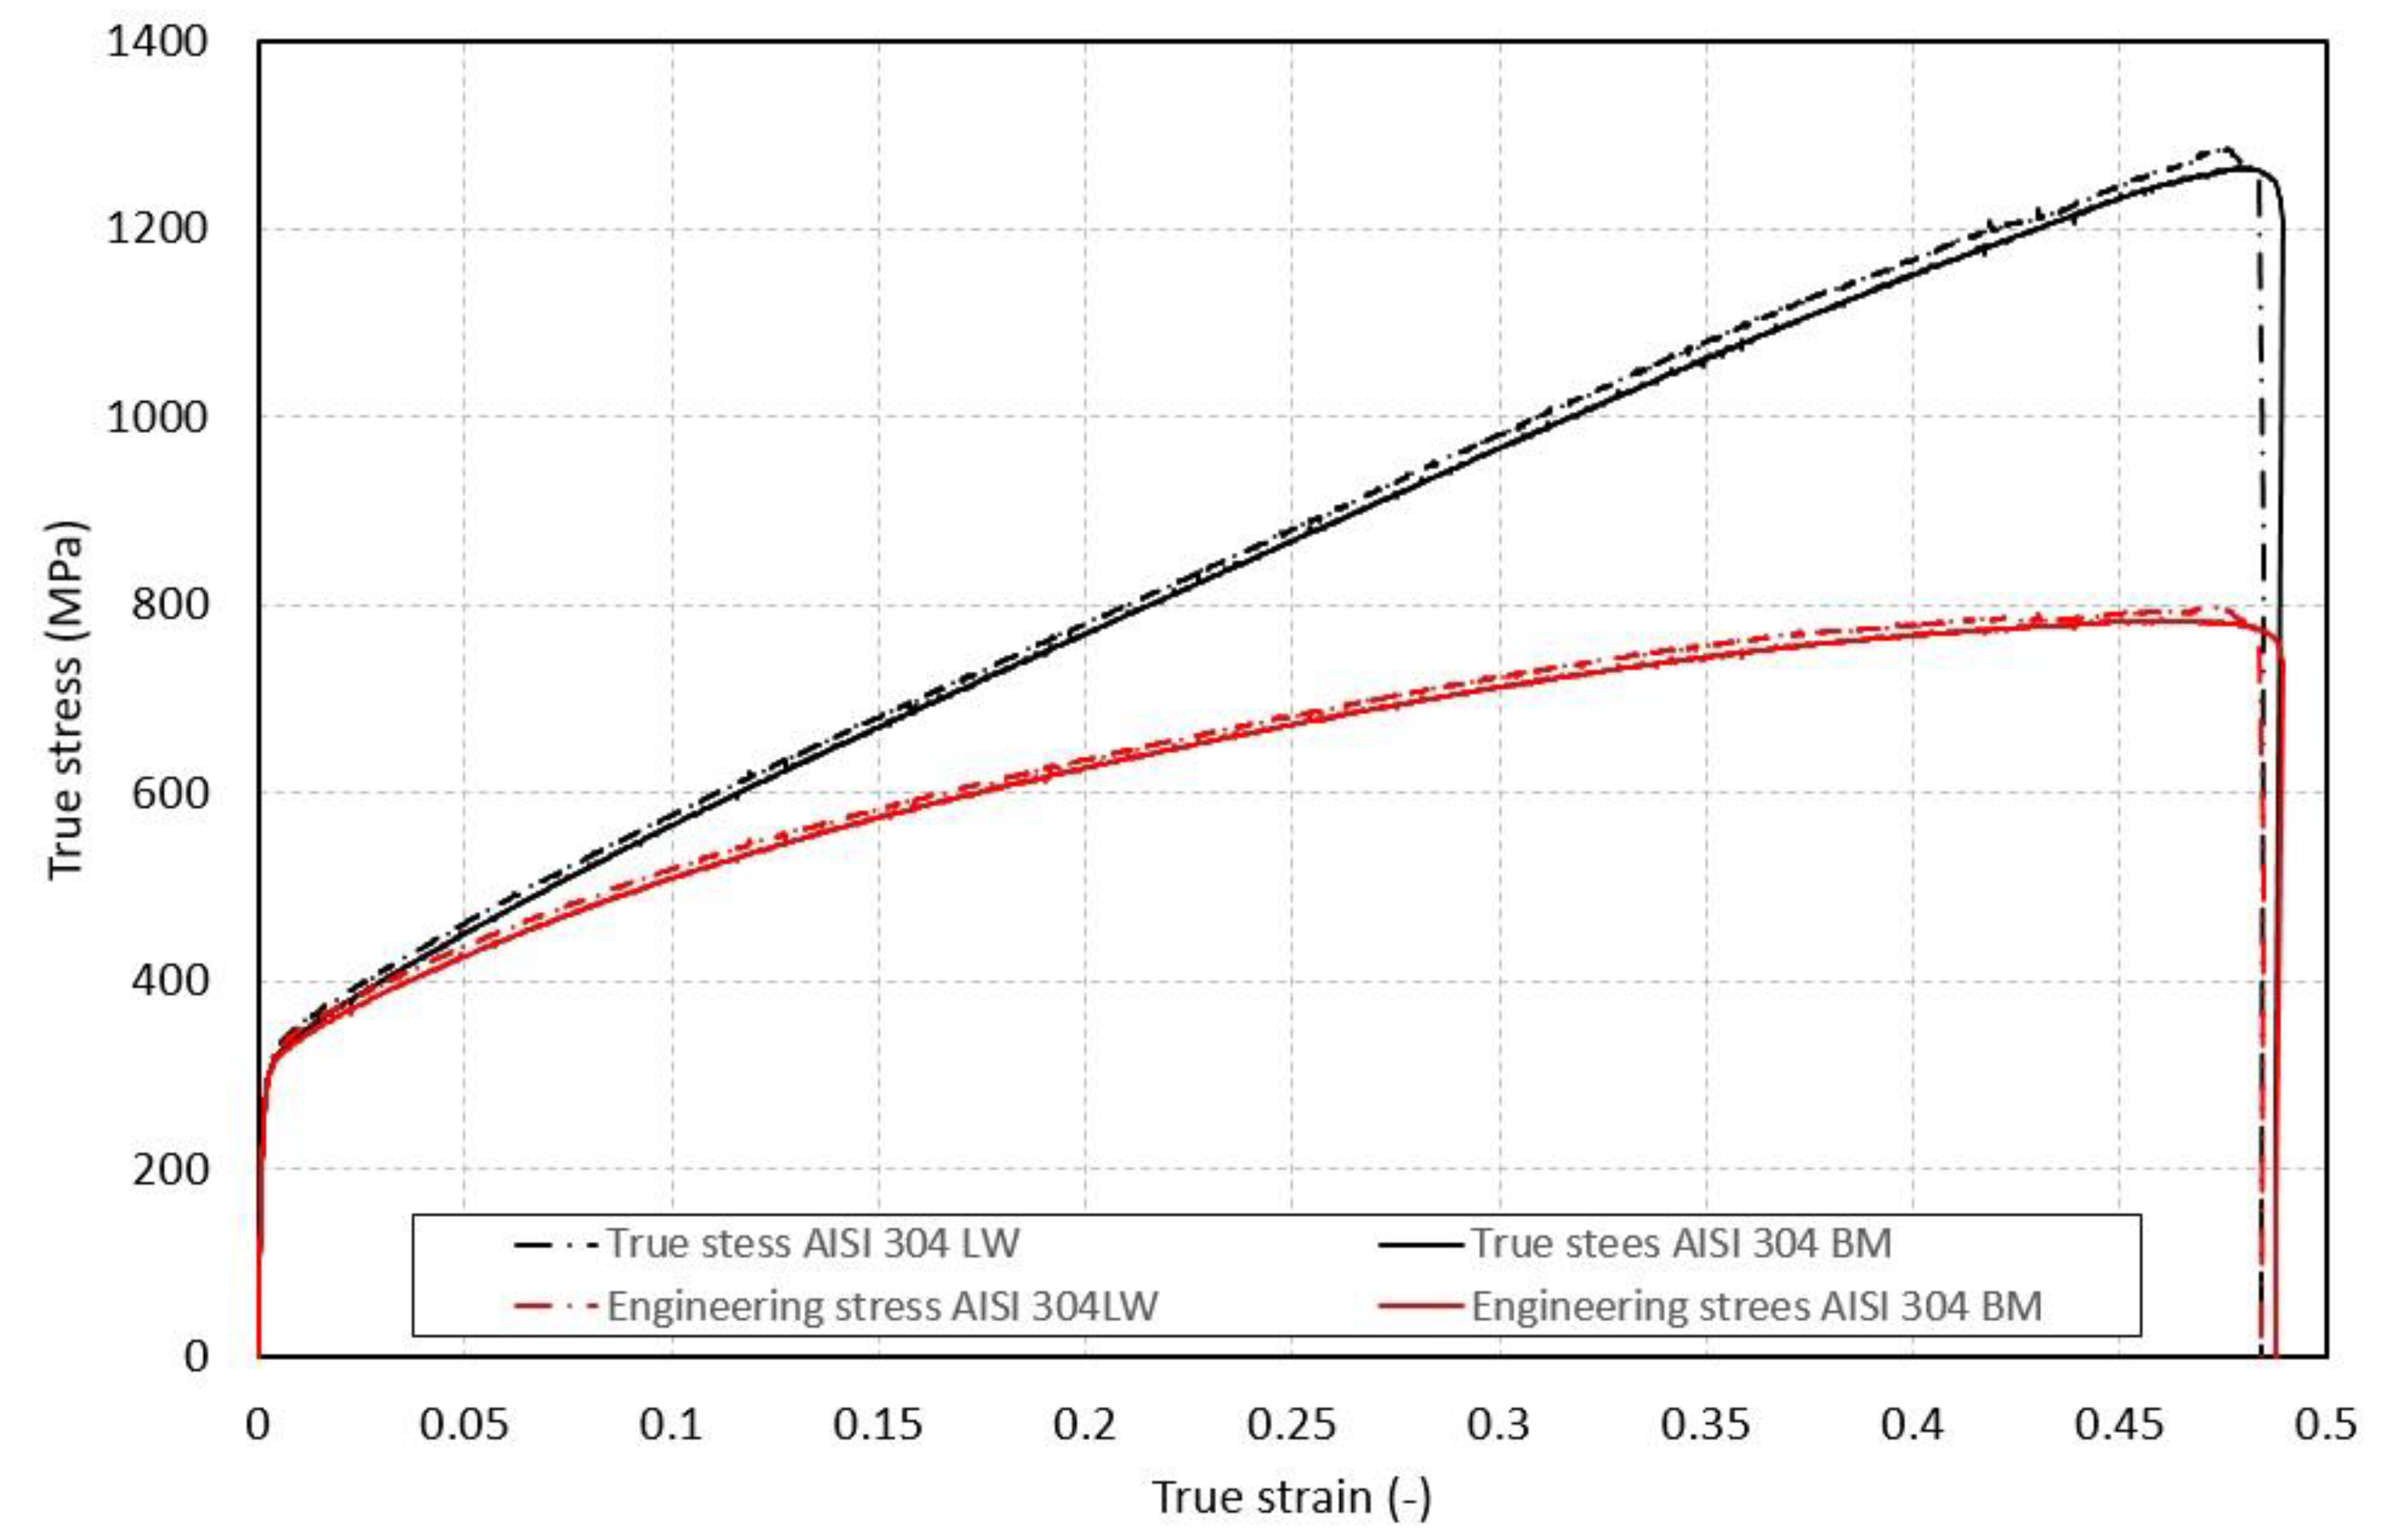
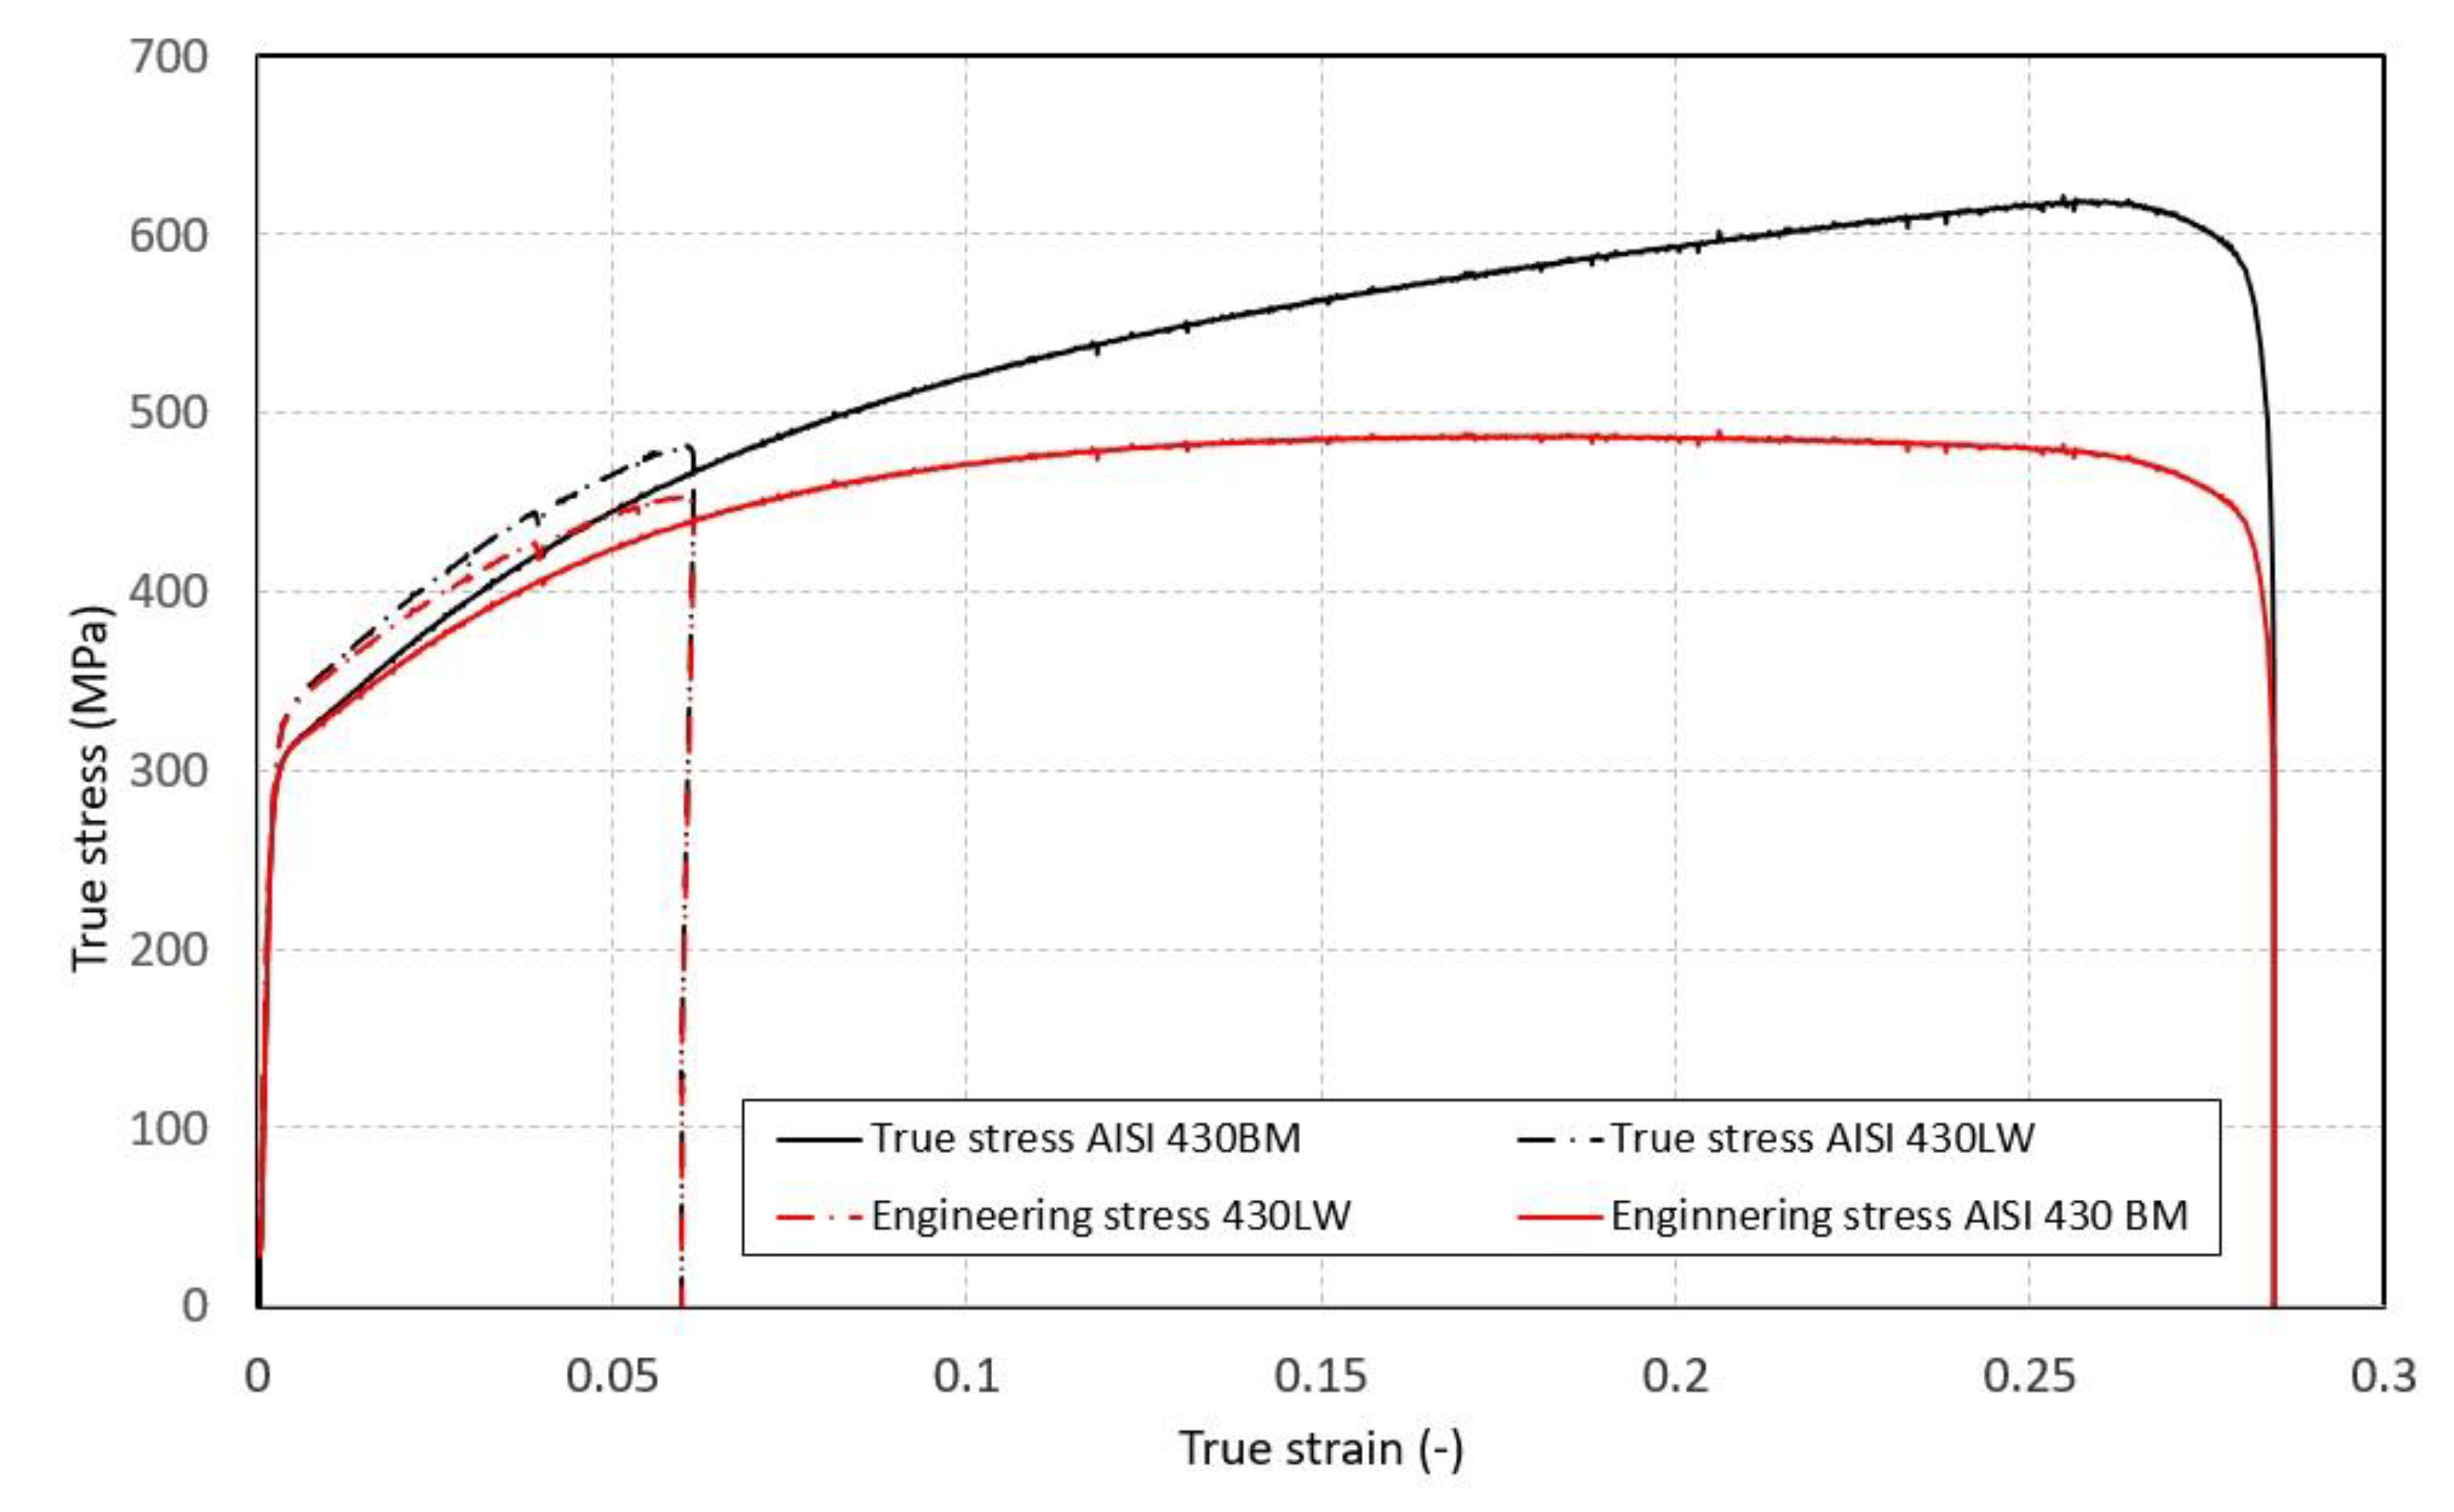
The area under the curve of the actual stress dependence on strain expresses the actual deformability of the material, while the engineering curve agreed on in terms of standards is related to the initial cross section of the sample and does not express the actual deformability. A comparison of the areas under the curves of the actual stress dependence on strain shows that the area under the curve of the AISI 430 BM base material is significantly larger than that under the curve of the actual stress dependence on the actual strain of the AISI 430 BM base material (
Figure 9). This means that a significant deterioration in formability occurs in AISI 430 LW after laser welding. It should also be noted that for the same strain (e.g., a strain of 0.05), the laser-welded samples of the AISI 430 BM material required approximately 20 MPa greater actual stress than the samples of the AISI 430 BM base material (
Figure 9).
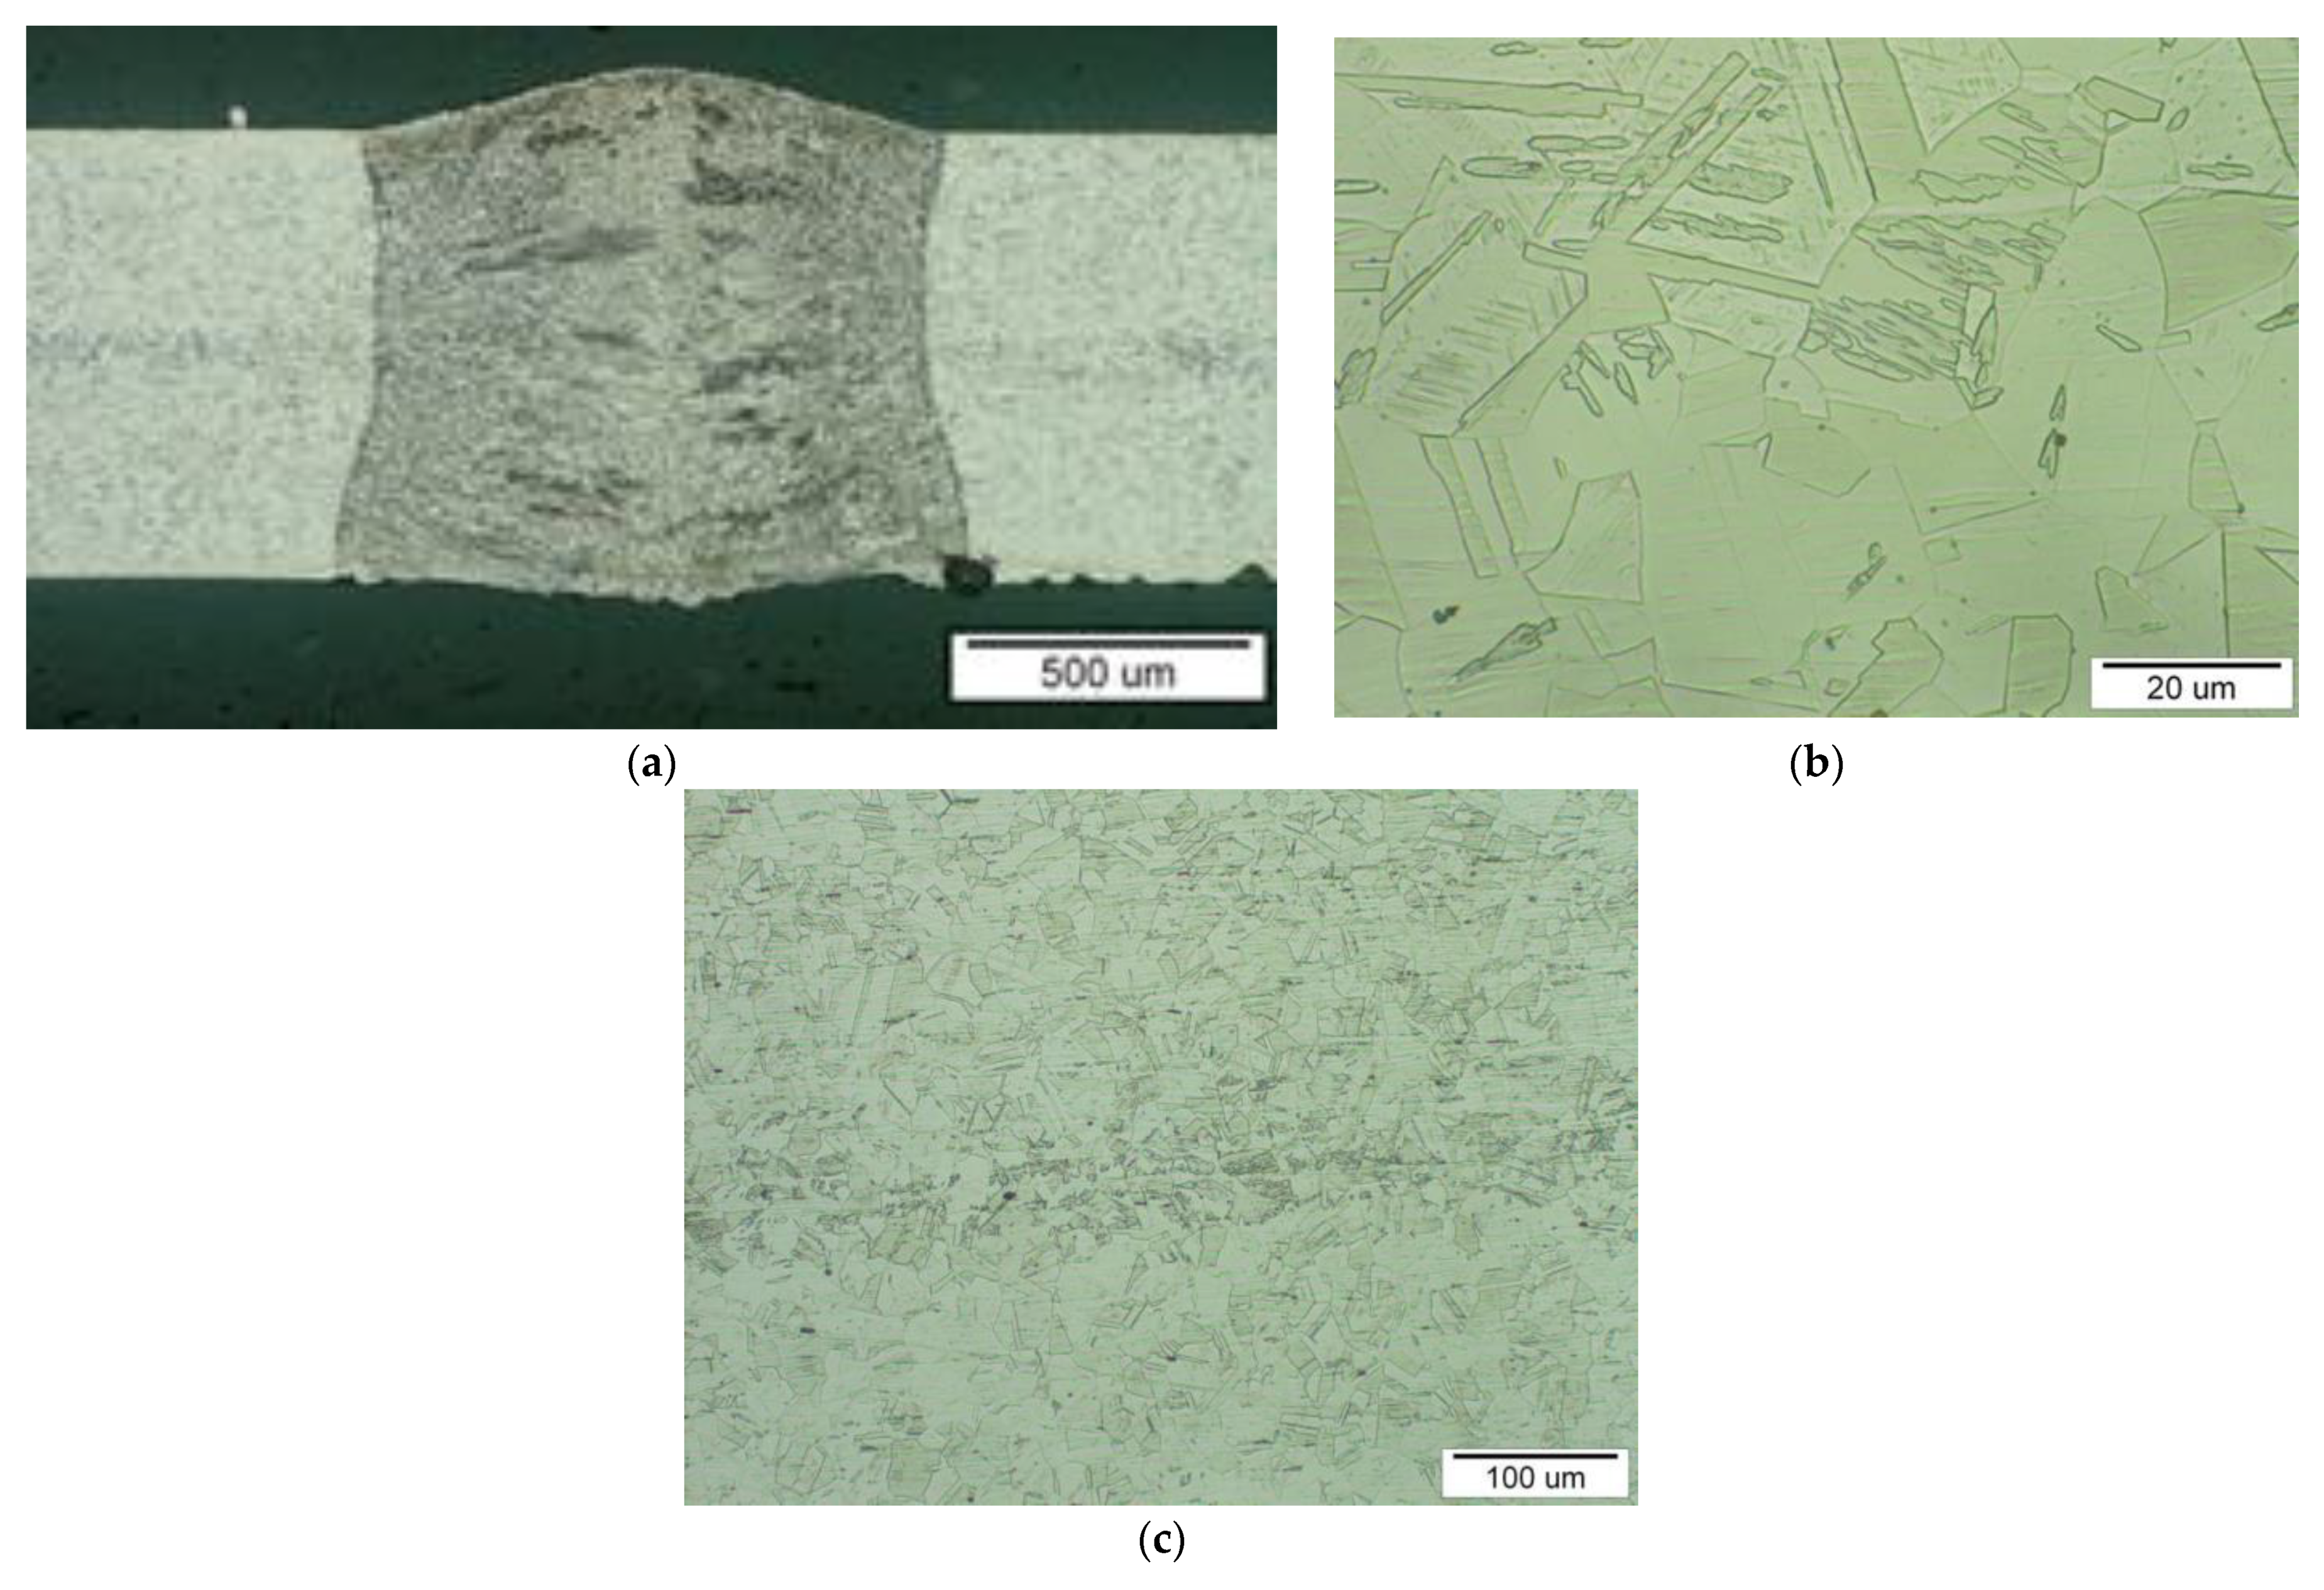
This fact was also confirmed by the microhardness results (
Figure 10). The microhardness in the welded joint area was 290 HV 0.5.
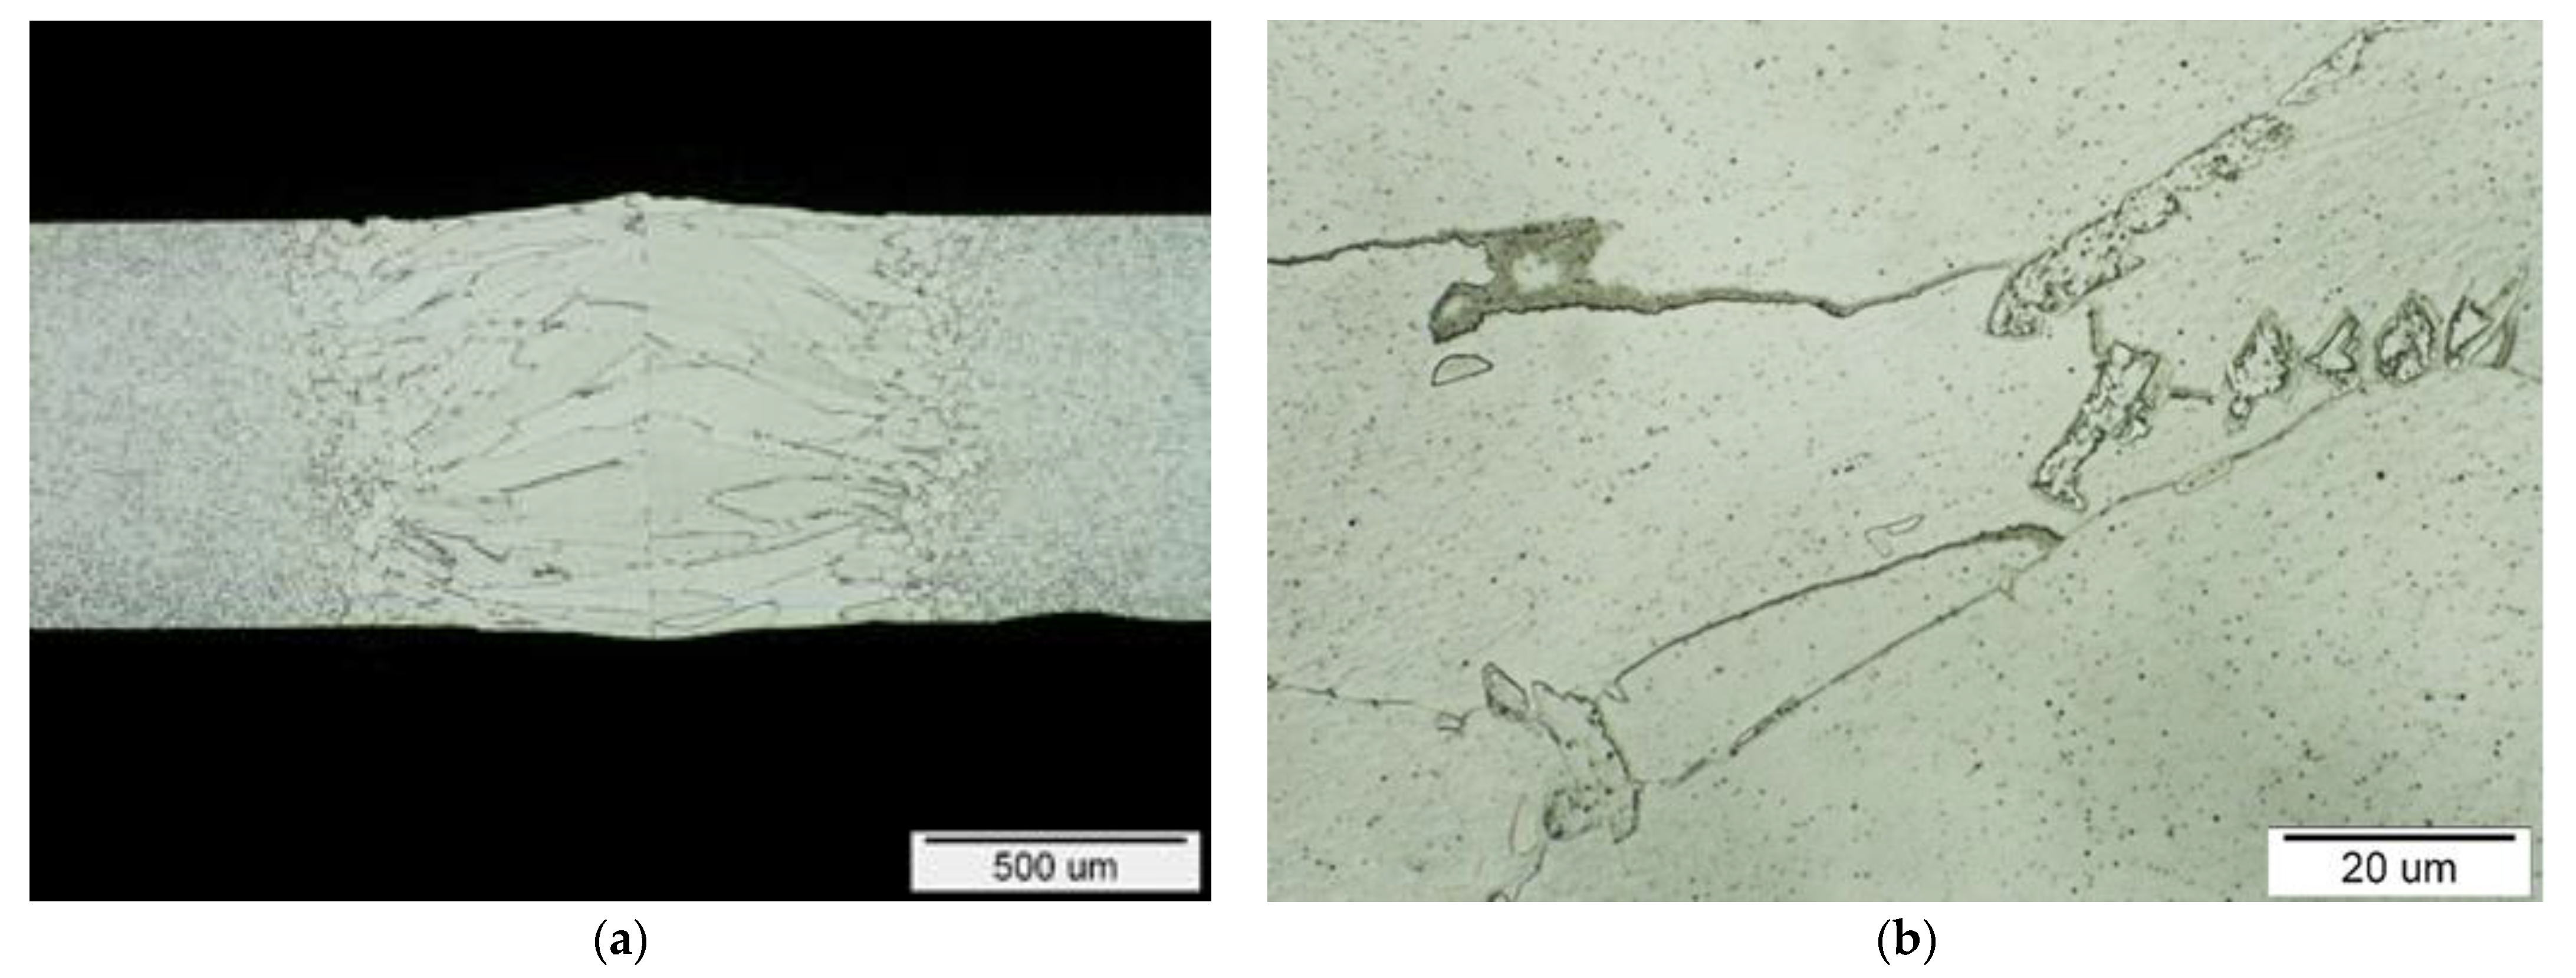
Figure 11a shows that large grains of ferrite passed into finer equiaxed ferritic grains in the direction towards the center of the welded joint. From the welded joint towards the base material, the size of the ferritic grains and the proportion of coarser carbide particles at their boundaries decreased. An increased amount of fine globular particles (probably carbides) evenly distributed in the ferritic structure was observed in this area (
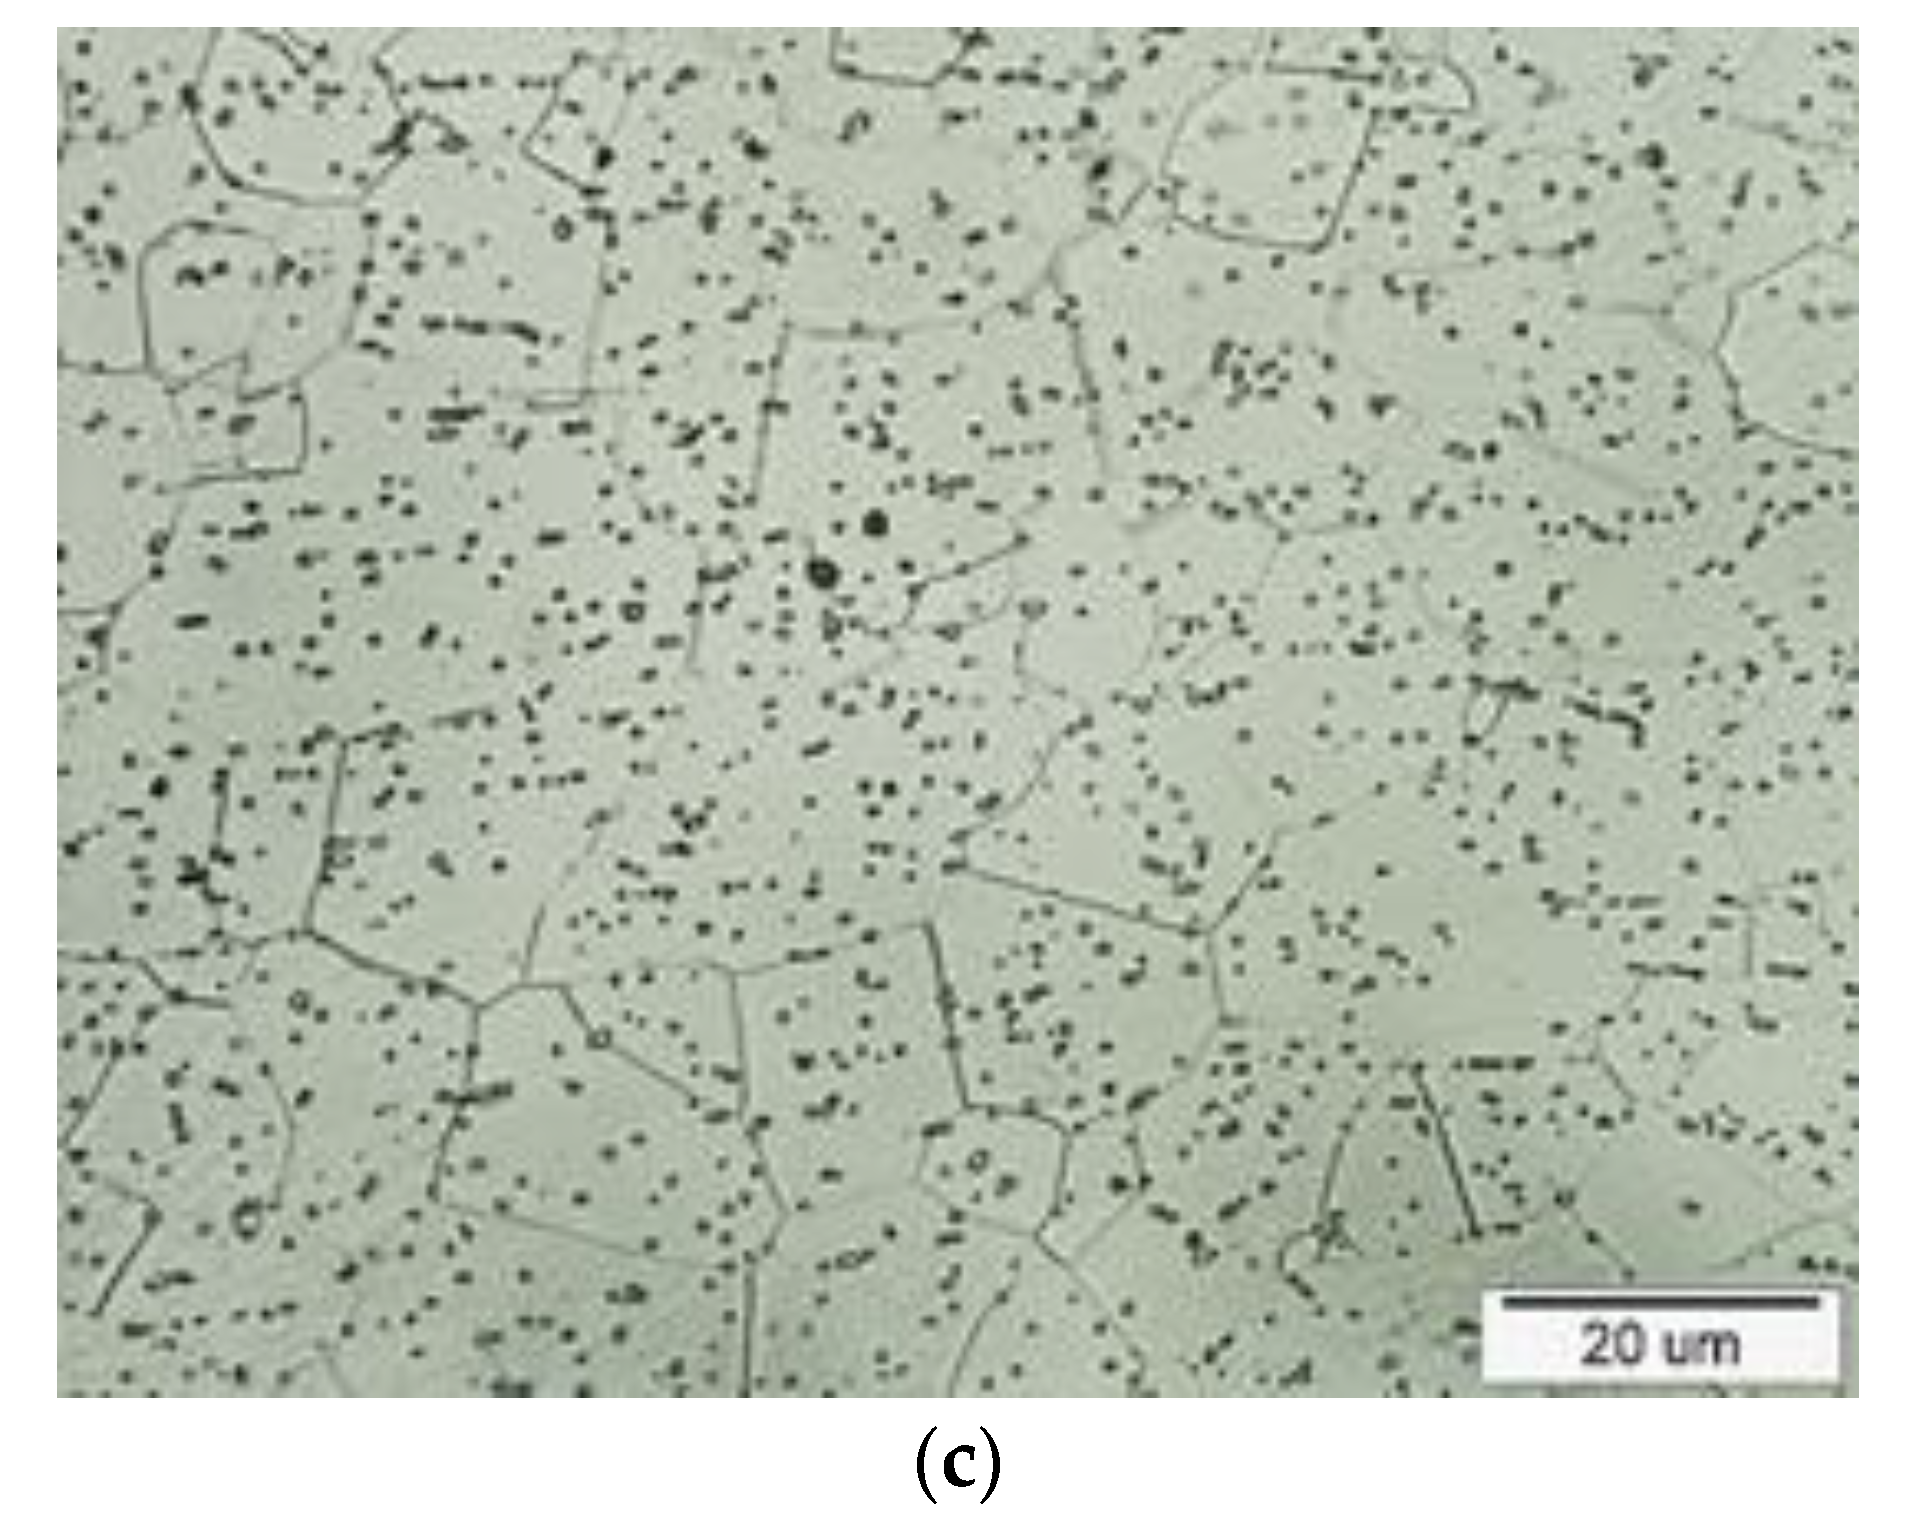
Figure 11b). The microstructure of the base material of the investigated steel is a fine-grained ferritic microstructure, with a relatively large amount of fine globular carbide particles in a uniform distribution (
Figure 11c). It should be noted that the failure of the laser-welded samples of the AISI 430 LW material occurred at a stress about 200 MPa lower and a strain lower by about 0.2, compared to failure observed in the samples of the AISI 430 BM base material.
The comparison of the dependence of the true stress on the true strain shown in
Figure 12 makes it clear that at the same strain (e.g., a strain of 0.05) the laser welded AISI 304 LW samples required only about a 2 MPa greater actual stress than the samples of the AISI 304 BM base material.
The welded-joint microstructure (AISI 304 LW) was largely dendritic and showed signs of dendritic growth towards the welded joint centerline, where bilateral dendritic growth terminated (
Figure 13a). In the structure of equiaxed austenite grains, there were platelet-like formations in the middle of the welded joint, probably of martensite, formed separately or in bundles (
Figure 13b). The microhardness in the area reached 209 HV 0.5. The microstructure of the AISI 304 BM base material was homogeneous and fine-grained, formed by equiaxed austenite grains with a number of twin interfaces inside individual grains (
Figure 13c).
The formability of the investigated materials was also assessed using the FLCs used by sheet-metal processors in the automotive industry. When analyzing the formability of AISI 304 BM, AISI 430 BM and laser-welded AISI 304 LW and AISI 340LW base materials according to their FLCs, the key issue was to determine the upper limit of the safety range, which should be sufficient to cover normal deviations in production.
In the case of samples made of AISI 304 material with a notch of R5 mm, the yellow zone ranges from 0.53 to 0.61 (
Figure 14). After plotting the individual zones (red, orange, yellow, and green), we see that the evaluated limit value of the major strain
φ1 = 0.66 is in the orange zone. In
Figure 14, this strain is indicated by a solid orange line. In the orange zone, there is a high risk of excessive thinning. Therefore, the limit value of the major strain was reduced by 10% in accordance with the recommendations given in the standards. In
Figure 14, it is indicated by a dotted orange line. After this adjustment, the upper limit value is at the top of the yellow zone. Thus, the upper limit values of the major strain were specified on samples with notches R5, R17, and R25 for both the base materials and also for both the laser-welded materials.
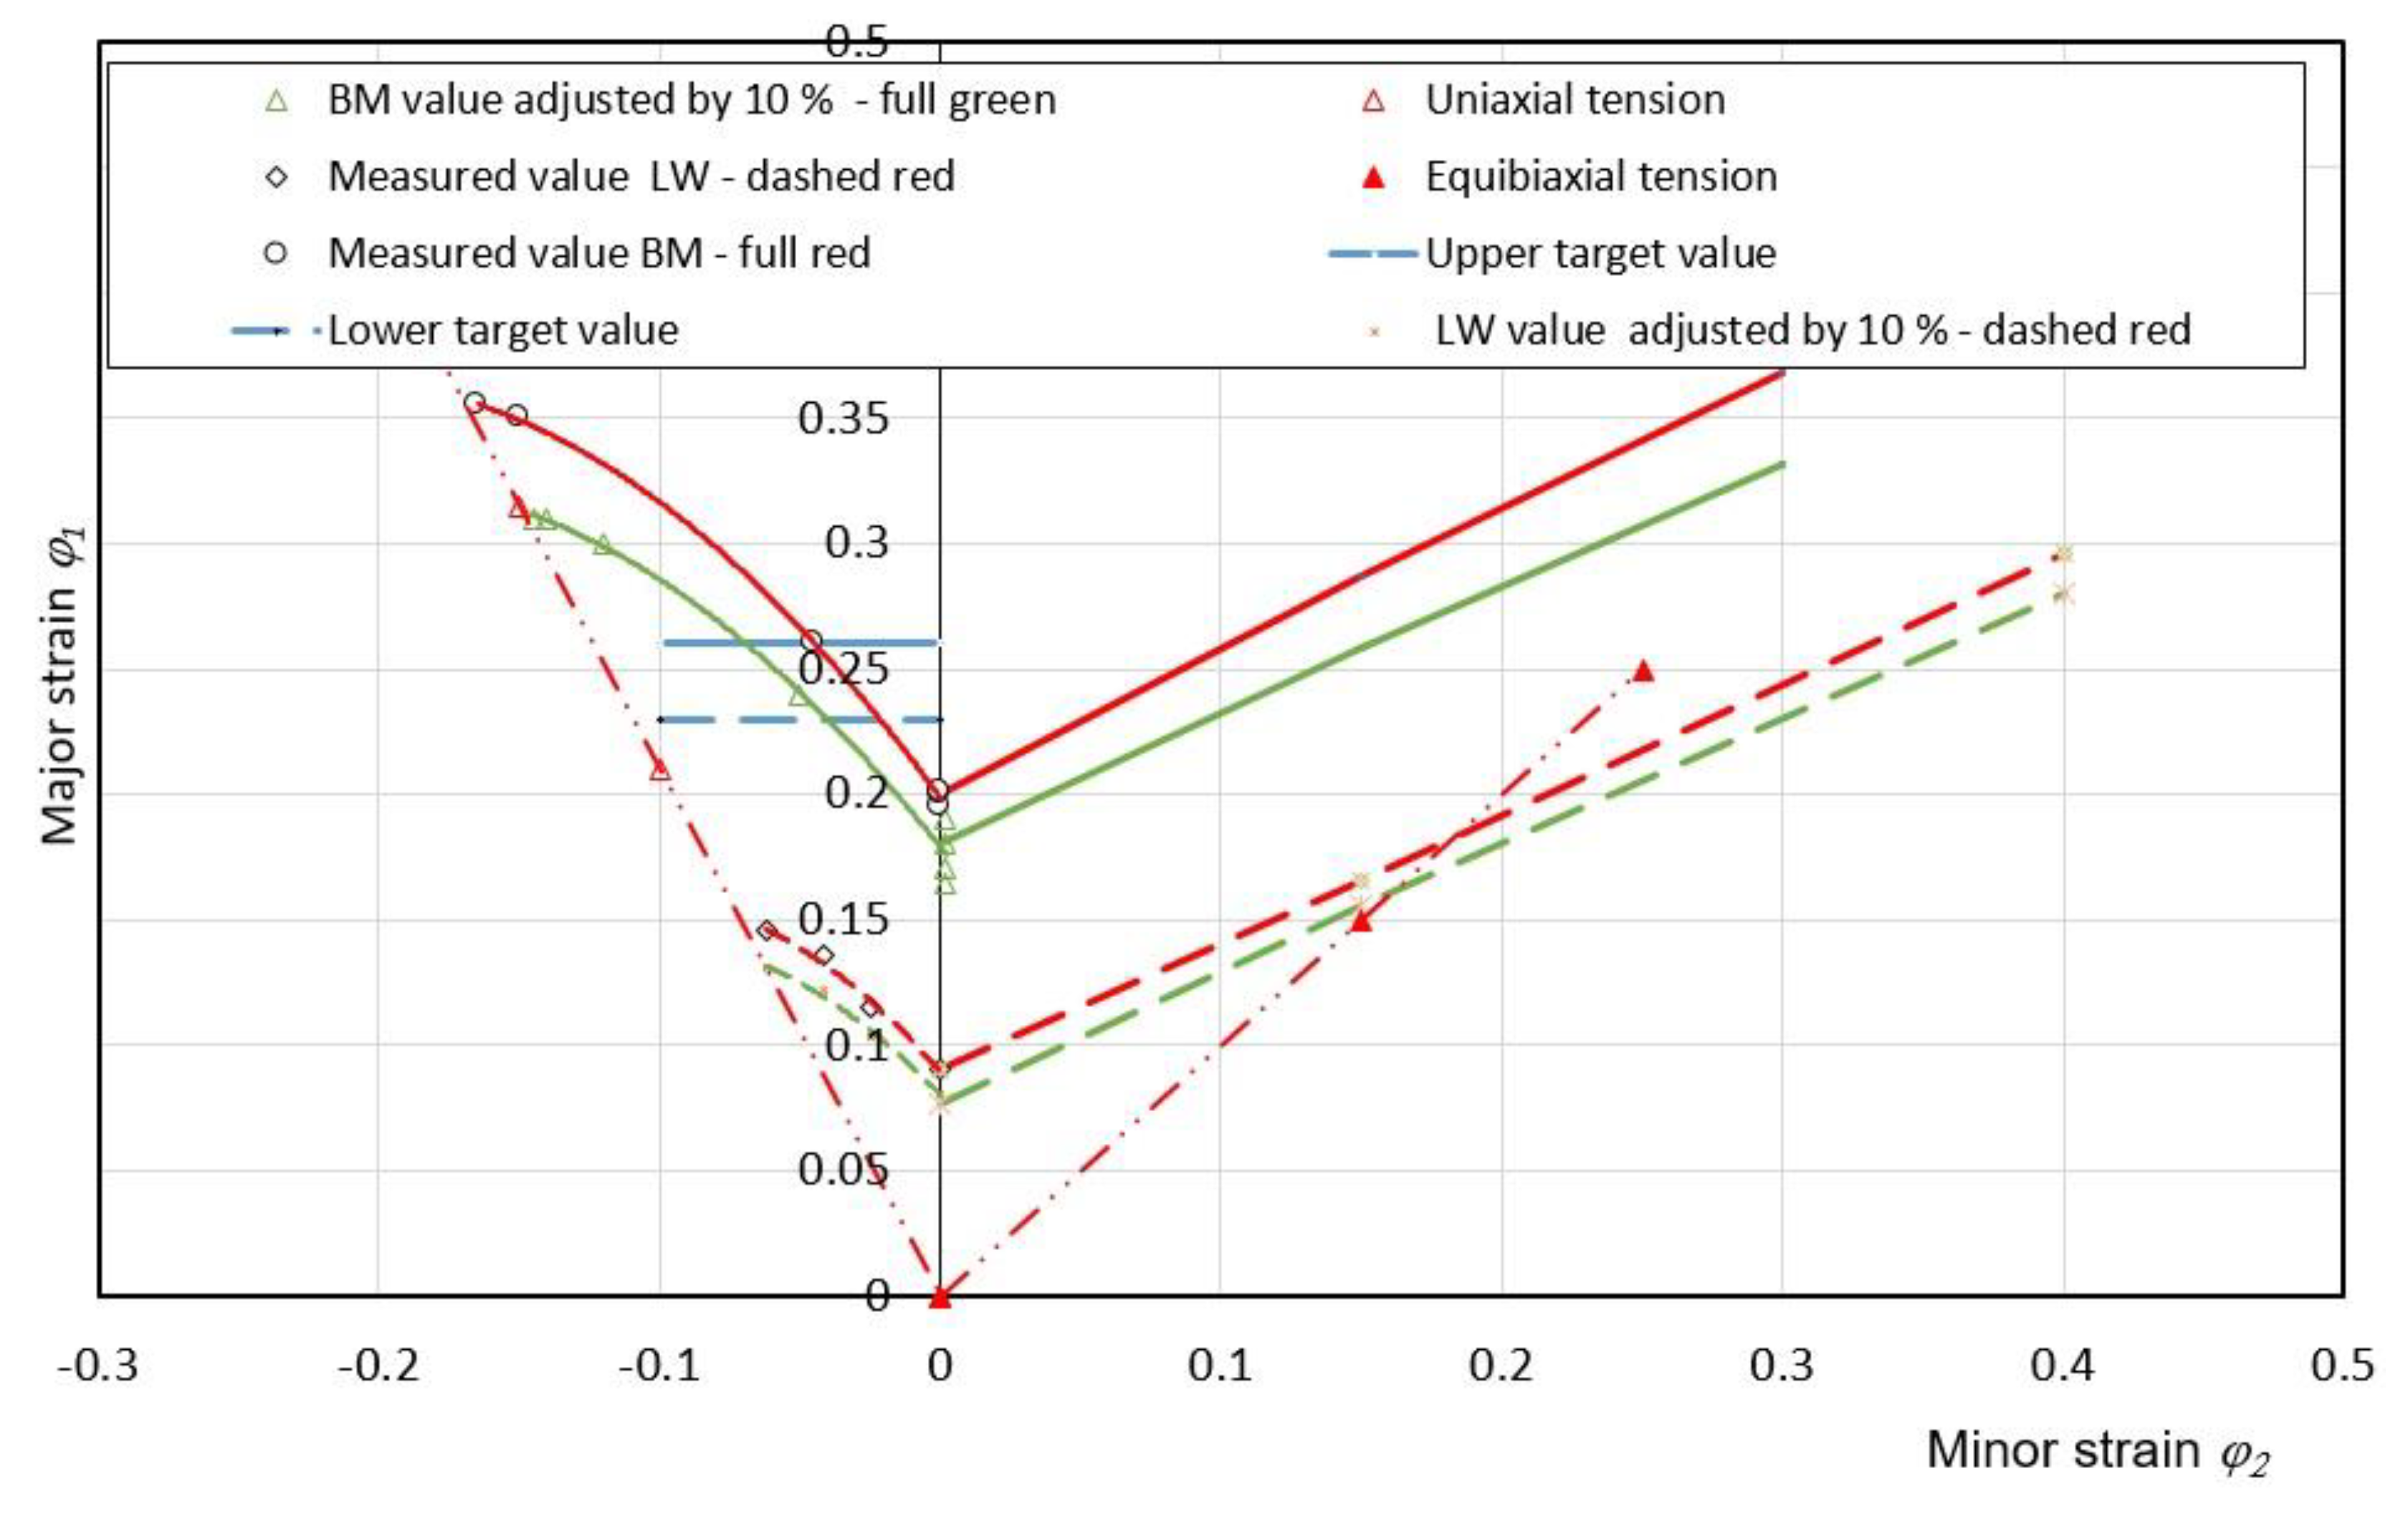
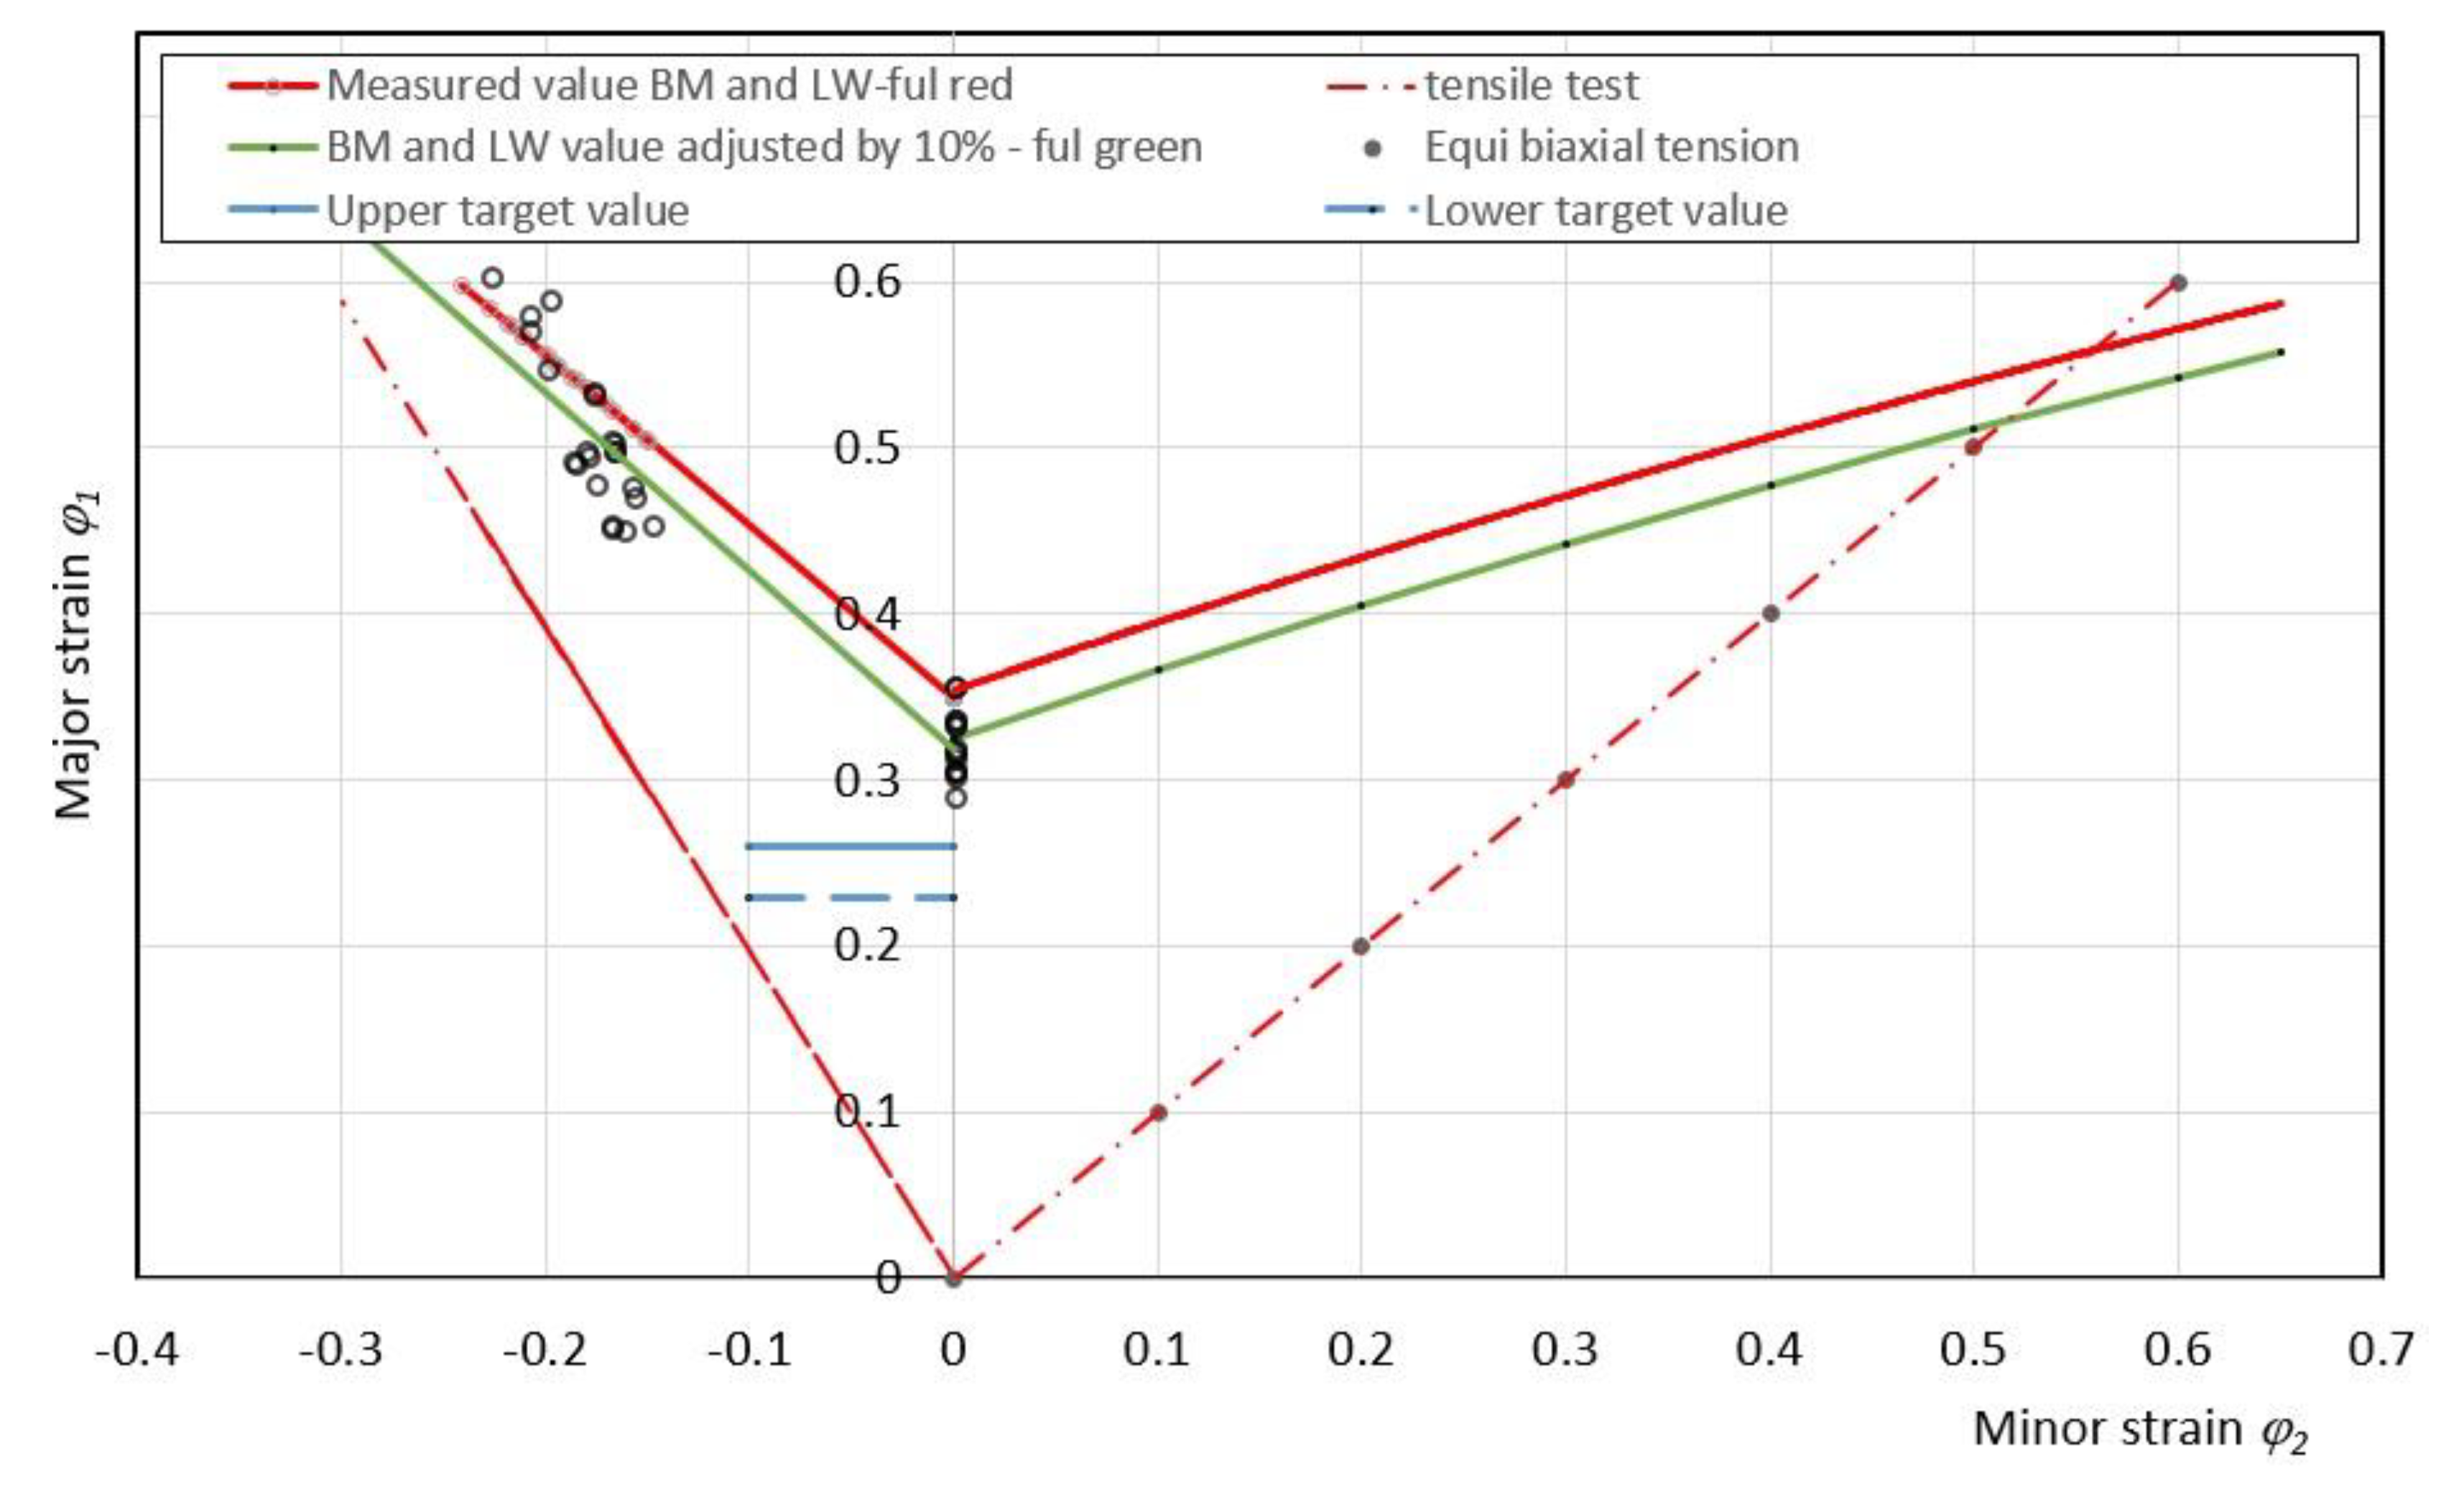
Based on the values of the major and the minor strains measured in the yellow zone, the left parts of the FLC for the base materials (BM) and the laser-welded materials (LW) were constructed as shown in
Figure 15 and
Figure 16, respectively. The solid red line indicates the upper limit values of the FLCs, and the green line represents the curves reduced by 10%. The upper target strain
φ1 value required to convert the blank into the finished surface part of the catalytic converter is indicated by a solid blue line for
φ2 from −0.1 to 0 in the FLD, and the lower target strain
φ1 value for the
φ2 from −0.1 to 0 is indicated by a dashed blue line.
Figure 15 shows that the target strain values for manufacturing the catalytic converter and muffler from both AISI 304 BM and AISI 304 LW are below the FLC specified for the yellow area, i.e., 10% below the upper limit value determined from strain values measured on samples with radii of R5, R17, and R25, as listed in
Table 5. This means that these parts should be manufacturable from both AISI 304BM and AISI 304 LW without the risk of failure or excessive wall thinning.
Based on the major and the minor strain values measured in the yellow zone, the left parts of the FLC were constructed for the base material AISI 430 BM and for the laser-welded material AISI 430 LW
Figure 16. The solid red line indicates the upper limit curves of the limit strains and the green solid line the curves reduced by 10% for the base material AISI 430 BM. The solid red line indicates the upper limit values of the FLCs and the green line the curves reduced by 10%. The upper target strain
φ1 value required to convert the blank into the finished surface part of the catalytic converter is indicated by a solid blue line for
φ2 from −0.1 to 0 in the FLD, and the lower target strain
φ1 value for the
φ2 from −0.1 to 0 is indicated by a dashed blue line.
Figure 16 shows that the target value of strain required for the production of the catalytic converter from the base AISI 430 BM material is exactly the target value below the FLC reduced by 10% for AISI 304 BM. In this case, too, it must be stated that the risk of excessive thinning of the wall is significant, even for small deviations in production conditions.
When using AISI 340 LW, the target values required for the conversion of semi-finished products into finished outer parts of the catalytic converter and the muffler are above the FLC. This means that in both cases there is a high risk not only of excessive thinning but also of failure. Therefore, it will not be possible to produce failure-free surface parts from laser-welded pipes unless the semi-finished products are thermomechanically treated before welding or another measure is taken.
It follows from
Figure 3 that points 1, 2, and 3 are important for the construction of the FLCs. Point 1 on the left side of the FLC can be generated for individual areas (zones) based on the results of the uniaxial tensile test. This point and the area delimiting the occurrence of failure or excessive thinning on the left side for anisotropic materials can be determined by Equation (11):
This equation applies to anisotropic materials under uniaxial tension. The state of uniaxial stress is marked on the left side of the FLD by a dotted red line (see
Figure 15 and
Figure 16). Point 1 is the most important for determining the position of the FLC in the diagram, because it is possible to create structures of FLCs for the left and the right sides from this point not only on the basis of experimental results but also numerically. A state of plane strain, i.e., the minor strain
φ2 = 0 and
φ1 =
FLC0, is found at point 1. The average
FLD0 values were calculated from the experimentally obtained results using Equation (12):
The other points needed to construct the FLC on the left-hand side were calculated according to (13):
The points for constructing the right branch of the FLCs were calculated according to Equation (14), as recommended by Keler and Brazier [
36]:
and according to a modified Equation (15) in the form given in [
36]:
where
p is the material constant, which is calculated using Equation (16) [
36]:
The branch on the right closes with point 3 and the dotted red line. Point 3 and the points for constructing the equi-biaxial tension state were calculated according to Equation (17):
The branch to the right between points 2 and 3 expresses the state of strain, starting at planar strain and continuing toward equiaxed tripping (
β =
φ1 /
φ2 = 1). As already mentioned,
FLD0 can be determined through calculations according to different models (Keller–Goodwin, Swift–Hill, Marciniak–Kuczynski, Sing-Rao, Keeler and Brazier, etc.) [
35,
36,
39]. Keeler and Brazier proposed the following (Equation (18)) for calculating
FLC0, i.e., an equation including the value of the strain-hardening exponent and the thickness of the sheet blank:
Keeler proved that the equation holds for
n ≤ 0.21 and
t ≤ 3.1 mm. Raghavan et al. suggested a
FLC0 predictive equation (Equation (19)) that includes tensibility and the thickness of the sheet blank:
where
t is the thickness of the sample,
n is the exponent of strain hardening,
εt is the relative uniform strain, and
εt =
Ag/100.
Table 6 shows a comparison of the measured
FLD0 values with the calculated values, using Equations (17) and (18). The difference Δ between the measured
FLD0M and the calculated
FLD0C values shows that smaller differences are recorded using Equation (18). In further research, materials with different structures (EDDQ, HSLA, DP 600, TRIP, etc.) will be included in the analysis, in order to clarify the predictive equations or propose a new predictive equation for calculating the
FLD0.
In production, it is often necessary to take cost-effective measures in process control so that the cost of poor quality does not increase with the growing number of errors. Because the increased costs of poor quality reduce the net income from the sale of products, they affect the company’s position in the market and its competitiveness. The economic efficiency of the adopted measures in terms of erroneous outputs can be expressed by the process capability indexes
Cp and
Cpk:
The
Cp index conveys what the process could be, and the
Cpk index how fit the process is to produce outputs within the required tolerance field. When designing the process, it is assumed that in the case of the catalytic converter, the target value of the major strain is
φ1C = 0.26, while that of the minor strain is
φ2 = 0.1 In this case, the target values are specified by a unilateral upper value of the limit strain
φ1, and the USLY in the yellow zone (upper specification limit
φ1). The process capability index for the production of a catalytic converter from AISI 304 BM and AISI 304 LW is:
There is a relationship between the sigma score and the process capability index which can be expressed by Equation (24):
After inserting the
Cpk value, we obtain the sigma score for the catalytic converter:
In this case, the
Cpk index is >1.33. This means that the processes for the production of the catalytic converter from AISI 304 BM and AISI 304 LW by hydroforming are suitable. It can also be stated that the process of producing the catalytic converter will be 99.9999998% failure-free, or that out of a million occasions, failure will occur at a rate of 0.002 ppm (two non-compliant products out of one hundred million cases (see
Table 6)).
Where the catalytic converter is manufactured from AISI 340 BM, the
Cpk is:
After inserting the
Cpk value, we obtain the sigma score for the catalytic converter:
In these cases (for AISI 430 BM and AISI 430 LW), the
Cpk index is <1.33. This means that the process for manufacturing the catalytic converter from AISI 430BM and AISI 430LW is unfit for the given purpose. Remedial measures must be taken. For example, using a thicker material and using thermomechanical processing before welding and after pressing might solve the problem. The results in [
36] suggest that corrosion occurs in the area of the welded joint in the AISI430 LW material, and even a small increase in stress may result in failure of this material.


