
Complex Material and Surface Analysis of Anterolateral Distal Tibial Plate of 1.4441 Steel

 ,
,  ,
, 
Abstract
:
1. Introduction
2. Materials and Methods
2.1. Microstructure and Metallography Observation
2.2. Corrosion Test
2.3. Wettability Test
2.4. Microhardness Testing
2.5. Contact-Type Surface Roughness Measurement
3. Results
3.1. Microstructure and Metallography Observation
3.2. Microhardness Testing
3.3. Wettability Test
3.4. Corrosion Testing Methods
- m is the mass of ions released during corrosion in grams,
- JC is corrosion current density,
- t is time in seconds (31,536,000 s/year),
- M is the molar mass of the substance in grams per mol,
- X is the atomic volume fraction of metal in steel composition (e.g., 0.15 for Ni in 1.4441 steel),
- F is the Faraday constant (96.485 Coulomb per mol), andS
- z is the valency number of ions (electrons transferred per ion during the reaction).
4. Discussion
5. Conclusions and Outlooks
Author Contributions
Funding
Institutional Review Board Statement
Informed Consent Statement
Data Availability Statement
Conflicts of Interest
References
- Ikar, M.; Grobecker-Karl, T.; Karl, M.; Steiner, C. Mechanical stress during implant surgery and its effects on marginal bone: A literature review. Quintessence Int. 2019, 51, 142–150. [Google Scholar] [CrossRef]
- Gibon, E.; Goodman, S.B. Biomaterials in Orthopaedics. In Encyclopedia of Biomedical Engineering; Elsevier: Amsterdam, The Netherlands, 2019; pp. 301–307. ISBN 9780128051443. [Google Scholar]
- Geringer, J.; Forest, B.; Combrade, P. Fretting-corrosion of materials used as orthopaedic implants. Wear 2005, 259, 943–951. [Google Scholar] [CrossRef] [Green Version]
- Antunes, R.A.; de Oliveira, M.C.L. Corrosion fatigue of biomedical metallic alloys: Mechanisms and mitigation. Acta Biomater. 2012, 8, 937–962. [Google Scholar] [CrossRef]
- Kim, I.-H.; Kwon, T.-Y.; Kim, K.-H. Wetting Behavior of Dental Implants. In Wetting and Wettability; InTechOpen: London, UK, 2015. [Google Scholar]
- ASTM A967/A967M-17; Standard Specification for Chemical Passivation Treatments for Stainless Steel. ASTM Stand. American Society for Testing and Materials, 2017. Available online: https://www.astm.org/a0967_a0967m-17.html (accessed on 20 September 2021).
- Guitar, M.A.; Scheid, A.; Britz, D.; Mücklich, F. Evaluation of the Etching Process for Analysis of Secondary Carbides in HCCI by Optical and Confocal Laser Microscopy. Pract. Metallogr. 2019, 56, 246–261. [Google Scholar] [CrossRef]
- Su, J.; Ma, M.; Wang, T.; Guo, X.; Hou, L.; Wang, Z. Fouling corrosion in aluminum heat exchangers. Chin. J. Aeronaut. 2015, 28, 954–960. [Google Scholar] [CrossRef] [Green Version]
- Topoglidis, E.; Cass, A.E.G.; O’Regan, B.; Durrant, J.R. Immobilisation and bioelectrochemistry of proteins on nanoporous TiO2 and ZnO films. J. Electroanal. Chem. 2001, 517, 20–27. [Google Scholar] [CrossRef]
- Pardo, A.; Merino, M.C.; Coy, A.E.; Viejo, F.; Arrabal, R.; Matykina, E. Pitting corrosion behaviour of austenitic stainless steels—Combining effects of Mn and Mo additions. Corros. Sci. 2008, 50, 1796–1806. [Google Scholar] [CrossRef]
- Terada, M.; Antunes, R.A.; Padilha, A.F.; de Melo, H.G.; Costa, I. Comparison of the corrosion resistance of DIN W. Nr. 1.4970 (15%Cr-15%Ni-1.2%Mo-Ti) and ASTM F-138 (17%Cr-13%Ni-2.5%Mo) austenitic stainless steels for biomedical applications. Mater. Res. 2006, 9, 281–286. [Google Scholar] [CrossRef] [Green Version]
- Kam, D.H.; Bhattacharya, S.; Mazumder, J. Control of the wetting properties of an AISI 316L stainless steel surface by femtosecond laser-induced surface modification. J. Micromech. Microeng. 2012, 22, 105019. [Google Scholar] [CrossRef]
- Calvimontes, A. The Measurement of the Surface Energy of Solids by Sessile Drop Accelerometry. Microgravity Sci. Technol. 2018, 30, 277–293. [Google Scholar] [CrossRef]
- ASTM E92-16; Standard Test Methods for Vickers Hardness and Knoop Hardness of Metallic Materials. ASTM B. Stand. 2017. Available online: https://www.astm.org/e0092-16.html (accessed on 29 September 2021).
- Thomas, T.R. Characterization of surface roughness. Precis. Eng. 1981, 3, 97–104. [Google Scholar] [CrossRef]
- Akkurt, A. Comparison of Roller Burnishing Method with Other Hole Surface Finishing Processes Applied on AISI 304 Austenitic Stainless Steel. J. Mater. Eng. Perform. 2011, 20, 960–968. [Google Scholar] [CrossRef]
- Dziubińska, A.; Surdacki, P.; Winiarski, G.; Bulzak, T.; Majerski, K.; Piasta, M. Analysis of the New Forming Process of Medical Screws with a Cylindrical Head of 316 LVM Steel. Materials 2021, 14, 710. [Google Scholar] [CrossRef] [PubMed]
- Mishra, S.; Narasimhan, K.; Samajdar, I. Deformation twinning in AISI 316L austenitic stainless steel: Role of strain and strain path. Mater. Sci. Technol. 2007, 23, 1118–1126. [Google Scholar] [CrossRef]
- Das, A.; Tarafder, S. Experimental investigation on martensitic transformation and fracture morphologies of austenitic stainless steel. Int. J. Plast. 2009, 25, 2222–2247. [Google Scholar] [CrossRef]
- Kubiak, K.J.; Wilson, M.C.T.; Mathia, T.G.; Carval, P. Wettability versus roughness of engineering surfaces. Wear 2011, 271, 523–528. [Google Scholar] [CrossRef] [Green Version]
- Kutz, M. Handbook of Environmental Degradation of Materials, 2nd ed.; Elsevier: Amsterdam, The Netherlands, 2012; ISBN 9781437734560. [Google Scholar] [CrossRef]
- El-Tahawy, M.; Huang, Y.; Um, T.; Choe, H.; Lábár, J.L.; Langdon, T.G.; Gubicza, J. Stored energy in ultrafine-grained 316L stainless steel processed by high-pressure torsion. J. Mater. Res. Technol. 2017, 6, 339–347. [Google Scholar] [CrossRef] [Green Version]
- Yin Yee Chin, P.; Cheok, Q.; Glowacz, A.; Caesarendra, W. A Review of In-Vivo and In-Vitro Real-Time Corrosion Monitoring Systems of Biodegradable Metal Implants. Appl. Sci. 2020, 10, 3141. [Google Scholar] [CrossRef]
- Brown, R.P.; Fowler, B.A.; Fustinoni, S.; Nordberg, M. Toxicity of Metals Released from Implanted Medical Devices. In Handbook on the Toxicology of Metals; Elsevier: Amsterdam, The Netherlands, 2015; Volume 1, pp. 113–122. ISBN 9780123973399. [Google Scholar]
- He, X.; Reichl, F.X.; Milz, S.; Michalke, B.; Wu, X.; Sprecher, C.M.; Yang, Y.; Gahlert, M.; Röhling, S.; Kniha, H.; et al. Titanium and zirconium release from titanium- and zirconia implants in mini pig maxillae and their toxicity in vitro. Dent. Mater. 2020, 36, 402–412. [Google Scholar] [CrossRef]
- Morrell, A.P.; Floyd, H.; Mosselmans, J.F.; Grover, L.M.; Castillo-Michel, H.; Davis, E.T.; Parker, J.E.; Martin, R.A.; Addison, O. Improving our understanding of metal implant failures: Multiscale chemical imaging of exogenous metals in ex-vivo biological tissues. Acta Biomater. 2019, 98, 284–293. [Google Scholar] [CrossRef]
- Godbole, N.; Yadav, S.; Ramachandran, M.; Belemkar, S. A review on surface treatment of stainless steel orthopedic implants. Int. J. Pharm. Sci. Rev. Res. 2016, 36, 190–194. [Google Scholar]
- Rahimi, E.; Kosari, A.; Hosseinpour, S.; Davoodi, A.; Zandbergen, H.; Mol, J.M.C. Characterization of the passive layer on ferrite and austenite phases of super duplex stainless steel. Appl. Surf. Sci. 2019, 496, 143634. [Google Scholar] [CrossRef]
- Ma, L.; Pascalidou, E.-M.; Wiame, F.; Zanna, S.; Maurice, V.; Marcus, P. Passivation mechanisms and pre-oxidation effects on model surfaces of FeCrNi austenitic stainless steel. Corros. Sci. 2020, 167, 108483. [Google Scholar] [CrossRef] [Green Version]
- Munir, S.; Pelletier, M.H.; Walsh, W.R. Potentiodynamic corrosion testing. J. Vis. Exp. 2016, 115, 54351. [Google Scholar] [CrossRef] [PubMed]
- Xin, Y.; Huo, K.; Tao, H.; Tang, G.; Chu, P.K. Influence of aggressive ions on the degradation behavior of biomedical magnesium alloy in physiological environment. Acta Biomater. 2008, 4, 2008–2015. [Google Scholar] [CrossRef]
- Liu, C.L.; Chu, P.K.; Lin, G.Q.; Qi, M. Anti-corrosion characteristics of nitride-coated AISI 316L stainless steel coronary stents. Surf. Coatings Technol. 2006, 201, 2802–2806. [Google Scholar] [CrossRef]
- Pistorius, P.C.; Burstein, G.T. Metastable pitting corrosion of stainless steel and the transition to stability. Philos. Trans. R. Soc. London. Ser. A Phys. Eng. Sci. 1992, 341, 531–559. [Google Scholar] [CrossRef]
- Thompson, N.G.; Syrett, B.C. Relationship Between Conventional Pitting and Protection Potentials and a New, Unique Pitting Potential. Corrosion 1992, 48, 649–659. [Google Scholar] [CrossRef]
- Scully, J.R.; Budiansky, N.D.; Tiwary, Y.; Mikhailov, A.S.; Hudson, J.L. An alternate explanation for the abrupt current increase at the pitting potential. Corros. Sci. 2008, 50, 316–324. [Google Scholar] [CrossRef]
- Salinas-Bravo, V.M.; Newman, R.C. An alternative method to determine critical pitting temperature of stainless steels in ferric chloride solution. Corros. Sci. 1994, 36, 67–77. [Google Scholar] [CrossRef]
- Ohtsuka, T.; Nishikata, A.; Sakairi, M.; Fushimi, K. Electrochemistry for Corrosion Fundamentals; Springer: Berlin/Heidelberg, Germany, 2018; ISBN 9811068208. [Google Scholar]
- Mah, D.; Pelletier, M.H.; Lovric, V.; Walsh, W.R. Corrosion of 3D-Printed Orthopaedic Implant Materials. Ann. Biomed. Eng. 2019, 47, 162–173. [Google Scholar] [CrossRef] [PubMed]
- Eliaz, N. Corrosion of Metallic Biomaterials: A Review. Materials 2019, 12, 407. [Google Scholar] [CrossRef] [Green Version]
- Jiménez-Come, M.J.; Turias, I.J.; Ruiz-Aguilar, J.J.; Trujillo, F.J. Breakdown potential modelling of austenitic stainless steel. J. Chemom. 2014, 28, 181–191. [Google Scholar] [CrossRef]
- Esmailzadeh, S.; Aliofkhazraei, M.; Sarlak, H. Interpretation of Cyclic Potentiodynamic Polarization Test Results for Study of Corrosion Behavior of Metals: A Review. Prot. Met. Phys. Chem. Surfaces 2018, 54, 976–989. [Google Scholar] [CrossRef]
- Different Forms of Corrosion Classified on the Basis of Appearence. In Corrosion and Protection; Springer: London, UK, 2007; pp. 89–191.
- McCafferty, E. Thermodynamics of Corrosion: Pourbaix Diagrams. In Introduction to Corrosion Science; Springer: New York, NY, USA, 2010. [Google Scholar]
- Fürbeth, W. Special Issue: Advanced Coatings for Corrosion Protection. Materials 2020, 13, 3401. [Google Scholar] [CrossRef]
- Liu, J.; Zhang, T.; Meng, G.; Shao, Y.; Wang, F. Effect of pitting nucleation on critical pitting temperature of 316L stainless steel by nitric acid passivation. Corros. Sci. 2015, 91, 232–244. [Google Scholar] [CrossRef]
- Bocchetta, P.; Chen, L.-Y.; Tardelli, J.D.C.; dos Reis, A.C.; Almeraya-Calderón, F.; Leo, P. Passive Layers and Corrosion Resistance of Biomedical Ti-6Al-4V and β-Ti Alloys. Coatings 2021, 11, 487. [Google Scholar] [CrossRef]
- Niinomi, M. Metals for Biomedical Devices; Elsevier: Amsterdam, The Netherlands, 2019; ISBN 9780081026663. [Google Scholar]
- Wang, Z.; Zhang, L.; Tang, X.; Cui, Z.; Xue, J.; Lu, M. Investigation of the deterioration of passive films in H2S-containing solutions. Int. J. Miner. Metall. Mater. 2017, 24, 943–953. [Google Scholar] [CrossRef] [Green Version]
- Rustandi, A.; Nuradityatama; Rendi, M.F.; Setiawan, S. The Use of Cyclic Polarization Method for Corrosion Resistance Evaluation of Austenitic Stainless Steel 304L and 316L in Aqueous Sodium Chloride Solut. Int. J. Mech. Eng. Robot. Res. 2017, 6, 512–518. [Google Scholar] [CrossRef]
- Høl, P.J.; Mølster, A.; Gjerdet, N.R. Should the galvanic combination of titanium and stainless steel surgical implants be avoided? Injury 2008, 39, 161–169. [Google Scholar] [CrossRef]
- Studio Srl, F. Polarisation Measurements Used for Corrosion Rates Determination. J. Sustenable Energy 2010, 1, 1–4. [Google Scholar]
- Yan, X.; Shi, C.; Liu, T.; Ye, Y.; Chang, C.; Ma, W.; Deng, C.; Yin, S.; Liao, H.; Liu, M. Effect of heat treatment on the corrosion resistance behavior of selective laser melted Ti6Al4V ELI. Surf. Coatings Technol. 2020. [Google Scholar] [CrossRef]
- Bormann, T.; Mai, P.T.; Gibmeier, J.; Sonntag, R.; Müller, U.; Kretzer, J.P. Corrosion Behavior of Surface-Treated Metallic Implant Materials. Materials 2020, 13, 2011. [Google Scholar] [CrossRef]
- ASTM G59-97(2020); Standard Test Method for Conducting Potentiodynamic Polarization Resistance Measurements. ASTM Int. ASTM International, 2020. Available online: https://www.astm.org/g0059-97r20.html (accessed on 11 October 2021).
- Alrabeah, G.O.; Brett, P.; Knowles, J.C.; Petridis, H. The effect of metal ions released from different dental implant-abutment couples on osteoblast function and secretion of bone resorbing mediators. J. Dent. 2017, 66, 91–101. [Google Scholar] [CrossRef]
- Bijukumar, D.R.; Segu, A.; Souza, J.C.M.; Li, X.J.; Barba, M.; Mercuri, L.G.; Jacobs, J.; Mathew, M.T. Systemic and local toxicity of metal debris released from hip prostheses: A review of experimental approaches. Nanomed.Nanotechnol. Biol. Med. 2018, 14, 951–963. [Google Scholar] [CrossRef] [PubMed]
- Pereira, M.C.; Pereira, M.L.; Sousa, J.P. Evaluation of nickel toxicity on liver, spleen, and kidney of mice after administration of high-dose metal ion. J. Biomed. Mater. Res. 1998, 40, 40–47. [Google Scholar] [CrossRef]
- Mancuso, V.; Zmerly, H. Metal allergy related to the use of orthopaedic prosthesis after trauma and normal aging process. Allergy Eur. J. Allergy Clin. Immunol. 2018, 4, 45–56. [Google Scholar]
- Bermúdez-Castañeda, A.; Igual-Muñoz, A.; Mischler, S. A Crevice Corrosion Model for Biomedical Trunnion Geometries and Surfaces Feature. Materials 2021, 14, 1005. [Google Scholar] [CrossRef]
- Ansari, T.Q.; Luo, J.-L.; Shi, S.-Q. Modeling the effect of insoluble corrosion products on pitting corrosion kinetics of metals. NPJ Mater. Degrad. 2019, 3, 28. [Google Scholar] [CrossRef] [Green Version]
- Wei, J.; Igarashi, T.; Okumori, N.; Igarashi, T.; Maetani, T.; Liu, B.; Yoshinari, M. Influence of surface wettability on competitive protein adsorption and initial attachment of osteoblasts. Biomed. Mater. 2009, 4, 045002. [Google Scholar] [CrossRef]
- Menzies, K.L.; Jones, L. The Impact of Contact Angle on the Biocompatibility of Biomaterials. Optom. Vis. Sci. 2010, 87, 387–399. [Google Scholar] [CrossRef] [PubMed]


| AISI 1.4441, Chemical Composition (wt.%) | ||||||||
|---|---|---|---|---|---|---|---|---|
| C | Si | Mn | P | S | Cr | Mo | Ni | Others |
| <0.03 | <1 | <2 | <0.25 | <0.01 | 17–19 | 2.5–3.2 | 13–15 | N < 0.1, Cu < 0.5 |
| Longitudinal Direction | Transversal Direction | ||
|---|---|---|---|
| Distance from the Thread (mm) | HV 0.1 | Distance from the Thread (mm) | HV 0.1 |
| 0.1 | 346 | 0.1 | 321 |
| 0.3 | 327 | 0.3 | 304 |
| 0.5 | 302 | 0.5 | 346 |
| 0.7 | 338 | 0.7 | 304 |
| 0.9 | 338 | 0.9 | 295 |
| 1.1 | 332 | 1.1 | 331 |
| 1.3 | 308 | 1.3 | 361 |
| 1.5 | 327 | 1.5 | 314 |
| 1.7 | 327 | 1.7 | 294 |
| 1.9 | 333 | 1.9 | 301 |
| Average HV 0.1 | 328 | Average HV 0.1 | 317 |
| Standard deviation | 14 | Standard deviation | 20 |
| Sample | Contact Angle (°) | Surface Energy (mJ·m−2) |
|---|---|---|
| Close thread | 50 ± 4 | 53.5 + 2.6; −2.3 |
| Between threads | 52 ± 2 | 53.6 + 1.2; −1.2 |
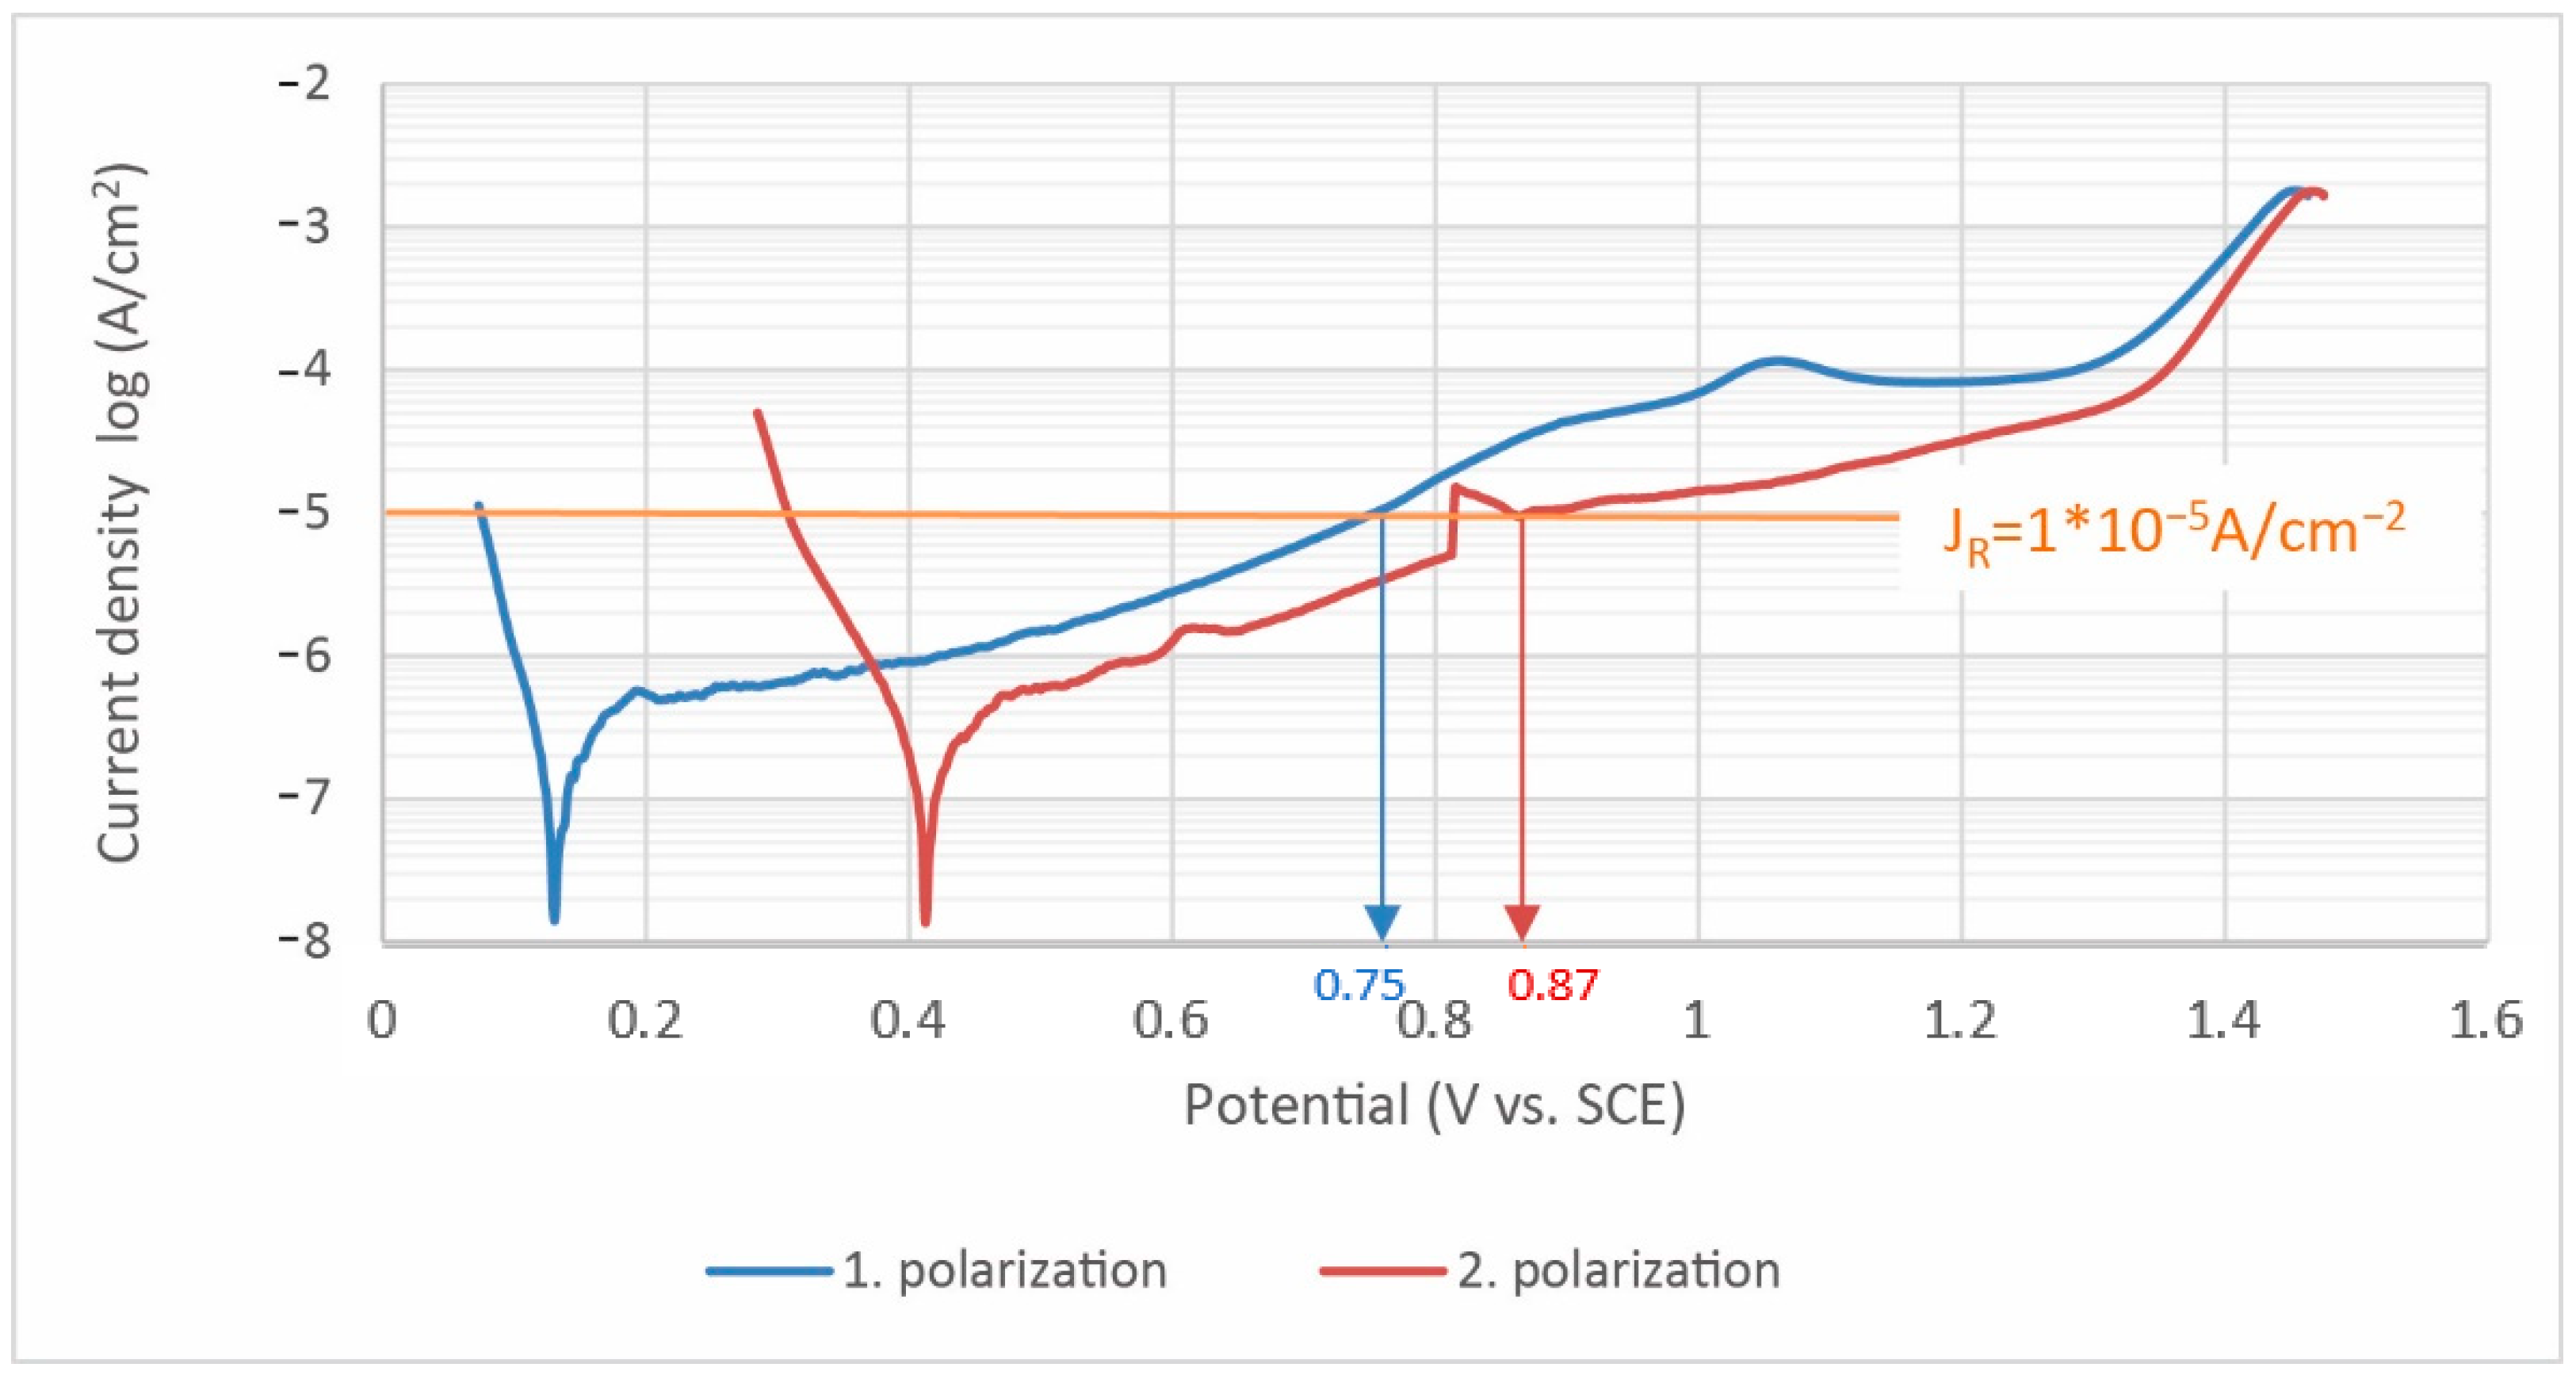
| Curve NO. | Corrosion Potential Ecor (mV vs. SCE) | Corrosion Rate CR (μm/Year) | Polarization Resistance Rp (kΩ·cm2) | Corrosion Current Density JC (μA/cm2) |
|---|---|---|---|---|
| 1 | 134 | 0.76 | 107 | 0.065 |
| 2 | 414 | 2.01 | 84 | 0.172 |
| Polarization | μg/(Year·cm2) | |||
| Mn | Cr | Mo | Ni | |
| 1st polarization | 12.5 | 118.3 | 19.9 | 99.6 |
| 2nd polarization | 32.9 | 312.6 | 52.6 | 263.2 |
| Polarization | μmol/(Year·cm2) | |||
| Mn | Cr | Mo | Ni | |
| 1st polarization | 0.2 | 2.3 | 0.2 | 1.7 |
| 2nd polarization | 0.6 | 6.0 | 0.5 | 4.5 |
Publisher’s Note: MDPI stays neutral with regard to jurisdictional claims in published maps and institutional affiliations. |
© 2021 by the authors. Licensee MDPI, Basel, Switzerland. This article is an open access article distributed under the terms and conditions of the Creative Commons Attribution (CC BY) license (https://creativecommons.org/licenses/by/4.0/).
Share and Cite
Hlinka, J.; Dostalova, K.; Dedkova, K.P.; Madeja, R.; Frydrysek, K.; Koutecky, J.; Sova, P.; Douglas, T.E.L. Complex Material and Surface Analysis of Anterolateral Distal Tibial Plate of 1.4441 Steel. Metals 2022, 12, 60. https://doi.org/10.3390/met12010060
Hlinka J, Dostalova K, Dedkova KP, Madeja R, Frydrysek K, Koutecky J, Sova P, Douglas TEL. Complex Material and Surface Analysis of Anterolateral Distal Tibial Plate of 1.4441 Steel. Metals. 2022; 12(1):60. https://doi.org/10.3390/met12010060
Chicago/Turabian StyleHlinka, Josef, Kamila Dostalova, Katerina Peterek Dedkova, Roman Madeja, Karel Frydrysek, Jan Koutecky, Pavel Sova, and Timothy E. L. Douglas. 2022. "Complex Material and Surface Analysis of Anterolateral Distal Tibial Plate of 1.4441 Steel" Metals 12, no. 1: 60. https://doi.org/10.3390/met12010060
APA StyleHlinka, J., Dostalova, K., Dedkova, K. P., Madeja, R., Frydrysek, K., Koutecky, J., Sova, P., & Douglas, T. E. L. (2022). Complex Material and Surface Analysis of Anterolateral Distal Tibial Plate of 1.4441 Steel. Metals, 12(1), 60. https://doi.org/10.3390/met12010060