Article

An Experimental Study of the Tension-Compression Asymmetry of Extruded Ti-6.5Al-2Zr-1Mo-1V under Quasi-Static Conditions at High Temperature

School of Mechanical Engineering and Automation, Beihang University, Beijing 100191, China
*
Author to whom correspondence should be addressed.
Metals 2021, 11(8), 1299; https://doi.org/10.3390/met11081299
Submission received: 13 July 2021 / Revised: 6 August 2021 / Accepted: 12 August 2021 / Published: 17 August 2021
(This article belongs to the Special Issue Titanium Alloys and Titanium-Based Matrix Composites)

Abstract

:
The tension-compression asymmetry (TCA) behavior of an extruded titanium alloy at high temperatures has been investigated experimentally in this study. Uniaxial tensile and compressive tests were conducted from 923 to 1023 K with various strain rates under quasi-static conditions. The corresponding yield stress and asymmetric strain hardening behavior were obtained and analyzed. In addition, the microstructure at different temperatures and stress states indicates that the extruded TA15 profile exhibits a significant yield stress asymmetry at different testing temperatures. The flow stress and yield stress during tension are greater than compression. The yield stress asymmetry decreases with the increase in temperature. The alloy also exhibits TCA behavior on the strain hardening rate. Its mechanical response during compression is more sensitive than tension. A dynamic recrystallization phenomenon is observed instead of twin generated in tension and compression under high-temperature quasi-static conditions. The grains are elongated along the tensile direction and deformed by about 45° along the compressive load axis. Finally, the TCA of Ti-6.5Al-2Zr-1Mo-1V (TA15) alloy is due to slip displacement. The tensile deformation activates basal <a>, prismatic <a> and pyramidal <c + a> slip modes, while the compressive deformation activates only prismatic <a> and pyramidal <c + a> slip modes.

1. Introduction

Titanium and its alloys for their high corrosion resistance, excellent mechanical properties and relatively light weight are widely used in aerospace materials [1,2,3,4]. Additionally, unlike aluminum alloys, they have similar thermal expansion coefficients and outstanding electrochemical compatibility with carbon fiber reinforced plastics (CFRP) [5,6]. Titanium alloys are highly desirable for use in contoured airframe structures with complex curvatures, such as the frame and reinforced frames of a cabin door, see in Figure 1 [7].
To form such contoured titanium components, Hot Stretch Bending (HSB) is developed by the Cyril Bath Company (Monroe, NC, USA) to fabricate such components in a new generation of commercial aircraft. Additionally, its process procedure includes the following four stages: heating, pre-stretch, bending and cooling, as seen in Figure 2 [6,8]. In the HSB, the bending moment produces tensile stress above the neutral axis, and compressive stress below the neutral axis. There are significantly TCA stress states in the alloy profile during forming; therefore, it is necessary to research the mechanical response under different stress states (tension and compression) to achieve accurate control of the geometry of the formed parts.
Many scholars have found that there is TCA in pure titanium and its alloys at room temperature and medium-high temperatures (≤873 K). Lin et al. [9] studied the TCA of pure titanium (CP-Ti) at room temperature and stated that the difference of the stress values activating the secondary twins is the main cause of TCA at room temperature. Tuninetti et al. [10] investigated the mechanical response of Ti-6Al-4V based on the target strain rate and the results indicated there is obvious TCA at ambient temperature. Hao et al. [11] revealed that the strain hardening and yield asymmetry of CP-Ti are prominent due to the large number of twinning grains generated during the compression process. Neeraj et al. [12] suggested that the <c + a> dislocation phenomenon occurred in the compression, but not in the tensile process. Additionally, the different critical shear stress (CRSS) of <a> slip was also one reason leading to the TCA of titanium alloy. Sarsfield et al. [13] founded that the tensile fracture of the material was in the shape of ‘V’, while the compression specimen was in the shape of 45° shear failure.
Additionally, it is also widely observed that TCA is significantly related to deformation temperatures and strain rates. Akhtar et al. [14] have carried out compression tests on three Ti-6Al-4V materials at 233–755 K with strain rates from 10−6 to 3378 s−1. The results supported that the yield stress and strain hardening of the three materials are more sensitive to temperature than strain rate. Adharapurapu et al. [15] have conducted dynamic compression and tension tests on a Ni-Ti shape memory alloy at temperatures from 469 to 673 K. The observations illustrated that temperature variation was one of the main causes of TCA.
Previous studies on the TCA of titanium and its alloys mainly focused on room temperature or medium-high temperatures (≤873 K). Compared to titanium plates and hot forging rods, HSB generally uses extruded profiles, and the forming temperature can achieve to the range of 868 to 1088 K [6]. However, there are few reports on the TCA of the extruded titanium profile in this forming temperature range. The hexagonal lattice metals have fewer sliding planes at ambient temperature, which mainly depends on the stress modes, grain orientation, twinning, etc. [16,17]. It is not clear whether alternative mechanisms such as twinning, grain boundary sliding are activated at such high temperatures. In addition, the extruded titanium alloy profile has a lamellar structure with uniform and coarse grains, and its plasticity and strength are lower than those of bimodal and tri-modal microstructures [18]. It remains unknown whether this microstructure pattern affects the TCA and, thus, influences the forming behavior of the alloys.
Hence, this paper is to investigate the tensile and compressive responses of the extruded titanium alloy profiles at high temperatures with HSB forming conditions. The stress-strain behavior and microstructure evolutions under tension and compression tests of the extrusion at 923 to 1023 K were studied. Based on the testing results, the effects of deformation temperature and strain rate on TCA were discussed.

2. Materials and Methods
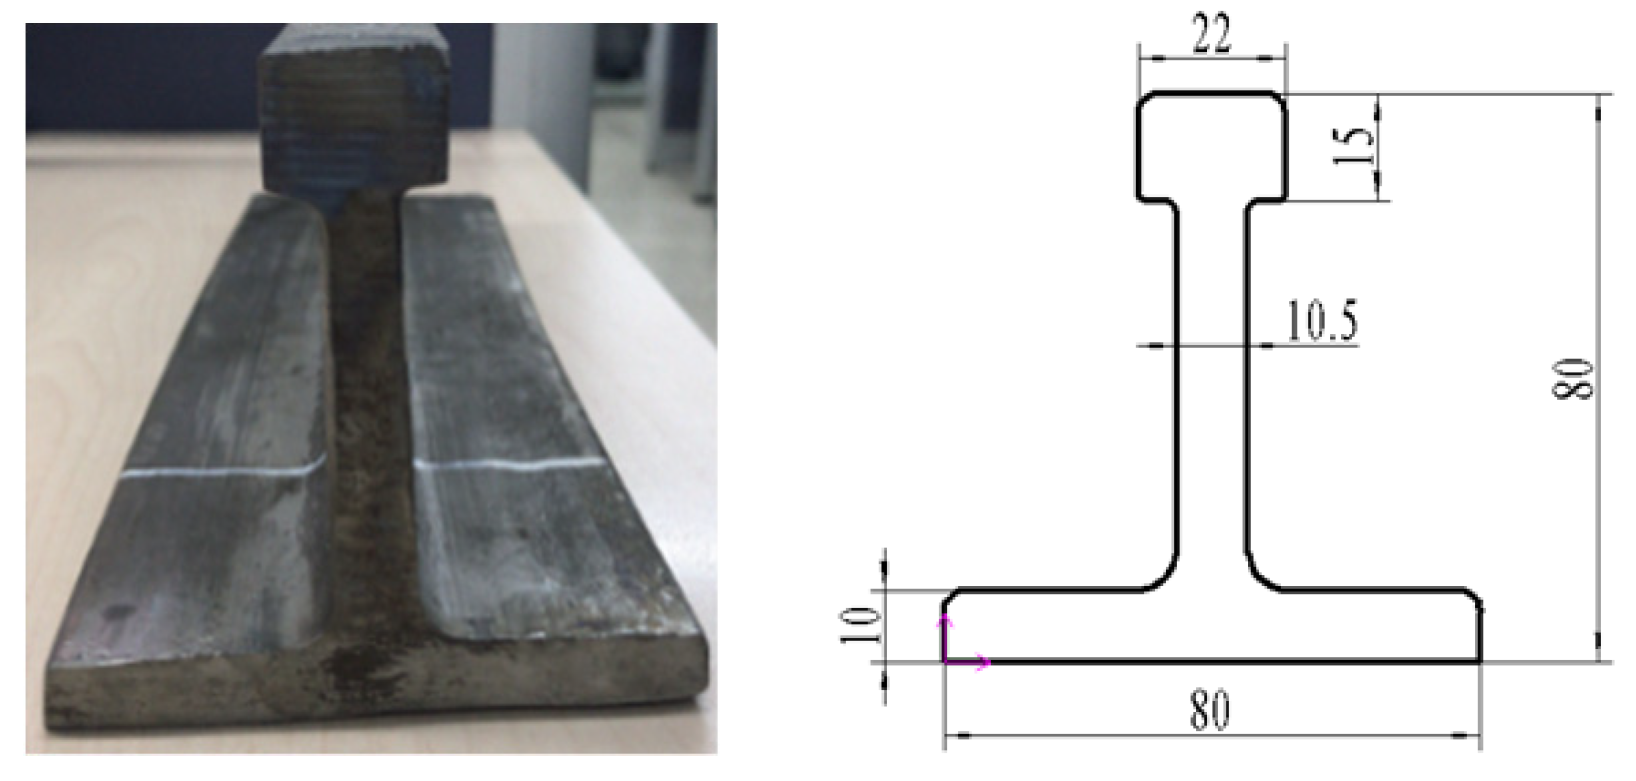
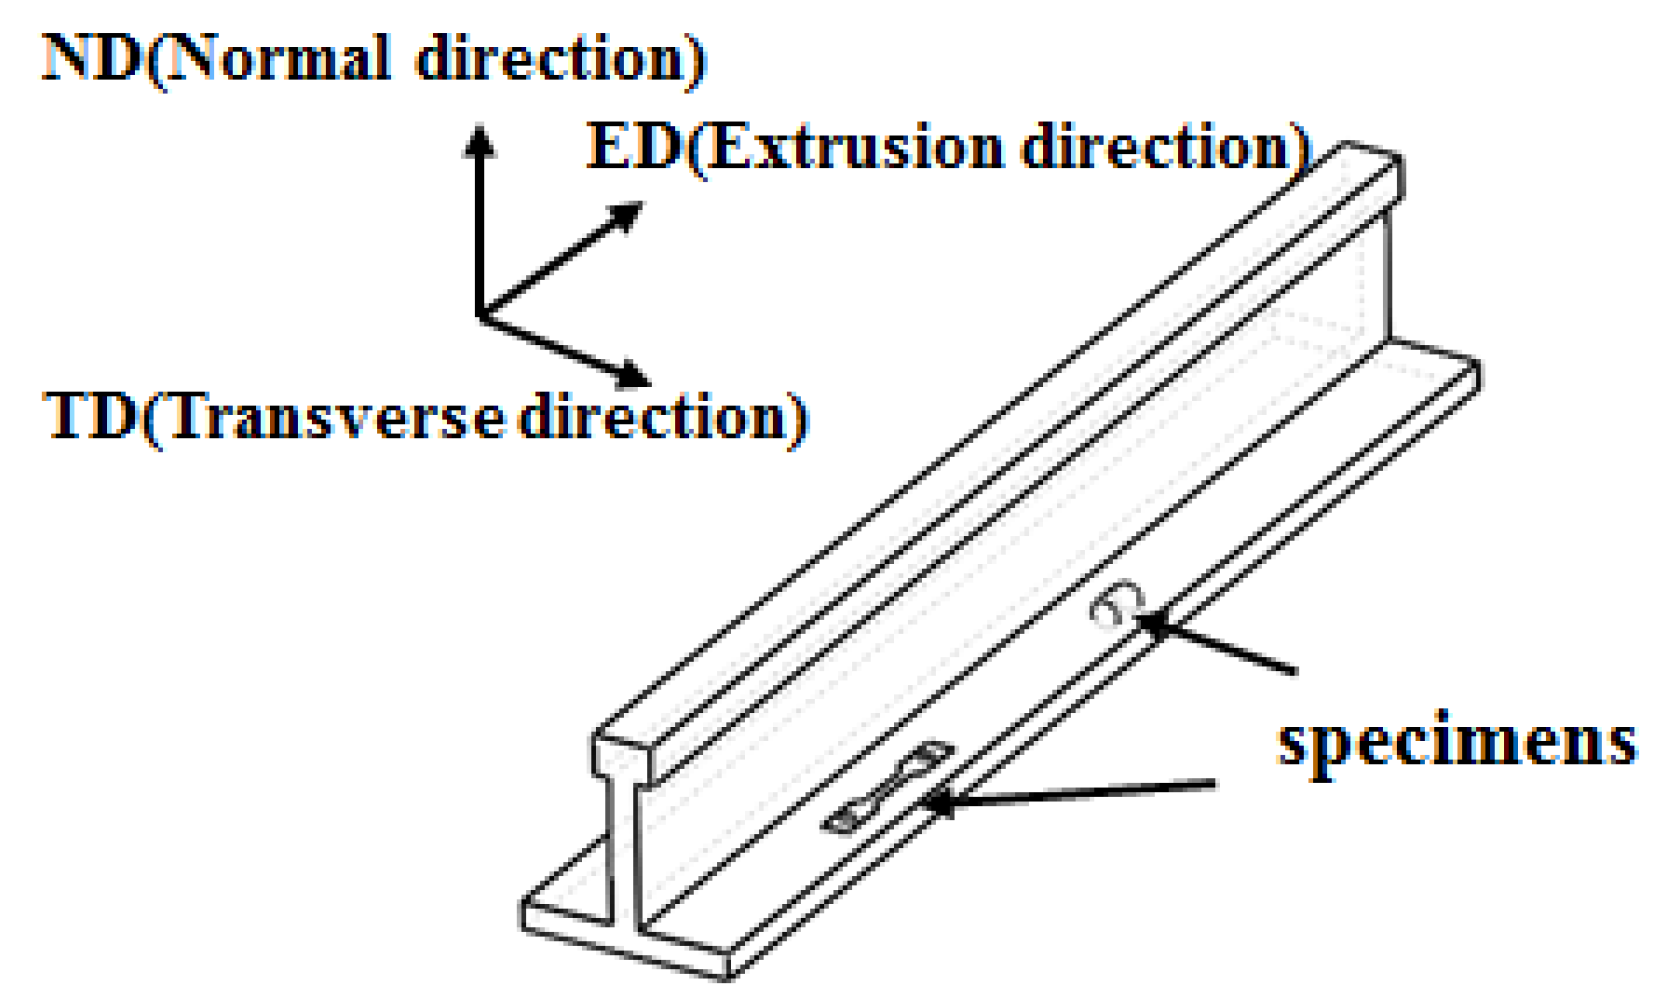
2.1. Material

The TA15 extrusion profiles, provided by Baoji Titanium Industry Co., Ltd. (Baoji, China) [19] according to AMST9046B [20] was used in this research. The alloys were annealed at 823 K for 2 h and then cooled to room temperature to eliminate the initial residual stress. The chemical composition (in wt.%) and cross-sectional dimensions of TA15 are listed in Table 1 and Figure 3. The tensile and compressive specimens are processed along the extrusion direction of the titanium profile, see in Figure 4.

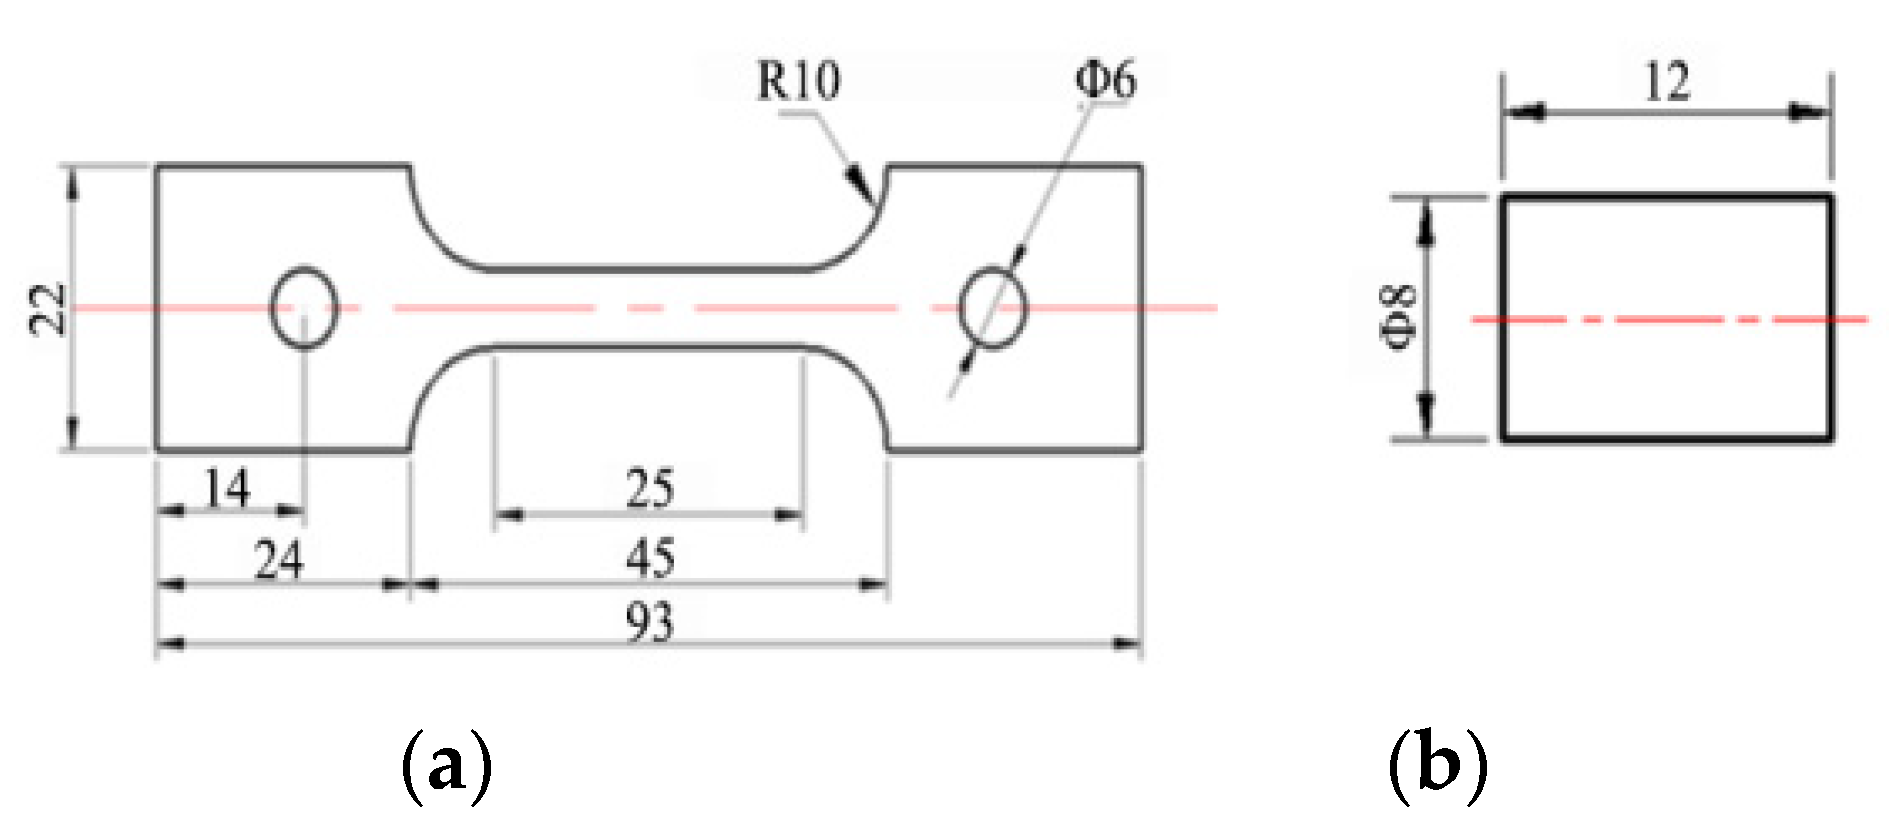
2.2. Mechanical Tests

The tensile tests were carried out on DDL50 testing machine at high temperature (923–1023 K). The dimension of tensile samples (refer to ISO 6892-2 [21]) is shown in Figure 5a. For tension tests, the samples are heated at a rate of 50 K/min and then held for 5 min to maintain temperature uniformity [19].
The compressive specimens are solid cylinders with a diameter of 8.0 mm and a length of 12 mm, as shown in Figure 5b. Additionally, the test was conducted on the Gleeble-1500 thermal/mechanical simulator (Gleebel Heat Simulator, Dynamic Systems Inc., Austin, TX USA). These specimens are heated to a specified temperature by 5 K/s and then kept for 5 min. It should be noted that although different heating rates have been adopted in the tensile and compressive tests due to the limitations of testing equipment, few effects are believed to be raised in the mechanical properties, as stated in a previous study by Shen et al. [22]. Considering the heat dissipation capacity of the equipment, the strain rate of the compression test is between 0.001–0.05 s−1.

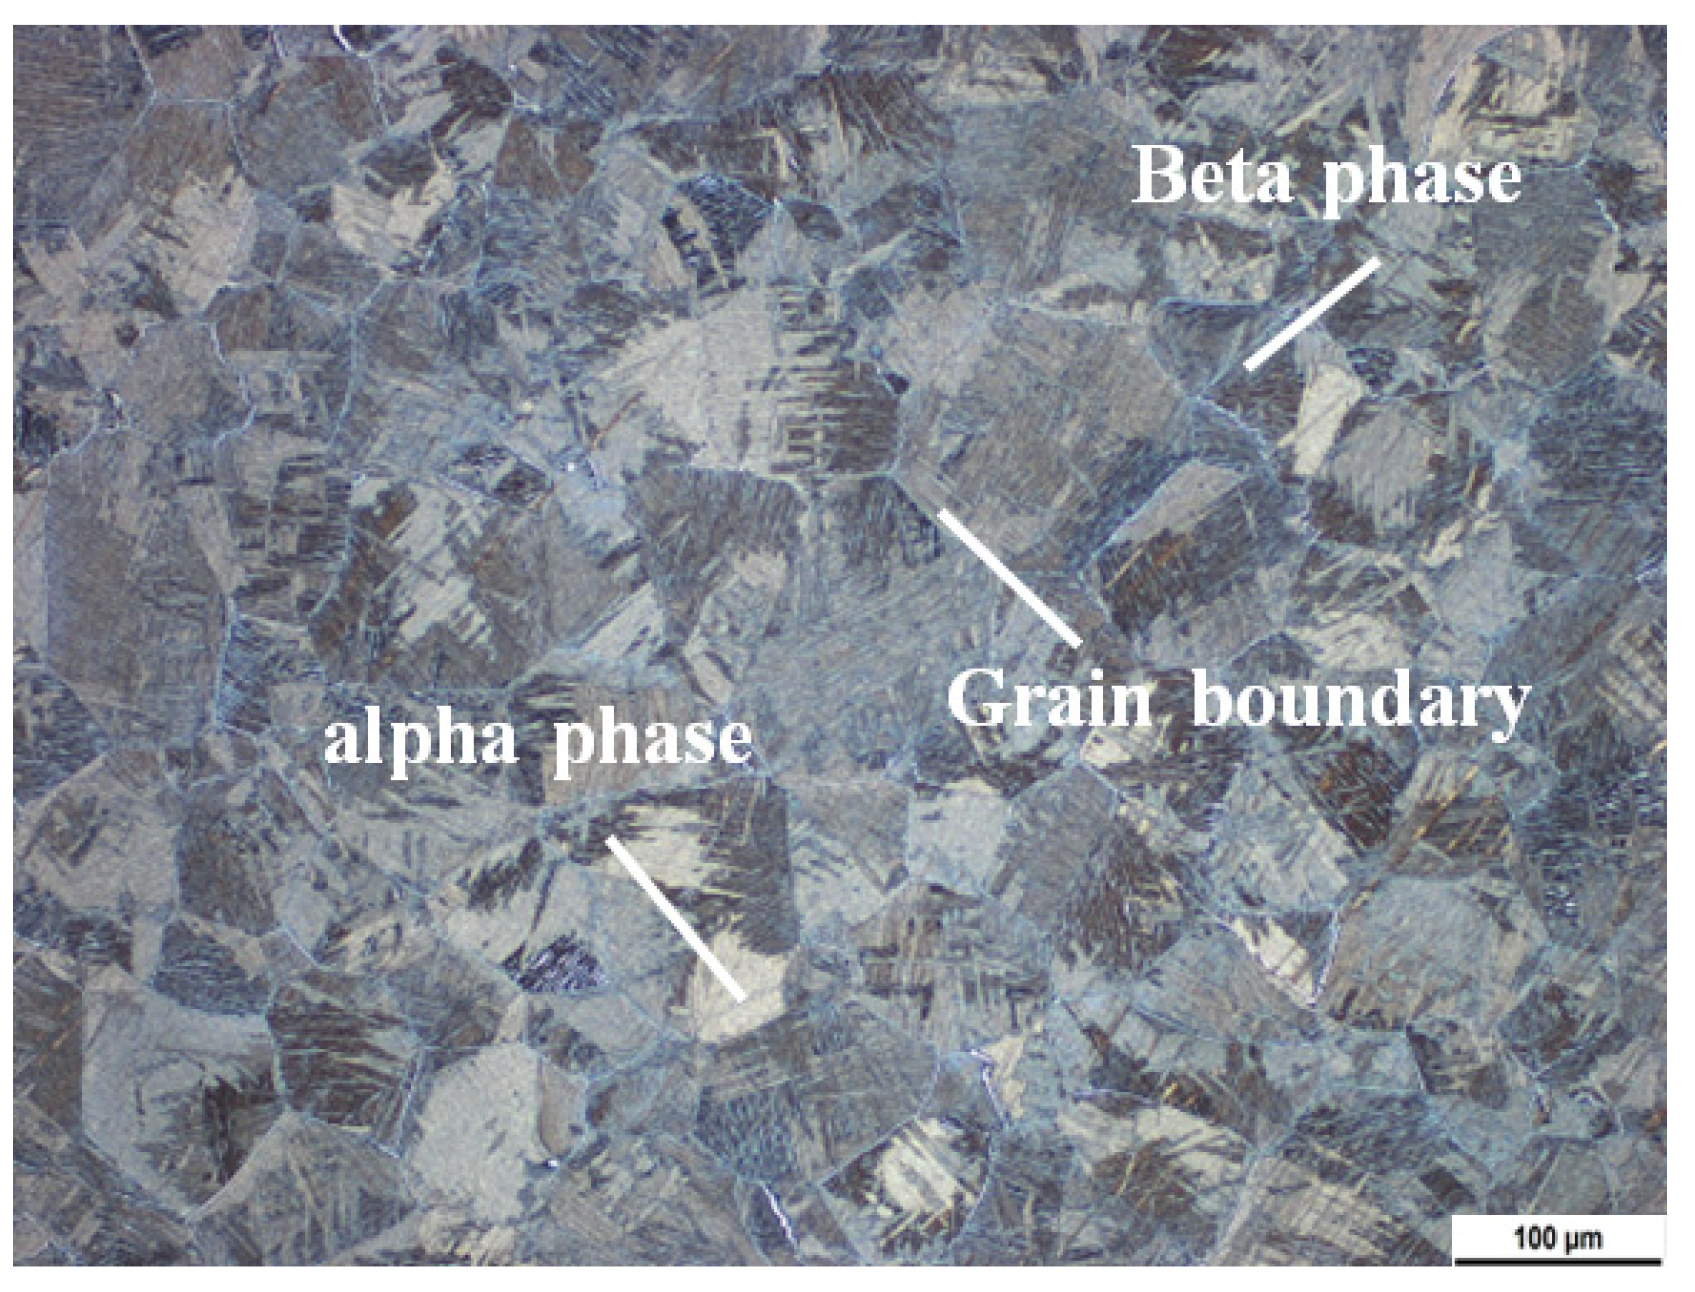
2.3. OM Observations

To identify the grain sizes of TA15, some tested samples for metallographic observations were prepared according to ISO 4499-1 [23]. The tensile specimens (the true strain is 0.25–0.4) were processed from the gauge length, while the compressive samples (the true stain is 0.7) were conducted along parallel compression direction by using a wire-electrode cutting machine. Then, the microstructure of TA15 alloy was observed under a Leica DM4000M metallographic microscope.
In this paper, the test scheme of TA15 titanium alloy with different temperature and strain rates is shown in Table 2.

3. Results

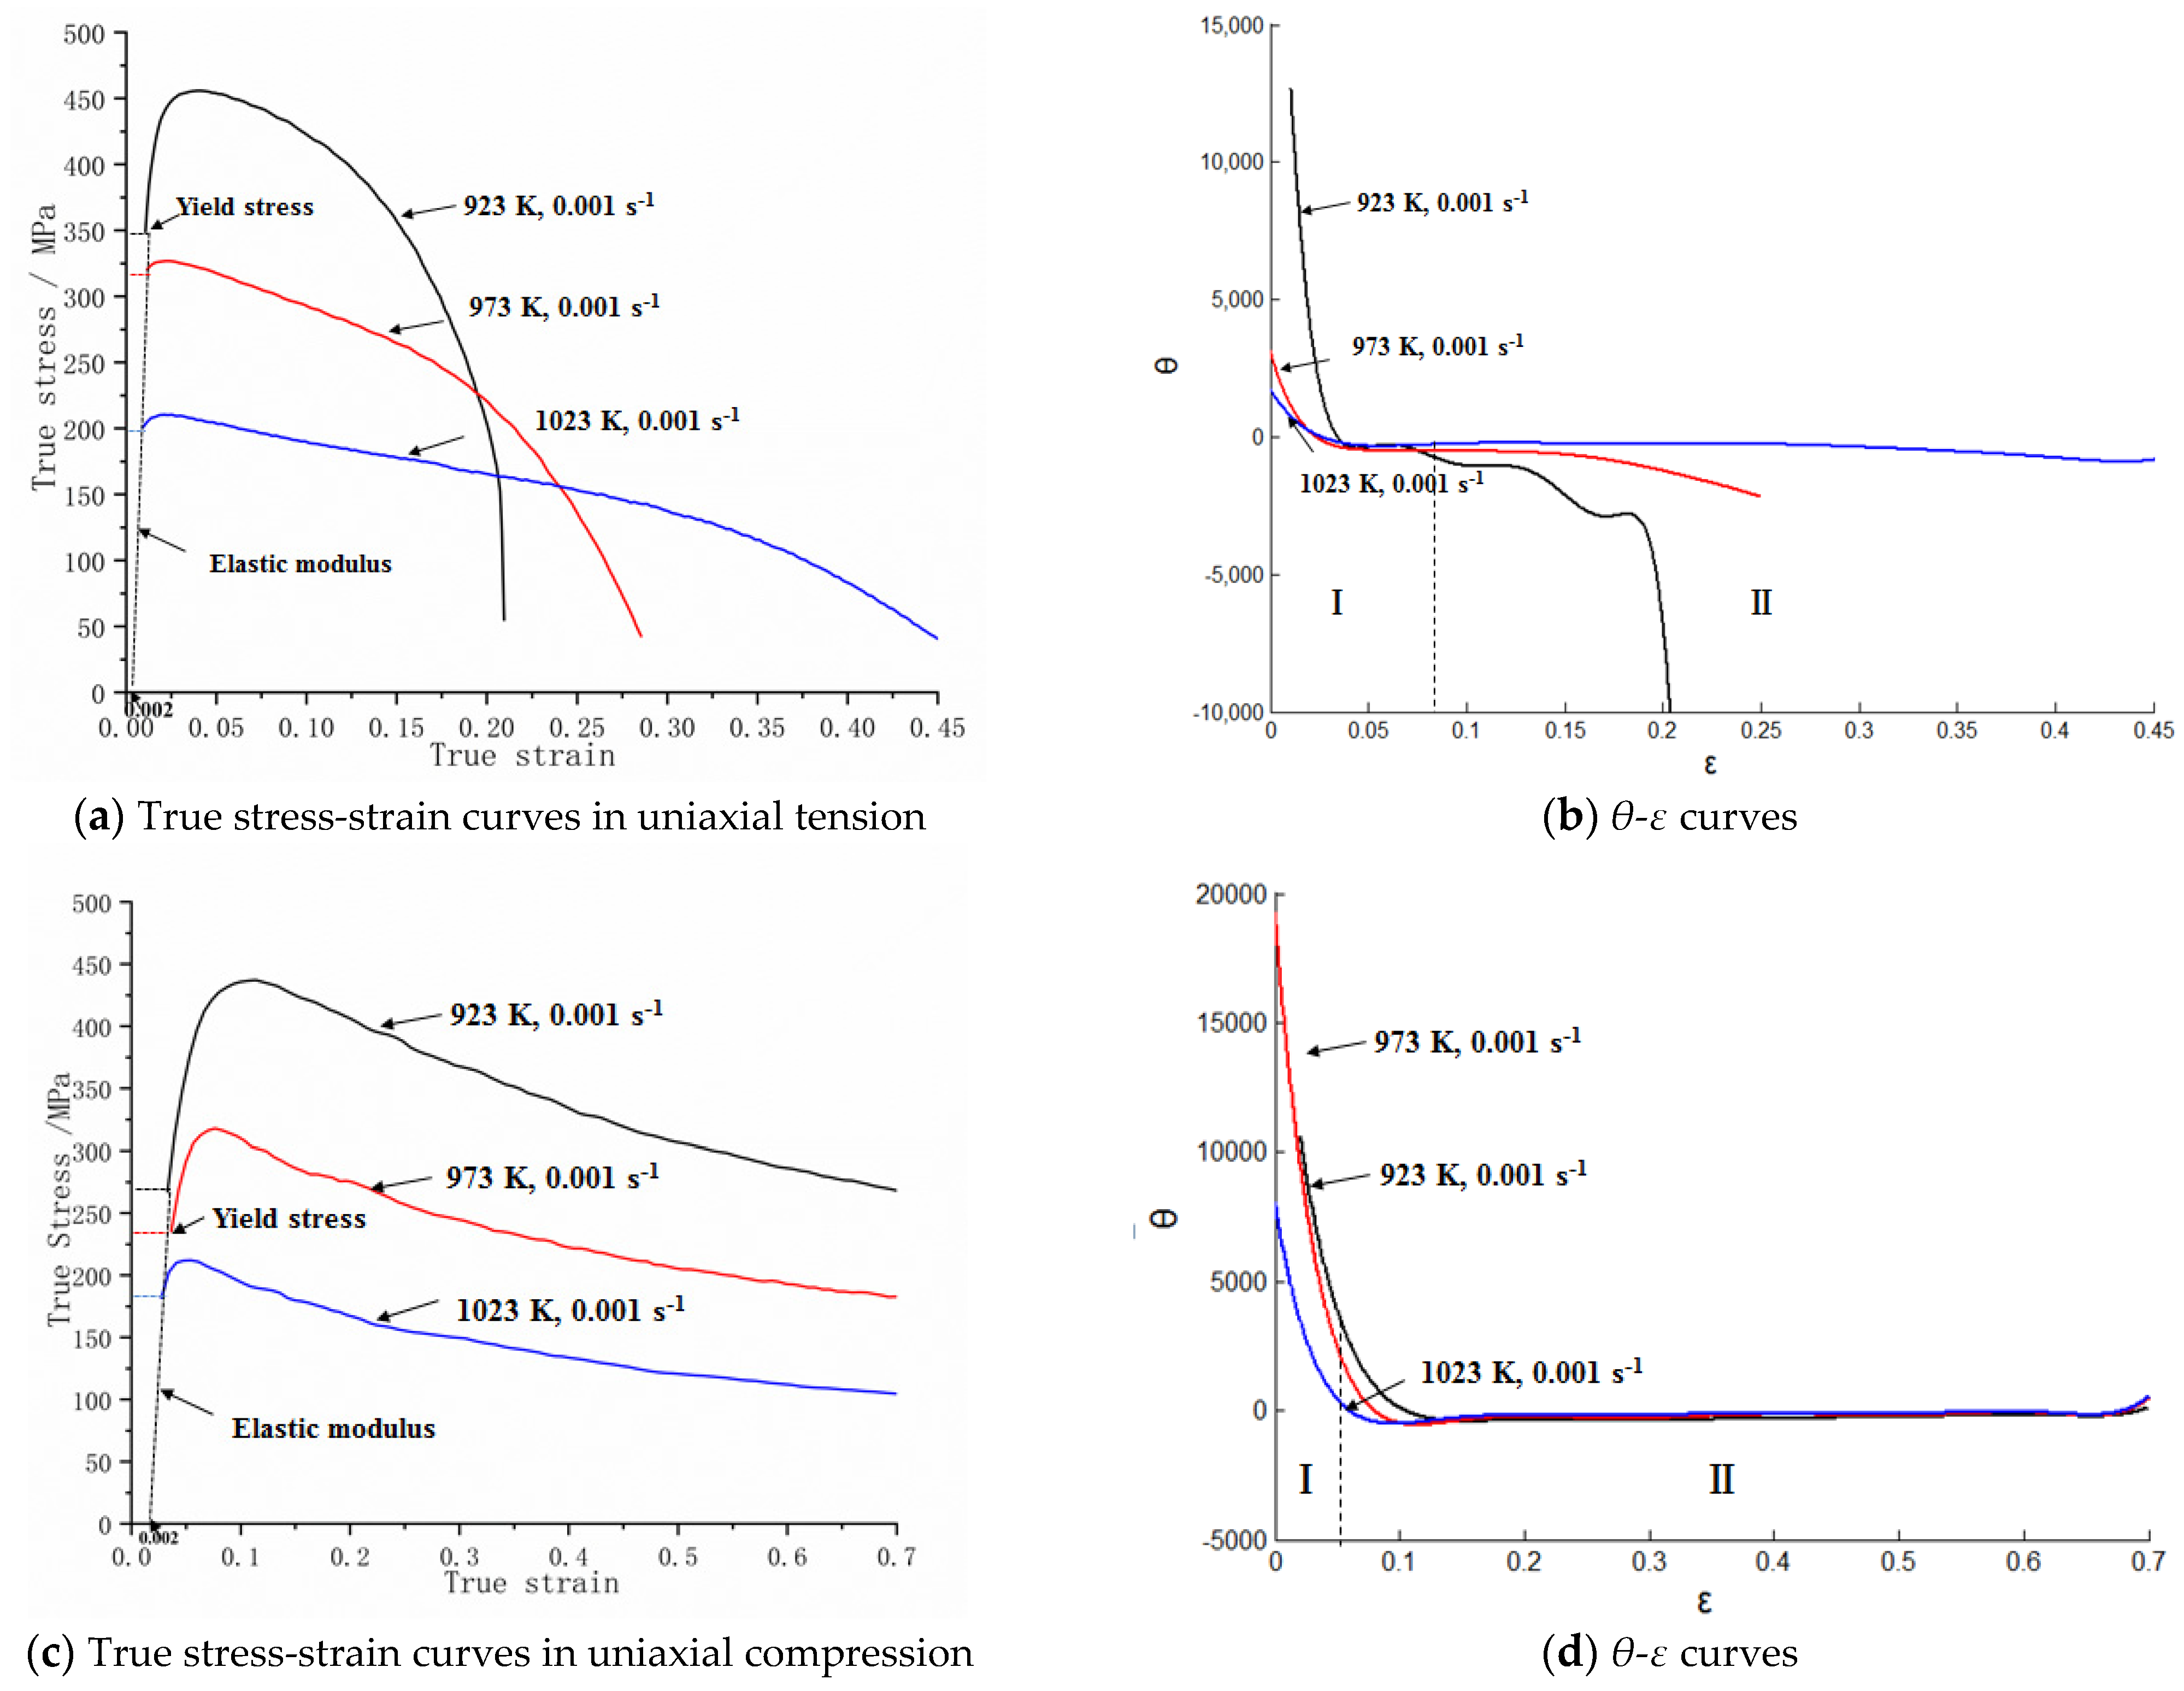
3.1. Stress–Strain Behavior at Different Temperatures

The true stress–strain curves (σ-ε) were derived from the engineering stress–strain data based on the assumption of incompressibility plastic deformation. Meanwhile, the corresponding strain hardening–true strain curves (θ-ε) were also derived from the true stress–strain curve (σ-ε) to analyze the evolution of mechanical behavior [16]. The strain hardening rate (θ) is the slope of the stress–strain curves (σ-ε) and it can be defined as follows:
θ = [ d σ d σ ] ε ˙
where σ is the true flow stress (MPa), ε is the true strain and ε ˙ is the strain rate (s−1).
Figure 6 shows the σ-ε curves and corresponding work hardening rate (θ-ε) curves of the TA15 profiles at different temperatures. The 0.2% offset yield stress σ 0.2 was defined as the experimental Young’s modulus fitted to the initial part of the stress-strain curves [24]. We can conclude that the flow stress of tension and compression decreases when the temperature rises from 923 to 1023 K. Figure 6a,c show that the yield stress σ 0.2 decreases about 150 MPa from 923 to 973 K, and the stress difference between 973 and 1023 K is about 100 MPa. Due to the high temperature softening effect [25], the stress curve shows a downward trend after passing the yield stress point, and the flow stress of titanium profiles is sensitive to the temperature. Figure 6b,d reveal that the different temperature also affects the work hardening rate (θ). The θ drops sharply at the beginning of the deformation and then becomes flat. In the uniaxial tension tests (Figure 6b), when the strain is larger than 0.08, it has a significant decrease and becomes negative at 923 K, which may be related to the local instability deformation [25]; when the temperature is 973 K and the strain exceed 0.2, θ starts to turn negative; it maintains stable when the temperature is 1023 K. In contrast, in uniaxial compression tests (Figure 6d), the difference of θ at different deformation temperature is small, and the curve is stable.

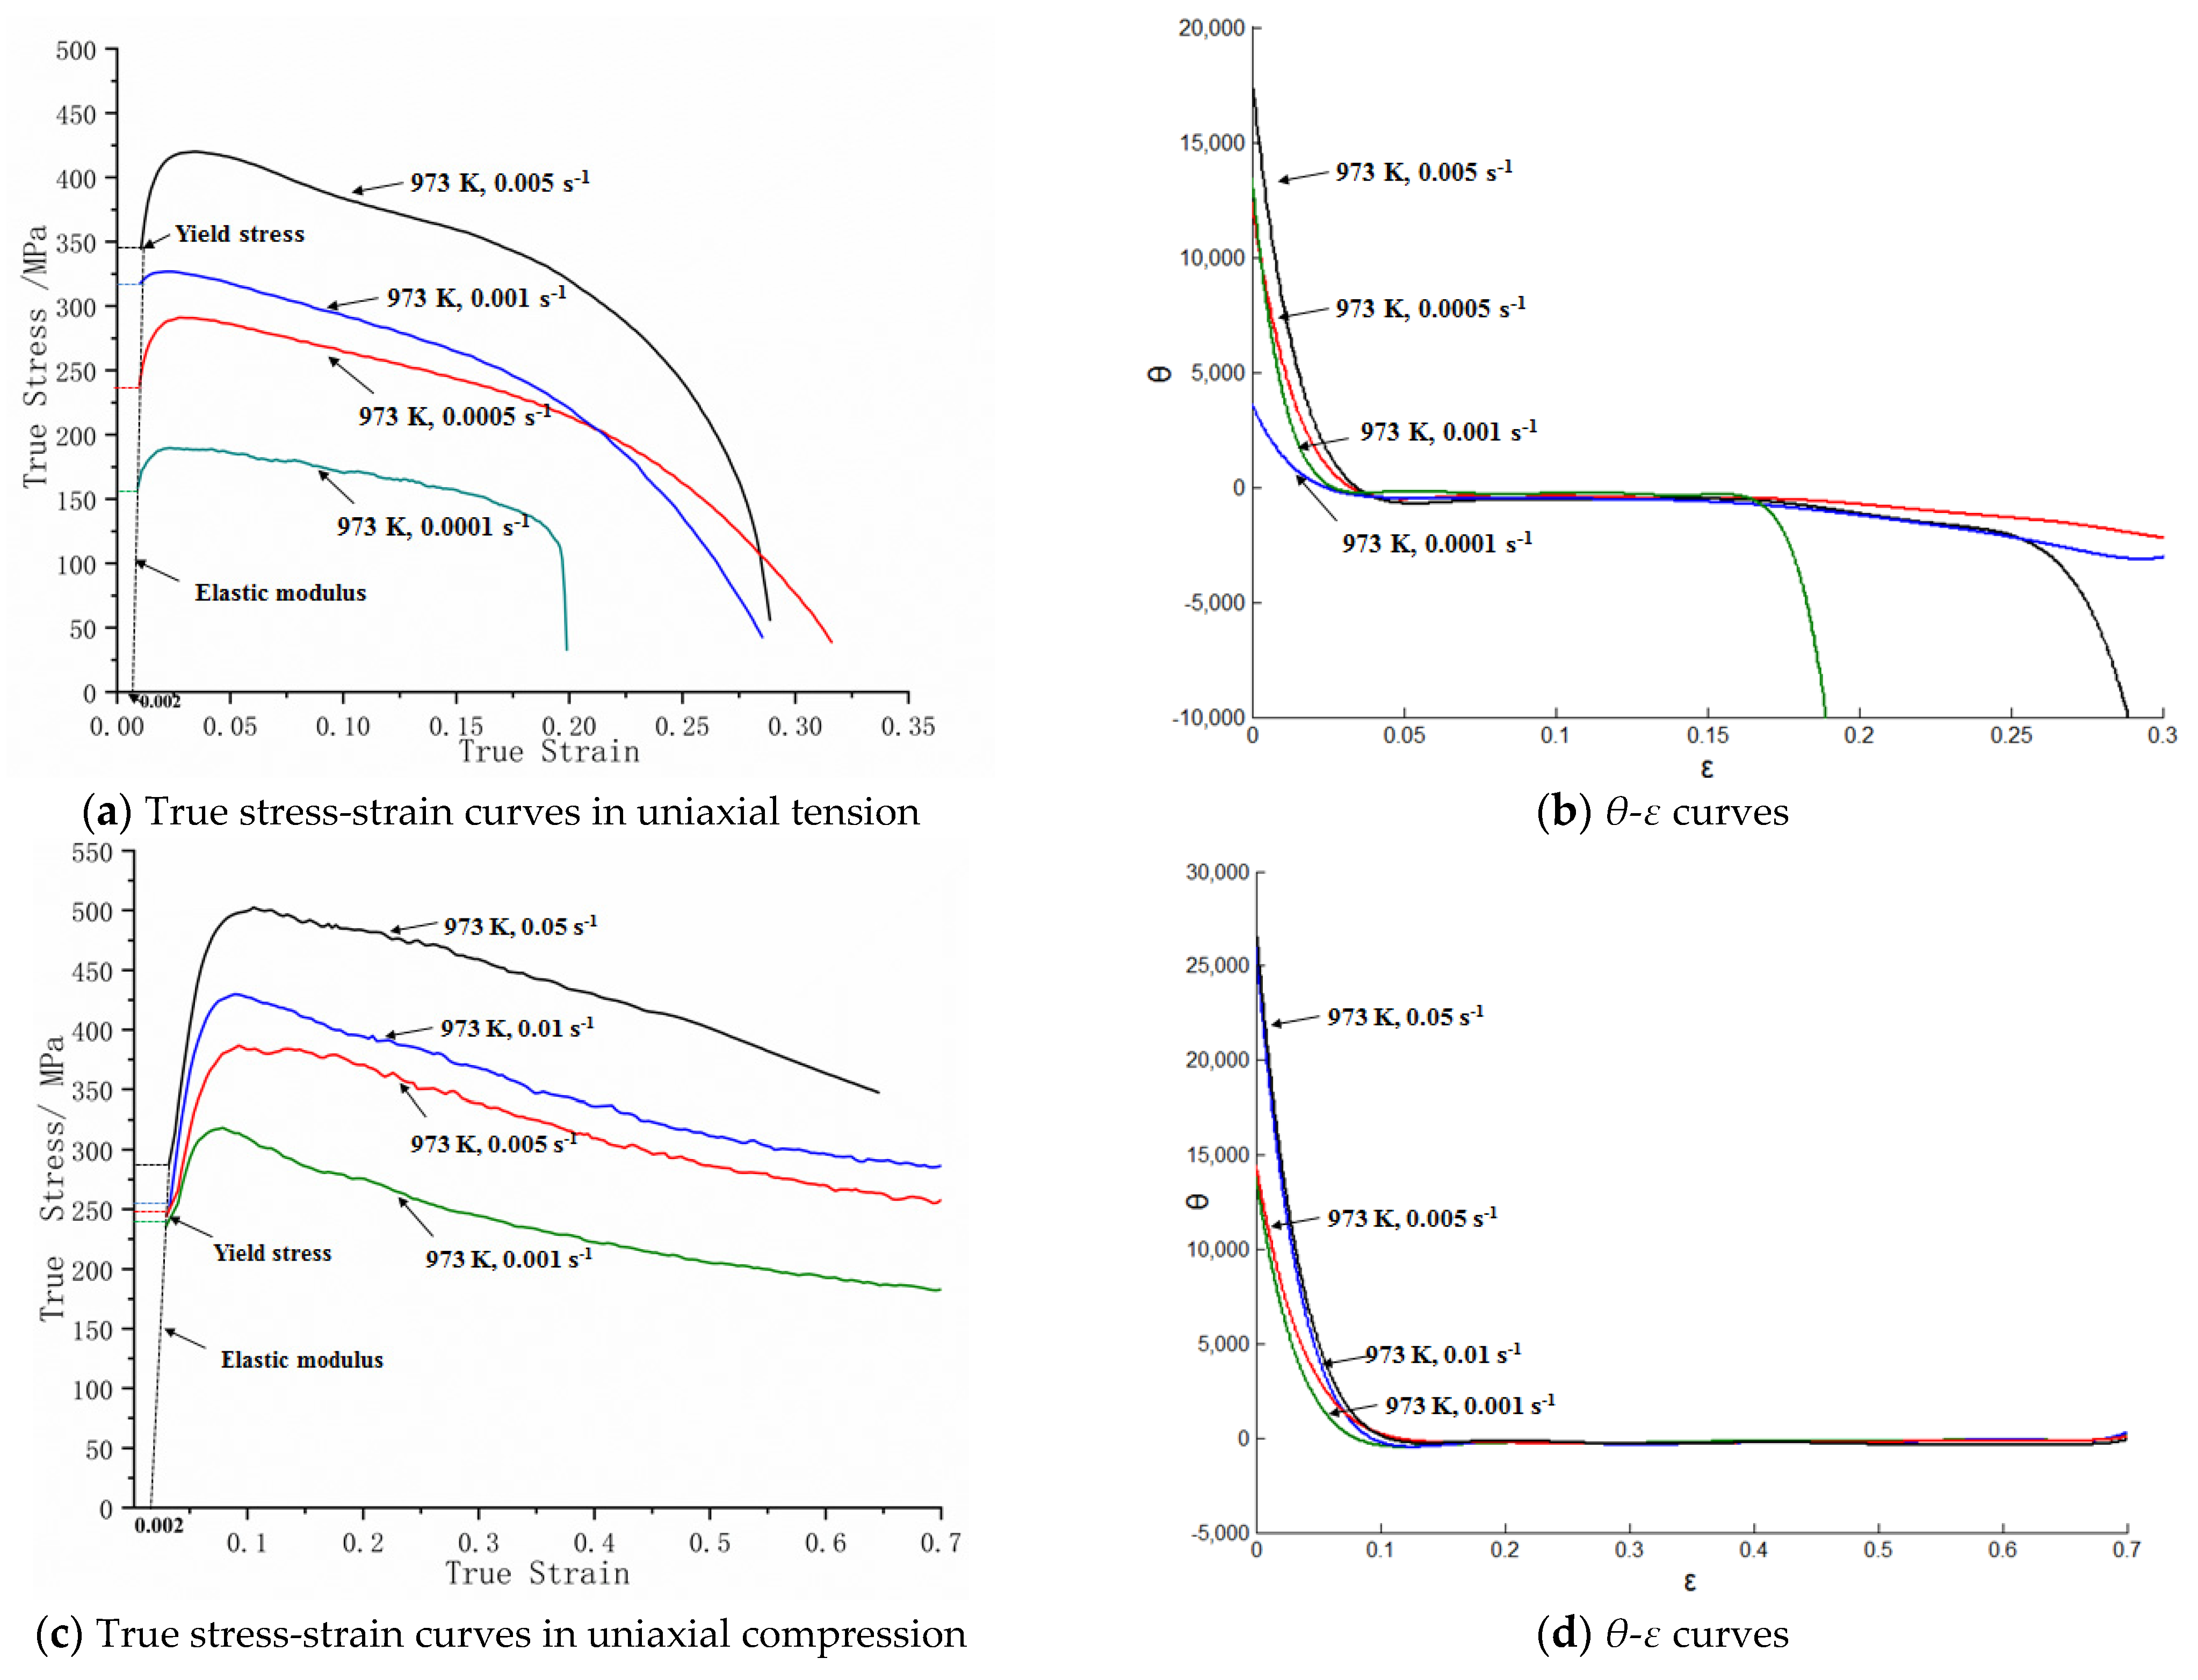
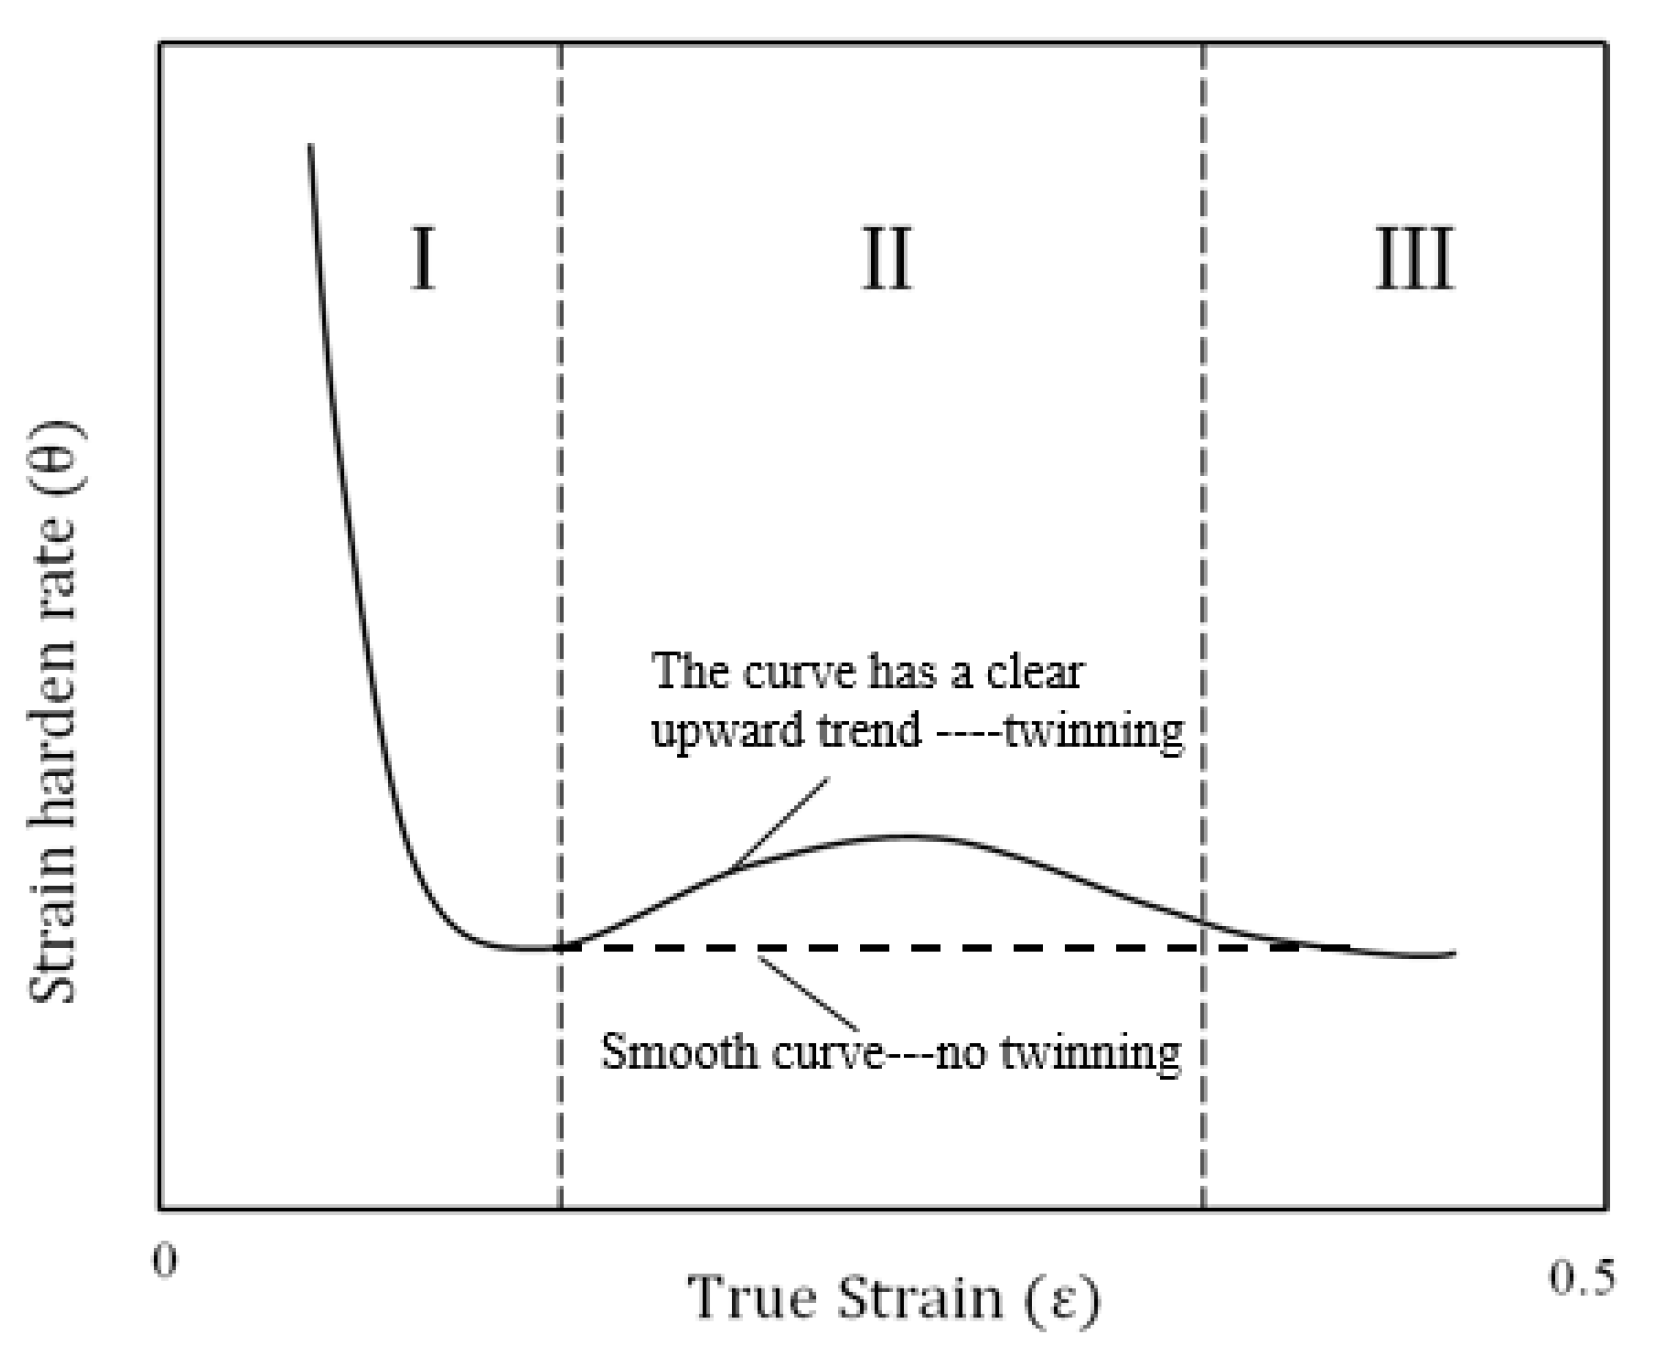
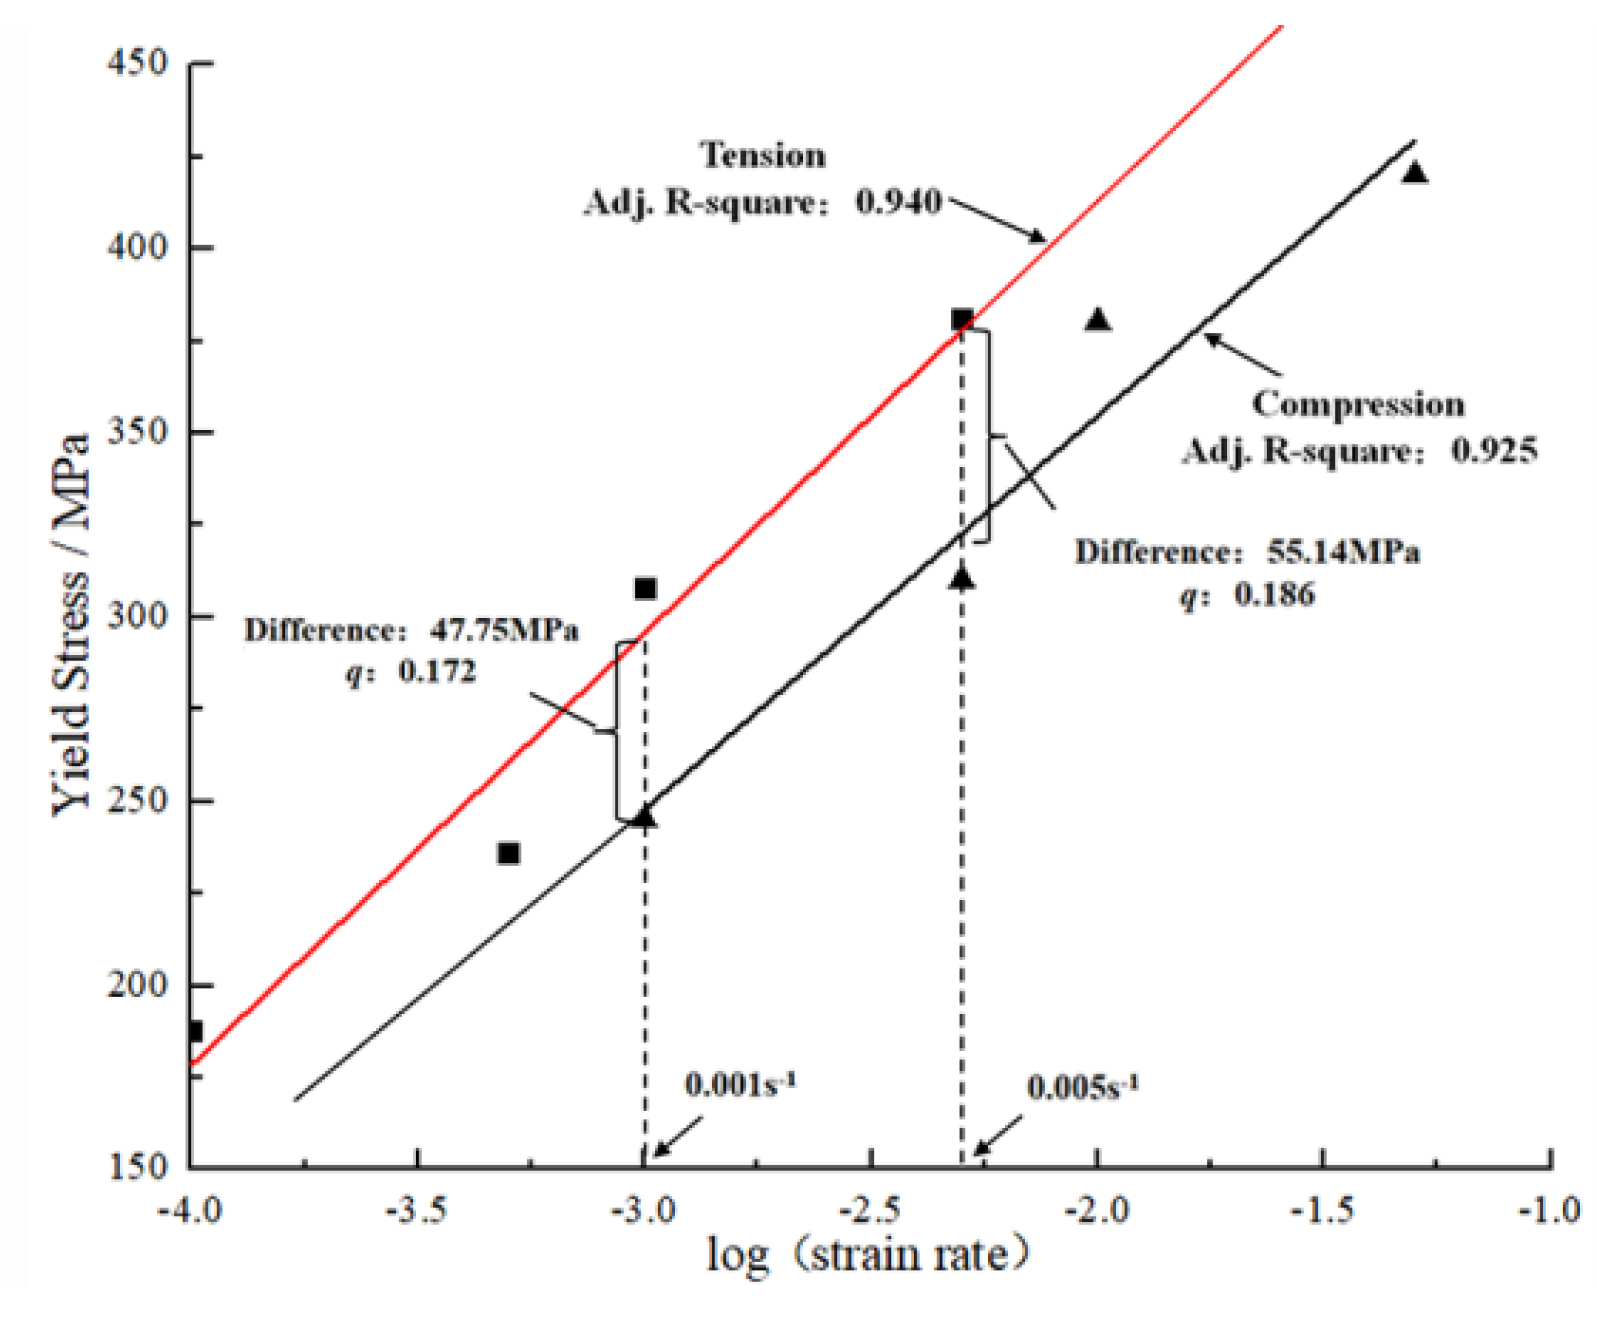
3.2. Stress-Strain Behavior at Different Strain Rates

Figure 7 shows the σ-ε and θ-ε curves at 973 K with different strain rates. It can be seen from Figure 7a,c that the tension and compression responses of TA15 profiles have a positive strain rate correlation within the tested rate range. As the strain rate increases from 0.0001 to 0.005 s−1, the yield stress rises from 150 to 368 MPa. According to Figure 7b,d, the θ changes little both in tensile and compressive deformation, and there is no three-stage hardening phenomenon [9] in (θ-ε) curves at 973 K.

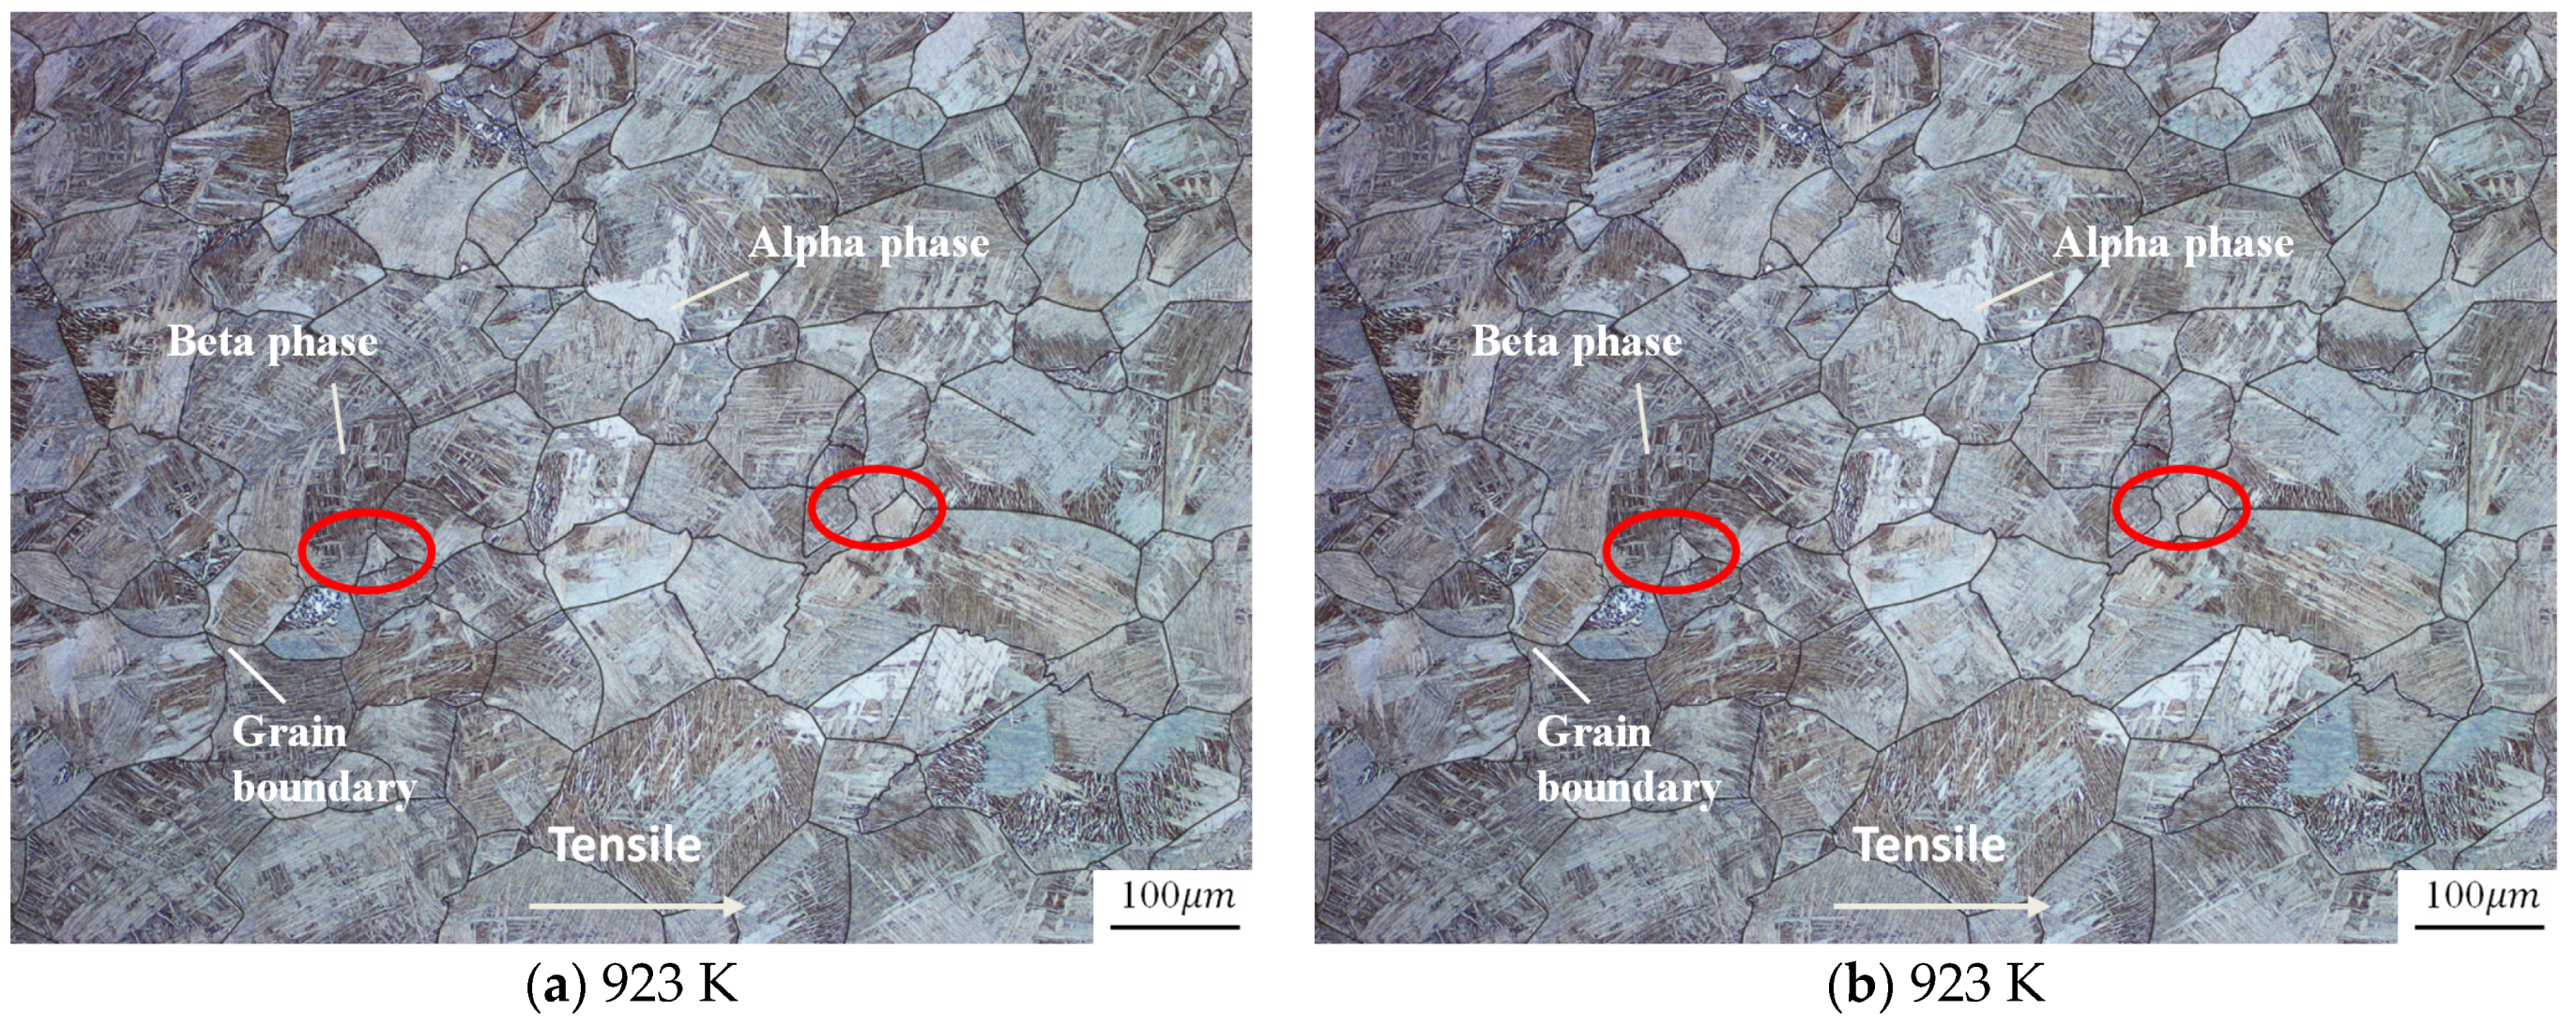
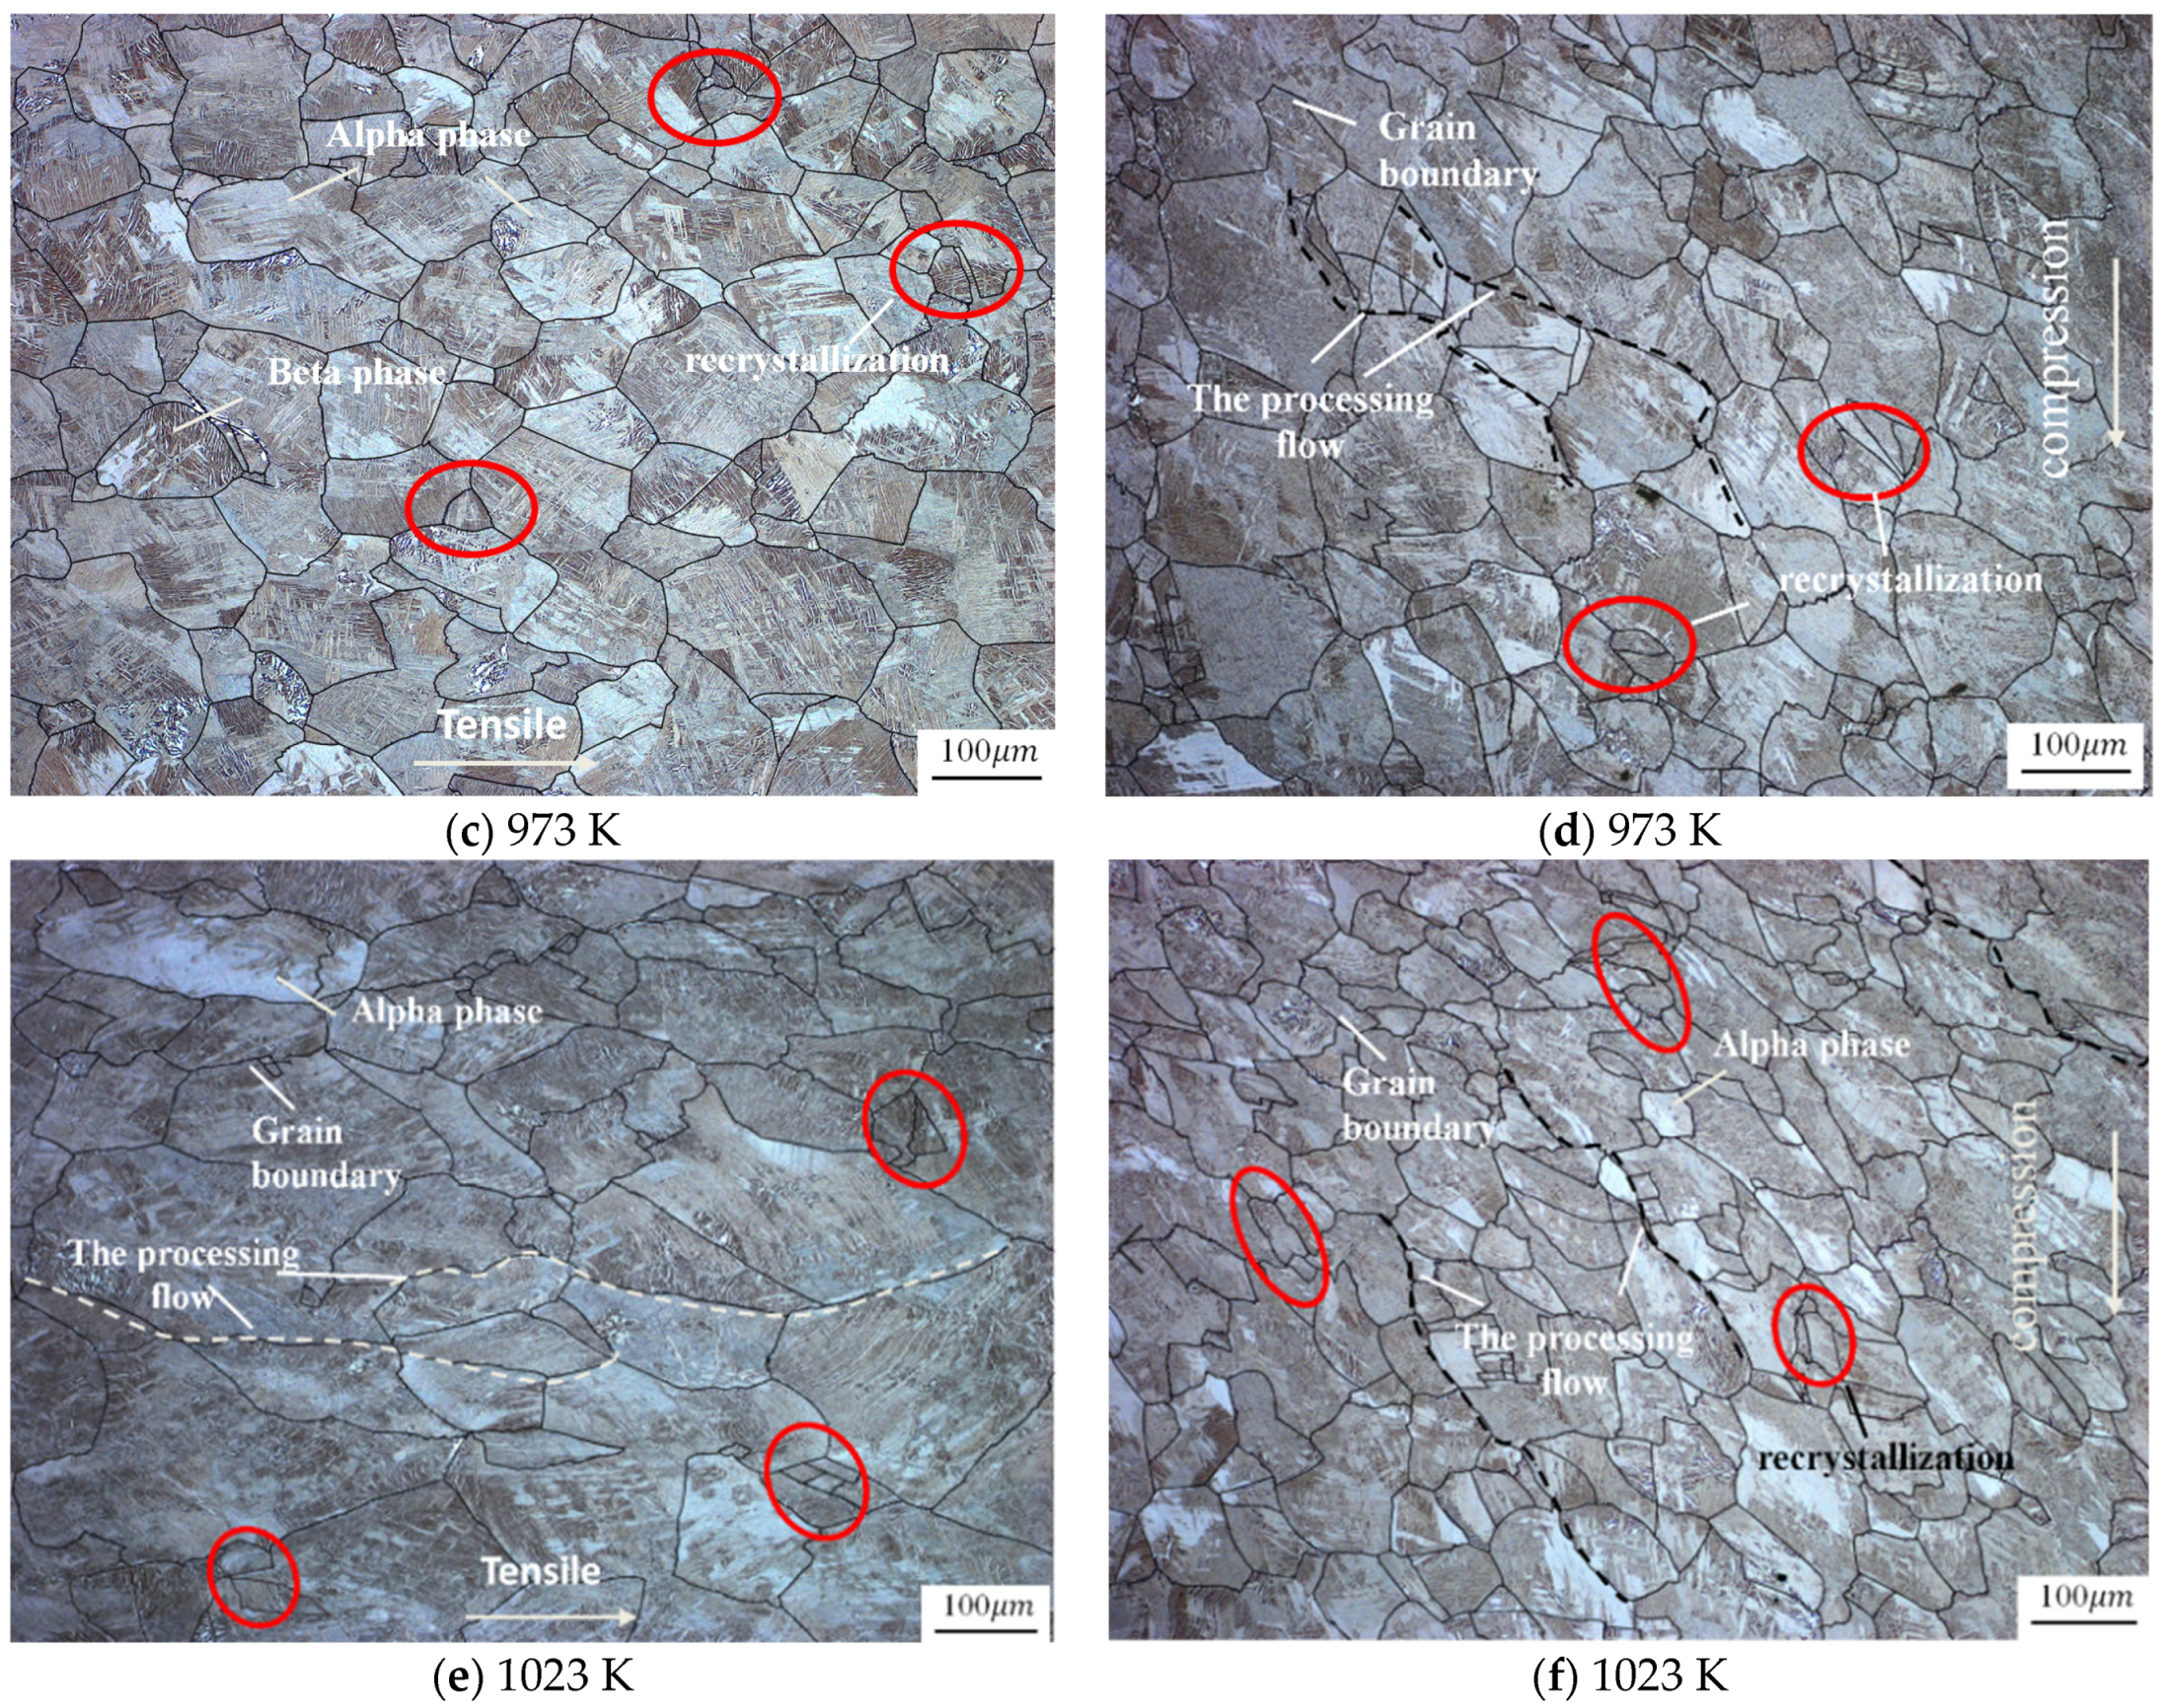
3.3. OM Microstructure

TA15 is a near-alpha titanium alloy with excellent thermal stability, outstanding room and medium temperature strength as well as weldability. It can be used for aircraft structural components such as bulkheads and ribbed wall panels [26]. The original microstructure of TA15 titanium alloy is presented in Figure 8. TA15 was heated to above the phase transition temperature (about 1263 K) and kept for one hour [19]. Then, the profile was extruded in the beta range using glass lubrication and flat extrusion dies. Since the heat and deformation temperature is higher than its phase transition temperature (about 30–50 K), the microstructure displays a typical lamellar structure, which is characterized by complete β grain boundaries, a well-developed lamellar α structure within the grains and an obvious grain boundary. Hence, the tested alloy with a lamellar structure has excellent fracture toughness and creep properties [27].
The specimens are water quenched immediately after deformation to retain the deformed structure and then observe the microstructure. The microstructures of the tested alloy at different temperatures are presented in Figure 9. Figure 9a is the metallographic structure of the tensile deformation sample at 923 K with a true stain of 0.2. We can see that there are clear β grain boundaries within lamellar α, and there are dynamically recrystallized grains distributed at the β grain boundaries. As the temperature increases, we can observe from Figure 9c that the β grains tend to elongate and grow at 973 K, the thickness of lamellar α increases and small fine grains also appeared in the grain boundaries. When the deformation temperature rises to 1023 K, we can conclude from Figure 9e that the β grains are further elongated and the true strain is about 0.45, the average grain size has increased significantly. During the tensile tests, we can tell from the OM results that the strain and temperature have little effect on dynamic recrystallization under the quasi-static conditions (0.001 s−1).
Compared with tensile tests, we also observed that the microstructure of the compressed samples with true strain is 0.7 at different temperatures. We can see from Figure 9b that there is dynamic recrystallization, which is characterized by a large deal of fine grains at the grain boundaries at 923 K, resulting in the average grain size being smaller than that in tension. When the temperature rises to 973 K, as shown in Figure 9d, more fine grains appear at the grain boundaries, and the processing flow is approximately along the 45° to the axis of compression loading. According to Figure 9f, the grown β grains are easily to observe due to the external force at a high temperature and the dynamic recrystallization of 1023 K is higher than that of 923 K. The average grain size is the smallest and the processing flow is more evident and clearer.

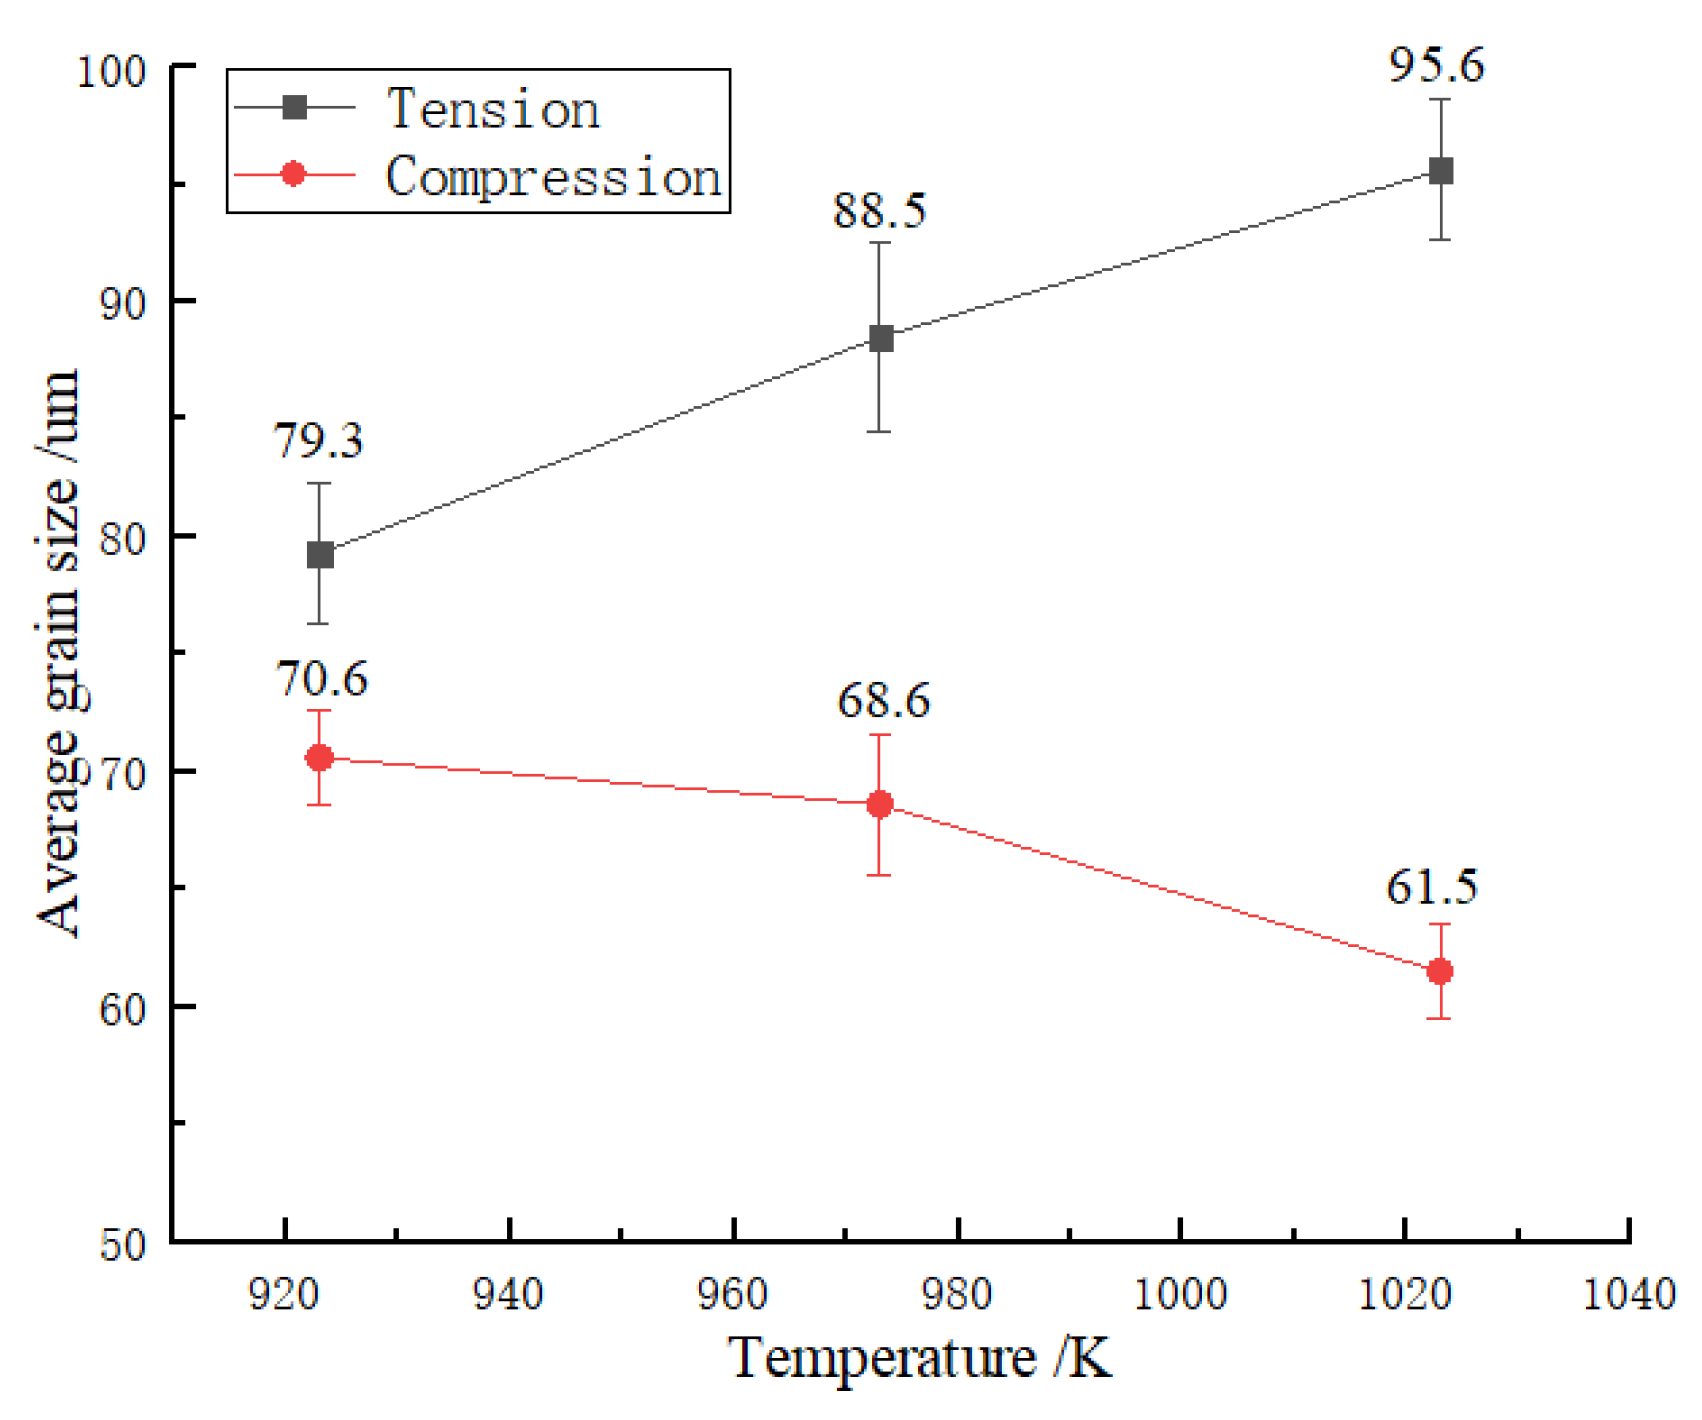
3.3.1. The Average Grain Size

The intercept point method [11] was used to analyze the average size of β grains from the OM results in Figure 9, and the results are shown in Figure 10. Figure 10 indicates that the average grain size in tension grows from 79.3 to 95.6 μm when the temperature increases from 923 to 1023 K, while that in compression is from 70.6 to 61.5 μm mostly due to recrystallization.

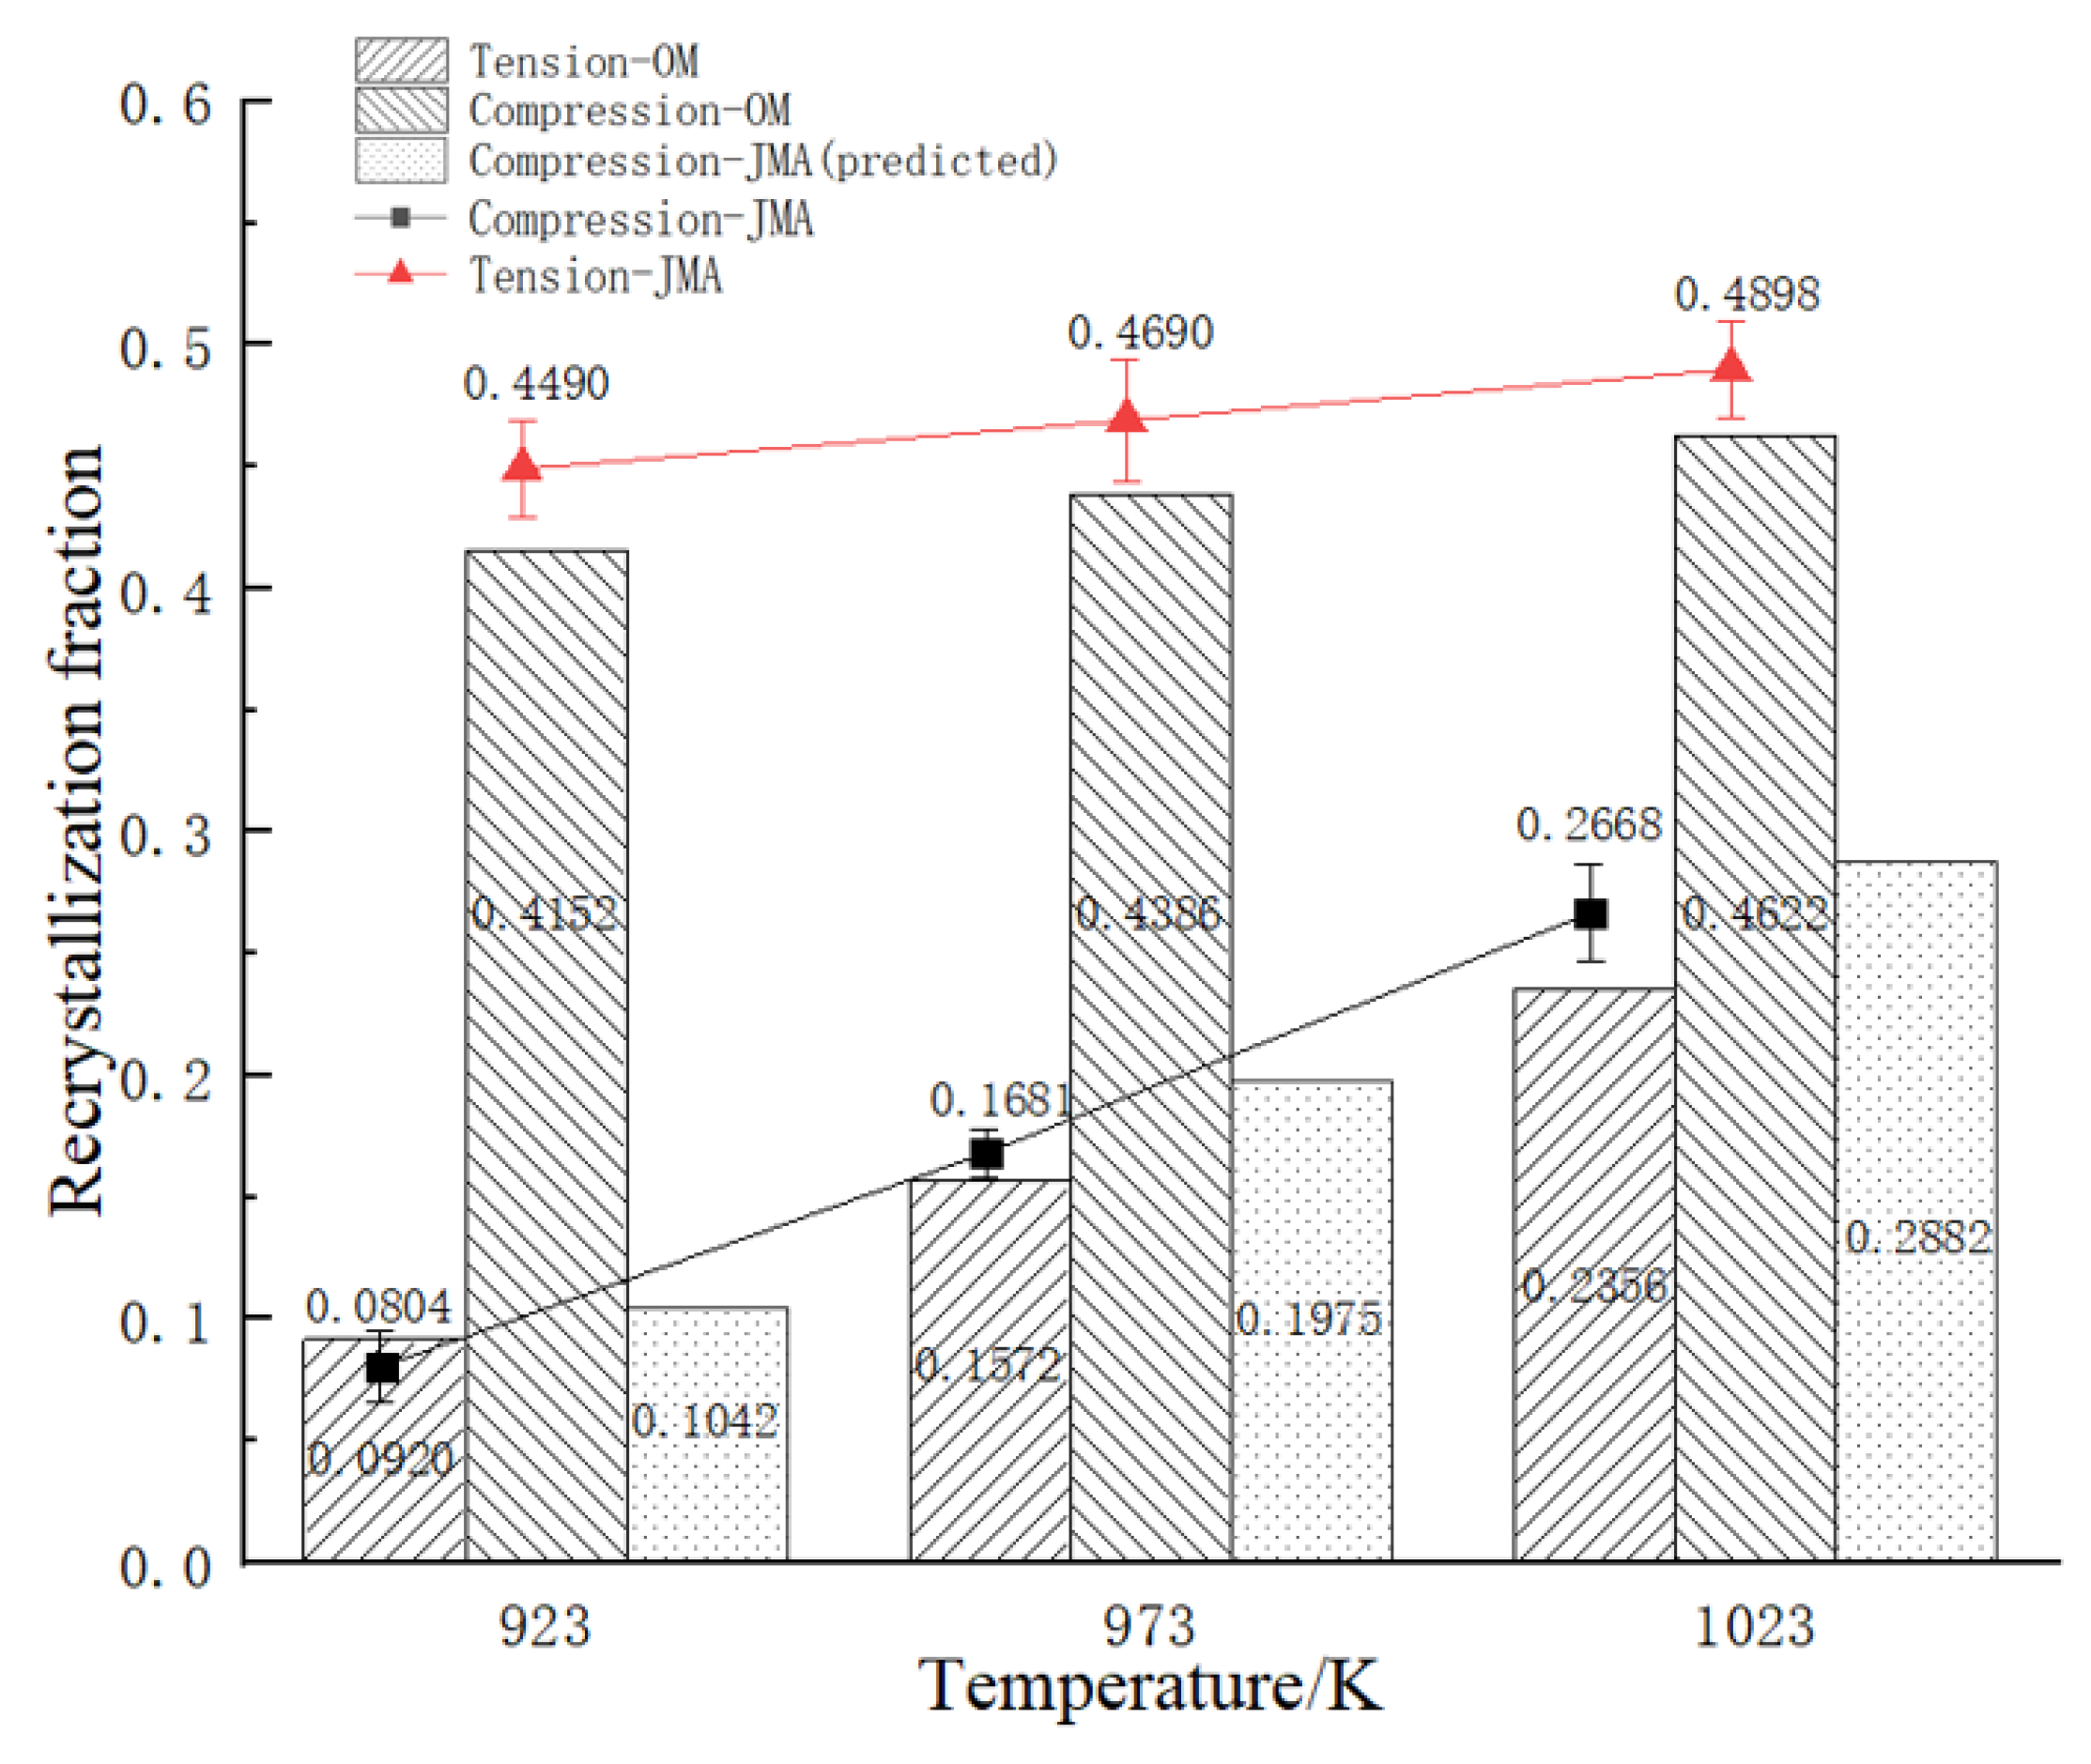
3.3.2. The Recrystallization Fraction

Due to the low strain rate and long deformation time in this experiment, the dynamically recrystallized grains may be swallowed up or grow up, the accuracy of the data obtained using metallographic methods have some fluctuations [28]. Ou [29] combined the metal-graphic observation method and data extrapolation method to quantify and simplified the Avrami recrystallization kinetic equation [30,31]. The dynamic recrystallization kinetic model generally adopts the following Johnson-Mehl-Avrami (JMA) Equation:
X d R X = 1 exp [ k × ( ε ε c ε 0.5 ) n d ] ,   ε ε c
where k and nd are the material parameters, and their values are 0.6245 and 1.0848 [29], respectively; X d R X is the dynamic recrystallization volume fraction; ε c is the critical strain of dynamic recrystallization; ε is the true strain and ε 0.5 is the strain when the dynamic recrystallization reaches 50%. According to Yue [32], when the strain rate maintains a constant, ε 0.5 and the temperature T (K) are approximately linear in relation, as shown in Equation (3), the value of ε 0.5 at a strain rate of 0.001 s−1 at 1323 K is 0.42, for ease of calculation, we take the ε 0.5 , T of 1023 K as the calculation basis and the value of ε 0.5 in this paper is 0.6.
ε 0.5 , T = 0.0006 T + 1.2138
The dynamic recrystallization critical strain ε c is represented by the Sellars model [33] as follows:
ε c = k 1 · ε p
ε p = a 1 × Z a 2
Z = ε ˙   · e x p ( Q / R T )
where ε p is the peak strain; k1 and a 1 are constants, and their values are 0.504 and 0.0341, respectively; a 2 is 0.0810 and 0.0605 in tension and compression, respectively [29]. Z is the Zener–Hollomon [34] parameter; ε ˙ is the strain rate (s−1), 0.001 s−1; Q is the deformation activation energy, 228,000 J/mol; R is the gas constant, 8.314 J (mol∙K) and T is the absolute temperature (K) [35].
Combining Equation (5) with Equation (6), Equation (4) can be simplified as follows:
ε c = 1.72 × 10 2 · Z a 2
The calculation results of the parameters are shown in Table 3.
The above-described calculation results into Equation (2); it can be simplified as follows:
X d R X = 1 exp [ 0.6245 × ( ε ε c ε 0.5 , T ) 1.0848 ] ,   ε ε c
where ε c is the dynamic recrystallization critical strain at 923–1023 K, ε takes the average strain value 0.2, 0.3 and 0.4 in tension and takes 0.7 in compression tests, respectively.
The calculated results were compared with the results obtained from the microscopic observation [9] to verify the validity of the JMA parameters. Additionally, on this basis, the X d R X of compression test under small strain was calculated by using the JMA equation, and the result was compared with that of tensile test, as shown in Figure 11.
We can conclude from Figure 11 that the experimental X d R X in tension at 923 K, 973 K and 1023 K is 0.0920, 0.1572 and 0.2358, while the calculated X d R X in tension at the same temperature is 0.0804, 0.1681 and 0.2668, respectively. Additionally, the experimental X d R X in compression at 923 K, 973 K and 1023 K is 0.4152, 0.4386 and 0.4622, while the calculated X d R X in compression at the same temperature is 0.4490, 0.4690 and 0.4898, respectively. Due to the low strain rate, part of the recrystallized grains grew, causing the calculated X d R X to be higher than that of the OM results, the calculation result error is less than 10%. Additionally, the X d R X of the compression test was predicted by using the JMA equation to be 0.1042, 0.1975 and 0.2882, respectively. We can tell that the recrystallization fraction in compression is higher than that in tension under the same strain condition, and the recrystallization fraction increase as the temperature rises.

4. Discussion

4.1. Effect of Deformation Temperature on TCA

Various studies have [9,16] found that the work hardening rate (θ-ε) curves of hexagonal close-packed (HCP) materials usually consist of a three-stage character of deformation curves at room temperature, which is classified by its slope [9], as shown in Figure 12. The sudden drop of θ in stage I is mainly due to the dynamic recovery [25]. Additionally, the twin phenomenon generates in stage II and the slope presents a visible increase; this phenomenon is easy to observe in the study of TCA at room temperature [11,25]. In stage III, there is a decrease, mainly because of the saturation of the twin volume fraction.
As the deformation temperature increases, the strength of the grains and grain boundaries decreases, and the dislocation resistance decreases [22,27], leading to the strain hardening rate reducing sharply in stage I. As the true strain increases, as shown in Figure 10, the dynamic recrystallized grains aggregate near the grain boundaries, which can not only activate more slip systems but also can increase the number of slip systems and change the grain orientation like twins [16], reducing the force that hinders plastic deformation. Therefore, we can see from Figure 6b,d and Figure 7b,d that there is no uptrend in stage II and the σ-ε curves (Figure 6a,c and Figure 7a,c) display a significant softening effect at high temperatures. Hao [11] studied the asymmetry of the strain hardening of CP-Ti at 298–873 K and found that the θ increased significantly and peaked in stage II due to the occurrence of twins in a low temperature, but there are no twins generated and the θ-ε curves of stage II become flat at 873 K. Similarly, we can judge from the (θ-ε) curves (Figure 7b,d) that the θ drops dramatically in the initial deformation and then flattens at 923–1023 K, and there is a recrystallization phenomenon instead of twins in Figure 9. Consequently, we can preliminarily tell from Figure 12 that there is no twin generated in the two stress states under the high-temperature conditions.
To study the effect of temperature on TCA clearly, the asymmetry coefficient q is defined as follows [36]:
q = σ y t 0.2 σ y c 0.2 σ y t 0.2
where σ y t 0.2 represents the tensile yield stress and σ y c 0.2 is the compressive yield stress. The deformed yield stress and the asymmetry coefficient q of uniaxial tension and compression at different temperatures and strain rates are shown in Table 4.
It can be concluded that the asymmetry coefficient q gradually decreased from 0.23 to 0.13 when the temperature rose from 923 to 1023 K. Additionally, the asymmetry coefficient q increased from 0.20 to 0.28 as the strain rate rose from 0.001 to 0.005 s−1. Thus, the TCA decreases with the increasing temperature. Therefore, TCA is negatively correlated with temperature and positively correlated with strain rate at high temperatures and quasi-static conditions.
In the initial stage of deformation, the initial grain size increases as the deformation temperature rises, thereby reducing the grain strength and grain boundary strength, and the plastic flow of the material becomes easier. As the strain increases, the high-density dislocation produced by the dynamic recrystallization effect is significant, resulting in a decrease in flow stress. This is consistent with the σ-ε curves of TA15 in Figure 6. Under high-temperature conditions, the dynamic recrystallization phenomenon causes recrystallized grains to appear near the grain boundaries, increasing the grain boundary slip system. Although the reduction in the grain size has a strengthening effect on the fine grains, the dynamic recrystallization softening effect is significant, thereby the flow stress decreases. As shown in Figure 9, the dynamic recrystallization in compression is higher than that in tension, resulting in the tensile flow stress being higher than the compressive flow stress. Additionally, this asymmetry behavior is consistent with the results of titanium and its alloys reported in other studies [11,14]. Finally, the strain rate also affects the TCA when the temperature is constant. As the thermal deformation time will decrease with the increase in the strain rate, leading to a small grain size and obvious strengthening effect, which causes the yield strength and the TCA to increase.
The activation criterion during the yield stage for the deformation modes based on the Schmid law [37] is used to research the influence of the load direction on the deformation modes; the critical resolved shear stress (CRSS) and the Schmidt factor (SF) of HCP structural metals slip and twin systems at high temperature are shown in Table 5 [38].
σ s = τ c m S F
where σ s , τ c and m S F are the yield stress, the CRSS and the SF, respectively.
Due to the HCPstructure, the deformation is coordinated by dislocation slip and twinning at room temperature [39,40]. However, the TCA has been generally attributed to activating additional sliding systems at high temperatures. From Table 4, it can be concluded that the prismatic < a > slip, the basal < a > slip and the pyramidal < c + a > slip with the theoretical starting stress are 91.5–162.0 MPa, 114.9–152.1 MPa and 297.5 MPa, respectively. The tensile yield stress is 355.25 MPa, and the compressive stress is 272 MPa at 923 K; therefore, the tensile deformation activates the basal < a > , prismatic < a > and pyramidal < c + a > slip modes. In contrast, the compressive deformation can only activate the prismatic < a > and pyramidal < c + a > slip modes, which could be one of the reasons for the TCA behavior observed by TA15 at high temperatures. The yield strength difference between tension and compression decreases with the increase in temperature and the amount of activated slip system gradually becomes equal, resulting in a decrease in tension and compression asymmetry. Therefore, under high temperatures (923–1023 K) and low strain rate conditions (<0.05 s−1), the TCA of TA15 is mainly caused by slip deformation.

4.2. Effect of Strain Rates on TCA

To assess the effect of strain rate on the TCA of the TA15 titanium alloy profile, the general relationship between strain rate and flow stress at a constant temperature is shown in Equation (11) [41].
σ = C ε ˙ m | ε , T
where C is a constant; the strain rate sensitivity m is calculated as follows [41]:
m = ln ( σ y 0.2 σ y 0.2 0 ) ln ( ε ˙ ε ˙ 0 )
where σ y 0.2 and σ y 0.2 0 are the yield stress under specific strain rate ε ˙ and ε ˙ 0 , respectively. ε ˙ 0 is the reference strain rate 0.001 s−1. The value of m in tension is 0.214 within the rate range of 0.0001–0.005 s−1, and the value of m in compression is 0.318 at 0.001–0.05 s−1. The results indicate that the mechanical response in compression has more obvious strain rate sensitivity compared with those in tension.
The following least square method used by Zhang [36] is used to indicate the relationship between the yield strength and strain rate:
σ y t 0.2   = 674.9 + 117.35 log ε ˙ σ y c 0.2   = 568.5 + 106.8 log ε ˙
The linear correlation coefficients (Adj. R-square) of Equation (13) are 0.940 and 0.925, showing a good linear correlation. Additionally, the σ 0.2 in tension and compression against the strain rate from experimental data are shown in Figure 13.
We can see from Figure 13 that the yield stress during tension is higher than that during compression. Moreover, the asymmetry parameter q increases from 0.172 to 0.186 as the strain rate grows from 0.001 to 0.005 s−1 at 973 K, and the TCA shows strain rate sensitivity.

5. Conclusions

In this paper, the TCA in the yield stress and strain hardening behavior of TA15 have been investigated with both tension and compression tests and selected optical observations at high temperatures under quasi-static conditions. The results are discussed as follows:
1. The extruded TA15 profile exhibits a significant TCA at high temperatures, and the flow stress and yield stress during tension are larger than compression. Additionally, the asymmetry coefficient q decreases from 0.23 to 0.13 when the temperature increases from 923 to 1023 K.
2. The alloy also exhibits TCA on the strain hardening rate. Its mechanical response during compression is more sensitive than during tension. The asymmetry parameter q increases from 0.172 to 0.186 when the strain rate grows from 0.001 to 0.005 s−1 at 973 K. There is no three-stage hardening phenomenon due to the dynamic recrystallization-induced softening effect at high temperatures.
3. The dynamic recrystallization phenomenon is observed under quasi-static conditions at high temperatures. The β grains are easy to fracture with the boundaries clear. Moreover, the grains are elongated along the tensile direction and deformed by about 45° along the compressive load axis. Finally, the recrystallization fractions in compression at 923 to 1023 K with a strain rate of 0.001 s−1 are 0.4152, 0.4386 0.4622, respectively.
4. The TCA is negatively correlated with temperature and positively correlated with strain rate at high temperatures under quasi-static conditions. The TCA of the TA15 alloy is due to slip displacement. Additionally, the tensile deformation activates the basal < a > , prismatic < a > and pyramidal < c + a > slip modes, while the compressive deformation activates the prismatic < a > , pyramidal < c + a > slip modes.

Author Contributions

This article is the result of the joint efforts of several authors. Conceptualization, D.L. and X.L.; formal analysis, C.Z. and X.L.; methodology, C.Z. and Y.L.; resources, D.L. and X.L.; writing-original draft, C.Z.; writing-review and editing, Y.L. All authors have read and agreed to the published version of the manuscript.

Funding

This research was funded by the National Key Research and Development Program of China, grant number 2017YFB0306200; National Natural Science Foundation of China, grant number 51775023 and 51975032.

Data Availability Statement

The data presented in this study are available on request from the corresponding author.

Conflicts of Interest

This article does not contain any studies with human participants or animals performed by any of the authors. Therefore, ethics approval is not applicable. The authors declare no competing interests.

References

  1. Boyer, R. An overview on the use of titanium in the aerospace industry. Mater. Sci. Eng. A 1996, 213, 103–114. [Google Scholar] [CrossRef]
  2. Li, C.-L.; Mi, X.-J.; Ye, W.-J.; Hui, S.-X.; Yu, Y.; Wang, W.-Q. A study on the microstructures and tensile properties of new beta high strength titanium alloy. J. Alloy. Compd. 2012, 550, 23–30. [Google Scholar] [CrossRef]
  3. Li, Y.; Loretto, M.; Rugg, D.; Voice, W. Effect of heat treatment and exposure on microstructure and mechanical properties of Ti–25V–15Cr–2Al–0.2C (wt%). Acta Mater. 2001, 49, 3011–3017. [Google Scholar] [CrossRef]
  4. Odenberger, E.-L.; Pederson, R.; Oldenburg, M. Finite element modeling and validation of springback and stress relaxation in the thermo-mechanical forming of thin Ti-6Al-4V sheets. Int. J. Adv. Manuf. Technol. 2019, 104, 3439–3455. [Google Scholar] [CrossRef] [Green Version]
  5. Xiao, J.; Li, D.; Li, X.; Deng, T. Constitutive modeling and microstructure change of Ti–6Al–4V during the hot tensile deformation. J. Alloy. Compd. 2012, 541, 346–352. [Google Scholar] [CrossRef]
  6. Astarita, A.; Armentani, E.; Ceretti, E.; Giorleo, L.; Mastrilli, P.; Paradiso, V.; Scherillo, F.; Squillace, A.; Velotti, C. Hot Stretch Forming of a Titanium Alloy Component for Aeronautic: Mechanical and Modeling. Key Eng. Mater. 2013, 554–557, 647–656. [Google Scholar] [CrossRef]
  7. Guo, G.; Li, D.; Li, X.; Deng, T.; Wang, S. Finite element simulation and process optimization for hot stretch bending of Ti-6Al-4V thin-walled extrusion. Int. J. Adv. Manuf. Technol. 2017, 92, 1707–1719. [Google Scholar] [CrossRef]
  8. Astarita, A.; Giorleo, L.; Scherillo, F.; Squillace, A.; Ceretti, E.; Carrino, L. Titanium Hot Stretch Forming: Experimental and Modeling Residual Stress Analysis. Key Eng. Mater. 2014, 611–612, 149–161. [Google Scholar] [CrossRef]
  9. Lin, P.; Hao, Y.; Zhang, B.; Zhang, S.; Chi, C.; Shen, J. Tension-compression asymmetry in yielding and strain hardening behavior of CP-Ti at room temperature. Mater. Sci. Eng. A 2017, 707, 172–180. [Google Scholar] [CrossRef]
  10. Tuninetti, V.; Gilles, G.; Milis, O.; Pardoen, T.; Habraken, A. Anisotropy and tension–compression asymmetry modeling of the room temperature plastic response of Ti–6Al–4V. Int. J. Plast. 2015, 67, 53–68. [Google Scholar] [CrossRef]
  11. Hao, Y.G.; Lin, P.; Zhang, B.Y.; Cui, X.L.; Zhang, C.J.; Chi, C.Z. Effect of Planar Anisotropy and Tension-Compression Asymmetry of CP-Ti on its Deep Drawing Behavior at Room Temperature. Mater. Sci. Forum 2018, 913, 190–195. [Google Scholar] [CrossRef]
  12. Neeraj, T.; Savage, M.; Tatalovich, J.; Kovarik, L.; Hayes, R.; Mills, M. Observation of tension–compression asymmetry in α and titanium alloys. Philos. Mag. 2005, 85, 279–295. [Google Scholar] [CrossRef]
  13. Sarsfield, H.; Wang, L.; Petrinic, N. An experimental investigation of rate-dependent deformation and failure of three titanium alloys. J. Mater. Sci. 2007, 42, 5085–5093. [Google Scholar] [CrossRef]
  14. Khan, A.S.; Kazmi, R.; Farrokh, B.; Zupan, M. Effect of oxygen content and microstructure on the thermo-mechanical response of three Ti–6Al–4V alloys: Experiments and modeling over a wide range of strain-rates and temperatures. Int. J. Plast. 2007, 23, 1105–1125. [Google Scholar] [CrossRef]
  15. Adharapurapu, R.R.; Jiang, F.; Vecchio, K.S.; Gray, G.T. Response of NiTi shape memory alloy at high strain rate: A systematic investigation of temperature effects on tension–compression asymmetry. Acta Mater. 2006, 54, 4609–4620. [Google Scholar] [CrossRef]
  16. Qin, H.; Jonas, J.J.; Yu, H.; Brodusch, N.; Gauvin, R.; Zhang, X. Initiation and accommodation of primary twins in high-purity titanium. Acta Mater. 2014, 71, 293–305. [Google Scholar] [CrossRef]
  17. Haertel, S.; Graf, M.; Lehmann, T.; Ullman, M. Influence of Tension-Compression Anomaly during Bending of Magnesium Alloy AZ31. Mater. Sci. Eng. A 2017, 705, 62–71. [Google Scholar] [CrossRef]
  18. Lei, Z.; Gao, P.; Li, H.; Cai, Y.; Li, Y.; Zhan, M. Comparative analyses of the tensile and damage tolerance properties of tri-modal microstructure to widmanstätten and bimodal microstructures of TA15 titanium alloy. J. Alloy. Compd. 2019, 788, 831–841. [Google Scholar] [CrossRef]
  19. Zhang, C.; Li, D.; Li, X.; Xia, Q. Numerical simulation and process optimization for hot stretch bending of Ti-6.5Al-2Zr-1Mo-1V large-section extrusion. Procedia Manuf. 2020, 50, 483–487. [Google Scholar] [CrossRef]
  20. AMST9046B. Titanium and Titanium Alloy, Sheet, Strip, and Plate; Society of Automotive Engineers (SAE): Washington, DC, USA, 2006. [Google Scholar]
  21. ISO 6892-2. Metallic Materials-Tensile Testing-Part2: Method of Test at Elevated Temperature; Case Postale; International Organization for Standardization: Geneva, Switzerland, 2011. [Google Scholar]
  22. Shen, F.J.; Chen, M.H.; Feng, J.C. Stress Relaxation and Flow Stress of TA15 Alloy at Elevated Temperature. Aerosp. Mater. Technol. 2013, 3, 114–118. [Google Scholar]
  23. ISO 4499-1. Hardmetals-Metallographic Determination of Microstructure-Part 1: Photomicrographs and Description; International Organization for Standardization: Geneva, Switzerland, 2020. [Google Scholar]
  24. Park, S.H.; Lee, J.H.; Moon, B.G.; You, B.-S. Tension–compression yield asymmetry in as-cast magnesium alloy. J. Alloy. Compd. 2014, 617, 277–280. [Google Scholar] [CrossRef]
  25. Xu, W.C.; Shan, B.D.; Lv, Y.; Li, C.F. Effects of hot deformation parameters on flow stress and establishment of constitutive relationship system of BT20 titanium alloy. Trans. Nonferrous Met. Soc. China 2005, 15, 167–172. [Google Scholar] [CrossRef]
  26. Shi, Y.; Zhong, F.; Li, X.; Gong, S.; Chen, L. Effect of laser beam welding on fracture toughness of a Ti-6.5Al-2Zr-1Mo-1V alloy sheet. J. Mater. Sci. 2007, 42, 6651–6657. [Google Scholar] [CrossRef]
  27. Wang, T.; Li, B.; Wang, Z.; Nie, Z. Hot deformation behavior and microstructure evolution of a high-temperature titanium alloy modified by erbium. J. Mater. Res. 2017, 32, 1517–1527. [Google Scholar] [CrossRef]
  28. Meng, Q.G.; Zhao, G.D.; Wang, L.N.; Wang, Y.F.; Guo, J.; Han, D. A Method for Determining the Volume Fraction of Dynamic Recrystallization of Metals Av-rami’s Method of Mathematical Model Coefficient. CN 201910387211.8, 17 September 2019. [Google Scholar]
  29. Ouyang, D.L.; Lu, S.; Cui, X.; Wang, K.L.; Wu, C. Dynamic Recrystallization of Titanium Alloy TA15 during β Hot Process at Different Strain Rates. Rare. Metal. Mat. Eng. 2011, 40, 325–330. [Google Scholar]
  30. Avrami, M. Kinetics of Phase Change. I General Theory. J. Chem. Phys. 1939, 7, 1103–1112. [Google Scholar]
  31. Avrami, M. Kinetics of Phase Change. II Transformation-Time Relations for Random Distribution of Nuclei. J. Chem. Phys. 1939, 8, 212–224. [Google Scholar] [CrossRef]
  32. Yue, L.Y.; Huang, Z.F.; He, Z.L.; Jiang, M.G.; Chen, W. Microstructure Evolution and Numerical Simulation of DP Steel TWBs During Warm Tensile Deformation. Adv. Mater. Res. 2012, 418–420, 1222–1227. [Google Scholar] [CrossRef]
  33. Nagarajan, V.; Palmiere, E.J.; Sellars, C.M. New approach for modelling strain induced precipitation of Nb(C,N) in HSLA steels during multipass hot deformation in austenite. Mater. Sci. Technol. 2009, 25, 1168–1174. [Google Scholar] [CrossRef] [Green Version]
  34. Medina, S.F.; Hernandez, C.A. General expression of the Zener-Hollomon parameter as a function of the chemical composition of low alloy and microalloyed steels. Acta Mater. 1996, 44, 137–148. [Google Scholar] [CrossRef]
  35. Jia, Y.; Xu, L.; Ma, P.; Gokuldoss Prashanth, K.; Yao, C.; Wang, G. Microstructure evolution and hot deformation behavior of spray-deposited Ti-Al alloy. J. Mater. Res. 2018, 33, 1–9. [Google Scholar] [CrossRef]
  36. Zhang, Q.; Zhang, J.; Wang, Y. Effect of strain rate on the tension–compression asymmetric responses of Ti–6.6Al–3.3Mo–1.8Zr–0.29Si. Mater. Des. 2014, 61, 281–285. [Google Scholar] [CrossRef]
  37. Yin, D.L.; Wang, J.T.; Liu, J.Q.; Zhao, X. On tension–compression yield asymmetry in an extruded Mg–3Al–1Zn alloy. J. Alloy. Compd. 2009, 478, 789–795. [Google Scholar] [CrossRef]
  38. Salem, A.; Semiatin, S. Anisotropy of the hot plastic deformation of Ti–6Al–4V single-colony samples. Mater. Sci. Eng. A 2009, 508, 114–120. [Google Scholar] [CrossRef]
  39. Mann, G.; Griffiths, J.R.; Cáceres, C.H. Hall-Petch parameters in tension and compression in cast Mg-2Zn alloys. J. Alloys Compd. 2004, 378, 188–191. [Google Scholar] [CrossRef]
  40. Duc-Toan, N.; Seung-Han, Y.; Dong-Won, J.; Tien-Long, B.; Young-Suk, K. A study on material modeling to predict spring-back in V-bending of AZ31 magnesium alloy sheet at various temperatures. Int. J. Adv. Manuf. Technol. 2011, 62, 551–562. [Google Scholar] [CrossRef]
  41. Dieter, G.E. Mechanical Metallurgy, 3rd ed.; McGraw-Hill Book Company: London, UK, 1988. [Google Scholar]
Figure 1. Reinforced frames of cabin door in Boeing 787 [7]. Reprinted with permission from Ref. [7]. Copyright 2021 Springer Nature.
Metals 11 01299 g001
Figure 2. Process procedure of HSB: (a) heating, (b) pre-stretch, (c) bending and (d) cooling [6].
Metals 11 01299 g002
Figure 3. Illustration and detailed dimensions of the section of extruded I profile (unit: mm).
Metals 11 01299 g003
Figure 4. Cutting specimens on extruded titanium alloy profile.
Metals 11 01299 g004
Figure 5. High temperature sample (unit: mm): (a) uniaxial tensile specimen and (b) uniaxial compressive specimen.
Metals 11 01299 g005
Figure 6. The σ-ε (a,c) and θ-ε (b,d) curves of tension and compression of TA15 at different temperatures.
Metals 11 01299 g006
Figure 7. The σ-ε (a,c) and θ-ε (b,d) curves of tension and compression of TA15 with different strain rates.
Metals 11 01299 g007
Figure 8. Microstructure of the unformed alloy.
Metals 11 01299 g008
Figure 9. Metallographic structure of TA15 in tension and compression at different temperatures.
Metals 11 01299 g009aMetals 11 01299 g009b
Figure 10. Average grain size vs. temperature of TA15.
Metals 11 01299 g010
Figure 11. The experimental and calculated recrystallization fraction of TA15 at different temperatures.
Metals 11 01299 g011
Figure 12. Curves of strain hardening rate θ versus true strain ε [9].
Metals 11 01299 g012
Figure 13. Effect of strain rate on the 0.2% yield stress of the alloy.
Metals 11 01299 g013
Table 1. Main chemical composition (in wt.%) of Ti-6.5Al-2Zr-1Mo-1V.
Al Zr Mn V Ti
5.5~7.0 1.5~2.5 0.5~2.0 0.8~2.5 allowance
Table 2. The experiments of uniaxial tension and compression of TA15.
GroupsTemperature/KStrain Rate/s−1Microstructure Test
19230.001Optical microscope
973
102
29730.0001-
0.0005
0.001-
0.005
Table 3. The calculation results of σ c , X d R X .
Temperature (K) Strain Rate (s−1) Z ε c X d R X
TensionCompression Tension Compression
923 0.001 8.0075 × 1090.1090.0680.07040.4390
9730.0011.7402 × 1090.0960.0620.16810.4690
1023 0.001 4.3866 × 1080.0850.0570.26680.4898
Table 4. Tensile and compressive yield stress, asymmetry coefficient at different temperatures.
Temperature/KTension/MPaCompression/MPaAsymmetry Coefficient qStrain Rates/s−1
923355.252720.230.001
973308.032480.20
1023212.931850.13
973348.252510.280.005
Table 5. SF and CRSS for different slip systems of HCP under high temperature (1088 K) [9,38].
Slip/Twin SystemBurgers VectorSlip/Twin Plane and Direction CRSS
τ c
Initial   SF ( m S F ) Stress
/MPa
Prismatic < a > { 10 10 } 11 20 430.4791.5
61 0.49 124.5
810.50162.0
Basal < a > { 0002 } 11 20 730.48152.1
610.50122.0
540.47114.9
Pyramidal < c + a > { 10 11 } 11 23 1190.40297.5
Publisher’s Note: MDPI stays neutral with regard to jurisdictional claims in published maps and institutional affiliations.

