Article

Reduction of Warping in Kinematic L-Profile Bending Using Local Heating

Institute of Forming Technology and Lightweight Components (IUL), TU Dortmund University, Baroper Str. 303, 44227 Dortmund, Germany
*
Author to whom correspondence should be addressed.
Metals 2021, 11(7), 1146; https://doi.org/10.3390/met11071146
Submission received: 24 June 2021 / Revised: 13 July 2021 / Accepted: 16 July 2021 / Published: 20 July 2021
(This article belongs to the Special Issue Tube and Sheet Metal Forming Processes and Applications)

Abstract

:
Kinematic bending of profiles allows to manufacture parts with high flexibility concerning the geometry. Still, the production of profiles with asymmetric cross-sections regarding the force application axis using kinematic bending processes offers challenges regarding springback and warping. These geometric deviations can be reduced by partial, cross-sectional heating during the process as it lowers the flow stress locally. In this work, the influence of partial, cross-sectional heating during a three-roll push-bending process on the warping and springback of L-profiles is investigated. Numerical and experimental methods reveal the influence of temperature on warping and springback. A newly developed analytical model predicts the warping and bending moment in the design phase and assists to understand the effect of warping reduction through partial heating during plastic bending. With increasing temperature of the heated profile area, the warping is reduced up to 76% and the springback of the bend profiles is decreased up to 44%. The warping reduction is attributed to a shift in stress free fiber due to the temperature gradient between heated and room temperature areas. The shift of stress-free fiber leads to an adapted shear center position, resulting in an approximated “quasi-symmetric” bending case.

1. Introduction

The warping of profiles with an asymmetric cross-section regarding the force application axis during bending is a common issue in profile bending. The shift between the force application axis and the shear center induces torsion moments in the cross-section [1] (Figure 1a). Altering the position of the force application axis to the shear center either requires specialized tools or is not possible without changing the product geometry as the position of the shear center can be located outside of the profile cross-section [2]. However, it is possible to move the force application axis to the shear center through welded plate elements (see Figure 1b). Methods to counter warping include the superposition with counteracting torsion-inducing forces [3]. One example of this method is the torque superposed spatial bending (TSS) process [4]. In this process, additional torque is superposed during the bending process which suppresses profile warping. The disadvantage is the additional torque axis necessary. Other methods to suppress warping include the use of supporting elements [5]. In a patent by Kreye [6], plastic warping is preventable through geometrical restrictions by supporting the profile at the whole shell surface in the forming area (see Figure 1c). Support elements have also been used to suppress the formation of a secondary bending axis in the bending of asymmetric profiles through a flexible bending process [7]. In the aforementioned flexible bending process, the profile is guided through a pusher. The position of the pusher is adjustable in the profile length direction which changes the position of the forming zone.
Additionally, process control can be used to counteract geometric deviations in kinematic bending processes. Wang et al. [8] proposed a process control concept by asymmetric loading patterns in a four-roll bending process of Z-profiles. Through the asymmetric loading pattern, warping can be eliminated. In return, process control requires complex models and high computational efforts. The mentioned methods to decrease geometric deviations in profile bending reduce flexibility as either more tools, machine axes, or workpiece-dependent models for process control are necessary. To reduce geometric deviations in kinematic profile bending, other methods are required to maximize flexibility.
To decrease the number of geometric deviations in bending processes without workpiece-dependent measures, bending processes have been supported by heating methods [9]. Park et al. [10] managed to employ a synchronous incremental forming and incremental heating process to bend hat-shaped profiles consisting of DP590 without buckling, collapse, or necking. Behne [11] describes a bending process with local induction heating and consequent cooling for tubes. The process manages to reduce thinning for bending radii of up to 2.5 times the diameter without a mandrel. Yanagimoto et al. [12] managed bending without springback for the v-bending of high-strength steel sheets. The reduction of springback can be attributed to the lowered bending moments due to thermal softening.
To use heating as a warping reduction measure, a flow stress gradient in the profile cross-section is to be reached through heating of one area of the cross-section, while the temperature of other areas remains approximately at room temperature. Local, cross-sectional heating is a known concept to reduce geometrical deviations in profile products. The so called “heat-straightening” is used in bridge [13] or ship repair [14] to suppress deformations due to thermal or mechanical loads. In this process, heat is introduced into a deformed part. Thermal expansion of a heated part is restricted to build up compressive stresses. Upon cooling, the amount of plastic compression remains. Through this process, deformed parts can be restored to their original shape. This method is not integrated into manufacturing processes and the knowledge is mostly empirical. The development of laser bending evolved from this method. Laser bending uses heat generated by a laser to induce thermal stresses in a workpiece, which leads to the shaping of the part. Kraus [15] used a wedge-shaped heating strategy to realize the bending of rectangular tubes. The products produced in this process are not subject to springback. In the laser bending of tube parts, it is shown that the process reduces tube ovalization compared to mechanical bending without a mandrel [16]. While the laser bending process offers advantages compared to conventional bending, a complex heating strategy is necessary to produce bend profiles without distortion.
The state of the art shows various methods to decrease warping in the bending of profiles and methods to decrease geometrical deviations in bending by local heating. On the one hand, these methods require special tools or computational efforts to reduce warping and springback. On the other hand, the displayed methods are not tested on profiles with asymmetry to the force application axis. In this work, a novel heating strategy by partial, cross-sectional heating and cooling to support a three-roll push-bending process is analyzed. The heating strategy aims to reduce profile warping and springback of the products. A gradient stiffness over a profile cross-section will influence the position of the shear center [17]. Additionally, through heating of the profile part, the flow stress and Young’s modulus, and therefore the stiffness, will decrease. The decreased flow stress will also lead to lowered stresses in the profile in this area. Both of these effects will consequently influence the shear center position. As the flow stress gradient will also cause a shift in stress free fiber position, it is suspected that the shear center position and the stress-free fiber position are linked. Through the decreased flow stress, a springback reduction in the bending process is expected.
Three main hypotheses emerge from the observations in the literature:
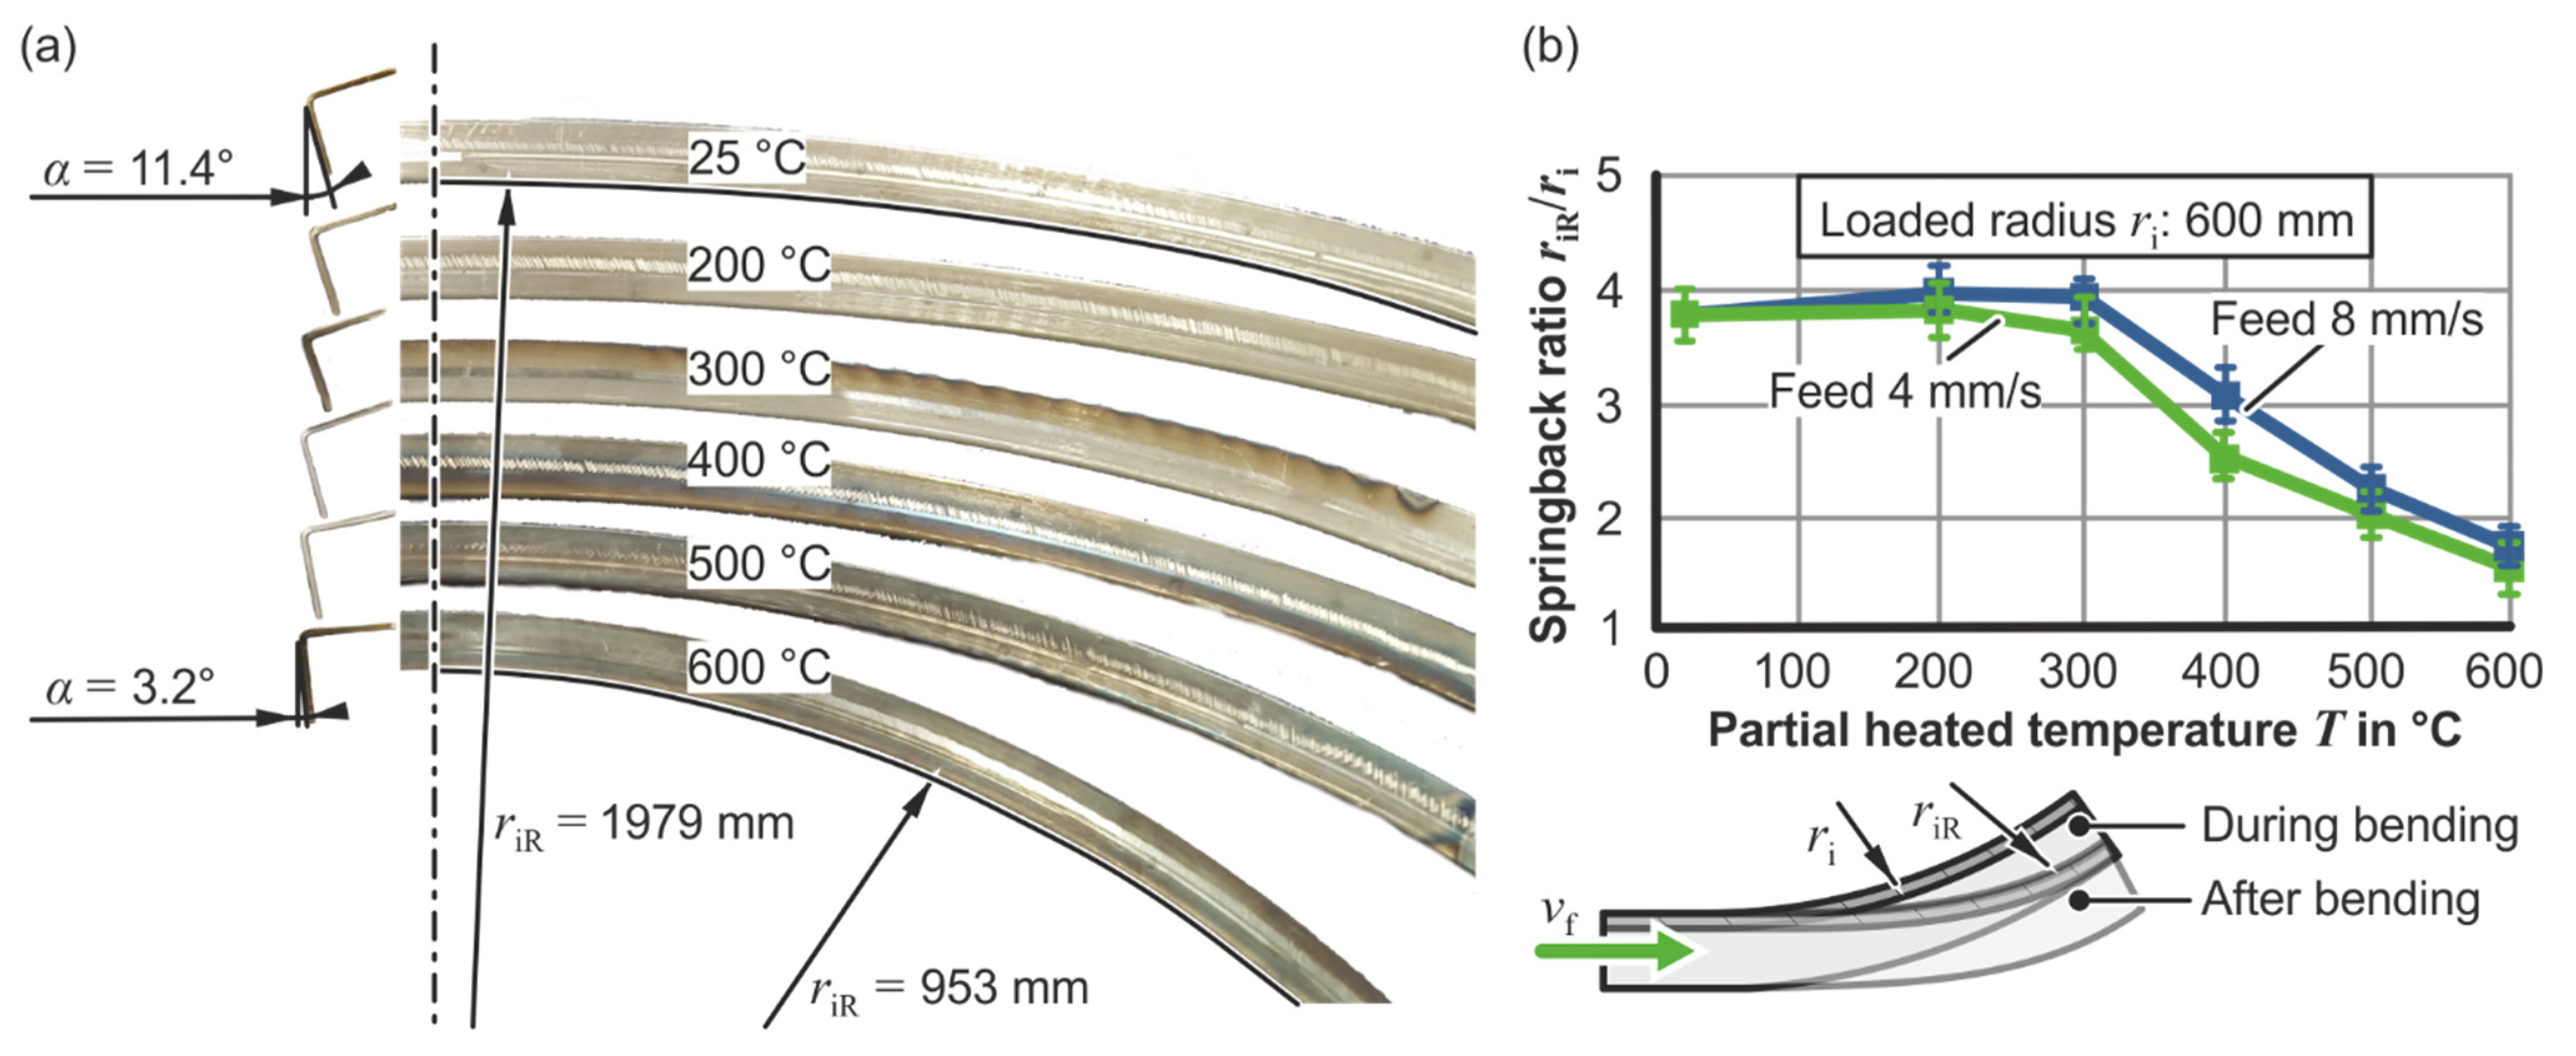
  • Partial heating while continuously bending an asymmetric profile leads to reduced springback.
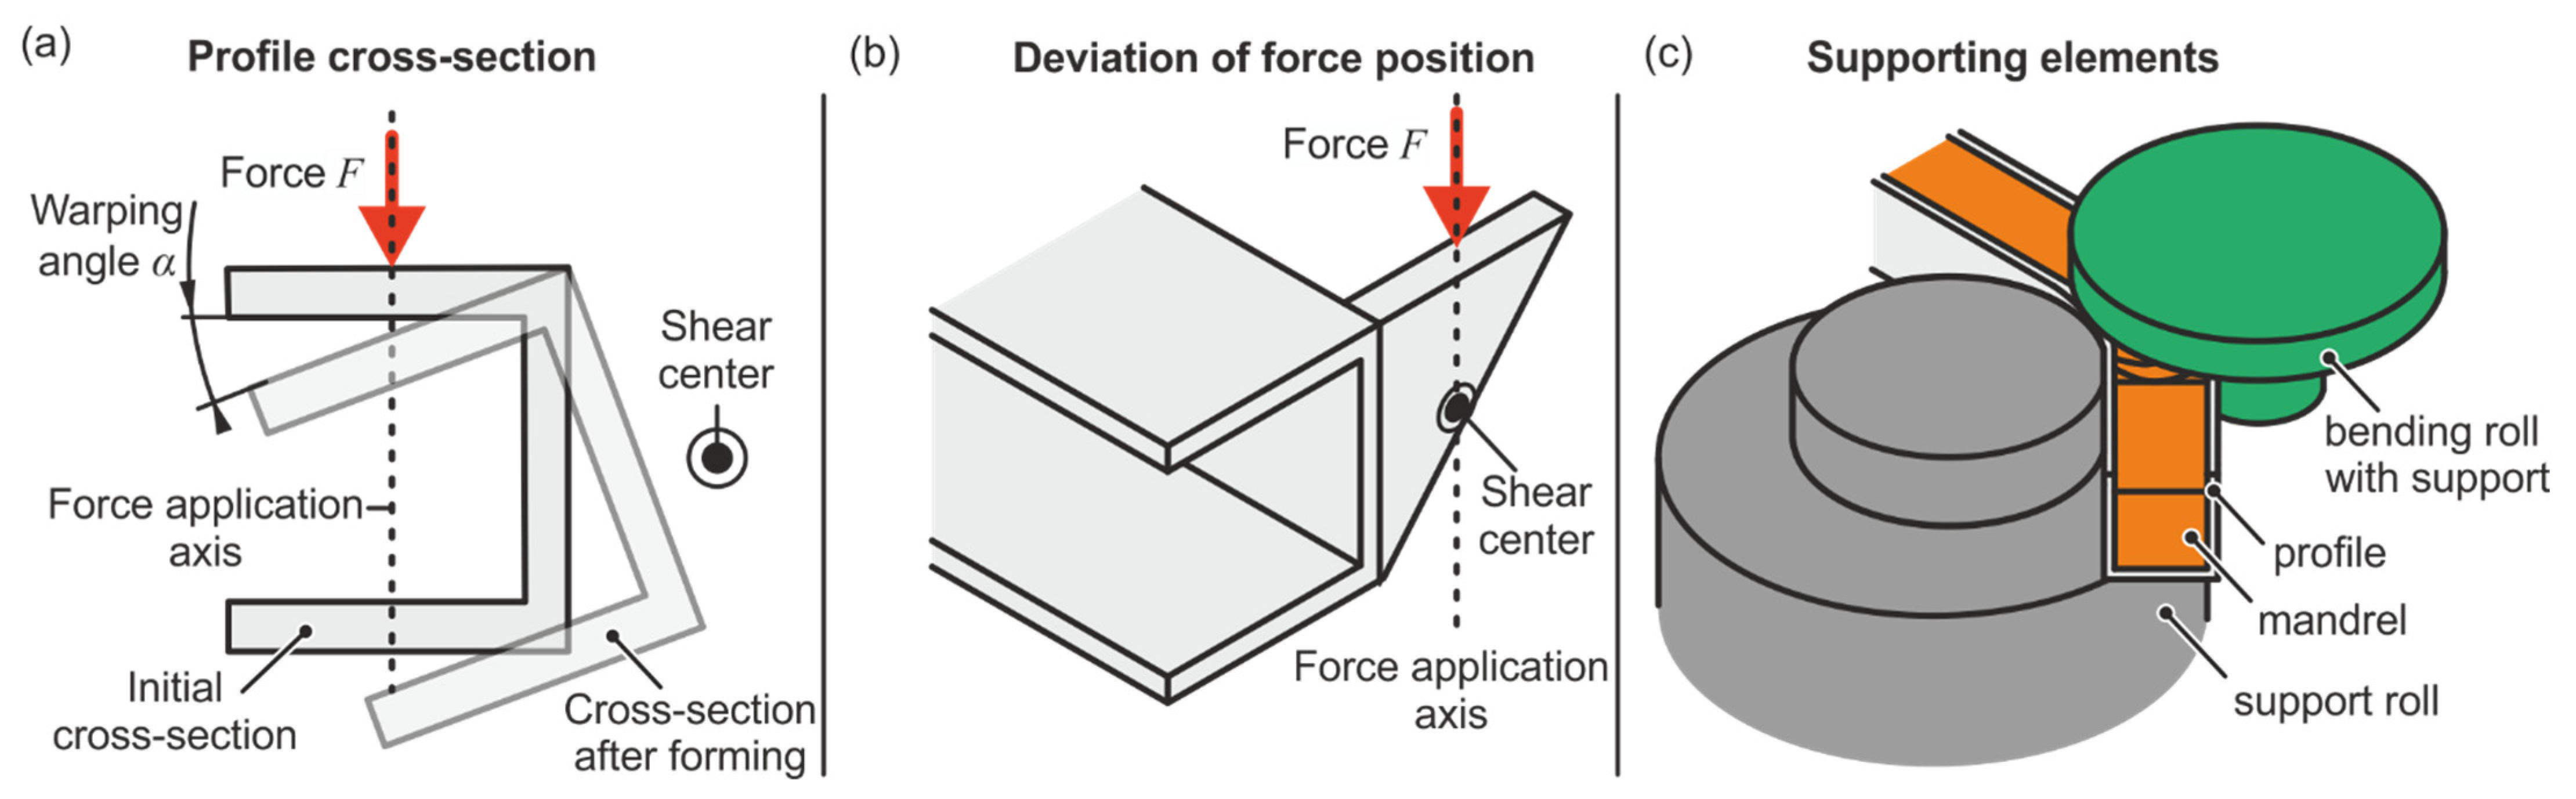
  • Warping is reduced through partial, cross-sectional heating in kinematic bending processes of asymmetric profiles.
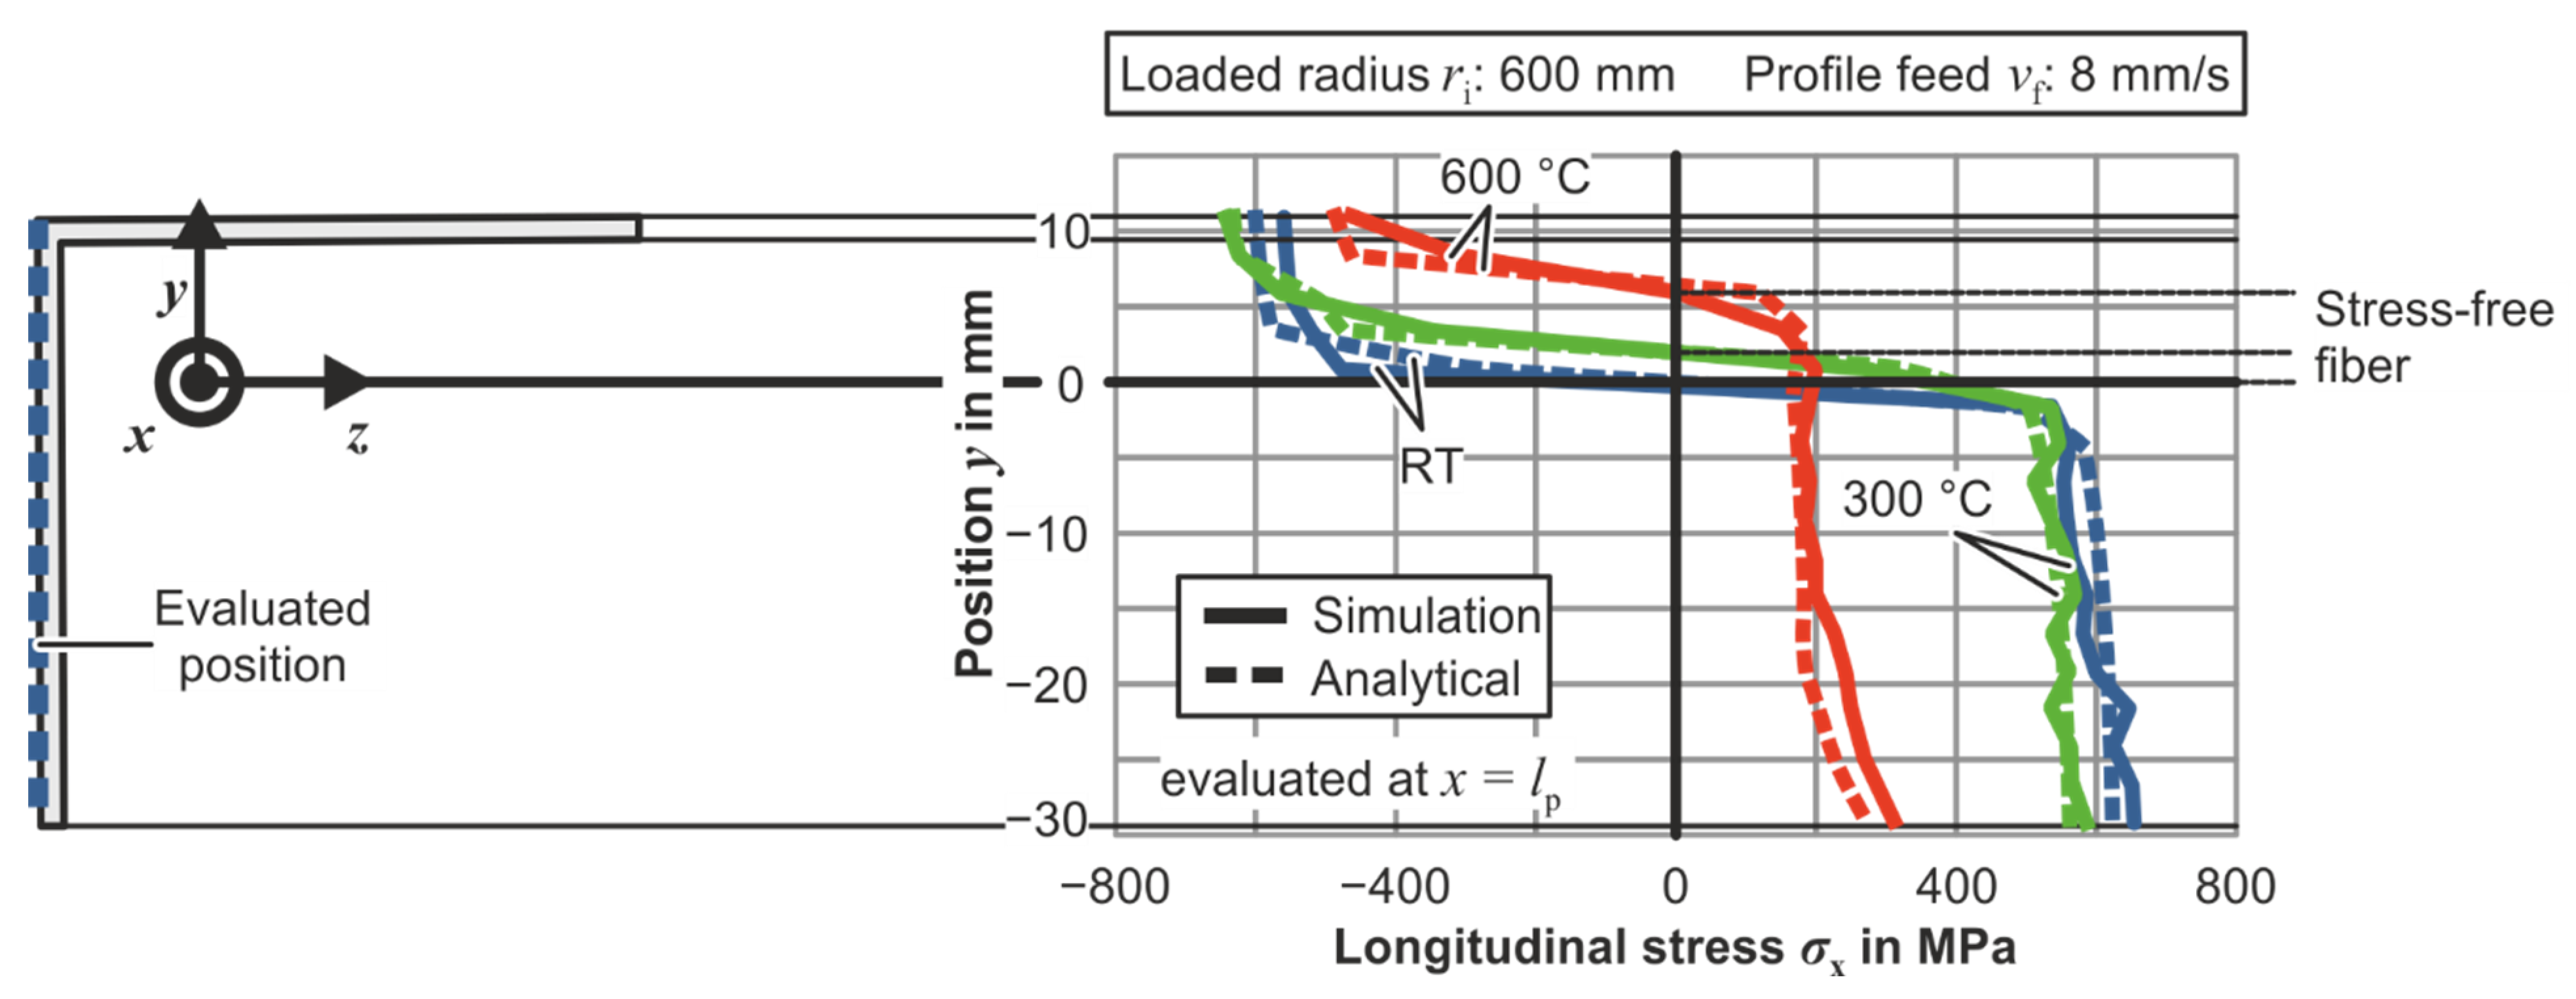
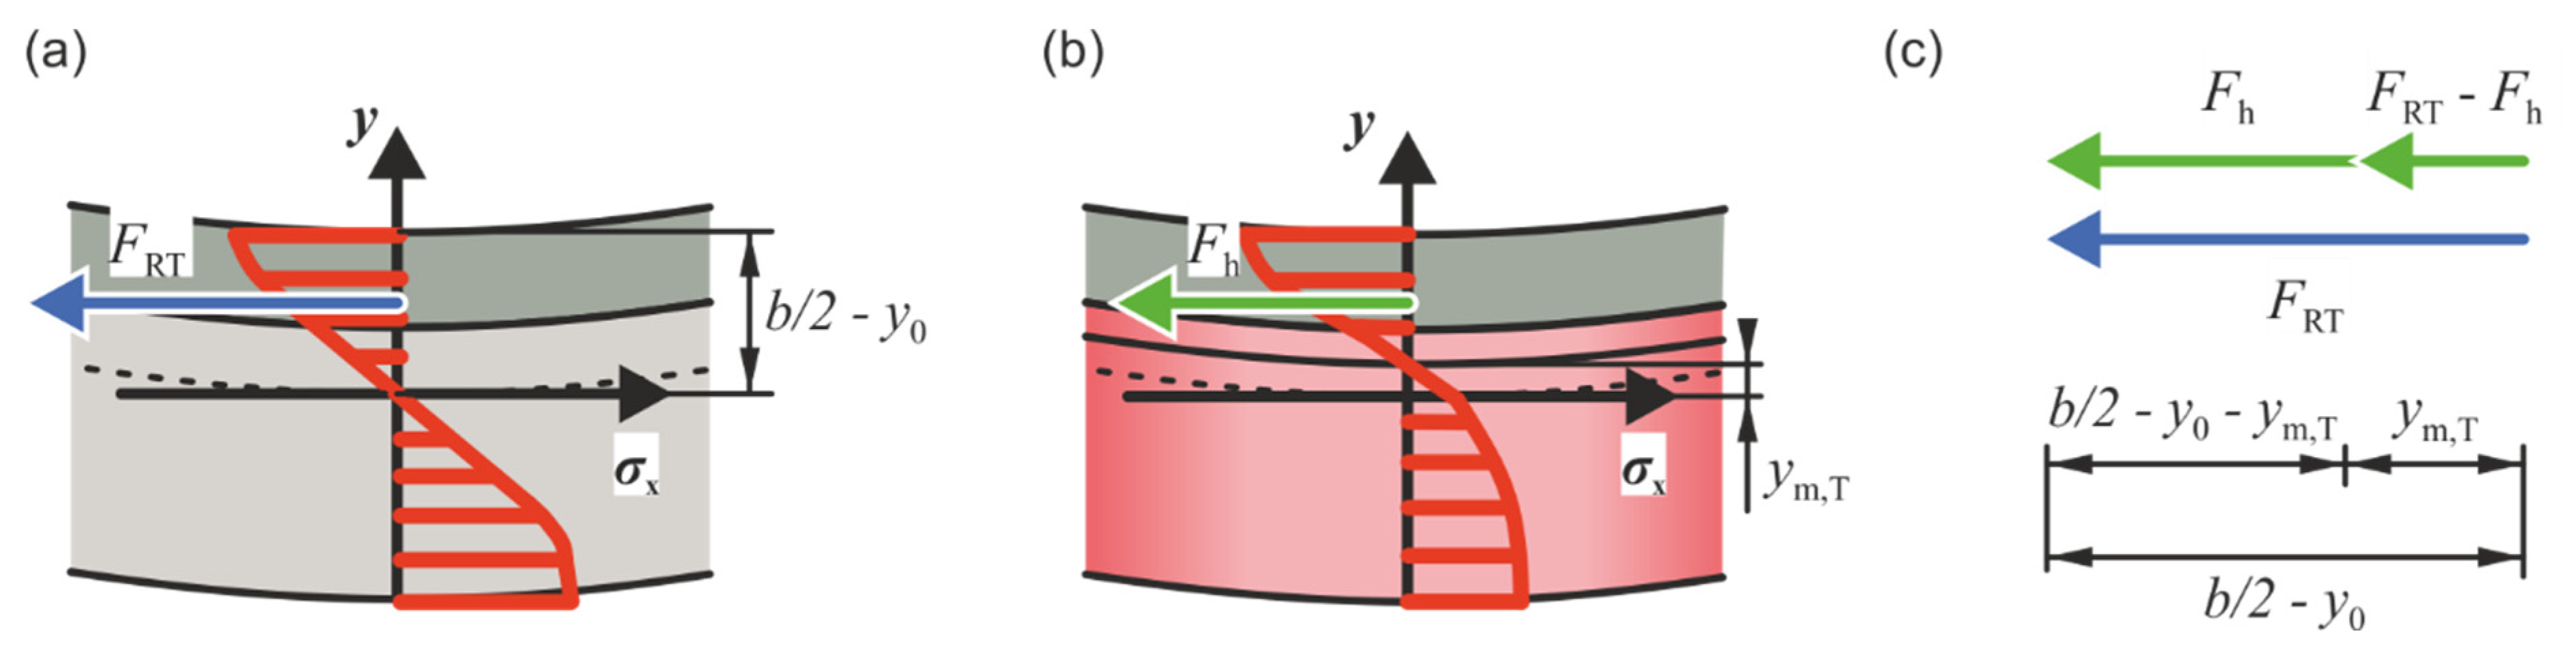
  • Warping reduction by partial, cross-sectional heating in the bending of asymmetric profiles is correlated with the stress-free fiber position.
To prove the defined hypotheses, L-profiles of S500MC are tested in a three-roll push bending process with partial-cross sectional heating and consequent water-jet cooling. The resulting unloaded profiles are evaluated for springback and warping and are compared to FEM results. With the geometrically validated FEM results in the unloaded state, the model in the continuous push-bending phase is used to describe the bending moment, warping, and position of stress-free fiber during the process. These results are compared to the developed analytical model for the continuous push-bending phase, which is able to predict the profile warping and bending moment.
In Table 1 the Nomenclature for this manuscript is presented.

2. Materials and Methods

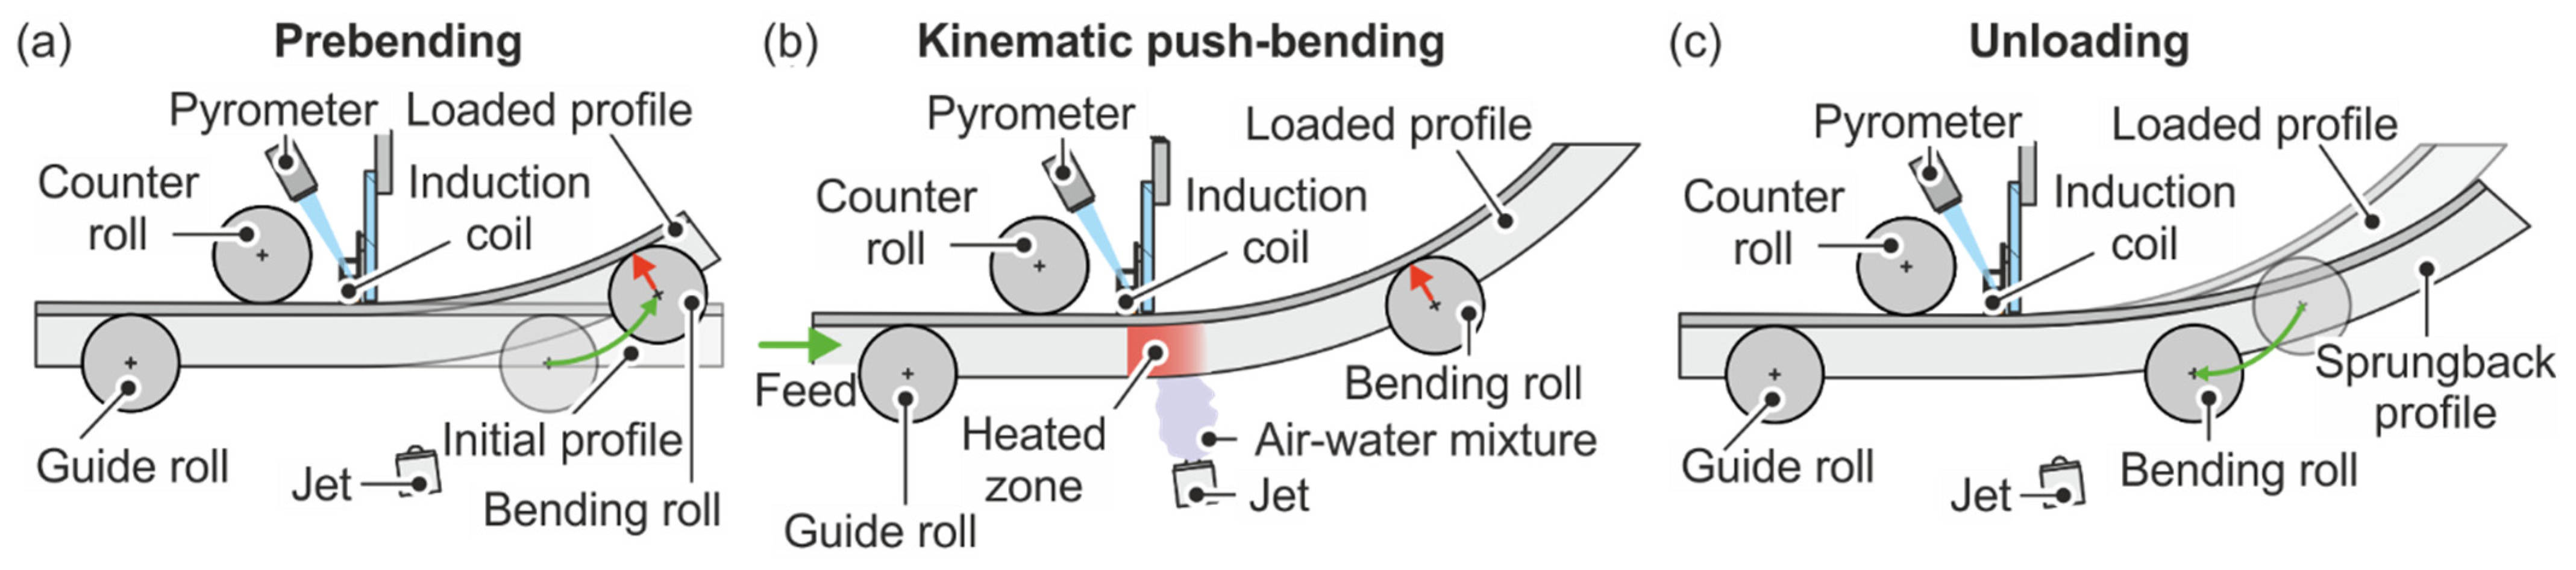
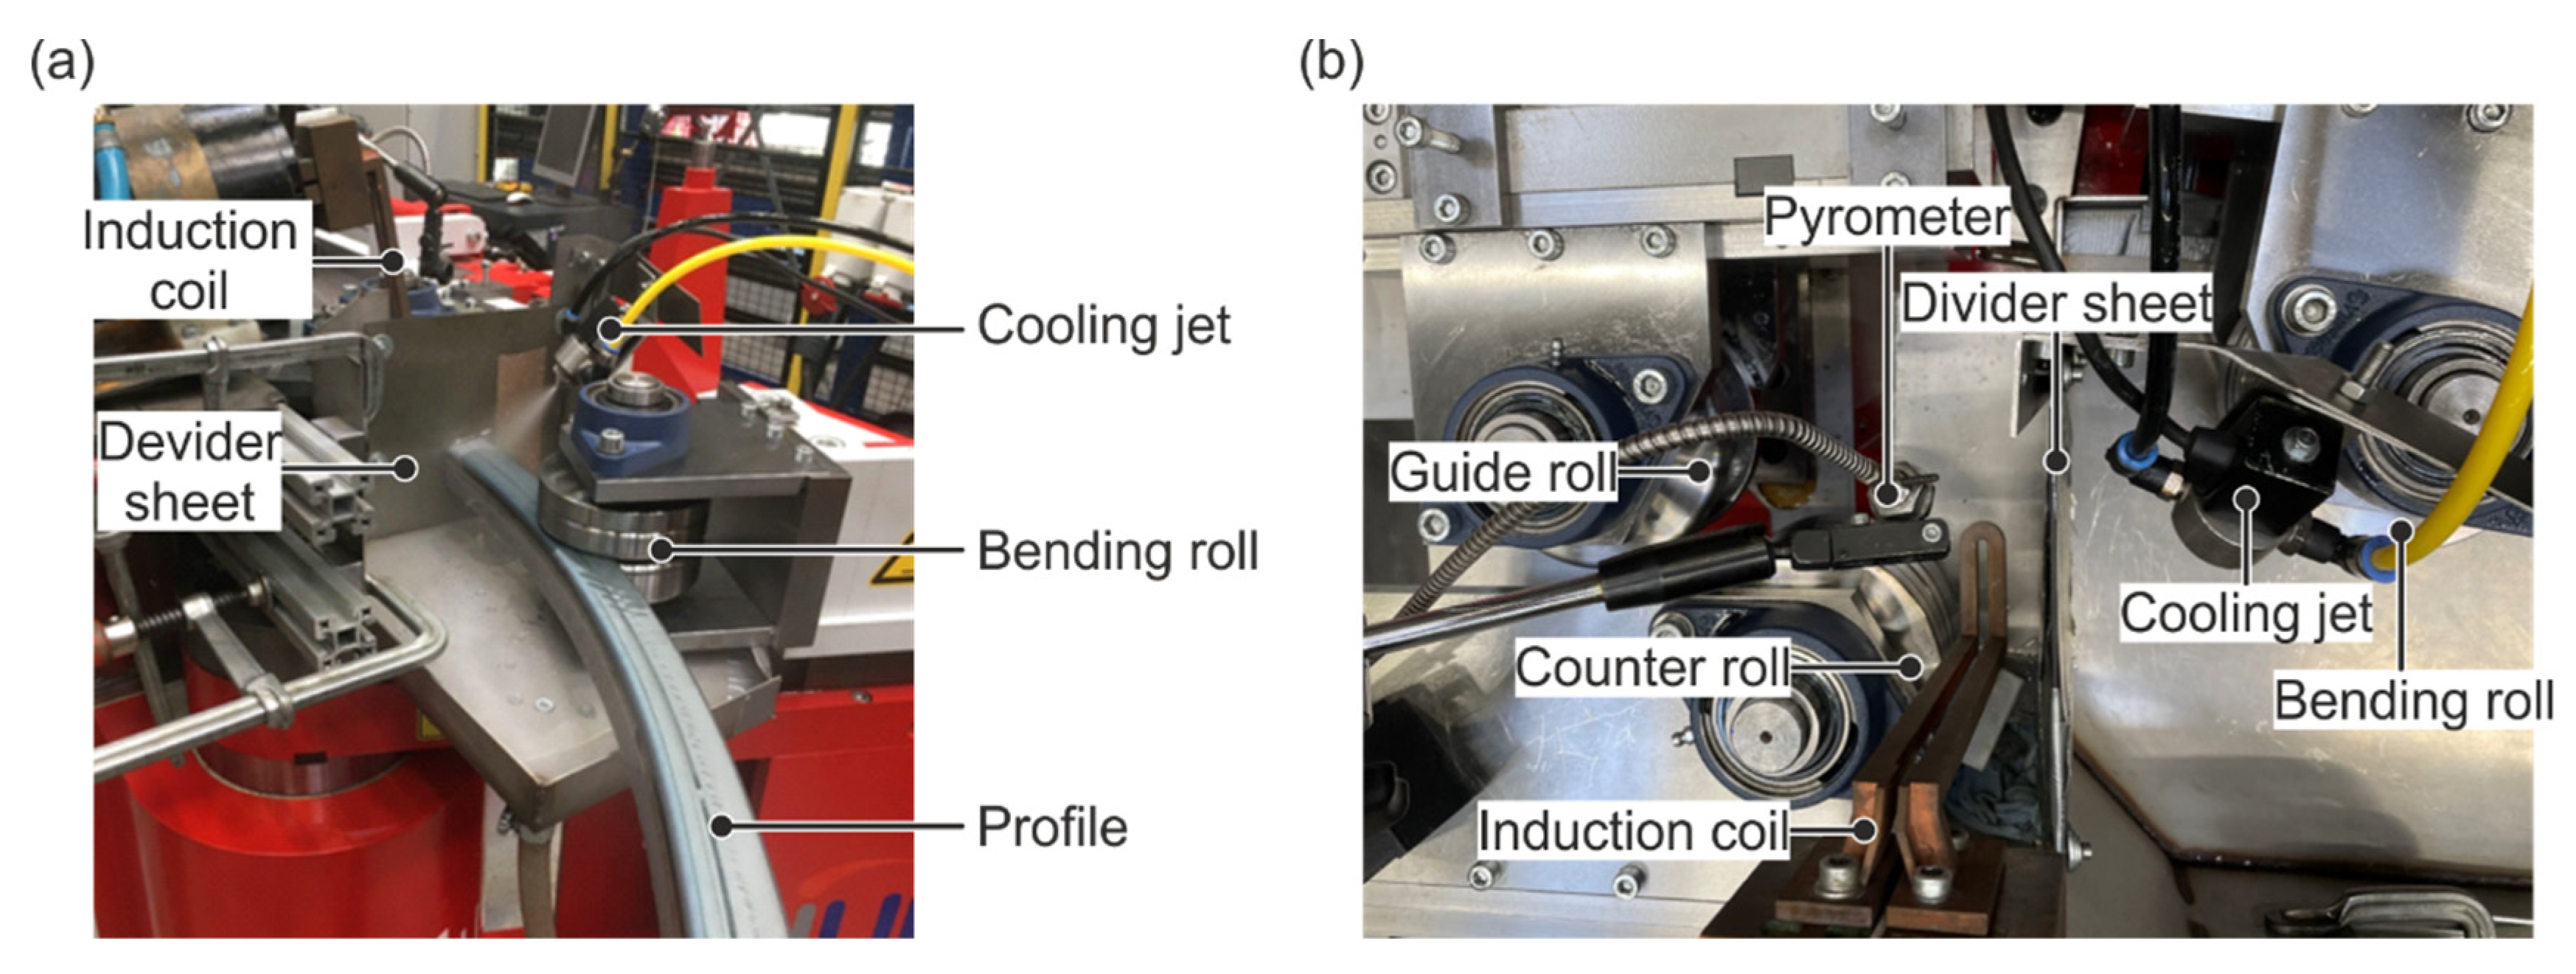
2.1. Process Setup and Process Parameters

For the analysis of the warping and springback, bending experiments are conducted. The experimental set-up is executed as a kinematic three roll push-bending process (Figure 2). The process is divided in three phases: pre-bending, kinematic push bending, and unloading. In pre-bending (Figure 2a), the profile is clamped between guide roll, counter roll, and bending roll. Between guide and counter roll the profile is only guided so no force is implied in profile thickness direction. To initiate the bending force between bending and counter roll, the bending roll is rotated until the desired bending radius is reached. During the kinematic push-bending phase (Figure 2b) the profile is pushed forward with the feed velocity νf to reach the desired bending angle. The profile is partially heated by induction in one profile area and consequently cooled by a water jet to keep the heated zone small with a length of the heated zone of 95 mm during this phase. Heating and cooling are deactivated for the unloading phase (Figure 2c). The bending roll is retracted, and the profile will spring back.
The experiments are performed on a rotatory drawbending machine DB 2060-CNC-SE-F, built by transfluid, Schmallenberg, Germany (Figure 3). The temperature is measured by a pyrometer M318 produced by Sensortherm, Steinbach, Germany. The temperature is measured at the center of the profile width after the profile passes the induction coil. Based on the measured temperature, the power output of the induction generator is controlled. Heating of the profiles is achieved through an induction generator TruHeat 7040 manufactured by Trumpf Hüttinger, Freiburg, Germany with a power of 40 kW. The heating and cooling zones are divided by a sheet of Dotherm D800-M, produced by Moeschter group, Dortmund, Germany, which possesses high temperature stability and low conductivity, to prevent water from reaching the cooling area. The geometry of the unloaded profiles is digitalized through the 3D scanning system ATOS, manufactured by GOM, Braunschweig, Germany, to quantify springback and warping.
L-profiles with a width b of 40 mm and a thickness t of 2.5 mm are analyzed. The loaded bending radius is set to 600 mm. The profile feed velocity is varied between 4 mm/s and 8 mm/s to show the influence of feed velocity on springback. The temperatures for the partial heating of a single profile area are room temperature and varying temperatures between 200 °C to 600 °C in 100 °C steps. Higher temperatures are not investigated as material recrystallization mechanisms are not considered in this work. The term partial heating always refers to the heating of the area of the L-profile parallel to the force as depicted in Figure 2b).

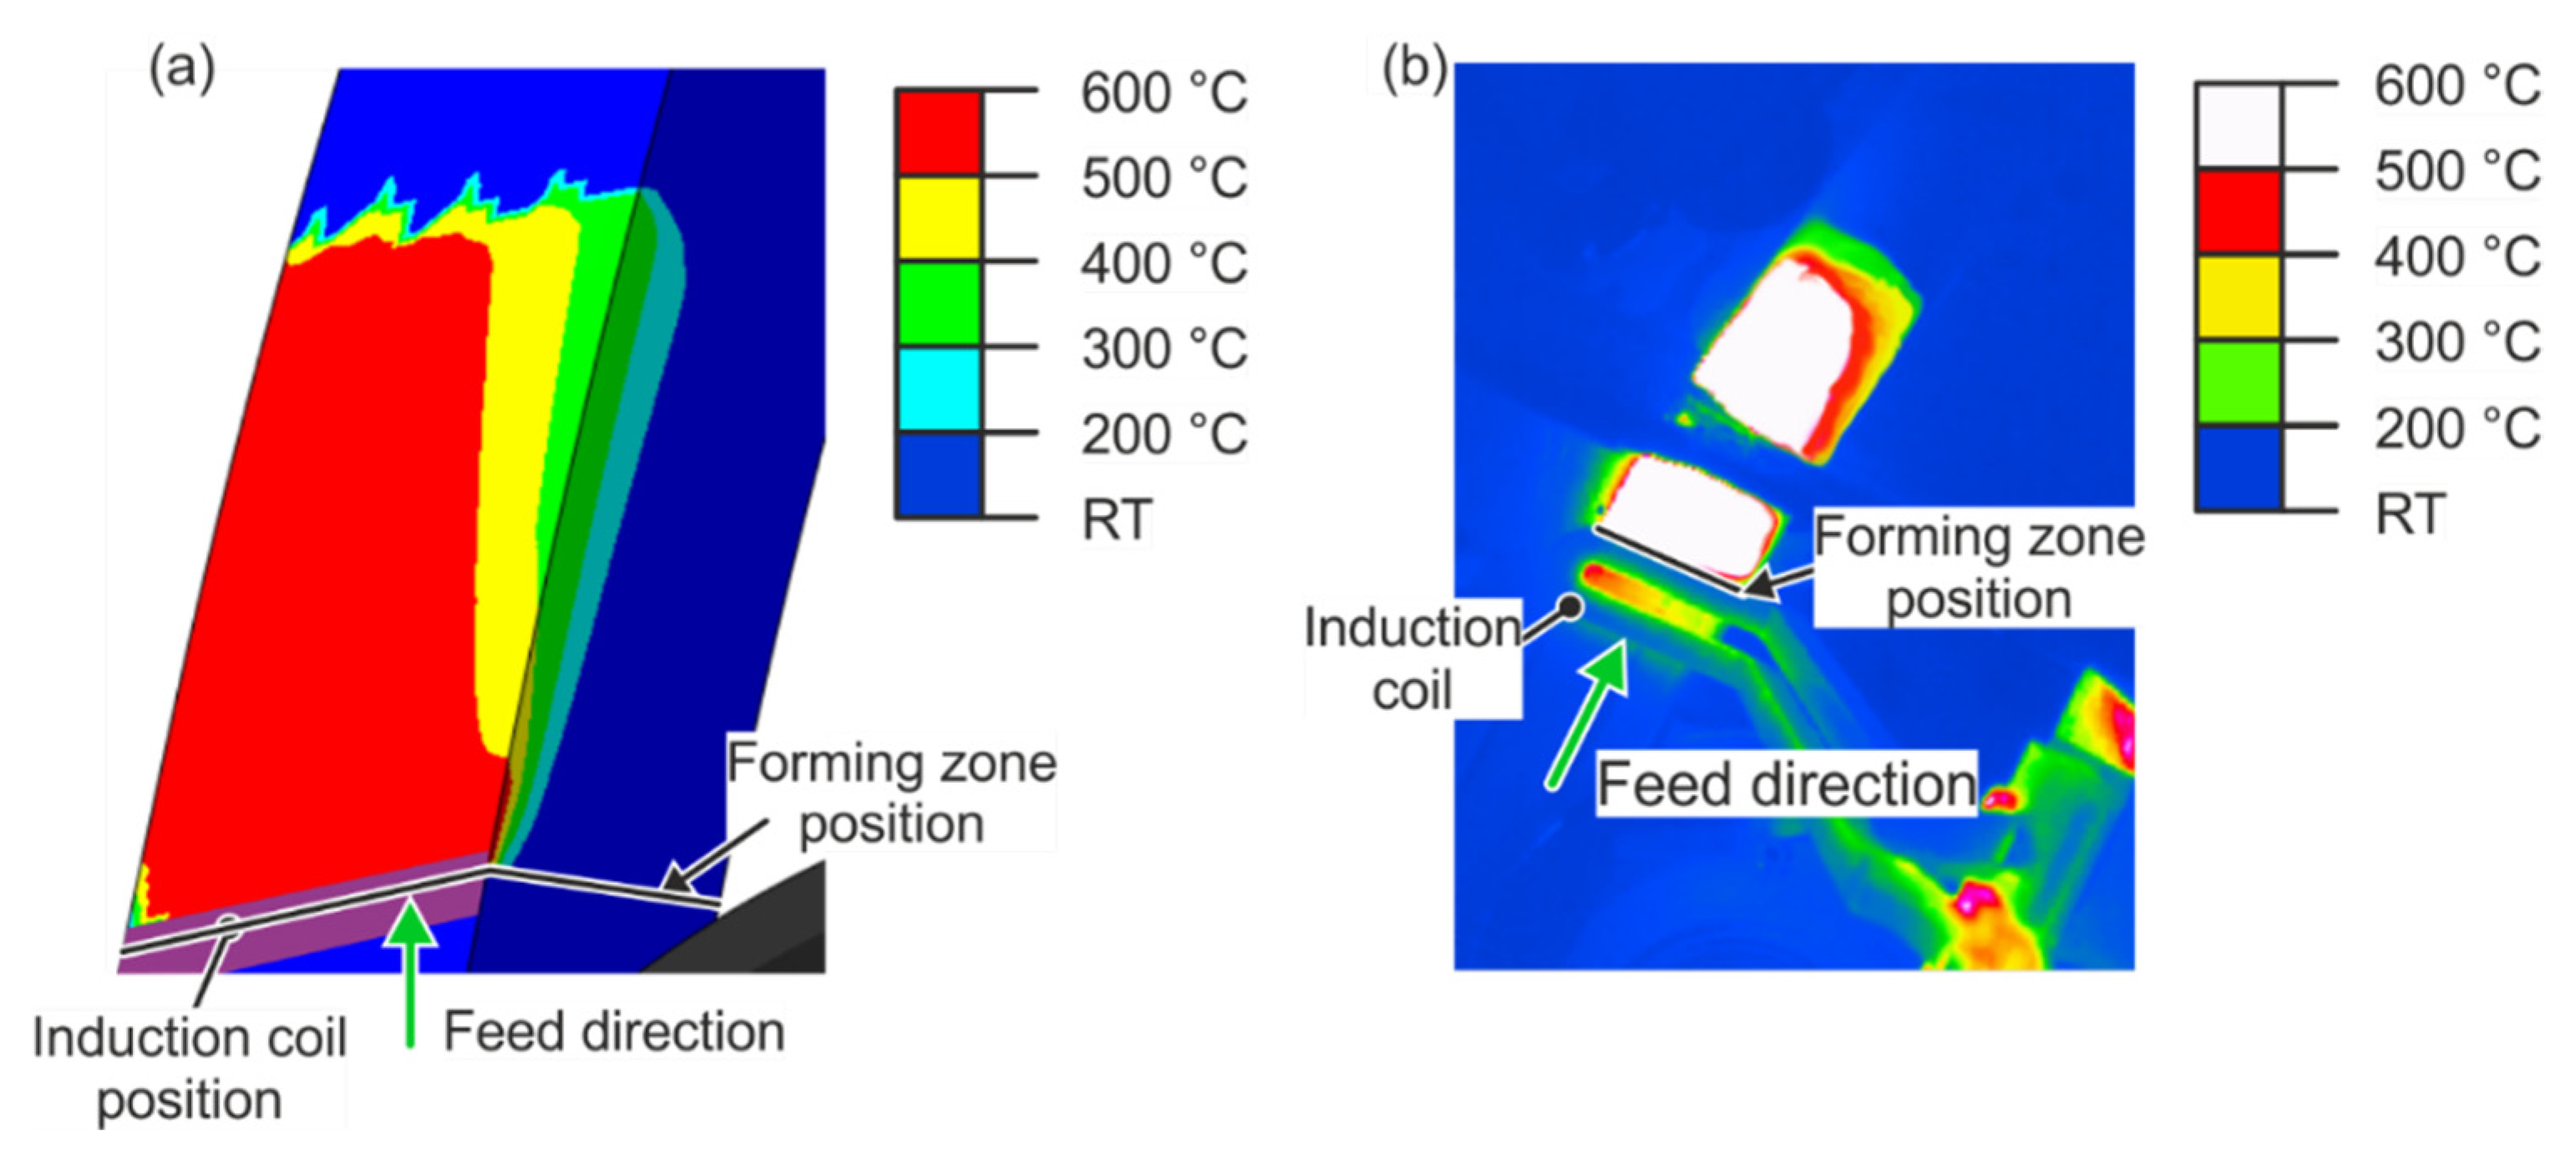
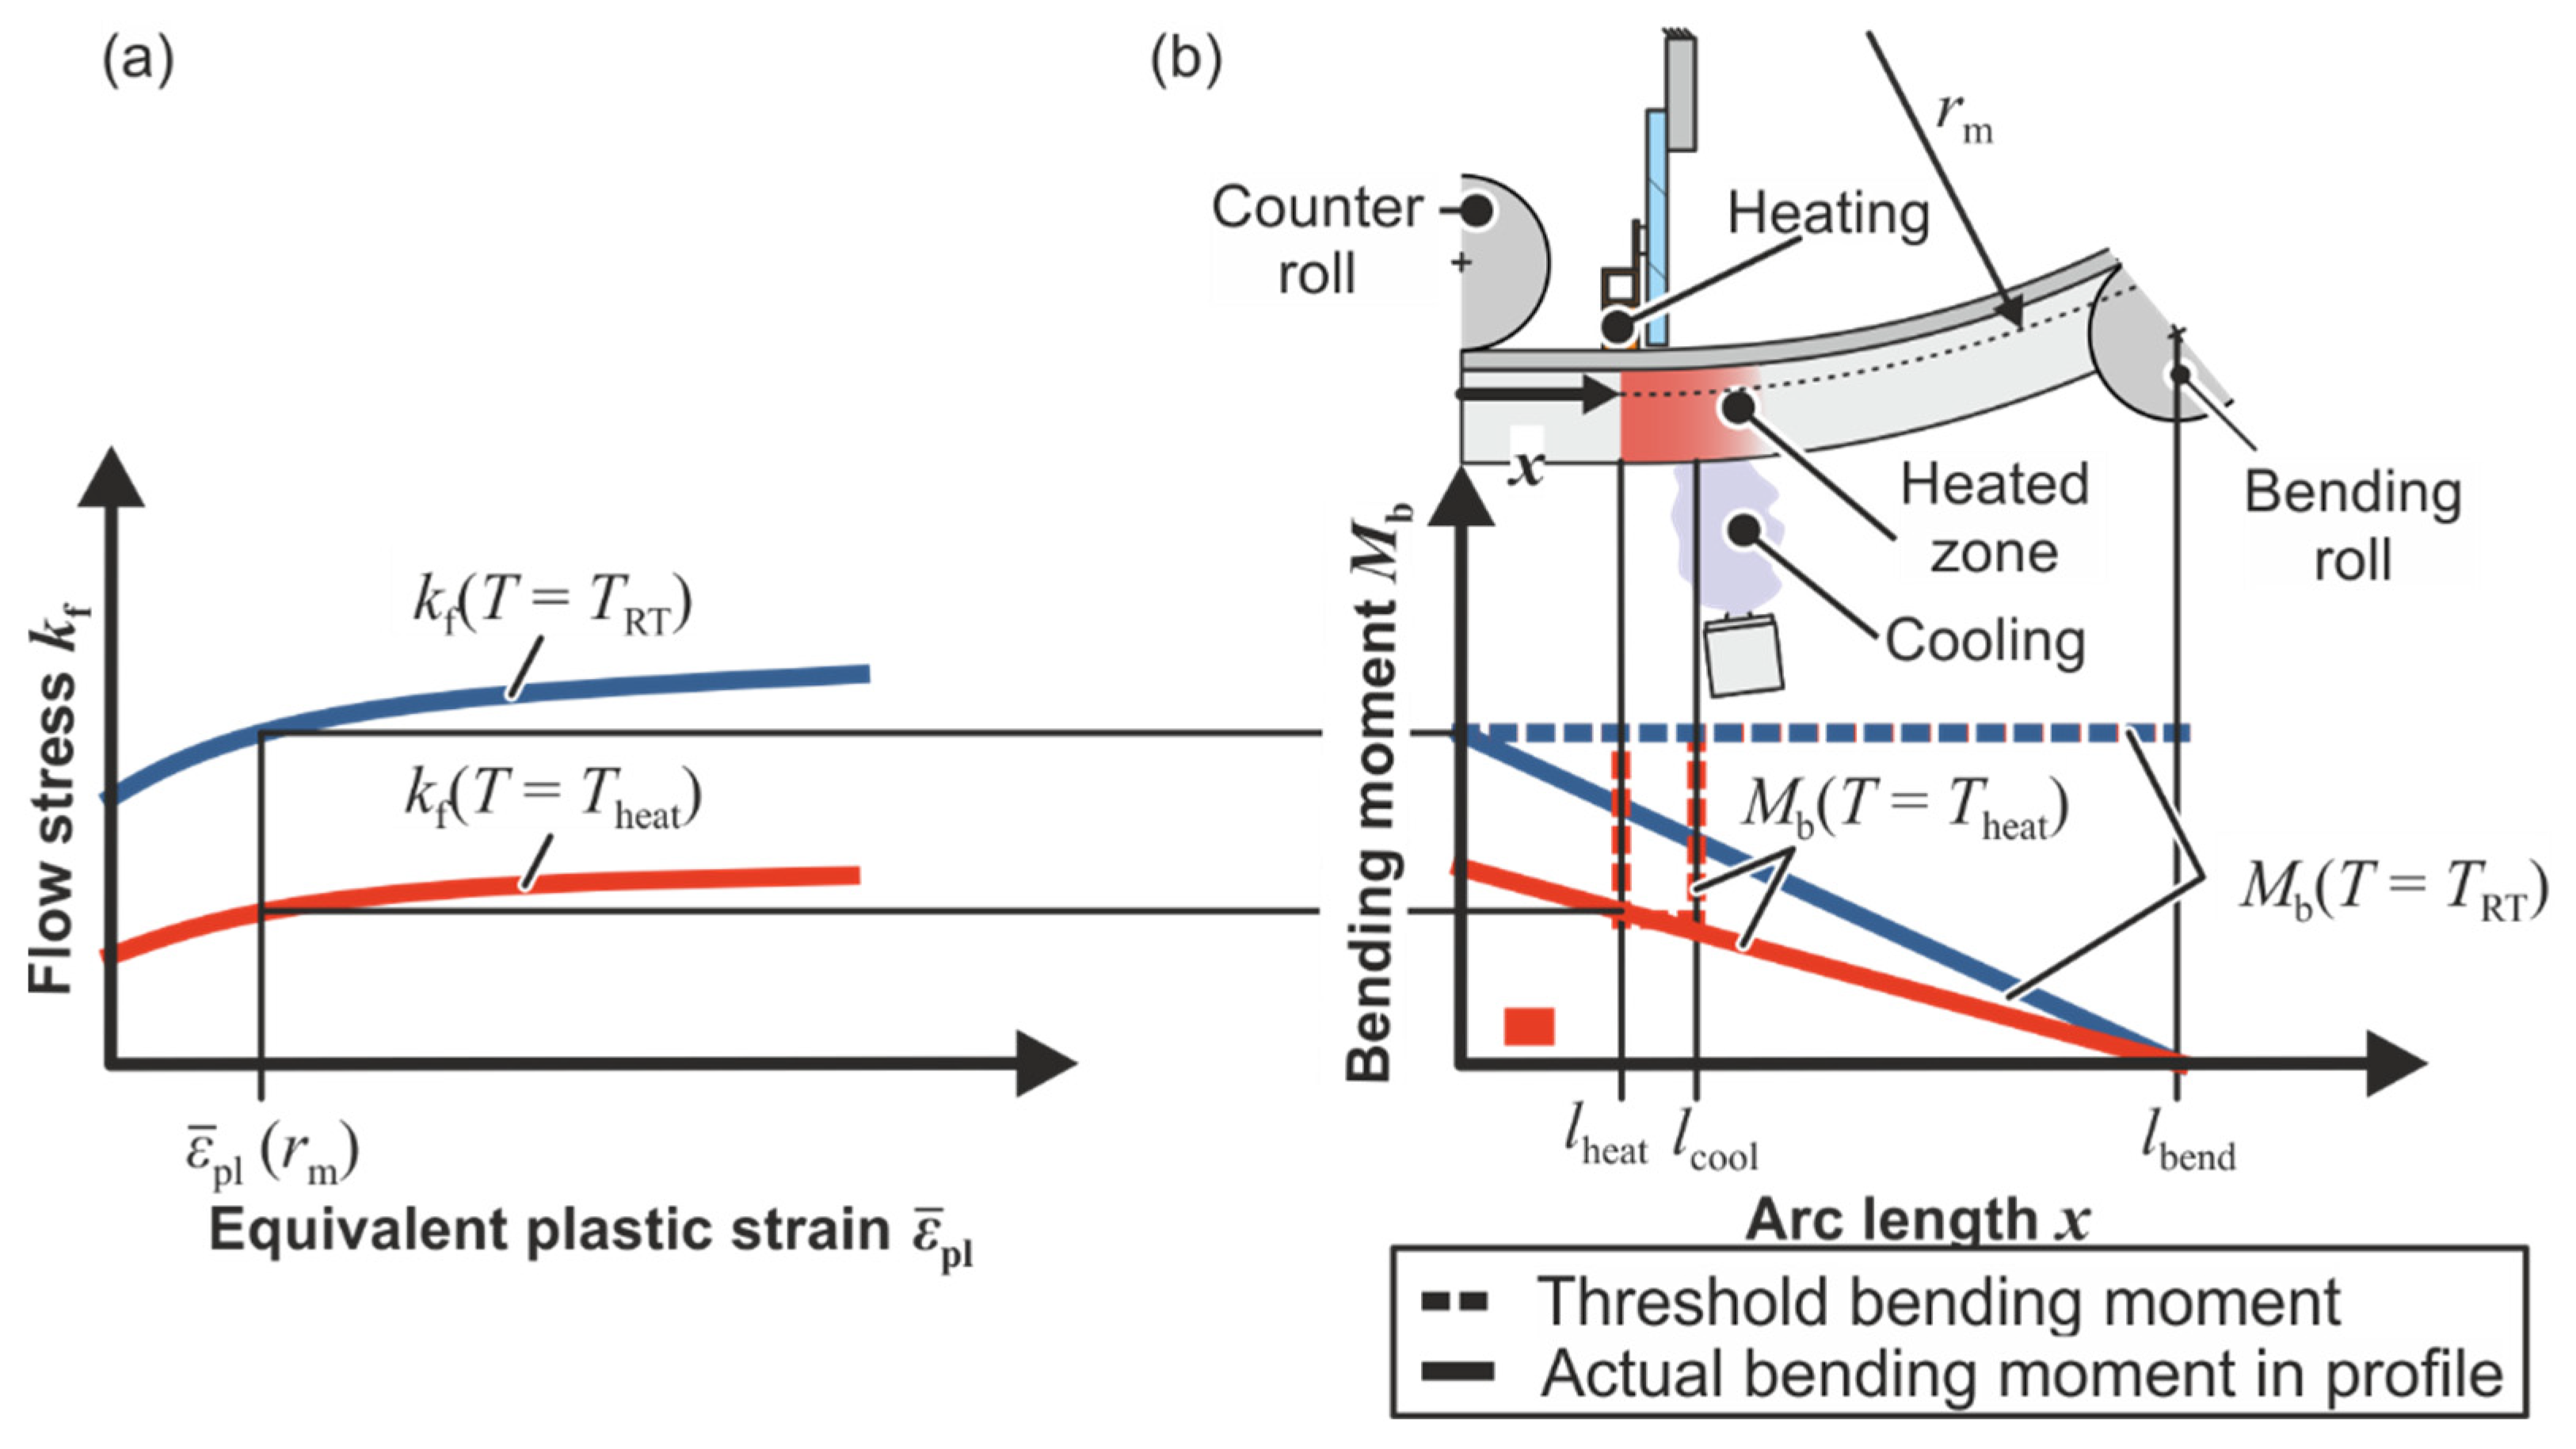
2.2. Principal Forming Zone

Depending on the partial heating temperature of the profile, a deviation of the forming zone position from the counter roll position is possible. The forming zone is at the position the bending moment in the profile first surpasses a threshold bending moment. At room temperature (T = TRT), the flow stress for forming is higher than in the heated case (Theat) (Figure 4a). The flow stress results in a threshold bending moment that is necessary to achieve a bending radius of rm (Figure 4b). One area of the profile is at room temperature (TRT) while the other is at heated temperature (Theat) for the partially heated profile. As the bending moment is an integral behavior demonstrated over the cross-section geometry, the threshold moment is decreased for a partially heated profile compared to a profile that is at room temperature. This results in the formation taking place at the counter roll position for the room temperature case. Partial heating for this process does not take place directly under the counter roll, but at a position x = lheat due to technical limitations. As the threshold bending moment is decreased between x = lheat and x = lcool, plasticity would not necessarily start at the counter roll. If the threshold moment for the heated area is reached, plasticity starts in the heated zone (x = lheat). The position at which plasticity starts x = lp is consequently either the position of the counter roll (lp = 0) or the position of the heated area (lp = lheat). The position of the forming zone is dependent on the amount of flow stress reduction and the position of the heated area.

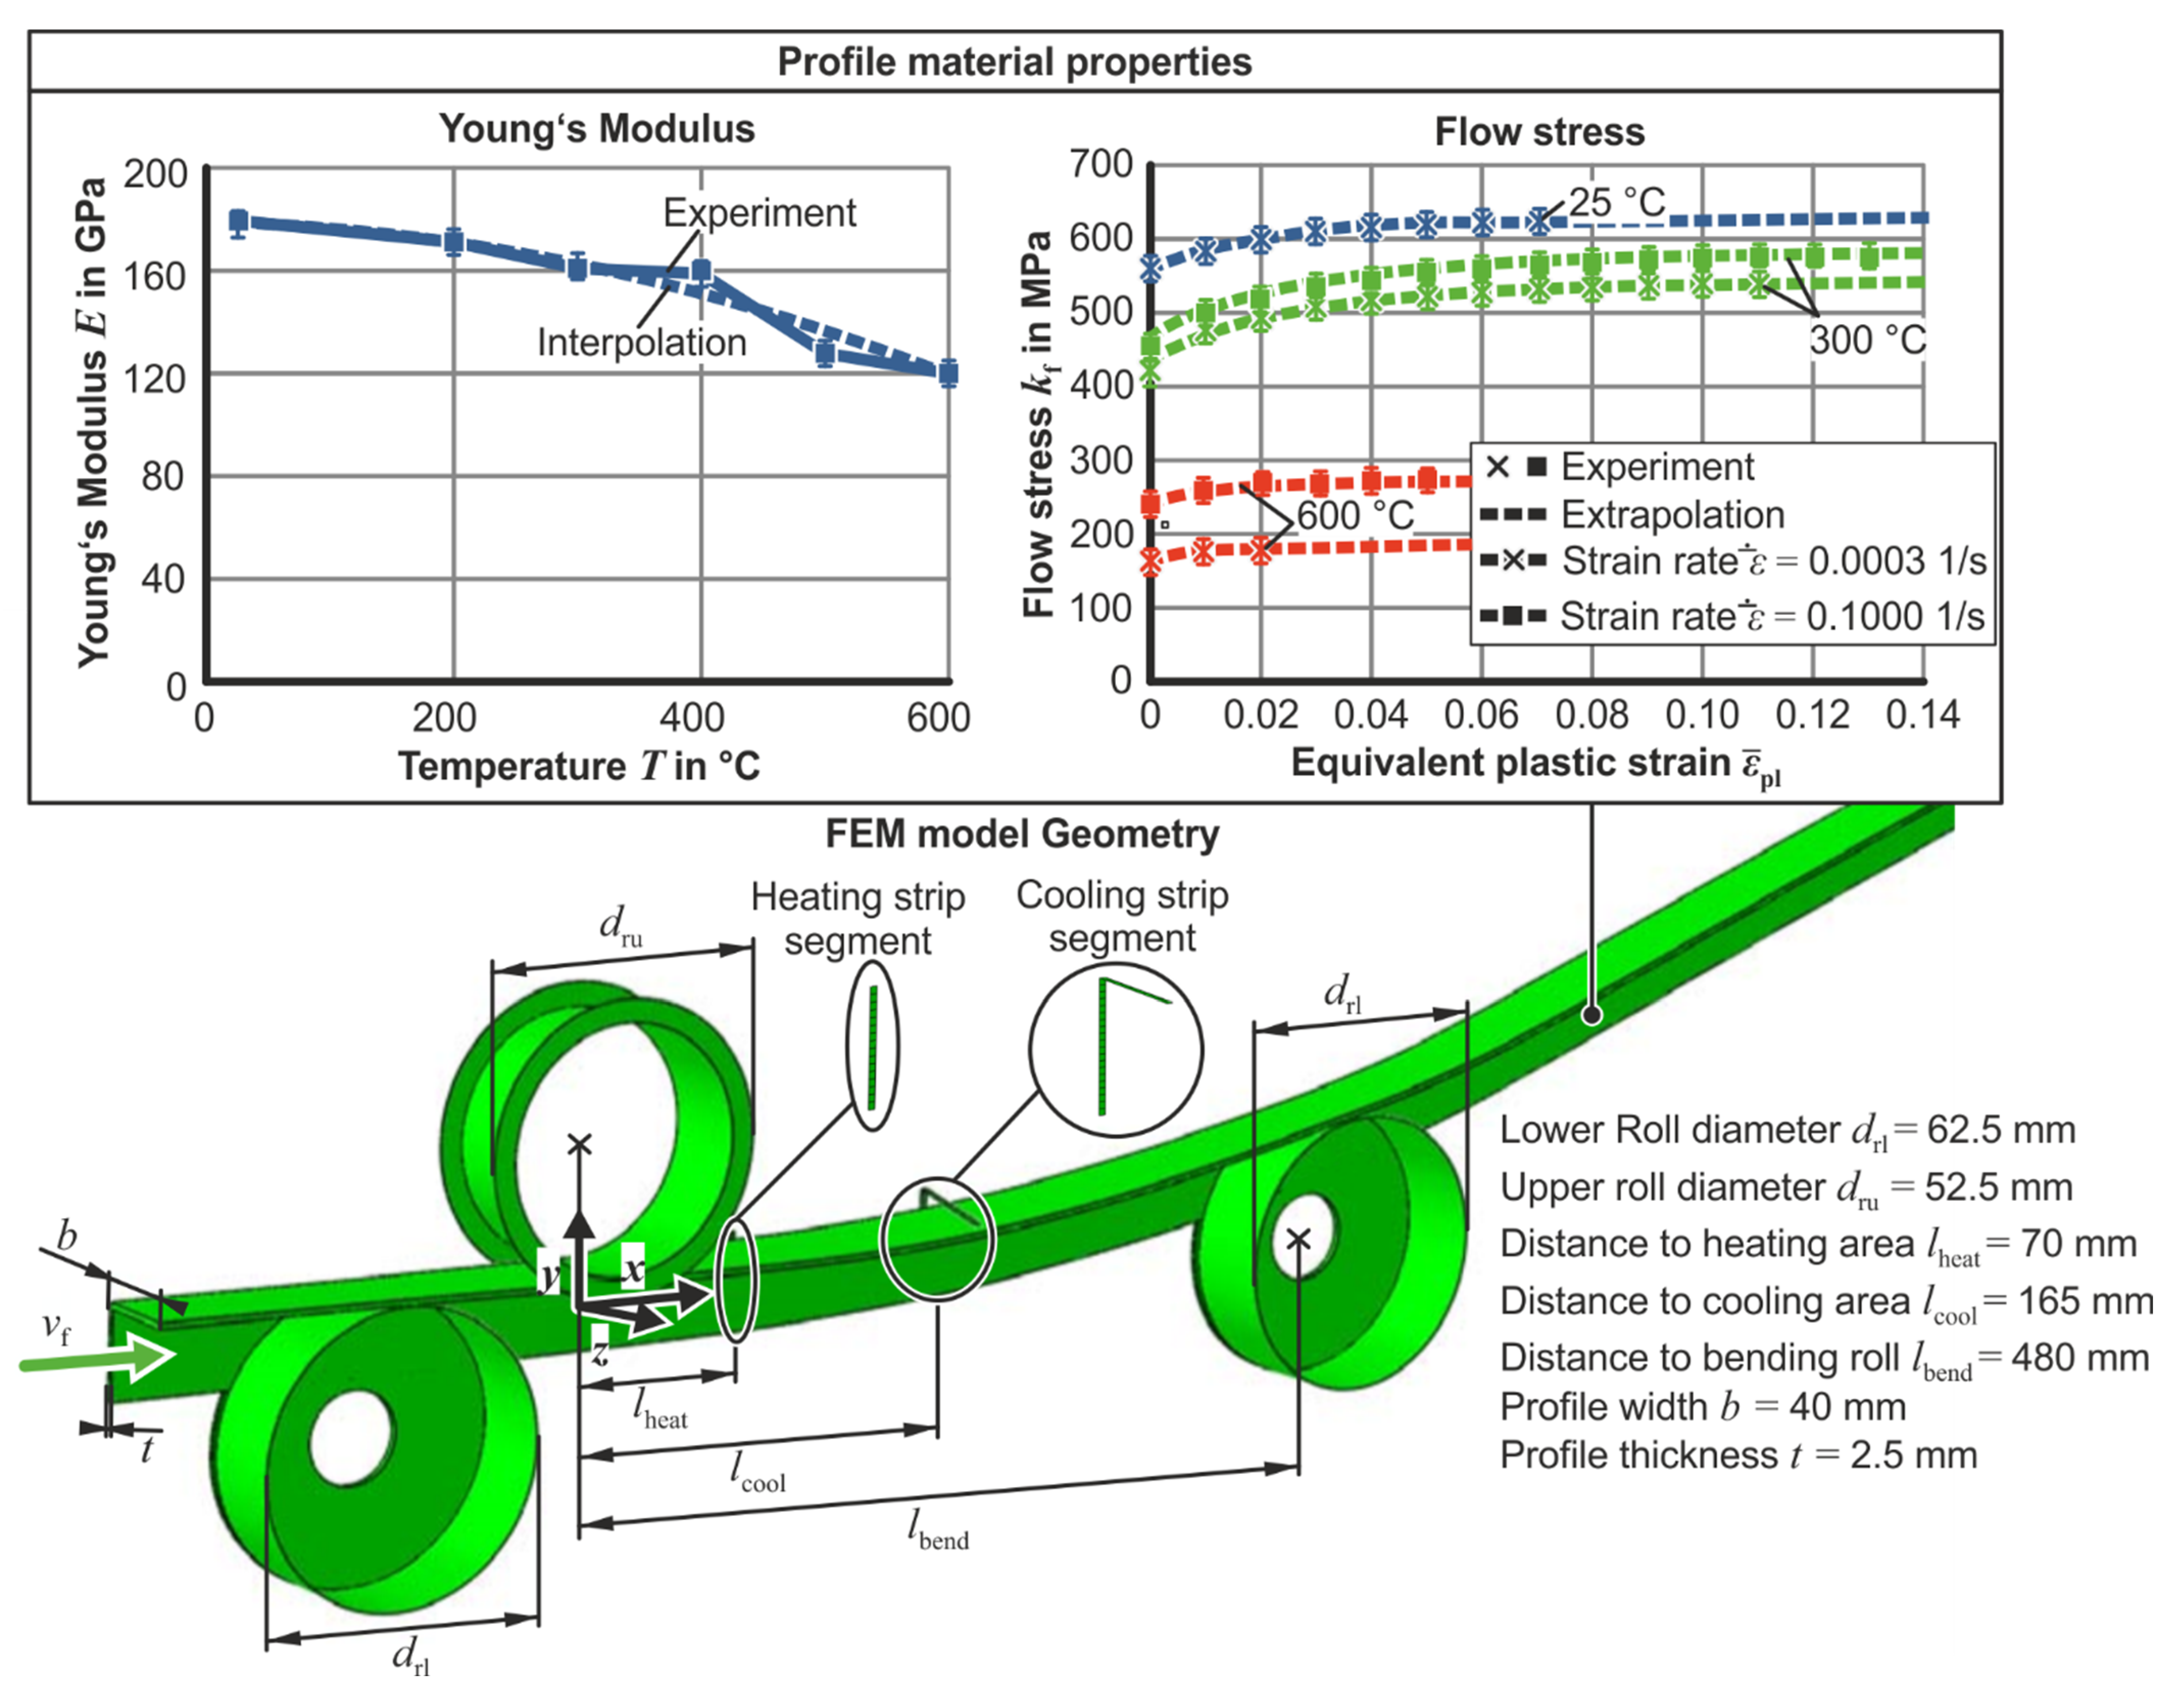
2.3. Numerical Model and Material Parameters

The material in use for the profiles is S500MC. Delivery conditions are according to EN 10140-2 (Table 2).
The temperature-dependent Young’s modulus and temperature- and strain rate-dependent flow curves were characterized through isothermal tensile tests on a Z250 tensile testing machine built by ZwickRoell, Ulm, Germany with induction heating. For the tensile tests, specimens with a parallel length of 30 mm and width of 10 mm are used to achieve a homogenous heating. The specimens are produced through laser cutting of the profile material in delivery condition. The strains are measured using a Maytec PMA-12/1N7-1 Extensometer produced by Maytec, Singen, Germany. Logarithmic strain rates 0.0003, 0.003, 0.03, 0.3, and 0.1 1/s as well as temperatures from 25 °C and between 200 and 600 °C in 100 °C steps were investigated (Figure 5). The specimens are evaluated according to ISO 6892. The software Abaqus 2018 with explicit global time incrementation is used for the numerical FE simulation. The profile is discretized with tri-linear hexahedral elements with full integration (C3D8T). The simulations employ full thermo-mechanical coupling. The deformable profile is meshed with 16 elements over the profile width (2.5 mm thick elements). Isotropic, linear, temperature-dependent elasticity is assumed for the workpiece material. The plastic behavior is modelled as isotropic according to von Mises with temperature and strain-rate dependent hardening. The rolls are modelled as rigid bodies with temperature degrees of freedom. The flow curves for each temperature set are extrapolated using a Tanimura–Voce model (see Appendix A for the model parameters)
k f = C 1 + ( C 2 C 1 ) exp ( C 3 ε ¯ pl ) + ( C 4 C 5 ε ¯ pl C 6 ) log ( ε ¯ ˙ pl ε ¯ ˙ pl , 0 ) + C 7 ε ¯ ˙ pl C 8  
with the flow stress k f , the material constants C 1 to C 8 , the equivalent plastic strain ε ¯ pl , the equivalent plastic strain rate ε ¯ ˙ pl , and the initial equivalent plastic strain rate ε ¯ ˙ pl , 0 . The temperature dependency of Young’s modulus is approximated by
E ( T ) 0.1579 MPa K 2 Δ T 2 9.5596 MPa K Δ T + 180,098   MPa ,  
where Δ T is the difference between room temperature and heating temperature. The maximum error for this approximation is 6%. The Poisson’s ratio is set as 0.3.
Continuous heating and cooling are realized through isothermal rigid strips with high conductivity. This heating method assumes that the temperature is evenly distributed after the material reaches the heating or the cooling zone. The strip for the heated area is at maximum temperature while the strip for the cooling area is at room temperature. The simulation is divided into three steps comparable to the bending tests. These steps are pre-bending, temperature-assisted continuous push bending, and unloading.

3. Analytical Modelling of the Kinematic Push-Bending Phase

In this segment, the developed analytical procedure is explained. First, the process is abstracted for the simplification of the calculations. Then, the assumptions for the model are displayed. After that, the resulting equations for strains and strain rates are defined. Using these definitions, the methods to evaluate warping angle and bending moment are shown.

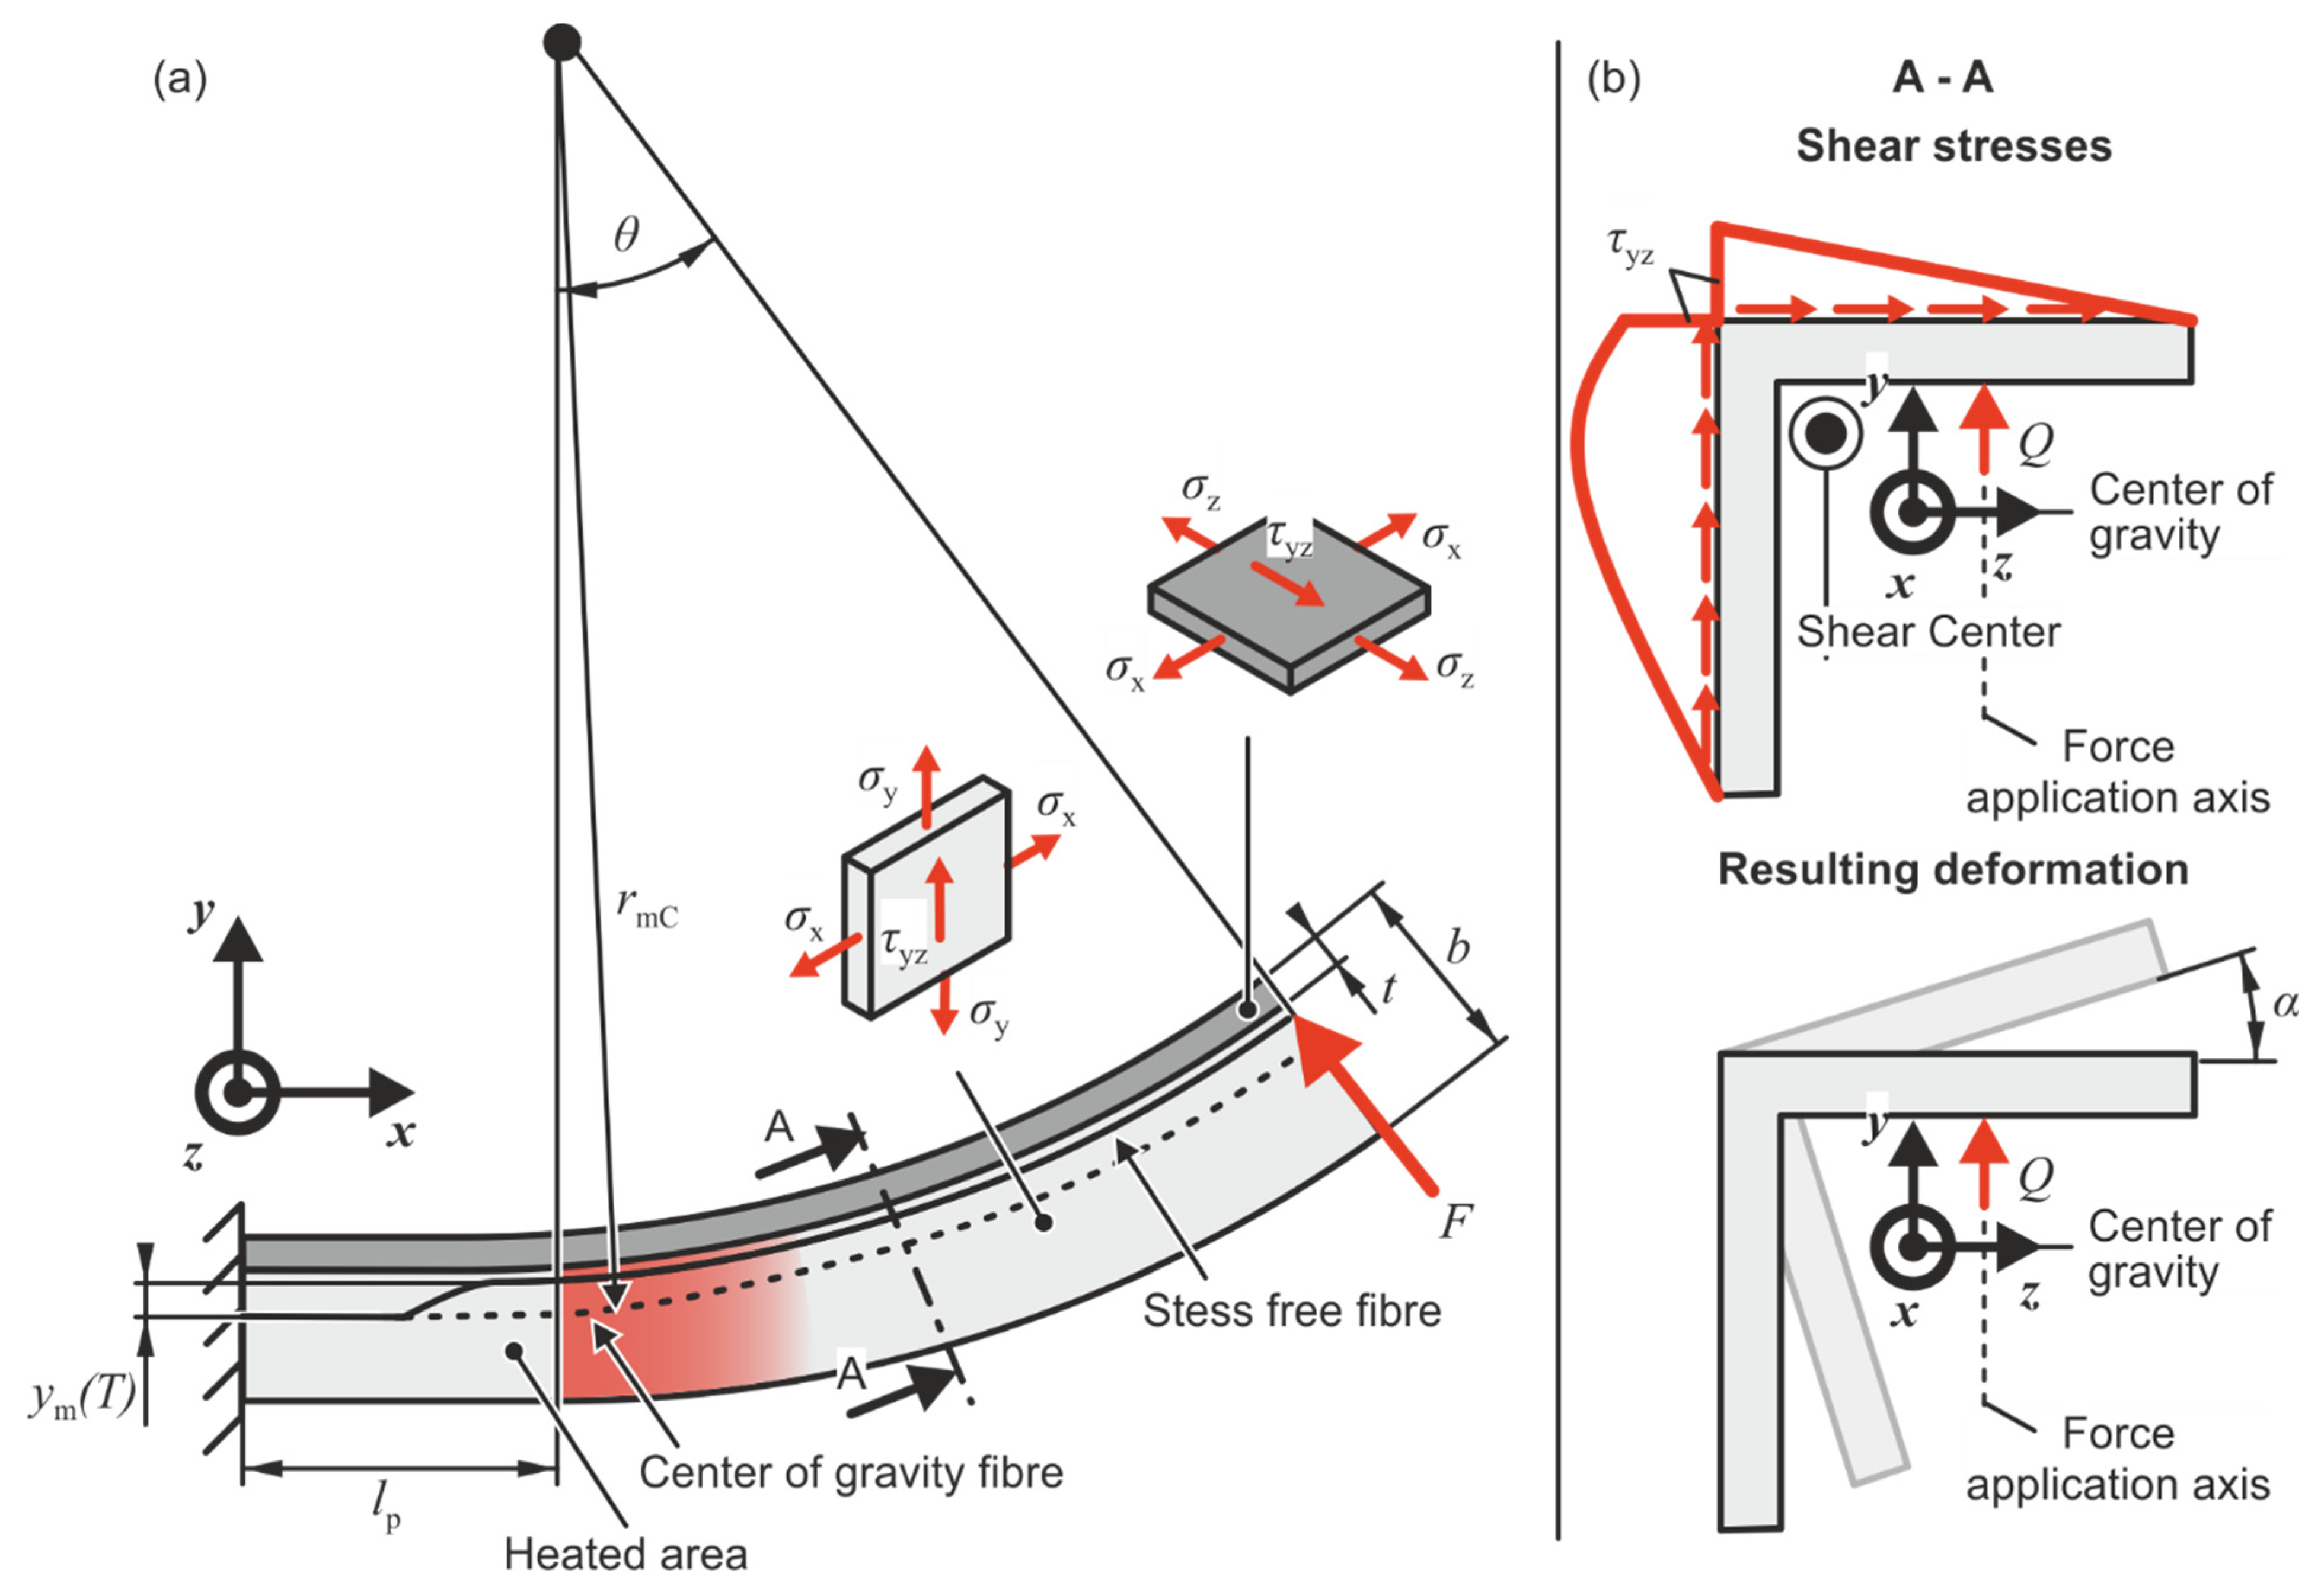
3.1. Abstraction of the Process Geometry Regarding the Profile Load

Plasticity in the analytical model is assumed to start at a position x = lp to reach a set bending radius at the center fiber rmC for the profile (see Figure 6a). The counter roll is simplified as fixed support, at which the origin of the coordinate system is located in the profile cross-sectional center of gravity. Resulting from the bending, an angle θ is generated between the forming force F and the position of plasticity onset lp. The forming force F induces a bending moment Mb. The partial heating on the profile is assumed to shift the position of the stress-free fiber ym (T). Additionally, through the forming force F, a section force Q on the cross-section (Figure 6b) is implied, which results in shear stresses τyz due to the difference between the force application axis position and shear center position. The shear stresses result in a torsion moment MT leading to a warping deformation with the warping angle α. The alteration of the stress-free fiber position ym (T) is assumed to influence the position of the shear center.

3.2. Assumptions

For the analytical investigation, it is assumed that a modified version of the elementary bending theory is applicable. The assumptions used from elementary bending theory are [18]
  • Bending radius rmC is constant during the whole bending operation
  • Planar surfaces stay planar and vertical to the sheet surface
  • The material is homogenous and isotropic
  • The sheet thickness during the bending process is constant
    Deviating from elementary bending theory, the following assumptions are made:
  • Normal stress implied by bending force is negligible compared to the bending and shear stresses
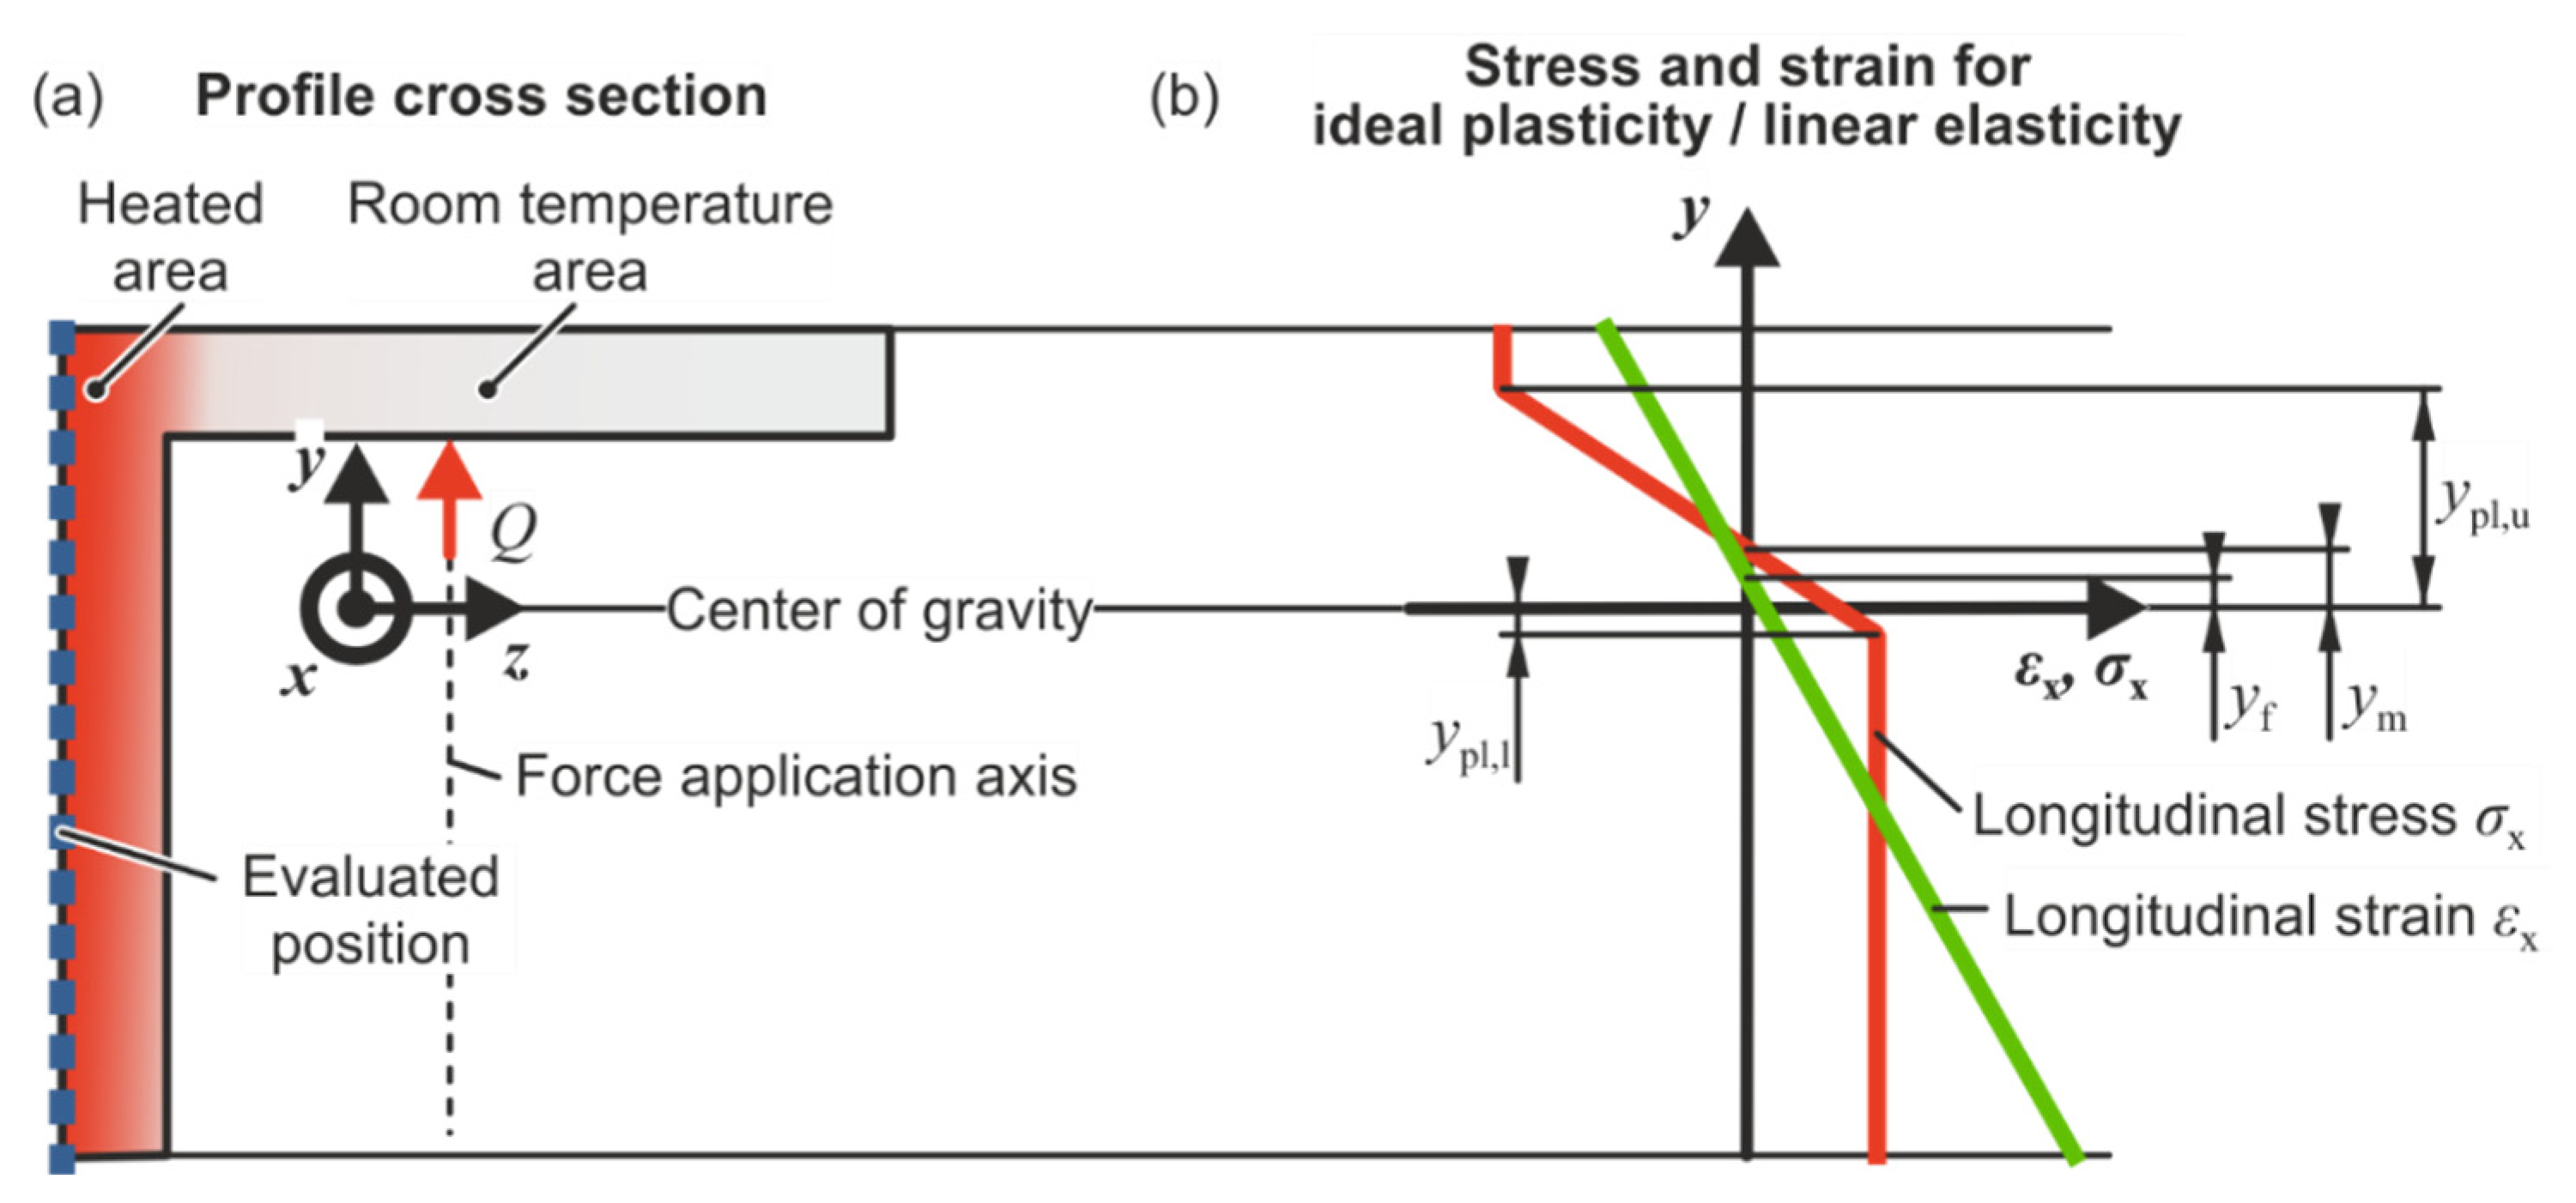
  • The progression of stress and strain curves for the tensile and the compressive area is symmetrical to the center of gravity fiber if the whole profile is at room temperature
  • The stress state for each of the cross-sectional areas is planar (elementary bending theory for wide sheets) with an addition of shear stresses vertical to the profile thickness due to the difference in position of force application axis and shear center.
  • The pre-bending phase has no influence on process behavior during the continuous push-bending phase.
  • The influence of shear stresses on reaching the threshold of onset of plasticity is negligible.
  • Through constant feed velocity νf the process is stationary at position x
  • Due to the small distance between the heating and the cooling zone no exchange of heat between the heated profile area and the area at room temperature is considered and heat exchanged with the surroundings is neglected (see Appendix B).
  • In the heating area, temperature increases linearly until reaching a maximum temperature at the center of the heating area.

3.3. Calculation of Strains and Strain Rates

In the continuous push bending process, the material behaves elastically at x < lp and the material can behave partially elastic or fully plastic over the cross-section. The temperature dependent elastic bending strain εel,x can be described as
ε el , x = y r mC + a T Δ T ,  
with the loaded bending radius to the center of gravity fiber rmC, the thermal expansion coefficient aT and the difference between room temperature and heating temperature ΔT as the compressive zone is in the positive y -segment. Elastic shear deformation is neglected ( ε el , yz = 0 ) Using Equation (3), the strain free fiber position yf can be calculated through ε el , x ( y f ) = 0 . For the plastic area of the profile cross-section, the plastic strains are expressed as
ε pl , x = ln ( 1 + y r mC ) ,
ε pl , yz = tan ( α ) .
Elastic and thermal strain components are neglected if the material behaves plastic as they are considered small compared to the plastic mechanical strain (see Appendix C).
The bending strain rate in the continuous push-bending phase can be expressed as
ε ˙ pl , x = v f x l p ln ( 1 + y r mC ) ,
with the profile feed velocity v f and the x position of plasticity onset l p . Assuming that strain rates and strains at the position x remain constant over time, during the bending, due to constant feed velocity, the Levy–Mises flow rule can be used to calculate the shear strain rate in the plastic segment as
ε ˙ pl , yz = ε pl , yz ε ˙ pl , x ε pl , x .

3.4. Calculation of Profile Warping

Using the mean slope Ep (T) (Appendix D) of the flow curve defined in Equation (1) and using temperature dependent Young’s modulus definition (Equation (2)), a relation between shear stress and shear strain rate in the plastic zone can be described through constant temperature as [19]
τ yz = 1 3 E ( T ) E p ( T ) E ( T ) + E p ( T ) tan ( α ) .
To describe the correlation between shear strains and forming force, the equation
τ yz = Q S I z t
is used with the cross-sectional force Q, the first moment of area S, the second moment of area I z and the profile thickness t. Using the relation between torsion moment and shear stress
M T = τ yz t   d A ,
(see Appendix E for the formulated integral) and using Equations (8) and (9) the warping angle α can be calculated numerically.

3.5. Calculation of the Bending Moment

The equation for the bending moment of the process can be expressed as
M b = σ B y   d A ,
where the bending stress in the plastic area σ B , pl can be resolved through the Mises equation and the flow rule
σ B = 2 3 k f ( ε ¯ pl , ε ¯ ˙ pl , T ) 2 4   τ yz 2
Considering the profile cross-section (Figure 7a), stresses and strains can develop partially plastic over the course of the y coordinate (Figure 7b). Additionally, in the partial heated case, assumption 6 must be generalized. Wolter [20] firstly determined that it is possible for the stress- and strain-free fiber to deviate in position and that the position of stress and strain symmetry changes during the bending process. For example, an added normal compressive stress shifts the position of the stress-free fiber in the direction of the compressive area [21]. A similar effect is expected for a partially heated profile. As temperature increases in the heated area, the flow stress is reduced. In the room temperature area, flow stress remains constant. As the force equilibrium needs to be fulfilled, the symmetry axis between the tensile and the compressive zone (the stress-free fiber) needs to shift in direction of the compressive zone. Due to the coupling of stress and strain, the strain free fiber will move in direction of the compressive area too. To solve the integral correlation in Equation (11), it is necessary to calculate the position of the stress-free fiber ( y m ) and the position at which the material starts plastic forming ( y pl , l in the lower and y pl , u in the upper area).
The fibers for plasticity onset ypl,l and ypl,u at xlp can be calculated using assumption 9 and Equation (3) through the relation
± ( 2 ( 1 ν 2 ) 3 E ( T ) k f ( 0 , ε ¯ ˙ pl , T ) a T Δ T ) r mC = y p l
with the Poisson’s ratio υ . The shift of the stress-free fiber y m from the center of gravity results from a shift due to normal stresses y m , N and a shift due to temperature y m , T yielding in
y m = y m , N + y m , T .
The shift due to normal stresses of the stress-free fiber occurs by the superposition of normal stresses [5] as they are added in the Mises stress. The position of the stress-free fiber is temperature dependent because of the reduced flow stress in the heated area. As the flow stress in the room temperature area remains constant, the stress-free fiber has to shift to the compressive zone so that force equilibrium between the tensile and the compressive zone of the cross section is fulfilled. As the normal stresses are negligible (assumption 5), the stress-free fiber position is ym = ym,T.
The position of the stress-free fiber due to temperature ym,T needs to be evaluated to calculate the bending moment. To evaluate ym,T, some considerations are necessary. Mechanical equilibrium between tensile and compressive zones for the room temperature case is fulfilled if the stress-free fiber is in the origin of the profile cross section (Figure 8a). Through the lower flow stress, the stress in the heated section is reduced (Figure 8b). As the force equilibrium between both areas still needs to be fulfilled, a shift in stress-free fiber position ym,T is caused. To calculate the position of the stress-free fiber, the forces in the compressive area (FRT and Fh) are related to their corresponding distance at which they act upon. In detail, b 2 y 0 is related to the room temperature force FRT and b 2 y 0 y m , T is related to the force in the partially heated case Fh. y0 is the distance between the middle of the profile cross section and the center of gravity. Through geometrical considerations, it is then assumed that the share of ym,T on the distance of the compressive zone in the room temperature case ( b 2 y 0 ) is the same as the share of the force FRTFh on the force at room temperature (FRT) (Figure 8c). This means that the force change between the room temperature case and the partial heated case is related to the stress-free fiber shift.
The resulting equation for the stress-free fiber can then be expressed as
F RT F h F RT = y m , T b 2 y 0 .  
Using the integral relation
F = σ B d A  
the forces FRT and Fh can be calculated. With ym, ypl, and α, the bending moment (Equation (11)) for the process can be calculated (see Appendix F).

4. Analysis of Push-Bending with Partial Cross-Sectional Heating and the Resulting Geometry

The effects of the partial heating strategy are evaluated in this chapter. First, the influence on the product geometry is investigated by examining the unloaded geometry. After that, the position of the plastic zone is determined. Finally, the influence of the partial heating strategy on bending load and warping angle is investigated to understand the mechanisms in the process.

4.1. Analysis of the Unloaded Geometry

The influence of the partial heating on the unloaded bending geometry is shown focusing on springback and warping (Figure 9a) From 25 to 300 °C, the warping angle and springback ratio stay approximately constant. With further increasing temperature springback and warping angle are decreasing. For higher feed velocity the profile springback increases by a mean value of 12% (see Figure 9b). The increase of springback at higher feed velocity can be attributed to the strain rate hardening (Figure 4). The higher feed velocity of 8 mm/s leads to a doubled strain rate compared to the lower velocity of 4 mm/s, resulting in a change of the highest strain rate from 0.055 1/s to 0.11 1/s. This results in an increase of the flow stress by 9% at 0.2 strain for the 600 °C case.
Until a temperature of 300 °C in the heated area, the maximum change between the room temperature case and the partial heated case is 2%. For temperatures higher than 300 °C, the springback reduces approximately linearly with a maximum reduction of 56% at 600 °C.
To validate the numerical model, the experimental data are compared to the numerical data (Figure 10a). The numerical simulation can approximate the experimental springback with an error of 3%.
The related warping angle increases linearly over the arc length for each parameter set until a saturation value (Figure 10b) on the arc length of 600–800 mm is reached, after saturation, the related warping angle is constant with a deviation from a constant value of maximum 13%. Related warping angle is decreasing with increasing temperature. After saturation (x = 1100 mm), the decrease for 300 °C is 9% and for 600 °C the decrease is 76% compared to the room temperature curve. The mean deviation between experimental and numerical results for all parameter sets is 10%. The springback is only reduced at temperatures higher than 300 °C. This can be attributed to the flow stress reduction in the cross section. To further discuss this effect, the position of the principal forming zone must be determined.

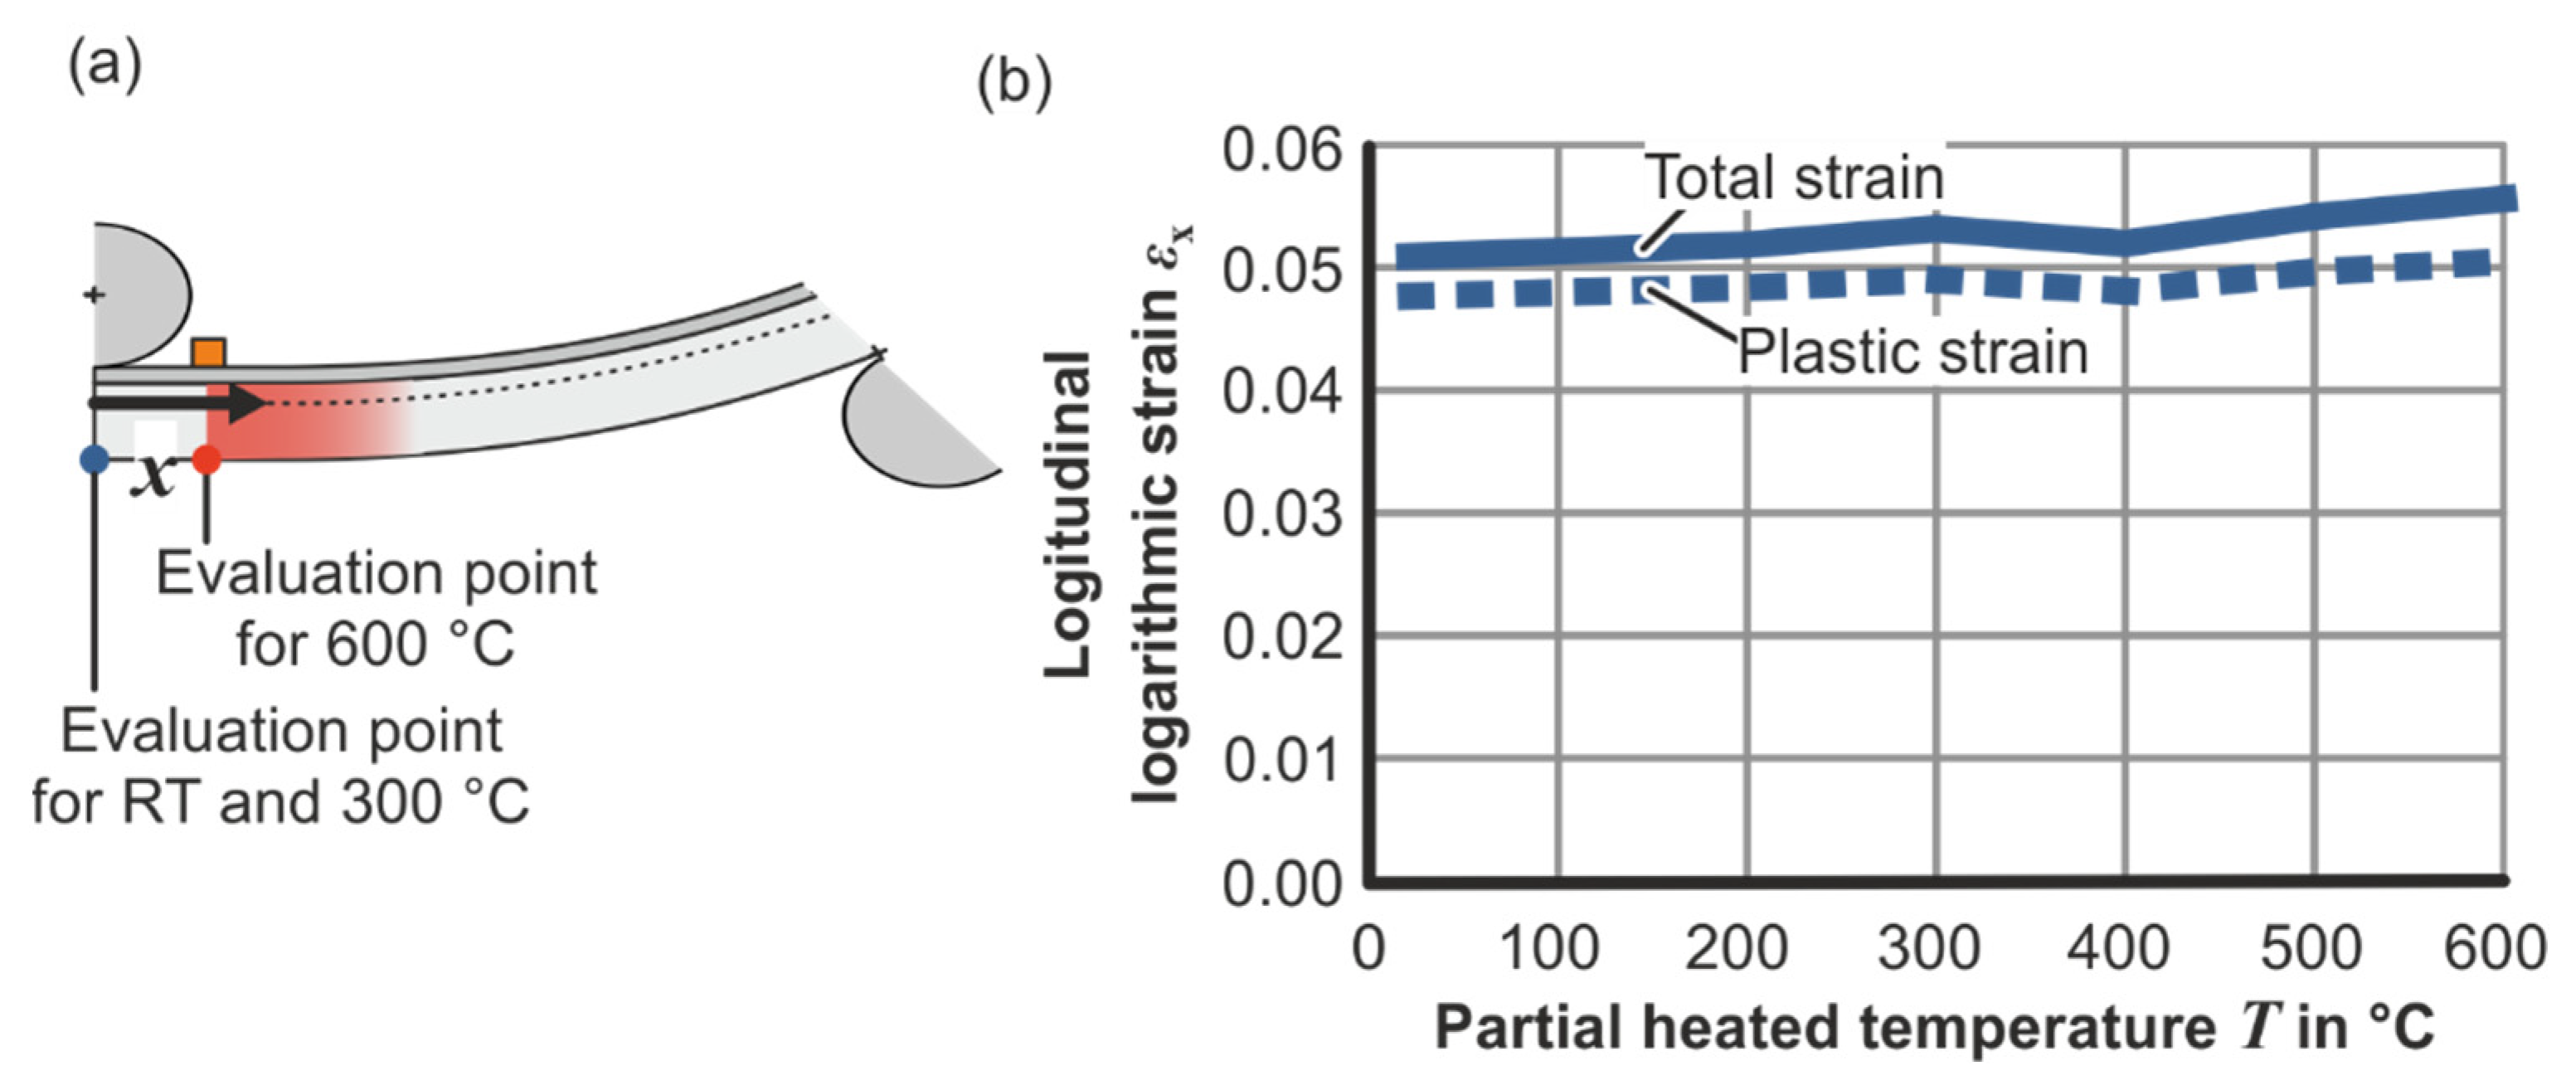
4.2. Investigation of the Plastic Zone

To analyze the influence of the partial heating strategy on springback and warping the location of the principal forming zone is important (Figure 11). The actual bending moment in the profile is evaluated using the bending force of the simulation data. The threshold bending moment is received by solving the bending moment equation (Equation (12)) for the minimum flow stress necessary to receive the set loaded radius. Temperature is assumed constant in the heated area. Plasticity starts at the first position the profile bending moment surpasses the threshold bending moment. For the room temperature case (Figure 11a) and 300 °C partial heating temperature (Figure 11b), the plastic deformation limit is surpassed at the position of the counter roll x = 0. The flow stress reduction for 300 °C is not sufficient for plasticity to start in the heated area. For the 600 °C case (Figure 11c), the bending moment reduction is sufficient for plasticity to start in the heated area at lp = 77 mm. Consequently, the bending moment is only decreased if the heating temperature is higher than 300 °C. The decreased bending moment results in lowered springback of the profile (Figure 9).
As plasticity for the 600 °C case does not start at the position of the counter roll, the moment arm also decreases which influences the set bending radius. The loaded radius is not adjusted for this effect in the analysis as it was not possible to determine the true radius before the analysis. The set radius r i for the 600 °C case would then be 447 mm, which would cause a deviation in the springback ratio of 11%. Consequently, the change of springback ratio between the 600 °C case and the room temperature case would be 44% (Figure 9b).

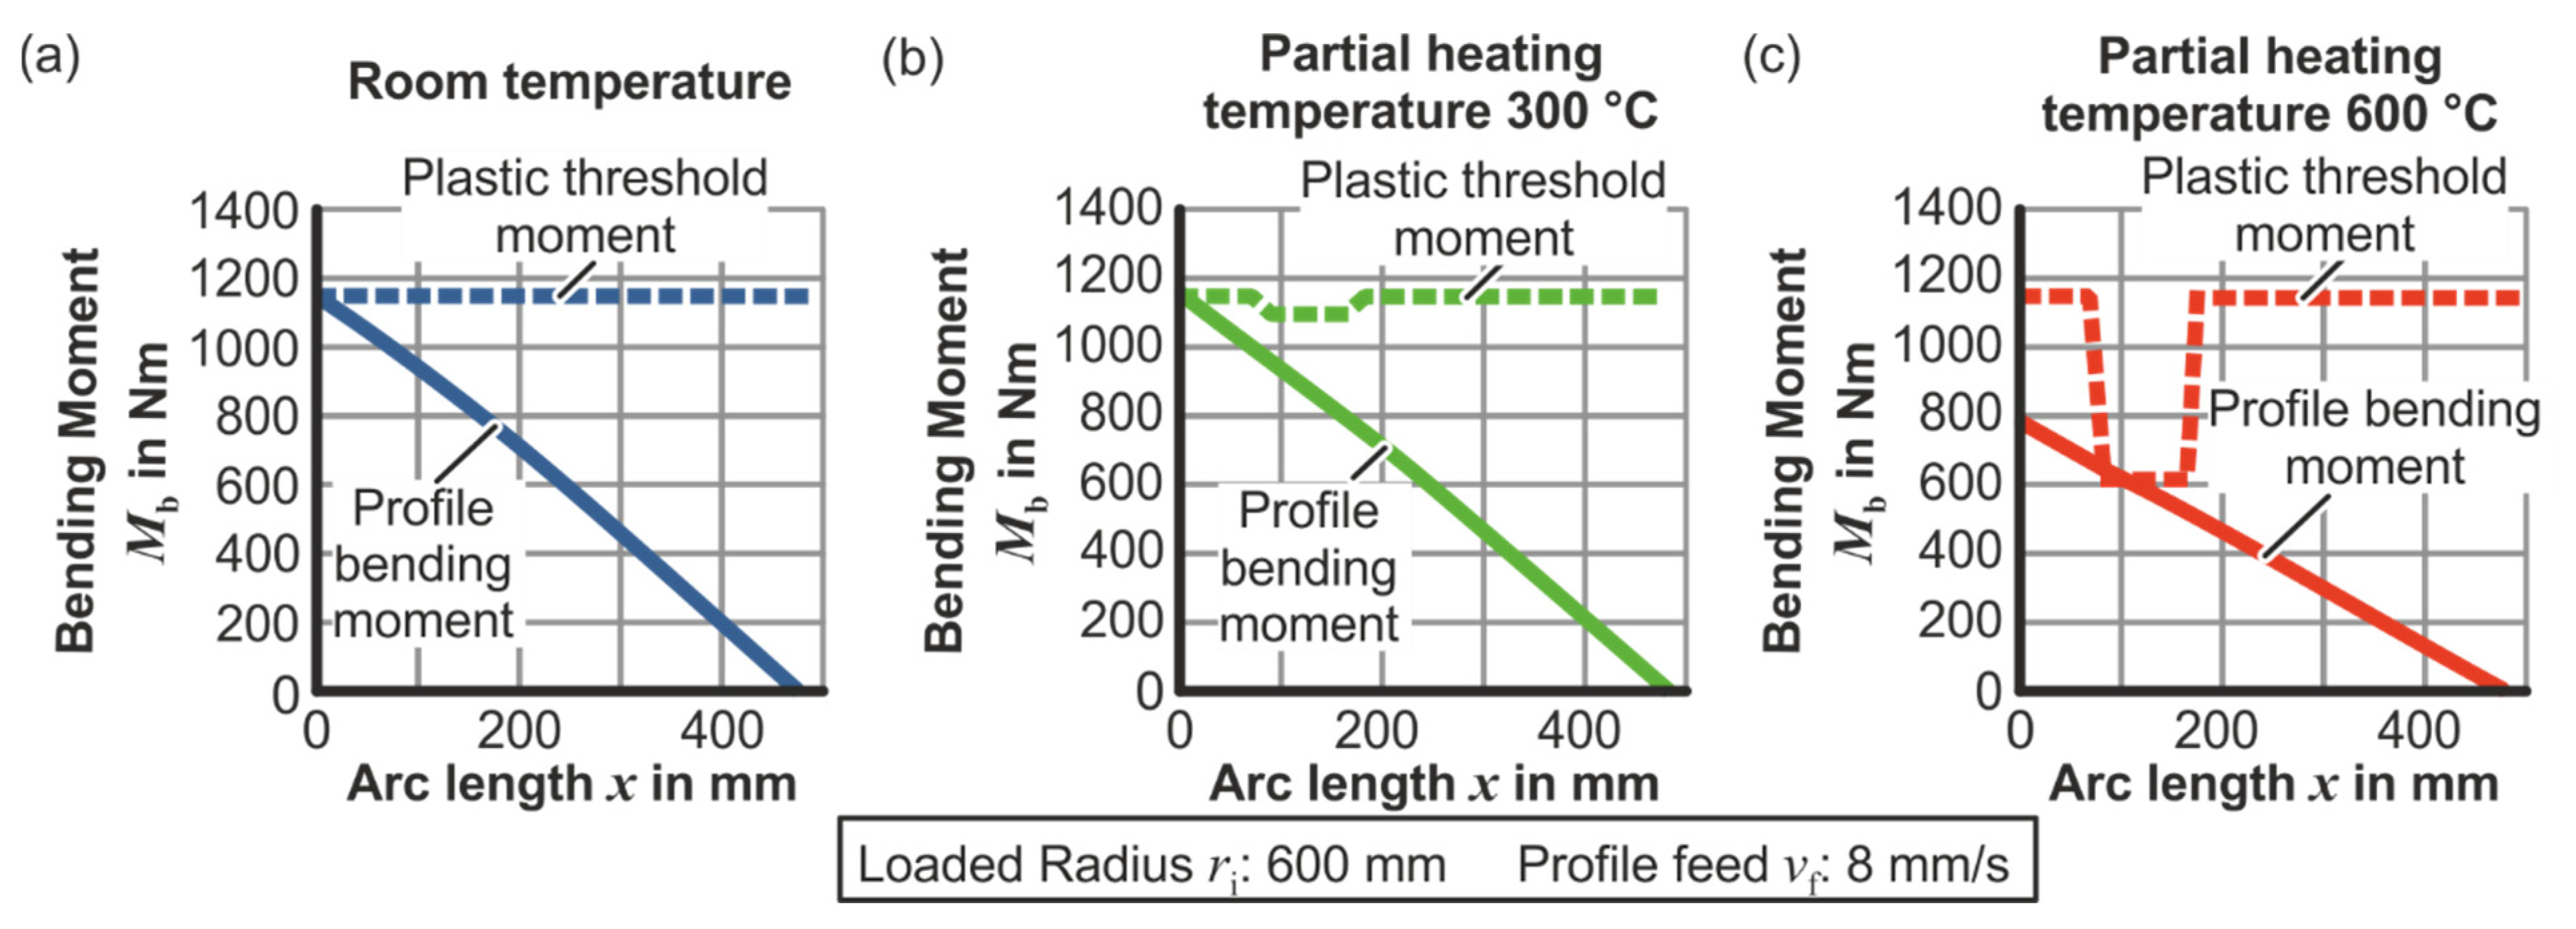
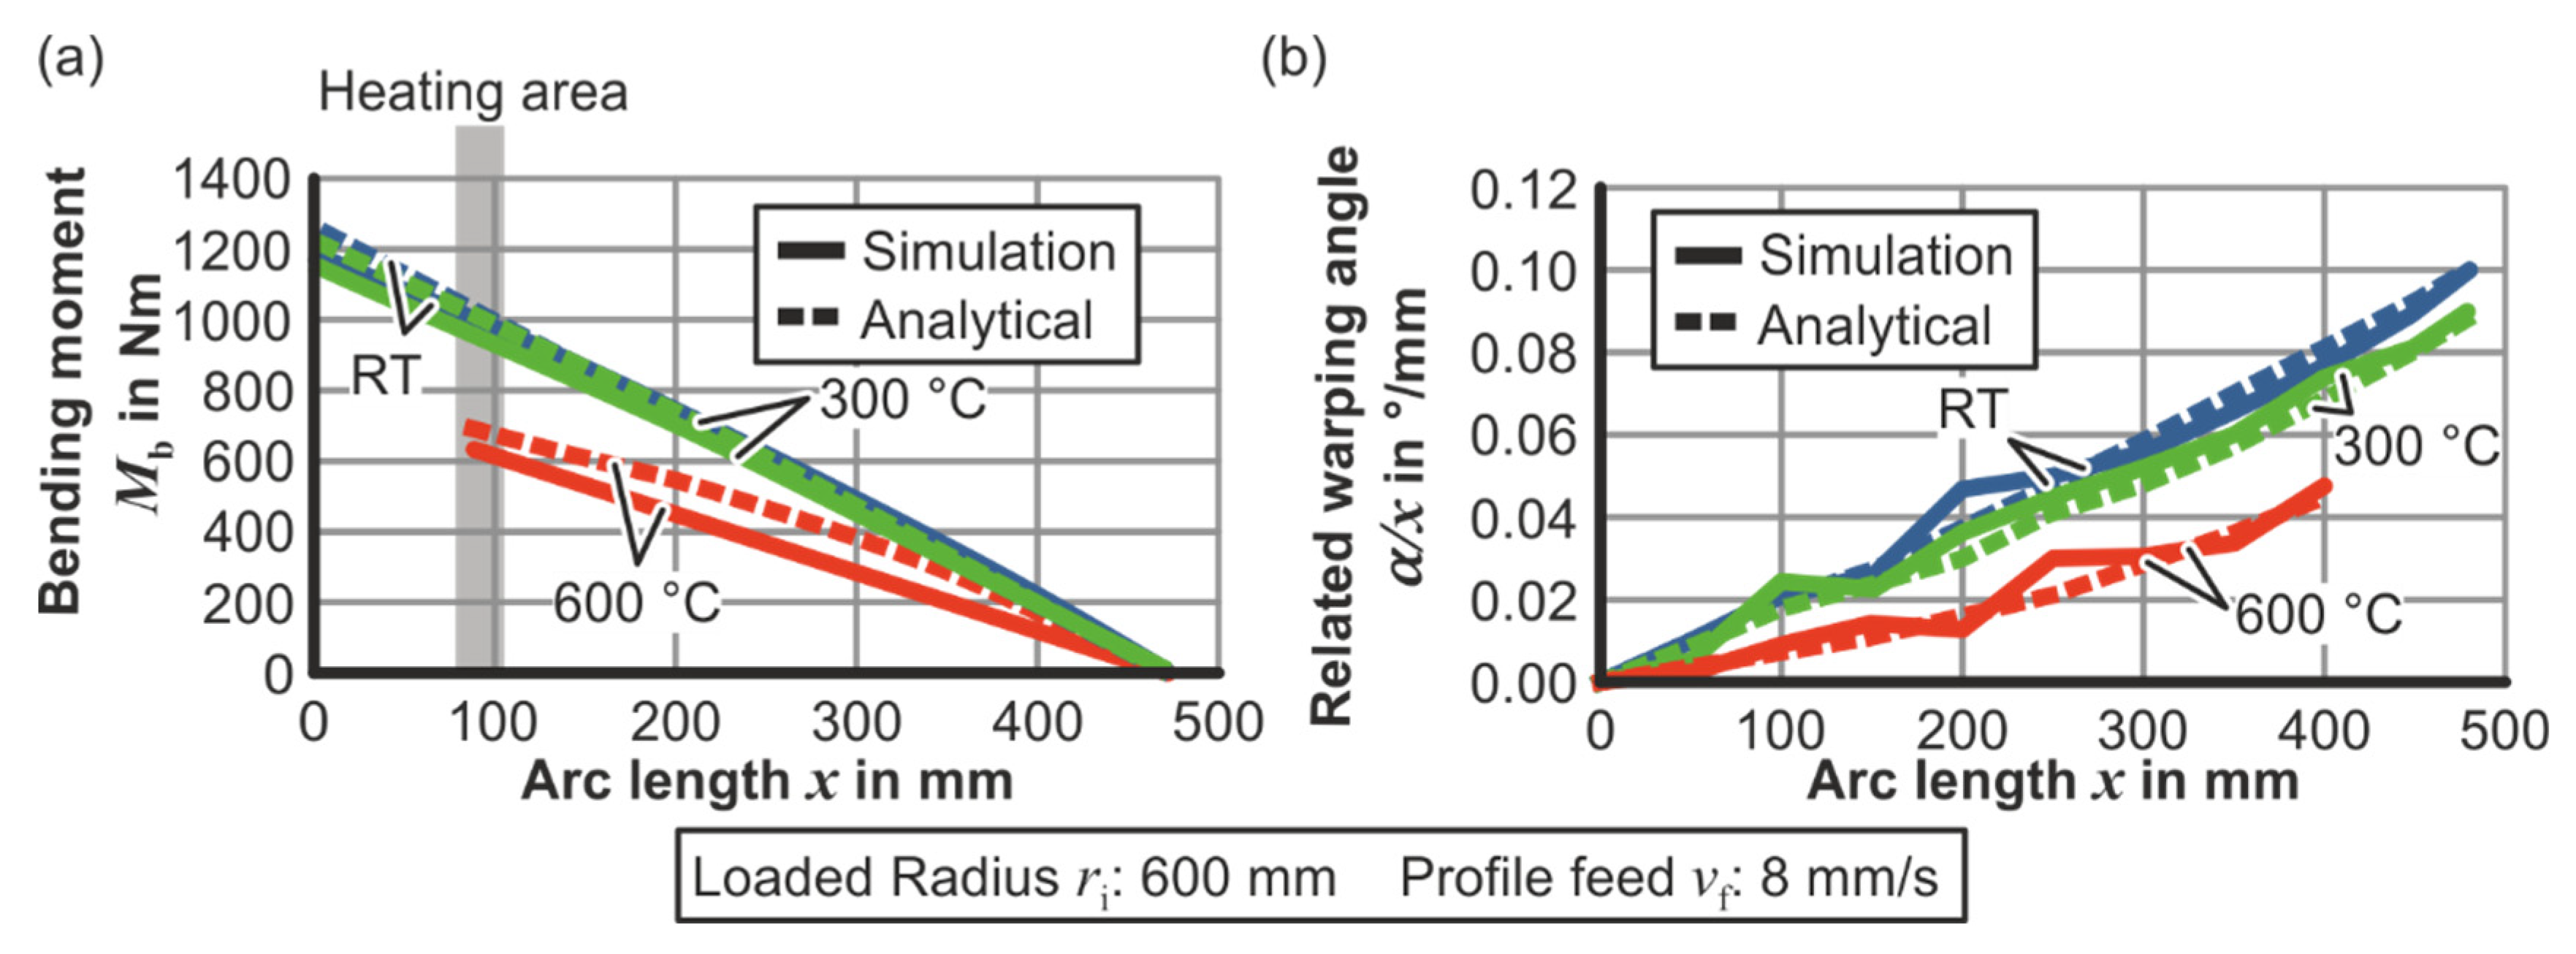
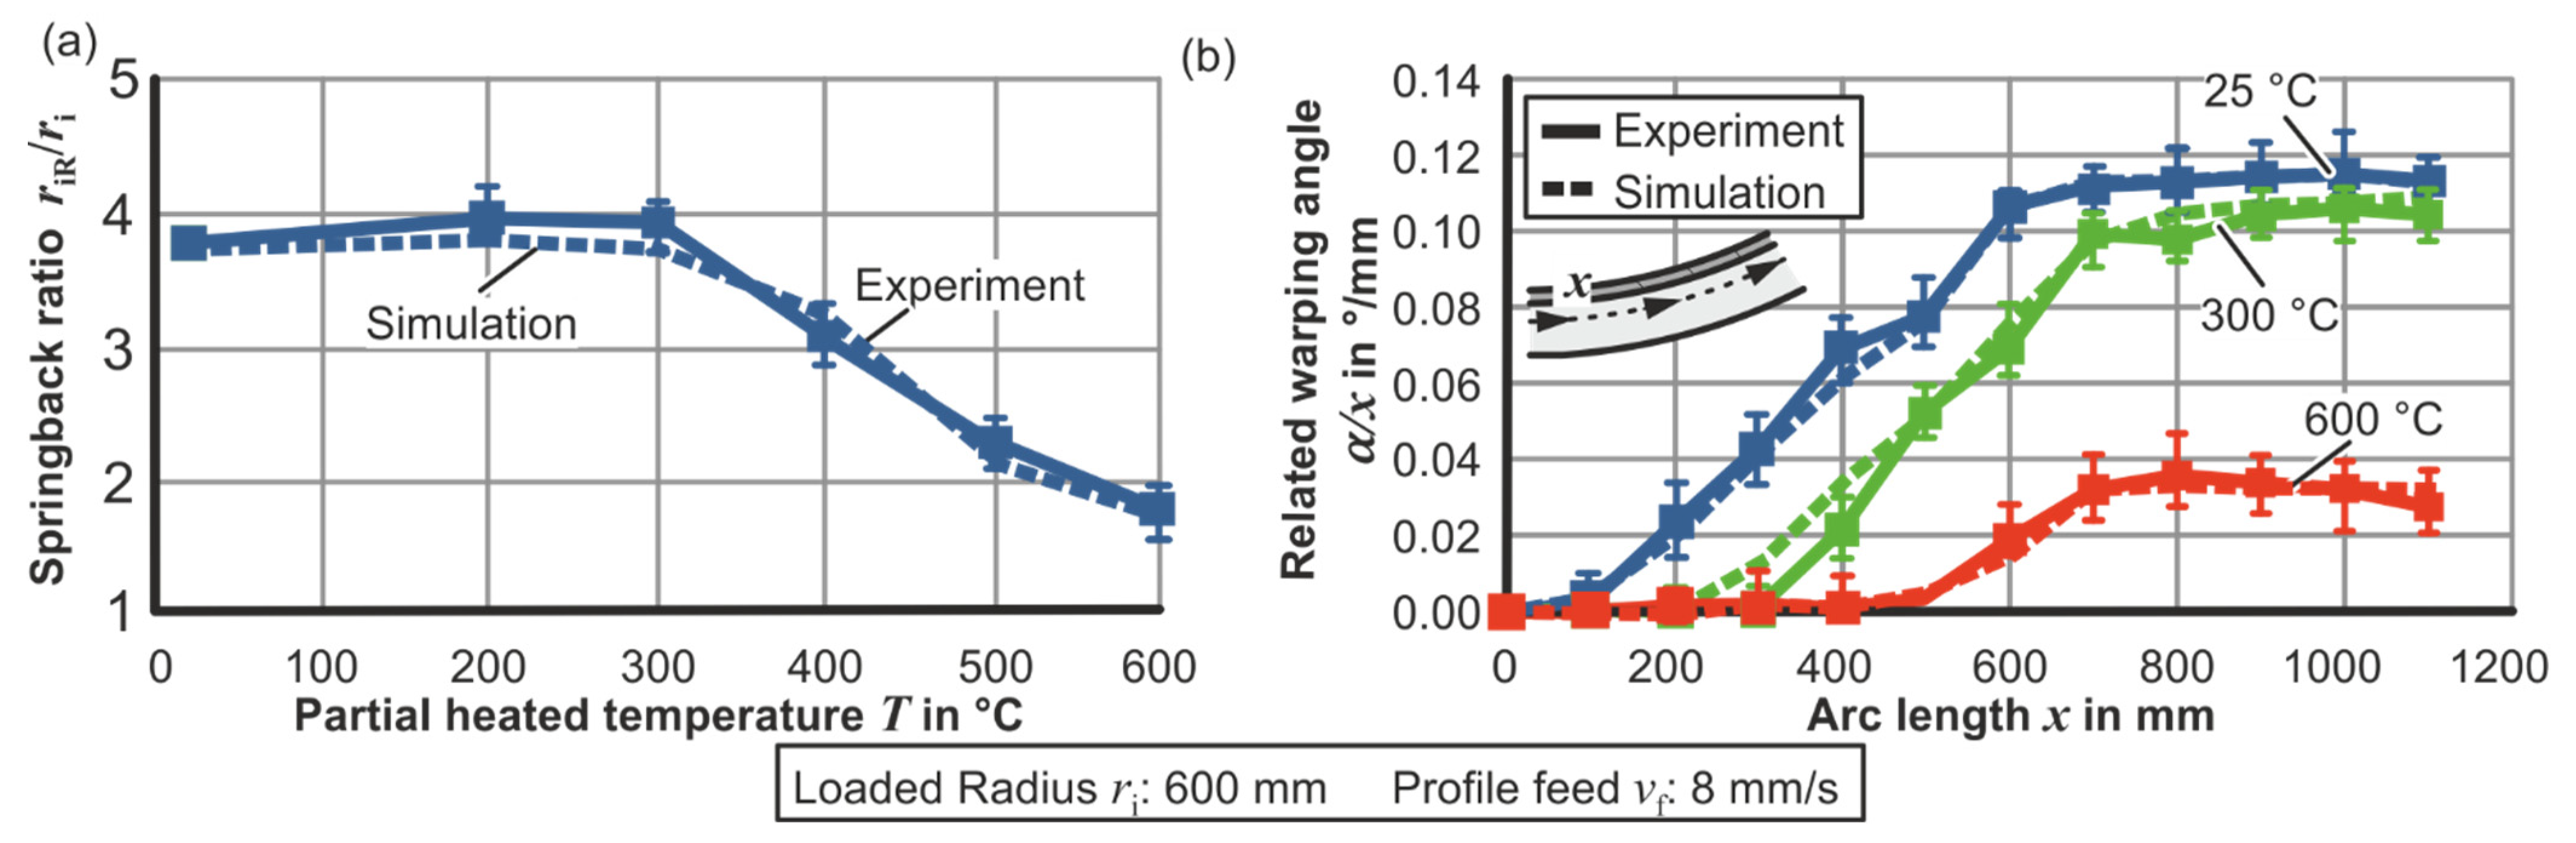
4.3. Analysis of the Bending Load and Profile Warping in the Kinematic Push Bending Phase

The longitudinal stresses σx in the profile cross-section are displayed to examine the influence of the stress-free fiber position on the profile warping and to investigate the accuracy of the analytical model. (Figure 12). While the stress for the room temperature case and the 300 °C cases behave elastic-plastic, the stress for the 600 °C case is fully plastic. Compared to the room temperature case, the maximum stress in the tensile area is reduced by 4% for the 300 °C partial heating temperature and by 52% for 600 °C partial heating. The position of the stress-free fiber ym related to the profile width b is 0.013 for the room temperature case, 0.057 for 300 °C heating temperature, and 0.14 for 600 °C heating temperature. The warping reduction can be traced back to the change in stress free fiber position. The shift of stress-free fiber for 300 °C explains why warping is reduced (Figure 10b), but the bending moment is the same as for the room temperature case (Figure 11a,b). Through partial heating, stresses in the tensile area become lower. As force equilibrium between tensile and compressive area still needs to be fulfilled the stress-free fiber shifts in direction of the room temperature area. Through the flow stress reduction shear stresses also get reduced in the heated area. Consequently, with increasing stress-free fiber position, the torsion moment in the profile is reduced. As the increase in stress free fiber position is higher for 600 °C than for 300 °C, the warping reduction is higher. The mean deviation between experimental and analytical data is 7%. The model can therefore predict the stress curves in the profile cross-section and the shift of the stress-free fiber.
To investigate the accuracy at which the analytical model can predict the bending moment and the profile warping as well as to investigate the warping in the loaded state, bending moment and related warping angle are displayed (Figure 13). Both are evaluated at the start of the plastic zone (x = lp). For the analysis of the related warping angle, the point of zero warping for the 600 °C the curve is shifted to the origin of the diagram to allow an easier comparison with the room temperature and 300 °C cases. The bending moment (Figure 13a) decreases linearly until the position of the bending roll (x = 480 mm) is reached. The bending moment is the highest for room temperature, though the mean difference between room temperature case and 300 °C case is 1%. The bending moments for 300 °C and room temperature cases are the same because they both start plastic deformation at the same threshold bending moment (Figure 11a,b). Compared to the highest bending moment, the highest bending moment for the 600 °C case decreases by 40%. In all cases, the analytical moment overestimates the numerical bending moment with a mean deviation of 7%. The reason for the deviation could be the neglected influence of the normal stresses (assumption 5) or a cumulative effect of the error margins resulting from both numerical and analytical analysis compared to the experimental data. The related warping angles (Figure 13b) are only evaluated at the positions between counter roll and bending roll as the analytical model is only applicable for the loaded state. Thus, the data displayed here are not directly comparable to the unloaded warping angle (Figure 10b). The related warping angles increase approximately linearly as they result from the equation for torsion moment (Equation (10)). The torsion moment behaves linearly over the x -axis. The maximum related warping angle of the 300 °C case is decreased by 13% and the maximum related warping angle for the 600 °C case is decreased by 53% compared to the room temperature case. This is analogical to the unloaded state. The analytical model can predict the numerical data with a mean deviation of 10%. It is thus possible for the analytical model to predict the warping and bending moment. The analytical model can now be used for process development and to generalize the results of this study for other profile geometries and materials.

5. Conclusions

To reduce warping and springback in the bending of profiles with asymmetric geometry in the force application axis, partial heating of the cross-section can be used. It has been shown that partial heating of the cross section leads to a springback reduction of at least 44% and a warping reduction of 76% compared to the room temperature case. The warping and springback reduction can be attributed to a shift in the stress-free fiber position. Partial heating reduces the flow stress in the heated area. Through the flow stress reduction, a shift in stress-free fiber to the compressive zone is noticeable, reducing the stresses in the cross section. To achieve reduced springback and warping, a threshold temperature of 300 °C must be reached.
Additionally, an analytical model has been developed which is able to predict warping with 90% and bending moment with 93% accuracy in a kinematic push-bending process. This model can be used for process design and control.

Author Contributions

Conceptualization, R.M. and A.E.T.; methodology, E.H.; formal analysis, E.H.; investigation, E.H.; resources, A.E.T.; writing-original draft preparation, E.H.; writing-review and editing, R.M. and A.E.T.; visualization E.H.; supervision, R.M. and A.E.T.; project administration, E.H. and R.M.; funding acquisition, A.E.T. All authors have read and agreed to the published version of the manuscript.

Funding

The authors would like to thank the German Research Foundation DFG for the support of the depicted research through project no. 408302329. The financial support is greatly acknowledged.

Institutional Review Board Statement

Not applicable.

Informed Consent Statement

Not applicable.

Data Availability Statement

Data sharing is not applicable to this article.

Acknowledgments

The authors thank the German Research Foundation (DFG) for the financial support of project 408302329 “Kinematic profile bending with locally heated cross-section” (German: Kinematisches Profilbiegen mit partieller Erwärmung des Querschnitts). The authors would also like to thank Till Clausmeyer for his helpful comments on the manuscript. His help is greatly appreciated.

Conflicts of Interest

The authors declare no conflict of Interests.

Appendix A

The parameters for flow curves are fitted through the least square method using the experimental data (Table A1).
Table A1. Flow curve extrapolation parameters.
Temperature C 1 C 2 C 3 C 4 C 5 C 6 C 7 C 8 ε ¯ ˙ p l , 0
25 °C56244528000000.0003
300 °C541440370.680.09000.0003
400 °C4703934410130.11780.550.0003
500 °C325285657.350.28.400.0003
600 °C17716036712.980.204.80.0003

Appendix B

To validate the analytical assumption regarding constant temperature in heated area and area at room temperature in the kinematic push-bending phase, the temperature fields in the simulation and experiment are evaluated (Figure A1). The thermographic measurements were carried out using a VarioCam HD produced by InfraTec, Dresden, Germany. For both the numerical and experimental temperature distribution the temperature near, the area at room temperature cools down to up to 400 °C. As the forming zone is at the beginning of the heated zone, the difference of temperature distribution between numerical and analytical results is negligible.
Figure A1. Temperature distribution in the kinematic push-bending phase for 600 °C heating temperature and 8 mm/s feed velocity. (a) simulated temperature distribution, (b) thermographic measurement.
Metals 11 01146 g0a1

Appendix C

For the validation of the neglected elastic and thermal strains in the plastic region for the analytical model, the elastic and total strain resulting from the numerical simulation are evaluated (Figure A2). For room temperature, the error resulting from neglecting the elastic strains is 6%. From 200 °C, each increase of 100 °C increases this error by approximately 1% as thermal strain increases. The maximum error from excluding thermal and elastic strains occurs at 600 °C partial heating temperature. The resulting error for the strains is 10%.
Figure A2. Difference between plastic strain and total strain. (a) evaluated position, (b) total strain and plastic strain evaluated through FE simulation for different partial heating temperatures.
Metals 11 01146 g0a2

Appendix D

The slope of a curve f (x) at a position x is defined using the relations
m = d f ( x ) d x .
As the slope of f (x) can be dependent on the position x a mean value of the slope can be calculated with
m ¯ = x m d x Δ x .
Plastic strain and strain rates are dependent on the y -axis position in the cross-section. Consequently, to calculate a mean slope of the flow curve, a mean value over strains and strain rates is necessary to approximate the hardening behavior. Using Equations (A1) and (A2), the mean slope of the flow curve over the strain rate E p , r ( ε ¯ pl , T ) can be calculated to:
E p , r ( ε ¯ pl , T ) = ε ¯ ˙ pl d d ε ¯ ˙ pl k f ( ε ¯ pl , ε ¯ ˙ pl , T ) d ε ¯ ˙ pl Δ ε ¯ ˙ pl .
Using Equation (A3), the mean slope of the flow curve over strain and strain rate is
E p ( T ) = ε ¯ pl ( d d ε ¯ pl E p , r ( ε ¯ pl , T ) ) d ε ¯ pl Δ ε ¯ pl .
With the mean slope of the flow curve, the relation between shear stresses and shear strain rate can be approximated.

Appendix E

The integral for the torsion moment MT for the profile geometry reads
M T = ( b 2 z 0 t ) b 2 + z 0 b 2 y 0 t b 2 y 0 τ yz , RT t   d y d z + ( b 2 z 0 ) ( b 2 z 0 t ) ( b 2 + y 0 ) b 2 y 0 τ yz , h t   d y d z
where z 0 and y 0 are the correspondent coordinate distances to the profile center to the center of gravity, τ yz , RT is the shear stress in the room temperature area, and τ yz , h is the shear stress at the heated area. Evaluation of Equation (9) yields
τ y z , RT = Q ( b b 2 t + ( b t ) t 2 2 ( b t + ( b t ) t ) z ) ( b 2 t + ( b t ) t 2 2 ( b t + ( b t ) t ) t 2 ) t b 3 3 + ( b t ) t 3 3 ( b 2 t + ( b t ) t 2 ) 2 4 ( b t + ( b t ) t )
τ yz , h = Q ( b b 2 t + ( b t ) t 2 2 ( b t + ( b t ) t ) + y ) ( y t 2 ) t b 3 3 + ( b t ) t 3 3 ( b 2 t + ( b t ) t 2 ) 2 4 ( b t + ( b t ) t ) .
for the corresponding profile geometry. Solving the torsion moment (Equation (A5)) using both shear stress from force equilibrium MT,e (Equation (A6)) and shear stress from strains MT,s (Equation (10)), the warping angle α can be calculated numerically using the relation
M T , e = M T , s .

Appendix F

The bending moment MB,pp for RT and 300 °C is given by
M B , pp = ( b 2 z 0 t ) b 2 + z 0 b 2 y 0 t b 2 y 0 σ B , pl ( T = R T ) y d y d z          + ( b 2 z 0 ) ( b 2 z 0 t ) y pl , u b 2 y 0 σ B , pl ( T = T 1 ) y d y d z          + ( b 2 z 0 ) ( b 2 z 0 t ) y m y pl , u σ B , el ( T = T 1 ) y d y d z          ( b 2 z 0 ) ( b 2 z 0 t ) y pl , l y m σ B , el ( T = T 1 ) y d y d z          ( b 2 z 0 ) ( b 2 z 0 t ) ( b 2 + y 0 ) y pl , l σ B , pl ( T = T 1 ) y d y d z ,
with elastic bending stress σB,el, plastic bending stress σB,pl, the upper plasticization fiber position ypl,u, and the lower plastification fiber position ypl,l assuming partial cross-sectional plasticity. For the 600 °C case with full plastification, the integral is expressed as
M B , fp = ( b 2 z 0 t ) b 2 + z 0 b 2 y 0 t b 2 y 0 σ B , pl ( T = R T ) y d y d z          + ( b 2 z 0 ) ( b 2 z 0 t ) y m b 2 y 0 σ B , pl ( T = T 1 ) y d y d z          ( b 2 z 0 ) ( b 2 z 0 t ) ( b 2 + y 0 ) y m σ B , pl ( T = T 1 ) y d y d z .
Using the first degree Taylor approximation on the integrals, the bending moment can be solved.

References

  1. Singh, D.K. Strength of Materials; Springer International Publishing: New York, NY, USA, 2021; ISBN 978-3-030-59666-8. [Google Scholar]
  2. Seely, F.B.; Putnam, W.J.; Schwalbe, W.L. The Torsional Effect of Transverse Bending Loads on Channel Beams. In University of Illionois Bulletin 211; University of Illinois: Champaign, IL, USA, 1930. [Google Scholar]
  3. Vollertsen, F.; Sprenger, A.; Kraus, J.; Arnet, H. Extrusion, channel, and profile bending: A review. J. Mater. Process. Technol. 1999, 87, 1–27. [Google Scholar] [CrossRef]
  4. Chatti, S.; Hermes, M.; Tekkaya, A.E.; Kleiner, M. The new TSS bending process: 3D bending of profiles with arbitrary cross-sections. CIRP Ann. 2010, 59, 315–318. [Google Scholar] [CrossRef] [Green Version]
  5. Chatti, S. Optimierung der Fertigungsgenauigkeit beim Profilbiegen. Ph.D. Thesis, Universität Dortmund, Dortmund, Germany, 1998. [Google Scholar]
  6. Kreye, B. Verfahren und Vorrichtung zum Biegen von hohlen Metallprofilen, insbesondere Rahmenprofilen für Fenster und Türen. Patent EP0115840, 15 August 1984. [Google Scholar]
  7. Li, P.; Wang, L.; Li, M. Flexible-bending of profiles with asymmetric cross-section and elimination of side bending defect. Int. J. Adv. Manuf. Technol. 2016, 87, 2853–2859. [Google Scholar] [CrossRef]
  8. Wang, A.; Xue, H.; Bayraktar, E.; Yang, Y.; Saud, S.; Chen, P. Analysis and control of twist defects of aluminum profiles with large z-section in roll bending process. Metals 2020, 10, 31. [Google Scholar] [CrossRef] [Green Version]
  9. Jahn, E. Herstellung von Rohrbögen nach dem Induktivbiegeverfahren. Tech. Uberwach. 1976, 17, 221–227. [Google Scholar]
  10. Park, J.C.; Seong, D.Y.; Yang, D.Y.; Cha, M.H. Development of an innovative bending process employing synchronous incremental heating and incremental forming. In Proceedings of the 10th International Conference on Technology of Plasticity, ICTP 2011, Aachen, Germany, 25–30 September 2011; pp. 325–330. [Google Scholar]
  11. Behne, T. A New Bending Technique for Large-Diameter Pipe. Iron Age Metalwork. Int. IAMI 1983, 22, 34–36. [Google Scholar]
  12. Yanagimoto, J.; Oyamada, K. Mechanism of springback-free bending of high-strength steel sheets under warm forming conditions. CIRP Ann. Manuf. Technol. 2007, 56, 265–268. [Google Scholar] [CrossRef]
  13. Avent, R.R. Guide for Heat-Straightening of Damaged Steel Bridge Members; Federal Highway Administration: Washington, DC, USA, 2008. [Google Scholar]
  14. Rothman, R.L. Flame Straightening Quenched-and-Tempered Steels in Ship Construction; Technical Report for US Ship Structure Comitee: Columbus, OH, USA, November 1975. [Google Scholar]
  15. Kraus, J. Laserstrahlumformen von Profilen. Ph.D. Thesis, Friedrich-Alexander-Universität Erlangen-Nürnberg, Erlangen, Germany, 1997. [Google Scholar]
  16. Li, W.; Yao, Y.L. Laser bending of tubes: Mechanism, analysis, and prediction. J. Manuf. Sci. Eng. Trans. ASME 2001, 123, 674–681. [Google Scholar] [CrossRef]
  17. Raither, W.; Bergamini, A.; Ermanni, P. Profile beams with adaptive bending–twist coupling by adjustable shear centre location. J. Intell. Mater. Syst. Struct. 2013, 24, 334–346. [Google Scholar] [CrossRef]
  18. Ludwik, P. Technologische Studie über Blechbiegung—Ein Beitrag zur Mechanik der Formänderungen. Tech. Blätter 1903, 35, 133–159. [Google Scholar]
  19. Haupt, P. Continuum Mechanics and Theory of Materials; Springer: Berlin, Germany, 2002; ISBN 978-3-642-07718-0. [Google Scholar]
  20. Wolter, K. Freies Biegen von Blechen; Dt. Ingenieur-Verl: Düsseldorf, Germany, 1952. [Google Scholar]
  21. Timoshenko, S.P.; Gere, J.M. Theory of Elastic Stability; McGraw-Hill: New York, NY, USA, 1961. [Google Scholar]
Figure 1. Countermeasures to reduce warping in profile bending profiles for the example of a U-profile. (a) profile cross-section with the shear center as cause for warping, (b) countermeasure: moving the position of force application by altering the profile geometry. (c) countermeasure: use of supporting elements.
Metals 11 01146 g001
Figure 2. Process concept for (a) prebending phase, (b) kinematic push-bending phase, and (c) unloading phase.
Metals 11 01146 g002
Figure 3. Experimental setup, (a) frontal view, (b) top view between the rolls.
Metals 11 01146 g003
Figure 4. (a) Resulting flow stress kf to bend a profile to the desired radius rm, (b) necessary bending moment to reach the desired radius and actual profile bending moment for room temperature (Mb (TRT)) and partial heated case (Mb (Th)).
Metals 11 01146 g004
Figure 5. Simulation set-up with geometrical- and material parameters.
Metals 11 01146 g005
Figure 6. Mechanical model for analytical calculation. (a) length direction, (b) corresponding cross-sectional cut A-A.
Metals 11 01146 g006
Figure 7. (a) profile cross-section of the partially heated profile, (b) longitudinal stress and strain progression for ideal plastic and linear elastic material behavior and partially plastic behavior over the cross section.
Metals 11 01146 g007
Figure 8. Relation between cross-sectional forces and stress-free fiber. (a) Room-temperature case, (b) partially heated case, (c) Relation between force and stress-free fiber.
Metals 11 01146 g008
Figure 9. (a) Profile specimens and corresponding cross-sections for a 600 mm loaded bending radius (change of moment arm through the heating area is neglected) and profile feed of 8 mm/s for different temperatures in the sprung back state. (b) springback ratio for varying partial heating temperatures and profile feed velocities.
Metals 11 01146 g009
Figure 10. Comparison of springback (a) and related warping angle (b) between experiments and Simulation for 8 mm/s feed and loaded radius of 600 mm.
Metals 11 01146 g010
Figure 11. Bending moments and plastic threshold bending moments for room temperature (a), 300 °C partial heating temperature (b) and 600 °C partial heating temperature (c) case resulting from mechanical equilibrium and flow stress for the loaded radius.
Metals 11 01146 g011
Figure 12. Comparison of numerical and analytical results for longitudinal stress over the profile y-axis at the onset of plastic deformation for the loaded radius of 600 mm and profile feed of 8 mm/s for different partial heating temperatures.
Metals 11 01146 g012
Figure 13. Analytical and numerical bending moment (a) and related waring angle (b) for the continuous push-bending phase at room temperature, 300 °C and 600 °C for a loaded radius of 600 mm and profile feed of 8 mm/s as a function of profile arc length.
Metals 11 01146 g013
Table 1. Nomenclature.
b Profile width[mm]
C i Material constant/
d rl Lower roll diameter[mm]
d ru Upper roll diameter[mm]
E Young’s modulus[GPa]
E p Mean slope of the flow curve[MPa]
F Force[N]
I z Second moment of area[mm4]
l bend Distance to bending roll[mm]
l cool Distance to cooling zone[mm]
l heat Distance to heating area[mm]
l p Distance to onset of plasticity[mm]
M b Bending moment[Nm]
M T Torsion moment[Nm]
Q Cross sectional force[N]
R m Tensile strength[MPa]
R p 0 , 2 Yield strength[MPa]
S First area of moment[mm3]
r m Bending radius[mm]
r mC Bending radius at profile center fiber[mm]
r i Bending radius at profile inner fiber[mm]
r iR Unloaded radius at profile inner fiber[mm]
t Profile thickness[mm]
T Temperature[°C]
T heat Heating temperature[°C]
T RT Room temperature[°C]
k f Flow stress[MPa]
v f Feed velocity[mm/s]
x , y , z Coordinate axis[mm]
x 0 ,   y 0 Distance from cross-section center to center of gravity [mm]
y f Strain free fiber position[mm]
y m Stress free fiber position[mm]
y pl Fiber position of plasticity onset[mm]
α Warping angle[°]
a T Coefficient of thermal expansion[1/K]
ε el Elastic strain/
ε pl Plastic strain/
ε ¯ pl Plastic equivalent strain/
ε ¯ ˙ pl Plastic equivalent strain rate[1/s]
ε ¯ ˙ pl , 0 Initial plastic equivalent strain rate[1/s]
θ Bending angle[°]
ν Poisson ration/
σ Normal stress[MPa]
σ B Bending stress[MPa]
τ Shear stress[MPa]
Table 2. Mechanical properties and chemical composition of steel S500MC in delivery condition according to EN 10140-2.
Yield   Strength   R p 0 , 2   in   MPa Tensile   Strength   R m   in   MPa Chemical Composition in wt%
CSiMnPSAlNbTiV
5856420.0450.020.8120.0130.0070.0320.0130.0010.137
Publisher’s Note: MDPI stays neutral with regard to jurisdictional claims in published maps and institutional affiliations.

