Article

Quantification of Solid Solution Strengthening and Internal Stresses through Creep Testing of Ni-Containing Single Crystals at 980 °C

Metals and Alloys Department, University of Bayreuth, 95447 Bayreuth, Germany
*
Author to whom correspondence should be addressed.
Metals 2021, 11(7), 1130; https://doi.org/10.3390/met11071130
Submission received: 31 May 2021 / Revised: 7 July 2021 / Accepted: 13 July 2021 / Published: 16 July 2021
(This article belongs to the Special Issue Advances in Superalloys and High Temperature Intermetallics)

Abstract

:
Various alloy compositions were cast as single crystals in a Bridgman vacuum induction furnace and creep tested at 980 °C: pure Ni, the equiatomic alloys CoCrNi and CrMnFeCoNi (Cantor alloy), single-phase fcc (Ni) solid solution alloys (with the composition of the matrix-phase of CMSX-3 and CMSX-4), and two-phase Ni-based superalloys CMSX-3 and CMSX-4. Due to the single-crystal state, grain size effects, grain boundary sliding, and grain boundary diffusion can be excluded. The results identify two major strengthening mechanisms: solid solution strengthening and other mechanisms summarized as precipitation hardening. Configurational entropy does not increase creep strength: The Cantor alloy, with the highest configurational entropy of all alloys tested, shows a weak and similar creep strength at 980 °C in comparison to pure Ni with zero configurational entropy. The element Re is a very effective strengthener, both in single-phase fcc (Ni) solid solution alloys as well as in two-phase superalloys. Quantitative estimations of different strengthening mechanisms: internal back stress, misfit stresses, Orowan bowing, and γ′-phase cutting (in the case of two-phase superalloys) are presented. Finite element simulations allow estimating the influence of solid solution strengthening of the matrix on the creep behavior of the two-phase superalloys.

1. Introduction

Single crystal Ni-based superalloys used as blade material in the hottest section of stationary gas turbines and aero-engines must withstand high static and dynamic stresses at high temperatures in an oxidizing atmosphere. To increase engine efficiency, the turbine entry temperature is raised steadily, leading to ever higher material temperatures (above 1000 °C) and higher mechanical loads (several 100 MPa in tension) [1]. Due to the single-crystal state and 〈001〉 orientation of the blade, these materials feature outstanding creep resistance and low elastic modulus, the latter reducing thermal fatigue stresses [1]. To further improve the creep properties of these alloys, many investigations have concentrated on the optimization of microstructure, leading to cuboidal L12-ordered γ′ precipitates coherently embedded in a face-centered cubic γ-matrix [2]. Others have focused on the improvement of the matrix strength by alloying solid solution strengthening elements such as tungsten (W), molybdenum (Mo), rhenium (Re) [3], and ruthenium (Ru) [4]. The following subchapters will discuss different contributions to the stress state present in Ni-based superalloys during external creep load.

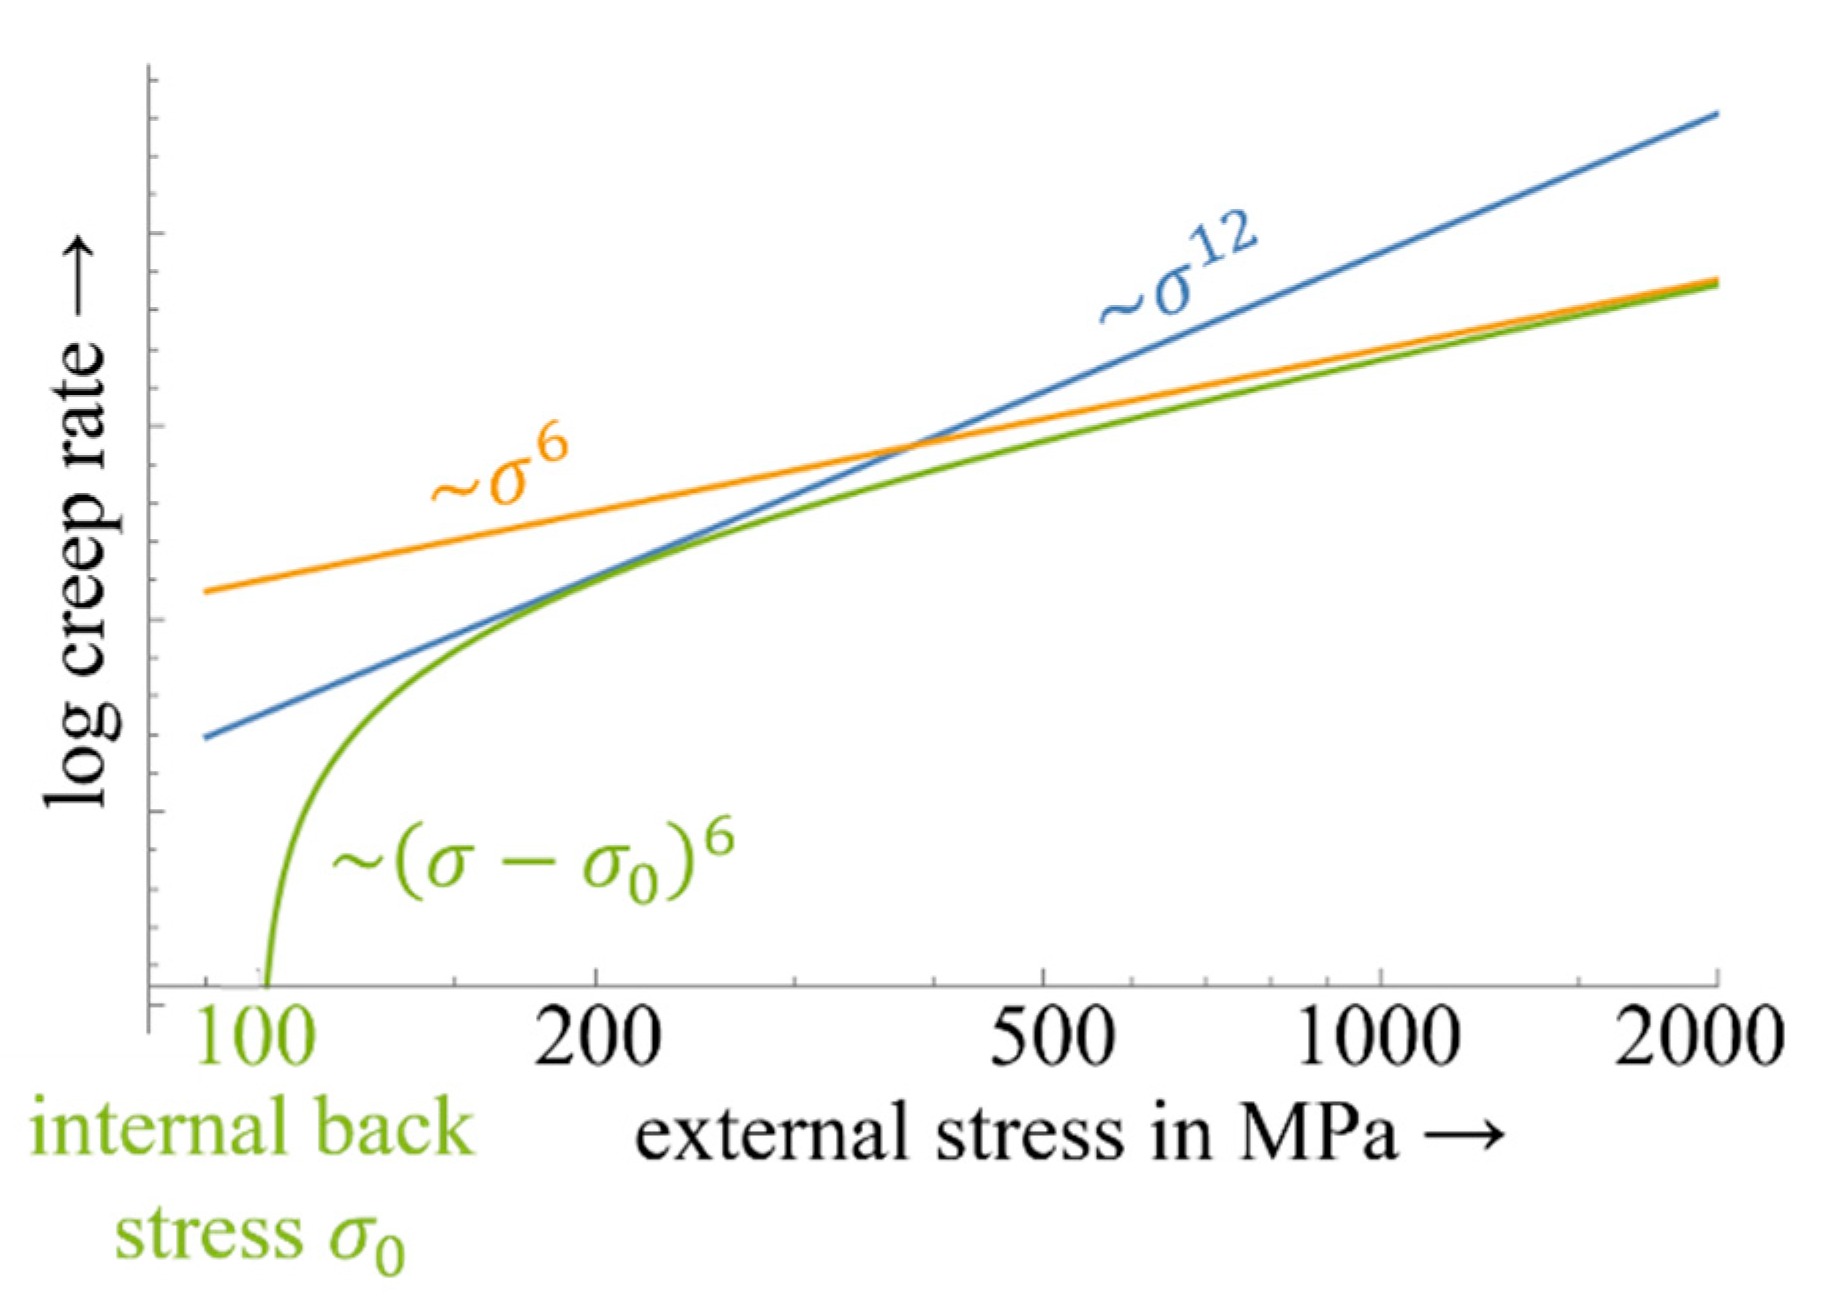
1.1. Internal Back Stress

To generally describe the time-dependent plastic deformation at a constantly applied stress σ in the steady-state regime of creep deformation, the Norton creep law:
ε ˙ = ε 0 ˙ · σ n ,
with the material parameters ε 0 ˙ and n can be used. A variety of theories describing creep can be found in the literature. If the dislocation climb is rate-controlling, a stress exponent in the range of 3 to 7 is anticipated [5,6,7,8,9]. A stress exponent n = 3 is generally called “natural creep law” [6].
Especially in multiphase alloys, stress exponents n > 10 may be observed as, for example, in oxide dispersion strengthened (ODS) alloys [7]. Such high values of n can be explained by considering an internal back stress σ 0 that obstacles may exert on dislocation movement, reducing the applied stress σ [8,9]:
ε ˙ = ε 0 ˙ · ( σ σ 0 ) n .
When the applied stress σ is in the range of the internal back stress σ 0 , the experimentally observed stress exponent may be found to be much higher (n > 10). This is emphasized schematically in Figure 1. The green curve shows the creep rate over the external stress after Equation (2) assuming n = 6 and σ 0 = 100 MPa. By application of Equation (1), for a stress range of about 180–300 MPa, an apparent stress exponent of 12 will be measured (blue curve).
The center σ with respect to logarithmic scale is calculated by:
σ = n 1 n 1 n 2 σ 0 ,
with n 1 the measured high-stress exponent if the applied stress is above the internal back stress and n 2 the measured low-stress exponent at very high applied stress levels. At stresses slightly higher than the internal back stress σ 0 , the strain rate would drop down to zero. This will not happen since the internal back stress is not a fixed value but can locally vary to a large extent, leading to an always non-zero strain rate.
In multi-phase alloys, hard particles can act as dislocation obstacles, leading to high internal back stresses and consequently to high n 1 , especially if the external stress σ is approaching σ 0 . At very high applied stresses, the particles are no longer efficient obstacles, and therefore the stress exponent n 2 approaches the stress exponent of the material without obstacles, i.e., the matrix material.

1.2. Solid Solution Strengthening

At room temperature, the solid solution strengthening of a binary alloy can be estimated by the theory presented by Fleischer with a square root dependence on concentration c [10,11]:
τ c b = f 0 2 / 3 c 1 / 2 ( 2 T ) 1 / 2 .
where τ c is the critical stress on a dislocation to overcome solute atoms acting as obstacles (comparable to the internal back stress σ 0 ), b is the magnitude of the Burgers vector, and f 0 is the maximum interaction force between an obstacle and a dislocation.
In the later derived theory by LaBusch, a c 2 / 3 dependence is postulated [12,13]:
τ c b = f 0 4 / 3 c 2 / 3 ω 1 / 3 ( 4 T ) 1 / 3 C .
with ω as the range of interaction force. For both theories, it is very hard to obtain the material parameters by experiment. Additionally, they describe interactions of dislocations with solute atoms in minor concentrations only, i.e., within the range of a few percent. Therefore, for the alloys tested in this work, we assume a dependence on elemental concentration but also on the difference of the element properties (mainly atomic radius, influence on elastic parameters, and electronegativity). This will be reflected in the quantities f 0 and ω in Equations (4) and (5). Obviously, the element Re takes a very specific role in Ni-based alloys [14,15,16] (see the effects on creep properties for the alloys with and without Re), whereas the differences of Fe, Cr, Mn, and Co in comparison to Ni are less pronounced.
The main difference of solid solution strengthening in comparison to all other strengthening mechanisms is that every dislocation has, at some stage, to move within the continuous matrix to result in a macroscopic plastic deformation. Therefore, an increase in solid solution strengthening of the matrix phase will definitely increase the macroscopic creep strength of two-phase alloys, provided the matrix allows a continuous movement of the dislocation throughout the sample and all other parameters do not change.

1.3. Dislocation Density Induced Internal Back Stress

Annihilation of dislocations at elevated temperatures allows the establishment of a constant dislocation density within the steady-state creep regime (onset is given by the minimum creep rate ε ˙ m i n or by the transition creep rate from primary to secondary stage ε ˙ t ). This dislocation density ρ results in an internal back stress, namely σ disl . [1]:
σ disl . = α · G b ρ ,
with shear modulus G, magnitude of the Burgers vector b, dislocation density ρ , and the constant α, depending on crystallography and activated slip systems, generally between 0.3 and 1. The dislocation density is locally adjusted to fulfill the condition
σ disl . σ local ,
with the local stress state σ local depending on all other stress contributions in this vicinity superimposed by the external stress.

1.4. Misfit Stress

The L12-ordered γ -precipitates in nickel-based superalloys are coherently embedded in the γ -matrix. Both phases are based on an fcc lattice structure with slightly different lattice parameters. This leads to a misfit stress σ misfit [17,18], which can be roughly approximated by:
| σ misfit |     δ   ·   E γ ,
with the Young’s modulus of the matrix E γ and the lattice misfit δ, given by:
δ = 2 ( a γ a γ ) ( a γ + a γ ) .
With a γ , the lattice parameter of the γ -phase and a γ of the matrix. Even for a constant misfit δ, the local misfit stress strongly depends on location: high compression stress state parallel to the phase boundary within the matrix phase and negligible small hydrostatic tension stresses within the γ -phase. The misfit stresses vary on a very small dimension (within 250 nm) from roughly −300 MPa in compression within the matrix channels, up to +30 MPa in tension stresses in the centers of γ particles [17,18].
Additionally, the misfit itself can vary, if segregations lead to different local compositions, which generally occurs for dendrites and interdendritic regions on a very different length scale of ≈0.2 mm [19].

1.5. Orowan Stress

The well-known Orowan stress is described in many textbooks, see for example [1], and can be estimated as
σ Orowan     G · b L
with the shear modulus G, the magnitude of the Burgers vector b, and the separation distance L in between obstacles. The Orowan stress given in Equation (10) is a rough estimate and can be determined more precisely if anisotropic calculations of dislocation stresses are carried out, but even thereby, σ Orowan is only accurate within ± 50 % [20,21].

1.6. Cutting of γ′-Phase

The cutting of a γ -particle occurs when a dislocation traveling in the matrix enters a γ -particle by forming an anti-phase boundary, while continuously moving on the same slip plane. Stresses necessary to cut a γ -particle can be estimated by several means and are mainly dependent on size [1,22]. Either the local stress is initially high enough, or after some plastic strain (generally > 1%) [23], the local stress in the vicinity of the phase boundary increases by the superposition of the above-mentioned internal stresses, and the cutting of coherent and large γ -particles occurs (as it is the case for CMSX-3 and CMSX-4). The first regular matrix dislocation entering the γ -phase creates an anti-phase boundary. This results in a cutting stress of [1,18]
σ cutting = E APB b ,
with E APB the energy necessary for the formation of an anti-phase-boundary and b, the magnitude of the Burgers vector.

1.7. Summary Stress Contributions

The stress fields discussed above all contribute to the creep strength of the alloys by acting as a back stress that must be overcome to allow dislocation movement and thus plastic deformation of the material (see Equation (2)). All stress fields have different spatial extensions with respect to their influence on dislocations. Solid solution strengthening obtained by point defects has very short-range stress fields, with a rapid decay in distance r from the interstitial or substitutional atoms, by r 3 [24].
All other strengthening contributions are wide range stress fields, or in most cases, even constant over some extension (several 100 nm). For example, the dislocation stress within the volume of equal dislocation density, misfit stress, and Orowan stress extend over the width of a matrix channel in nickel-based superalloys with high γ -volume fractions and, finally, cutting stresses over the edge length of a γ -cube. Therefore, the most difficult strengthening contribution to tackle is solid solution strengthening.
To estimate the statistical influence of each of the above-mentioned strengthening mechanisms is demanding:
  • Dislocation density varies depending on the orientation of individual matrix channels with respect to external load direction.
  • The misfit can vary locally from 0 to −4 × 10⁻³ in interdendritic areas as compared to the dendrite center, respectively [19].
  • The distance L between γ -precipitates is distributed between 10 and 150 nm, resulting in a change of the Orowan stress within a factor of 15. Additionally, coarsening occurs during long-time creep, resulting in an increase of L.
  • The stresses can convert into each other, e.g., misfit-induced stress can turn into dislocation-induced stress.
A mobile dislocation will always travel into volumes with minimal local back stress. In some cases, the local stress can result in an attractive force on the dislocation, which results in the pinning of the dislocation in a certain volume.
In order to separate major influences of the strengthening contributions, we designed the following experiments. To highlight the potentials of the two different strengthening mechanisms, solid solution strengthening and precipitation hardening, it is crucial to compare them in a systematic manner. In this work, we experimentally determined creep strength of seven different alloys at considerably different applied stresses, ranging from 5 to 300 MPa at 980 °C. Stresses were chosen in such a manner that a strain rate in the range of 10−7 s−1 was reached, leading to lifetimes of ≈12 days for 10% strain. This allows enough time for diffusional processes to take place, being similar for all alloys.
The examined single-crystalline materials are technical pure Ni, Cantor alloy (equiatomic mixture with 20 at.% each of CrMnFeCoNi), another equiatomic three-component alloy (CrCo Ni with 33 at.% each), two single-phase fcc (Ni) alloys, corresponding to the compositions of the matrix phases of CMSX-3 and CMSX-4, and the respective two-phase Ni-based superalloys (CMSX-3 and CMSX-4).
The creep experiments were designed not only to compare the stress necessary to achieve a certain creep rate but also to directly quantify the gain of the different strengthening mechanisms. To the best of our knowledge, there is no comparable research reported in the open literature.

2. Materials and Methods

2.1. Material

All samples were cast, heat-treated (if applicable), and creep-tested with equipment of the group of metals and alloys at the University of Bayreuth, Germany. To quantify the different strengthening mechanisms, seven alloys were cast as single crystals in a Bridgman vacuum induction furnace [25]. Single crystals were used in order to precisely compare the material behavior not disturbed by grain size or morphology or grain boundary mechanisms like sliding or diffusion.
Table 1 lists the composition of the alloys cast and creep tested in at.%. The Ni-content varies from 20 to 100 at.%. For all alloys, µ-XRF measurements were carried out. For all elements, the deviation of measured to nominal composition was <1 at.%. Table 2 lists the occurring phases as well as the configurational entropies S c o n f i g calculated via
S c o n f i g = R i = 1 N C i · ln C i
with R being the molar gas constant. Table 3 lists the respective heat treatments of the samples that were carried out.
The alloys can be divided into four groups:
(A)
Pure Ni (single-phase fcc) with 99.9 at.% technical purity and configurational entropy equal to zero. No heat treatment was carried out. Solid solution strengthening can be excluded. For the sake of readability, this sample composition will also be referred to as an “alloy”, knowing that this might not be a precise denomination.
(B)
Equiatomic alloys with single-phase fcc microstructure: CrCoNi with 33.3 at.% for each element and the so-called Cantor alloy (CrMnFeCoNi with 20 at.% each) [26]. These two compositions exemplify a configurational entropy S config of 1.10·R (generally called medium entropy alloy) and 1.61·R (high entropy alloy). No heat treatment was carried out on CrCoNi and Cantor alloy. Due to the evaporation of Mn during the SX casting procedure, the Mn content was adjusted before casting to obtain 20 ± 1 at.% in the cast single-crystal sample.
(C)
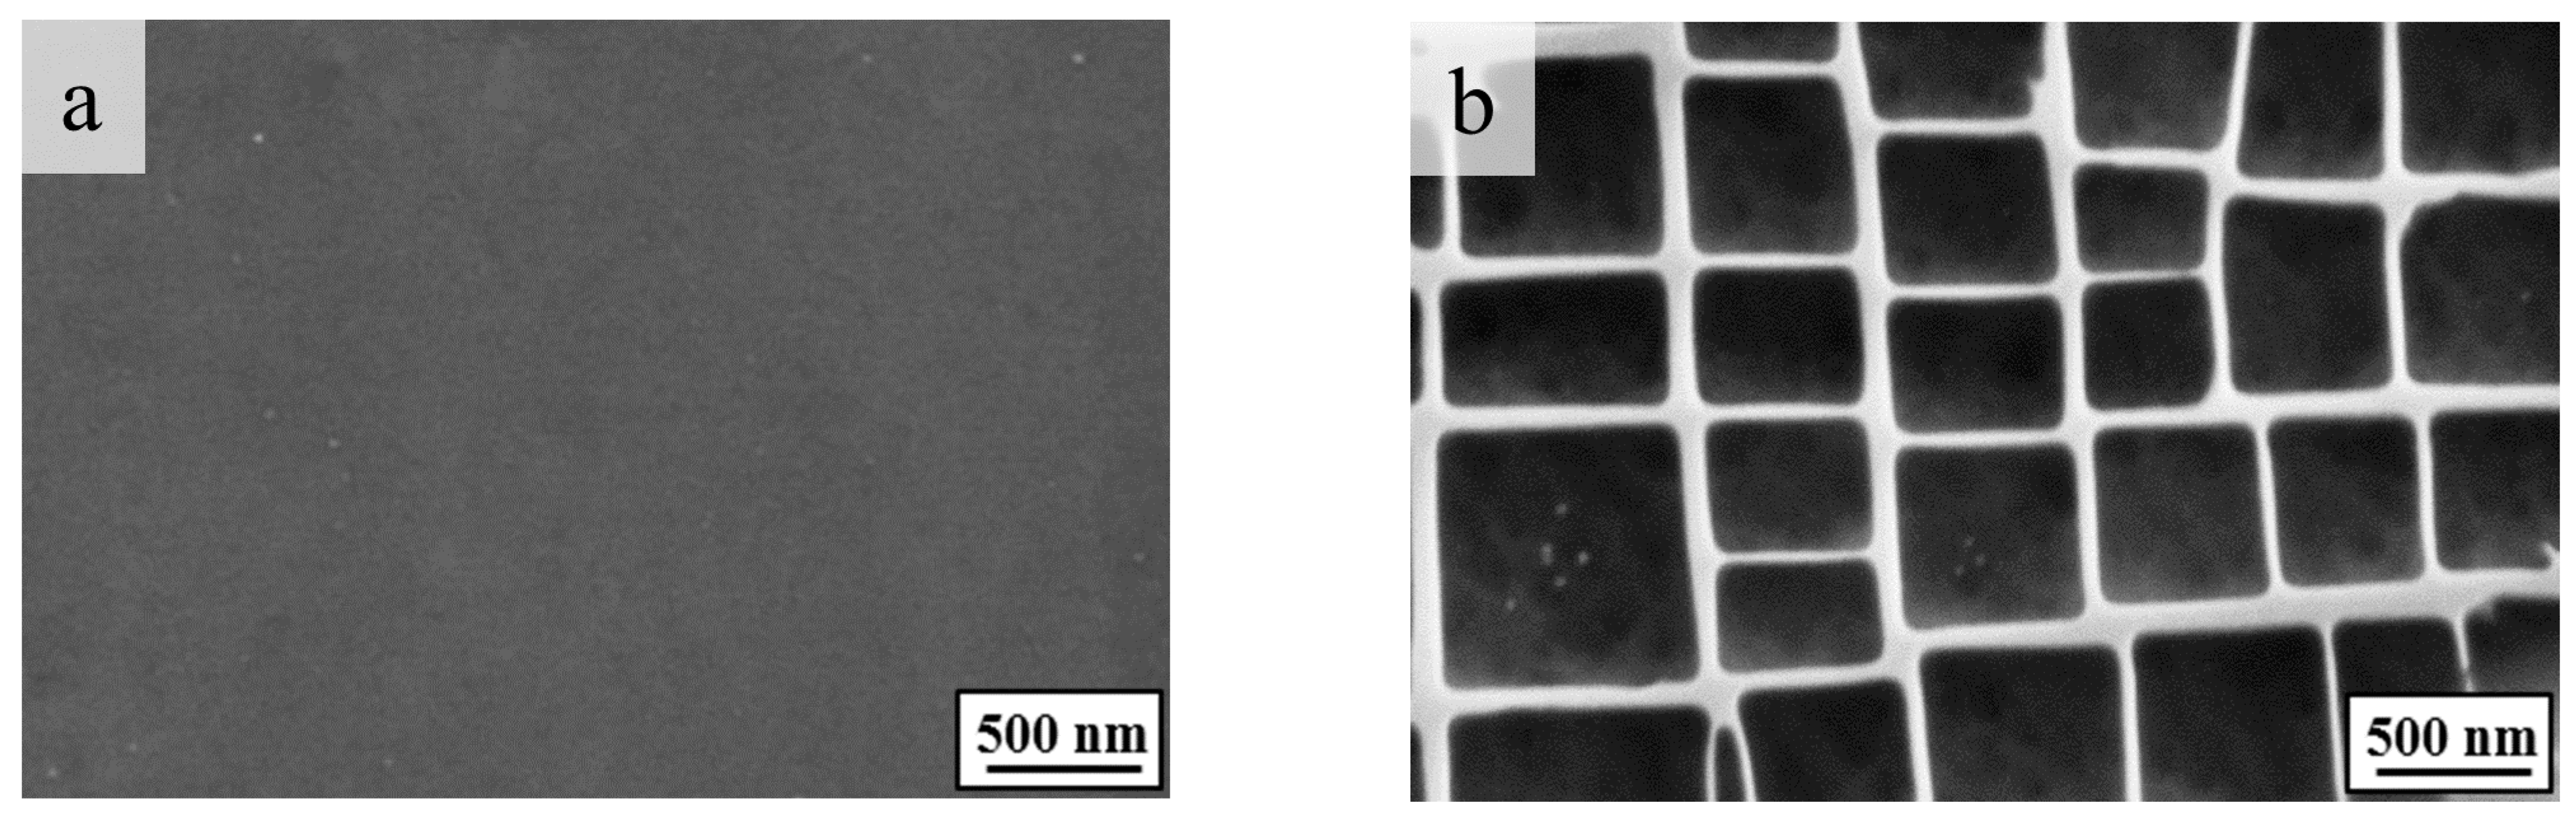
Single-phase solid solution strengthened Ni-based alloys with fcc structure. The two alloys of this group have the composition of the matrix of the two alloys of Group (D). The compositions of the matrix phases were calculated with Thermo-Calc Software and database TTNi7 at 800 °C [27] and compared with experimentally determined matrix composition. A temperature of 800 °C was used to ensure the single-phase state at 980 °C. No precipitates were observed in these alloys; hence, they remain single-phase, see, for example, Figure 2a. Homogenization treatment was performed at 1290 °C for 48 h, see Table 3. The two alloys within this group have similar compositions, except for the element Re. Thereby, the contribution of solid solution strengthening of Re can be quantitatively determined. It should be noted that 3.1 atomic% of Re converts into 9.0 weight%.
(D)
The commercially available two-phase Ni-based superalloys CMSX-3 (no Re, 1st generation) and CMSX-4 (1.0 at.% (3 wt.%) Re, 2nd generation) [28]. The exceptionally good mechanical properties of Ni-based superalloys at high temperatures are mainly due to the two-phase matrix/ γ -microstructure (Figure 2b). A specific heat treatment, see Table 3, was used after single-crystal casting in order to obtain such a microstructure, resulting in an average edge length of the cuboidal γ -particles of 410 ± 30 nm (CMSX-3) and 470 ± 50 nm (CMSX-4). The γ -volume fraction for the alloys is about 60% for CMSX-3 and about 70% for CMSX-4 at 980 °C.

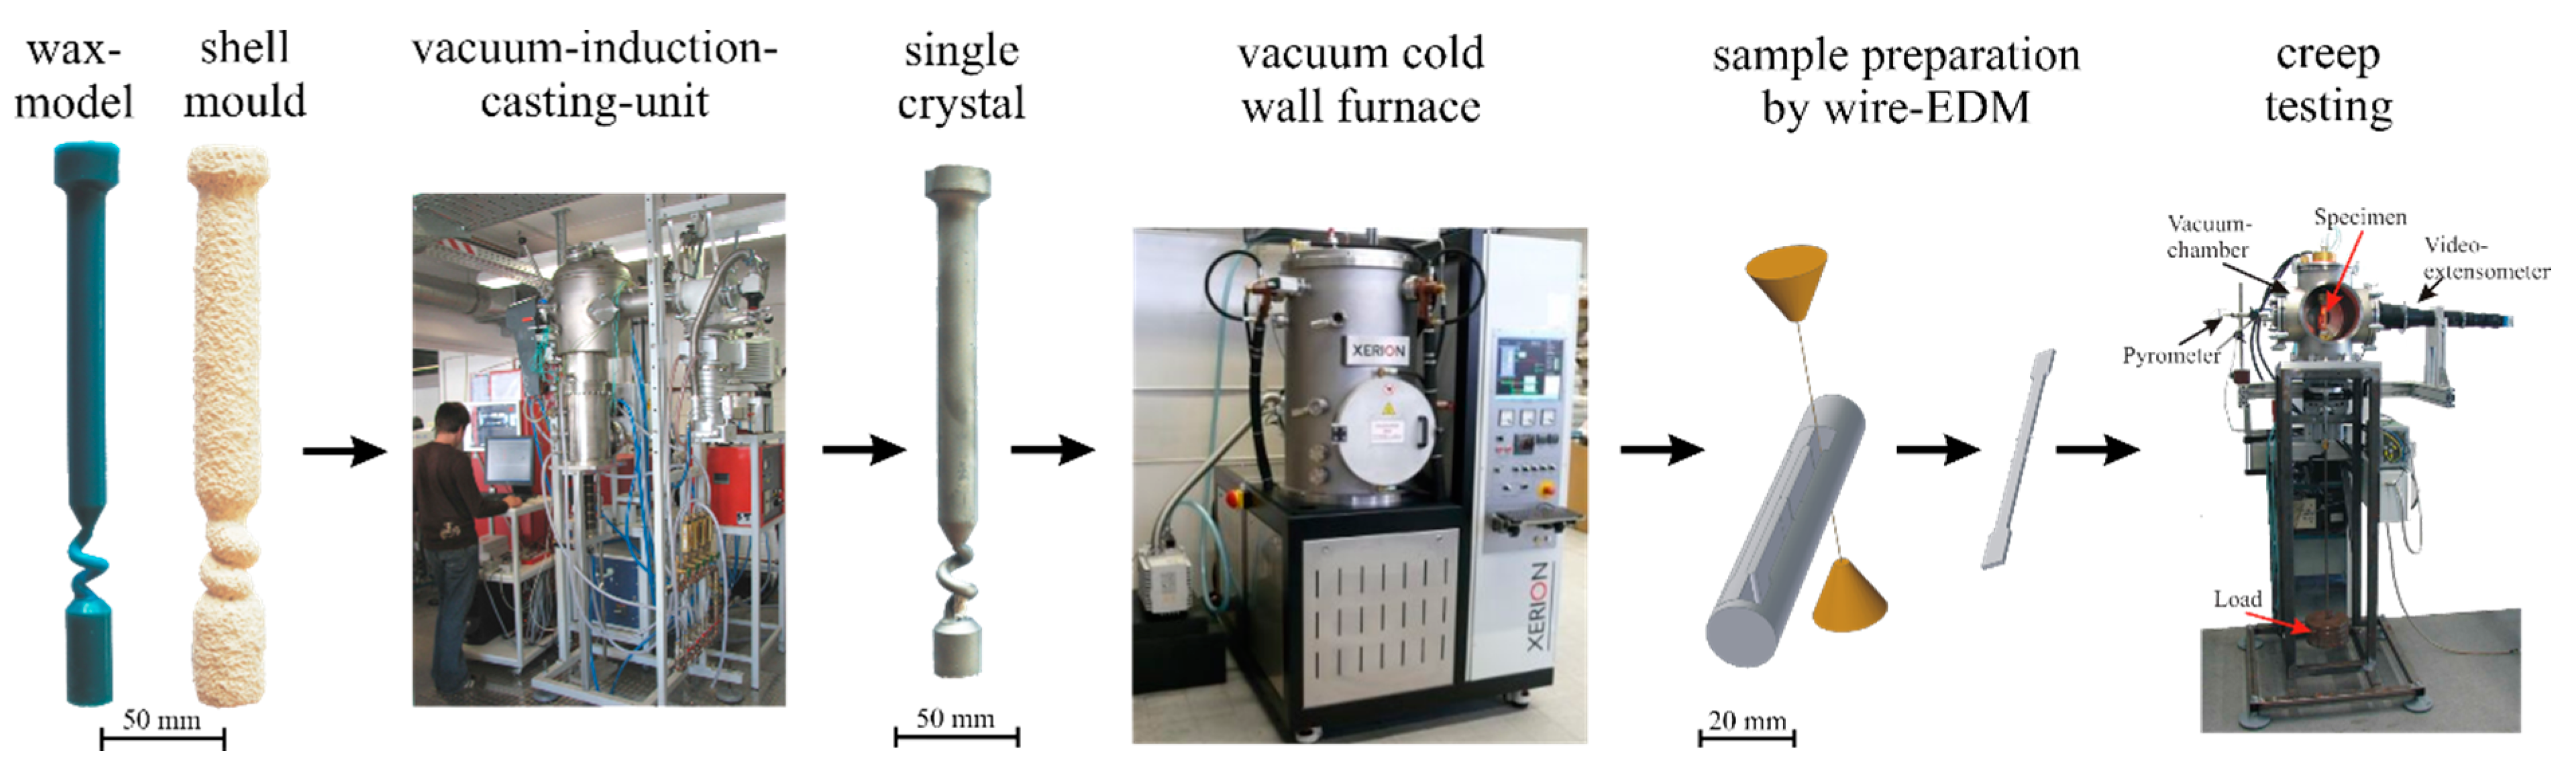
2.2. Sample Processing

Figure 3 shows the necessary processing steps in a schematic overview in order to obtain reliable creep results. Master alloys are melted from high-purity elements (>99.9%) in an arc furnace under 5 · 10 4   Pa argon atmosphere (not shown in Figure 3). Shell molds are produced via the lost wax method. Single crystal casting is then carried out in a Bridgman investment casting furnace [25] where several arc-melted buttons are melted together at about 1600 °C. The shell mold is heated to 1450 °C with a second furnace located in the vacuum chamber below. After pouring the liquid metal into the shell mold, the mold is lowered with a rate of 3 mm/min through a baffle with a gradient of 6 K/mm. The resulting single-crystalline cylindrical rods have a diameter of 15 mm and a length of 130 mm [3]. To ensure the absence of grain boundaries, the samples are etched after casting. A successfully cast single crystal shows no grain boundaries and dendrite arms that are visible from top to bottom of the samples over a length of more than 100 mm.
The as-cast single crystals were then heat-treated in a vacuum cold wall furnace with a pressure of 10−4 Pa or encapsulated in quartz glass tubes, using the heat treatment parameters listed in Table 3. Lower temperature heat treatment (annealing with <900 °C) was carried out in air since the sample surface was removed before creep testing. Thereafter, samples were cut into flat creep samples using wire electrical discharge machining (EDM). Out of one single-crystalline rod, more than 10 creep specimens could be eroded. The flat sides were sanded with a 2000 grid and etched in order to get rid of the EDM re-cast layer to finally achieve the creep samples.
Since all necessary steps were carried out in our lab, we achieved a very reliable and fast process chain where creep data could be obtained from single crystals with the desired alloy compositions within a couple of weeks.

2.3. Creep Testing

Creep samples with a cross-section of 2.9 mm in width and thickness of 1.0 mm were used. The exact geometry is described in [4]. The deviation of the 001 crystallographic axis of the single crystals from the load axis was determined by the dendrites revealed after etching for 10 s in molybdic acid. The deviation from 001 for all samples was less than 9°.
For the determination of the creep resistance, a high-temperature creep setup [30,31] was used. Applied stresses vary over a wide range, depending on the alloy used, from 5 to 300 MPa at a temperature of 980 °C to achieve a steady-state strain rate between 10−3 and 10−9 s−1, resulting in lifetimes of several 10 min to more than 1 year (in theory, if the test was not aborted). Since the focus of this research is on the minimum or secondary creep rate, respectively, tests with strain rates below 10−8 s−1 were generally aborted after reaching a stationary state. Pure Ni and the high entropy Cantor alloy were tested in the range of 5–14 MPa, the single-phase medium entropy and matrix alloys of Group (C) were tested in between 15 and 75 MPa and Group (D), and the two-phase Ni-based superalloys were tested in between 170 and 300 MPa. This paper summarizes 25 creep tests with a minimum of three tests for each alloy in order to obtain a reliable Norton exponent for each alloy.

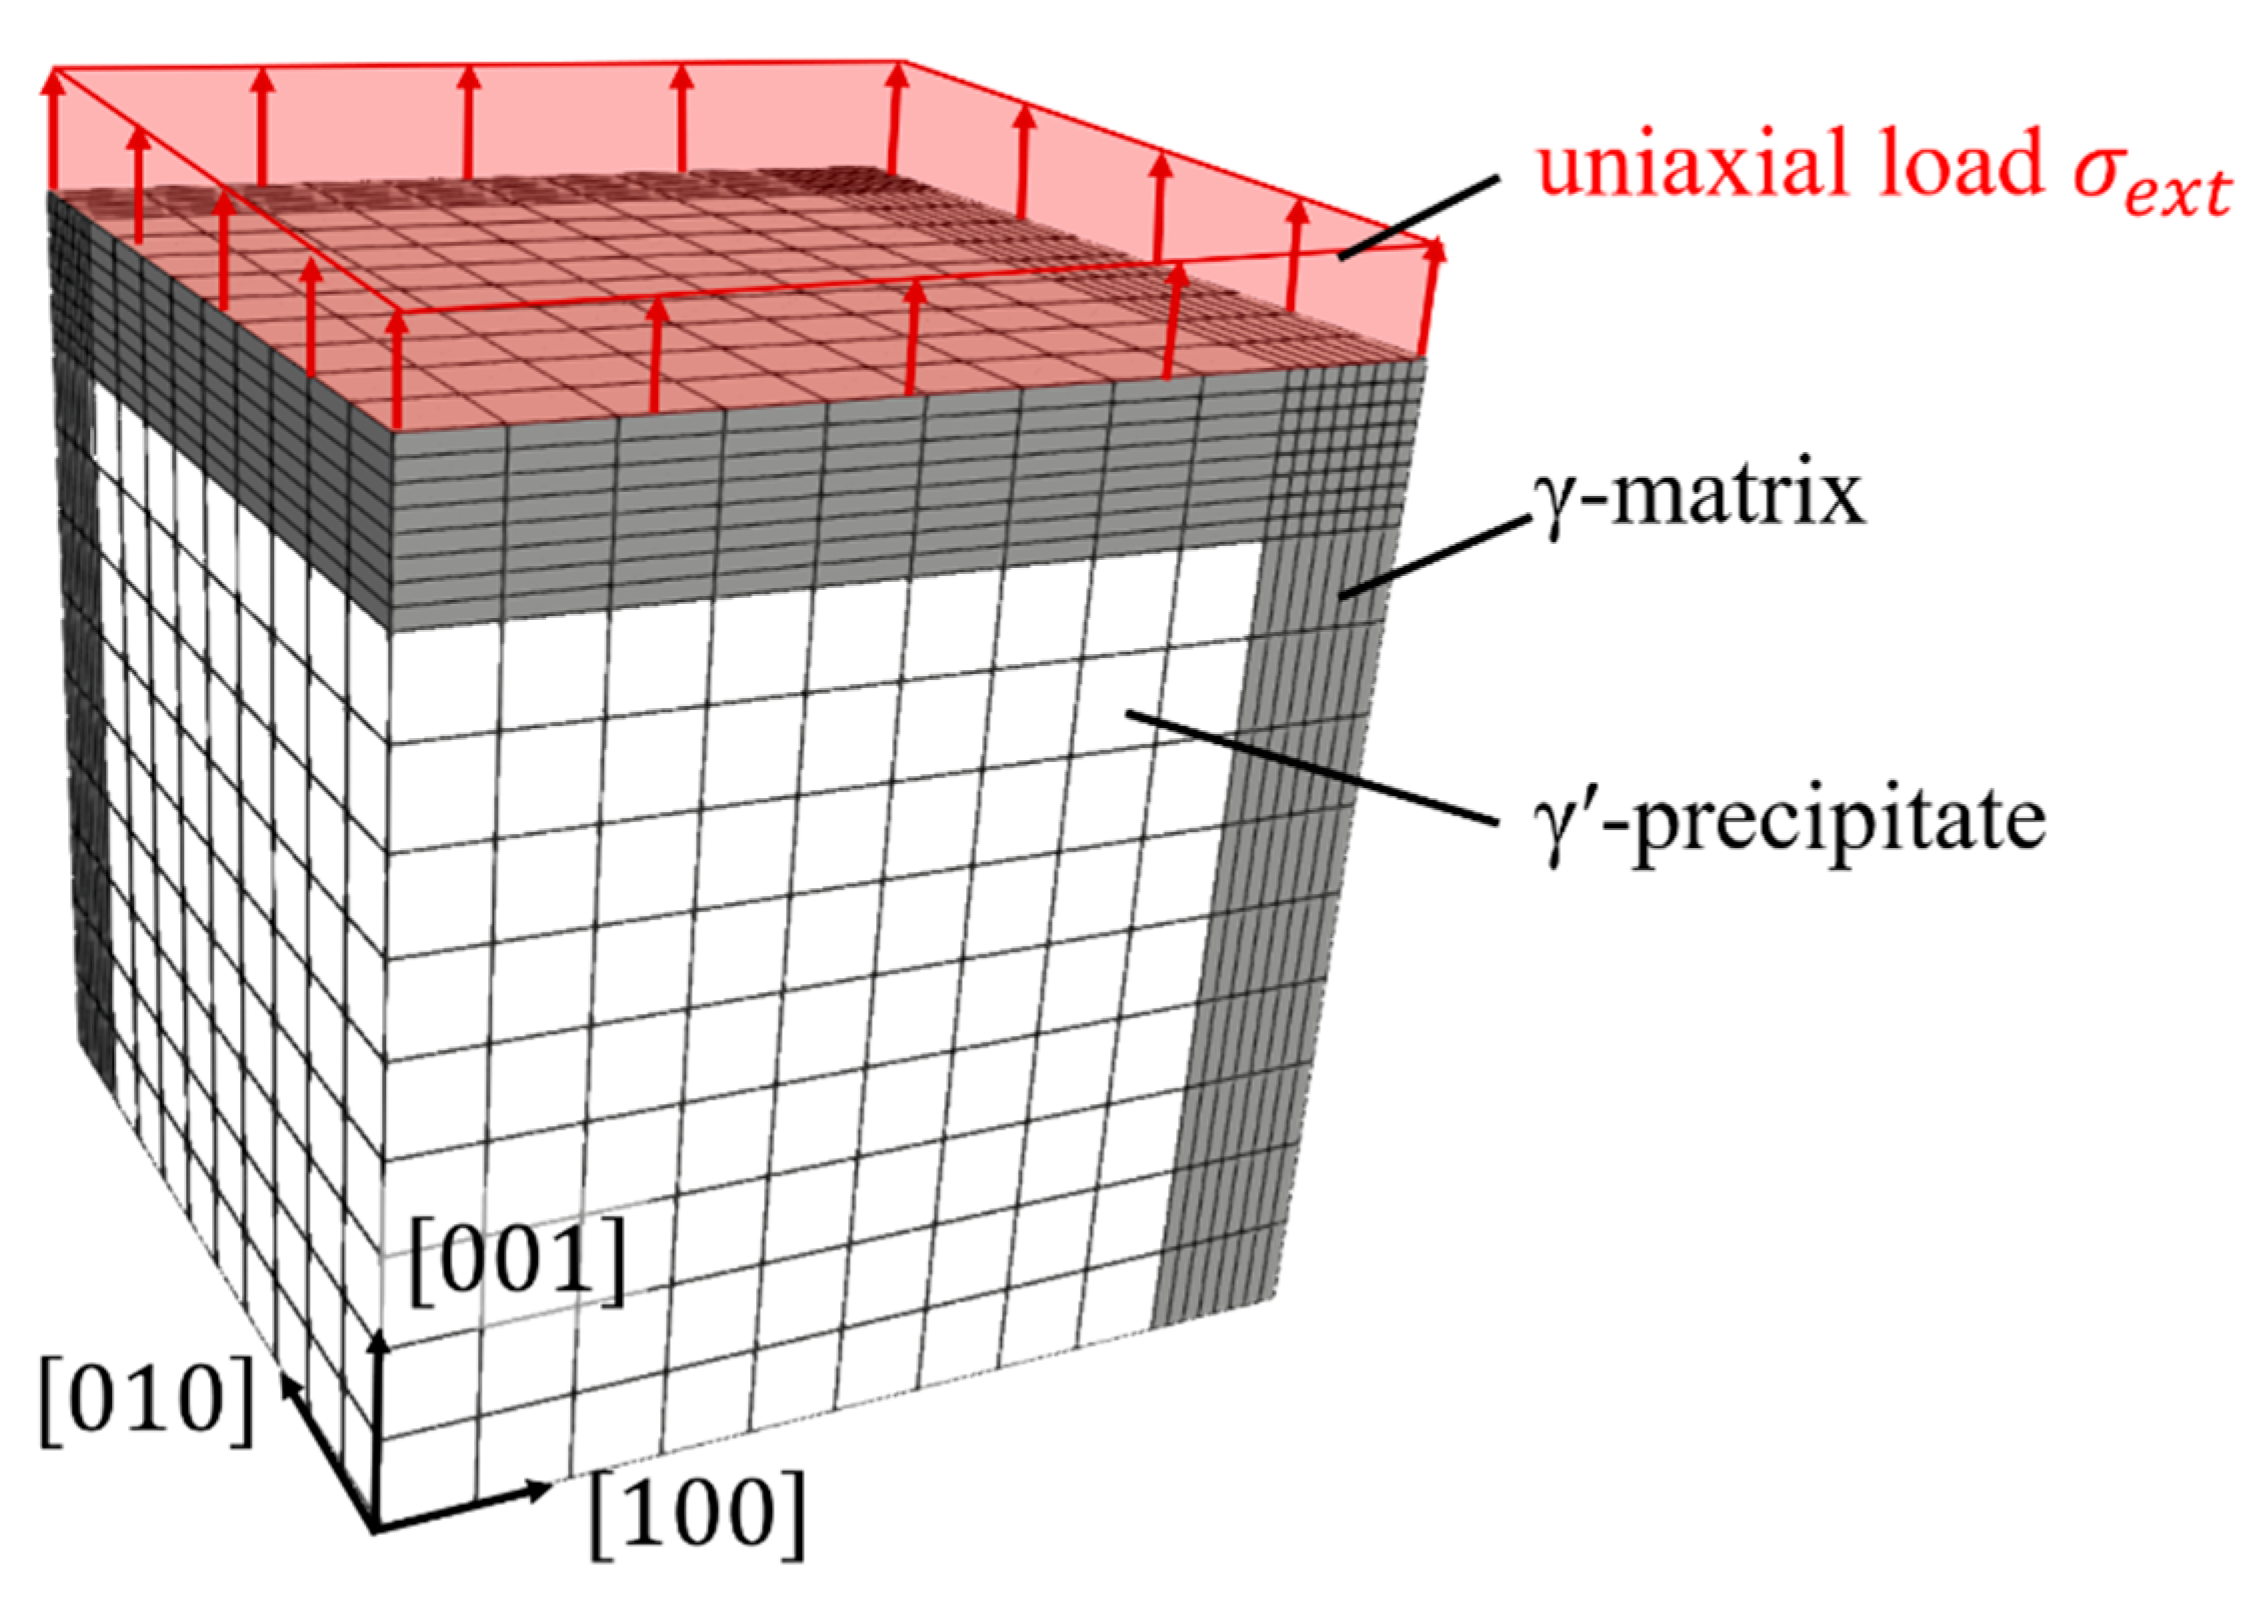
2.4. Simulation of Two-Phase Steady-State Creep by Finite Element Calculations

We used a finite element (FE) model to describe the influence of misfitting γ′ precipitates on the bulk creep resistance of a two-phase alloy. By varying the creep properties of the matrix phase, we investigated their influence on the creep properties of the respective two-phase alloys. Creep properties of the matrix phases of the Ni-based superalloys CMSX-3 and CMSX-4 were used in simulations with otherwise identical setups, and the corresponding bulk creep rates were determined.
Figure 4 shows the finite element mesh used to simulate the steady-state creep behavior of a two-phase alloy with a typical γ/γ′ microstructure [32]. The γ′ volume fraction was set by adjusting the thickness of the matrix channels relative to the precipitate edge length. Mirror symmetries were used such that an eighth of a cuboidal precipitate with surrounding matrix channels sufficiently described the microstructure [17,18,32]. Mirror boundaries and plane deformation boundary conditions allow for the simulation domain to stay periodic while also avoiding spurious strains that arise from volume conservation [18,33,34]. The two-phase microstructure was implemented by locally varying material properties. The coherency of the interface was explicitly modeled as the finite elements of the matrix and the γ′ phase at the phase boundary share the same nodes.
Cubic symmetry was used with three independent elastic constants for each phase. The misfit strains were modeled by an eigenstrain of the precipitate. The stress distribution from the misfitting precipitate was determined in a preliminary run and used as the initial state for the creep simulations. The elastic constants of the phases were determined by resonance ultrasound spectroscopy [35], and the lattice misfit was determined by neutron scattering [36,37].
The time-dependent plastic deformation of the matrix phase was considered locally via Norton’s creep law in Equation (1) with a steady-state creep rate ε 0 ˙ at a reference stress σ r e f and the stress exponent n. This is a phenomenological model to describe isotropic steady-state creep; therefore, primary creep in the matrix is neglected. The γ′ phase is assumed to be ideally elastic. The parameters for Equation (1) were determined from the creep experiments of the single-phase matrix alloys. All material parameters at a temperature of 980 °C that were used for the finite element calculation are listed in Table 4. To differentiate between the effect of solid solution strengthening of the matrix and of the precipitate volume fraction, both parameters were set independently.
On one side of the simulation domain, a homogeneous external stress σ e x t was applied in order to simulate a creep experiment. The displacement of this surface was observed over time, which results in a macroscopic strain as a function of time. This data was then processed analogously to the data from the creep experiments in order to determine the steady-state creep rate. The simulated loads were equal to the static loads of the creep tests.

3. Results and Discussion

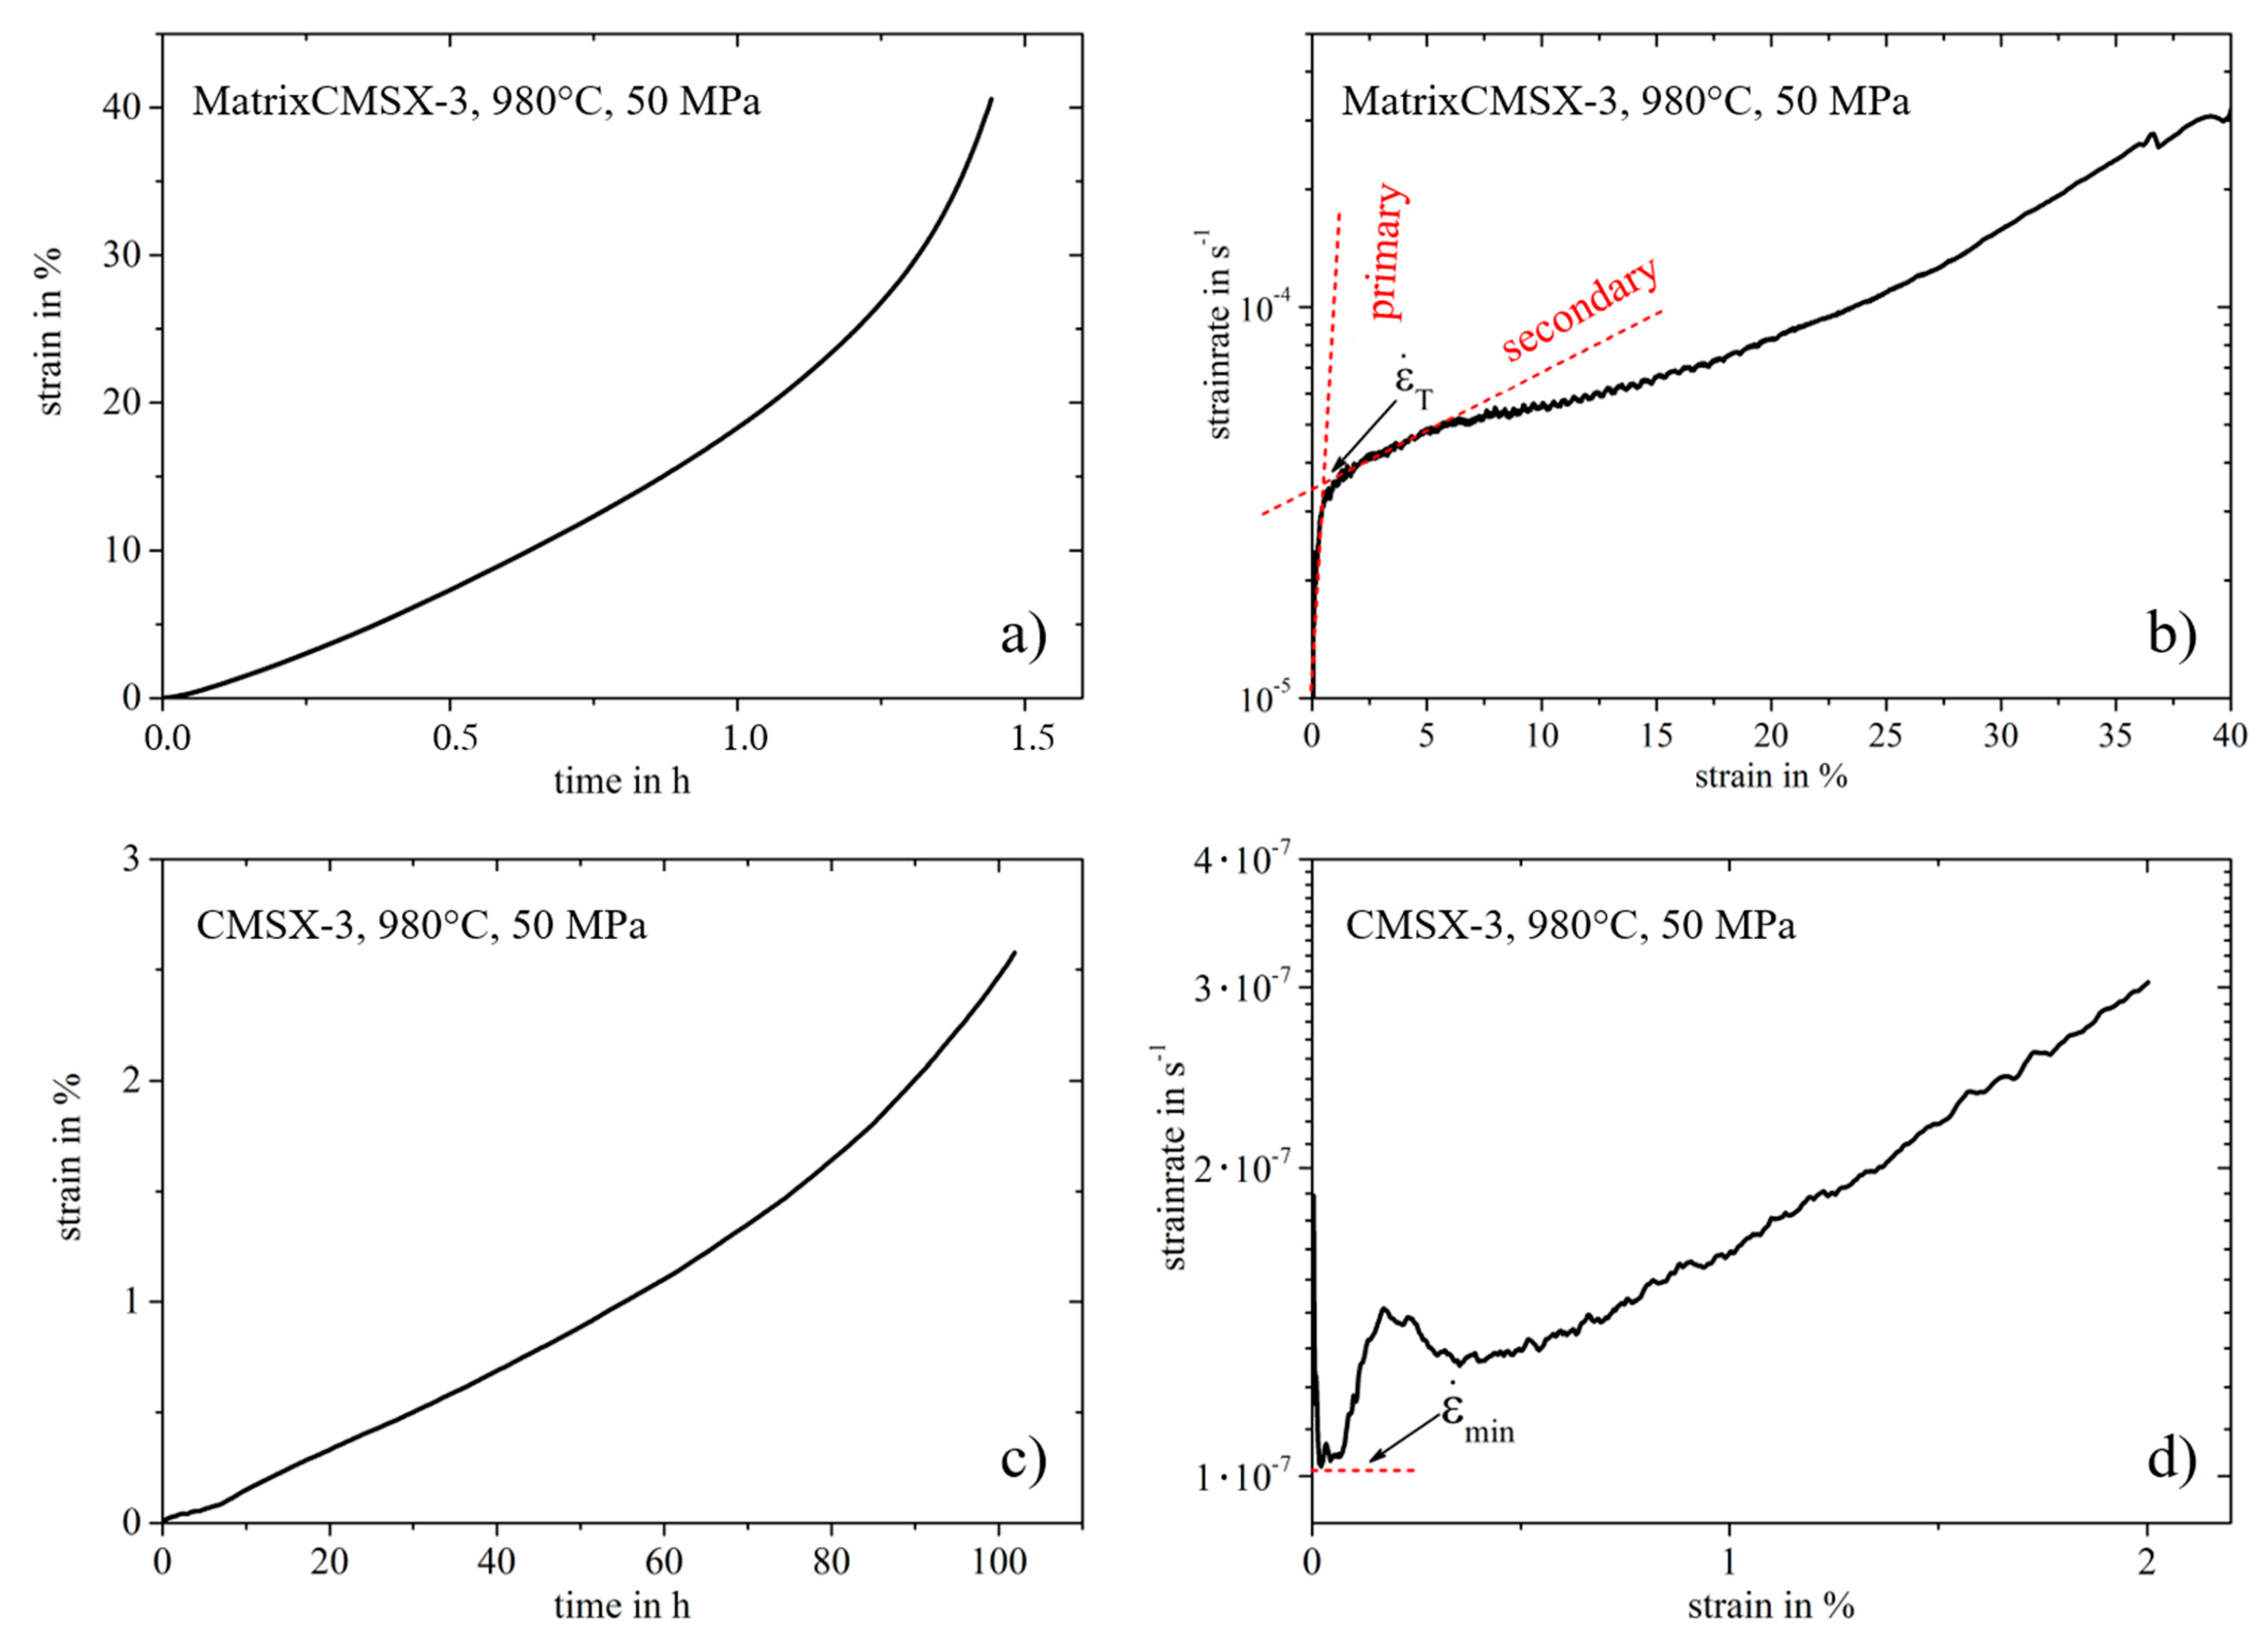
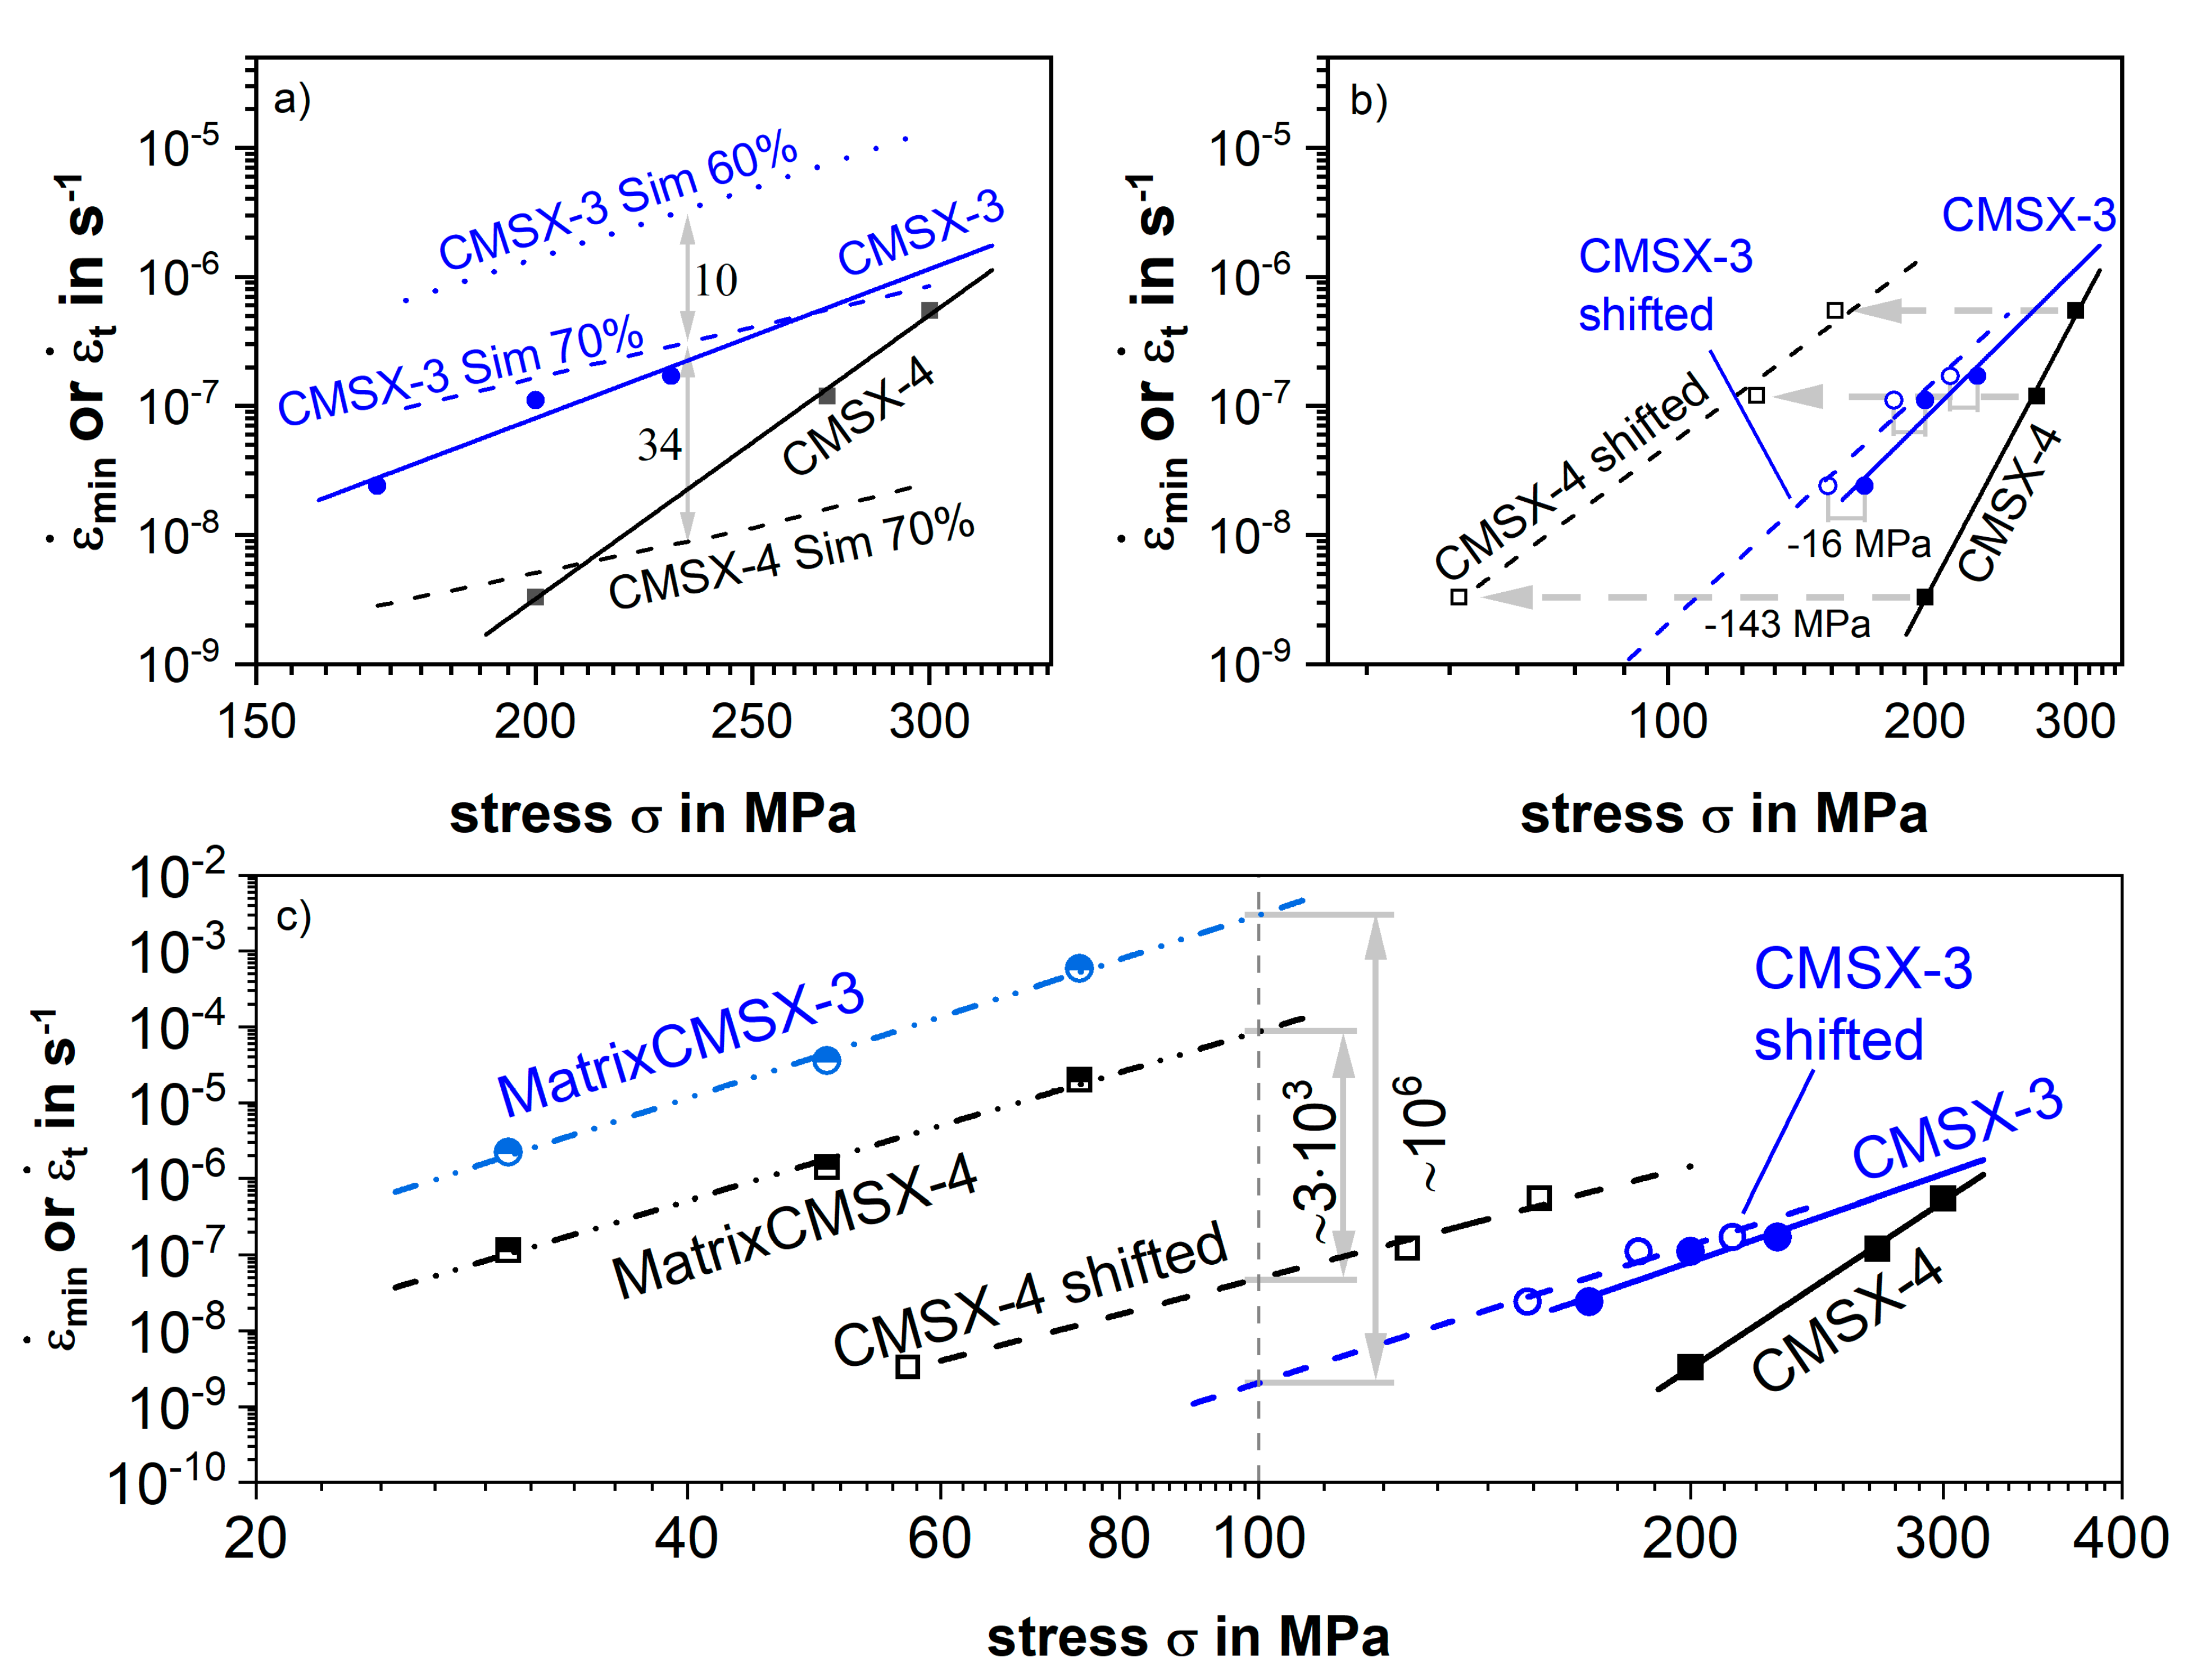
3.1. Experimental Evaluation of the Steady-State Creep Rate

Figure 5 shows the different transient behavior from primary to stationary creep for a highly solid solution strengthened single-phase matrix alloy [38]. An inverse creep behavior with a steadily increasing strain rate [39] is observed in comparison to a precipitation-hardened Ni-based superalloy. The two single-crystal superalloys CMSX-3 and CMSX-4 show a sigmoidal creep behavior with a pronounced minimum creep rate in the here investigated temperature and load range (980 °C and 170–300 MPa). The different transient behavior can be understood by a stronger reduction in the velocity of mobile dislocations in comparison to the change in dislocation density, see Figure 1 in [40]. In the case of pure Ni and medium-entropy and high-entropy Cantor alloy, regular textbook creep behavior occurs.
Therefore, for Groups (A), (B), and (D), the minimum creep rate ε ˙ m i n can be determined straightforwardly. In the case of Group (C), the single-phase matrix alloys with an inverse creep behavior, the transition creep rate ε ˙ t is used. Figure 6 shows the matrix of CMSX-3 at a stress of 50 MPa in comparison to the two-phase superalloy CMSX-3 at 200 MPa. The transition creep rate is marked by the intersection of primary and secondary creep regimes in Figure 5b,d.

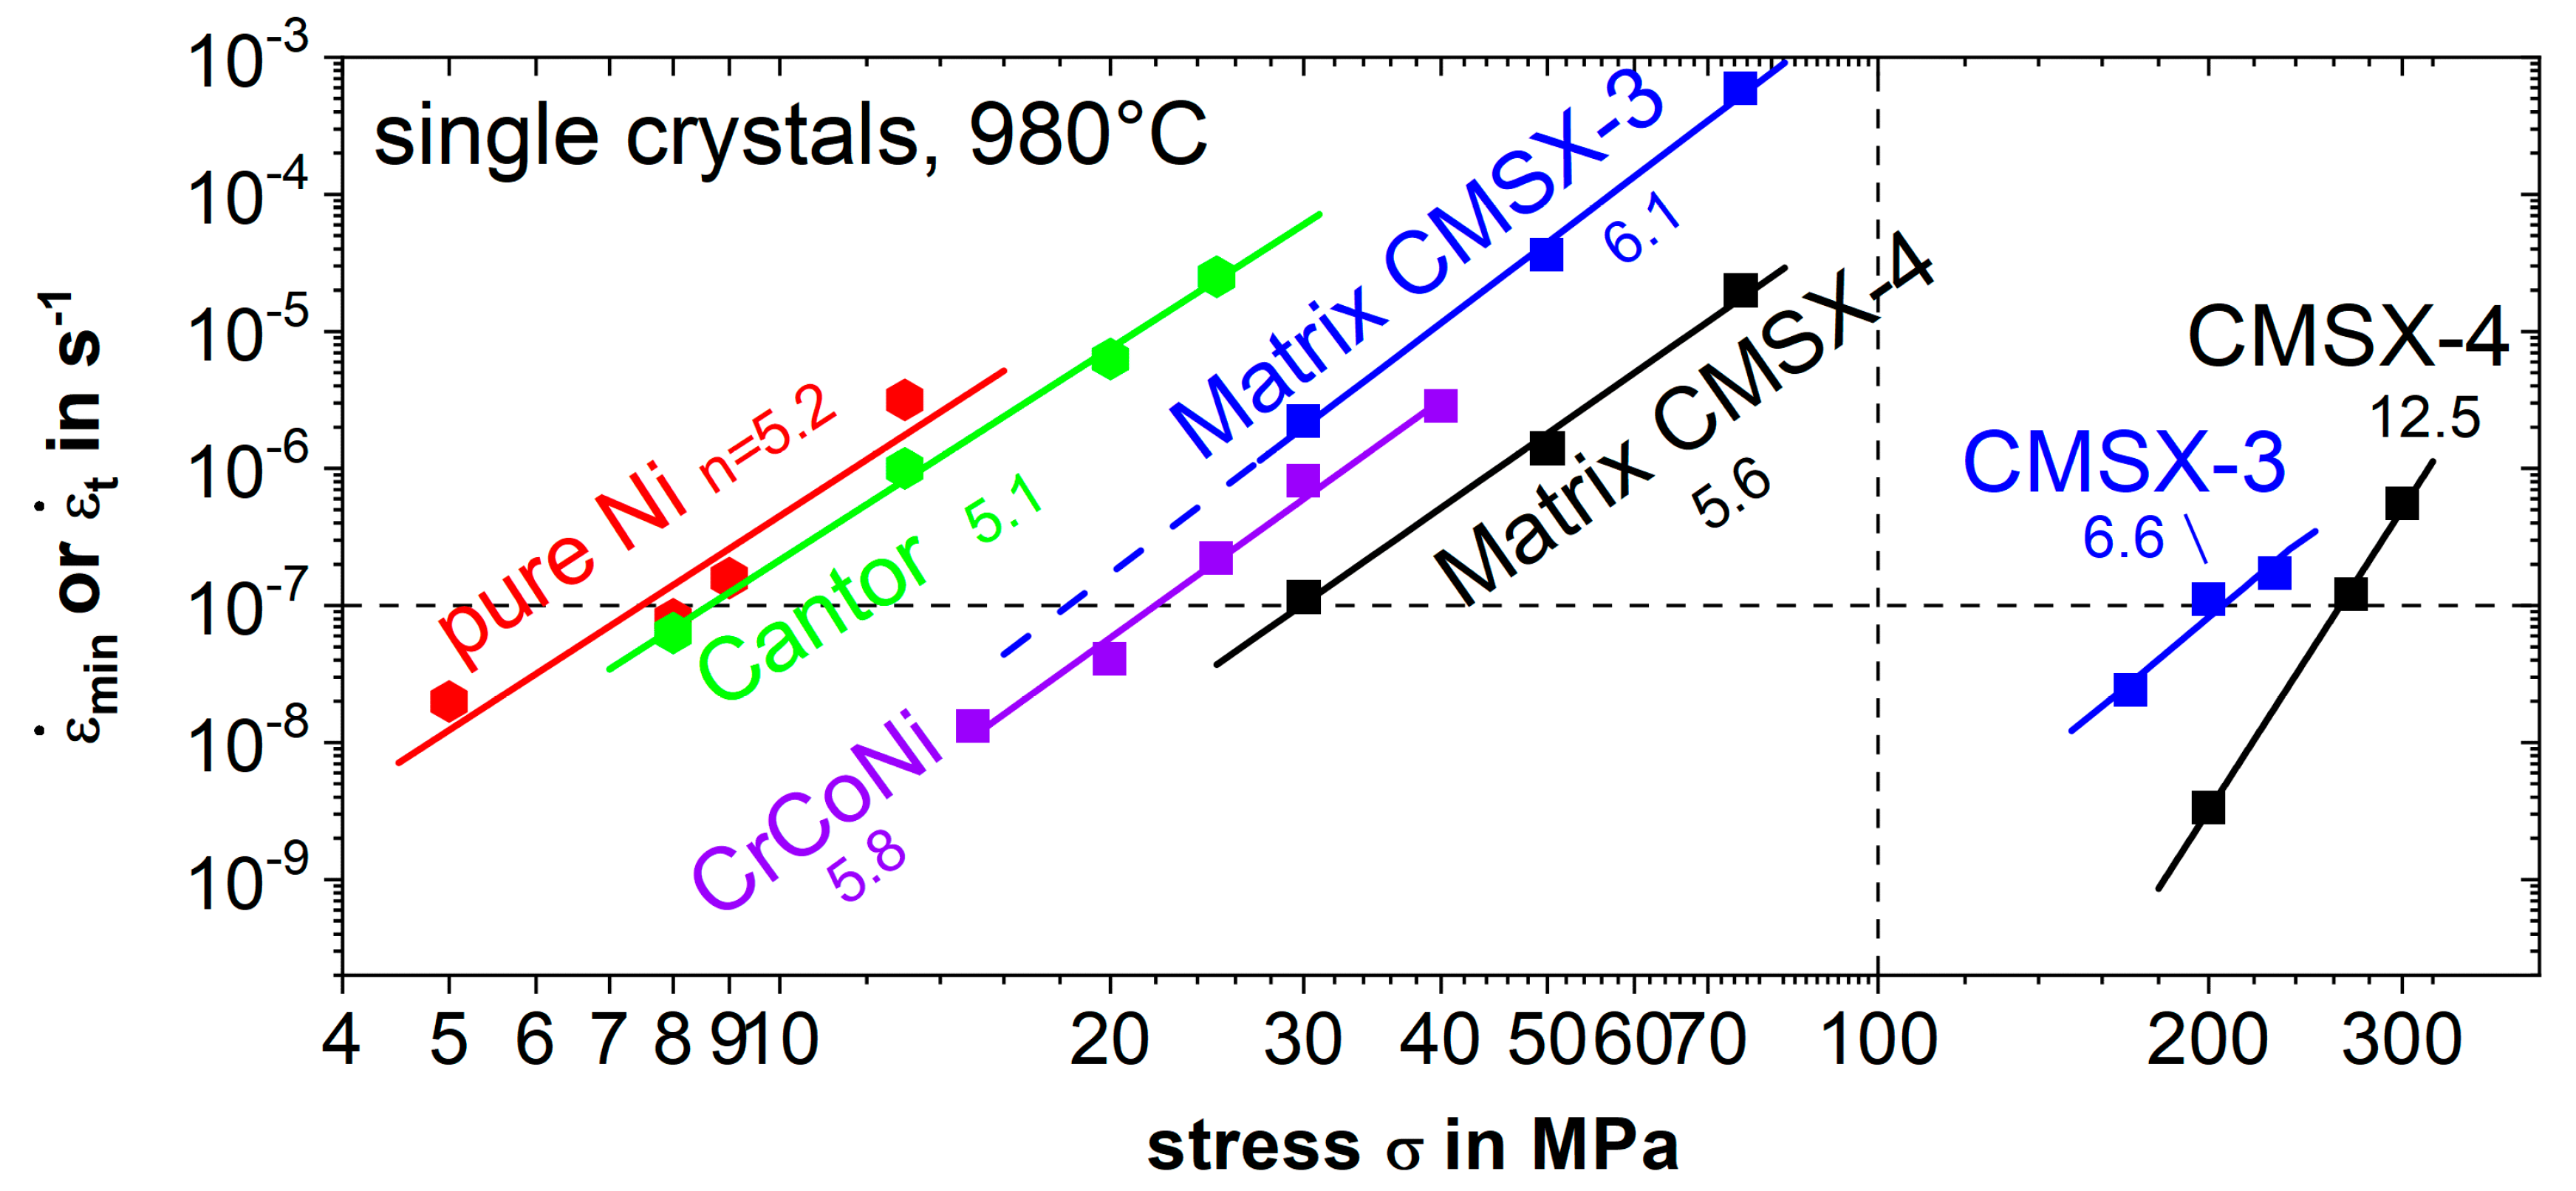
3.2. Creep Results at 980 °C over a Wide Range of Applied Stress

Figure 6 shows the creep results in a double logarithmic plot of ε ˙ m i n (or ε ˙ t ) versus the applied stress σ, commonly known as a Norton plot. The slope of the linear regression lines gives the Norton creep exponent n from Equation (1). Together with ε 0 ˙ an alloy and temperature-dependent material constant, creep strength at a certain stress level is fully described. The experimentally determined stress exponents n, the necessary applied stress to obtain a strain rate of 10−7 s−1 (horizontal dashed line in Figure 6), and the logarithm to base 10 of the extrapolate ε 0 ˙ at an applied stress σ = 100 MPa (vertical dashed lines in Figure 6) are listed in Table 5.
The lowest stress to result in a steady-state strain rate of 10−7 s−1 is reached for the single-crystal pure Ni samples and the high entropy Cantor alloy; then, the medium entropy alloy CrCoNi and the two single-phase matrix alloys follow. The stress needed to reach a steady-state strain rate of 10−7 s−1 in MatrixCMSX-4 compared to pure Ni is increased by a factor of 4 solely by solid solution strengthening. Finally, the two-phase Ni-based superalloys exhibit a wide gap, showing the strongest creep resistance. The sequence for the increase in Re content is the same: the matrix of CMSX-3 (no Re) has less creep resistance than the matrix of CMSX-4 (with 3.1 at.% or 9 wt.% Re), which is the same for the two-phase superalloys: CMSX-3 (no Re) is less creep-resistant than CMSX-4 (with 1.0 at.% or 3 wt.% Re).
The Norton exponent n stays nearly constant, with 5.1–6.6 over a wide stress range from 5 to 230 MPa, see Figure 6 and Table 5. A larger jump in stress exponent occurs for the two-phase superalloy CMSX-4 with n > 12. We discussed the influence of internal back stress σ 0 on stress exponent n earlier in this paper.
Solid solution strengthening obviously occurs strongly between pure Ni and the medium entropy alloy CrCoNi as well as the two single-phase matrix alloy. On the other hand, pure entropy increase does not help at these temperatures (compare pure Ni with Cantor alloy). It can be stated that the solid solution strengthening by Cr and Co with 33 at.% each is more effective than adding four elements with, in total, 80 at.%.
The influence of Re on solid solution strengthening can be quantified by comparing the two matrix alloys, MatrixCMSX-3, a single-phase alloy with the composition of the matrix of CMSX-3, and MatrixCMSX-4 (Table 1). By adding 3.1 at.% Re (MatrixCMSX-4). the creep strength is additionally enhanced by a factor of 1.7. Re is one of the most effective solid solution strengtheners in Ni alloys at high temperature.
The third and strongest strengthening mechanism at high temperature is precipitation hardening through γ precipitates. Compared to the two single-phase matrix alloys (MatrixCMSX-3 and MatrixCMSX-4), the two-phase Ni-based superalloys CMSX-3 and CMSX-4 show higher stresses at a minimum/transition creep rate of 10−7 s−1 by a factor of 12 and 9, respectively. Due to the strong solid solution strengthener Re in the matrix alloy of CMSX-4, the contribution of the precipitation hardening in CMSX-4 is smaller compared to CMSX-3 and its corresponding matrix. Both superalloys have similar composition except for Re, see Table 1. Thereby, the solid solution-strengthening potential of Re in the Ni-based superalloys is quantified. An addition of 1.0 at.% Re in CMSX-4 leads to a higher stress to reach a steady-state strain rate of 10−7 s−1 of a factor of 1.2 as compared to CMSX-3 with no Re content.
Table 6 lists the different effects and special features for each contribution to the internal back stress. For fully optimized precipitation hardening, as is the case for modern Ni-based superalloys like CMSX-3 and CMSX-4, all of the important microstructural features, i.e., misfit δ, matrix channel width L, and anti-phase boundary energy E A P B , result in high internal back stress of several 100 MPa. An upcoming dislocation chooses its path where the least internal back stress is active. From the very rough estimates listed in Table 6, this would be in the following order: least local misfit, then least local dislocation density, then widest matrix channel width, and only finally the cutting of the γ -phase. Therefore, the cutting of the γ′-phase will occur only after a certain internal back stress has built up due to some percent of creep strain in the later stages of steady-state creep [23]. This has been widely experimentally observed.

3.3. Quantification of Solid Solution Strengthening and Internal Back Stresses by Precipitation Hardening

Figure 7a shows a section of Figure 6 with the experimentally observed creep rates of the two-phase alloys CMSX-3 and CMSX-4. Finite element calculations of two-phase creep rates are provided assuming a γ′ volume content of 70% and considering a creep rate of the matrix equal to the creep rates measured for MatrixCMSX-3 and MatrixCMSX-4 (CMSX-3 Sim 70% and CMSX-4 Sim 70%, respectively). An additional simulation was carried out with a lower γ′ volume content of 60% and the matrix creep properties of CMSX-3 (CMSX-3 Sim 60%).
By inserting a coherently embedded cuboidal precipitate into the matrix the bearable stress at a creep rate of 10−7 s−1 rises almost by a factor of 10. This is in very good agreement with our experimental observations. The presented FE model can quantitatively assess the magnitude of the precipitation hardening effect. Overall, the simulations predict a higher creep rate for CMSX-3 than for CMSX-4 by a factor of over 300. At a volume fraction of 70%, the different creep resistance of the matrix (see simulation input data in Table 4) leads to an increase in the simulated two-phase creep rate of a factor of 34. This is again in good agreement with the factor of 25 between the creep rates of the matrix of CMSX-3 and CMSX-4. The presented simulation data also show the quantitative influence of the precipitate volume fraction on the creep rate. The creep rate of CMSX-3 with a more realistic γ′ volume fraction of 60% is again a factor of 10 higher compared to the simulation with a volume fraction of 70% as in CMSX-4.
Even though the magnitude of the creep rate is predicted well, the stress exponent is not in agreement. The strong increase of n in CMSX-4 (n > 12) is not reflected in the FE calculations. This is due to the simplicity of the model, which does not take into account the above-discussed internal back stress contributions, mainly Orowan stress and dislocation back stress. Therefore, the internal back stress is underestimated in the FE calculations.
The quantification process for the internal back stress σ 0 is shown in detail in Figure 7b. The stress level is chosen such that a steady-state creep rate of 10−7 s−1 is reached (210 and 260 MPa, respectively). The internal stresses of the two-phase alloys are calculated via Equation (3) as
σ 0 CMSX 3   =   n 1 n 2 n 1 σ   =   6.6 6.1 6.6   210   MPa   =   16   MPa ,
σ 0 CMSX 4 = n 1 n 2 n 1 σ   =   12.5 5.6 12.5   260   MPa   =   143   MPa .
The creep curves are shifted towards lower stress by their internal back stress (see Figure 1). More importantly, this results in a change in stress exponent. By adjusting σ 0 in such a way that the stress exponents of the matrix are achieved, we obtain σ 0 CMSX 4 = 143 MPa and σ 0 CMSX 3 = 16 MPa . This additional internal stress in the two-phase superalloy CMSX-4 as compared to CMSX-3 of 123 MPa is due to an increased, more negative misfit (due to Re increase) and an increased volume fraction of ~70% for CMSX-4 and 60% for CMSX-3 (due to a slight increase of γ′ forming elements).
Figure 7c shows a further comparison of the shifted two-phase creep data with the matrix data (vertical shifts at 100 MPa). We are able to estimate a creep strain reduction of a factor of about 10 6 for CMSX-3 and 3 × 10 3 for CMSX-4 by precipitation hardening.

3.4. Combined Effect of Various Strengthening Mechanism

The stress exponent of pure single-crystal Ni was determined to be 5.2 for a temperature of 980 °C, which is in good agreement for modeling of creep behavior by climb for pure metals [9]. Mitra and McLean [43] calculated the Norton exponent n in their work with 4.7 at a temperature of 800 °C. The stress exponent of the alloy CMSX-4 of 12.5 is also in good agreement with the work of Drew et al. [44] with a value of 13.3 and Knobloch et al. [29] with 13. The work of Pollock and Argon [17] confirms the lower stress exponent of CMSX-3 with 7.1 compared to 6.6 in this work.
Comparing CMSX-4 with CMSX-3, both single-phase matrix, and two-phase superalloys, we observe that the Re increase results in a solid solution strengthening of the matrix, which can be quantified by a vertical drop from MatrixCMSX-3 towards MatrixCMSX-4 by a factor of 20–30. Considering a matrix volume fraction of 30%, this vertical shift should reduce to a factor of 6–9. This is reflected in the about six times higher creep strength of CMSX-4 as compared to CMSX-3. Table 5 lists and Figure 6 and Figure 7 visualize these observations.
FEM calculations allow calculating a two-phase behavior by considering γ′ morphology and misfit as well as different matrix creep behavior, see Table 4. The FE model we used does not consider Orowan stress. Therefore, the internal back stresses are largely underestimated, and the high-stress exponent cannot be predicted by our FEM setup.
It is not possible to simply sum up the internal back stresses of the various acting strengthening mechanisms, because a mobile dislocation will choose the path with the least amount of the combined internal back stress in its surroundings. Therefore, statistical means are necessary in order to further clarify the contributions of the strengthening mechanisms.

4. Conclusions

Seven different Ni-containing single-crystalline alloys have been creep tested. The results clearly show and allow the quantification of the influence of solid solution strengthening with and without Re as well as the influence of precipitation hardening. Simple considerations of internal back stresses, together with finite element simulations, allow quantifying both effects. For the creep at 980 °C and stress levels, which result in steady-state strain rates of 10−7 s−1, we can summarize:
  • An influence of solely configurational entropy on creep strength is not observed. However, solid solution strengthening is of course of very high importance. Bearable stresses are four times higher for the matrix of CMSX-4 compared to pure Ni.
  • We quantify the combined internal back stresses due to the various acting strengthening mechanisms in two-phase superalloys to be:
    σ 0 CMSX 4 = 143 MPa for the Ni-based superalloy CMSX-4.
    σ 0 CMSX 3 = 16 MPa for CMSX-3.
  • Additions of Re: 1.0 at.% (3 wt.%, respectively) Re in the superalloys, corresponding to 3.1 at.% (9 wt.%, respectively) in the single-phase matrix, result in a strength increase of the matrix by a factor of 1.7 (1.2, respectively) in the two-phase material.
  • The element Re influences the lattice misfit, the γ′ precipitate size, and morphology and thereby increases the internal back stress.
  • Quantification of these effects is only possible by using single-crystal samples.

Author Contributions

Conceptualization, U.G.; methodology, U.G.; formal analysis, U.G., F.S., C.G., and M.M. (Moritz Müller); investigation, C.G., M.M. (Mike Mosbacher), F.K., and F.S.; resources, U.G. and R.V.; writing—original draft preparation, U.G.; writing—review and editing, F.S. and M.M. (Moritz Müller); visualization, U.G. and M.M. (Moritz Müller); supervision, U.G.; project administration, U.G., funding acquisition, U.G. and R.V. All authors have read and agreed to the published version of the manuscript.

Funding

This research was funded by the Deutsche Forschungsgemeinschaft (DFG) with grant numbers GL 181/19, 32, 50, 52, and 56.

Acknowledgments

The extensive experimental work of our former colleagues Martin Brunner, Ernst Fleischmann, and Christian Konrad to establish single-crystal casting and creep testing is highly appreciated.

Conflicts of Interest

The authors declare no conflict of interest.

References

  1. Reed, R.C. The Superalloys: Fundamentals and Applications; Cambridge University Press: Cambridge, UK; New York, NY, USA, 2006; ISBN 9780511541285. [Google Scholar]
  2. Sims, C.T.; Stoloff, N.S.; Hagel, W.C. (Eds.) Superalloys II: High-Temperature Materials for Aerospace and Industrial Power; Wiley: New York, NY, USA, 1987; ISBN 978-0-471-01147-7. [Google Scholar]
  3. Fleischmann, E.; Miller, M.K.; Affeldt, E.; Glatzel, U. Quantitative experimental determination of the solid solution hardening potential of rhenium, tungsten and molybdenum in single-crystal nickel-based superalloys. Acta Mater. 2015, 87, 350–356. [Google Scholar] [CrossRef] [Green Version]
  4. Harada, H.; Murakami, H. Design of Ni-Base Superalloys. In Computational Materials Design; Zunger, A., Osgood, R.M., Hull, R., Sakaki, H., Saito, T., Eds.; Springer Berlin Heidelberg: Berlin/Heidelberg, Germany, 1999; pp. 39–70. ISBN 978-3-642-08404-1. [Google Scholar]
  5. Bird, J.E.; Mukherjee, A.K.; Dorn, J.E. Correlations between High-Temperature Creep Behaviour and Structure. In Quantitative Relation Between Properties and Microstructure: Proceedings of an International Conference; Israel University Press: Haifa, Israel, 1969; pp. 255–342. [Google Scholar]
  6. Biberger, M.; Blum, W. On the natural law of steady state creep. Scr. Metall. 1989, 23, 1419–1424. [Google Scholar] [CrossRef]
  7. Zakine, C.; Prioul, C.; François, D. Creep behaviour of ODS steels. Mater. Sci. Eng. A 1996, 219, 102–108. [Google Scholar] [CrossRef]
  8. Blum, W.; Finkel, A. New technique for evaluating long range internal back stresses. Acta Metall. 1982, 30, 1705–1715. [Google Scholar] [CrossRef]
  9. Kassner, M.E. Fundamentals of Creep in Materials, 3rd ed.; Butterworth-Heinemann: Amsterdam, The Netherlands, 2014; ISBN 9780080994277. [Google Scholar]
  10. Fleischer, R. Solution hardening. Acta Metall. 1961, 9, 996–1000. [Google Scholar] [CrossRef]
  11. Fleischer, R. Substitutional solution hardening. Acta Metall. 1963, 11, 203–209. [Google Scholar] [CrossRef]
  12. Labusch, R. A Statistical Theory of Solid Solution Hardening. Phys. Stat. Sol. B 1970, 41, 659–669. [Google Scholar] [CrossRef]
  13. Labusch, R. Statistische theorien der mischkristallhärtung. Acta Metall. 1972, 20, 917–927. [Google Scholar] [CrossRef]
  14. Wu, X.; Makineni, S.K.; Liebscher, C.H.; Dehm, G.; Rezaei Mianroodi, J.; Shanthraj, P.; Svendsen, B.; Bürger, D.; Eggeler, G.; Raabe, D.; et al. Unveiling the Re effect in Ni-based single crystal superalloys. Nat. Commun. 2020, 11, 389. [Google Scholar] [CrossRef] [PubMed] [Green Version]
  15. Heckl, A.; Neumeier, S.; Göken, M.; Singer, R.F. The effect of Re and Ru on γ/γ′ microstructure, γ-solid solution strengthening and creep strength in nickel-base superalloys. Mater. Sci. Eng. A 2011, 528, 3435–3444. [Google Scholar] [CrossRef]
  16. Pettinari-Sturmel, F.; Douin, J.; Krieg, F.; Fleischmann, E.; Glatzel, U. Evidence of Short-Range Order (SRO) by Dislocation Analysis in Single-Crystal Ni-Based Matrix Alloys with Varying Re Content After Creep. In Superalloys 2020; Tin, S., Hardy, M.C., Clews, J., Cormier, J., Feng, Q., Marcin, J., O’Brien, C., Suzuki, A., Eds.; Springer International Publishing: Cham, Switzerland, 2020; pp. 253–259. ISBN 978-3-030-51833-2. [Google Scholar]
  17. Pollock, T.M.; Argon, A.S. Creep resistance of CMSX-3 nickel base superalloy single crystals. Acta Metall. Et Mater. 1992, 40, 1–30. [Google Scholar] [CrossRef]
  18. Glatzel, U.; Feller-Kniepmeier, M. Calculations of internal stresses in the γ/γ′ microstructure of a nickel-base superalloy with high volume fraction of γ′-phase. Scr. Metall. 1989, 23, 1839–1844. [Google Scholar] [CrossRef]
  19. Völkl, R.; Glatzel, U.; Feller-Kniepmeier, M. Measurement of the lattice misfit in the single crystal nickel based superalloys CMSX-4, SRR99 and SC16 by convergent beam electron diffraction. Acta Mater. 1998, 46, 4395–4404. [Google Scholar] [CrossRef]
  20. Glatzel, U.; Forbes, K.R.; Nix, W.D. Dislocation energies for an anisotropic cubic crystal calculations and observations for NiAl. Philos. Mag. A 1993, 67, 307–323. [Google Scholar] [CrossRef]
  21. Scattergood, R.O.; Bacon, D.J. The Orowan mechanism in anisotropic crystals. Philos. Mag. A J. Theor. Exp. Appl. Phys. 1975, 31, 179–198. [Google Scholar] [CrossRef]
  22. Bensch, M.; Konrad, C.H.; Fleischmann, E.; Rae, C.; Glatzel, U. Influence of oxidation on near-surface γ′ fraction and resulting creep behaviour of single crystal Ni-base superalloy M247LC SX. Mater. Sci. Eng. A 2013, 577, 179–188. [Google Scholar] [CrossRef]
  23. Pollock, T.M.; Argon, A.S. Intermediate Temperature Creep Deformation in CMSX-3 Single Crystals. In Proceedings of the Superalloys 1988 (Sixth International Symposium), Superalloys, Champion, PA, USA, 18–22 September 1988; pp. 285–294, ISBN 0-87339-076-8. [Google Scholar]
  24. Hirth, J.P.; Lothe, J. Theory of Dislocations, 2nd ed.; Wiley: New York, NY, USA, 1982; ISBN 0471091251. [Google Scholar]
  25. Konrad, C.H.; Brunner, M.; Kyrgyzbaev, K.; Völkl, R.; Glatzel, U. Determination of heat transfer coefficient and ceramic mold material parameters for alloy IN738LC investment castings. J. Mater. Process. Technol. 2011, 211, 181–186. [Google Scholar] [CrossRef]
  26. Cantor, B.; Chang, I.; Knight, P.; Vincent, A. Microstructural development in equiatomic multicomponent alloys. Mater. Sci. Eng. A 2004, 375–377, 213–218. [Google Scholar] [CrossRef]
  27. Andersson, J.-O.; Helander, T.; Höglund, L.; Shi, P.; Sundman, B. Thermo-Calc & DICTRA, computational tools for materials science. Calphad 2002, 26, 273–312. [Google Scholar] [CrossRef]
  28. Harris, K.; Wahl, J.B. Improved Single Crystal Superalloys, CMSX-4 (SLS)[La+Y] and CMSX-486. In Proceedings of the Superalloys 2004 (Tenth International Symposium), Seven Springs, PA, USA, 19–23 September 2004; pp. 45–52. [Google Scholar]
  29. Knobloch, C.; Saβ, V.; Siebörger, D.; Glatzel, U. Anisotropie creep behavior of a nickel-based superalloy compared with single phase nickel solid solution and γ′ phase single crystals. Mater. Sci. Eng. A 1997, 234–236, 237–241. [Google Scholar] [CrossRef]
  30. Völkl, R.; Fischer, B.; Beschliesser, M.; Glatzel, U. Evaluating strength at ultra-high temperatures—Methods and results. Mater. Sci. Eng. A 2008, 483–484, 587–589. [Google Scholar] [CrossRef]
  31. Brunner, M.; Bensch, M.; Völkl, R.; Affeldt, E.; Glatzel, U. Thickness influence on creep properties for Ni-based superalloy M247LC SX. Mater. Sci. Eng. A 2012, 550, 254–262. [Google Scholar] [CrossRef]
  32. Preußner, J.; Rudnik, Y.; Völkl, R.; Glatzel, U. Finite-element modelling of anisotropic single-crystal superalloy creep deformation based on dislocation densities of individual slip systems. Z. für Met. 2005, 96, 595–601. [Google Scholar] [CrossRef]
  33. Probst-Hein, M.; Dlouhy, A.; Eggeler, G. Interface dislocations in superalloy single crystals. Acta Mater. 1999, 47, 2497–2510. [Google Scholar] [CrossRef]
  34. Schleifer, F.; Holzinger, M.; Lin, Y.-Y.; Glatzel, U.; Fleck, M. Phase-field modeling of γ/γ″ microstructure formation in Ni-based superalloys with high γ″ volume fraction. Intermetallics 2020, 120, 106745. [Google Scholar] [CrossRef] [Green Version]
  35. Fleck, M.; Schleifer, F.; Holzinger, M.; Glatzel, U. Phase-Field Modeling of Precipitation Growth and Ripening During Industrial Heat Treatments in Ni-Base Superalloys. Met. Mater. Trans. A 2018, 49, 4146–4157. [Google Scholar] [CrossRef]
  36. Glatzel, U.; Müller, A. Neutron scattering experiments with a nickel base superalloy part I: Material and experiment. Scr. Metall. Et Mater. 1994, 31, 285–290. [Google Scholar] [CrossRef]
  37. Glatzel, U. Neutron scattering experiments with a nickel base superalloy part II: Analysis of intensity profiles. Scr. Metall. Et Mater. 1994, 31, 291–296. [Google Scholar] [CrossRef]
  38. Fleischmann, E.; Konrad, C.; Preußner, J.; Völkl, R.; Affeldt, E.; Glatzel, U. Influence of Solid Solution Hardening on Creep Properties of Single-Crystal Nickel-Based Superalloys. Met. Mater. Trans. A 2015, 46, 1125–1130. [Google Scholar] [CrossRef]
  39. Hemker, K.J.; Nix, W.D. High-temperature creep of the intermetallic alloy Ni3Al. Metall. Trans. 1993, 24, 335–341. [Google Scholar] [CrossRef]
  40. Preußner, J.; Rudnik, Y.; Brehm, H.; Völkl, R.; Glatzel, U. A dislocation density based material model to simulate the anisotropic creep behavior of single-phase and two-phase single crystals. Int. J. Plast. 2009, 25, 973–994. [Google Scholar] [CrossRef]
  41. Hoffman, R.E.; Pikus, F.W.; Ward, R.A. Self-Diffusion in Solid Nickel. J. Met. 1956, 8. [Google Scholar]
  42. Ardell, A.J.; Huang, J.C. Antiphase boundary energies and the transition from shearing to looping in alloys strengthened by ordered precipitates. Philos. Mag. Lett. 1988, 58, 189–197. [Google Scholar] [CrossRef]
  43. Mitra, S.K.; McLean, D. Cold Work and Recovery in Creep at Ostensibly Constant Structure. Met. Sci. J. 1967, 1, 192–198. [Google Scholar] [CrossRef]
  44. Drew, G.L.; Reed, R.C.; Kakehi, K.; Rae, C.M.F. Single Crystal Superalloys: The Transition from Primary to Secondary Creep. In Proceedings of the Superalloys 2004 (Tenth International Symposium), Seven Springs, PA, USA, 19–23 September 2004; pp. 127–136, ISBN 0-87339-576-X. [Google Scholar]
Figure 1. Schematic Norton plot of the stationary creep rate over the applied stress for a material with an internal back stress σ 0 = 100   MPa (green line) and a matrix response with n = 6 (orange line). For an applied stress in the range of 180–300 MPa, a stress exponent of around 12 is determined (blue line). The blue line is shifted vertically due to different ε 0 ˙ .
Metals 11 01130 g001
Figure 2. Microstructure of the investigated (a) single-phase matrix alloys and the (b) two-phase Ni-based superalloy with cuboidal, dark γ′-precipitates (ordered) and thin, bright γ-matrix channels (face-centered cubic, fcc).
Metals 11 01130 g002
Figure 3. Process chain of SX-casting, heat treatment, specimen production, and creep testing at the chair of metals and alloys in Bayreuth.
Metals 11 01130 g003
Figure 4. Finite element model of the γ/γ′ microstructure with a γ′-volume fraction of 60%. A constant load σ e x t was applied in [001]-direction, and periodic boundary conditions were applied to all surfaces.
Metals 11 01130 g004
Figure 5. Creep experiments of CMSX-3 (c,d) and the corresponding matrix alloy MatrixCMSX-3 (a,b). Strain over time (a,c) and strain rate over time (b,d) are shown. Minimum creep rate ε ˙ m i n and transition creep rate ε ˙ T are indicated.
Metals 11 01130 g005
Figure 6. Minimum/transition creep rates of seven different alloys, all of them as single crystals at 980 °C and 100 MPa. Creep parameters are listed in Table 5.
Metals 11 01130 g006
Figure 7. (a) Simulated two-phase creep rates with CMSX-3 and CMSX-4 matrix and a γ′ volume content of 60% and 70%. (b) Experimental two-phase creep curves shifted by the calculated internal back stresses σ 0 for every alloy. (c) Reduced creep rate at 100 MPa for two-phase CMSX-3 and CMSX-4 compared to their respective matrix alloys.
Metals 11 01130 g007
Table 1. Nominal composition of the alloys in at.%. Measured composition deviates in all cases only slightly.
in at.%GroupAlTiCrMnFeCoNiMoHfTaWRe
Ni(A)------100-----
CrCoNi(B)--33--3333-----
Cantor--2020202020-----
matrixCMSX-3(C)3.10.121.4--20.351.10.9-0.13.0-
matrixCMSX-43.30.120.0--19.650.00.9-0.12.93.1
CMSX-3(D)12.41.39.1--4.767.60.30.052.02.6-
CMSX-412.61.37.7--9.962.80.40.052.22.11.0
Table 2. Phases present in the alloys of groups (A) to (D). The configurational entropy S config of the solid solution alloys after Equation (12) is also given. The two-phase alloys are marked with a * to indicate that the entropy is calculated from S config of the respective matrix phases multiplied by the volume content of the matrix phase (60% for CMSX-3 and 70% for CMSX-4).
AlloyGroupPhases S config in   R
Ni(A)single-phase fcc0.00
CrCoNi(B)1.10
Cantor1.61
matrixCMSX-3(C)1.27
matrixCMSX-41.37
CMSX-3(D)two-phase fcc + L120.51 *
CMSX-40.41 *
Table 3. Heat treatment parameters of the seven different alloys.
AlloyGroupHeat TreatmentLiterature
Ni(A)-
CrCoNi(B)
Cantor-
MatrixCMSX-3
MatrixCMSX-4
(C)1290 °C/48 hthis work
CMSX-3(D)1293 °C/2 h + 1298 °C/3 h, cooling with > 100 °C/min,
1080 °C/4 h, 870 °C/20 h
[17]
CMSX-41320 °C/2 h, cooling with > 100 °C/min,
1140 °C/6 h, cooling with > 100 °C/min, 870 °C/20 h
[29]
Table 4. Material data at 980 °C used for the creep simulation of CMSX-3 and CMSX-4.
ParameterValue
Elastic constantsγ-matrixC11 = 210 GPa
C12 = 160 GPa
C44 = 90 GPa
γ′-phaseC11 = 200 GPa
C12 = 140 GPa
C44 = 100 GPa
Lattice misfit −2.2 × 10⁻³
Creep parameters at σ r e f = 100 MPamatrix CMSX-3 ε 0 = 2 × 10⁻³ s−1
n = 5.5
matrix CMSX-4 ε 0 = 8 × 10⁻⁵ s−1
n = 5.5
Mass density 8900 kg m−3
γ′ volume fractionCMSX-360%
CMSX-470%
Table 5. Norton exponents, bearable stresses for a steady-state strain rate of 10 7   s 1 and creep rates at 100 MPa of the tested elements/alloys at a temperature of 980 °C. Lifetimes at 980 °C and 100 MPa are extrapolated by assuming a strain to failure of 10% and a constant strain rate throughout the sample lifetime.
AlloyNorton ExponentStress σ in MPa to Reach a Steady-State Strain Rate of 10−7 s−1 Log 10 ( ε 0 ˙ in   s 1 )   at   100   MPa Extrapolated Life Time
Ni5.27.5−1.22 s
CrCoNi5.822−3.23 min
Cantor5.18.4−1.53 s
MatrixCMSX-36.118−2.532 s
MatrixCMSX-45.630−4.121 min
CMSX-36.6210−9.14 years
CMSX-412.5260−12.3>6000 years
Table 6. Different contributions to the internal back stress in a Ni-based superalloy with high volume fraction of γ′ phase. Estimations have been obtained with: α = 1, G = E = 100 GPa, b = a 110 / 2 = 250   pm , ρ = 1014   m 2 , L = 50 nm, δ   = 2.2 × 10 3 [36,37], E APB = 0.15   J · m 2 [41,42].
Stress TypeEstimated Internal Back Stress ContributionLateral ExtensionLocationRemarks
solid solution strengtheningw, f0 unknown and r−3 dependencevery short range~r−3matrixalways active during plastic deformation as long as a continuous matrix exists
dislocation density250 MPaconst.matrixvaries strongly locally, in exchange with misfit stress
misfit220 MPaconst.matrixvaries strongly locally on two different length scales, in exchange with dislocation density, can be negative
Orowan500 MPaconst.matrixreduced during creep if coarsening occurs, increases with increasing dislocation density (apparent smaller separation of γ′ phase)
cutting600 MPaconst.γ′ phaseconstant within γ′ phase
Publisher’s Note: MDPI stays neutral with regard to jurisdictional claims in published maps and institutional affiliations.

