
Influence of Cutting Speed in Turning and Force in Subsequent Diamond Smoothing on Magnetic Properties of Steel 100Cr6

 ,
,
Abstract
:1. Introduction
2. Materials and Methods
3. Results
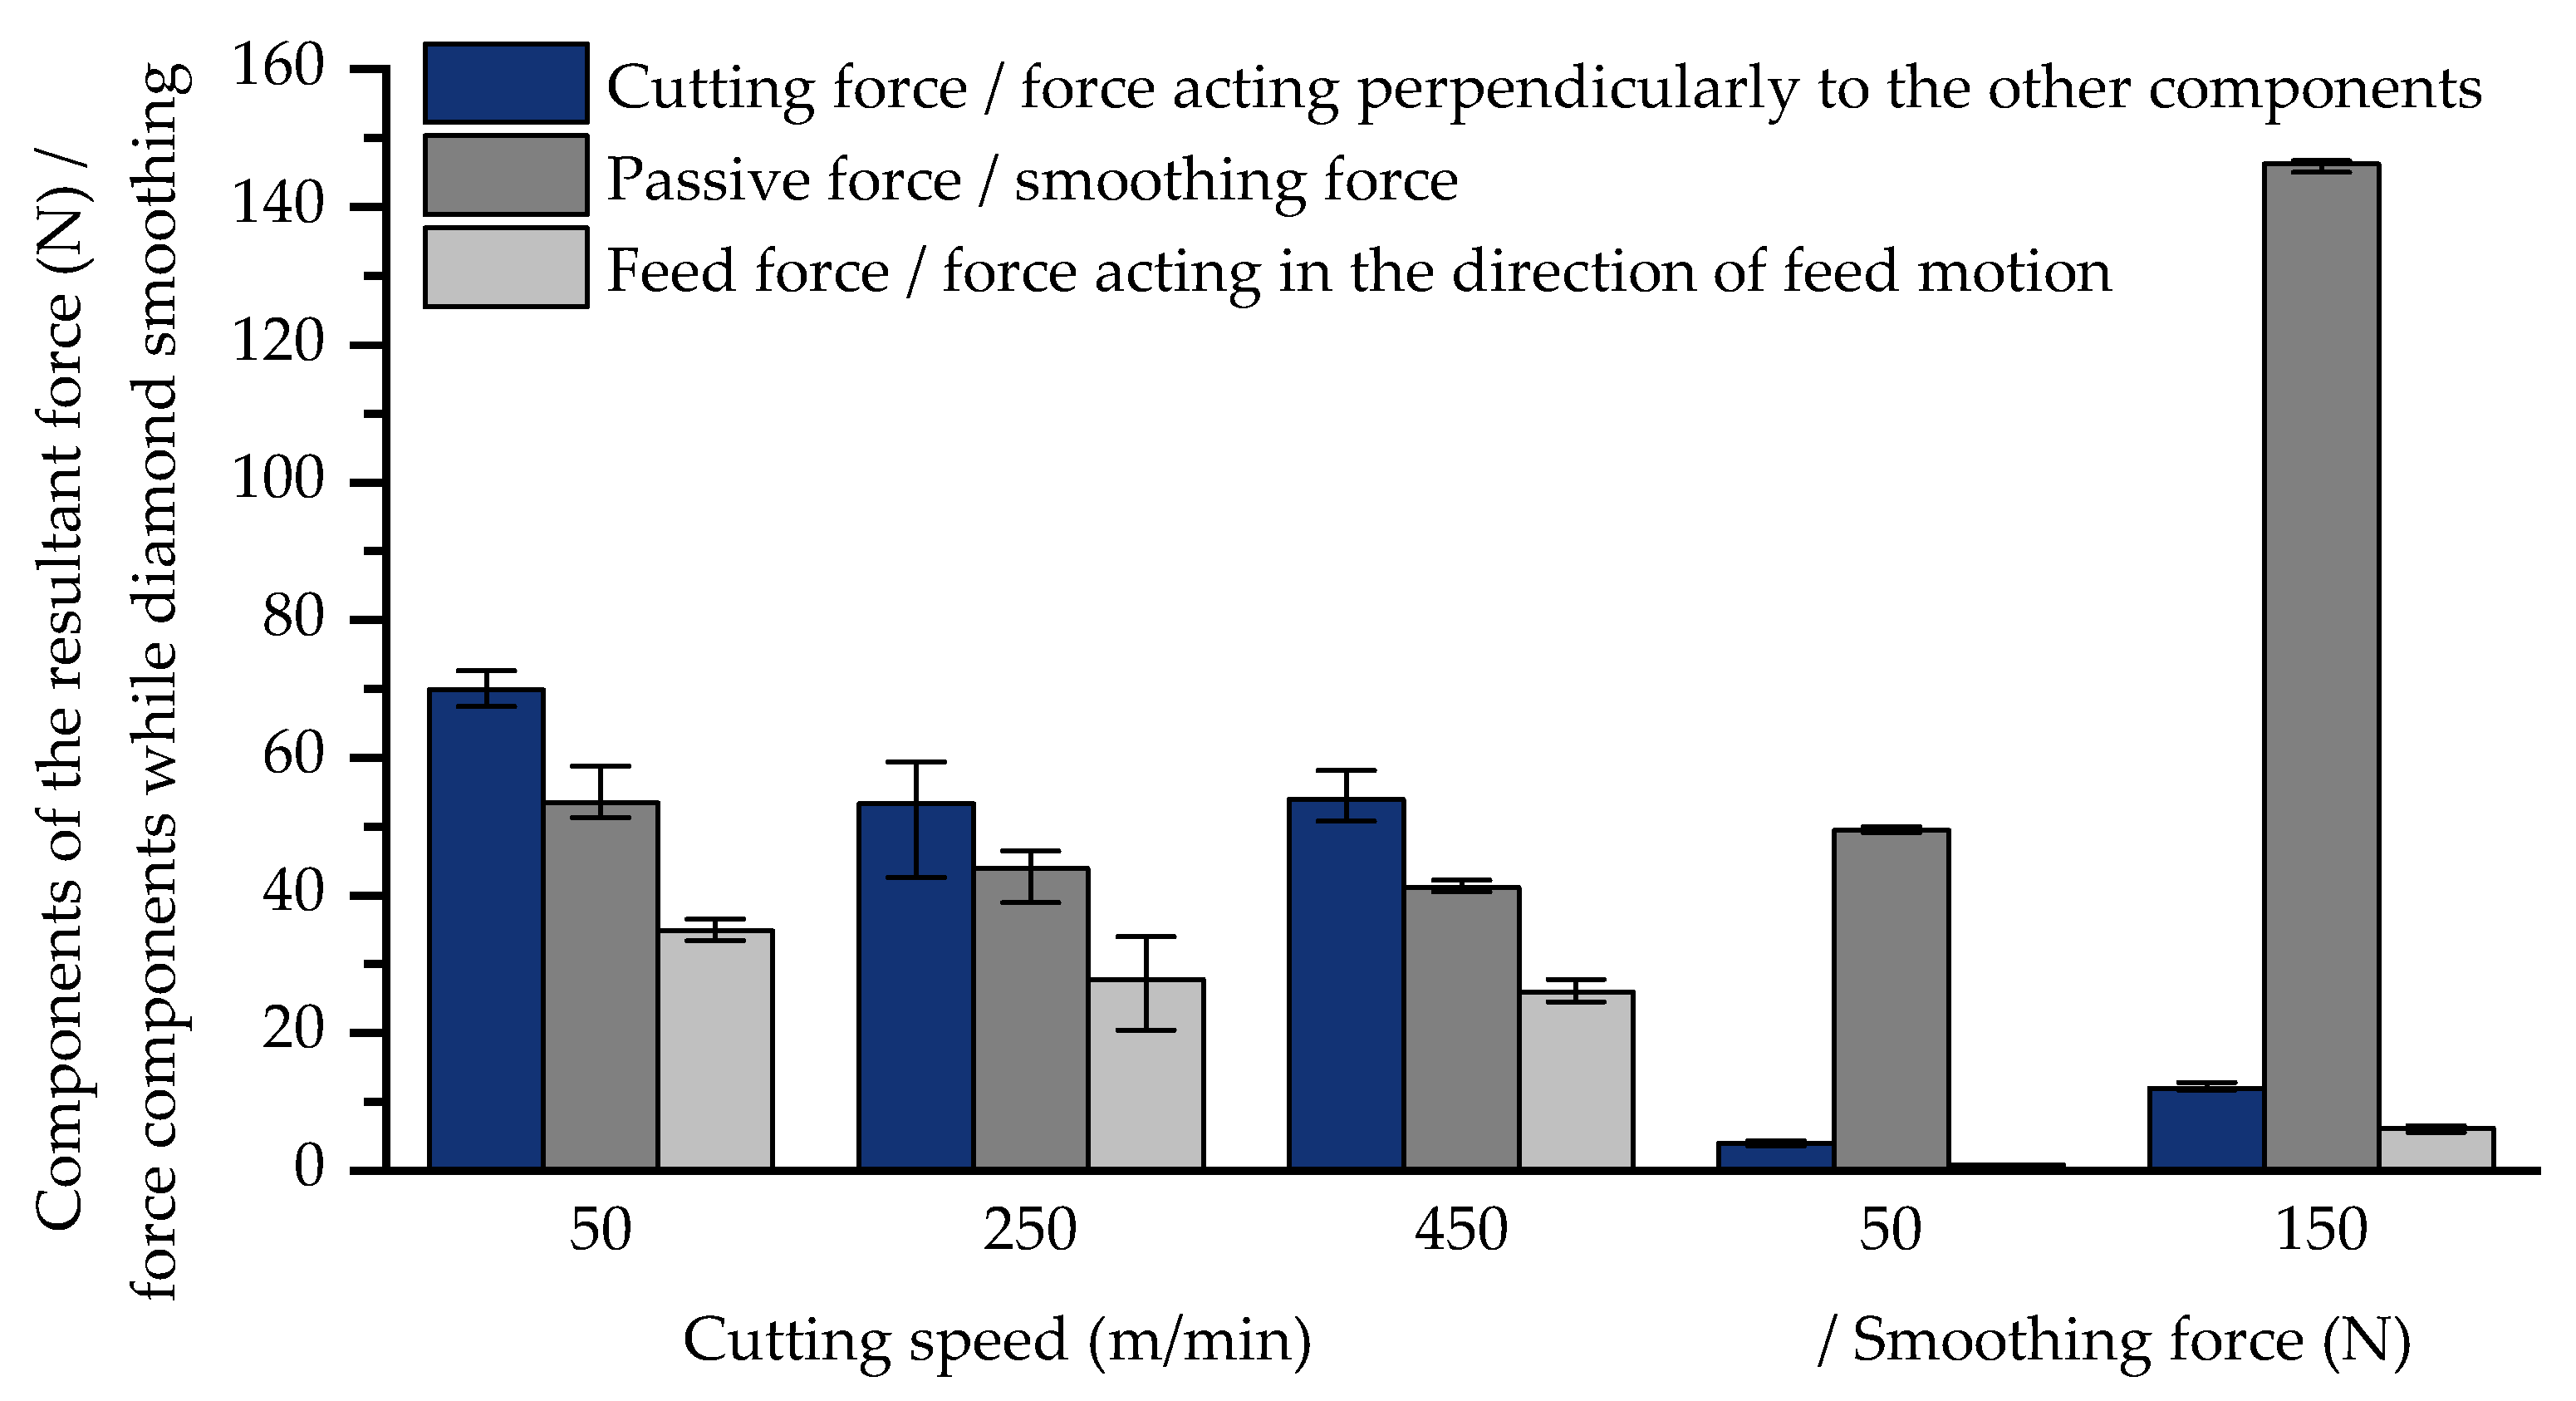
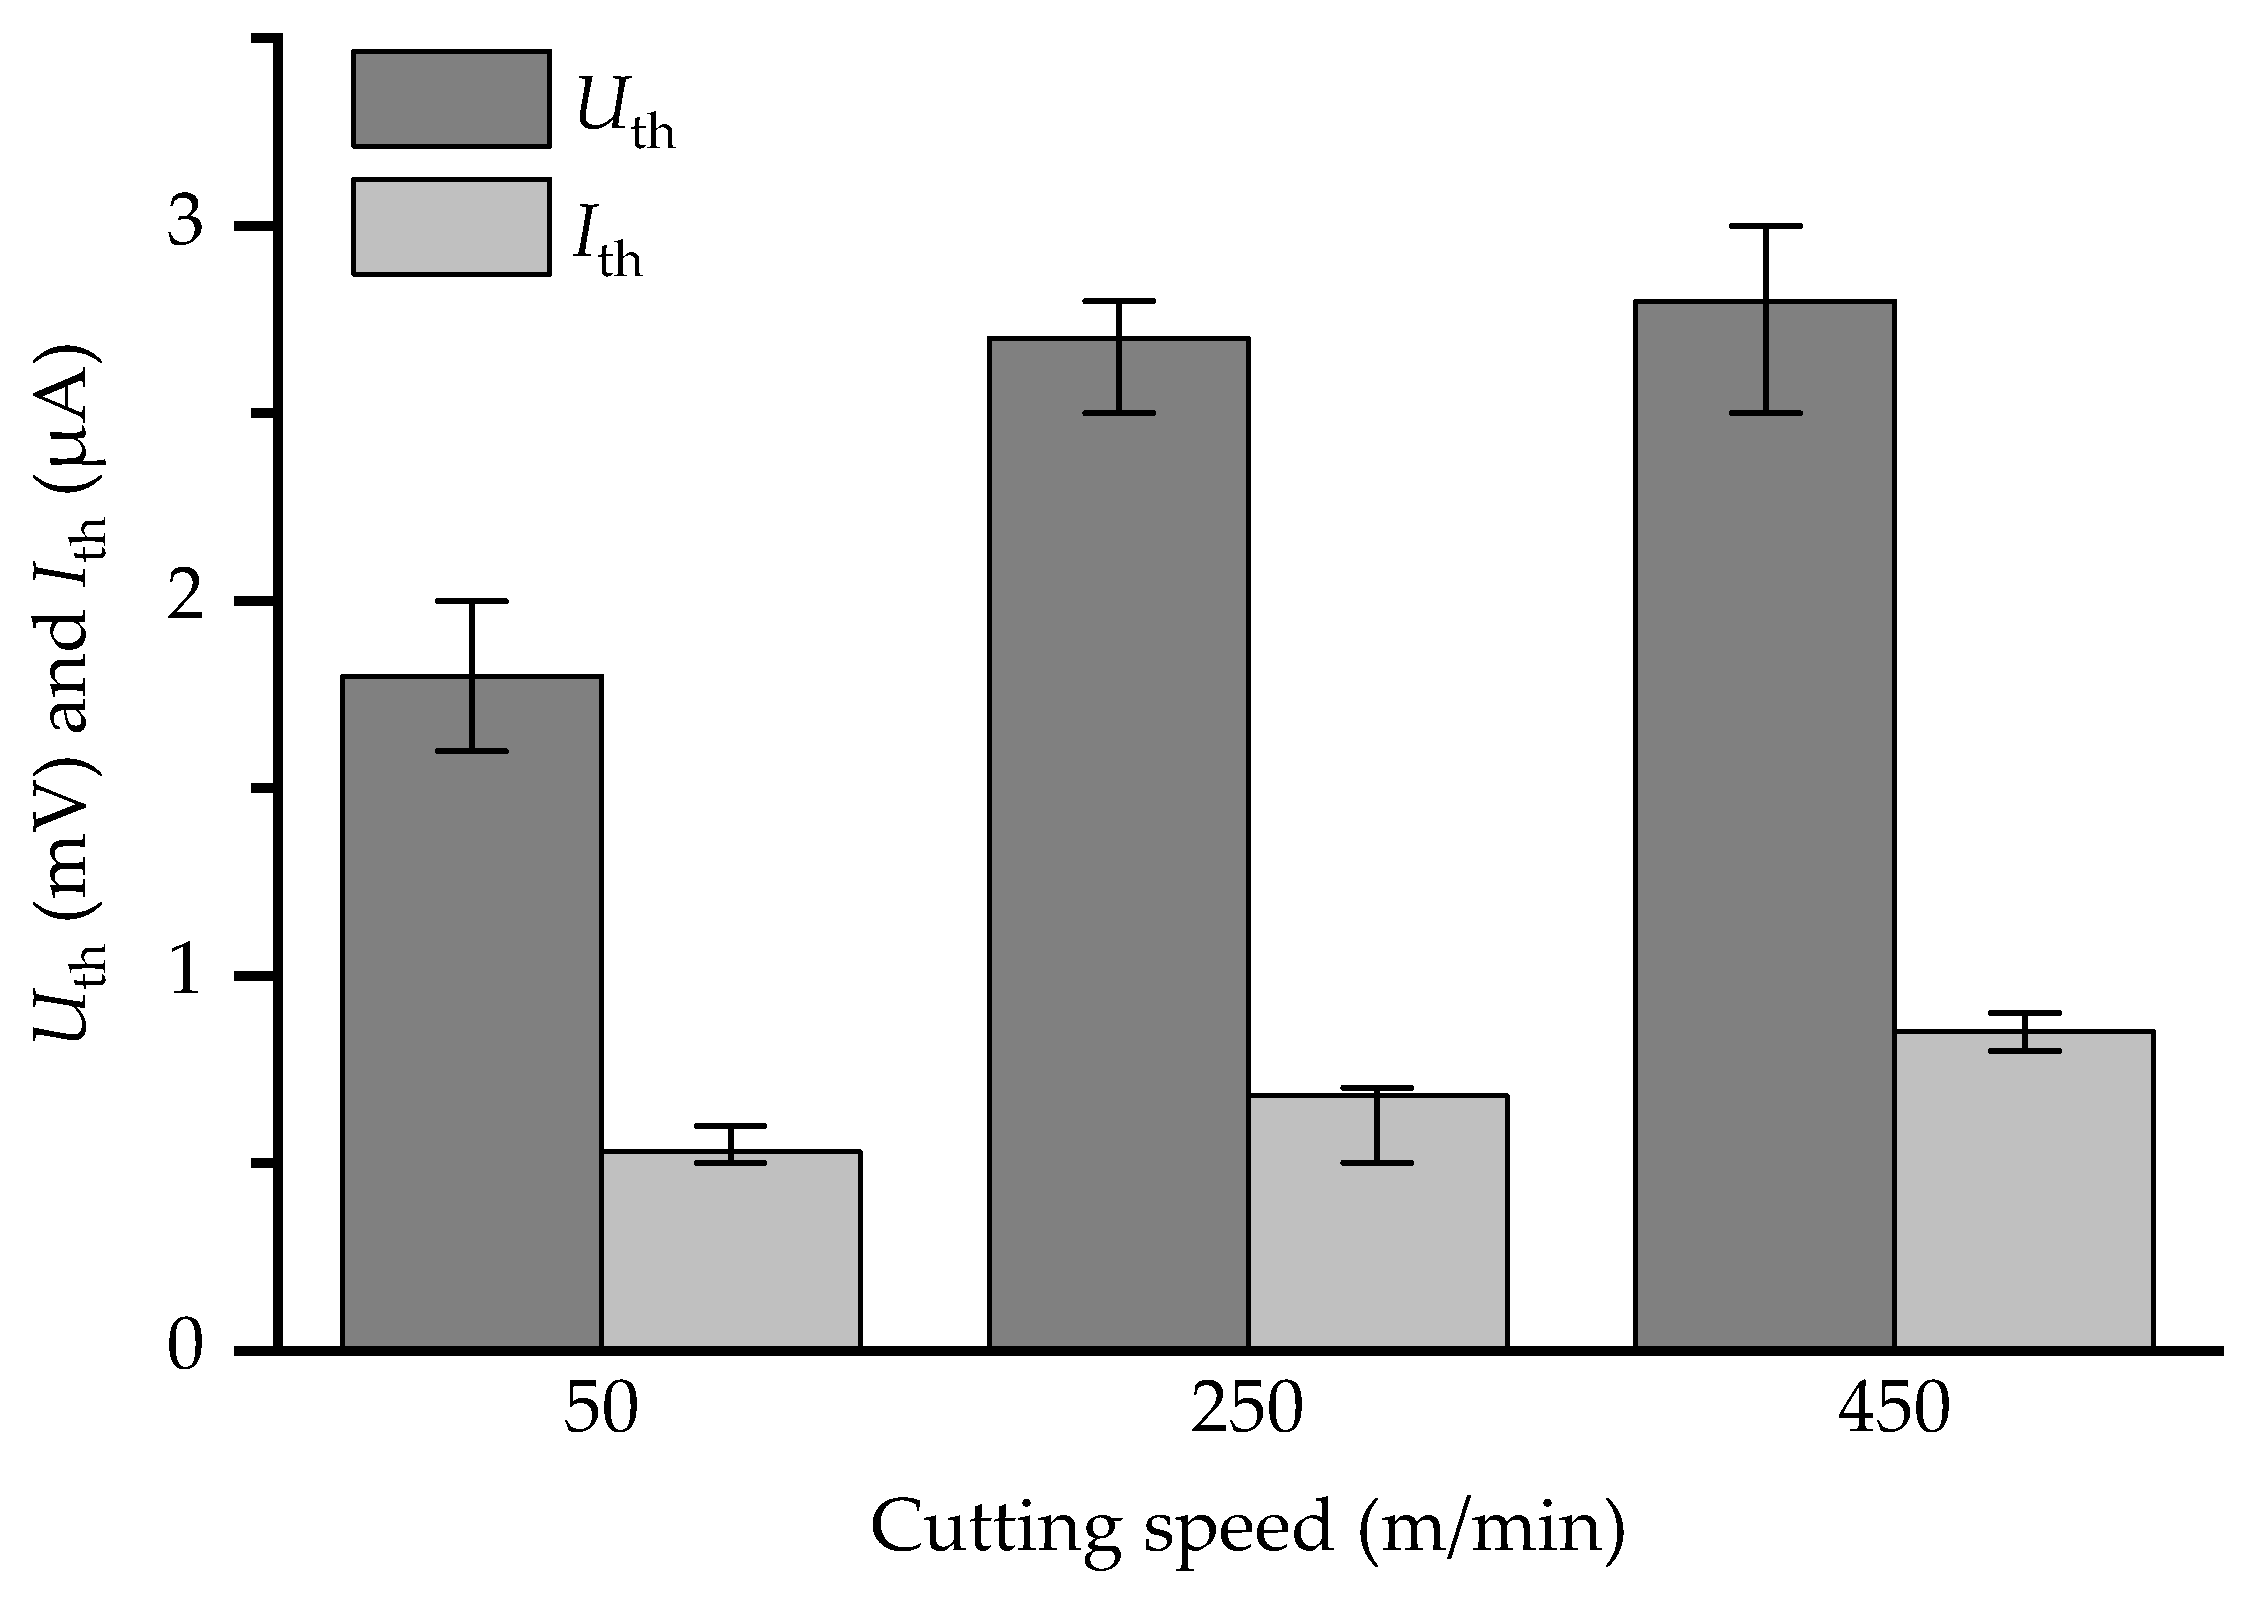
3.1. In-Process Measurements
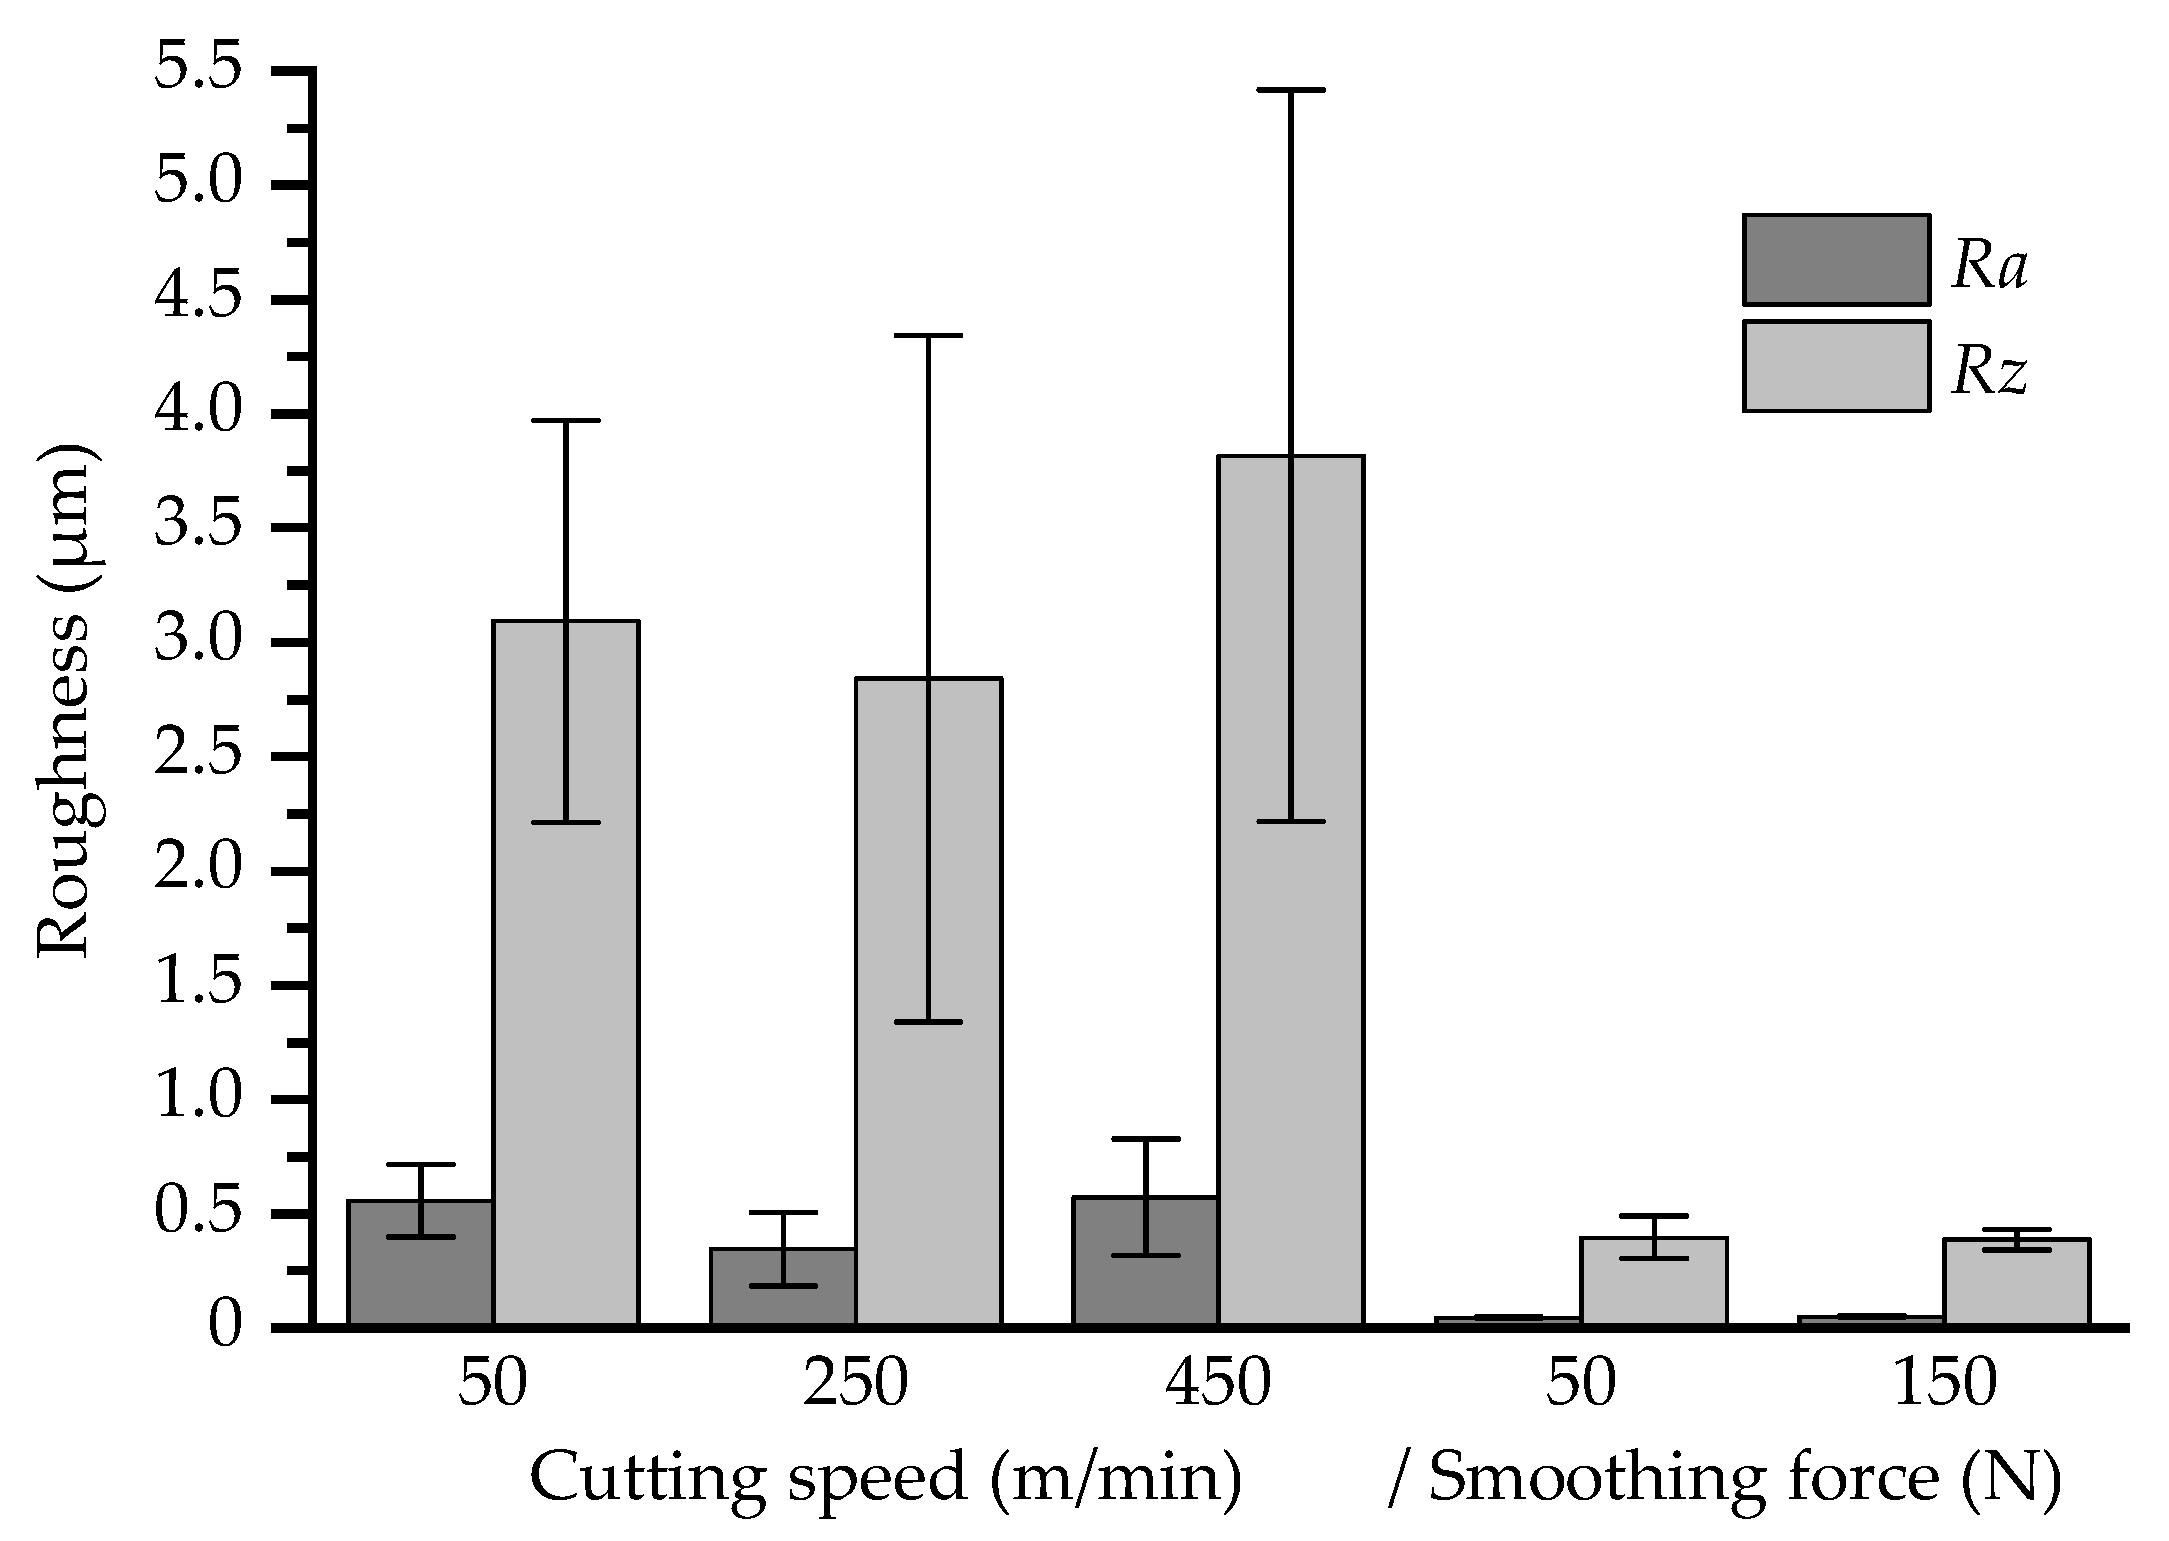
3.2. Geometrical Surface Properties
3.3. Magnetic Characterization and the Impact of Machining
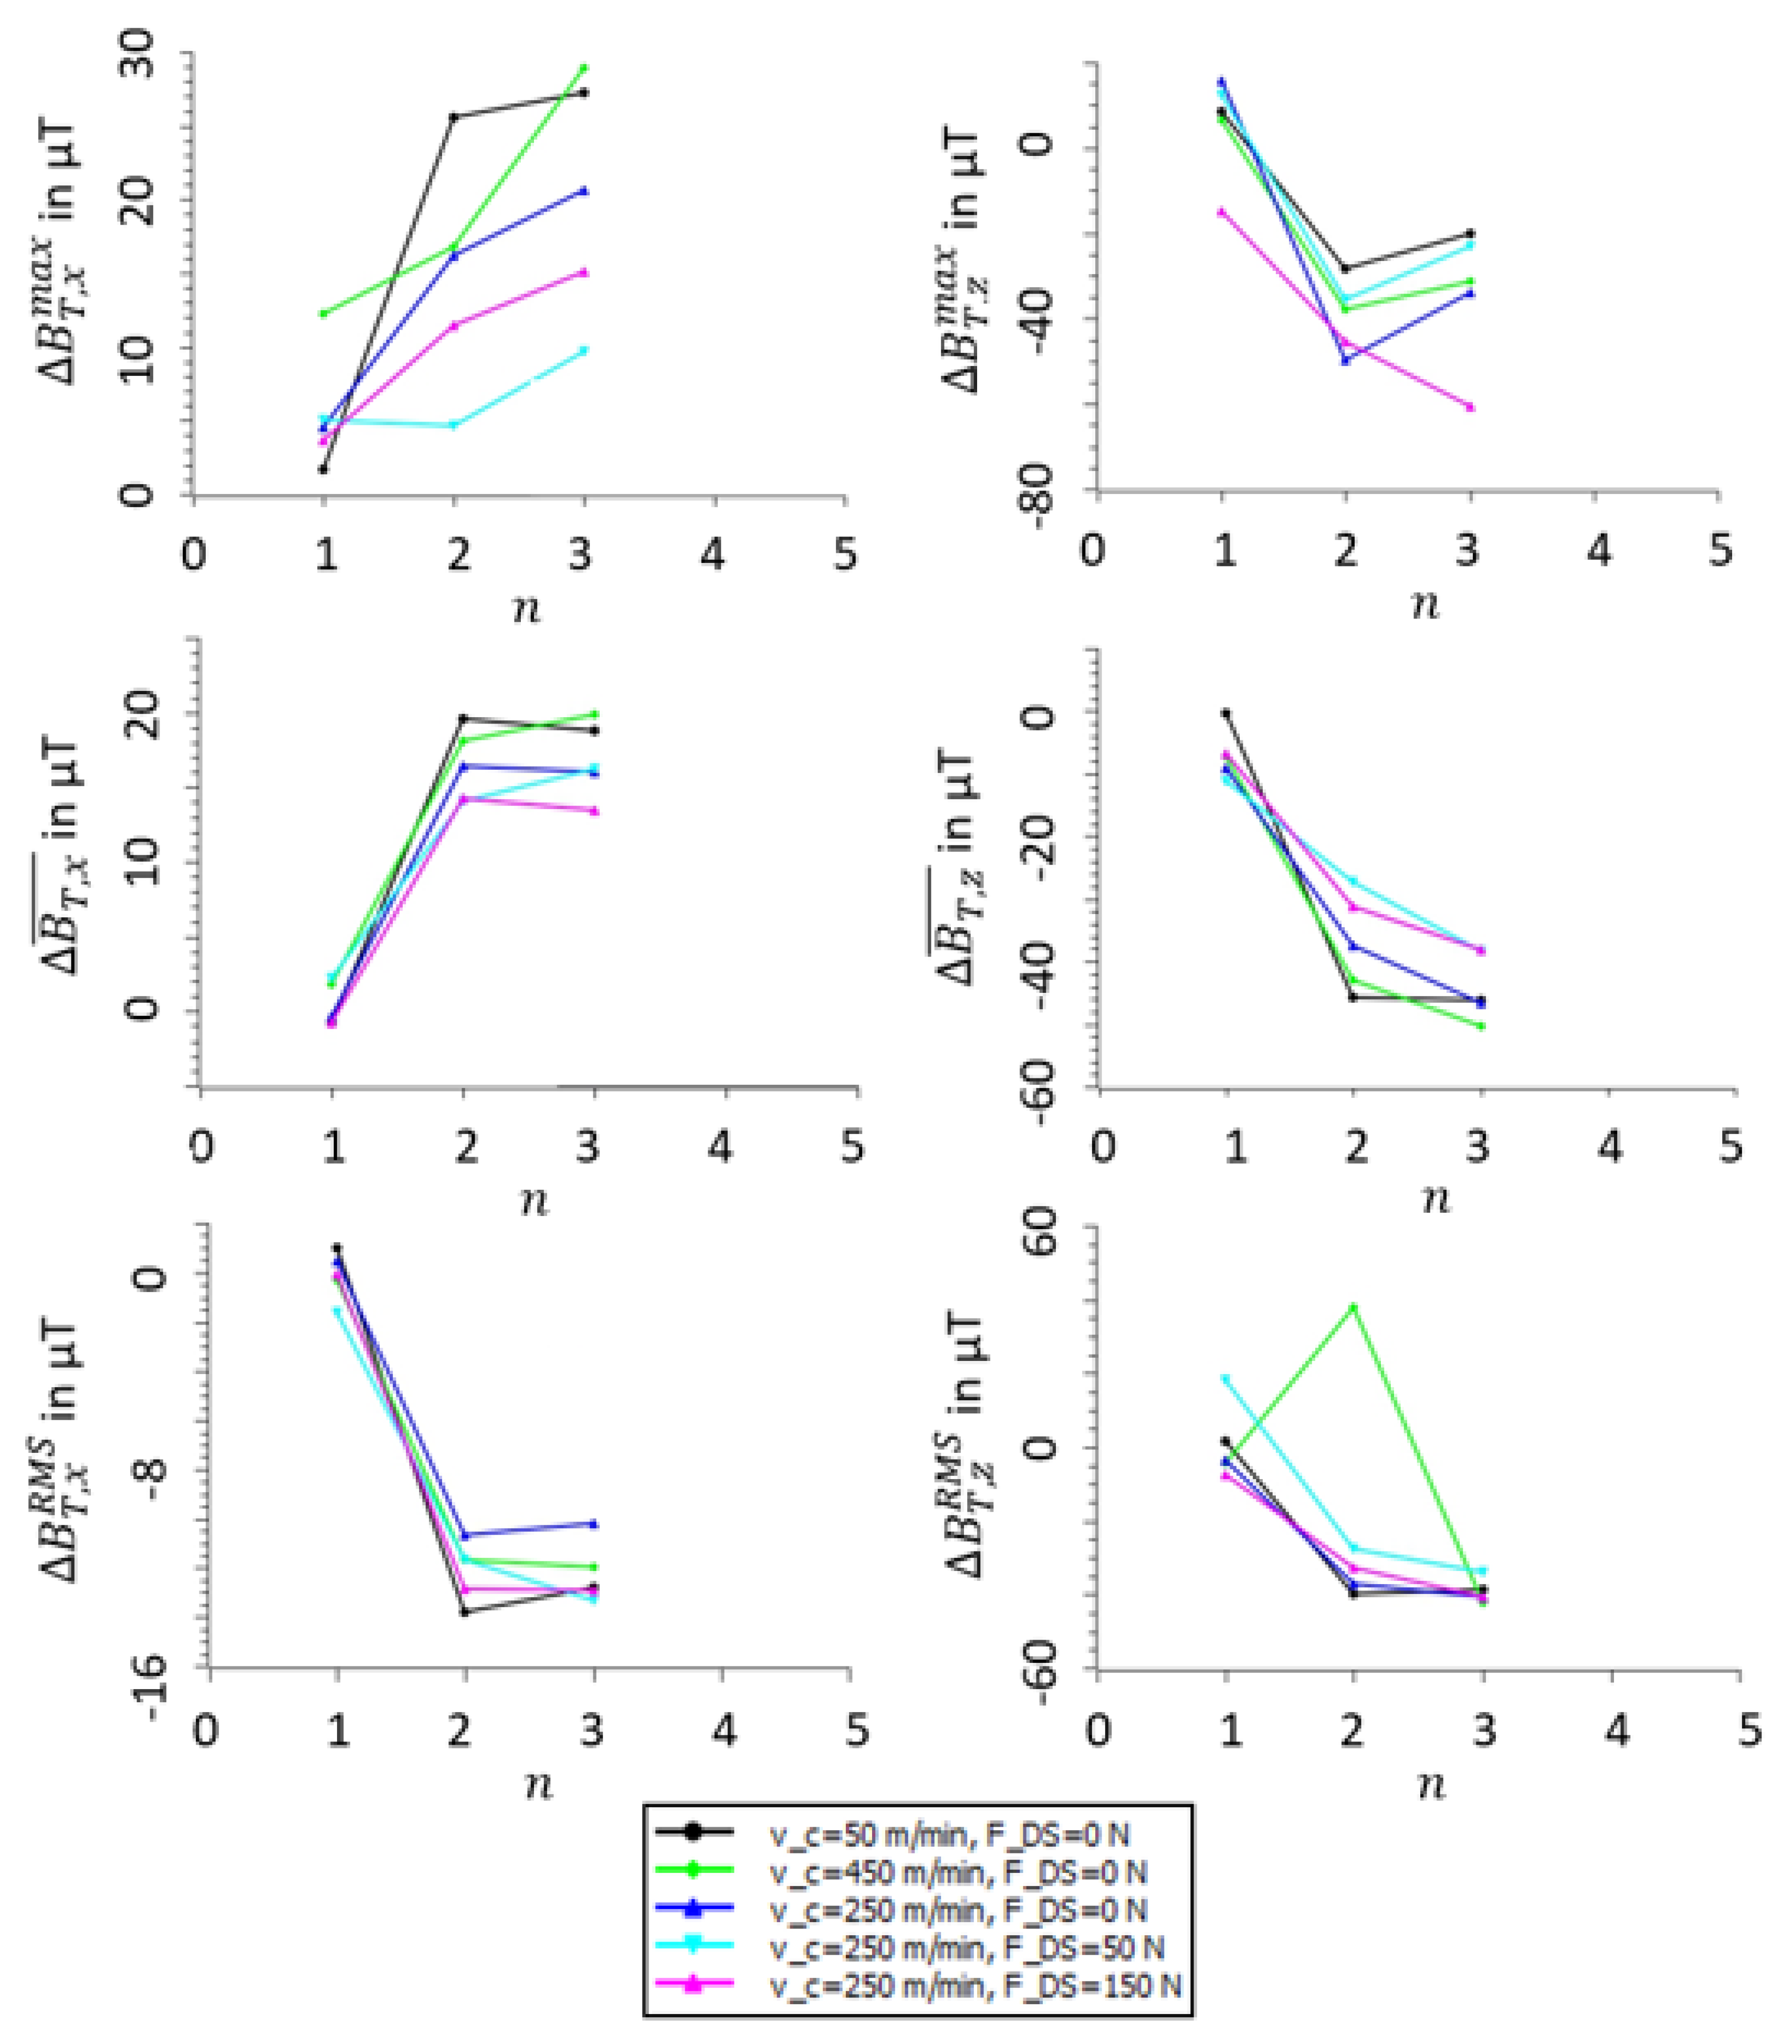
3.4. The Impact of Transport and Storage
3.5. Linkage between Results
4. Conclusions and Future Work
- Whether machining or transport have a bigger impact on magnetic properties depends on the regarded characteristics. SHPM analyses have shown that machining, storage, and transport influence some characteristics of magnetic leakage flux differently. In some cases, machining predominates transport and storage. In other cases, it is the other way around.
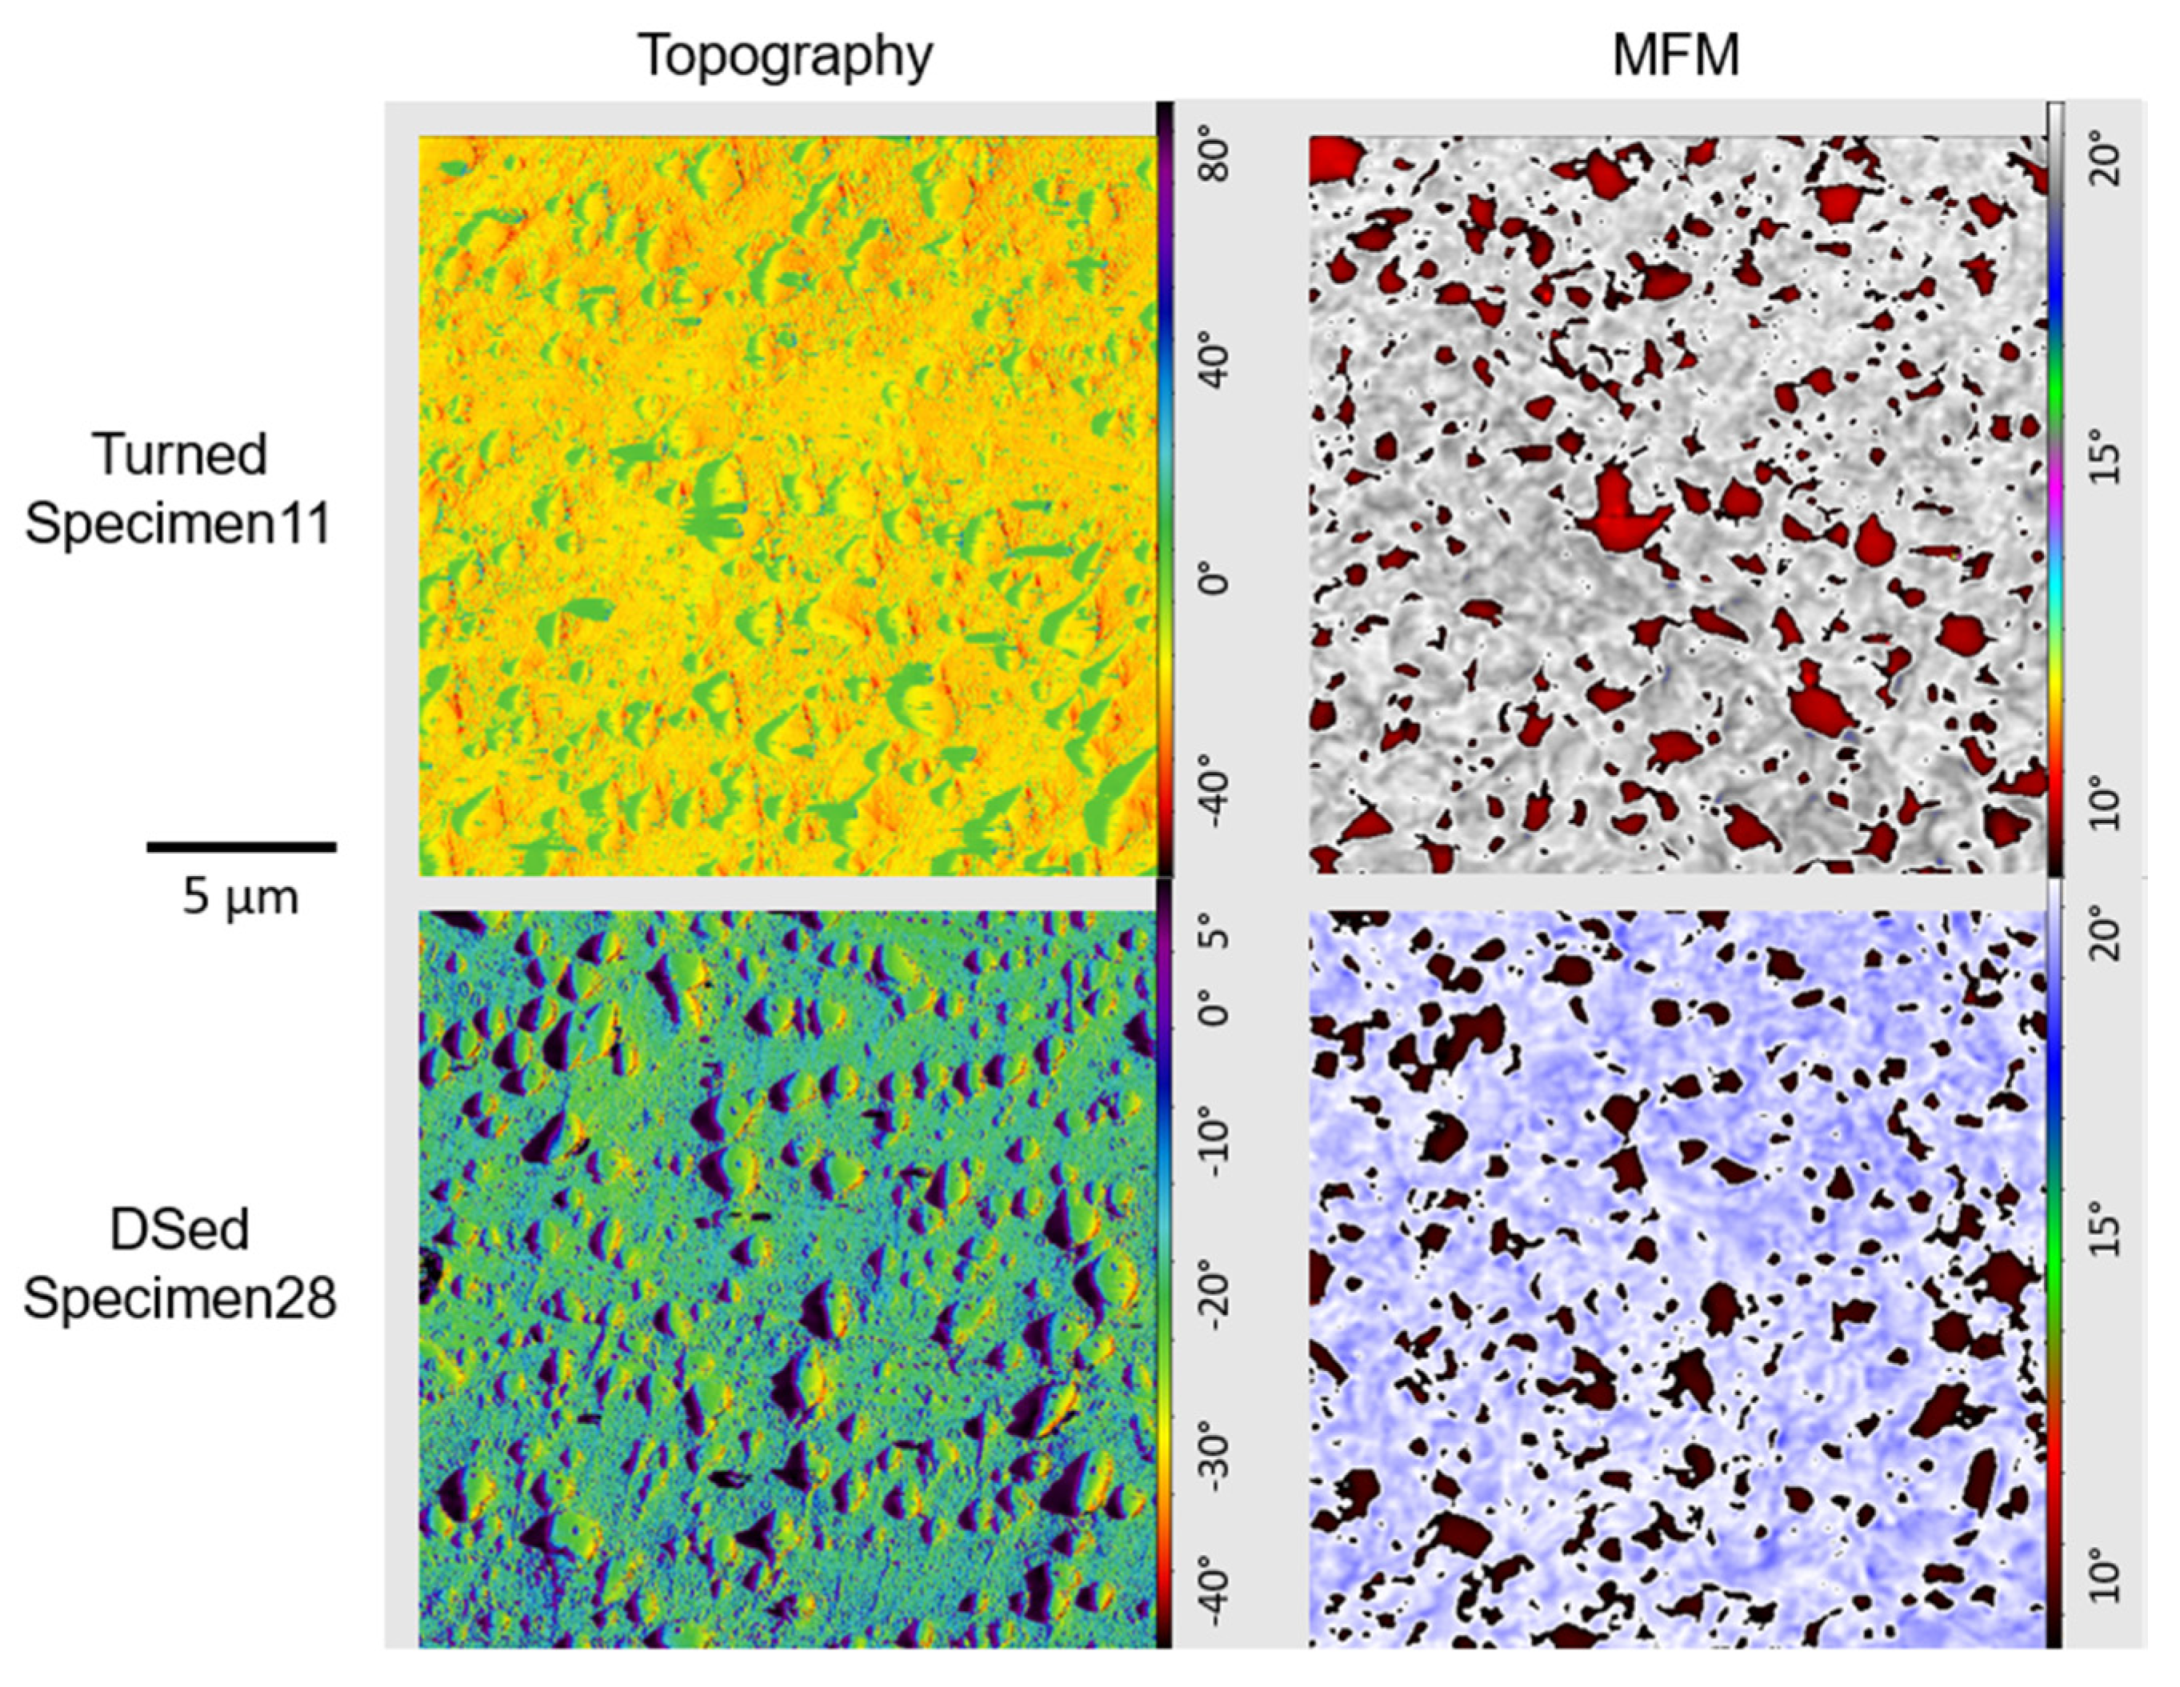
- MFM contributes to a microstructural assessment but does not display magnetic domains on the inspectable scale.
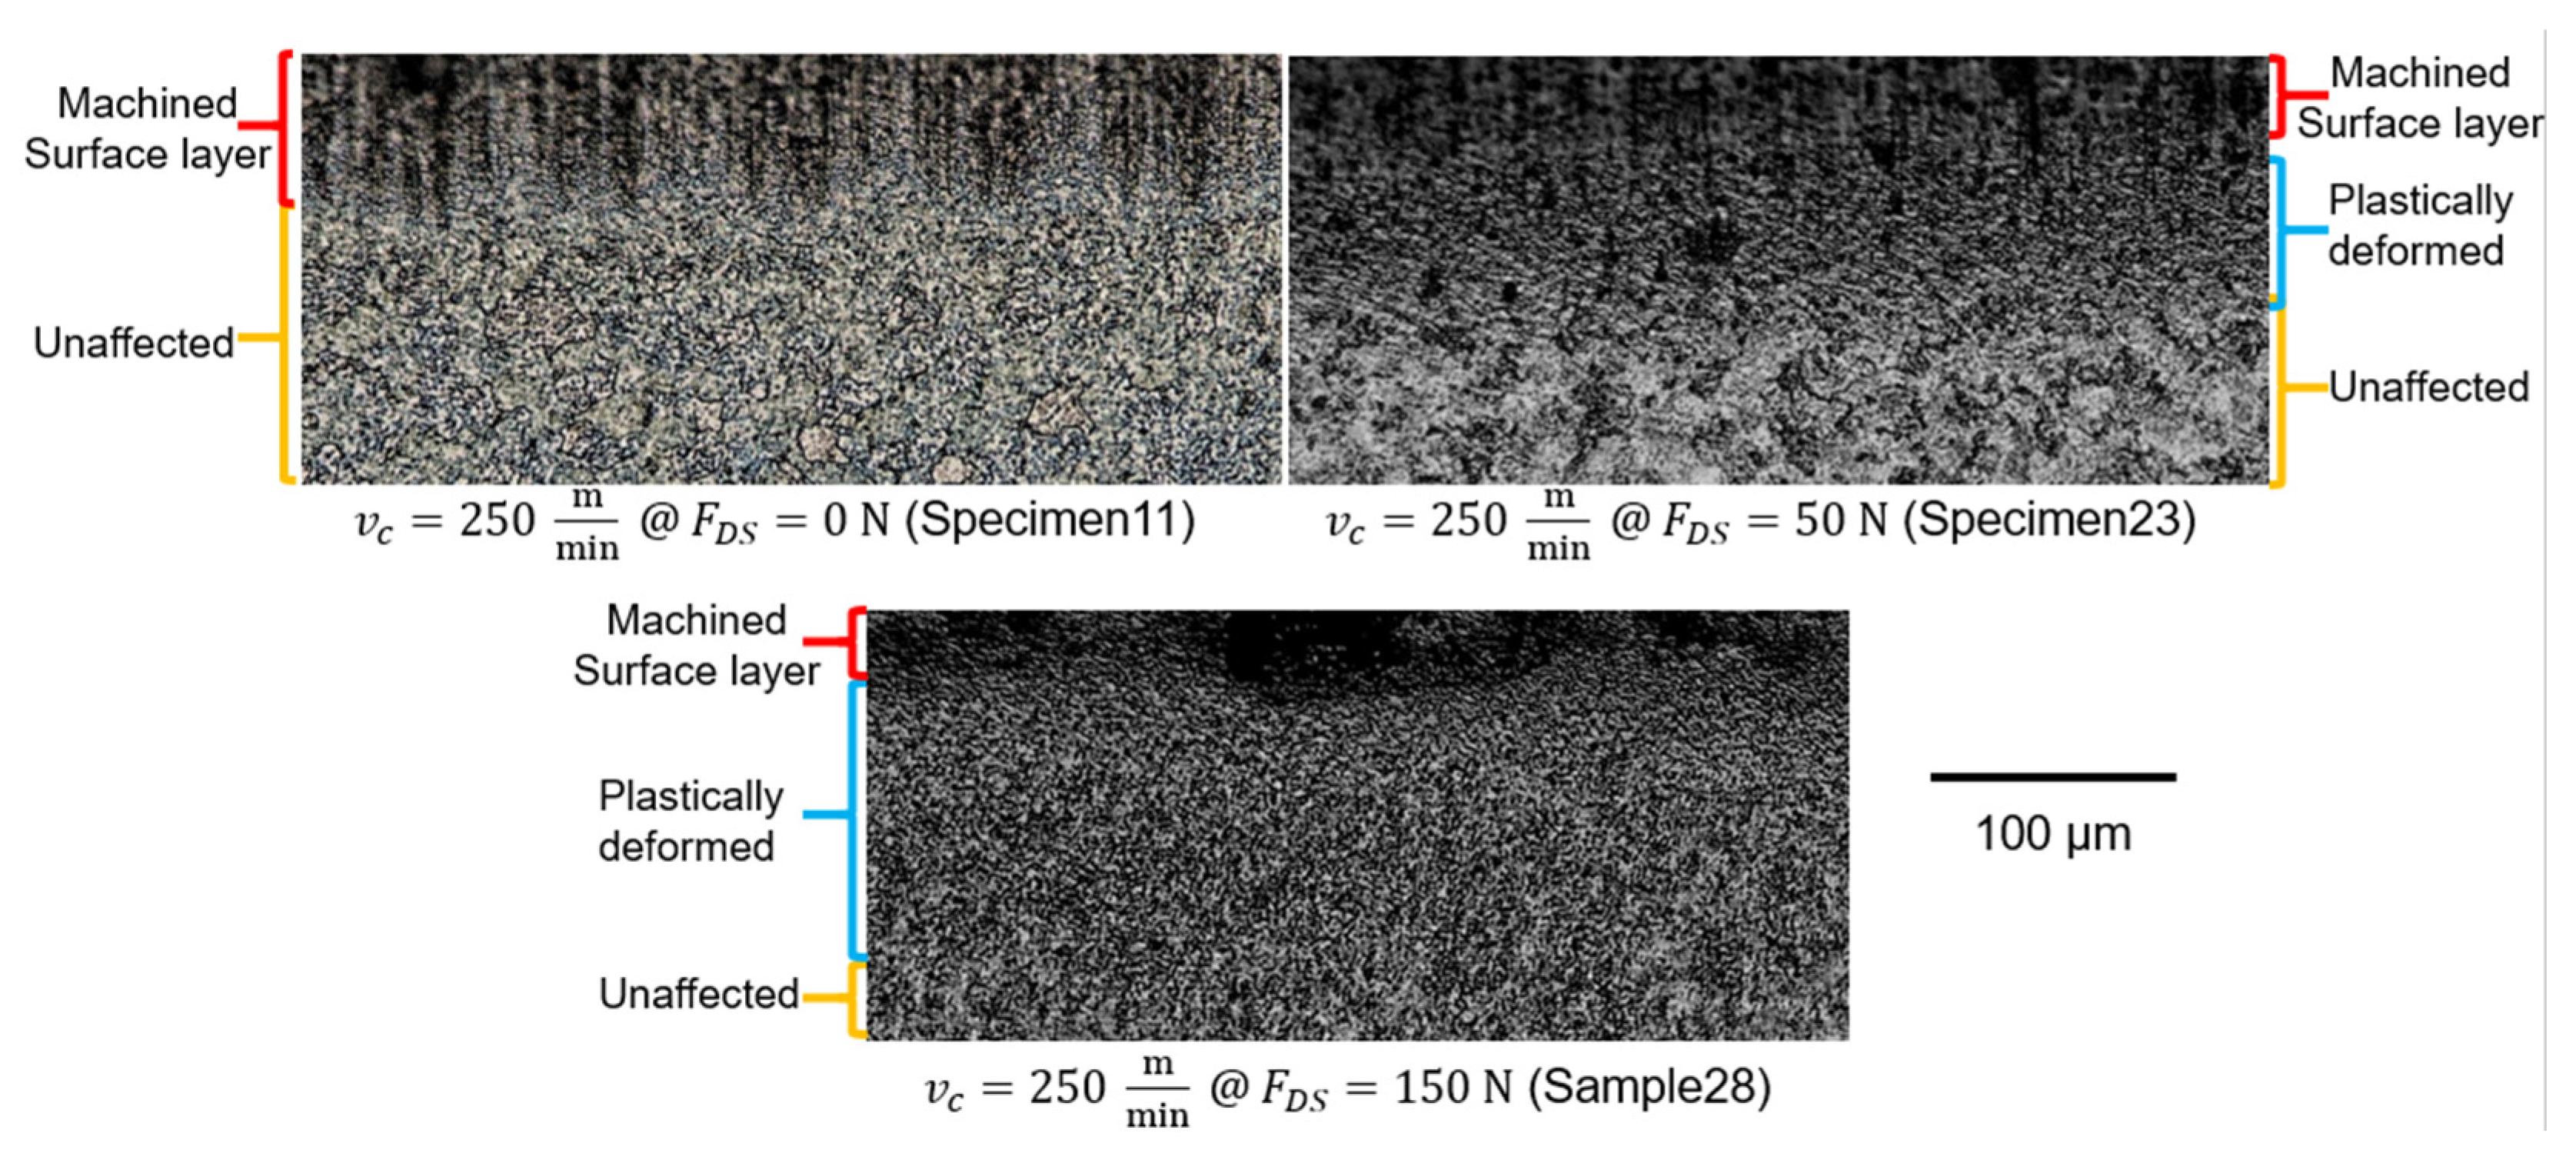
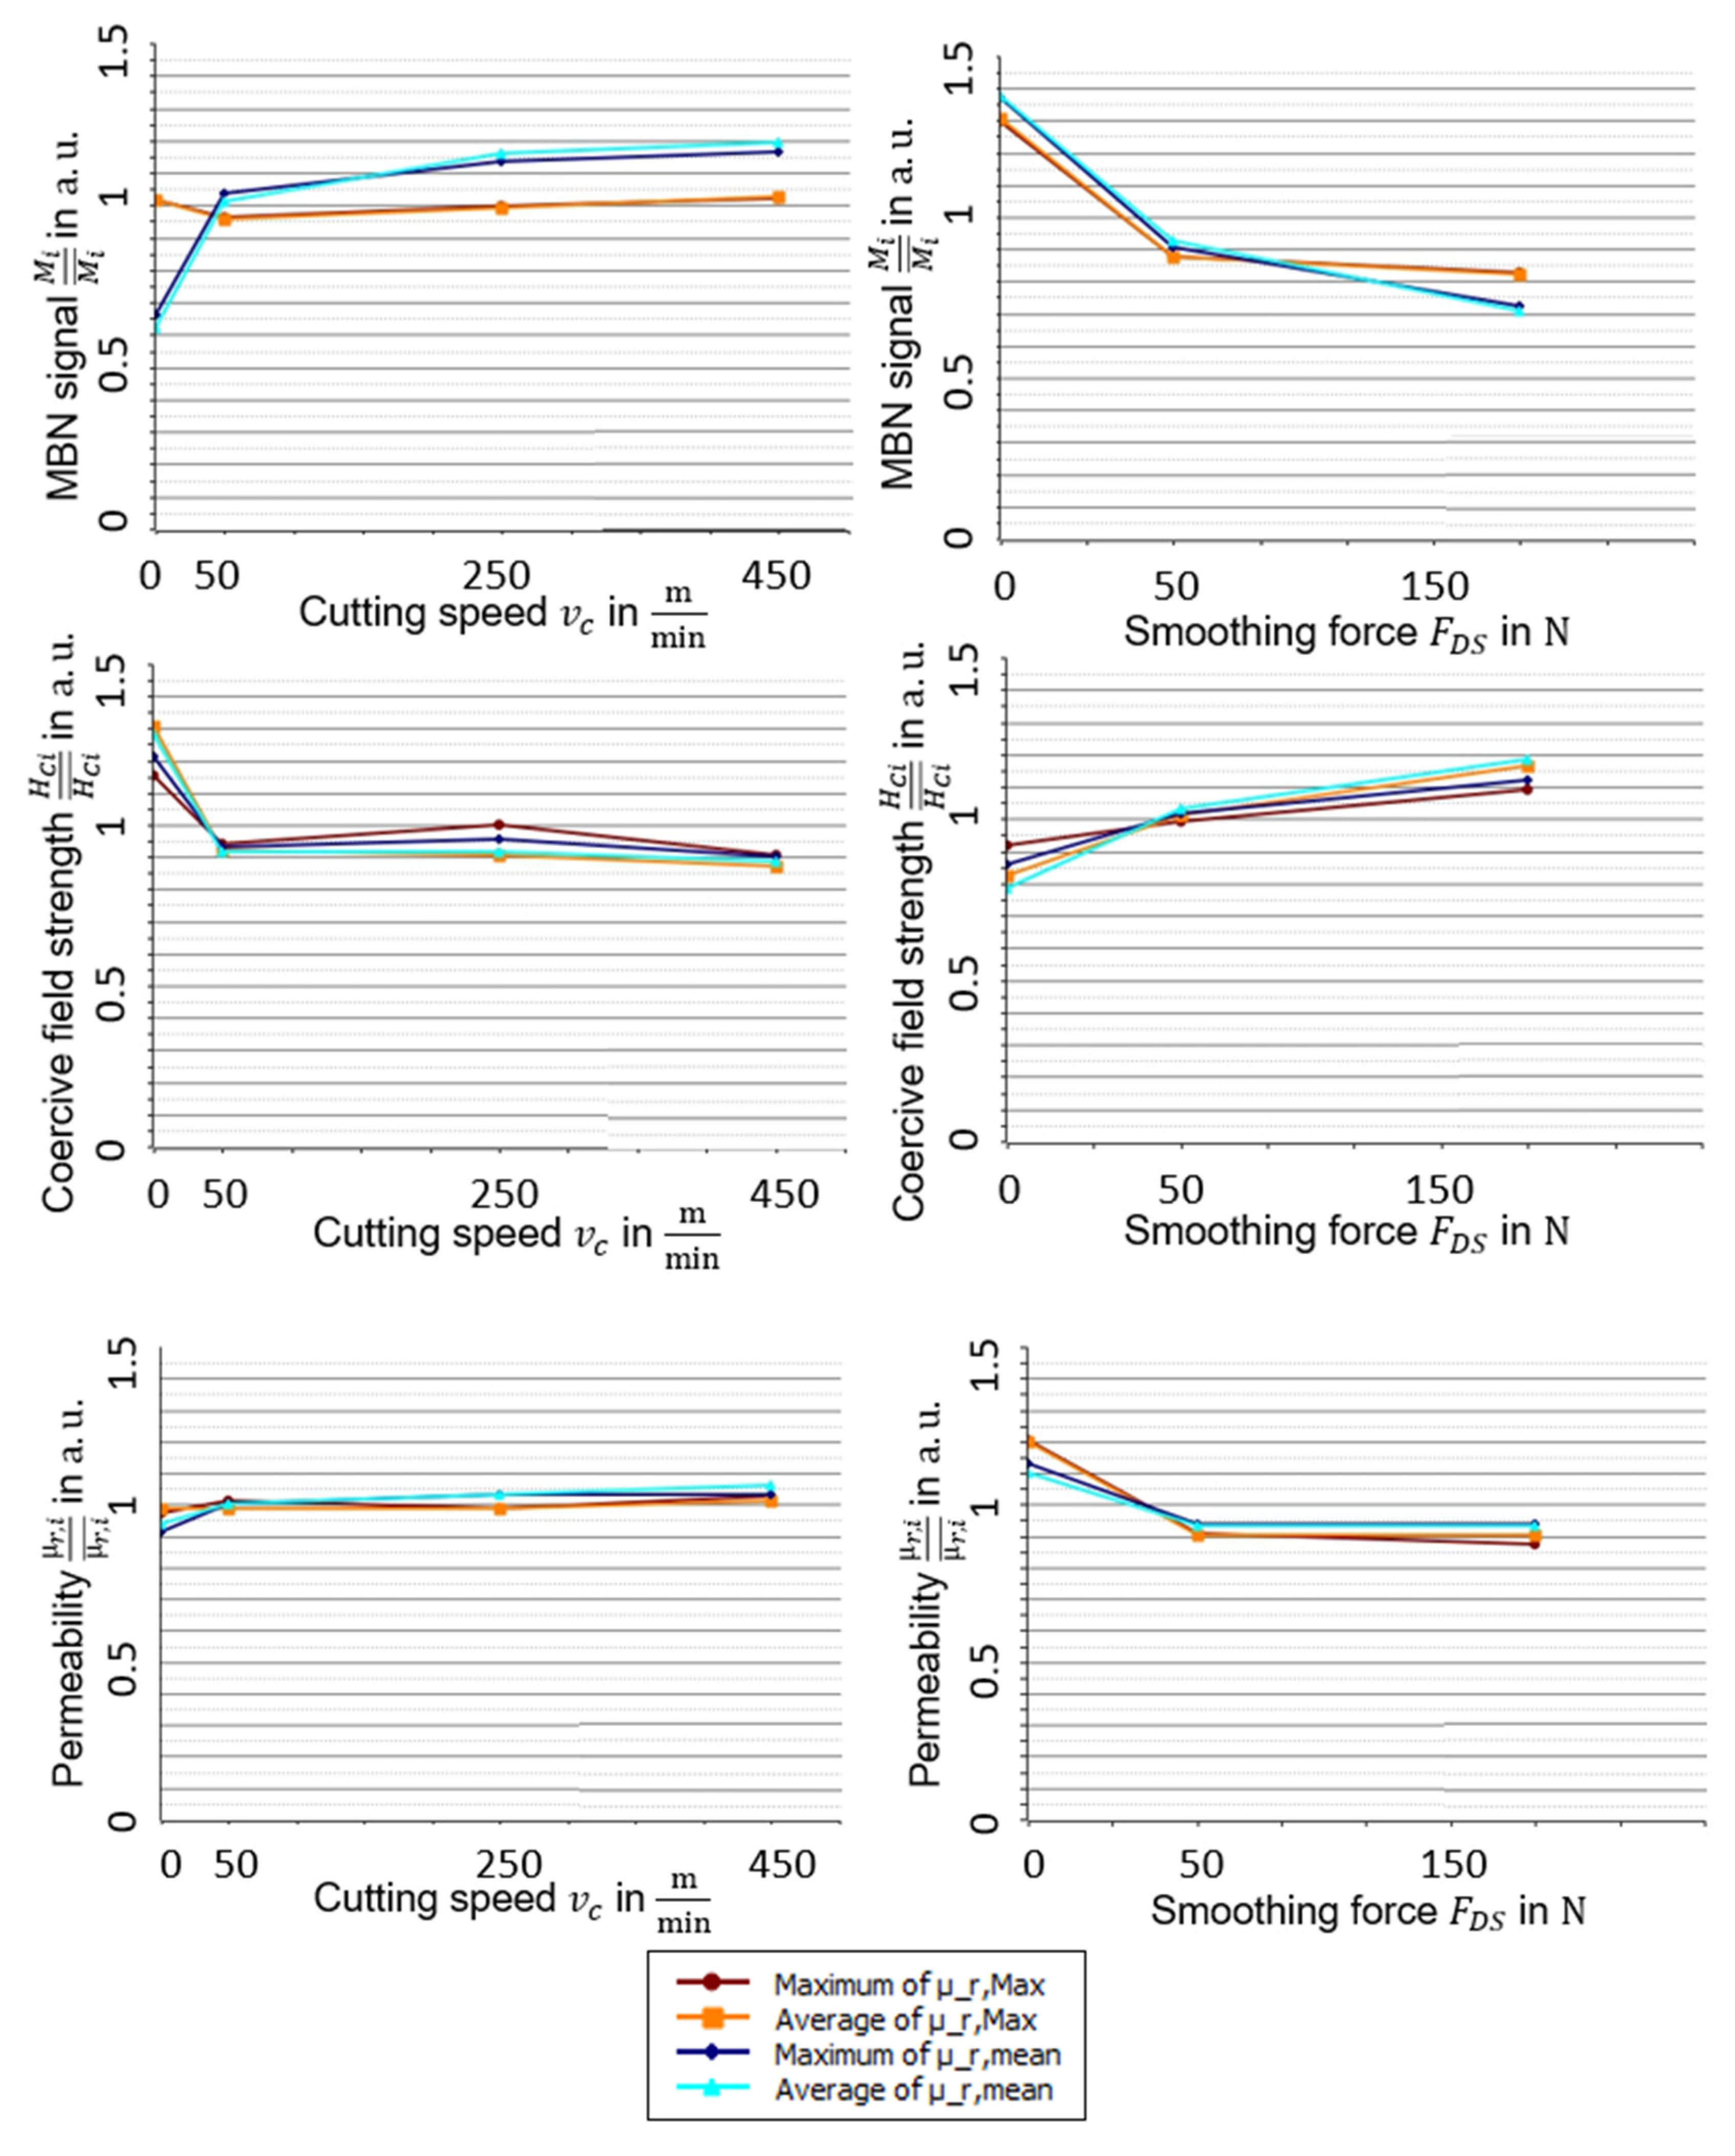
- Diamond smoothing seems to provoke magnetic hardening of the specimens, whereas turning has an effect tending towards magnetic softening. Loading conditions possibly cause variations in magnetic properties, even if their magnitude can be regarded secondary. An alternative explanation would be that DS causes magnetic hardening due to cold working mechanisms.
- Turning causes bigger changes in the magnetic leakage flux state than DS does, but DS cannot be considered in isolation, because turning is always the pre-process. Machining demagnetized specimens, and repetition of the same experiments might clarify this issue.
- Transport tends to demagnetize the specimens, and only maxima can be affected in different ways. Consequently, magnetic homogeneity is reduced, or at least changed.
- Storage has a much smaller impact than transport. Its effect leads to a demagnetization, where positive and negative leakage flux values slowly head towards zero, but the effect is so weak that there is no relevance in that.
- Correlations showed the impact of machining parameters on magnetic properties. Non-magnetic properties such as grain size also seem to be linked to magnetic ones. Machining forces and temperatures influence the magnetic state of a specimen. Residual stress state depends less on other properties, especially in the case of turning. In DS, residual stress correlates with nearly every other characteristic, except for the shear stresses in the direction of the feed motion. Magnetic properties are linked to each other, even if they are acquired by different methods, so correlations contribute to a coherent and consistent view on the whole system.
- All in all, the existence of a degree of deformation caused by machining techniques seems possible. Plastic deformations of different magnitudes within a surface layer could explain the trends in magnetic and general property changes. There is a need for experimental verification in further experiments.
Author Contributions
Funding
Institutional Review Board Statement
Informed Consent Statement
Data Availability Statement
Acknowledgments
Conflicts of Interest
References
- Clapham, L.; Jagadish, C.; Atherton, D.; Boyd, J. The influence of controlled rolling on the pulse height distribution of magnetic Barkhausen noise in steel. Mater. Sci. Eng. A. 1991, 145, 233–241. [Google Scholar] [CrossRef]
- Trapp, K.; Herter, F.; Bähre, D. Magnetic Property Changes by Machining Ferromagnetic Materials. Procedia CIRP 2016, 46, 250–253. [Google Scholar] [CrossRef] [Green Version]
- Trapp, K.; Käfer, L.; Bähre, D. Effects of Machining Ferromagnetic Materials on Magnetic Property Changes. In Proceedings of the 43rd North American Manufacturing Research (NAMRC 43), Charlotte, NC, USA, 8–12 June 2015; pp. 721–727. [Google Scholar] [CrossRef] [Green Version]
- Tekkaya, A.; Allwood, J.; Bariani, P.; Bruschi, S.; Cao, J.; Gramlich, S.; Groche, P.; Hirt, G.; Ishikawa, T.; Löbbe, C.; et al. Metal forming beyond shaping: Predicting and setting product properties. Ann. CIRP 2015, 64, 629–653. [Google Scholar] [CrossRef]
- Brinksmeier, E.; Meyer, D.; Heinzel, C.; Lübben, T.; Sölter, J.; Langenhorst, L.; Frerichs, F.; Kämmler, J.; Kohls, E.; Kuschel, S. Process Signatures-The Missing Link to Predict Surface Integrity in Machining. Procedia CIRP 2018, 71, 3–10. [Google Scholar] [CrossRef]
- Weiss, H.A.; Leuning, N.; Hameyer, K.; Hoffmann, H.; Volk, W. Manufacturing efficient electrical motors with a predictive maintenance approach. CIRP Ann. 2019, 68, 253–256. [Google Scholar] [CrossRef]
- Leuning, N.; Steentjes, S.; Hameyer, K. Effect of grain size and magnetic texture on iron-loss components in NO electrical steel at different frequencies. J. Magn. Magn. Mater. 2019, 469, 373–382. [Google Scholar] [CrossRef]
- Boehm, A.; Hahn, I. Influence of turning on the magnetic properties of electrical steel in the production of electrical machines. In Proceedings of the 2011 IEEE International Electric Machines & Drives Conference (IEMDC), Niagara Falls, ON, Canada, 14–17 May 2011; pp. 83–88. [Google Scholar]
- Senda, K.; Ishida, M.; Nakasu, Y.; Yagi, M. Influence of shearing process on domain structure and magnetic properties of non-oriented electrical steel. J. Magn. Mater. 2006, 304, 513–515. [Google Scholar] [CrossRef]
- Makar, J.M.; Tanner, B.K. The effect of plastic deformation and residual stress on the permeability and magnetostriction of steels. J. Magn. Magn. Mater. 2000, 222, 291–304. [Google Scholar] [CrossRef]
- Bao, S.; Liu, X.; Zhang, D. Variation of Residual Magnetic Field of Defective U75V Steel Subjected to Tensile Stress: Residual Magnetic Field of Defective U75V Steel under Tensile Stress. Strain 2015, 51, 370–378. [Google Scholar] [CrossRef]
- Honda, T.; Santos, E.C.; Kida, K. Scanning Hall probe microscopy of residual magnetic fields around plastic deformation of Vickers indentations in carbon tool steel (JIS, SKS93). Mech. Mater. 2014, 69, 262–269. [Google Scholar] [CrossRef]
- Čilliková, M.; Dubec, J.; Neslušan, M.; Mičietová, A.; Blažek, D. Magnetic Evaluation of Residual Stresses and Structure Transformations Induced in Soft Steel after Turning. Acta Phys. Pol. A. 2014, 126, 60–61. [Google Scholar] [CrossRef]
- Klocke, F. Manufacturing Processes 1: Cutting; Springer: Berlin/Heidelberg, Germany, 2011. [Google Scholar]
- Gorkunov, E.S.; Zadvorkin, S.M.; Kokovikhin, E.A.; Tueva, E.A.; Subachev, Y.V.; Goruleva, L.S.; Podkopytova, A.V. The effects of deformations by rolling and uniaxial tension on the structure and the magnetic and mechanical properties of armco iron, steel 12X18H10T, and a steel 12X18H10T-Armco Iron-Steel 12X18H10T composite material. Russ. J. Nondestruct. Test. 2011, 47, 369–380. [Google Scholar] [CrossRef]
- Baldo, S.; Mészáros, I. Effect of cold rolling on microstructure and magnetic properties in a metastable lean duplex stainless steel. J. Mater. Sci. 2010, 45, 5339–5346. [Google Scholar] [CrossRef]
- Roe, B.P. Probability and Statistics in the Physical Sciences; Springer International Publishing: Cham, Switzerland, 2020. [Google Scholar]


| Experiment Number | Turning | Diamond Smoothing | |
|---|---|---|---|
| Cutting Speed (M/Min) | Tool Number | Force (N) | |
| 1–3 | 50 | 1 | |
| 4–6 | 2 | ||
| 7–9 | 250 | 3 | |
| 10–12 | 4 | ||
| 13–15 | 450 | 5 | |
| 16–18 | 6 | ||
| 19–21 | 250 | 7 | 50 |
| 22–24 | 8 | ||
| 25–27 | 9 | 150 | |
| 28–30 | 10 | ||
| |BX| in µT | BZin µT | |
|---|---|---|
| Scale |  |  |
| Pristine material | 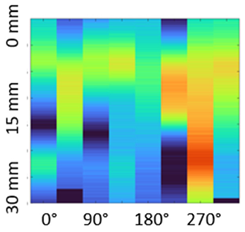 | 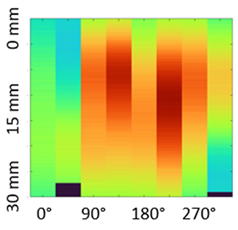 |
| vc= 250 m/min FDS = 0 N |  |  |
| vc= 250 m/min FDS = 150 N |  | 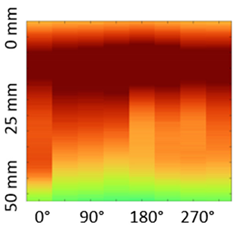 |
| Cutting Speed (M/Min) | DS Force (N) | Transport Cycles | ||||||
|---|---|---|---|---|---|---|---|---|
| 50 | 0 | 1 | 0.16 | −0.86 | 3.29 | 0.46 | −0.05 | 0.21 |
| 2 | −0.8 | −0.7 | −6.06 | −1.02 | 0.02 | −0.34 | ||
| 3 | −0.65 | −1.56 | −2.77 | −0.56 | −0.02 | −0.14 | ||
| 250 | 0 | 1 | 0.17 | −0.11 | −9.6 | 0.31 | −1.08 | −0.26 |
| 2 | −0.65 | −1.56 | −2.77 | −0.21 | −2.17 | −0.9 | ||
| 3 | 0.48 | 1.46 | 28 | 0.11 | −3.25 | −1.16 | ||
| 450 | 0 | 1 | 0.49 | 1.4 | −0.28 | 0.14 | −0.75 | −0.36 |
| 2 | 0.12 | 0.08 | −0.87 | −0.46 | −0.03 | −0.28 | ||
| 3 | 0.6 | 1.47 | −1.15 | −0.32 | −0.78 | −0.64 | ||
| 250 | 50 | 1 | −0.56 | −0.53 | −0.67 | −41.67 | −1.05 | −0.79 |
| 2 | −0.22 | −0.86 | −0.36 | 0.56 | 0.32 | 0.47 | ||
| 3 | 0.07 | −3.92 | −1.04 | 0.81 | −0.27 | 0.18 | ||
| 250 | 150 | 1 | −1.11 | 0.32 | −0.02 | −2.31 | −0.97 | −1.19 |
| 2 | 0.25 | 1.71 | −2.51 | 0.01 | 0.01 | 0.03 | ||
| 3 | 0.4 | 0.97 | −2.54 | −0.25 | −0.44 | −0.36 |
| Scale |  | |
| Pre-machined state | 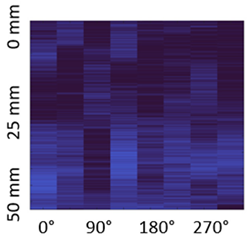 |  |
| vc= 250 m/min FDS = 0 N | 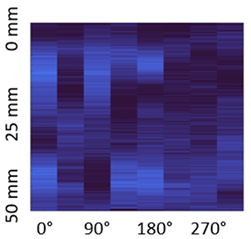 |  |
| vc= 250 m/min FDS = 150 N |  | 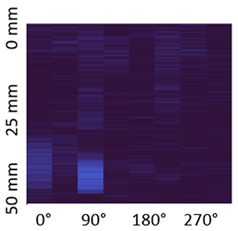 |
Publisher’s Note: MDPI stays neutral with regard to jurisdictional claims in published maps and institutional affiliations. |
© 2021 by the authors. Licensee MDPI, Basel, Switzerland. This article is an open access article distributed under the terms and conditions of the Creative Commons Attribution (CC BY) license (https://creativecommons.org/licenses/by/4.0/).
Share and Cite
Maurer, O.; Liborius, H.; Rauch, C.; Bähre, D.; Schubert, A. Influence of Cutting Speed in Turning and Force in Subsequent Diamond Smoothing on Magnetic Properties of Steel 100Cr6. Metals 2021, 11, 1131. https://doi.org/10.3390/met11071131
Maurer O, Liborius H, Rauch C, Bähre D, Schubert A. Influence of Cutting Speed in Turning and Force in Subsequent Diamond Smoothing on Magnetic Properties of Steel 100Cr6. Metals. 2021; 11(7):1131. https://doi.org/10.3390/met11071131
Chicago/Turabian StyleMaurer, Oliver, Hendrik Liborius, Christiane Rauch, Dirk Bähre, and Andreas Schubert. 2021. "Influence of Cutting Speed in Turning and Force in Subsequent Diamond Smoothing on Magnetic Properties of Steel 100Cr6" Metals 11, no. 7: 1131. https://doi.org/10.3390/met11071131
APA StyleMaurer, O., Liborius, H., Rauch, C., Bähre, D., & Schubert, A. (2021). Influence of Cutting Speed in Turning and Force in Subsequent Diamond Smoothing on Magnetic Properties of Steel 100Cr6. Metals, 11(7), 1131. https://doi.org/10.3390/met11071131