Article

A Ternary Map of Ni–Mn–Ga Heusler Alloys from Ab Initio Calculations

by
Yulia Sokolovskaya
1,
Olga Miroshkina
1,2,
Danil Baigutlin
1,3,
Vladimir Sokolovskiy
1,4,*,
Mikhail Zagrebin
1,4,5,
Vasilly Buchelnikov
1,4,* and
Alexey T. Zayak
6
1
Condensed Matter Physics Department, Chelyabinsk State University, 454001 Chelyabinsk, Russia
2
Faculty of Physics and Center for Nanointegration Duisburg-Essen (CENIDE), University of Duisburg-Essen, 47048 Duisburg, Germany
3
Department of Physics, School of Engineering Science, LUT University, FI-53850 Lappeenranta, Finland
4
Academic Research Center for Energy Efficiency, National University of Science and Technology “MISiS”, 119049 Moscow, Russia
5
Faculty of Mathematics, Mechanics and Computer Sciences, South Ural State University (National Research University), 454080 Chelyabinsk, Russia
6
Department of Physics and Astronomy, Bowling Green State University, Bowling Green, OH 43403, USA
*
Authors to whom correspondence should be addressed.
Metals 2021, 11(6), 973; https://doi.org/10.3390/met11060973
Submission received: 12 May 2021 / Revised: 7 June 2021 / Accepted: 13 June 2021 / Published: 17 June 2021
(This article belongs to the Special Issue Recent Development in Magnetic Shape Memory Alloys)

Abstract

:
In the search for new magnetic functional materials, non-stoichiometric compounds remain a relatively unexplored territory. While experimentalists create new compositions looking for improved functional properties, their work is not guided by systematic theoretical predictions. Being designed for perfect periodic crystals, the majority of first-principles approaches struggle with the concept of a non-stoichiometric system. In this work, we attempt a systematic computational study of magnetic and structural properties of Ni–Mn–Ga, mapped onto ternary composition diagrams. Compositional stability was examined using the convex hull analysis. We show that the cubic austenite has its stability region close to the stoichiometric Ni 2 MnGa, in agreement with experimental data, while the tetragonal martensite spreads its stability over a wider range of Mn and Ni contents. The unstable compositions in both austenite and martensite states are located in the Ga-rich corner of the ternary diagram. We note that simultaneous stability of the austenite and martensite should be considered for potentially stable compounds suitable for synthesis. The majority of compounds are predicted to be ferrimagnetically ordered in both austenitic and martensitic states. The methodology used in this work is computationally tractable, yet it delivers some predictive power. For experimentalists who plan to synthesize stable Ni–Mn–Ga compounds with ferromagnetic order, we narrow the target compositional range substantially.

1. Introduction

During the last decades, shape memory Ni–Mn-based Heusler alloys have received notable attention as promising materials for a wide variety of engineering applications such as a magnetic actuator, controller, sensor, and damping technologies. Ni 2 MnGa is probably the most known Heusler alloy. Its distinguishing feature is the martensitic transformation in the ferromagnetic (FM) state between the high-temperature cubic austenite and the low-temperature modulated martensite with twin boundary structure occurring at about T m 200 K [1]. In 1996, Ulakko et al. [2] suggested the idea of magnetically induced reorientation of the twin variants structure in Ni 2 MnGa. These authors were the first to demonstrate 0.2% field-induced strains along the (001) direction in a Ni 2 MnGa single crystal with a magnetic field of 0.8 T applied at 265 K. That success was followed by extensive research of non-stoichiometric Ni–Mn–Ga compositions, covering various aspects such as the crystal structure of the austenite and martensite [3,4,5,6,7], magnetic and magnetoresistance properties [8,9], thermally and magnetically induced deformation [2,10,11], magnetocaloric properties [12,13], heat treatment processes [3,14], and phase diagrams [15,16,17,18,19,20,21,22].
At present, the most studied off-stoichiometric compounds are concentrated near Ni 2 MnGa. However, it is clear that expanding that region can lead to new functional phenomena. For example, we know that the martensitic and magnetic transition temperatures are sensitive to the valence electron concentration e / a (electrons per atom). Ni-rich Ni 2 + x Mn 1 x Ga ( 0 x < 0.4 and 7.5 e / a < 7.8 ) [18] and Mn-rich Ni 2 Mn 1 + x Ga 1 x ( 0 x < 0.6 and 7.5 e / a < 8.0 ) [22] provide an example. Some of these compositions reveal a strong magnetostructural coupling leading to an appearance of the first-order magnetostructural phase transition between the FM or antiferromagnetic (AFM) (ferrimagnetic (FIM)) martensite and the FM or paramagnetic (PM) austenite.
Compositions close to stoichiometric Mn 2 NiGa and Ga 2 MnNi are not investigated so deeply. According to experimental findings [23,24,25], Mn 2 NiGa austenite possesses an inverse Heusler structure ( F 4 ¯ 3 m , space group no. 216) and undergoes a martensitic transformation in the FIM state at 270 K. In addition, a large thermal hysteresis of 50 K and a high Curie temperature T C = 588 K are reported. Ab initio studies References [26,27,28] confirm the inverse atomic arrangement. Ga 2 MnNi is found to be an FM martensite at room temperature with T C of about 330 K. The martensitic transformation in the PM state takes place at ≈780 K, and this temperature is the highest reported so far in the Ni–Mn–Ga family [29]. Experimental and theoretical study [29] revealed the regular L2 1 structure of the austenitic phase, in which Ga atoms occupy equivalent positions.
Overall, we see that properly chosen deviations in stoichiometry can tune the magneto-structural coupling in Ni–Mn–Ga; however, the data are still sparse. Experimental studies of non-stoichiometric systems are associated with the complexity of synthesis as well as challenges of mechanical and segregational instabilities. Meaningful and systematic predictions from first-principles computations could allow for more efficient strategies of exploring wide ranges of non-stoichiometric compositions. Earlier, ab initio methods were used to explore structural, magnetic, vibrational, and thermodynamic properties of Ni 2 + x Mn 1 x Ga and Ni 2 Mn 1 + x Ga 1 x alloys (for instance, see References [30,31,32,33,34,35,36]).
It was demonstrated that doping of Ni–Mn–Ga significantly influences lattice constants, bulk moduli, magnetic moments, and Curie temperatures of the austenite and provided qualitative information about the phase stability in terms of the formation energy [37,38,39].
Along with the conventional first-principles methods, chemical disorder in Ni x Mn y Ga z was simulated using the coherent potential approximation (CPA) [37,38,40]. While this method treats atomic disorder very efficiently, it lacks the ability for complete structural relaxations, leaving some uncertainty that relies on the average description of the calculated properties of a crystal with ideal atomic positions. In order to verify our CPA results, we utilized simulations of the atomic disorder in Ni–Mn–Ga within 16-atom supercells, in [39], using the projector augmented wave (PAW) method [41,42]. Both approaches revealed similar compositional trends, which makes sense, since we did not allow the PAW calculations to fully relax atomic positions, keeping all atoms in the high-symmetry sites. Additional studies [37,38,39] showed similar compositional trends.
Thus, one significant drawback of our previous studies was the lack or internal relaxations of atomic positions, i.e., we assumed that in the high-symmetry cubic phase, atoms would naturally stick to the high-symmetry sites. Moreover, our previous work was focused on the stability of the austenitic phase only, assuming that martensite would have the same stability range. However, further analysis shows that the prediction of stable FM compositions requires simultaneous stability of the austenite and martensite. The challenge with this approach is that martensite requires relaxation of all degrees of freedom, allowing atoms to leave the high-symmetry sites. For Ni–Mn–Ga, local relaxations are essential, leading to such phenomena as structural modulations, which influences lattice parameters, structural stability, and magnetic order. Optimizing all those degrees of freedom for all possible compositions is a formidable task; therefore, we have to develop a simplified approach, which would be computationally manageable, and make a step in the right direction toward reliable ab initio predictions of compositional trends.
In this work, we analyze compositional trends in austenitic and martensitic phases of Ni x Mn y Ga z alloys over the full ternary composition ranges. Our analysis of the chemical stability utilizes the convex hull methodology, which takes into account most possible reactions, providing a direct measure of the phase stability from the first-principles study [43].

2. Computational Methodology

Magnetic and structural properties were calculated using the PAW method implemented in VASP [41,42]. The exchange correlation effects were treated with the Perdew–Burke–Ernzerhof functional of the generalized gradient approximation [44]. The PAW pseudopotentials with the following electronic configurations were used: 3 p 6 3 d 8 4 s 2 for Ni, 3 p 6 3 d 6 4 s 1 for Mn, and 3 d 10 4 s 2 4 p 1 for Ga. A uniform Monkhorst-Pack mesh of 8 × 8 × 8 k-points was used to sample the Brillouin zone with the first-order Methfessel–Paxton method ( σ = 0.1 eV). The plane-wave basis kinetic-energy cutoff of 400 eV was applied, whereas the kinetic-energy cutoff for the augmented charge was chosen as 800 eV. Full crystal structure optimization, including atomic coordinates and lattice parameters, was performed using the conjugate-gradient algorithm. The convergence criterion for the residual forces is 10 5 eV/Å, while the self-consistent calculations are converged with an accuracy of 10 6 eV.
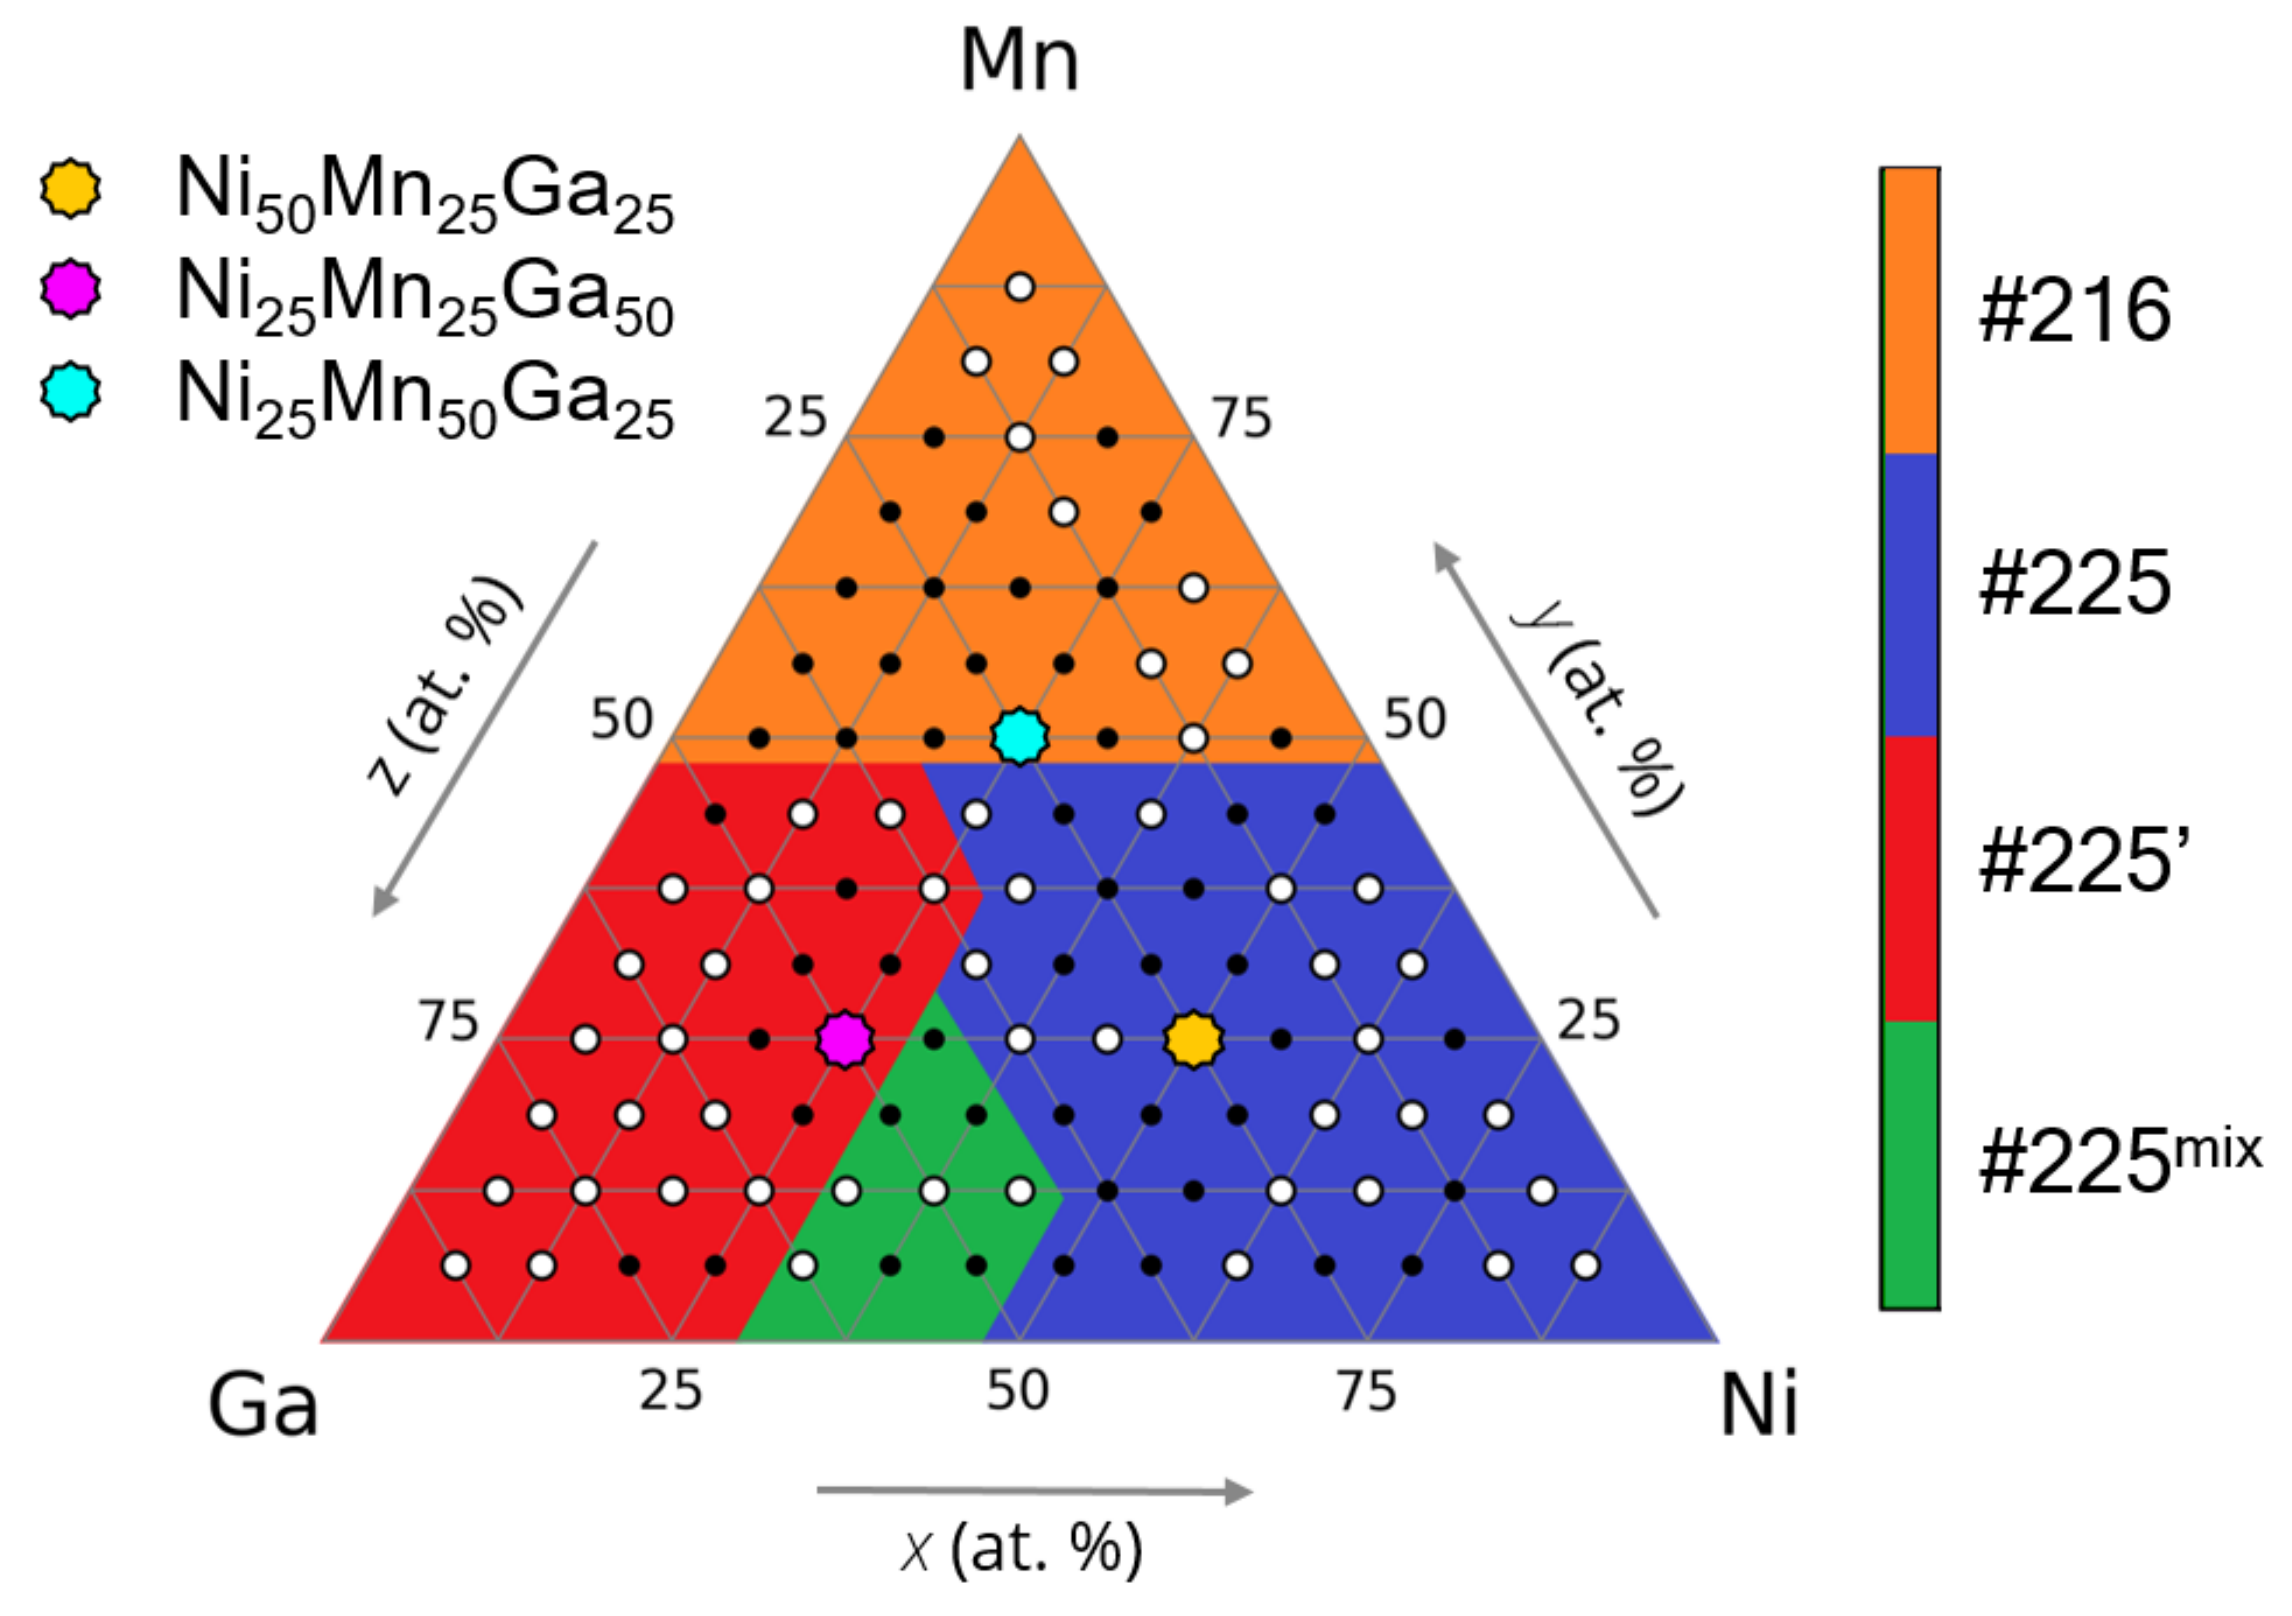
We used 16-atom supercells to model 105 compositions covering uniformly the ternary Ni–Mn–Ga diagram, as shown in Figure 1. In order to facilitate discussions, we split the diagram schematically into the three zones depending on Mn content y and denoted them as Area I ( y 25 at.%), II ( 25 < y < 50 at.%), and III ( y 50 at.%).
The choice of these areas based on Mn content is justified by similarities in magnetic configurations for each area, which are attributed to Mn atoms sitting in different sub-lattices. We examine both regular ( F m 3 ¯ m , space group #225) and inverse ( F 4 ¯ 3 m , space group no. 216) Heusler structures for all compositions in the austenitic phase and find that the regular structure is preferable for Ni- and Ga-rich compositions (areas I and II). In this case, the alloys assume the #225 and # 225 structures, as shown in Figure 1. The inverse Heusler structure turns out to be more favorable for Mn-rich compositions (area III). One can find more information about crystal structures in the Supplementary Material (SM) (Table S1 and Figures S1 and S2).
The magnetic ordering of Mn-excess compositions is rather complex due to the magnetic moments of Mn atoms that occupy the Ga and Ni sites and can interact antiferromagnetically with those on the Mn sublattice. In view of this fact, we considered several types of magnetic configurations, which can be grouped as follows: (i) area I: FM only; (ii) area II: FM, FIM-1, and FIM-2 (Mn excess atoms have a reversed magnetic moment to that of Mn atoms on the Mn sublattice); (iii) area III: FM one and seven FIM configurations. All magnetic configurations are listed in Table S2 and visualized in Figures S3 and S4 of the SM.
To analyze the phase stability of the compounds, we used a new three-step procedure, with an improvement over our previous studies [37,38,39], where only the formation energy ( E f o r m ) was used as the stability criterion. At first, we evaluate the stability of austenitic (martensitic) phases in the context of the preservation of cubic (tetragonal/orthorhombic) symmetry after the full relaxation for each composition. In the second step, the E f o r m of the compounds in austenitic and martensitic phases is analyzed. It is assumed that a compound is stable against the decomposition into its pure components if E f o r m has a negative sign in accordance with the equation E f o r m = E 0 Ni x Mn y Ga z ( x E 0 Ni + y E 0 Mn + z E 0 Ga ) . Here E 0 Ni x Mn y Ga z is the ground-state energy of Ni x Mn y Ga z , while E 0 Ni , E 0 Mn , and E 0 Ga are the ground-state energies of corresponding components in their preferable structures. Compositions with a positive E f o r m are eliminated from the consideration. In the third step, the phase stability is determined using the convex hull analysis in conjunction with the evaluation of decomposition into pure elements and stable binary compounds. To plot the convex hull, 13 pivot points were used as follows: Ga, Ni, Mn, Ga 3 Ni 2 , Ga 3 Ni 5 , Ga 5 Ni, Ga 7 Ni 3 , Ga 9 Ni 13 , GaNi 3 , MnGa, MnGa 4 , MnNi 3 , and Ni 2 MnGa. Structural parameters for the pivot points are listed in SM (Table S3). To investigate the decomposition trends, all possible combinations of the reaction products (pivot points) were generated for each compound. We took into account the decomposition of two and three reaction products, each of these might be one of 13 pivot points. The stoichiometric coefficients for reactions are evaluated by solving linear equations, only considering equations with the positive stoichiometric coefficients. For each composition, a fraction of stable reactions is normalized on its own number of possible reactions depending on Ni, Mn, and Ga content. By an example of Ni 9 Mn 4 Ga 3 , 27 possible decomposition reactions are listed in Table S4 of the SM. This compound is stable against decomposition in the case of 22 reactions, which gives us 81% of stable reactions.

3. Results and Discussion

To gain information about the structural stability of compounds under study, we first discuss the arrangement of atoms within a crystalline cubic structure for each composition. Figure 2 illustrates the ternary diagram of the cubic structures distribution with the preferable atomic arrangement for Ni x Mn y Ga z .
The full geometric optimization of structures with the cubic supercell suggested that 54 out of the 105 compositions preserve a cubic symmetry, as opposed to Reference [39] where all 105 compositions were considered with the cubic structure. Another distinctive feature of the full geometric optimization (as opposed to the relaxation without change in atomic positions) is the prediction of slightly different atomic configurations. Thus, the favorable configurations of atoms are turned out to be as follows: (i) the Mn-rich compounds ( y 50 at.%) have the inverse structure (#216); (ii) the compounds of x > 45 at.%Ni, 25 < y < 50 at.%Mn, and z < 30 at.%Ga possess the regular structure ( # 225 ) in which Ni atoms occupy 8c sites; (iii) the compounds of x < 45 at.%Ni and y < 25 at.%Mn tend to favor the # 225 structure, in which Ga atoms are located at 8c sites. However, neglecting of the atomic relaxations [39] does not provide the #225 mix atomic ordering for compositions with 30 < x < 45 at.%Ni, 6 < y < 25 at.%Mn, and 40 < z < 70 at.%Ga and the #216 one for Mn 50 Ni 25 Ga 25 . In the latter case, the inverse Heusler structure (#216) has been observed experimentally [26,27]. For the remaining 51 compounds, the initial cubic structure is transformed into the tetragonal and orthorhombic configurations. Among those are 27 compounds mainly with Ga- and Ni-rich content from area I; 15 compounds of area II with variable content of the all constituent elements; and 9 Mn-rich compositions with z < 15 at.%Ga from the area III.
At the same time, a full geometric optimization of structures with a tetragonal supercell reveals 13 compositions, in which the tetragonal structures are higher in energy than the cubic one. These are 11 Ga-rich and near-equiatomic Ni and Ga compositions from the area I and two compositions with nearly equal Mn and Ga content from the area II. The list of compositions with stable austenite and martensite phases is presented in Tables S5–S10, see the SM.
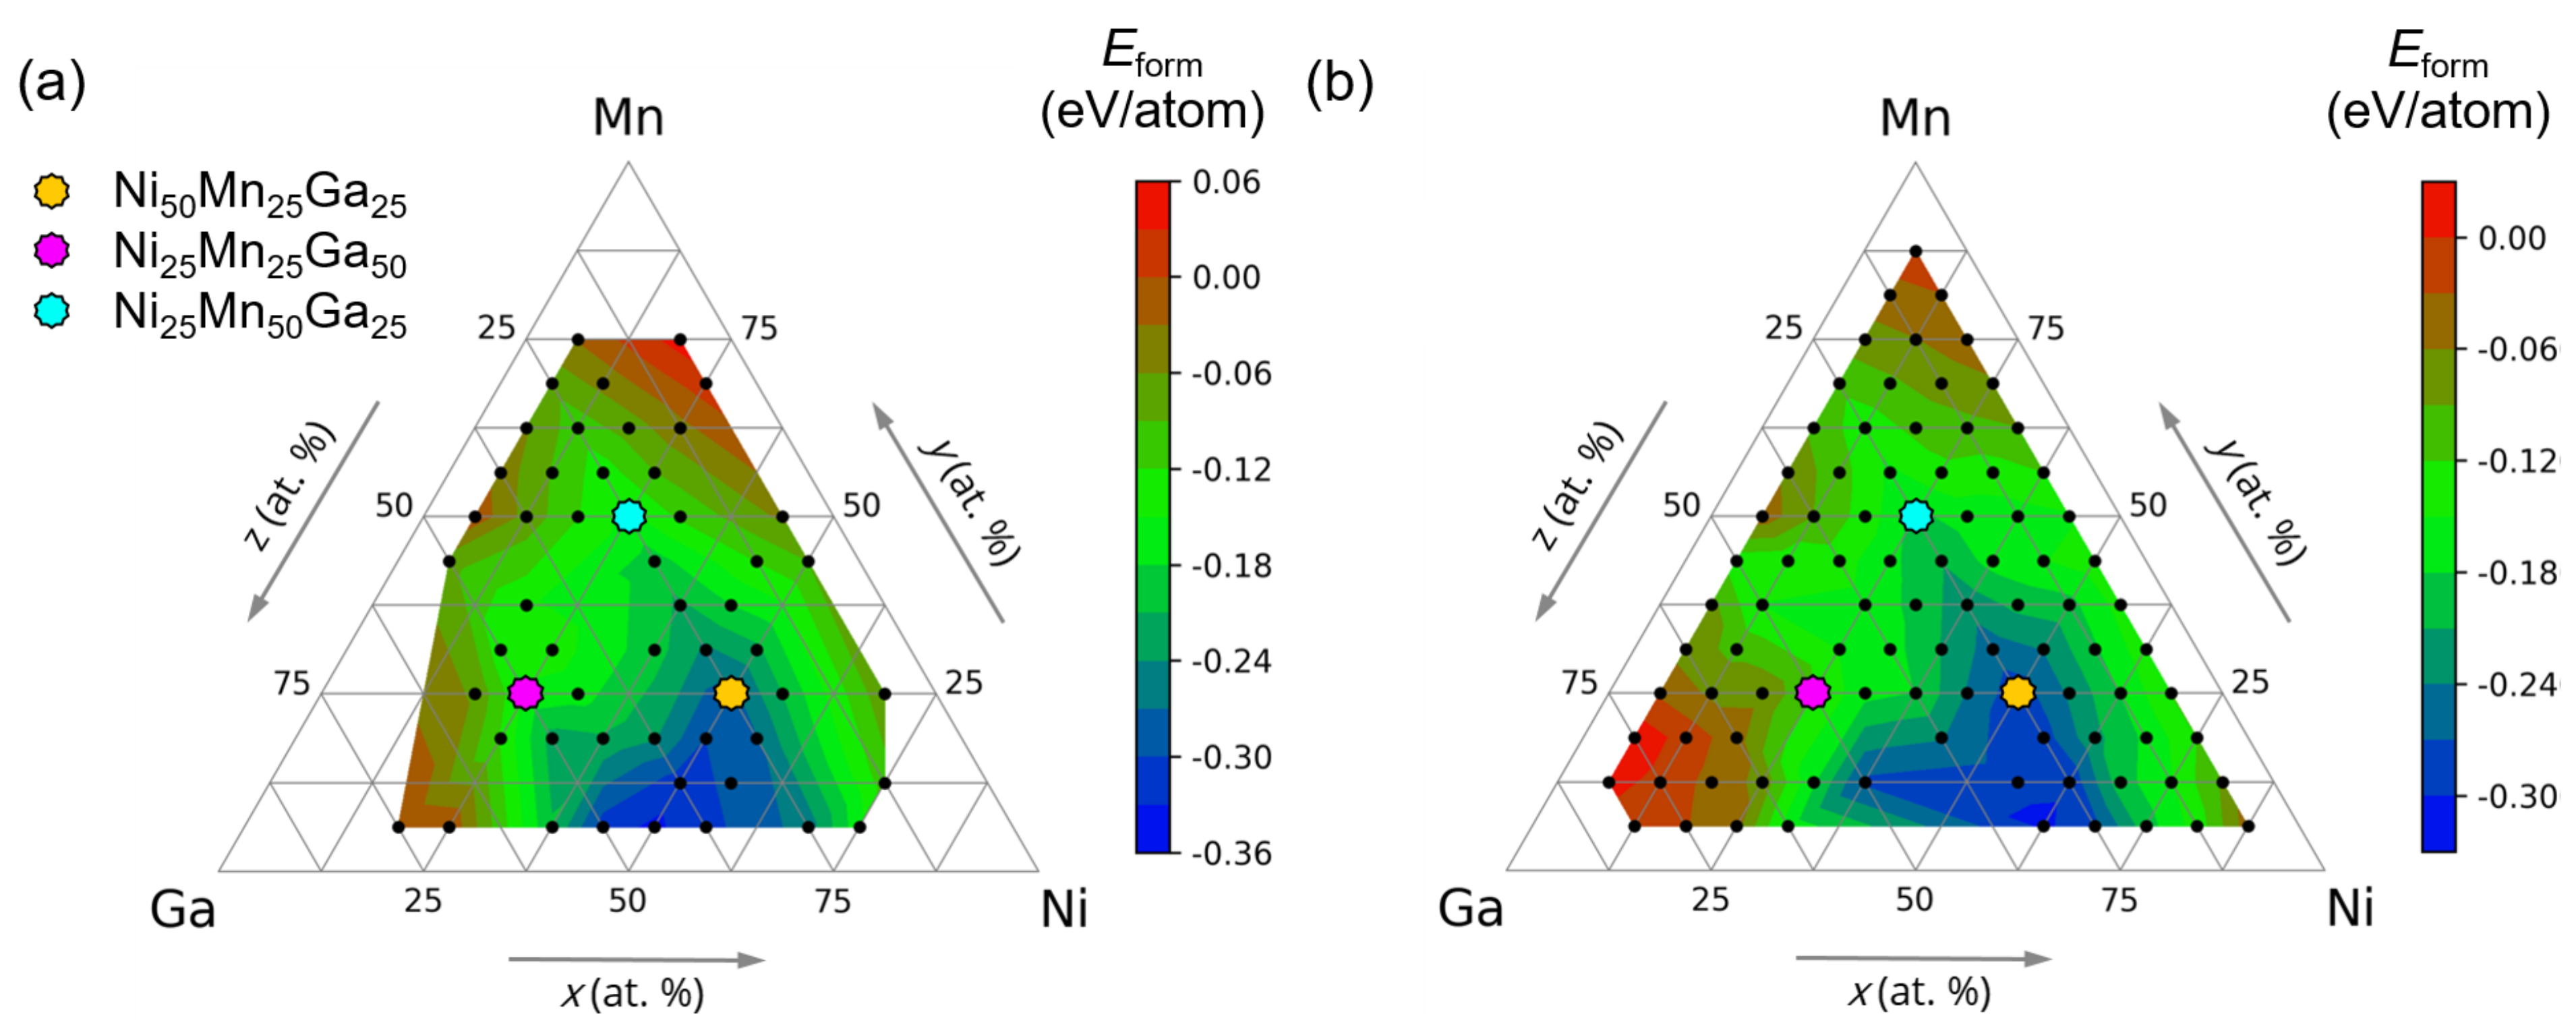
Figure 3 shows formation energies for compounds in the austenitic and martensitic phases mapped onto the ternary diagram. We have eliminated here the unfavorable compositions in the corresponding phases in accordance with Figure 2.
As can be seen from Figure 3a,b, the formation energy is negative for the majority of compounds. The maps of E f o r m for favorable austenitic and martensite structures are similar. For both cases, the most stable compounds are close to Ni 50 Mn 25 Ga 25 in concentration ranges of 45 < x < 65 at.%Ni, 6 < y < 30 at.%Mn, and 18 < z < 45 at.%Ga.
In general, the supercell calculations with structural relaxations reproduce the corresponding static relaxation results for Ni–Mn–Ga in the austenitic phase [37,38,39]. However, comparative analysis of the two approaches shows that the Ga- and Mn-rich compounds located at the left and top corners of the ternary map turn out to be unstable ( E f o r m > 0) after the full geometric optimization as compared to the static relaxation procedure, which predict the Ga-rich compositions to be unstable only in the austenitic phase [37,39]. In the martensitic phase, among 92 compositions, only two (Ni 6.25 Mn 12.5 Ga 81.25 and Ni 6.25 Mn 18.75 Ga 75 ) orthorhombic structures have positive formation energies and decompose into the elements involved. We have excluded these compositions from further consideration.
The criterion of stability in terms of formation energy is not rigorous since some multicomponent compounds can decompose into stable binary and ternary prototypes together with elemental components. Therefore, it is necessary to consider the thermodynamic phase stability of Ni x Mn y Ga z in terms of the energy convex hull analysis. The main idea is to compare E f o r m of the ternary compound under study with a possible combination of stable phases (pivot points). The three-dimensional convex hull and its cross-sections into the formation energy-composition space of Ni–Mn–Ga with austenite and martensite phases are shown in Figure S5 of the SM. The majority of investigated compounds have negative formation energies but lie above or closely above the convex hull. This finding indicates that these compositions are in a thermodynamically metastable austenitic or martensitic phase and can decompose.
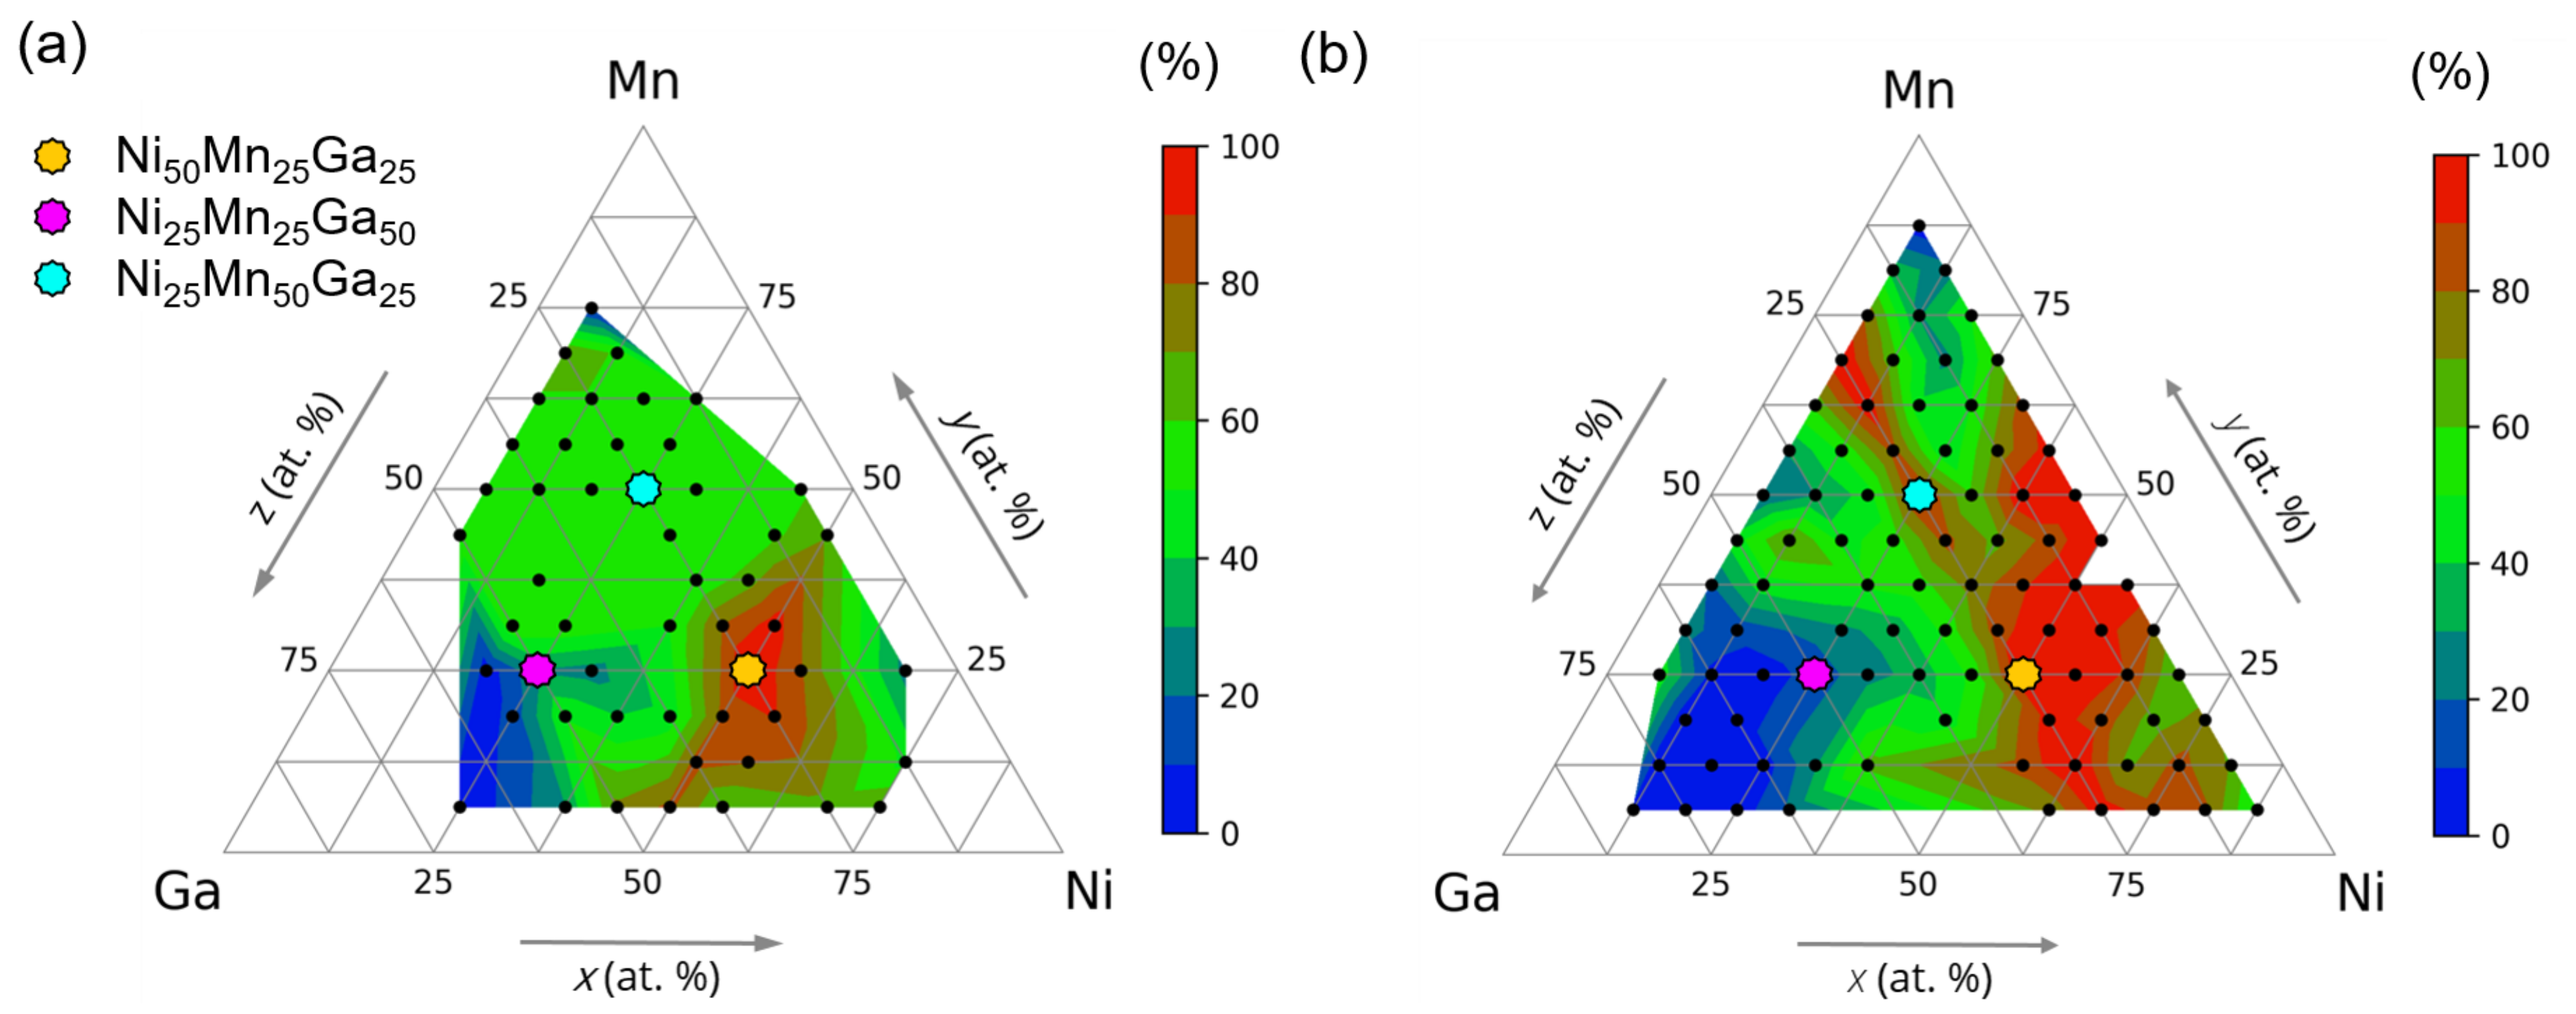
Figure 4a,b display contour maps of the decomposition reactions indicating the stable, metastable, and unstable Ni x Mn y Ga z compositions in the austenite and martensite. One can see that for both phases, the Ga-rich compounds concentrated near the left corner of the ternary diagram are unstable and reveal a tendency for decomposing into stable sub-compounds as suggested by the convex hull. It happens because the Ga-rich compounds lie sufficiently above the convex hull. Compounds from the middle part of the diagram are found to be metastable with a fraction of decomposition reactions at about 50%. Finally, compounds of z < 30 at.%Ga located at the right side of the ternary diagram are potentially stable or nearly stable (i.e., lying on or right above the convex hull).
In particular, the fraction of compounds with the stable tetragonal structure is sufficiently greater than those with the stable cubic structure. We note that the Ni–Mn–Ga compounds predicted to be stable in the austenite phase are concentrated near the stoichiometric Ni 2 MnGa. This finding reproduces the experimental ternary diagram well, revealing the most studied Ni–Mn–Ga compounds (see Figure S6 in the SM).
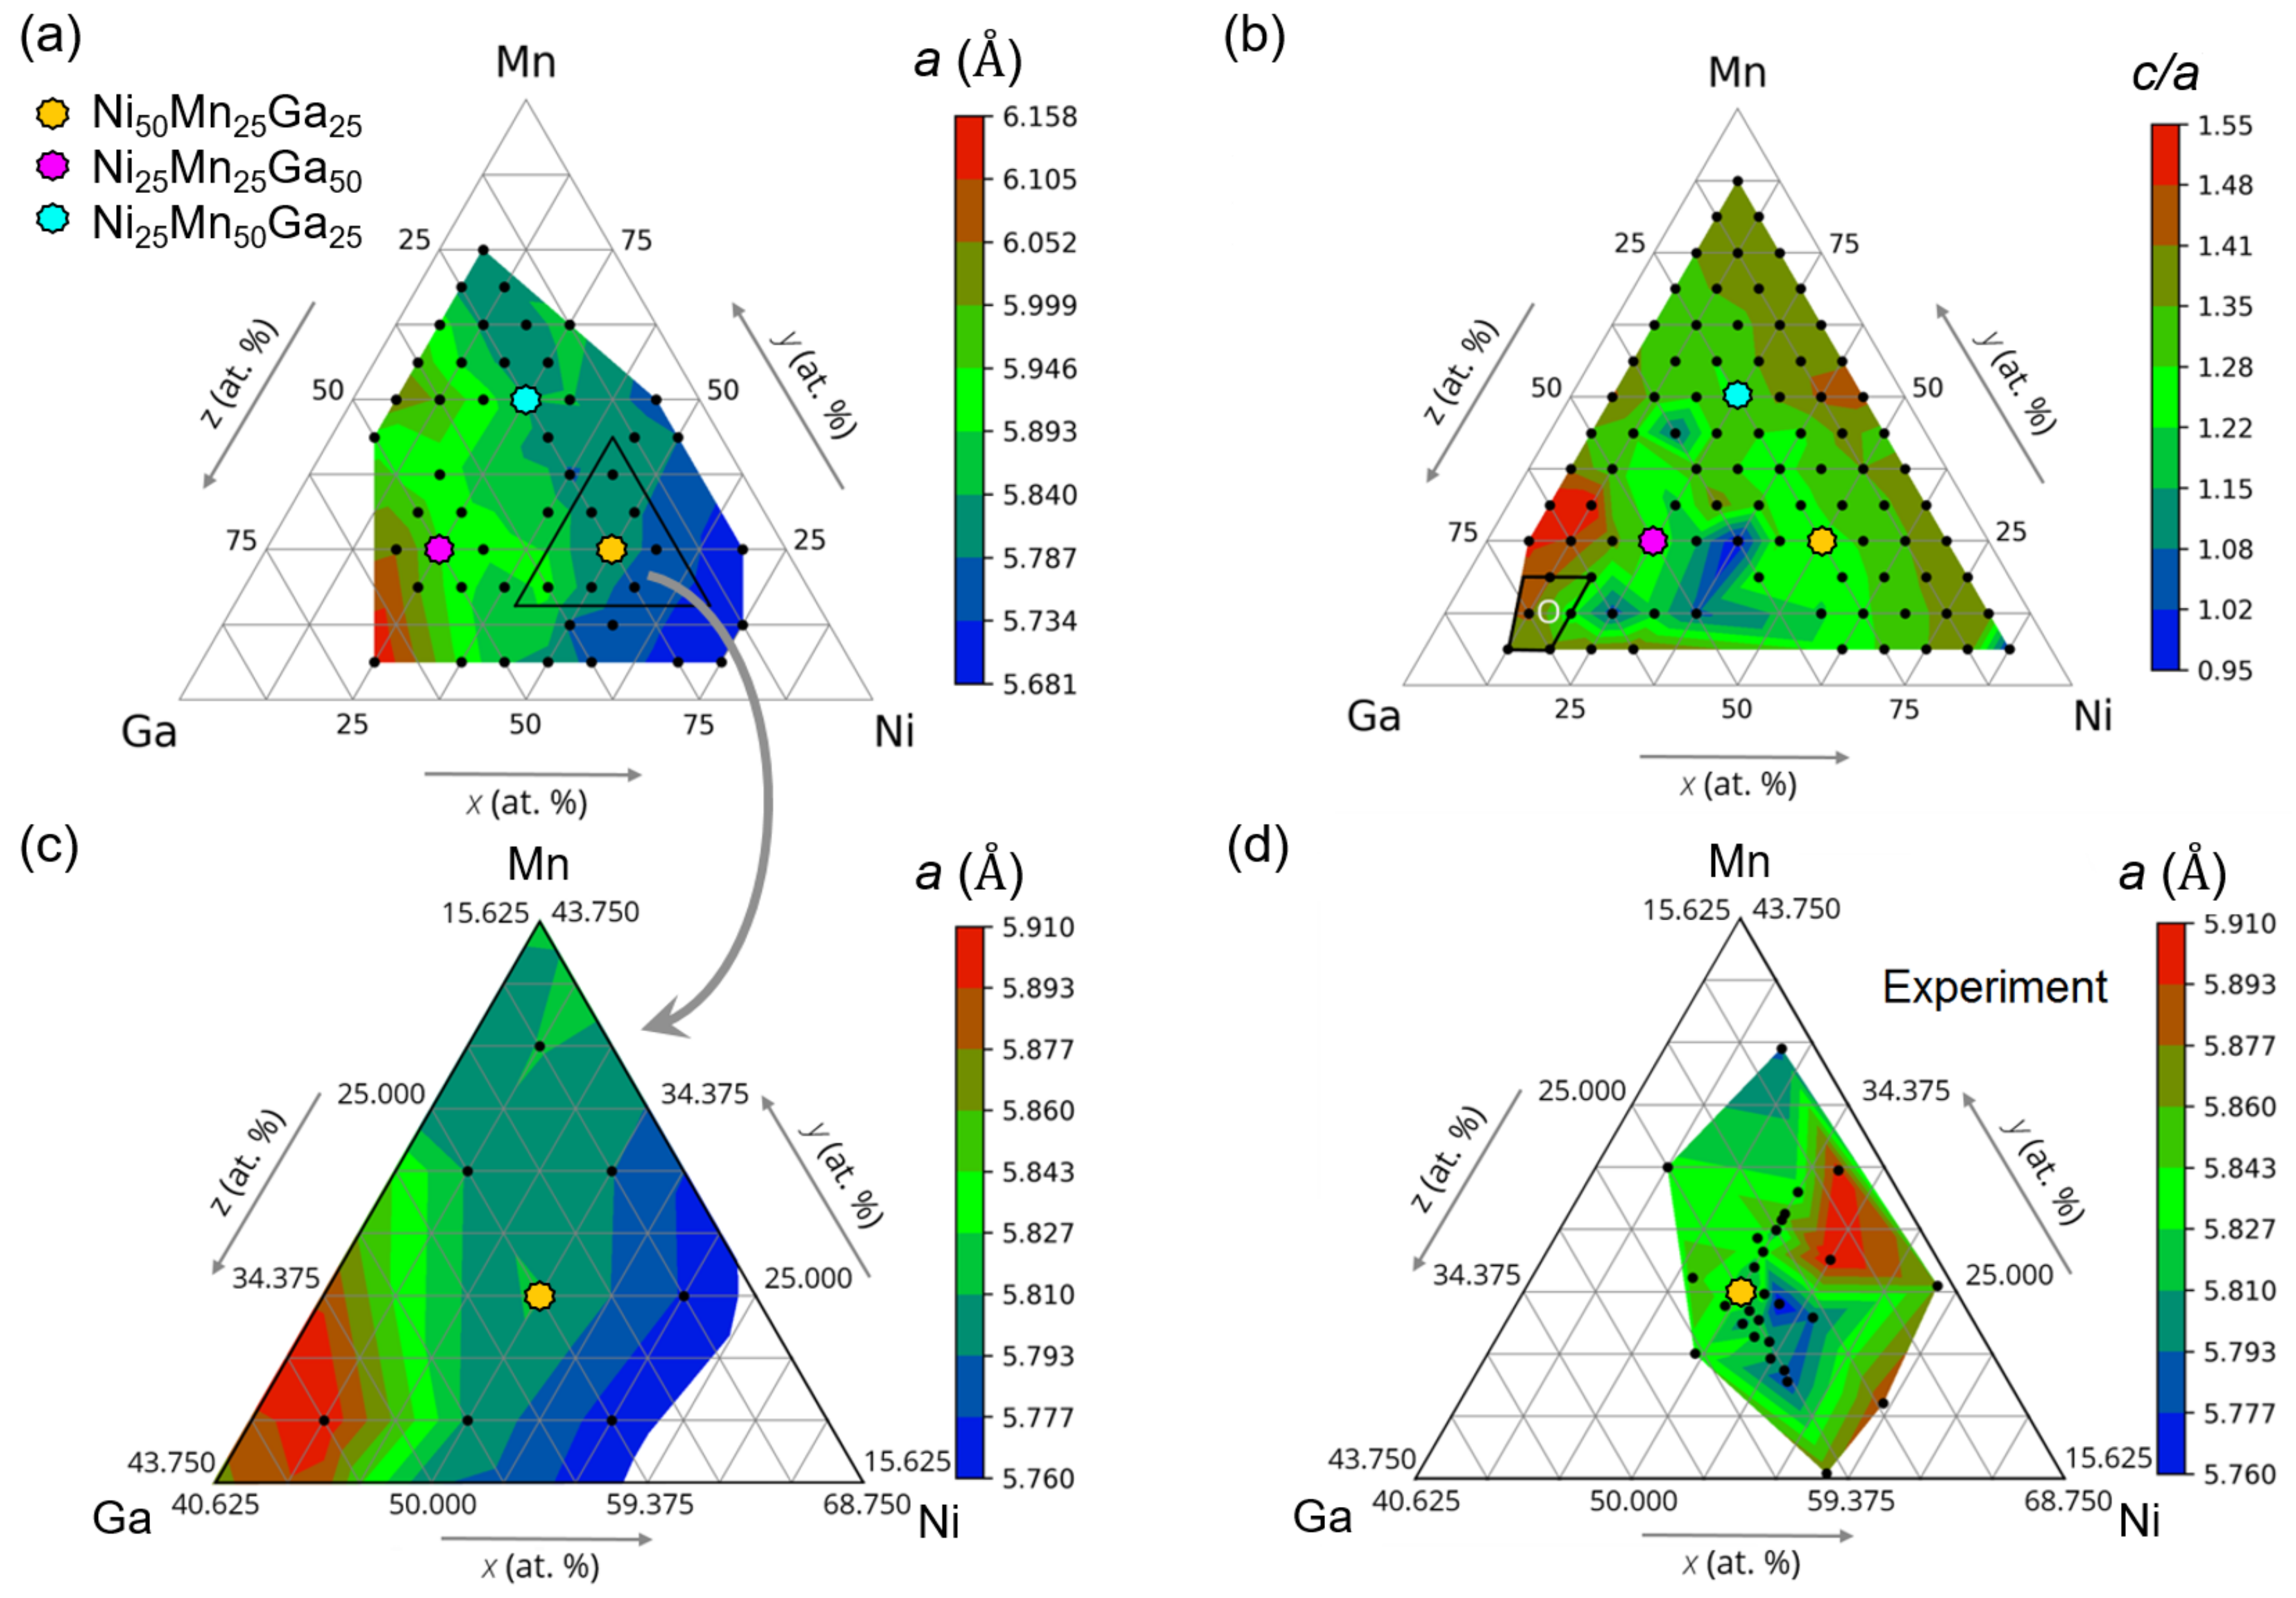
Figure 5a illustrates the contour map of the optimized lattice constant a 0 of the cubic austenite Ni x Mn y Ga z . It can be seen that equilibrium lattice parameters depend mostly on the Ga content. Compounds with Ga excess z > 55 at.% exhibit the large a 0 > 6 Å due to the larger atomic radius of Ga as compared to those of Ni and Mn. A gradual decrease in Ga doping leads to a reduction in a 0 . For compositions with x < 55 at.%Ni and 25 < z < 55 at.%Ga, a 0 takes values in the range between 5.85 and 5.95 Å, whereas the further reduction of Ga at the same Ni content decreases the lattice parameter to a 0 5.78 Å. A sufficiently smaller lattice constant (≈5.68 Å) is observed for Ni-rich compositions with x > 70 at.%Ni.
In Figure 5b, we display the contour map of the tetragonal ratio c / a of martensitic Ni x Mn y Ga z . For Mn- or Ni-rich compounds with the Ga content of z < 20 at.%, the tetragonal structure is characterized by the ratios 1.3 < c / a < 1.4 . An increase in both Ga and Ni or Ga and Mn concentrations simultaneously leads to a reduction in the c / a range to 1.2 < c / a < 1.3 . The quantity of these compounds is the largest and they are represented within the middle area of diagram with the exception of compositions with 25 < x < 57 at.%Ni, y < 35 at.%Mn, and 31 < z < 57 at.%Ga (see the blue map in Figure 5b), which are stable in the cubic phase ( c / a = 1 ) only. The largest tetragonal ratios varied in the range of 1.4 < c / a < 1.5 are found for tetragonally distorted Ga-rich compounds ( x < 18 at.%, 18 < y < 30 at.%, and 55 < z < 70 at.%). We would like to mention that for Ga-rich compounds ( x < 18 at.%, y < 18 at.%, and z > 64 at.%), the orthorhombic structure with 0.9 < b / a < 1 and 1.3 < c / a < 1.4 is favorable. The calculated lattice constants for both austenitic and martensitic structures are summarized in the SM (see Tables S5–S10).
Our data allow for a systematic comparison of the calculated lattice parameters with available experimental data. The calculated equilibrium lattice constant a 0 of the stoichiometric compositions are ≈5.81 Å for Ni 2 MnGa, 5.84 Å for Mn 2 NiGa, and 5.95 Å for Ga 2 MnNi. These values are close to experimental ones: 5.82 Å for Ni 2 MnGa [1], 5.9 Å for Mn 2 NiGa [23], and 5.84 Å for Ga 2 MnNi [29]. Despite the slight difference in theoretical and experimental values for Mn 2 NiGa and Ga 2 MnNi, it should be pointed out that our results are found to be in excellent agreement with other ab initio studies. For instance, Barman et al. [29] reported a 0 = 5.96 Å for Ga 2 MnNi and Kundu et al. [28] obtained 5.84 Å for Mn 2 NiGa.
As for the off-stoichiometric compositions, there is a limited list of compounds studied experimentally, and most of them are concentrated near Ni 2 MnGa (see Figure S6 in the SM). Figure 5c,d show magnifications of the theoretical and experimental data in the vicinity of Ni 2 MnGa maps of a 0 . The lattice constants of the most experimental compounds take values between 5.81 and 5.86 Å, except the Ni 51.2 Mn 31.1 Ga 17.7 and Ni 52 Mn 24.4 Ga 23.6 with the largest a 0 = 5.91 Å and lowest a 0 = 5.76 Å [45], respectively. The discrepancy between experimental and calculated values is ≈1%. Apart from the accuracy of ab initio simulations, the difference could arise from the fact that the experimental values of a 0 were obtained at finite temperatures (i.e., at temperatures above T m ). For instance, T m for Ni 51.2 Mn 31.1 Ga 17.7 with the largest a 0 is about 446 K [45]. In contrast, ab initio methods assume zero temperatures and lattice constants have to be slightly less. As Figure 5d suggests, the lattice constant reduces and reaches the value of about 5.76 Å with increasing (decreasing) Ni (Mn) content at the fixed ≈25 at.%Ga. On the other hand, the successive replacement of Ga by Mn and vice versa at the fixed 50 at.%Ni does not change the lattice constant sufficiently, which is about 5.84 Å. The similar trends for Ni 50 ± x Mn 25 ± y Ga 25 and Ni 50 Mn 25 ± y Ga 25 ± z can be seen in the theoretical a 0 map, as shown in Figure 5c.
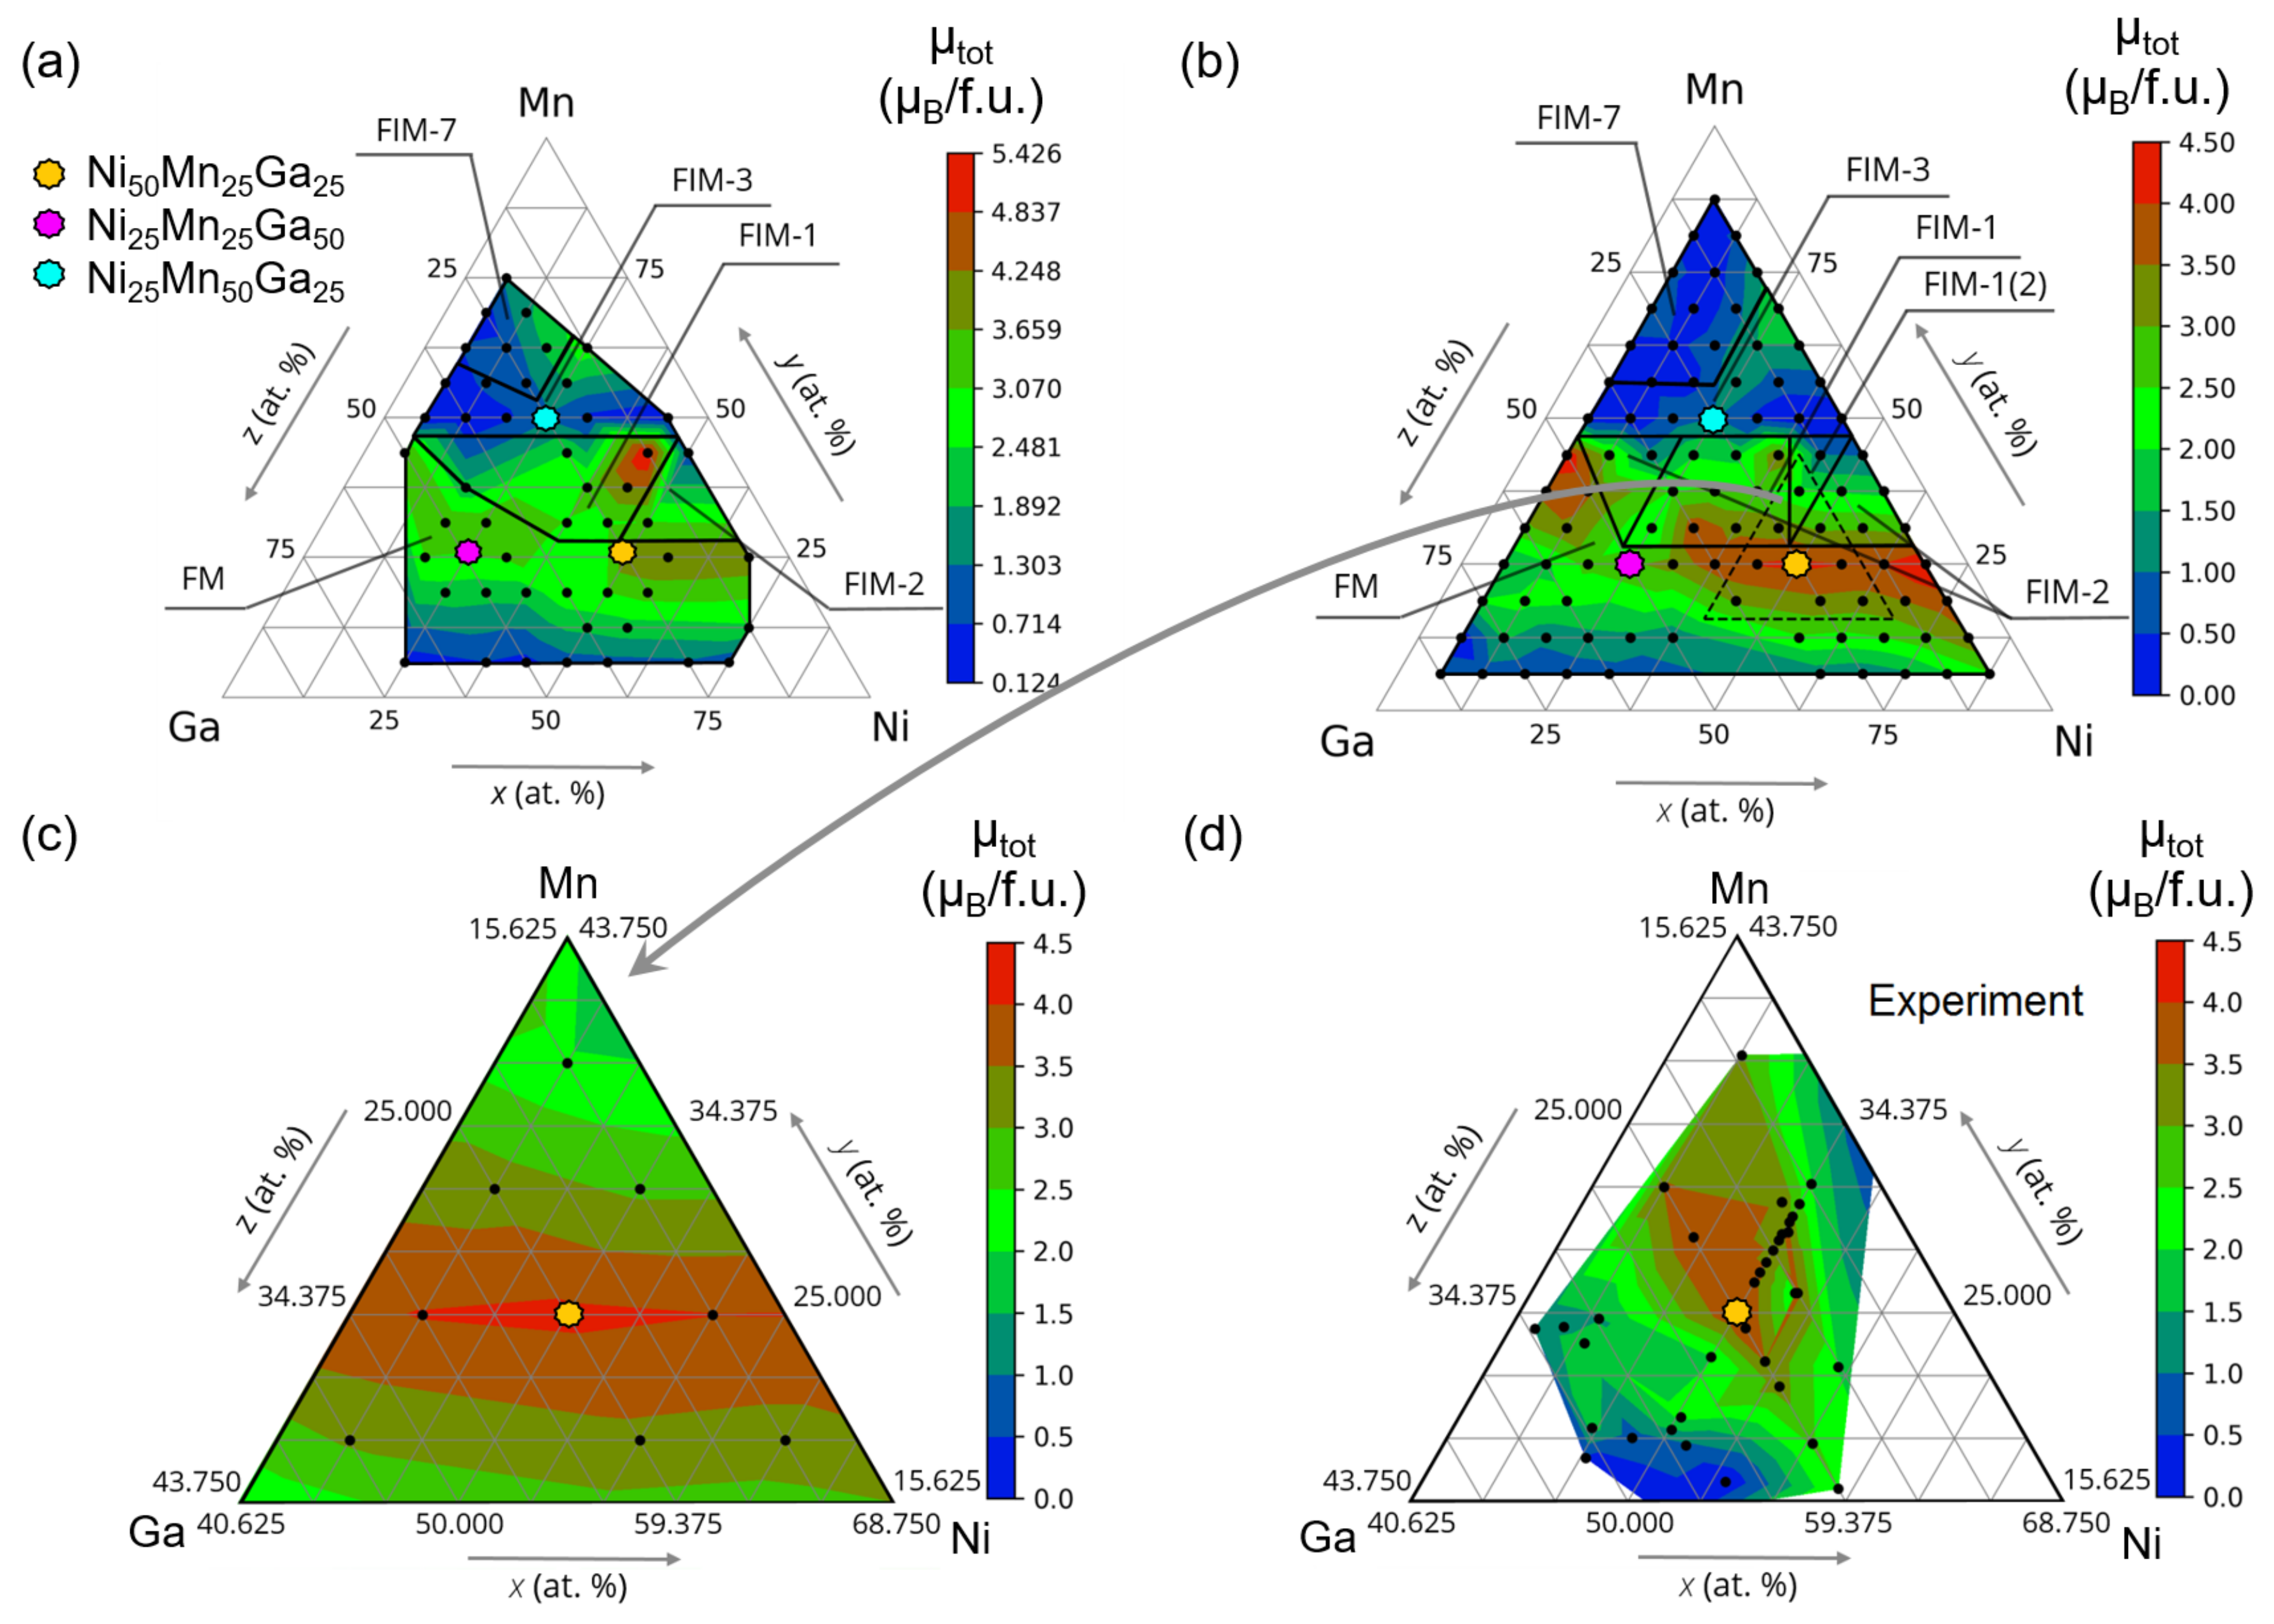
Total magnetic moments ( μ t o t ) for stable compositions in the austenite and martensite are shown in contour maps of Figure 6a,b, correspondingly, where we also marked areas with favorable magnetic configurations. One can see a similarity in the magnetic moments of the austenitic and martensitic phases. Namely, Ga- and Ni-rich compounds (area I) are ordered ferromagnetically. Ga-rich compositions have a small magnetic moment less than 1.5 B /f.u.; which is correlated with larger contents of non-magnetic Ga diluting the ferromagnetically ordered phase. Compositions of area II are predominantly ordered ferrimagnetically with FIM-1 type. At the same time, there are regions with FIM-2, FIM-1(2), and FM spin configurations on the right and left sides of the area II. We note that inverted spins are assigned to Mn-excess atoms located at Ni sites for FIM-1 and at Ga sites for FIM-2. This effect takes place for all Mn excess atoms in the case of the FIM-1(2) state. The largest magnetic moments of 5.5 B /f.u. and 4.52 B /f.u. are obtained for FM austenite Ni 62.5 Mn 31.25 Ga 6.25 and FM martensite Ni 68.75 Mn 25 Ga 6.25 . In addition, the largest difference between μ t o t in austenite and martensite is about 2.5 B /f.u. for composition 50 < x < 75 at.%Ni and z < 25 at.%Ga.
Let us consider the Mn-rich compounds mapped in the area III. Since Mn atoms can occupy four f c c sublattices constituting the inverse Heusler structure depending on nominal composition, several FIM alignments can be realized. Among the seven considered spin configurations, FIM-3 and FIM-7 are predicted to be favorable. For FIM-3, Mn atoms at the 4a site have reversed spin alignment, while Mn atoms at both 4a and 4 b have opposite spins in the case of FIM-7. The total magnetic moment is smaller than 1.5 B /f.u particularly in the tetragonal martensitic phase because of the complex magnetic order. The largest difference in total magnetic moments between the austenite and martensite is ≈2.5 B /f.u. for compounds with 10 < x < 35 at.% and z < 25 at.%. The partial magnetic moments for all compositions are listed in Tables S11–S15 of the SM.
In contrast to Reference [39], the relaxation of the atomic positions allows to reveal distinguishing features of the magnetic phase diagram, which are: (i) the FIM-1 phase with a larger magnetic moment (We would like to note that there is the misprint in Figure 3a of Ref. [39]. The unit for total magnetic moment plotted in the area II of diagram is B /atom instead B /f.u. As consequence, there is a difference between magnetic moments calculated within the full geometric and static relaxation procedures.) exists for compounds with y < 50 at.%Mn and (ii) the FIM-3 phase occurs for compounds with y 50 at.%Mn.
In Figure 6c,d, we illustrate the zoomed-in contour maps of μ t o t for a set of theoretical and experimental compounds in the martensitic phase for compositions near Ni 50 Mn 25 Ga 25 . Close inspection of the data shows that the theoretical μ t o t correlates with experimental ones. In both cases, the largest μ t o t 4 B /f.u. is found for Ni 50 Mn 25 Ga 25 , whereas deviations from the stoichiometry such as Ni 50 ± x Mn 25 x Ga 25 , Ni 50 Mn 25 ± x Ga 25 x , and Ni 50 ± x Mn 25 Ga 25 x result in the magnetic moment reduction to 2 B /f.u. For experimental samples 46 < x < 57 at.%Ni, y < 19 at.%Mn, and 28 < z < 35 at.%Ga, the magnetic moment is less than 1 B /f.u. Importantly, these calculations do not predict any compounds with a favorable tetragonal structure in the present concentration range. Such distinction can be caused by the presence of modulated martensitic structure in the experimental compounds, while modulations were not taken into account in calculations due to an increase in computational problems.
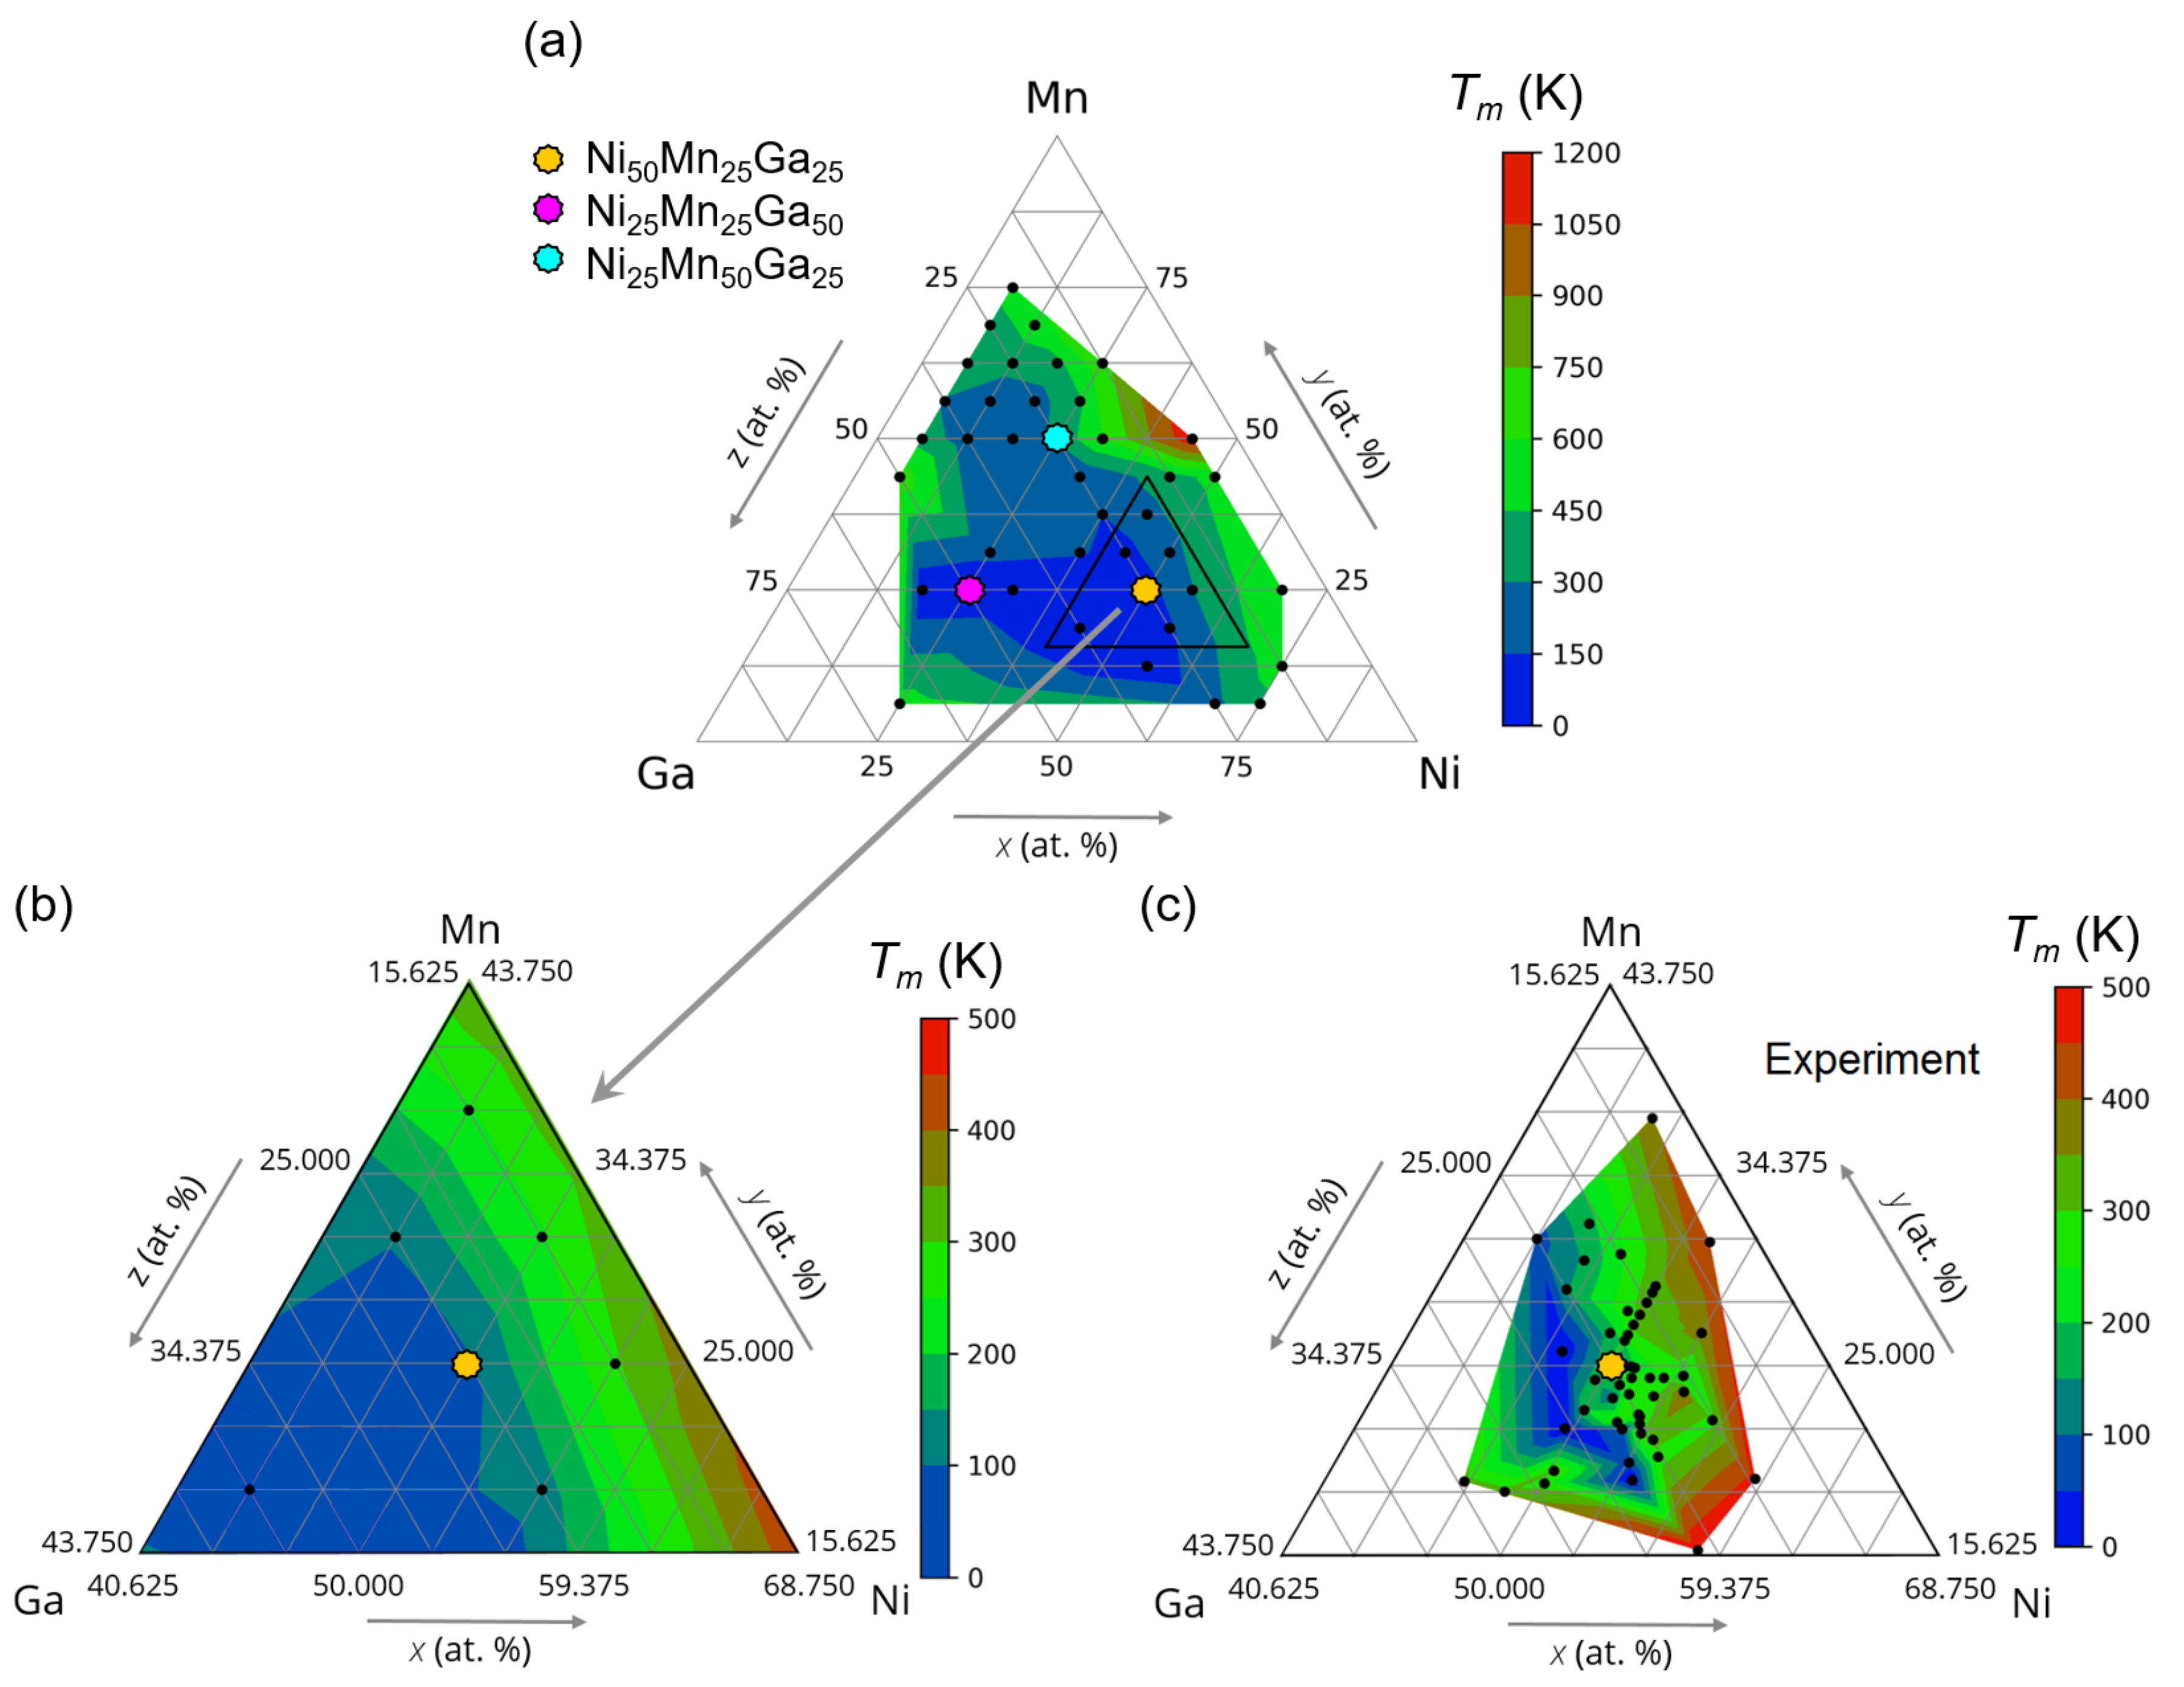
Having the total energies of the austenitic and martensitic phases, we can estimate the martensitic transformation temperature T m using the relation Δ E k B T m , where Δ E is the energy difference between the cubic and tetragonal structures and k B is the Boltzmann constant. Obtained T m for Ni x Mn y Ga z are presented in Figure 7. One can see that the martensitic transformation is predicted for ≈40% of compounds under study, most of those are compositions with z < 30 at.%Ga. The lowest T m is obtained for compositions with 25 < z < 60 at.%Ni, 15 < y < 30 at.%Mn, and 25 < z < 55 at.%Ga, while the largest ones are found for Mn-rich compounds with a small Ga content. In particular, we predict T m 1160 K for Ni 43.75 Mn 50 Ga 6.25 . This compound is close in composition to a binary NiMn, which demonstrates the B2-L1 0 martensitic transformation at about 1000 K [46,47].
Figure 7b,c compare the theoretical and experimental zoomed-in contour maps of martensitic for compositions concentrated near Ni 50 Mn 25 Ga 25 . One can see a noticeable correlation between our results and experimental results. For the Ni 50 Mn 25 ± x Ga 25 x compound, the subsequent replacement of Ga by Mn atoms leads to an increase in T m . The theoretically obtained change in T m of about 150 K between Ni 50 Mn 25 Ga 25 and Ni 50 Mn 31.25 Ga 18.75 is in agreement with an experimental one between Ni 50 Mn 25 Ga 25 and Ni 50 Mn 28.9 Ga 21.1 [22]. A similar trend can be observed for T m of Ni 50 + x Mn 25 Ga 25 x and Ni 50 + x Mn 25 x Ga 25 but with a smaller change of T m with x. On the other hand, an increase in Ga content leads to T m reduction as it follows from theoretical and experimental ternary maps. Since substitution of Mn or Ni for Ga provides a change in the e / a ratio, it results in an increasing T m . Figure 7a,b show that the majority of considered compounds demonstrate this tendency and reproduce the experimental T m ( e / a ) behavior [17,20,22] in accordance with the Hume–Rothery mechanism. A correlation between Figure 5b and Figure 7 allows us to conclude that a high martensitic transition temperature is observed for compositions with a large tetragonality ( c / a ratio) of the martensite. A detailed inspection of Figure 7b,c suggests that the theoretical values of T m are calculated to be less than the experimental ones. This disagreement can be minimized by an extension of zero-temperature ab initio calculations to finite temperatures in terms of the balance of free energies in the different magnetic, premartensitic, and martensitic phases as proposed by Dutta et al. [35].

4. Conclusions

In summary, we carried out a systematic investigation of Ni–Mn–Ga austenite and martensite with respect to their magnetic and structural properties. A mesh of 105 Ni–Mn–Ga compositions was studied using the first-principles supercell calculations. The ground state atomic and magnetic configurations for cubic austenitic and tetragonal martensitic phases were simulated and considered based on their chemical and structural stability. It is shown that 51 compositions located mainly on the left ( z > 45 at.%Ga) and right ( y > 45 at.%Mn) sides of triangle diagrams are unstable in the cubic austenite. In the case of the martensitic phase, the majority of compositions prefer the tetragonal structure with the c / a ratio varied from 1.15 to 1.5. The exception is the compounds 25 < x < 57 at.%Ni, y < 35 at.%Mn, and 31 < z < 57 at.%Ga, which prefer the cubic structure. Ga-rich compounds have an orthorhombic structure. The phase stability analysis conducted in terms of the convex hull showed that (i) Ga-rich compositions with z > 60 at.%Ga decompose with utmost probability into stable pure components and binary phases that lie on the convex hull; (ii) compounds with 35 < z < 60 at.%Ga tend to decompose with a probability of about 50%; (iii) alloys with z < 35 at.%Ga are stable against decomposition, and their phase stability rises with decreasing Ga content.
The magnetic phase diagrams are found to be similar for austenite and martensite, revealing the regions of FM and FIM spin alignment. The ferromagnetically ordered austenitic and martensitic phases are available predominantly in compounds with Mn content y < 30 at.%. In contrast, the complex FIM order with various types of Mn spin alignment takes place for the compositions with y > 30 at.%Mn. Alloys with 10 < x < 35 at.%Ni and z < 25 at.%Ga reveal the largest magnetization difference between the austenitic and martensitic phases, which turned out to be ≈2.5 B /f.u.
Overall, this work demonstrates the predictive power of first-principles calculations, which can be used for the heuristic search of functional magnetic materials and their characterization and for the prediction of compounds with novel functionalities. Despite limitations in ab initio methods, results obtained in this work demonstrate our improved understanding of what it takes to predict stable martensitic off-stoichiometric magnetic compounds. With the increasing expertise in this field, one could undertake a full-feature study with larger supercells, allowing for various types of structural degrees of freedom, like the modulations in the case of Ni–Mn–Ga.

Supplementary Materials

The following are available online at https://www.mdpi.com/article/10.3390/met11060973/s1, Figure S1: 16-atom cubic supercells for stoichiometric Ni–Mn–Ga with L2 1 crystal structure. (a) Ni 8 Mn 4 Ga 4 ( F m 3 ¯ m , #225); (b) Ga 8 Mn 4 Ni 4 ( F m 3 ¯ m , #225 ); (c) Mn 8 Ni 4 Ga 4 ( F m 3 ¯ m , #225 ); (d) Mn 8 Ni 4 Ga 4 ( F 4 ¯ 3 m , #216). Here, Ni, Mn (Mn 1 for #216 structure), Ga, and Mn 2 (for #216 structure) atoms are denoted by green, red, light blue, and orange colors, respectively; Figure S2: 16-atom cubic supercells for off-stoichiometric Ni–Mn–Ga with #225 mix structure: (a) Ni 7 Mn 4 Ga 5 and (b) Ni 5 Mn 4 Ga 7 . Here Ni, Mn, Ga, and Ni-excess atoms are denoted by green, red, light blue, and orange colors, respectively; Figure S3: Structures in a cubic space group #225 for Ni–Mn–Ga with (a) FM, (b) FIM-1, and (c) FIM-2 spin configurations. Here, Ni, Mn, Ga, and Mn-excess atoms are denoted by green, red, light blue, and violet colors, respectively; Figure S4: Structures in a cubic space group #216 for Ni–Mn–Ga with (a) FIM-3, (b) FIM-7 spin configurations. Here Ni, Mn 1 , Mn 2 Ga, and Mn-excess atoms are denoted by green, red, orange, light blue, and violet colors, respectively; Figure S5: The three-dimensional convex hull in the formation energy of Ni–Mn–Ga compositions with the (a) austenite and (b) martensite phases. (c), (d) The cross-sections of convex hull plotted at the fixed Mn content (y = 25, 50, and 75 at.%). Here lines denote the profiles of the convex hull. The degree of stable reactions among the possible ones for a particular compound against the decomposition into a mixture of stable phases is also indicated above symbols; Figure S6: Compositional ternary phase diagram of Ni–Mn–Ga compounds from (Sokolovskaya Yu.A.; Sokolovskiy V.V.; Zagrebin M.A.; Buchelnikov V.D.; Zayak A.T. Ab Initio Study of the Composite Phase Diagram of Ni–Mn–Ga Shape Memory Alloys. J. Exp. Theor. Phys. 2017, 152, 125–132.). The points map the most studied compositions (about 900) reported in the literature; Table S1: Positions of the Ni, Mn and Ga atoms considered in the regular (space group #225) and inverse (space group #216) Heusler structures; Table S2: The considered orientation of spin magnetic moment of Mn atoms located at different Wyckoff positions in the regular (#225) and inverse (#216) Heusler structures. Here the reversed spin orientation is marked in a red color to enhance visibility. Notice that the Ni spin magnetic moment is aligned along the direction ⇑; Table S3: Space group, lattice parameter a (in Å), c / a ratio, and total energy E t o t (in eV/atom) per atom for the pivot points of the ternary Ni–Mn–Ga convex hull; Table S4: Possible decomposition reactions and the decomposition energy E d e c (in eV/atom) between the investigated alloy and reaction products for Ni 9 Mn 4 Ga 3 . The positive value indicates the phase instability against the decomposition process and vice versa; Table S5: Optimized lattice constants a, b, c (in Å) and their ratios, the total energy E t o t and the formation energy E f o r m (in eV/atom) as well as the preferable structure for compounds in the austenite phase from the area I; Table S6: Optimized lattice constants a, b, c (in Å) and their ratios, the total energy E t o t and the formation energy E f o r m (in eV/atom) as well as the preferable structure for compounds in the austenite phase from the area II; Table S7: Optimized lattice constants a, b, c (in Å) and their ratios, the total energy E t o t and the formation energy E f o r m (in eV/atom) as well as the preferable structure for compounds in the austenite phase from the area III; Table S8: Optimized lattice constants a, b, c (in Å) and their ratios, the total energy E t o t and the formation energy E f o r m (in eV/atom) for compounds in the martensite phase from the area I; Table S9: Optimized lattice constants a, b, c (in Å) and their ratios, the total energy E t o t and the formation energy E f o r m (in eV/atom) for compounds in the martensite phase from the area II; Table S10: Optimized lattice constants a, b, c (in Å) and their ratios, the total energy E t o t and the formation energy E f o r m (in eV/atom) for compounds in the martensite phase from the area III; Table S11: Element resolved magnetic moments (in B ), total magnetic moments (in B /f.u.) and favorable magnetic reference state for compounds in the austenite and martensite phase from the area I; Table S12: Element resolved magnetic moments (in B ), total magnetic moments (in B /f.u.) and favorable magnetic reference state for compounds in the austenite phase from the area II. Here μ Mn ( Ga ) and μ Mn ( Ni ) are the magnetic moments of Mn atoms placed at the Ga- and Ni sublattice, respectively; Table S13: Element resolved magnetic moments (in B ), total magnetic moments (in B /f.u.) and favorable magnetic reference state for compounds in the martensite phase from the area II. Here μ Mn ( Ga ) and μ Mn ( Ni ) are the magnetic moments of Mn atoms placed at the Ga- and Ni sublattice, respectively; Table S14: Element resolved magnetic moments (in B ), total magnetic moments (in B /f.u.) and favorable magnetic reference state for compounds in the austenite phase from the area III. Here μ Mn ( 4 a ) and μ Mn ( 4 b ) are the magnetic moments of Mn atoms, which occupy 4a and 4b Wyckoff sites while μ Mn ( Ga ) and μ Mn ( Ni ) are the Mn magnetic moments at the Ga- and Ni sites, respectively; Table S15: Element resolved magnetic moments (in B ), total magnetic moments (in B /f.u.) and favorable magnetic reference state for compounds in the martensite phase from the area III. Here μ Mn ( 4 a ) and μ Mn ( 4 b ) are the magnetic moments of Mn atoms, which occupy 4a and 4b Wyckoff sites while μ Mn ( Ga ) and μ Mn ( Ni ) are the Mn magnetic moments at the Ga- and Ni sites, respectively; Table S16: Martensitic transition temperature T m (in K) for compositions from the areas I, II, and III; Table S17: Experimental value of the lattice constants a (in Å) for austenitic phase; Table S18: Experimental value of the total magnetic moments (in B /f.u.) for compounds in the martensite phase; Table S19: Experimental value of the martensitic transition temperature T m (in K).

Author Contributions

Y.S.: ab initio calculations; O.M.: ab initio calculations, writing; D.B.: calculations of convex hull energy and decomposition reactions, visualization; V.S.: conceptualization, methodology, visualization—review and editing; M.Z.: methodology, ab initio calculations, writing, visualization; V.B.: conceptualization, methodology, writing—review and editing, supervision; A.T.Z.: conceptualization, methodology. All authors have read and agreed to the published version of the manuscript.

Funding

The work was carried out with financial support from the Ministry of Science and Higher Education of the Russian Federation in the framework of Increase Competitiveness Program of NUST “MISiS” (No. K2-2020-045), implemented by a governmental decree dated 16 March 2013, No. 211.

Institutional Review Board Statement

Not applicable.

Informed Consent Statement

Not applicable.

Data Availability Statement

Not applicable.

Conflicts of Interest

The authors declare no conflict of interest.

References

  1. Webster, P.J.; Ziebeck, K.R.A.; Town, S.L.; Peak, M.S. Magnetic order and phase transformation in Ni2MnGa. Philos. Mag. B 1984, 49, 295–310. [Google Scholar] [CrossRef]
  2. Ullakko, K.; Huang, J.K.; Kantner, C.; O’Handley, R.C. Large magnetic-field-induced strains in Ni2MnGa single crystals. Appl. Phys. Lett. 1996, 69, 1966–1968. [Google Scholar] [CrossRef]
  3. Chernenko, V.A.; Seguí, C.; Cesari, E.; Pons, J.; Kokorin, V.V. Sequence of martensitic transformations in Ni-Mn-Ga alloys. Phys. Rev. B 1998, 57, 2659–2662. [Google Scholar] [CrossRef] [Green Version]
  4. Wedel, B.; Suzuki, M.; Murakami, Y.; Wedel, C.; Suzuki, T.; Shindo, D.; Itagaki, K. Low temperature crystal structure of Ni-Mn-Ga alloys. J. Alloys Compd. 1999, 290, 137–142. [Google Scholar] [CrossRef]
  5. Glavatska, N.; Mogilniy, G.; Glavatsky, I.; Danilkin, S.; Hohlwein, D.; Beskrovnij, A.; Lindroos, V.K. Temperature dependence of martensite structure and its effect on magnetic-field-induced strain in Ni2MnGa magnetic shape memory alloys. J. Phys. IV France 2003, 112, 963–967. [Google Scholar] [CrossRef]
  6. Gavriljuk, V.G.; Söderberg, O.; Bliznuk, V.V.; Glavatska, N.I.; Lindroos, V.K. Martensitic transformations and mobility of twin boundaries in Ni2MnGa alloys studied by using internal friction. Scripta Mater. 2003, 49, 803–809. [Google Scholar] [CrossRef]
  7. Vasil’ev, A.N.; Buchel’nikov, V.D.; Takagi, T.; Khovailo, V.V.; Estrin, E.I. Shape memory ferromagnets. Phys. Usp. 2003, 46, 559–588. [Google Scholar] [CrossRef] [Green Version]
  8. Dubenko, I.; Samanta, T.; Pathak, A.K.; Kazakov, A.; Prudnikov, V.; Stadler, S.; Granovsky, A.; Zhukov, A.; Ali, N. Magnetocaloric effect and multifunctional properties of Ni-Mn-based Heusler alloys. J. Magn. Magn. Mater. 2012, 324, 3530–3534. [Google Scholar] [CrossRef]
  9. Dubenko, I.; Quetz, A.; Pandey, S.; Aryal, A.; Eubank, M.; Rodionov, I.; Prudnikov, V.; Granovsky, A.; Lähderanta, E.; Samanta, T.; et al. Multifunctional properties related to magnetostructural transitions in ternary and quaternary Heusler alloys. J. Magn. Magn. Mater. 2015, 383, 186–189. [Google Scholar] [CrossRef] [Green Version]
  10. Sozinov, A.; Likhachev, A.A.; Lanska, N.; Ullakko, K. Giant magnetic-field-induced strain in NiMnGa seven-layered martensitic phase. Appl. Phys. Lett. 2002, 80, 1746–1748. [Google Scholar] [CrossRef]
  11. Buchelnikov, V.D.; Vasiliev, A.N.; Koledov, V.; Taskaev, S.V.; Khovaylo, V.V.; Shavrov, V.G. Magnetic shape-memory alloys: Phase transitions and functional properties. Phys. Usp. 2006, 49, 871–877. [Google Scholar] [CrossRef]
  12. Planes, A.; Manosa, L.; Acet, M. Magnetocaloric effect and its relation to shape-memory properties in ferromagnetic Heusler alloys. J. Phys. Condens. Matter. 2009, 21, 233201. [Google Scholar] [CrossRef] [Green Version]
  13. Kamantsev, A.P.; Koledov, V.V.; Mashirov, A.V.; Dilmieva, E.T.; Shavrov, V.G.; Cwik, J.; Los, A.S.; Nizhankovskii, V.I.; Rogacki, K.; Tereshina, I.S.; et al. Magnetocaloric and thermomagnetic properties of Ni2.18Mn0.82Ga Heusler alloy in high magnetic fields up to 140 kOe. J. Appl. Phys. 2015, 117, 163903. [Google Scholar] [CrossRef] [Green Version]
  14. Pons, J.; Chernenko, V.A.; Santamarta, R.; Cesari, E. Crystal structure of martensitic phases in Ni-Mn-Ga shape memory alloys. Acta Mater. 2000, 48, 3027–3038. [Google Scholar] [CrossRef]
  15. Bozhko, A.D.; Vasil’ev, A.N.; Khovailo, V.V.; Buchel’nikov, V.D.; Dikshtein, I.E.; Seletskii, S.M.; Shavrov, V.G. Phase transitions in the ferromagnetic alloys Ni2+xMn1-xGa. JETP Lett. 1998, 67, 227–232. [Google Scholar] [CrossRef]
  16. Vasil’ev, A.N.; Bozhko, A.D.; Khovailo, V.V.; Dikshtein, I.E.; Shavrov, V.G.; Buchelnikov, V.D.; Matsumoto, M.; Suzuki, S.; Takagi, T.; Tani, J. Structural and magnetic phase transitions in shape-memory alloys Ni2+xMn1-xGa. Phys. Rev. B 1999, 59, 1113–1120. [Google Scholar] [CrossRef]
  17. Jin, X.; Marioni, M.; Bono, D.; Allen, S.M.; O’Handley, R.C.; Hsu, T.Y. Empirical mapping of Ni-Mn-Ga properties with composition and valence electron concentration. J. Appl. Phys. 2002, 91, 8222–8224. [Google Scholar] [CrossRef]
  18. Khovaylo, V.V.; Buchelnikov, V.D.; Kainuma, R.; Koledov, V.V.; Otsuka, M.; Shavrov, V.G.; Takagi, T.; Taskaev, S.V.; Vasiliev, A.N. Phase transitions in Ni2+xMn1-xGa with a high Ni excess. Phys. Rev. B 2005, 72, 224408. [Google Scholar] [CrossRef] [Green Version]
  19. Entel, P.; Buchelnikov, V.D.; Khovailo, V.V.; Zayak, A.T.; Adeagbo, W.A.; Gruner, M.E.; Herper, H.C.; Wassermann, E.F. Modelling the phase diagram of magnetic shape memory Heusler alloys. J. Phys. D Appl. Phys. 2006, 39, 865–889. [Google Scholar] [CrossRef]
  20. Wang, Y.F.; Wang, J.M.; Jiang, C.B.; Xu, H.B. Composition triangle diagrams of Ni-Mn-Ga magnetic shape memory alloys. Acta Metall. Sin. (Engl. Lett.) 2006, 19, 171–175. [Google Scholar] [CrossRef]
  21. Buchelnikov, V.D.; Taskaev, S.V.; Zagrebin, M.A.; Ermakov, D.I.; Koledov, V.V.; Shavrov, V.G.; Takagi, T. The phase diagrams of Ni-Mn-Ga alloys in the magnetic field. J. Magn. Magn. Mater. 2007, 313, 312–316. [Google Scholar] [CrossRef]
  22. Çakır, A.; Righi, L.; Albertini, F.; Acet, M.; Farle, M.; Aktúrk, S. Extended investigation of intermartensitic transitions in Ni-Mn-Ga magnetic shape memory alloys: A detailed phase diagram determination. J. Appl. Phys. 2013, 114, 183912. [Google Scholar] [CrossRef]
  23. Liu, G.D.; Chen, J.L.; Liu, Z.H.; Dai, X.F.; Wu, G.H.; Zhang, B.; Zhang, X.X. Martensitic transformation and shape memory effect in a ferromagnetic shape memory alloy: Mn2NiGa. Appl. Phys. Lett. 2005, 87, 262504. [Google Scholar] [CrossRef]
  24. Liu, G.D.; Dai, X.F.; Yu, S.Y.; Zhu, Z.Y.; Chen, J.L.; Wu, G.H.; Zhu, H.; Xiao, J.Q. Physical and electronic structure and magnetism of Mn2NiGa: Experiment and density-functional theory calculations. Phys. Rev. B 2006, 74, 054435. [Google Scholar] [CrossRef] [Green Version]
  25. Singh, S.; Maniraj, M.; D’Souza, S.W.; Ranjan, R.; Barman, S.R. Structural transformations in Mn2NiGa due to residual stress. Appl. Phys. Lett. 2010, 96, 081904. [Google Scholar] [CrossRef]
  26. Barman, S.R.; Banik, S.; Shukla, A.K.; Kamal, C.; Chakrabarti, A. Martensitic transition, ferrimagnetism and Fermi surface nesting in Mn2NiGa. Europhys. Lett. 2007, 80, 57002. [Google Scholar] [CrossRef]
  27. Chakrabarti, A.; Siewert, M.; Roy, T.; Mondal, K.; Banerjee, A.; Gruner, M.E.; Entel, P. Ab initio studies of effect of copper substitution on the electronic and magnetic properties of Ni2MnGa and Mn2NiGa. Phys. Rev. B 2013, 88, 174116. [Google Scholar] [CrossRef]
  28. Kundu, A.; Gruner, M.E.; Siewert, M.; Hucht, A.; Entel, P.; Ghosh, S. Interplay of phase sequence and electronic structure in the modulated martensites of Mn2NiGa from first-principles calculations. Phys. Rev. B 2017, 96, 064107-13. [Google Scholar] [CrossRef] [Green Version]
  29. Barman, S.R.; Chakrabarti, A.; Singh, S.; Banik, S.; Bhardwaj, S.; Paulose, P.L.; Chalke, B.A.; Panda, A.K.; Mitra, A.; Awasthi, A.M. Theoretical prediction and experimental study of a ferromagnetic shape memory alloy: Ga2MnNi. Phys. Rev. B 2008, 78, 134406. [Google Scholar] [CrossRef] [Green Version]
  30. Uijttewaal, M.A.; Hickel, T.; Neugebauer, J.; Gruner, M.E.; Entel, P. Understanding the Phase Transitions of the Ni2MnGa Magnetic Shape Memory System from First Principles. Phys. Rev. Lett. 2009, 102, 035702. [Google Scholar] [CrossRef]
  31. Buchelnikov, V.D.; Sokolovskiy, V.V.; Herper, H.C.; Ebert, H.; Gruner, M.E.; Taskaev, S.V.; Khovaylo, V.V.; Hucht, A.; Dannenberg, A.; Ogura, M.; et al. First-principles and Monte Carlo study of magnetostructural transition and magnetocaloric properties of Ni2+xMn1-xGa. Phys. Rev. B 2010, 81, 094411. [Google Scholar] [CrossRef]
  32. Li, C.-M.; Luo, H.-B.; Hu, Q.-M.; Yang, R.; Johansson, B.; Vitos, L. Temperature dependence of elastic properties of Ni2+xMn1-xGa and Ni2Mn(Ga1-xAlx) from first principles. Phys. Rev. B 2011, 84, 174117. [Google Scholar] [CrossRef]
  33. Hickel, T.; Uijttewaal, M.; Al-Zubi, A.; Dutta, B.; Grabowski, B.; Neugebauer, J. Ab Initio-Based Prediction of Phase Diagrams: Application to Magnetic Shape Memory Alloys. Adv. Eng. Mater. 2012, 14, 547–561. [Google Scholar] [CrossRef]
  34. Xu, N.; Raulot, J.M.; Li, Z.B.; Bai, J.; Yang, B.; Zhang, Y.D.; Meng, X.Y.; Zhao, X.; Zuo, L.; Esling, C. Composition-dependent structural and magnetic properties of Ni-Mn-Ga alloys studied by ab initio calculations. J. Mater. Sci. 2015, 50, 3825–3834. [Google Scholar] [CrossRef]
  35. Dutta, B.; Çakır, A.; Giacobbe, C.; Al-Zubi, A.; Hickel, T.; Acet, M.; Neugebauer, J. Ab initio Prediction of Martensitic and Intermartensitic Phase Boundaries in Ni-Mn-Ga. Phys. Rev. Lett. 2016, 116, 025503. [Google Scholar] [CrossRef] [PubMed]
  36. Sokolovskiy, V.V.; Gruner, M.E.; Entel, P.; Acet, M.; Çakir, A.; Baigutlin, D.R.; Buchelnikov, V.D. Segregation tendency of Heusler alloys. Phys. Rev. Mater. 2019, 3, 084413. [Google Scholar] [CrossRef]
  37. Sokolovskaya, Y.A.; Sokolovskiy, V.V.; Zagrebin, M.A.; Buchelnikov, V.D.; Zayak, A.T. Ab Initio Study of the Composite Phase Diagram of Ni-Mn-Ga Shape Memory Alloys. J. Exp. Theor. Phys. 2017, 125, 104–110. [Google Scholar] [CrossRef]
  38. Sokolovskiy, V.V.; Sokolovskaya, Y.A.; Zagrebin, M.A.; Buchelnikov, V.D.; Zayak, A.T. Ternary diagrams of magnetic properties of Ni-Mn-Ga Heusler alloys from ab initio and Monte Carlo studies. J. Magn. Magn. Mater. 2019, 470, 64–68. [Google Scholar] [CrossRef]
  39. Sokolovskaya, Y.; Zagrebin, M.; Buchelnikov, V.; Zayak, A. Ternary phase diagram of Ni-Mn-Ga: Insights from ab initio calculations. EPJ Web Conf. 2018, 185, 05012. [Google Scholar] [CrossRef]
  40. Ebert, H.; Koedderitzsch, D.; Minar, J. Calculating condensed matter properties using the KKR-Green’s function method—Recent developments and applications. Rep. Prog. Phys. 2011, 74, 096501. [Google Scholar] [CrossRef]
  41. Kresse, G.; Furthmüller, J. Efficient iterative schemes for ab initio total-energy calculations using a plane-wave basis set. Phys. Rev. B 1996, 54, 11169–11186. [Google Scholar] [CrossRef] [PubMed]
  42. Kresse, G.; Joubert, D. From ultrasoft pseudopotentials to the projector augmented-wave method. Phys. Rev. B 1999, 59, 1758–1775. [Google Scholar] [CrossRef]
  43. Anelli, A.; Engel, E.; Pickard C., J.; Ceriotti, M. Generalized convex hull construction for materials discovery. Phys. Rev. Mater. 2018, 2, 103804-8. [Google Scholar] [CrossRef] [Green Version]
  44. Perdew, J.P.; Burke, K.; Ernzerhof, M. Generalized Gradient Approximation Made Simple. Phys. Rev. Lett. 1996, 77, 3865–3868. [Google Scholar] [CrossRef] [PubMed] [Green Version]
  45. Chernenko, V.A.; Cesari, E.; Kokorin, V.V.; Vitenko, I.N. The development of new ferromagnetic shape memory alloys in Ni-Mn-Ga system. Scr. Metall. Mater. 1995, 33, 1239–1244. [Google Scholar] [CrossRef]
  46. Adachi, K.; Wayman, C.M. Transformation behavior of nearly stoichiometric Ni-Mn alloys. Metall. Trans. A 1985, 16, 1567–1579. [Google Scholar] [CrossRef]
  47. Entel, P.; Dannenberg, A.; Siewert, M.; Herper, H.C.; Gruner, M.E.; Buchelnikov, V.D.; Chernenko, V.A. Composition-Dependent Basics of Smart Heusler Materials from First- Principles Calculations. Mater. Sci. Forum 2011, 684, 1–29. [Google Scholar] [CrossRef]
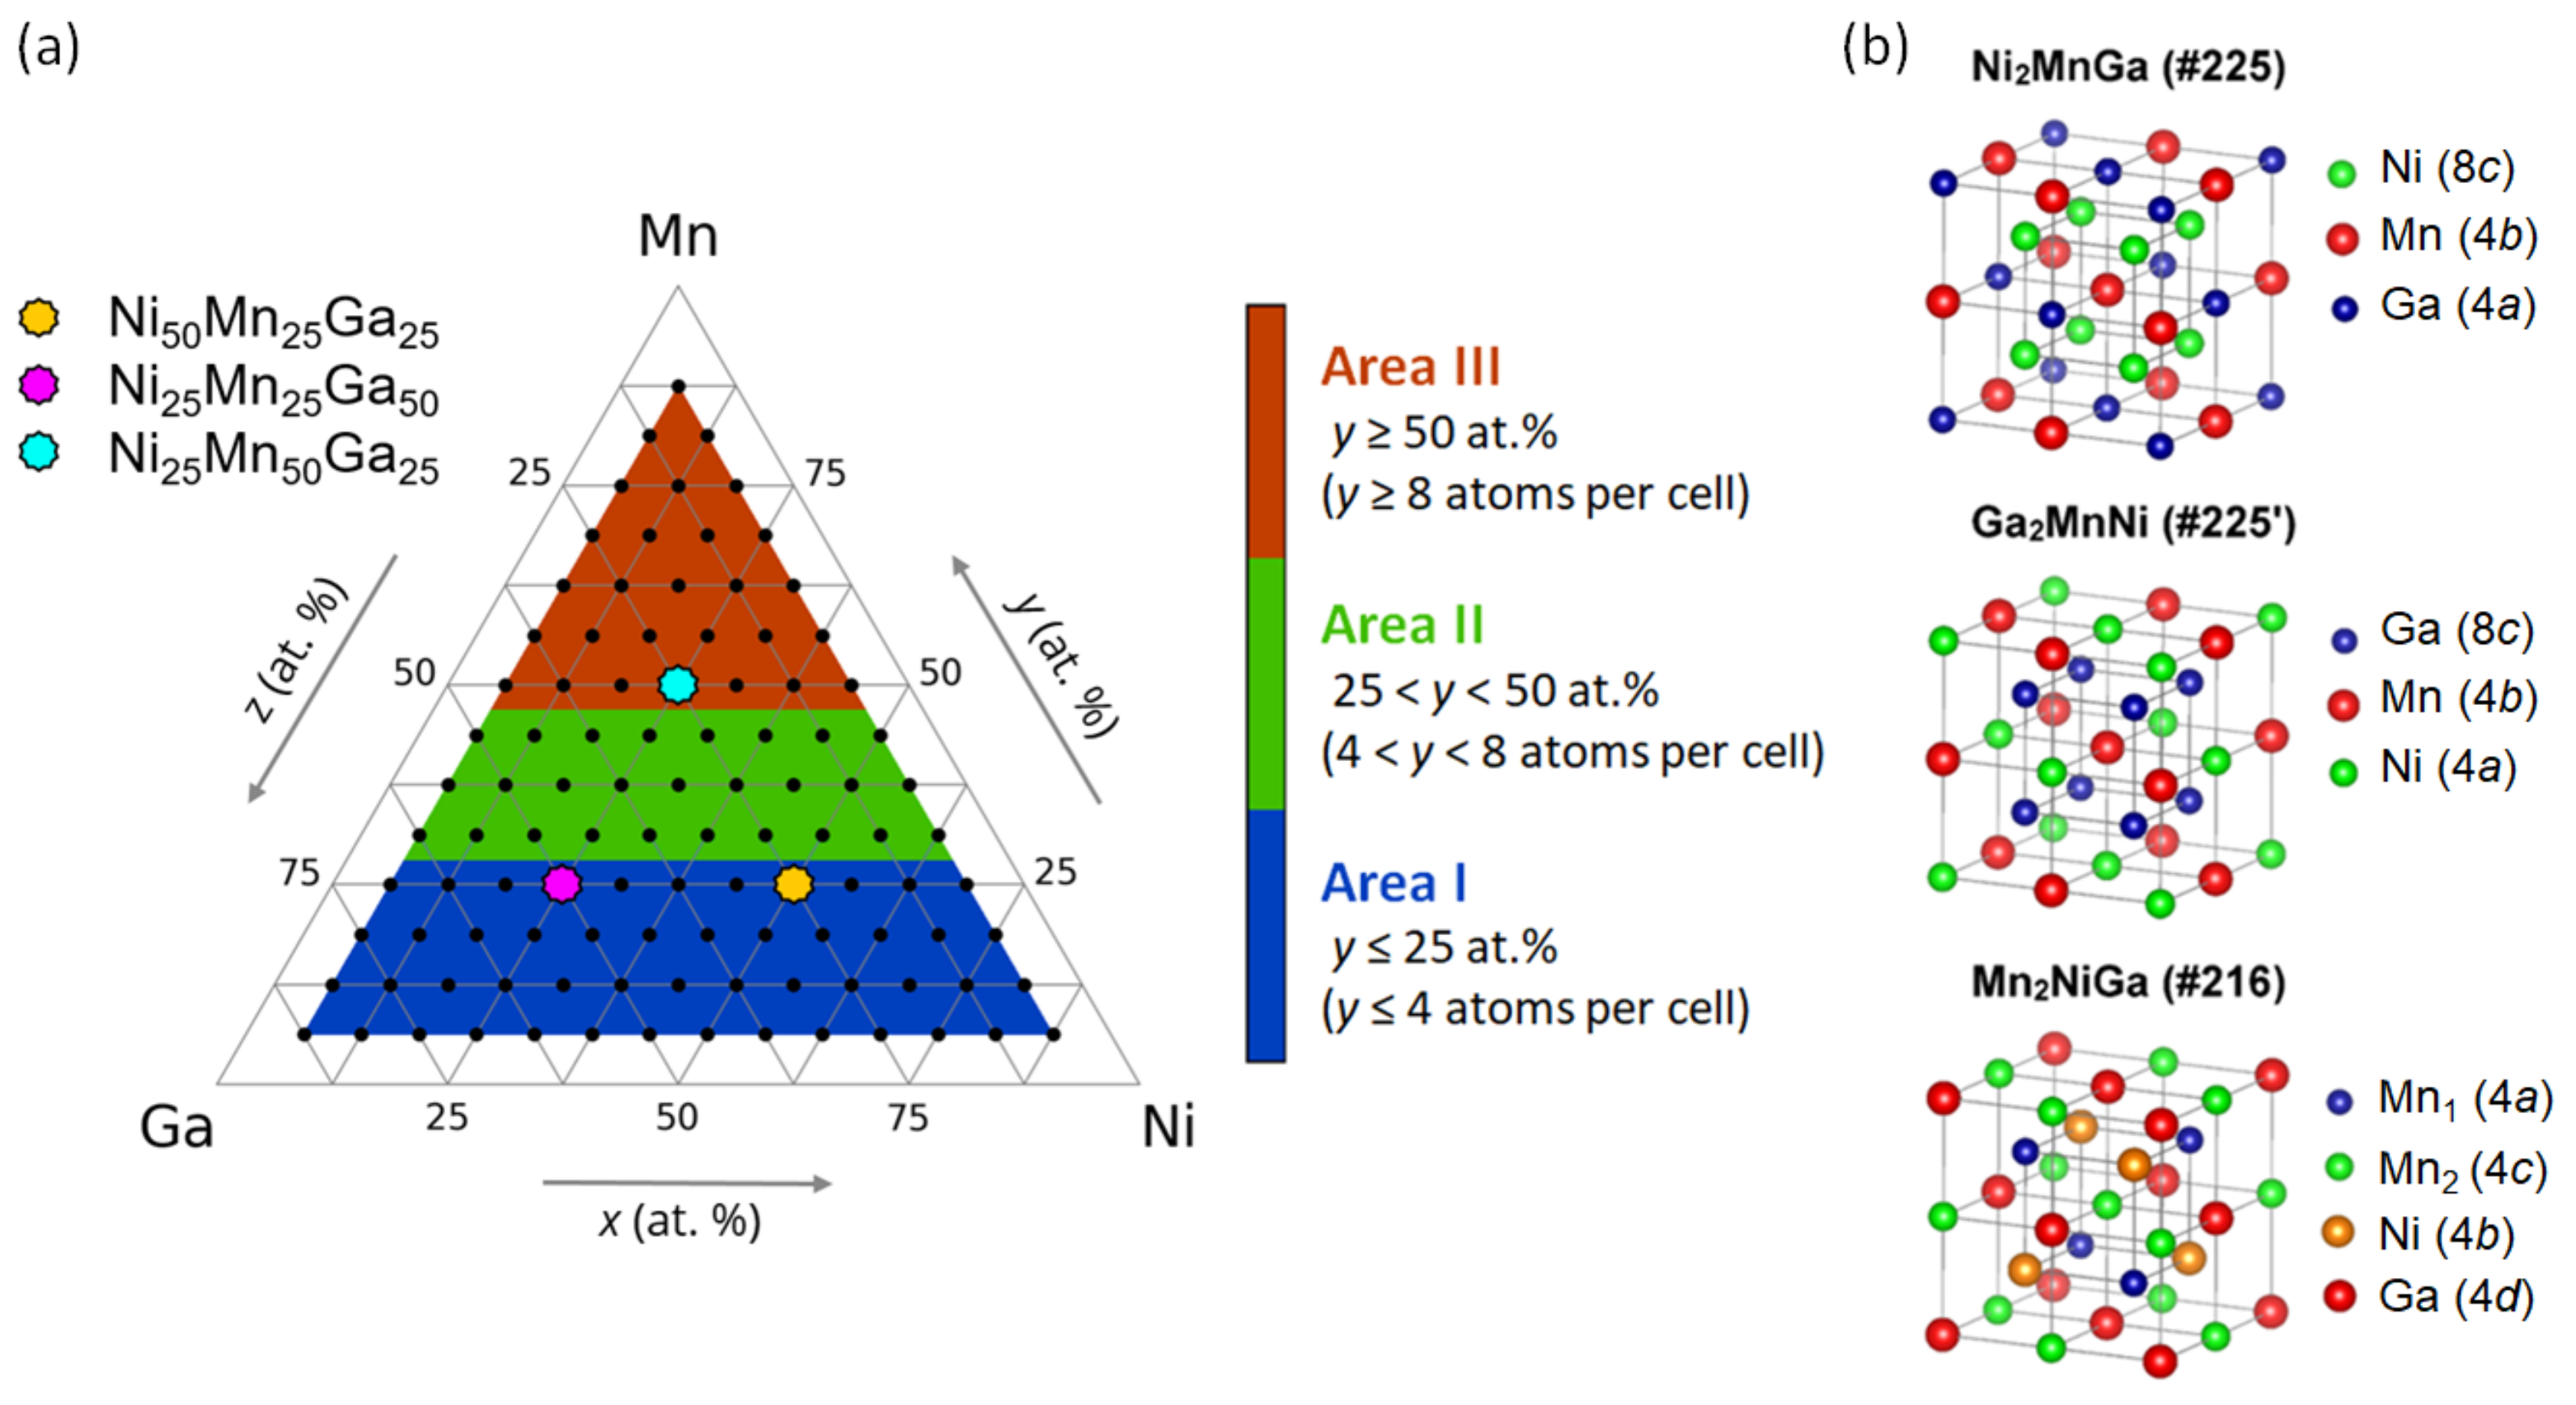
Figure 1. (Color online) (a) The set of 105 composition points formed by the 16-atom supercells and represented as a ternary diagram of the Ni–Mn–Ga system. Color circles denote the stoichiometric compositions. (b) Regular ( # 225 and # 225 ) and inverse ( # 216 ) cubic Heusler structures with the corresponding Wyckoff positions for the stoichiometric compounds.
Metals 11 00973 g001
Figure 2. (Color online) Distribution of stable austenitic crystal structures mapped into the ternary diagram of Ni x Mn y Ga z . Open circles indicate the compositions with tetragonally and orthorhombically distorted structures afforded by the geometric optimization procedure of an initial cubic structure. Here #225 mix indicates the regular structure with 8 c sites simultaneously occupied by Ni and Ga.
Metals 11 00973 g002
Figure 3. (Color online) Formation energy mapped into the ternary diagram of Ni x Mn y Ga z compounds with favorable (a) cubic and (b) tetragonal and orthorhombic crystal structures.
Metals 11 00973 g003
Figure 4. (Color online) The ternary maps of the stable reactions for Ni x Mn y Ga z in the (a) austenitic and (b) martensitic phases against the decomposition into a mixture of stable compounds. Here, 0% and 100% correspond to the unstable and stable Ni x Mn y Ga z compositions.
Metals 11 00973 g004
Figure 5. (Color online) Calculated (a) equilibrium lattice parameter a 0 and (b) tetragonal ratio c / a mapped into the ternary diagram of Ni x Mn y Ga z compounds in austenite and martensite. (c) Theoretical and (d) experimental large-scale a 0 maps. The list of experimental compositions is tabulated in Table S17, see the SM. Label O in (b) denotes the region with a favorable orthorhombic structure. For the orthorhombic structure, the b / a ratio is presented in Table S8, see the SM.
Metals 11 00973 g005
Figure 6. (Color online) Calculated total magnetic moments together with preferable spin alignment of Ni x Mn y Ga z in the (a) austenitic and (b) martensitic phase. (c) Theoretical and (d) experimental large-scale maps of the total magnetic moment in the martensitic phase. The experimental compositions are listed in Table S18, see the Supplementary Materials.
Metals 11 00973 g006
Figure 7. (Color online) (a,b) Theoretical and (c) experimental martensitic transition temperature of Ni x Mn y Ga z . In the case of (b,c), the large-scale contour maps in the vicinity of Ni 50 Mn 25 Ga 25 are illustrated. The list of experimental compositions is presented in Table S19, see the SM.
Metals 11 00973 g007
Publisher’s Note: MDPI stays neutral with regard to jurisdictional claims in published maps and institutional affiliations.