
Influence of Uniaxial Deformation on Texture Evolution and Anisotropy of 3104 Al Sheet with Different Initial Microstructure

 ,
, 
 and
and 
Abstract
:1. Introduction
2. Materials and Methods
2.1. Tensile Testing
2.2. Hardness and Conductivity Measurements
2.3. Optical Microscopy
2.4. Metallographic Examination—Texture
- -
- Rolling components: Copper {112}<111>, S2{213}<-1-42>, S3 (or S) {123}<634>, Taylor{4411}<11118>, Brass {011}<211>
- -
- Recrystallization components: Cube {001}<100>, P{011}<111>, Q{013}<2-31>, R{124}<211>, Goss{011}<100>
3. Results
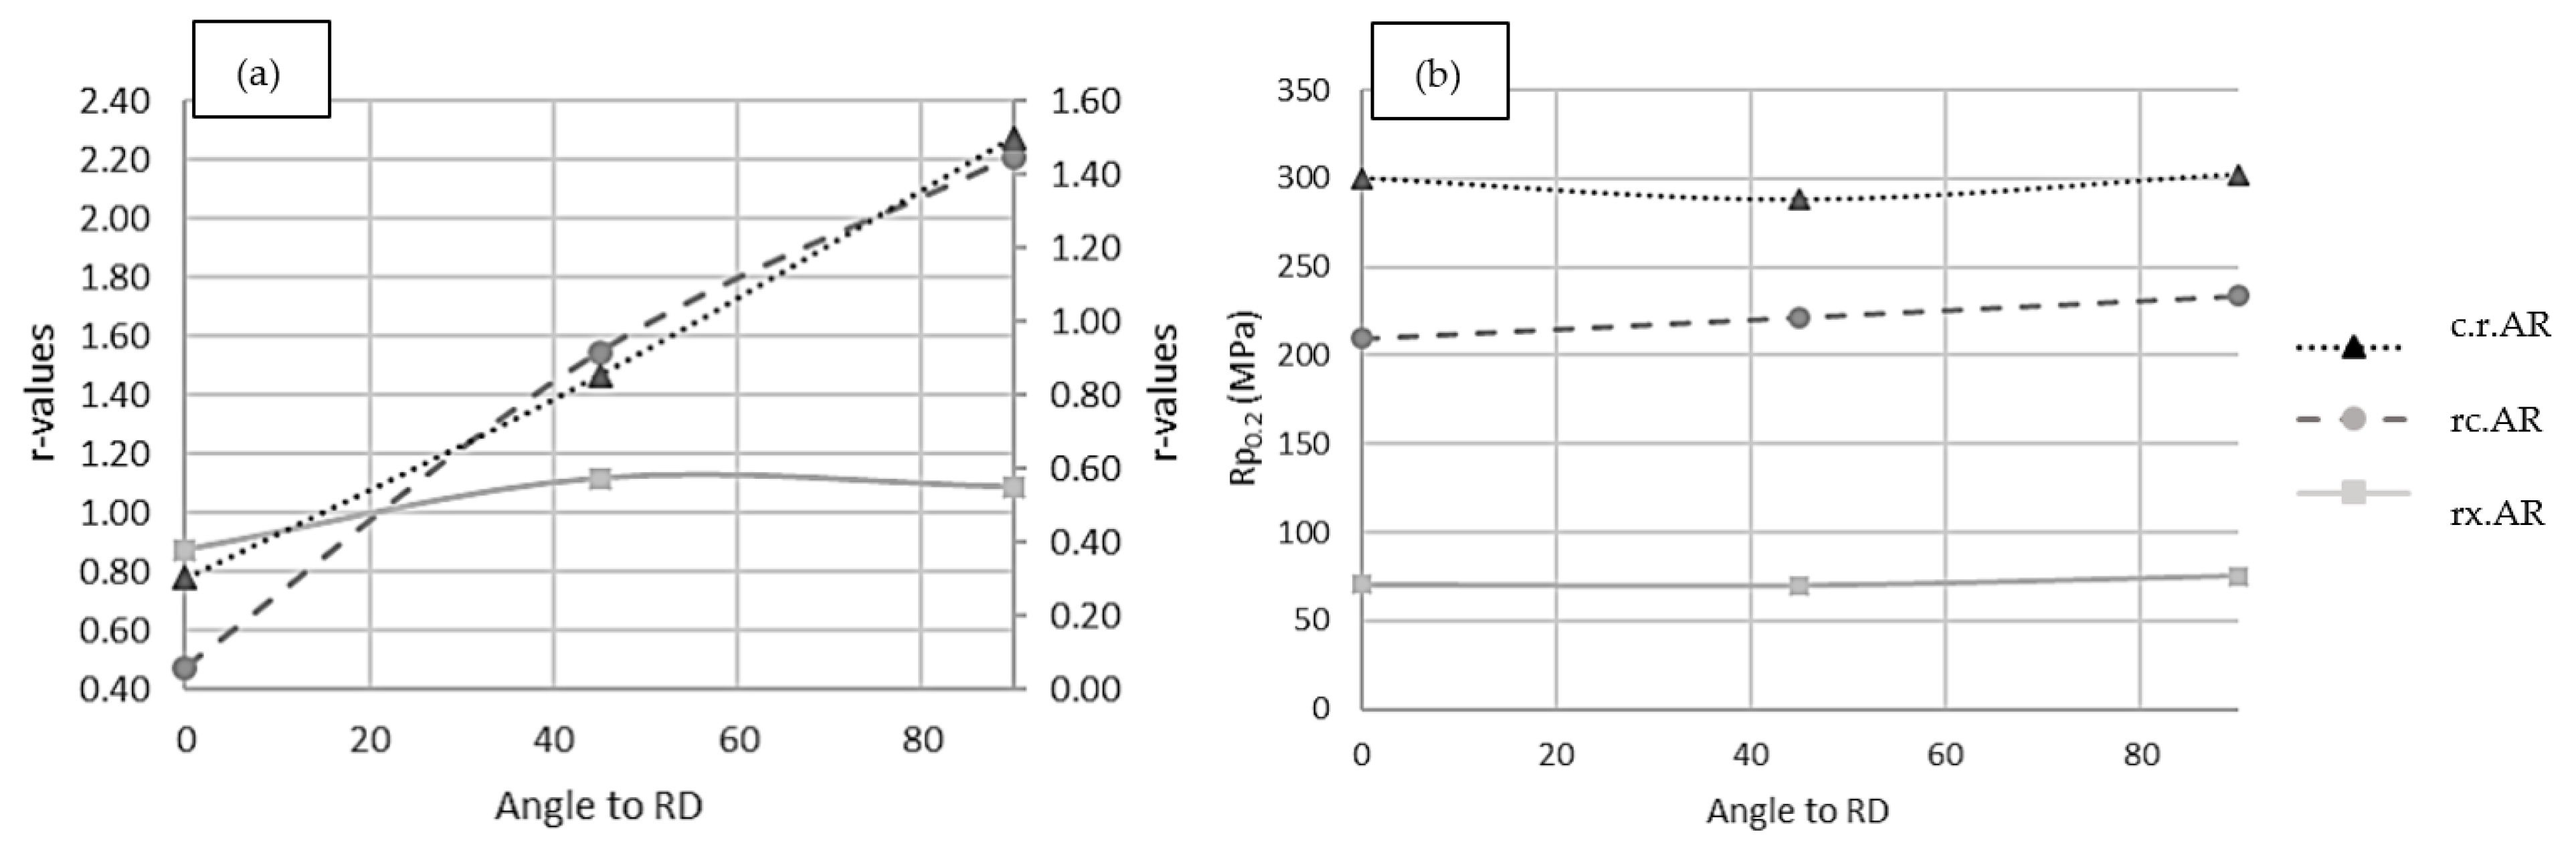
3.1. Mechanical Behavior (Tensile Testing, Anisotropy)
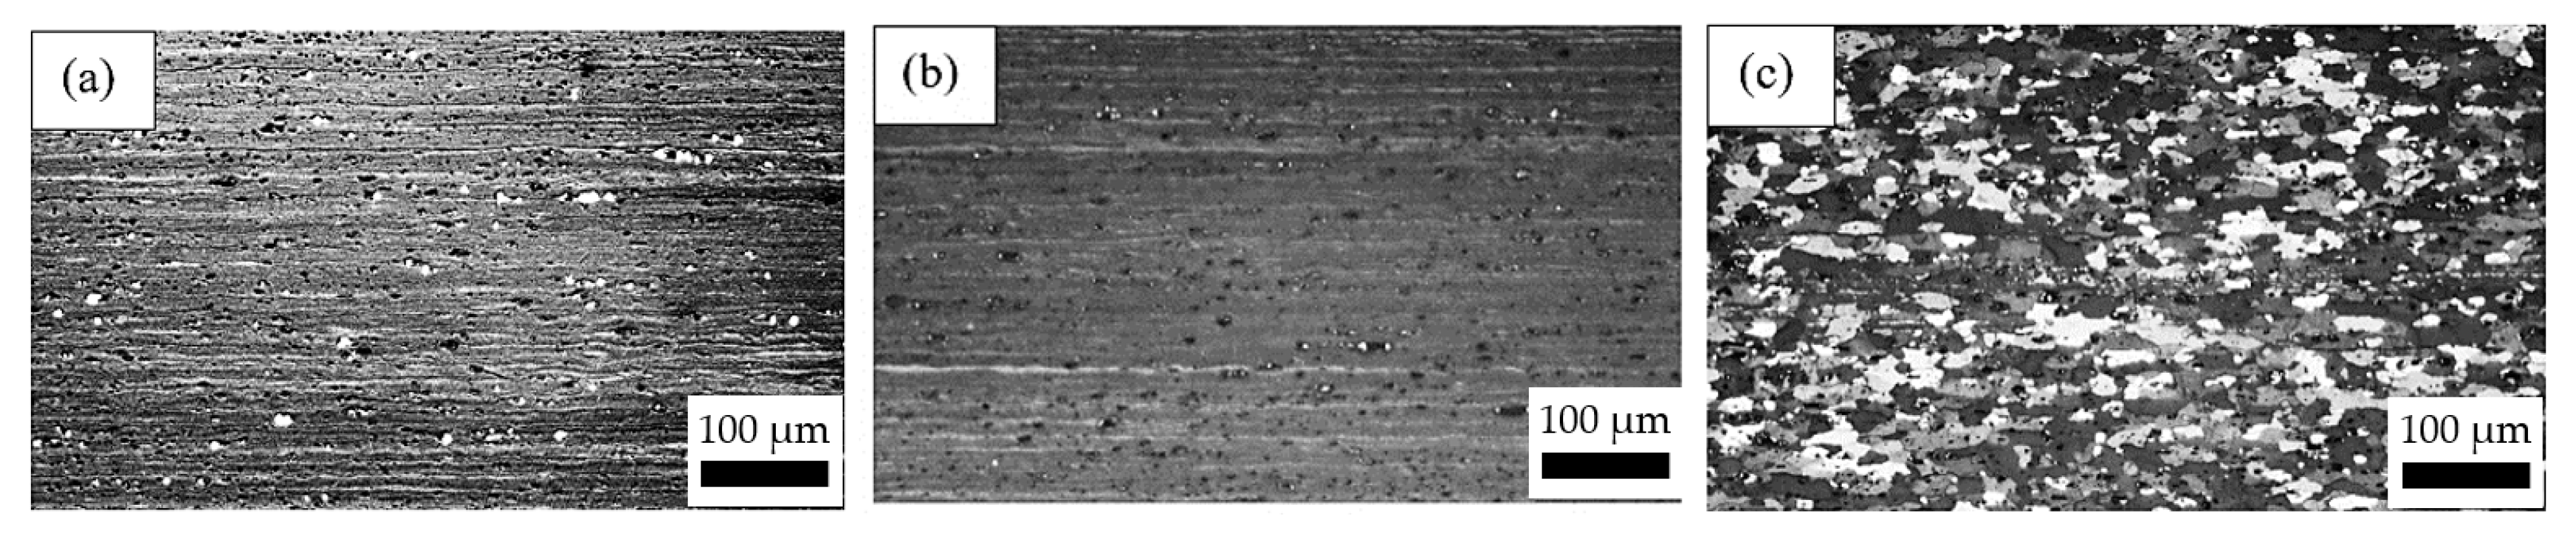
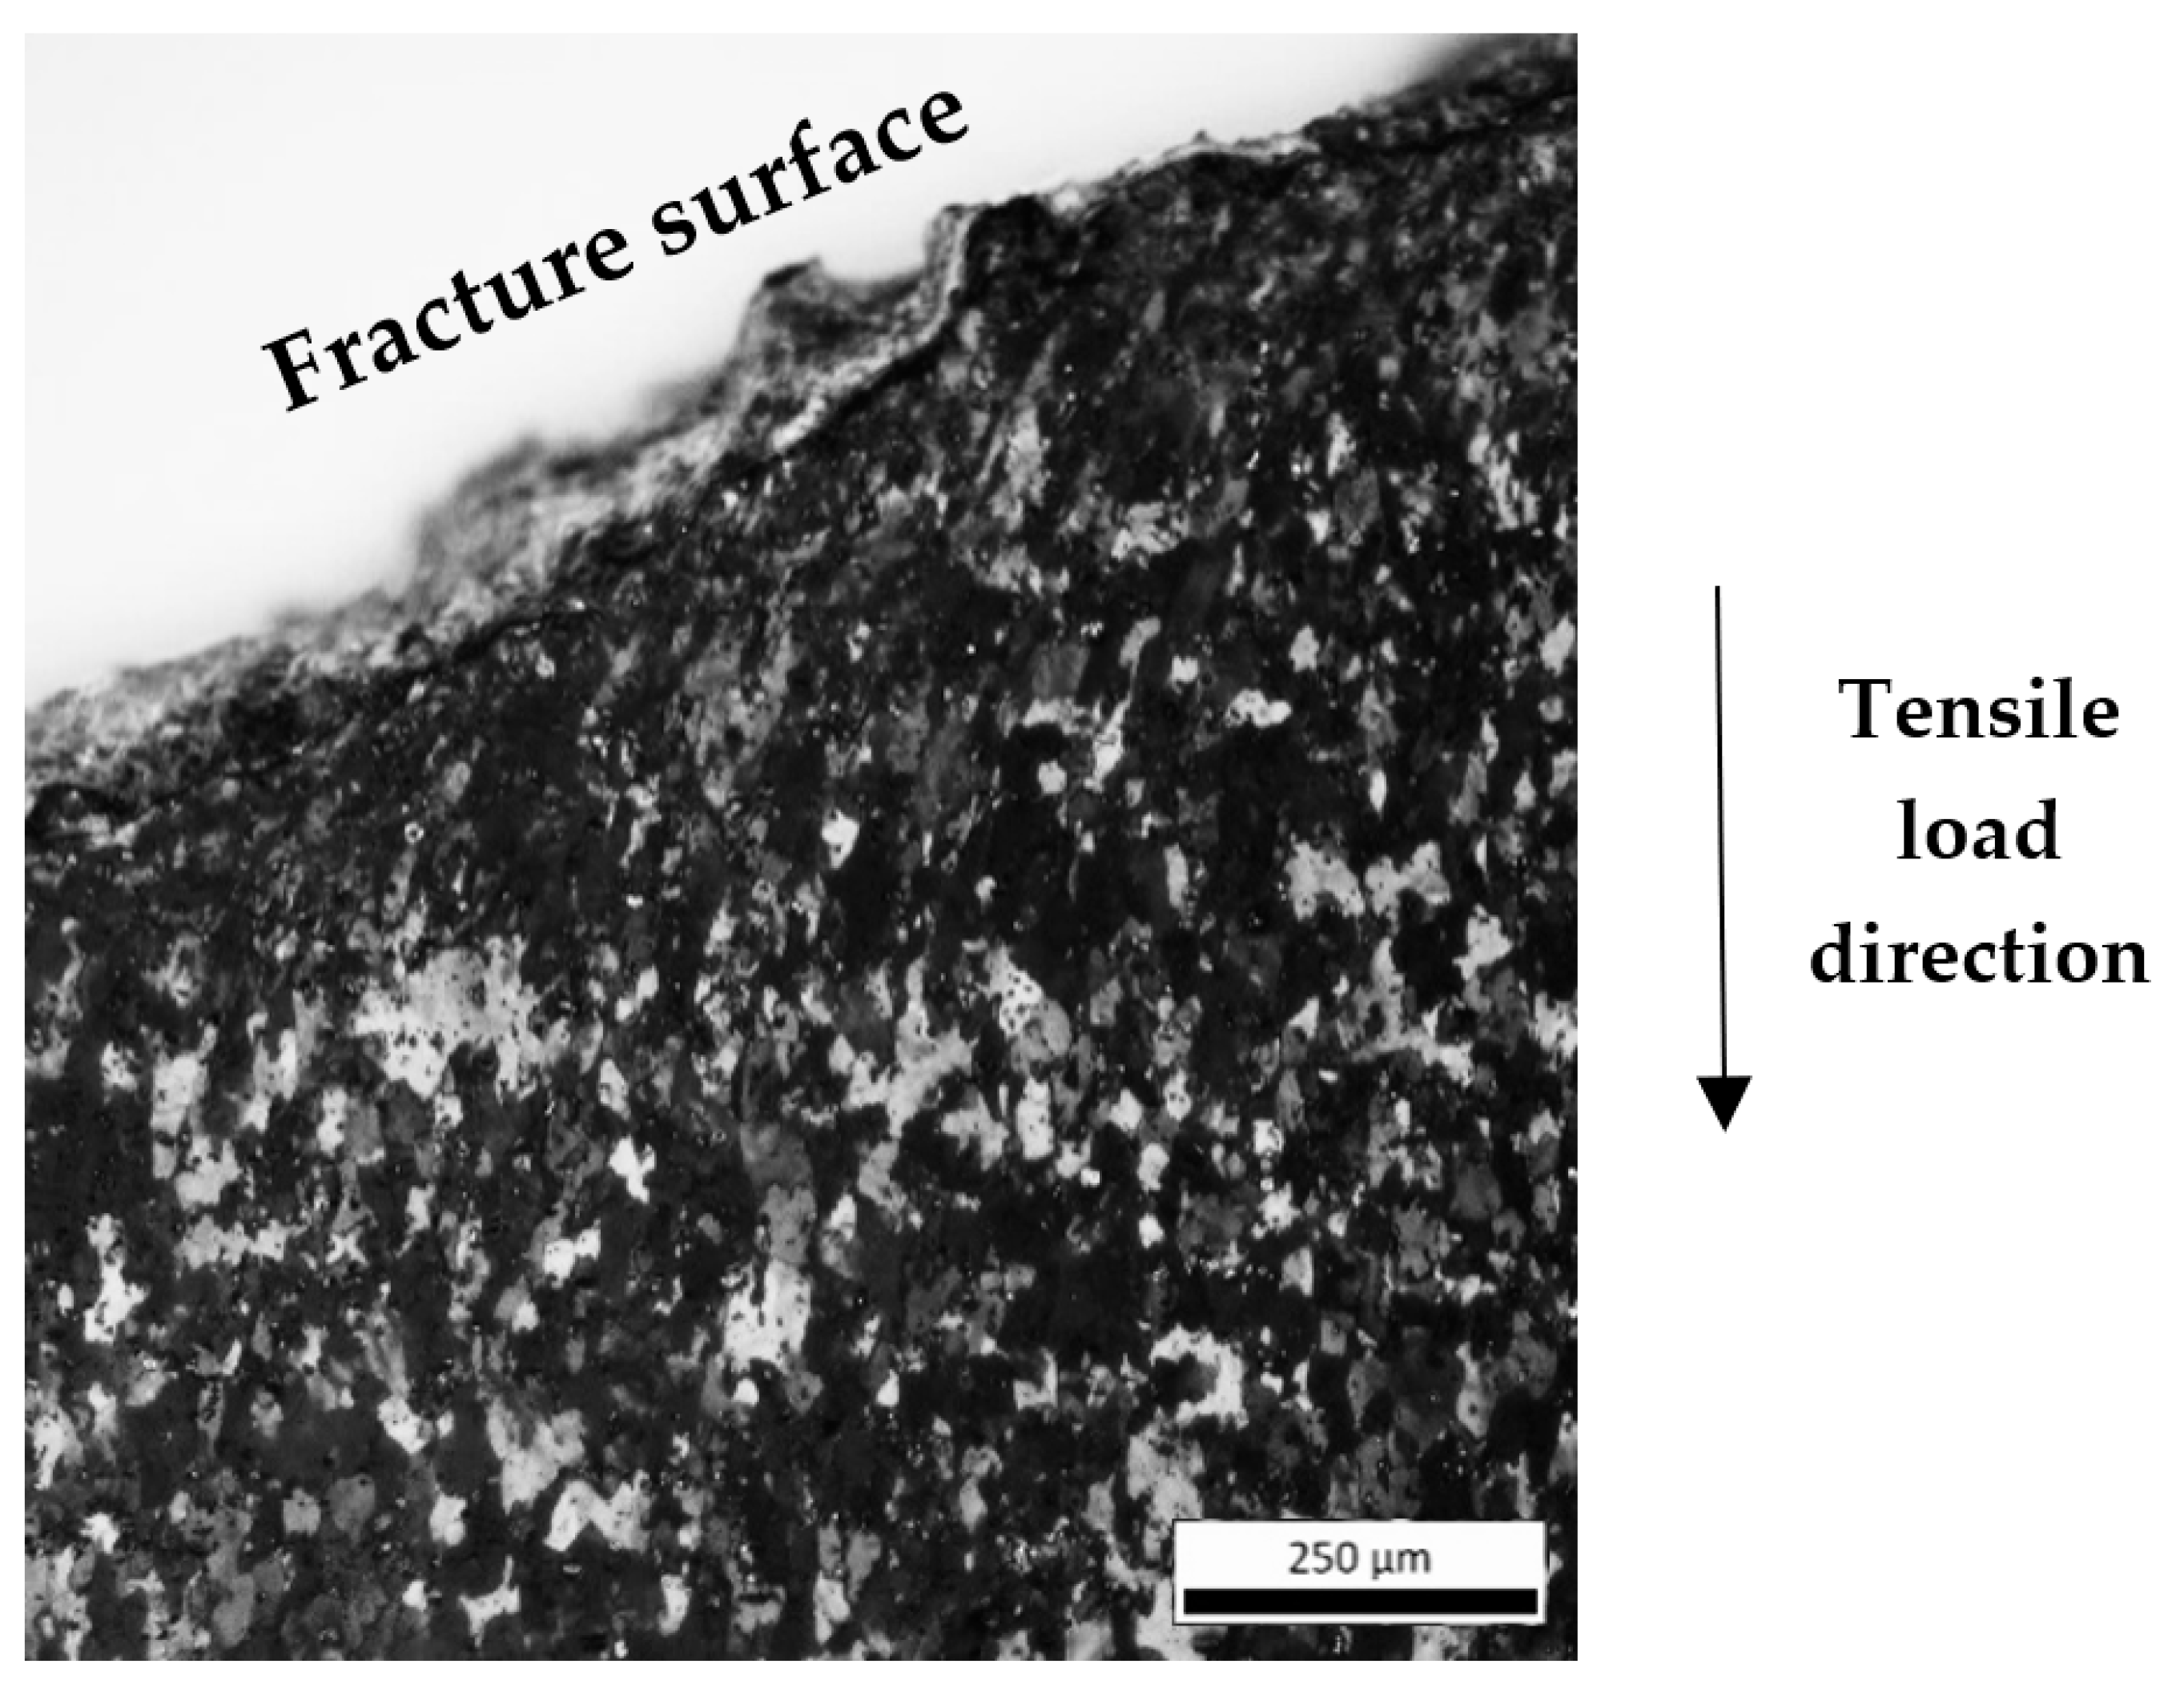
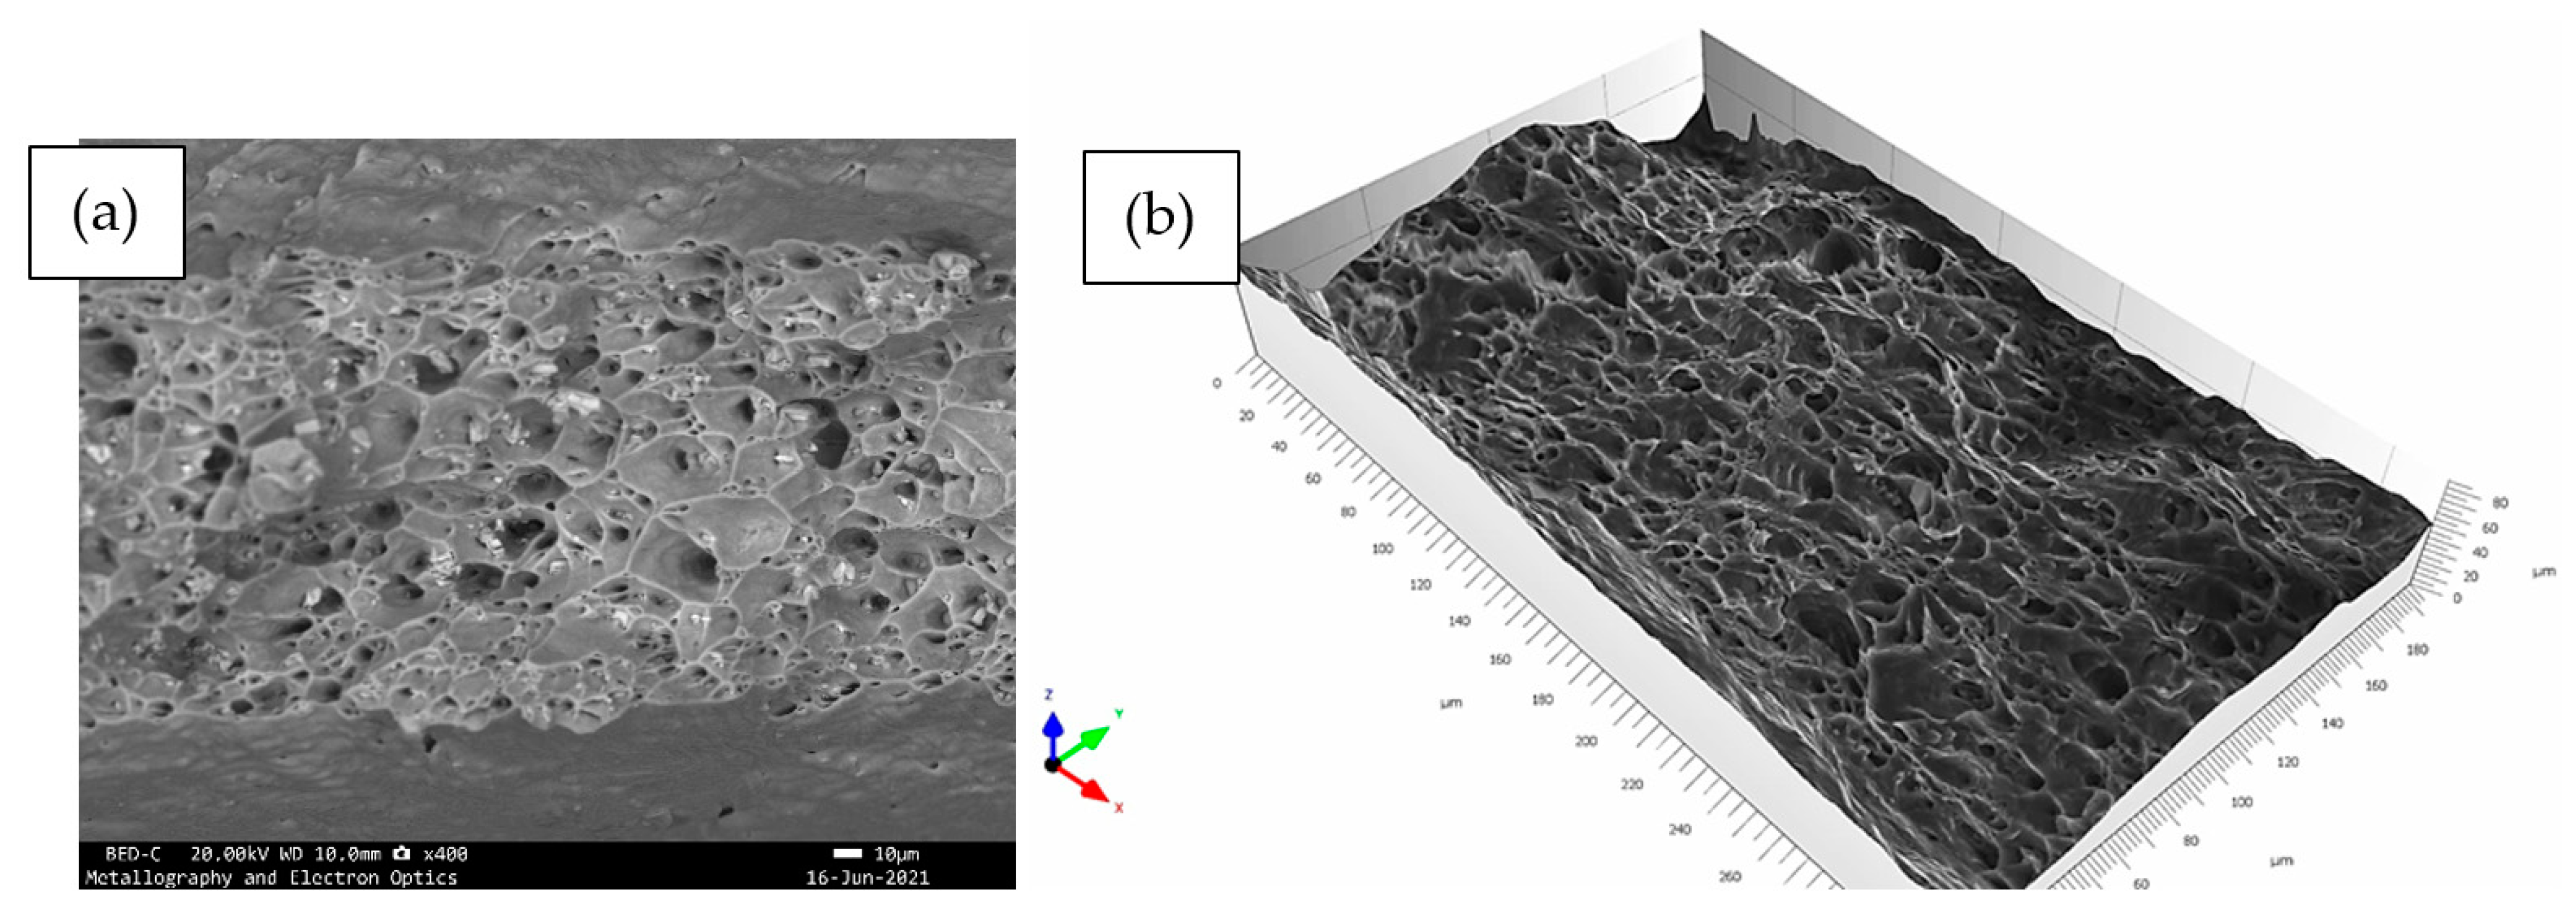
3.2. Microstructural Analysis and Fractography
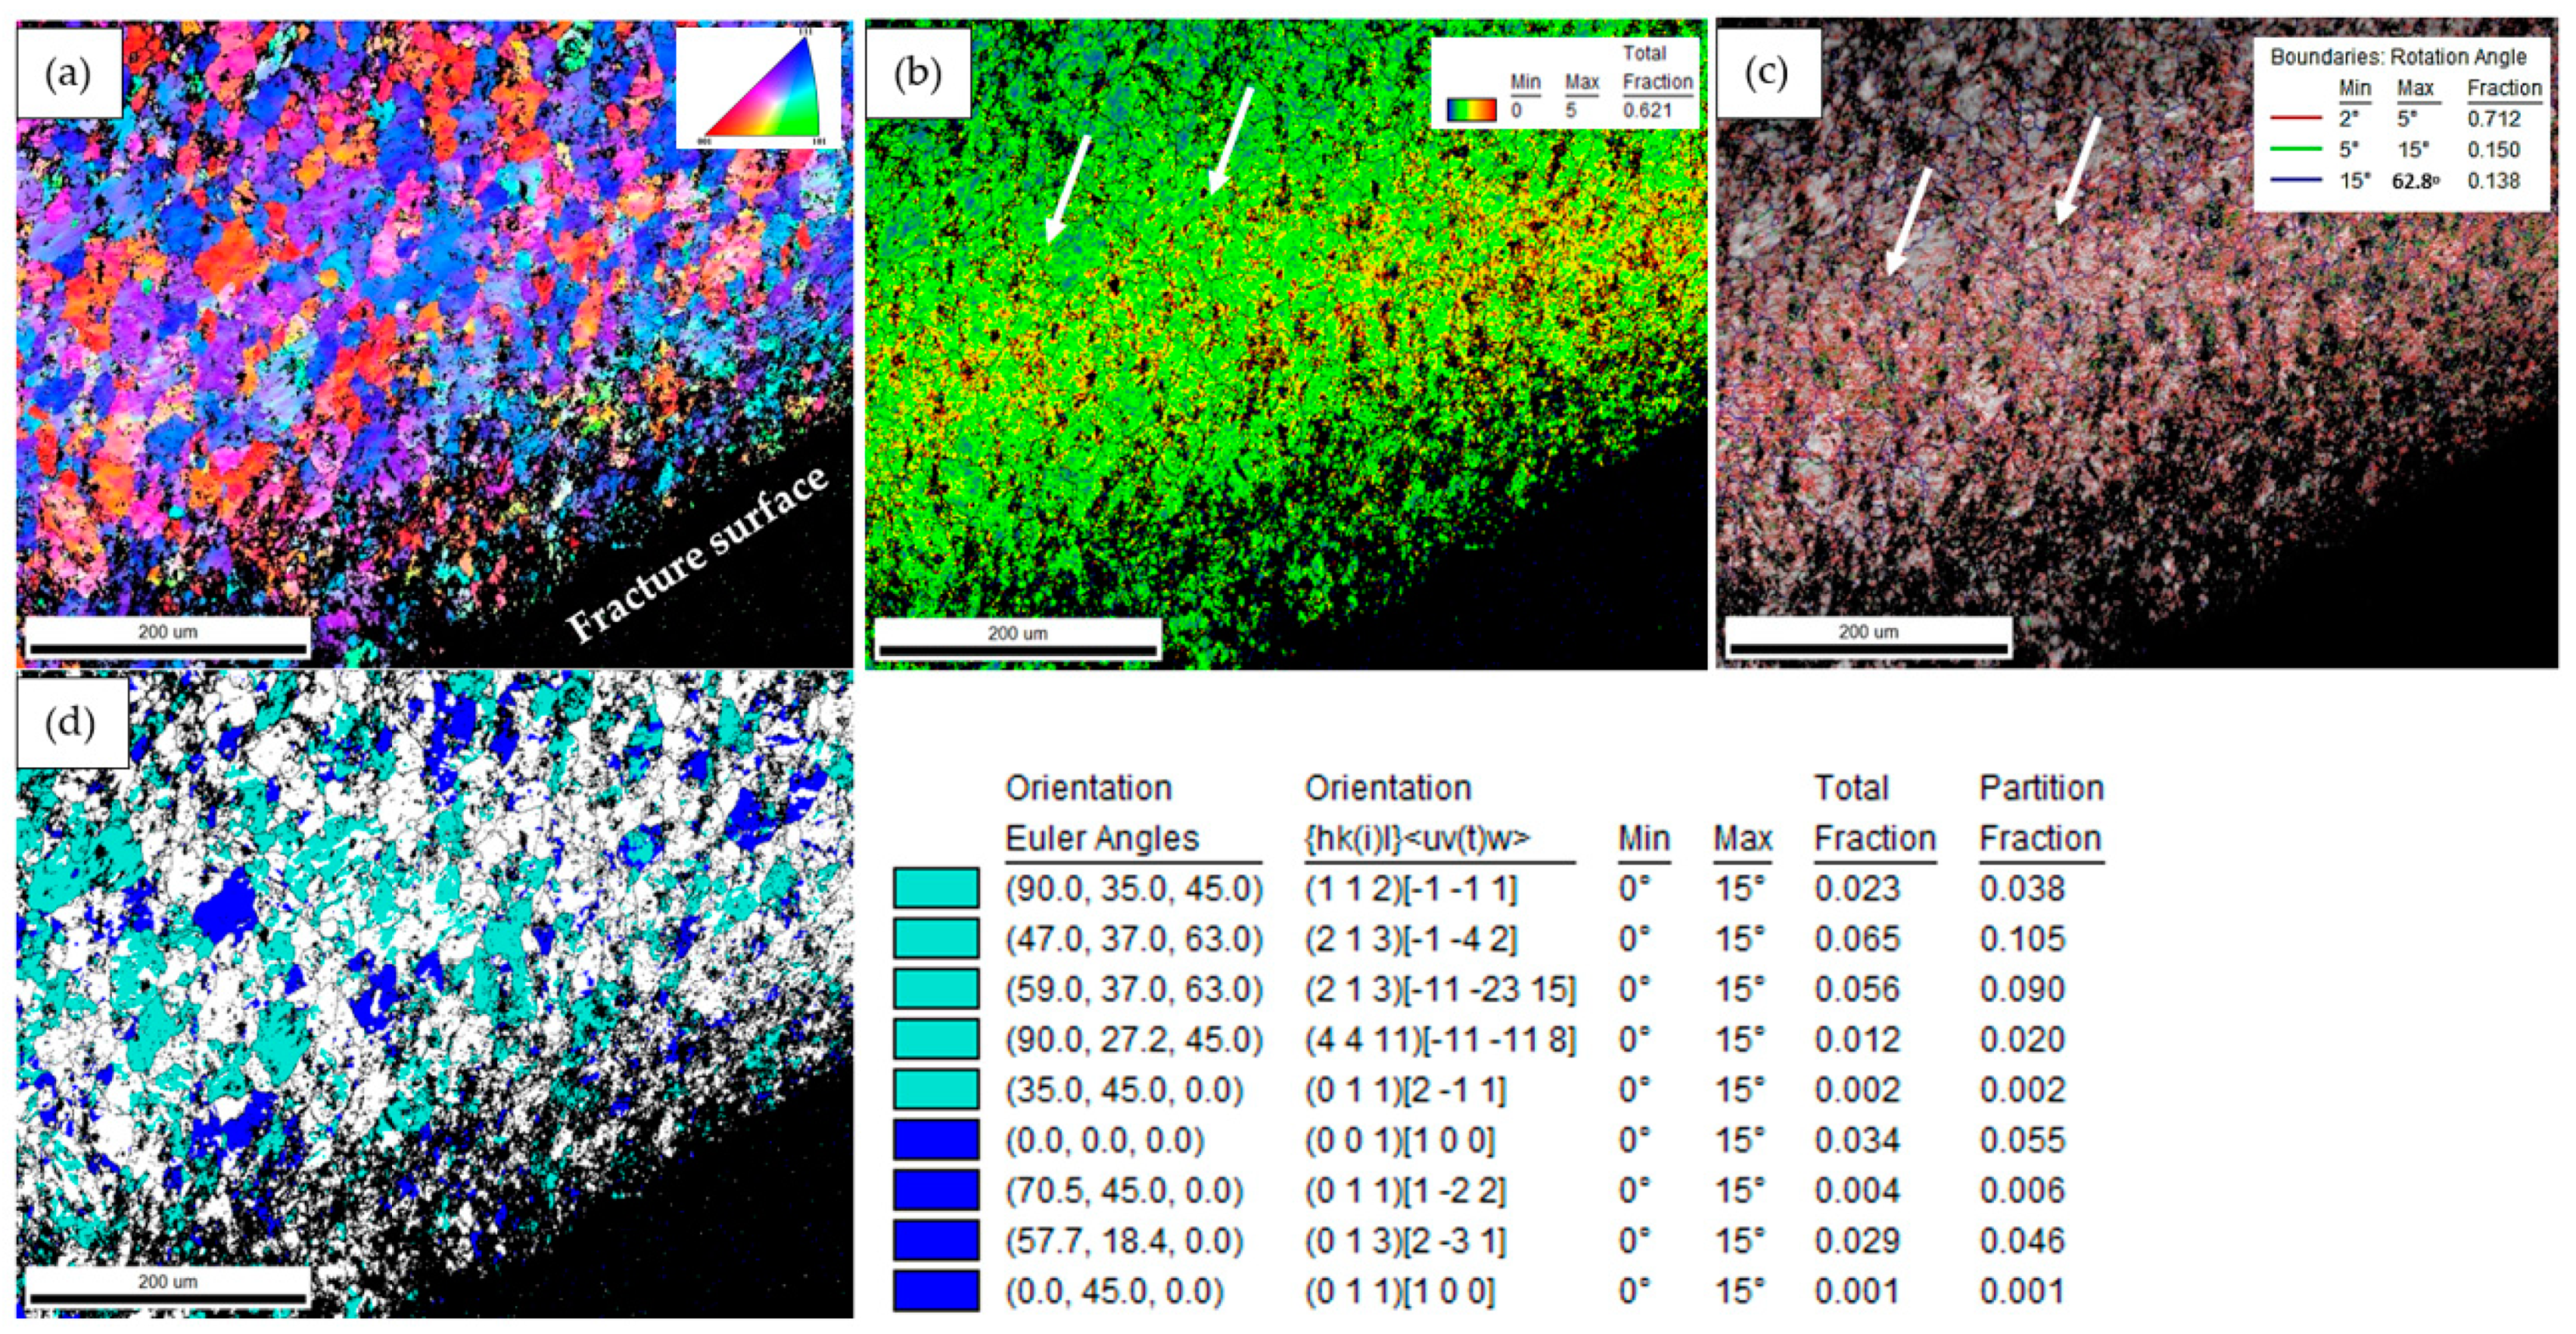
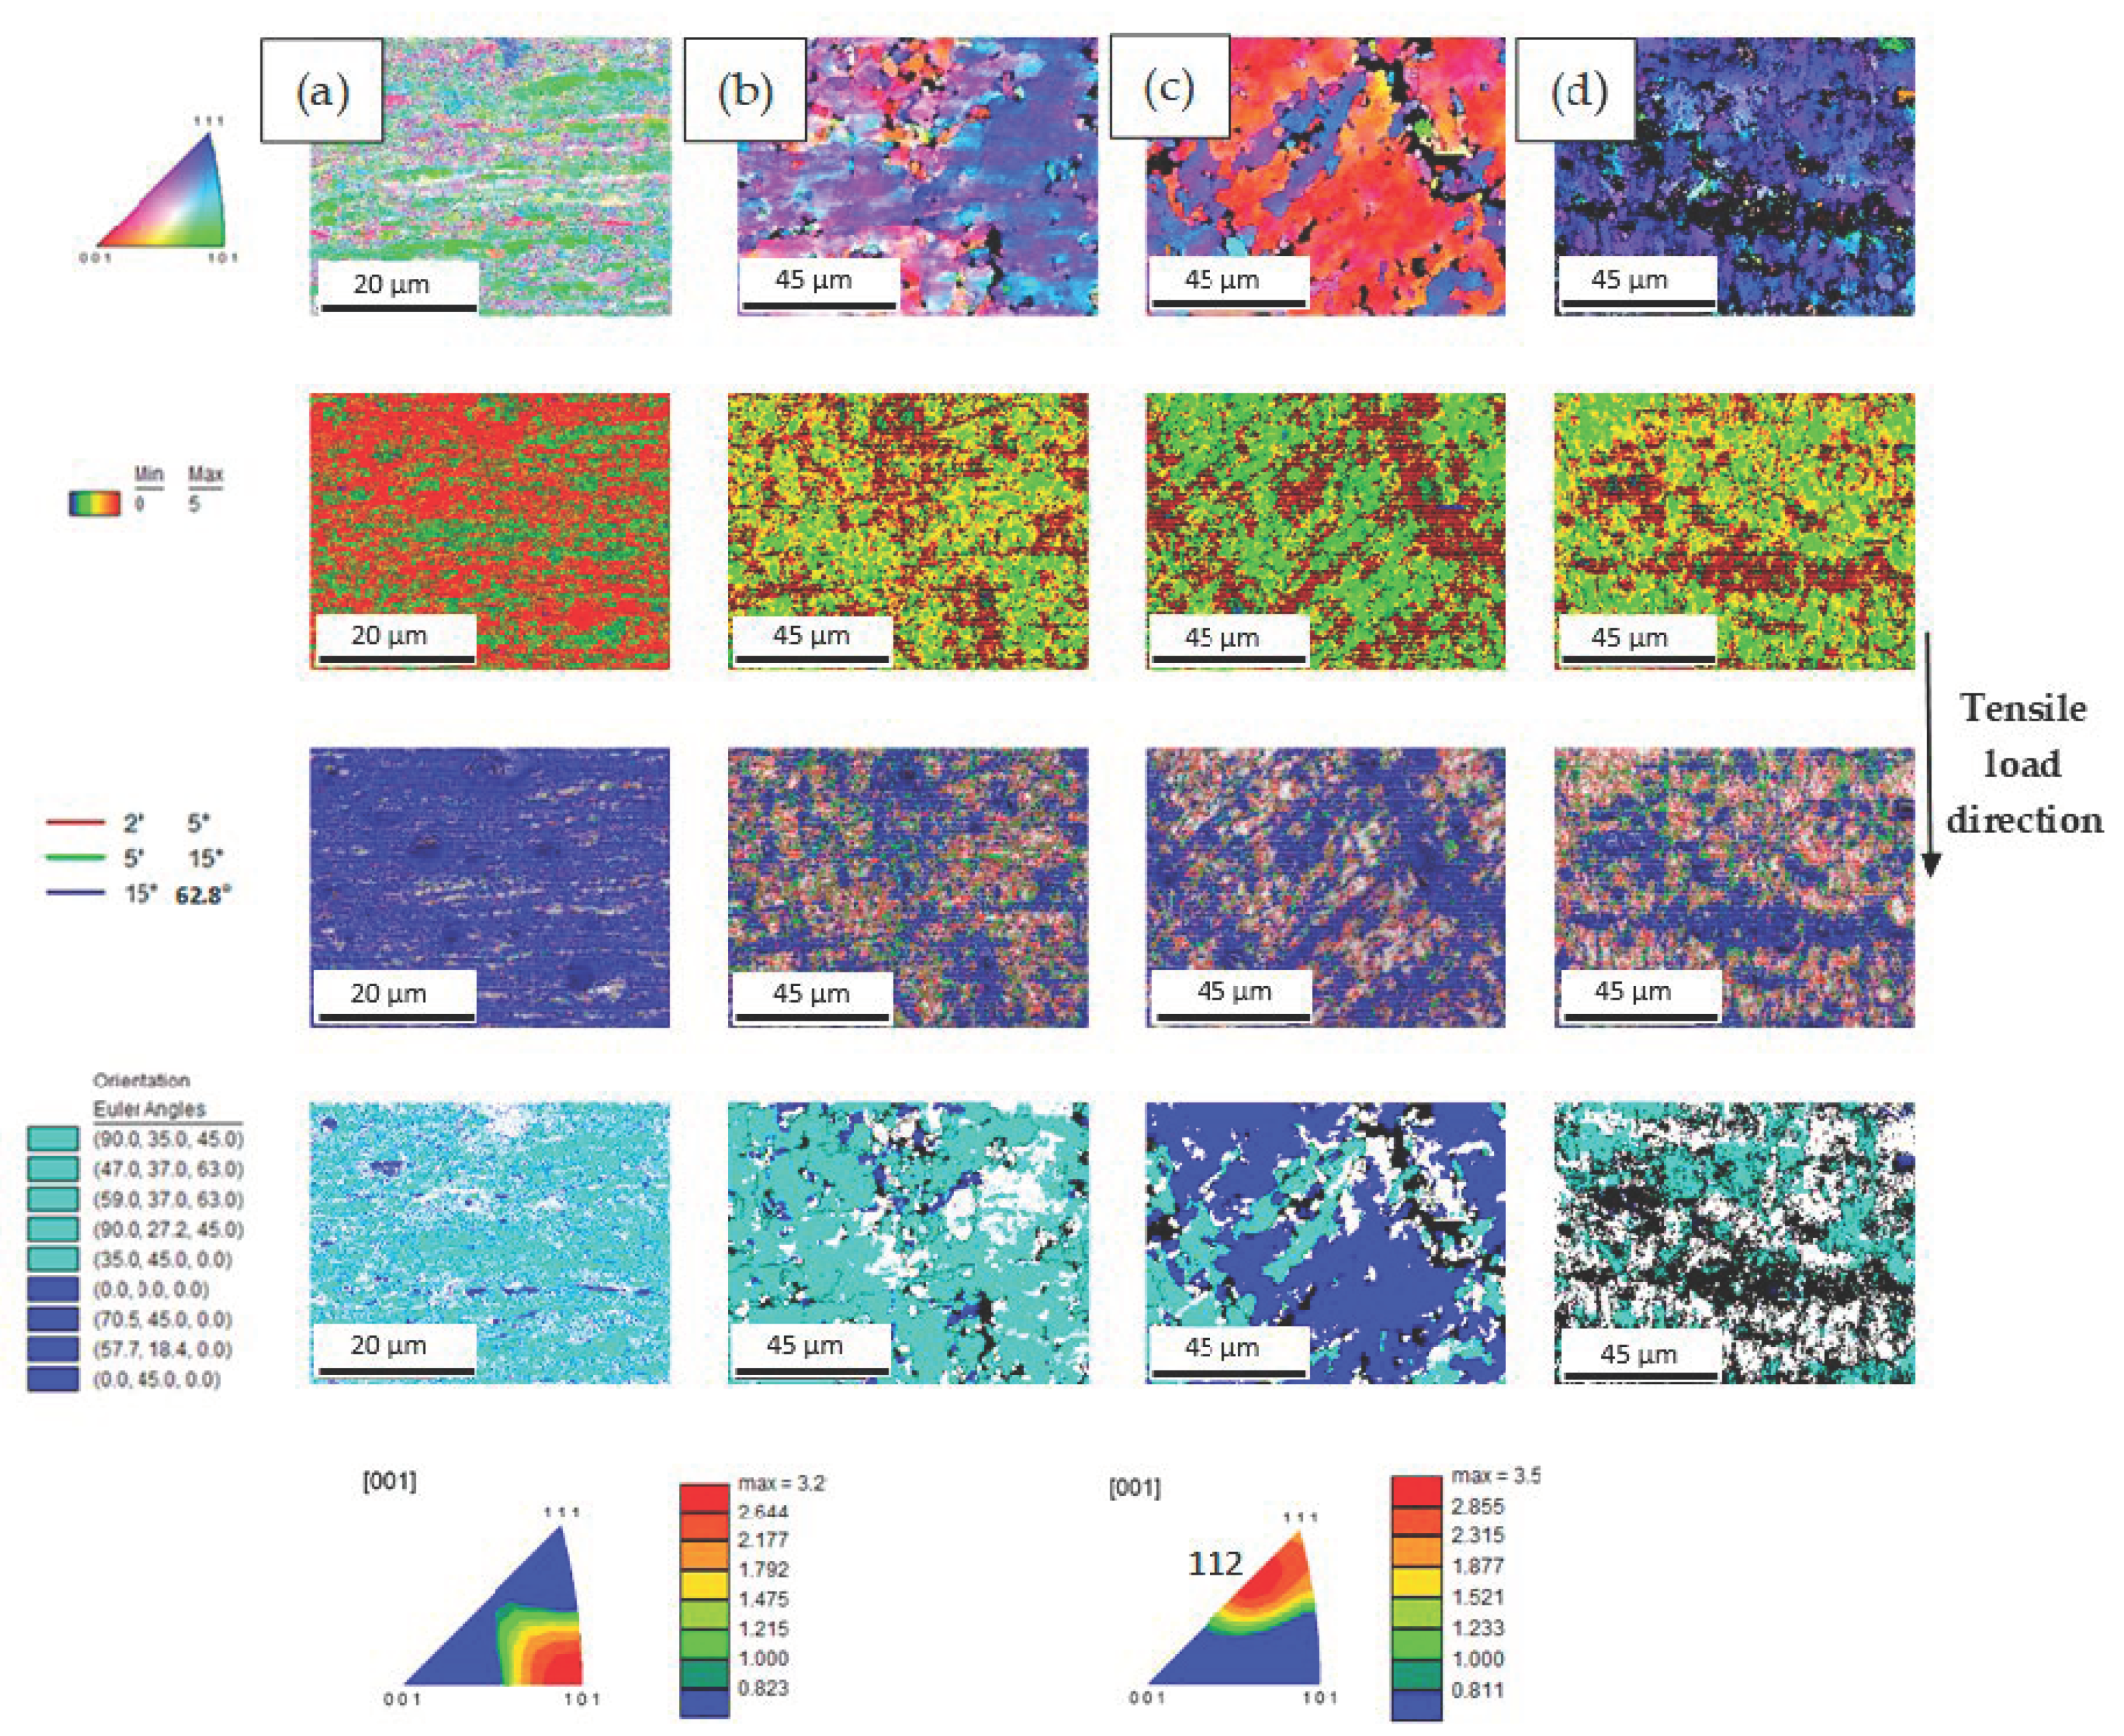
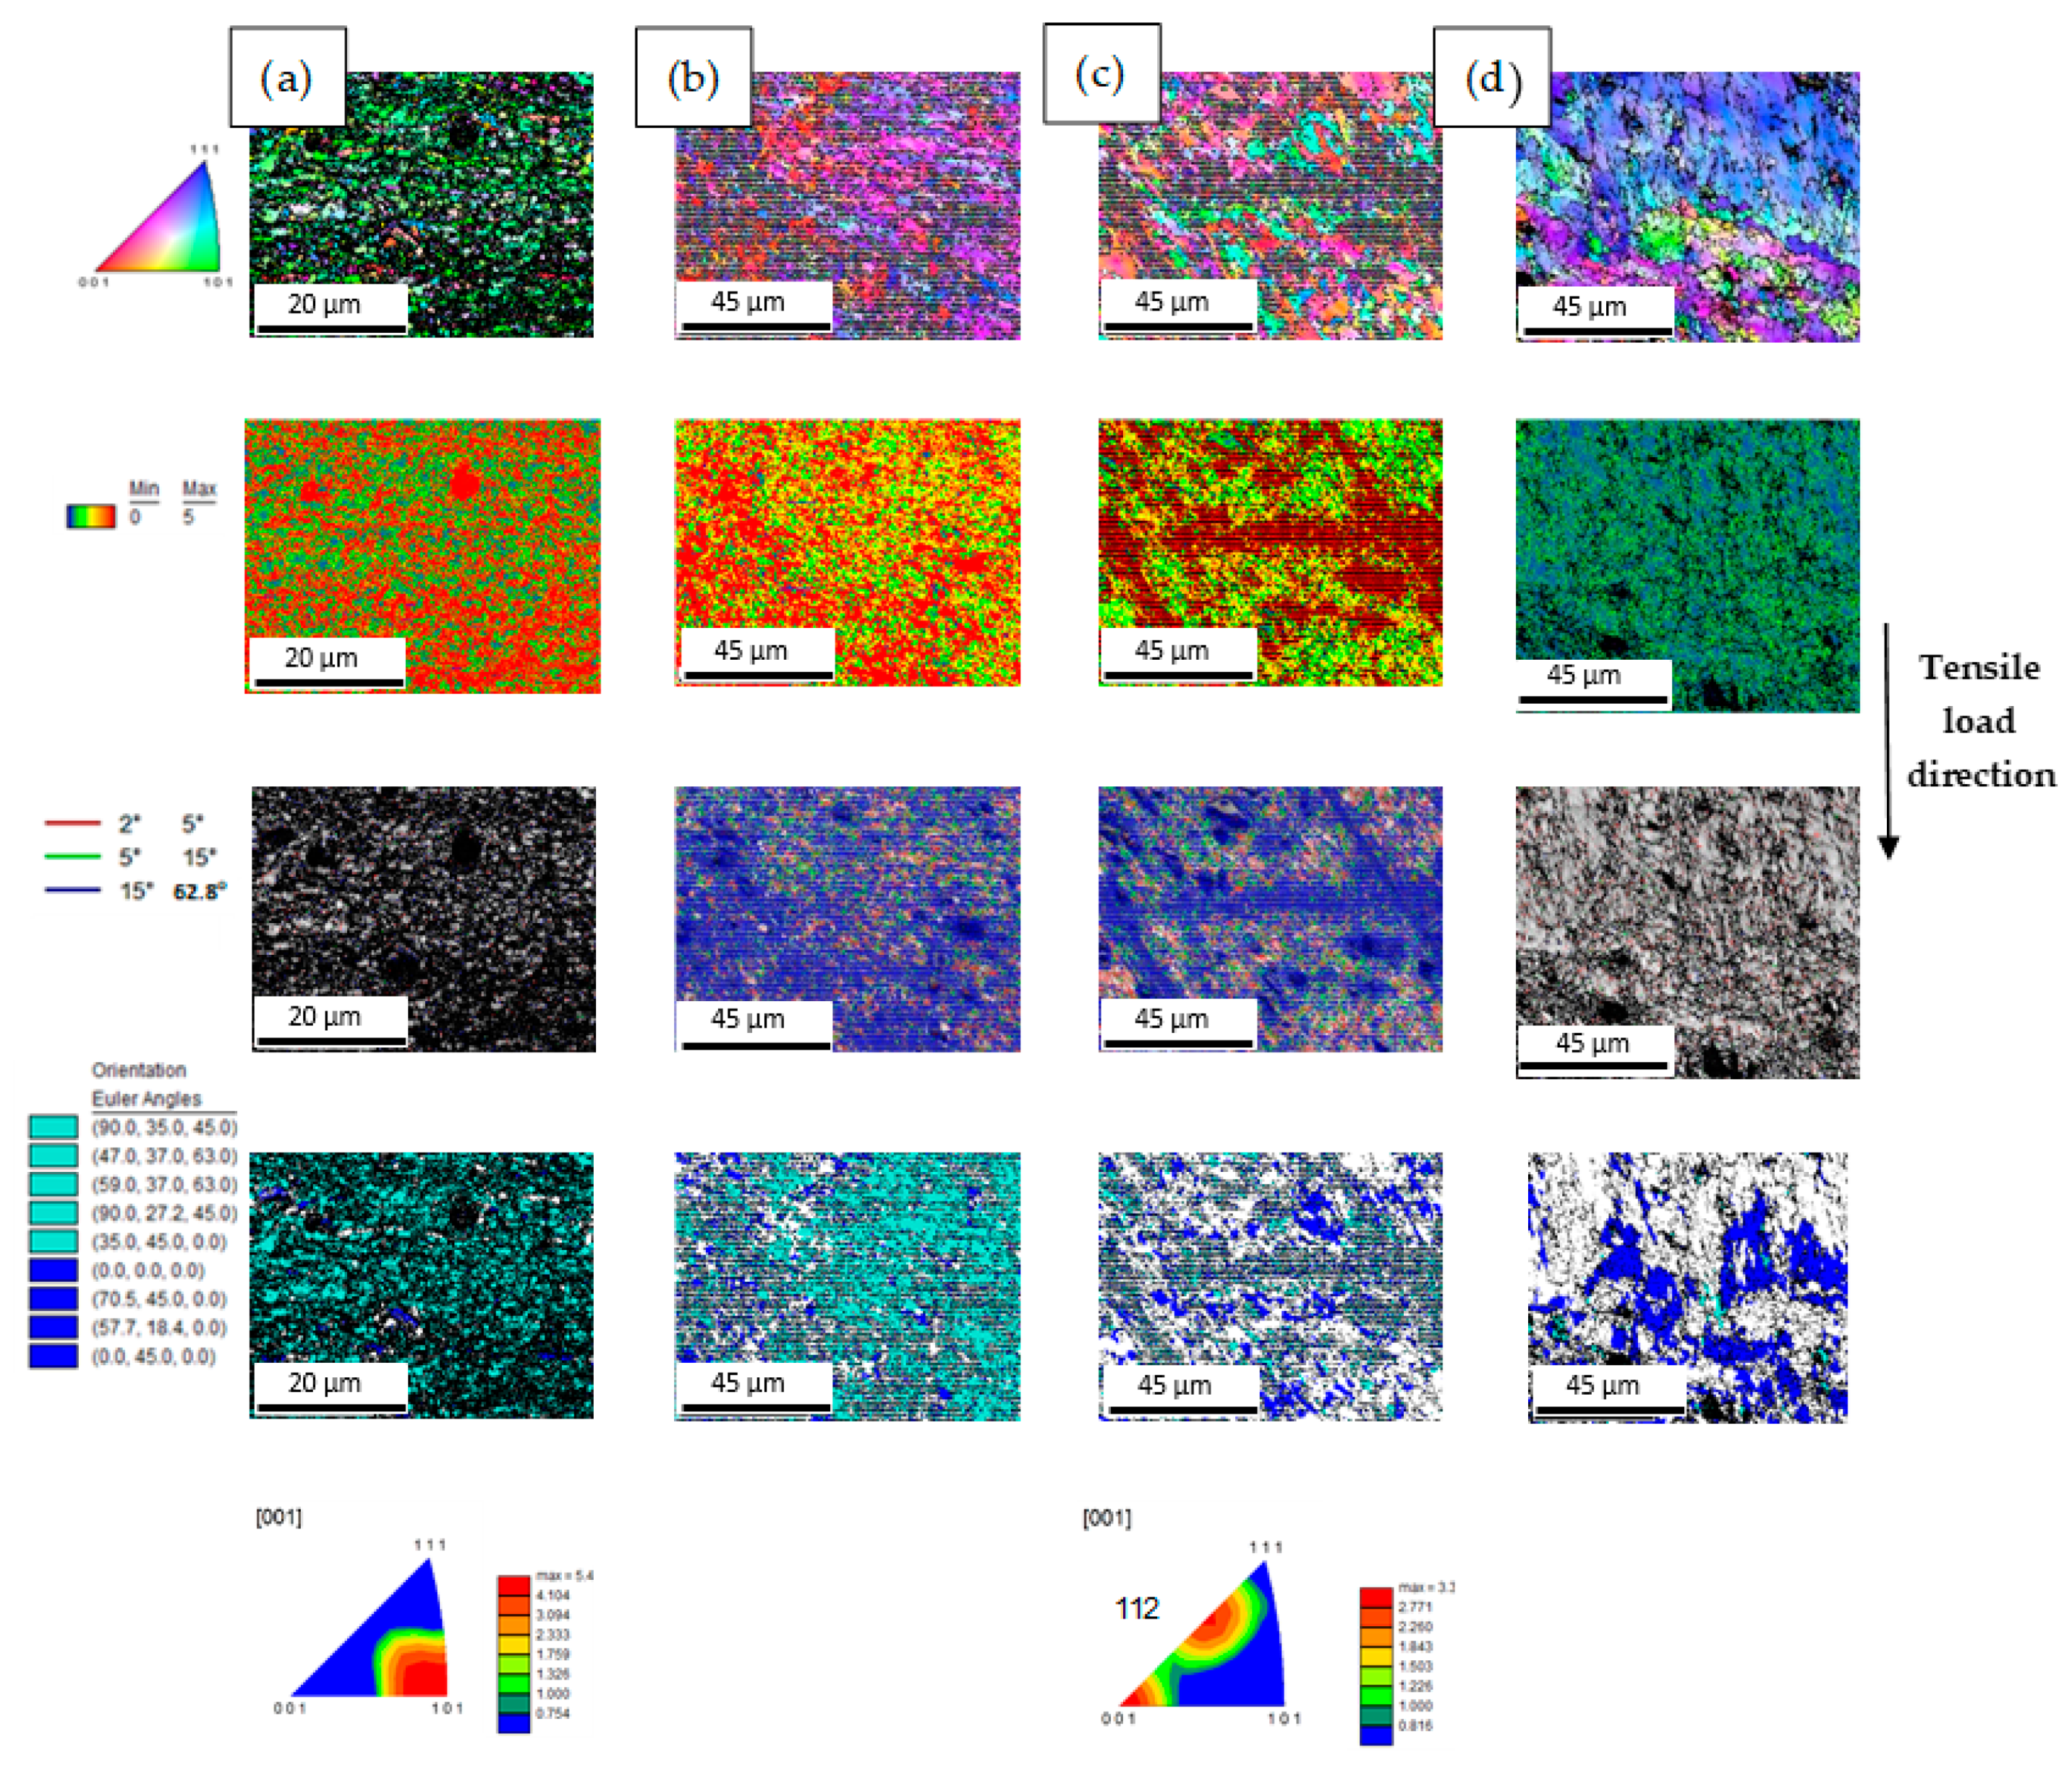
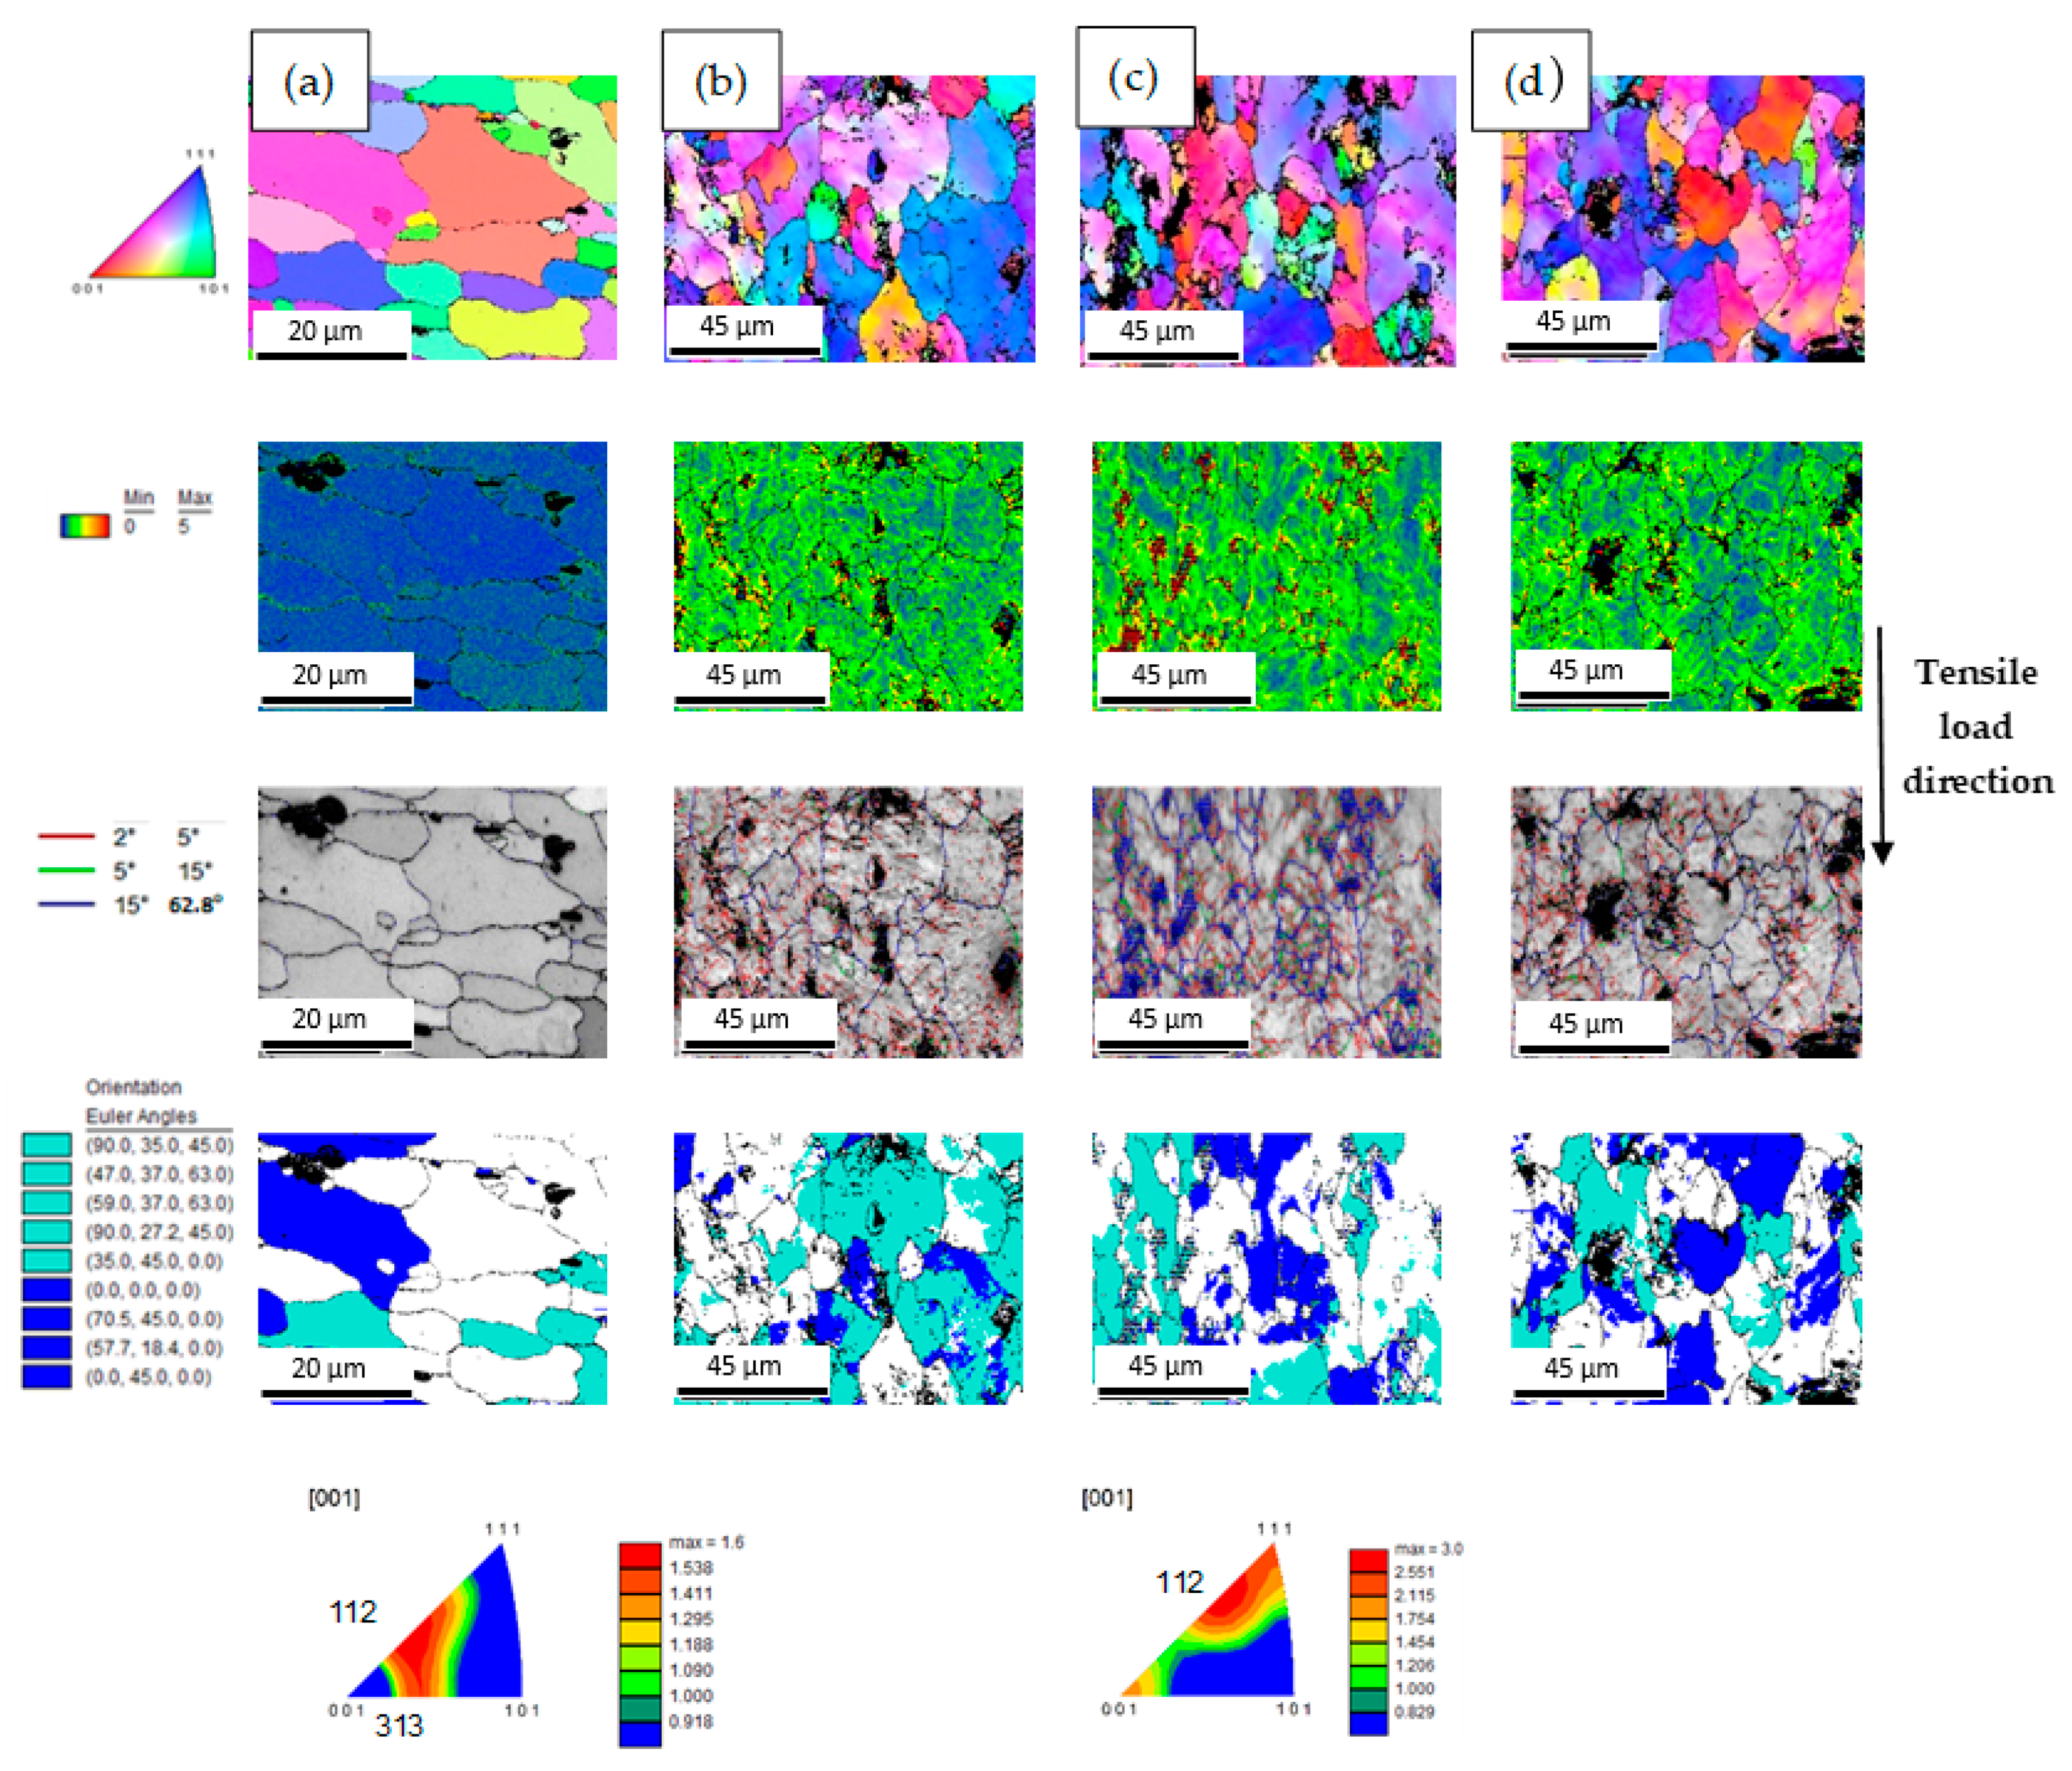
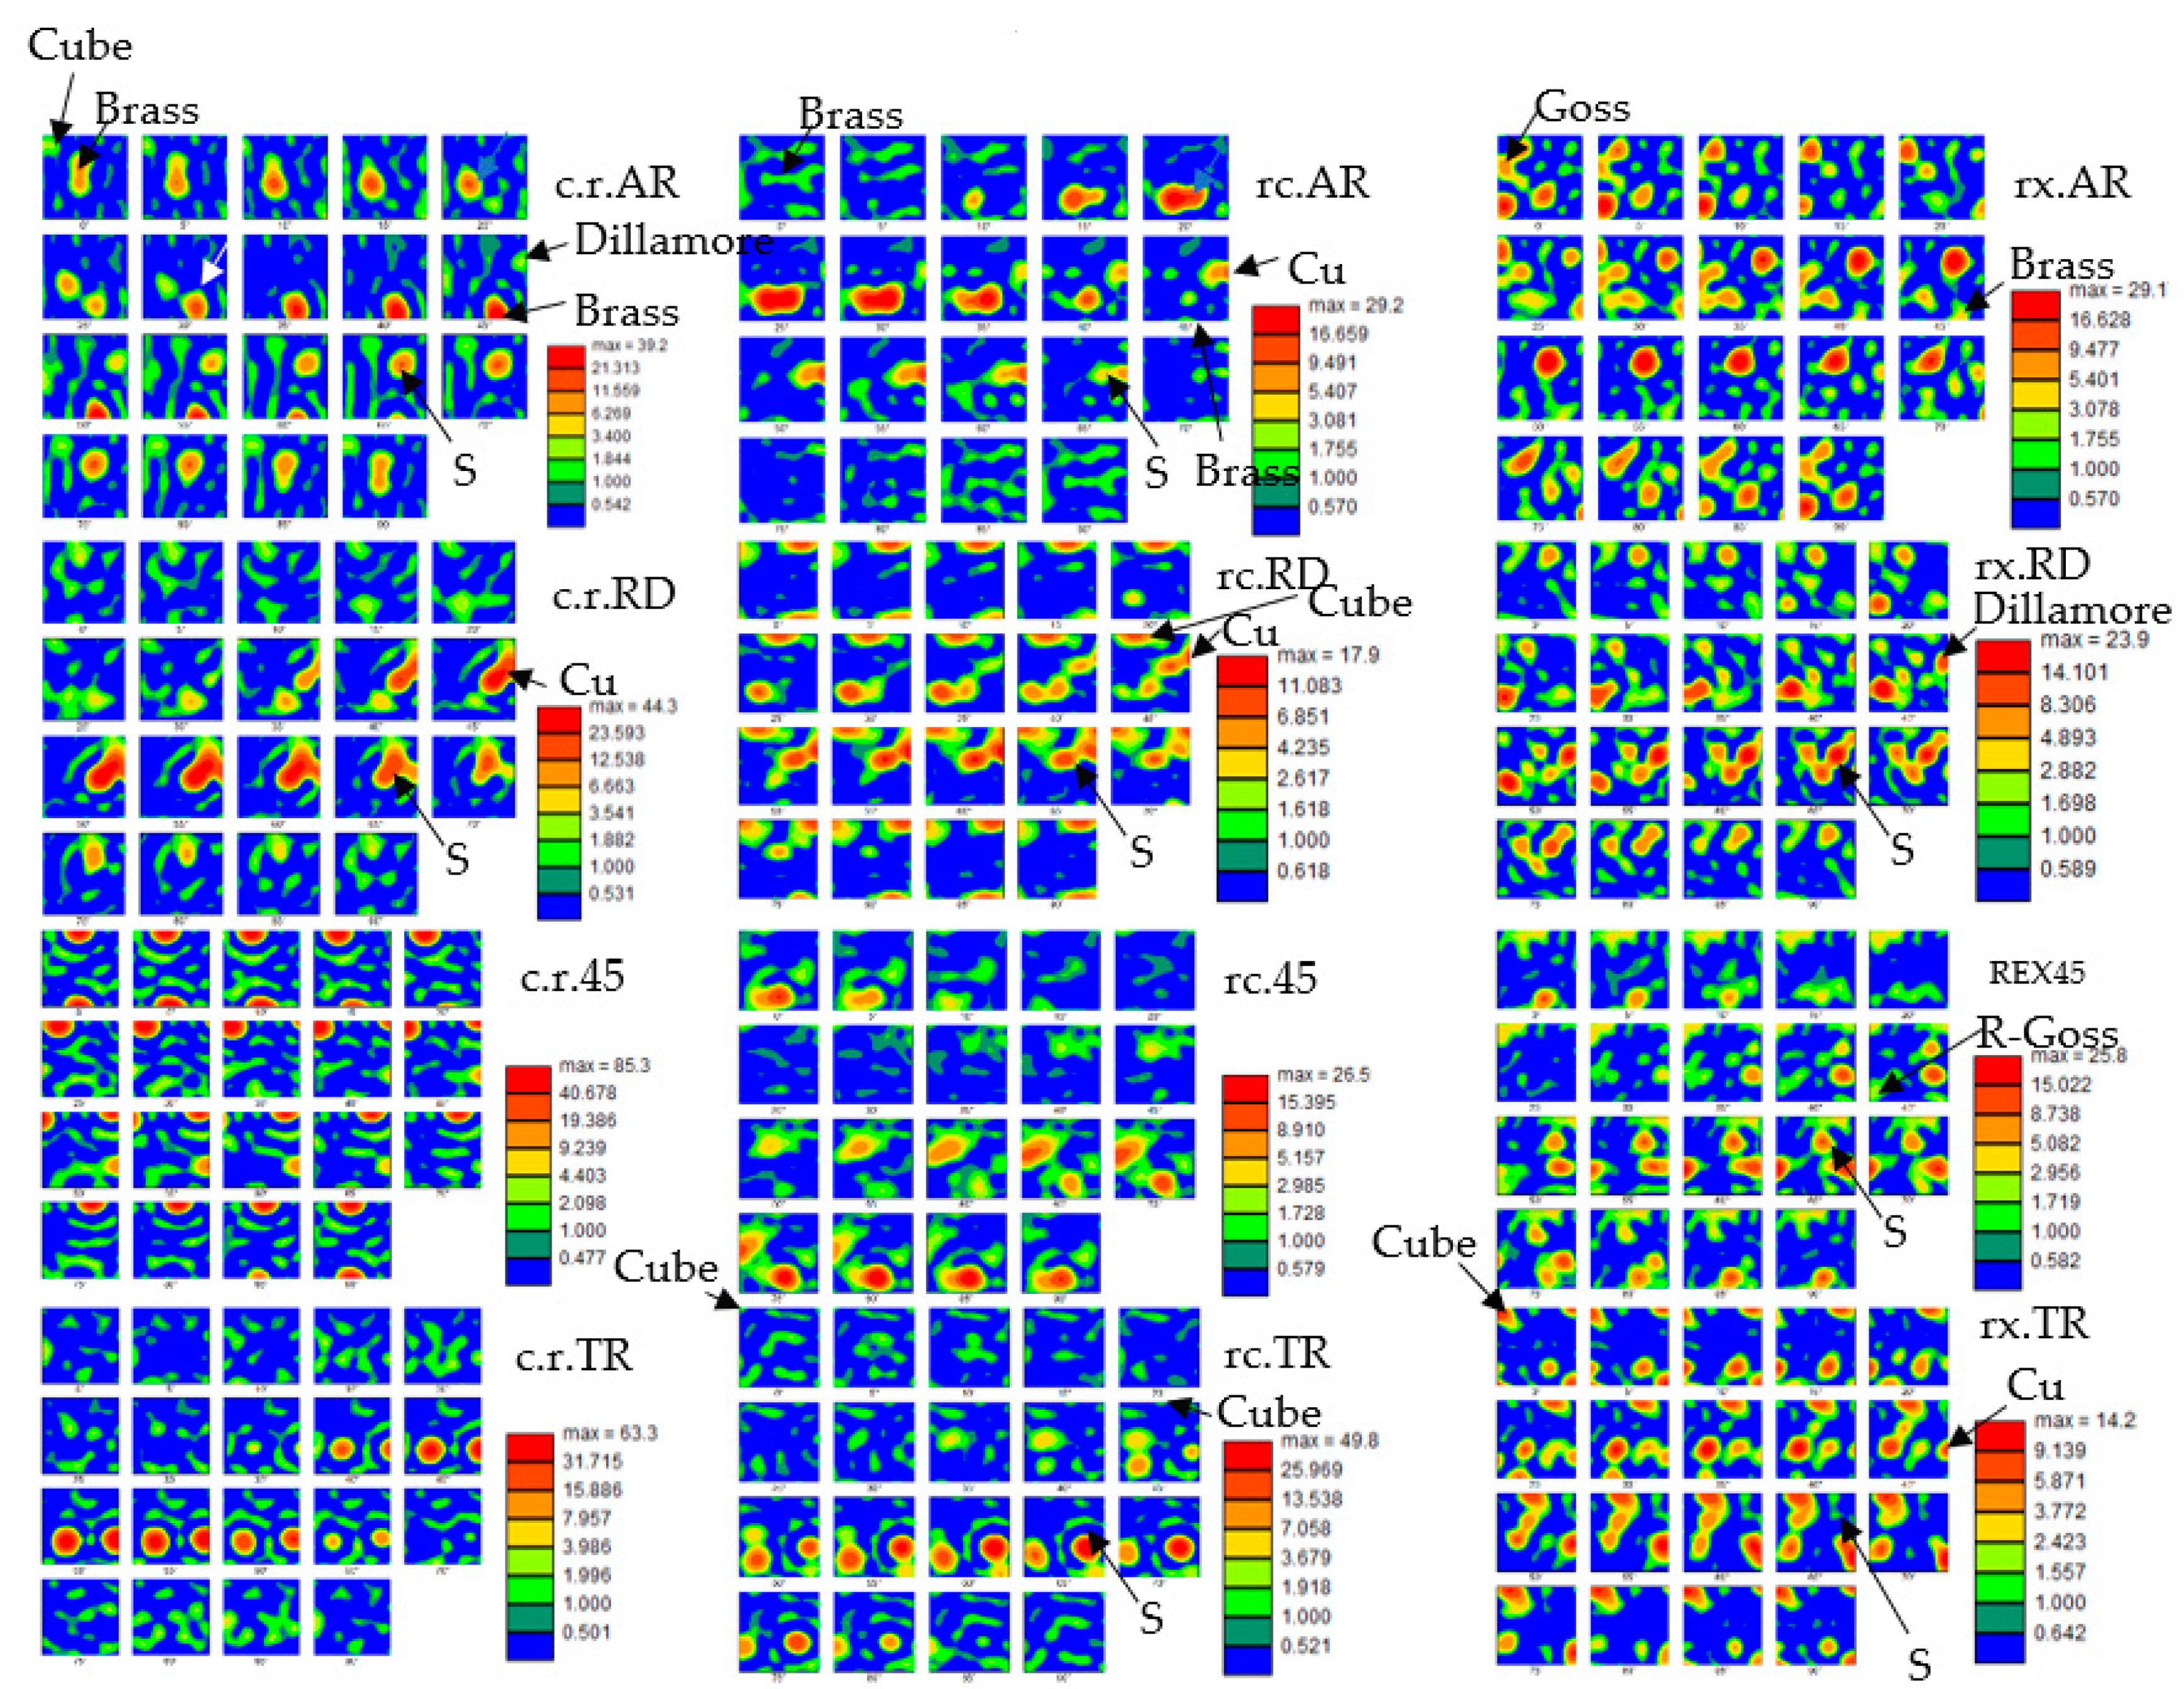
3.3. EBSD Scans and Analysis
4. Discussion
5. Conclusions
- The optimal combination of Δr and rm values was observed for the recovered sample.
- The S component exhibited a noteworthy behavior since, S2 and S3, namely similar components, retained the 50% of the texture before and after tensile testing in an orientation parallel to the RD.
- The texture components exhibited gradual orientation transitions over various layers of SGBs.
- The most prominent recrystallization texture component in the cold rolled and recovered states was R due to the previous intense presence of S components.
- The recovered sample exhibited a recrystallization texture leading to better results with regards to the deep drawing behavior of the material, an assumption that was further supported through the measured r-values.
- After uniaxial loading, the subgrain structure exhibited a gradual transformation to HAGBs in the recrystallized sample at 45° while a reinforcement of the SGBs was observed in all other examined cases.
- The (101) rotation towards (112) led to satisfying results regarding the resulting mechanical response.
- The combination of a high number of S-oriented grains, which were at the same time, strain-free due to recovery, as along with the presence of HAGBs and secondarily by SGBs, constituted the ideal substructure regarding the Δr and rm values. The aforementioned state is expected to lead into better results with regards to the deep drawing behavior of the material.
Author Contributions
Funding
Institutional Review Board Statement
Informed Consent Statement
Data Availability Statement
Acknowledgments
Conflicts of Interest
References
- Charlier, H.; Ekström, P. Aluminum Alloys for Packaging II; Institute of Materials Engineering Australasia Ltd.: Victoria, Australia, 1996; pp. 245–251. [Google Scholar]
- Kaufman, J.G.; Anderson, K.; Weritz, J. Properties and Selection of Aluminum Alloys; ASM International: Materials Park, OH, USA, 2019. [Google Scholar]
- ASTM Ε407-07 Standard Practice for Microetching Metals and Alloys; ASTM International: Materials Park, OH, USA, 2015.
- Benke, M.; Hlavacs, A.; Petho, D.; Angel, D.; Sepsi, M.; Mertinger, V. A simple correlation between texture and earing. IOP Conf. Ser. Mater. Sci. Eng. 2018, 426, 012003. [Google Scholar] [CrossRef]
- Aretz, H.; Aegerte, J.; Engler, O. Analysis of earing in deep drawn cups. AIP Conf. 2010, 1252, 417. [Google Scholar]
- Tikhovskiy, D.F.I. Simulation of earing during deep drawing of an Al–3% Mg alloy (AA 5754) using a texture component crystal plasticity FEM. J. Mater. Process. Technol. 2007, 183, 169–175. [Google Scholar] [CrossRef]
- Zhao, Z.; Mao, W.; Roters, F.; Raabe, D. A texture optimization study for minimum earing in aluminium by use of a texture component crystal plasticity finite element method. Acta Mater. 2004, 52, 1003–1012. [Google Scholar] [CrossRef]
- OIM Analysis 5.3 Manual; OIM: Le Grand-Saconnex, Switzerland.
- Barros, P.; Oliveira, M.; Alves, J.; Menezes, L. Earing prediction in drawing and ironing processes using an advanced yield criterion. Key Eng. Mater. 2013, 554–557, 2266–2276. [Google Scholar] [CrossRef]
- Kocks, U.F.; Tome, C.N.; Wenk, H.R. Texture and Anisotropy; Cambridge University Press: Cambridge, UK, 2000. [Google Scholar]
- Wert, J.A.; Huang, X.; Winther, G.; Pantleon, W.; Poulsen, H.F. Revealing deformation microstructures. Mater. Today 2007, 10, 24–32. [Google Scholar] [CrossRef]
- Liu, W.; Jensen, D.J.; Morris, J. Effect of grain orientation on microstructures during hot deformation of AA 3104 aluminium alloy by plane strain compression. Acta Mater. 2001, 49, 3347–3367. [Google Scholar] [CrossRef]
- Hirsch, J.; Engler, O. Texture, local orientation and microstructure in industrial Al-alloys. In Proceedings of the 16th RISO International Symposium on Materials Science, Roskilde, Danmark, 4–8 September 1995. [Google Scholar]
- Hirsch, J.; Al-Samman, T. Superior light metals by texture engineering: Optimized aluminum and magnesium alloys for automotive applications. Acta Mater. 2013, 61, 818–843. [Google Scholar] [CrossRef]
- Huang, K.; Li, Y.; Marthinsen, K. Effect of heterogeneously distributed pre-existing dispersoids on the recrystallization behavior of a cold-rolled Al-Mn-Fe-Si alloy. Mater. Charact. 2015, 102, 92–97. [Google Scholar] [CrossRef]
- Daaland, O.; Nes, E. Origin of Cube texture during hot rolling of commercial Al-Mn-Mg alloys. Acta Mater. 1995, 44, 1389–1411. [Google Scholar] [CrossRef]
- Worswick, M.; Finn, M. The numerical simulation of stretch flange forming. Int. J. Plast. 2000, 16, 701–720. [Google Scholar] [CrossRef]
- Voort, G.F.V. Metallography, Principles and Practice; McGraw-Hill: New York, NY, USA, 1984. [Google Scholar]
- Takeda, H.; Hibino, A.; Takata, K. Influence of Crystal Orientations on the Bendability of an Al-Mg-Si Alloy. Mater. Trans. 2010, 51, 614–619. [Google Scholar] [CrossRef]
- Lehto, P. Adaptive domain misorientation approach for the EBSD measurement of deformation induced dislocation sub-structures. Ultramicroscopy 2021, 222, 113203. [Google Scholar] [CrossRef] [PubMed]
- Hansen, N. New discoveries in deformed metals. Met. Mater. Trans. A 2001, 32, 2917–2935. [Google Scholar] [CrossRef]
- Liu, Q.; Jensen, D.J.; Hansen, N. Effect of grain orientation on deformation structure in cold-rolled polycrystalline aluminium. Acta Mater. 1998, 46, 5819–5838. [Google Scholar] [CrossRef]
- Taylor, G. Plastic Strain in Metals. J. Inst. Met. 1938, 62, 307–324. [Google Scholar]
- Bay, B.; Hansen, N.; Hughes, D.; Kuhlmann-Wilsdorf, D. Evolution of fcc deformation structures in polyslip. Acta Metall. Et Mater. 1992, 40, 205–219. [Google Scholar] [CrossRef]
- Liu, Q.; Hansen, N. Deformation microstructure and orientation of FCC crystals. Phys. Status Solidi 1995, 149, 187–199. [Google Scholar] [CrossRef]
- Sedlacek, R.; Blum, W.; Kratochvil, J.; Forest, S. Subgrain Formation during Deformation: Physical Origin and Consequences. Metall. Mater. Trans. A 2001, 32, 319–327. [Google Scholar]
- Hansen, N.; Jensen, D.J. Development of Microstructure in FCC Metals during Cold Work. Philos. Trans. Math. Phys. Eng. Sci. 1999, 357, 1447–1469. [Google Scholar] [CrossRef]
- Ashby, M. The Effect of Dispersed Phases upon Dislocation Distributions in Plastically Deformed. Philos. Mag. 1996, 13, 805–834. [Google Scholar]
- Godfrey, A.; Mishin, O.; Yu, T. Characterization and influence of deformation. IOP Conf. Ser. Mater. Sci. Eng. 2015, 29, 012003. [Google Scholar] [CrossRef] [Green Version]
- Humphreys, F.; Hatherly, M. Recrystallization and Related Annealing Phenomena; Elsevier: Amsterdam, The Netherlands, 2004. [Google Scholar]
- Humphreys, F. The nucleation of recrystallization at second phase particles in deformed aluminum. Acta Metall. 1977, 25, 1323–1344. [Google Scholar] [CrossRef]
- Engler, O. On the origin of the R orientations in the recrystallization textures of aluminum alloys. Met. Mater. Trans. A 1999, 30, 1517–1527. [Google Scholar] [CrossRef]
- Papadopoulou, S.; Kontopoulou, A.; Gavalas, E.; Papaefthymiou, S. The Effects of Reduction and Thermal Treatment on the Recrystallization and Crystallographic Texture Evolution of 5182 Aluminum Alloy. Metals 2020, 10, 1380. [Google Scholar] [CrossRef]
- Li, Y.; Arnberg, L. Quantitative study on the precipitation behavior of dispersoids in DC-cast AA3003 alloy during heating and homogenization. Acta Mater. 2003, 51, 3415–3428. [Google Scholar] [CrossRef]
- Papadopoulou, S.; Gavalas, E.; Papaefthymiou, S. Methodology for the Identification of Nucleation Sites in Aluminum Alloy by Use of Misorientatation Mapping. Mater. Proc. 2021, 3, 11. [Google Scholar] [CrossRef]
- Rossiter, P. The Electrical Resistivity of Metals and Alloys; Cambridge University Press: Cambridge, UK, 1987. [Google Scholar]
- Muggerud, A.; Mørtsell, E.; Li, Y.; Holmestad, R. Dispersoid strengthening in AA3xxx alloys with varying Mn and Si content during annealing at low temperatures. Mater. Sci. Eng. A 2013, 567, 21–28. [Google Scholar] [CrossRef]
- Lodgaard, L.; Ryum, N. Precipitation of dispersoids containing Mn and/or Cr in Al–Si alloys. Mater. Sci. Eng. A 2000, 283, 144–152. [Google Scholar] [CrossRef]

| State | Condition | Sample ID |
|---|---|---|
| Cold rolling 90% reduction (deformed) | As received state | c.r.AR |
| After tensile testing of //RD sample | c.r.RD | |
| After tensile testing of 45o towards RD sample | c.r.45 | |
| After tensile testing of ꞱRD sample | c.r.TR | |
| Recovery annealing (recovered) | As received state | rc.AR |
| After tensile testing of //RD sample | rc.RD | |
| After tensile testing of 45o towards RD sample | rc.45 | |
| After tensile testing of ꞱRD sample | rc.TR | |
| Recrystallization annealing (fully recrystallized) | As received state | rx.AR |
| After tensile testing of //RD sample | rx.RD | |
| After tensile testing of 45o towards RD sample | rx.45 | |
| After tensile testing of ꞱRD sample | rx.TR |
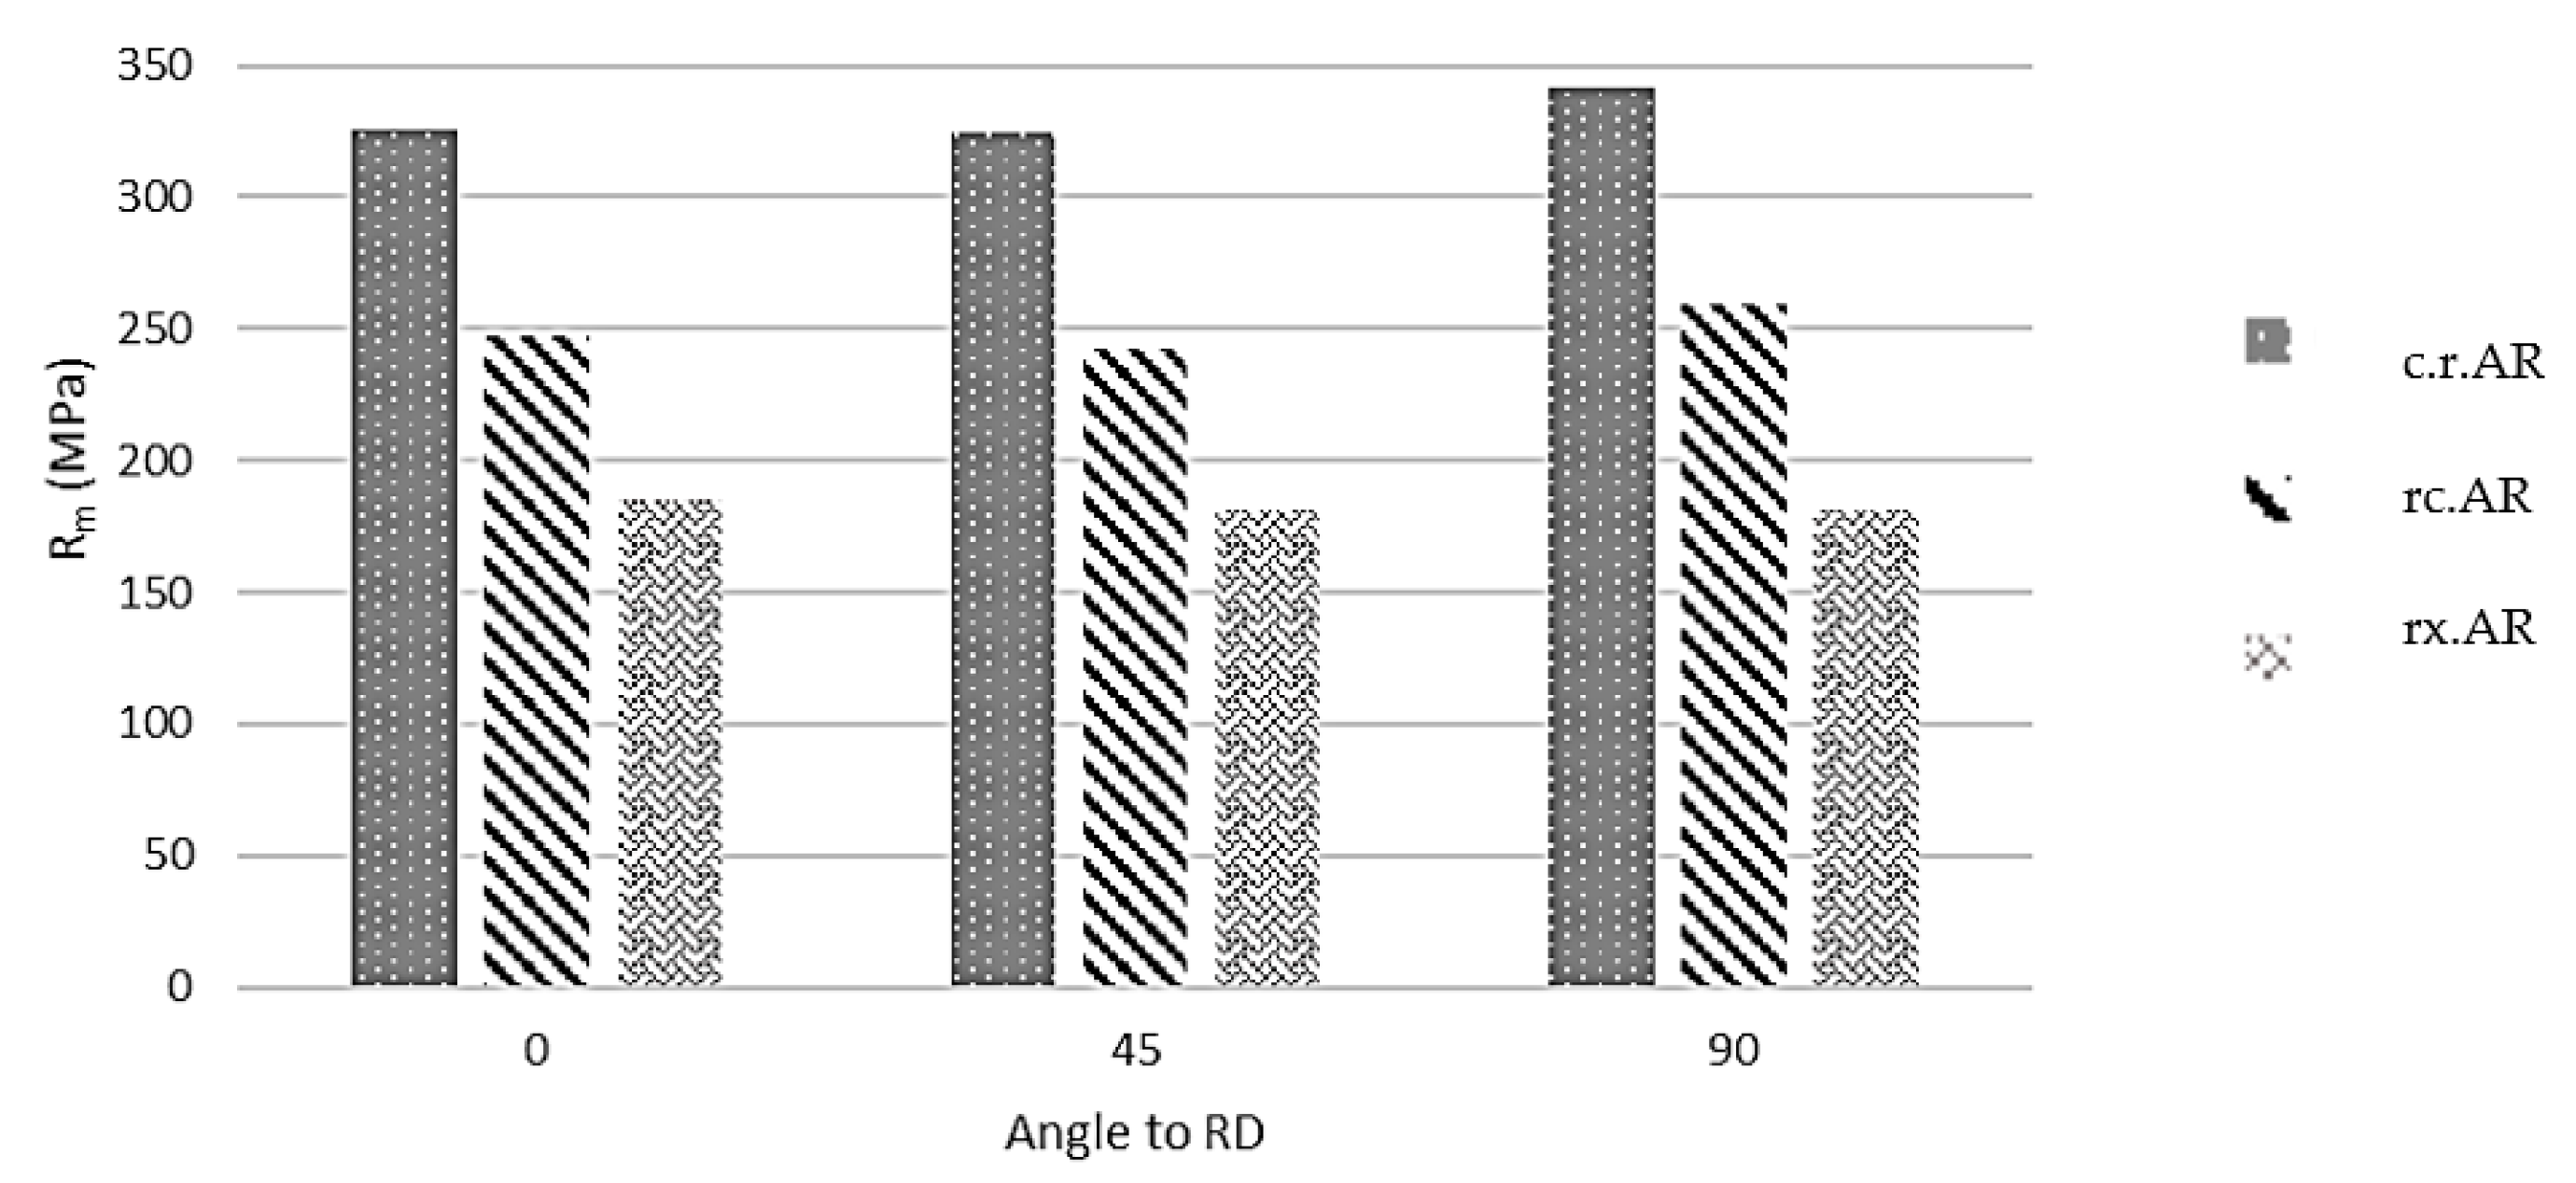
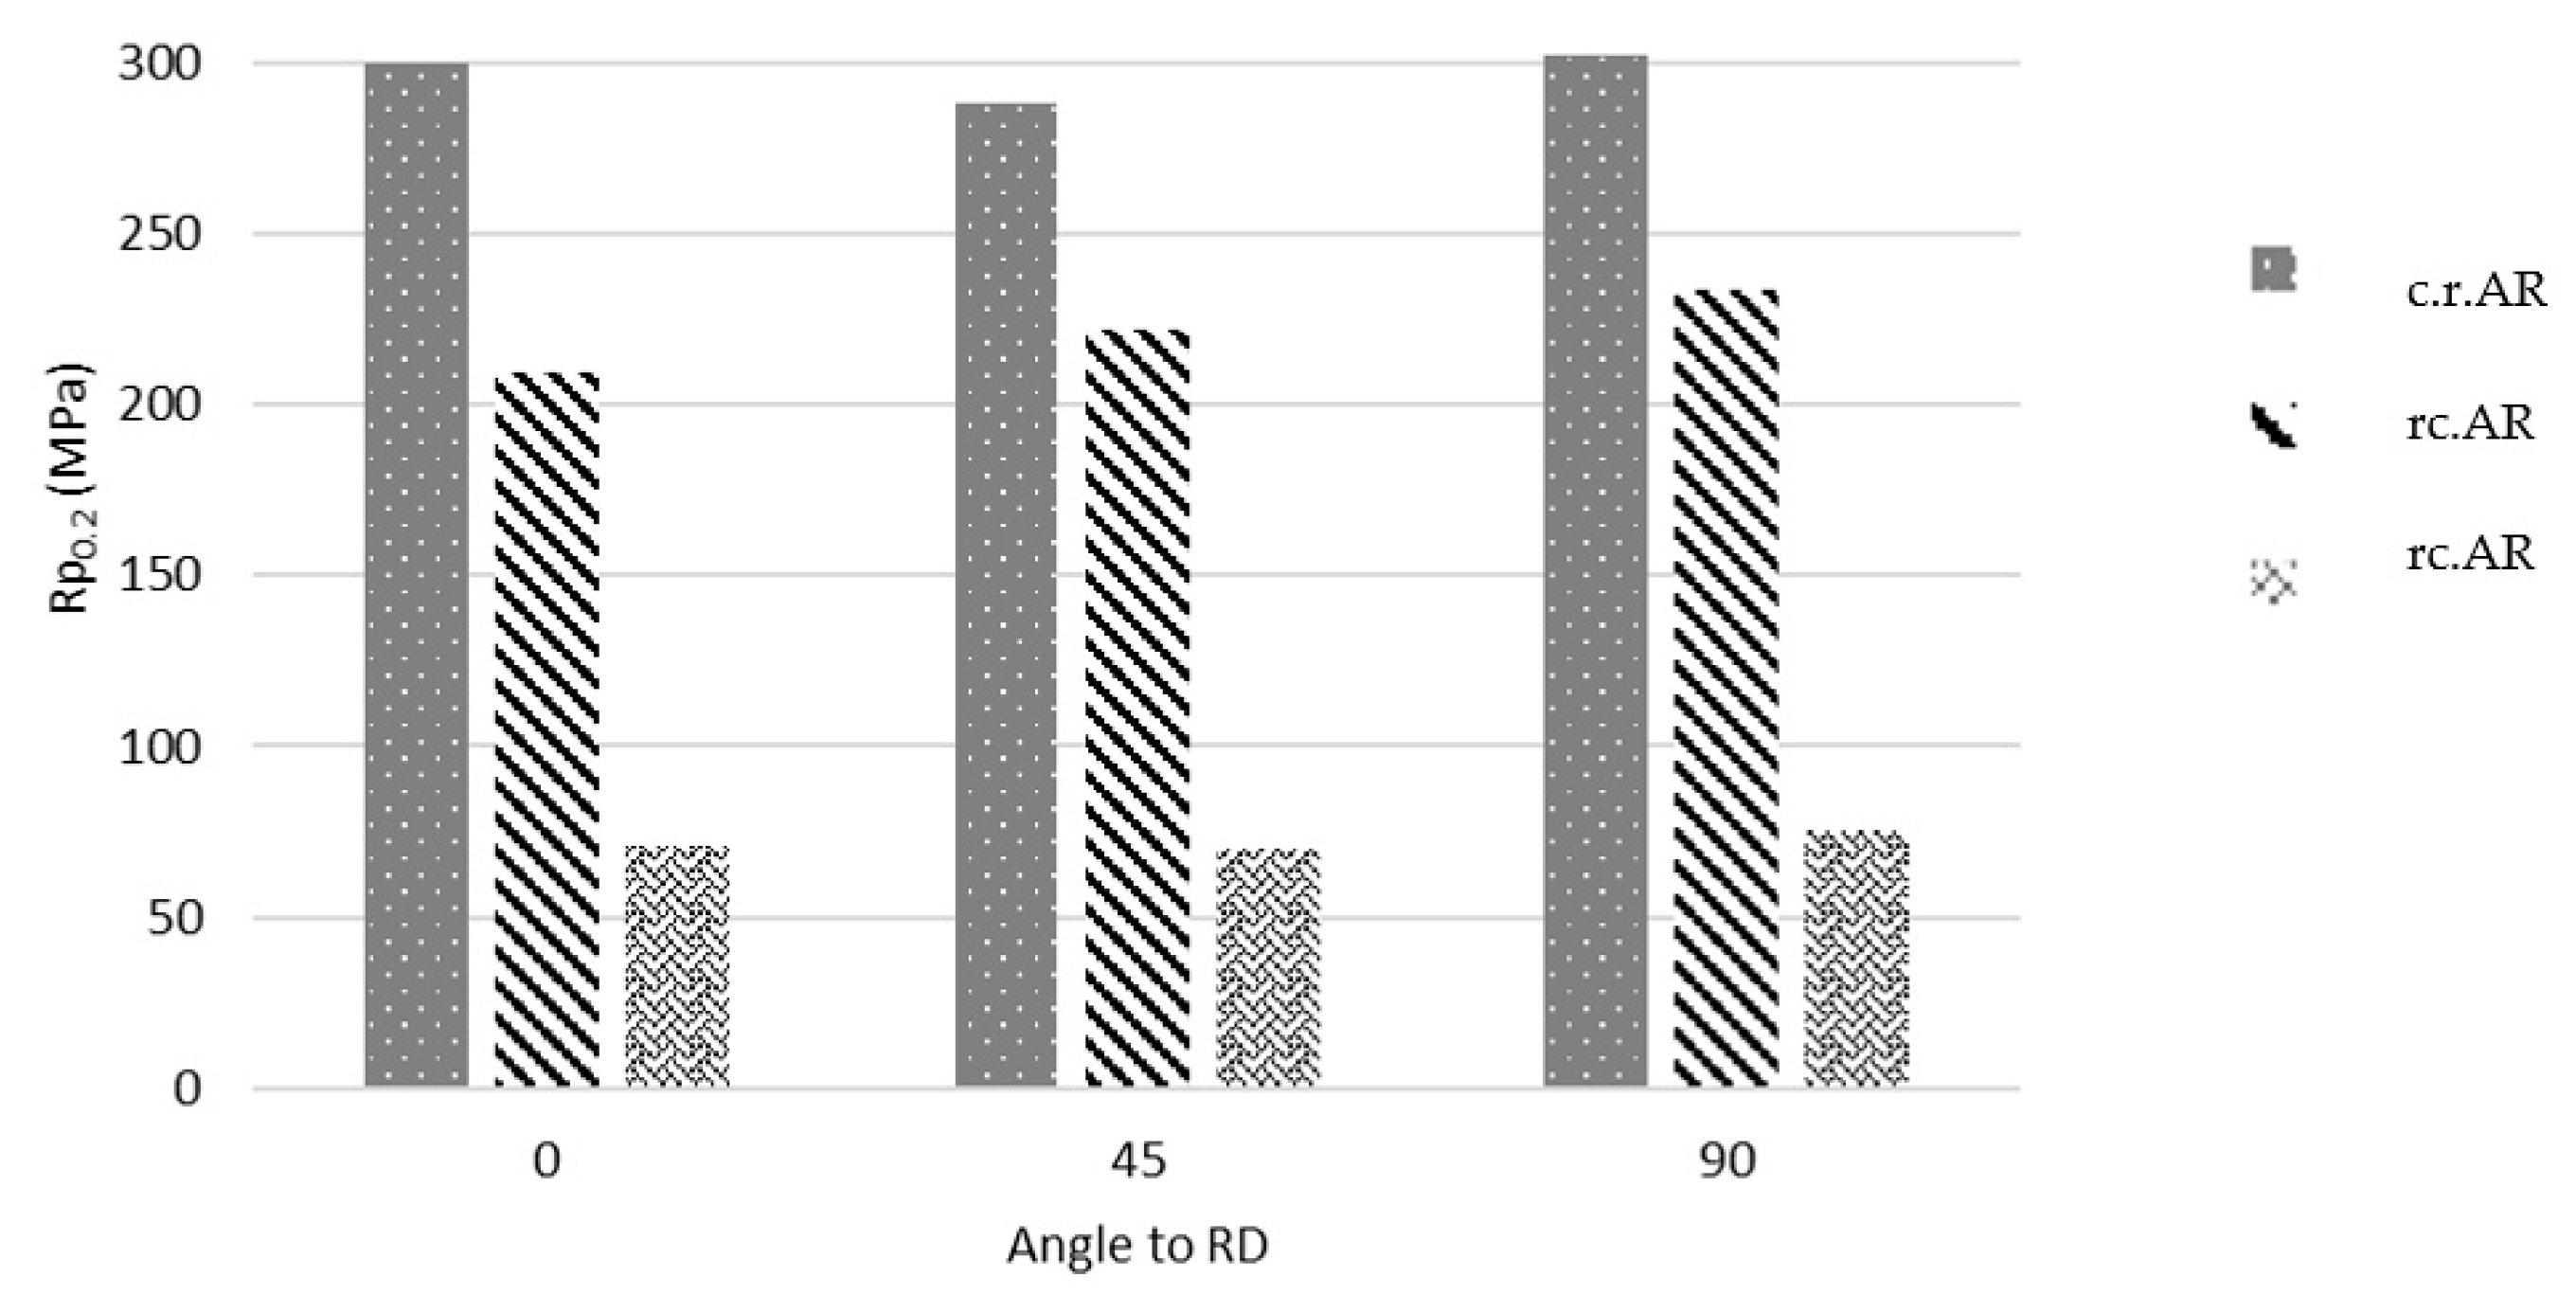
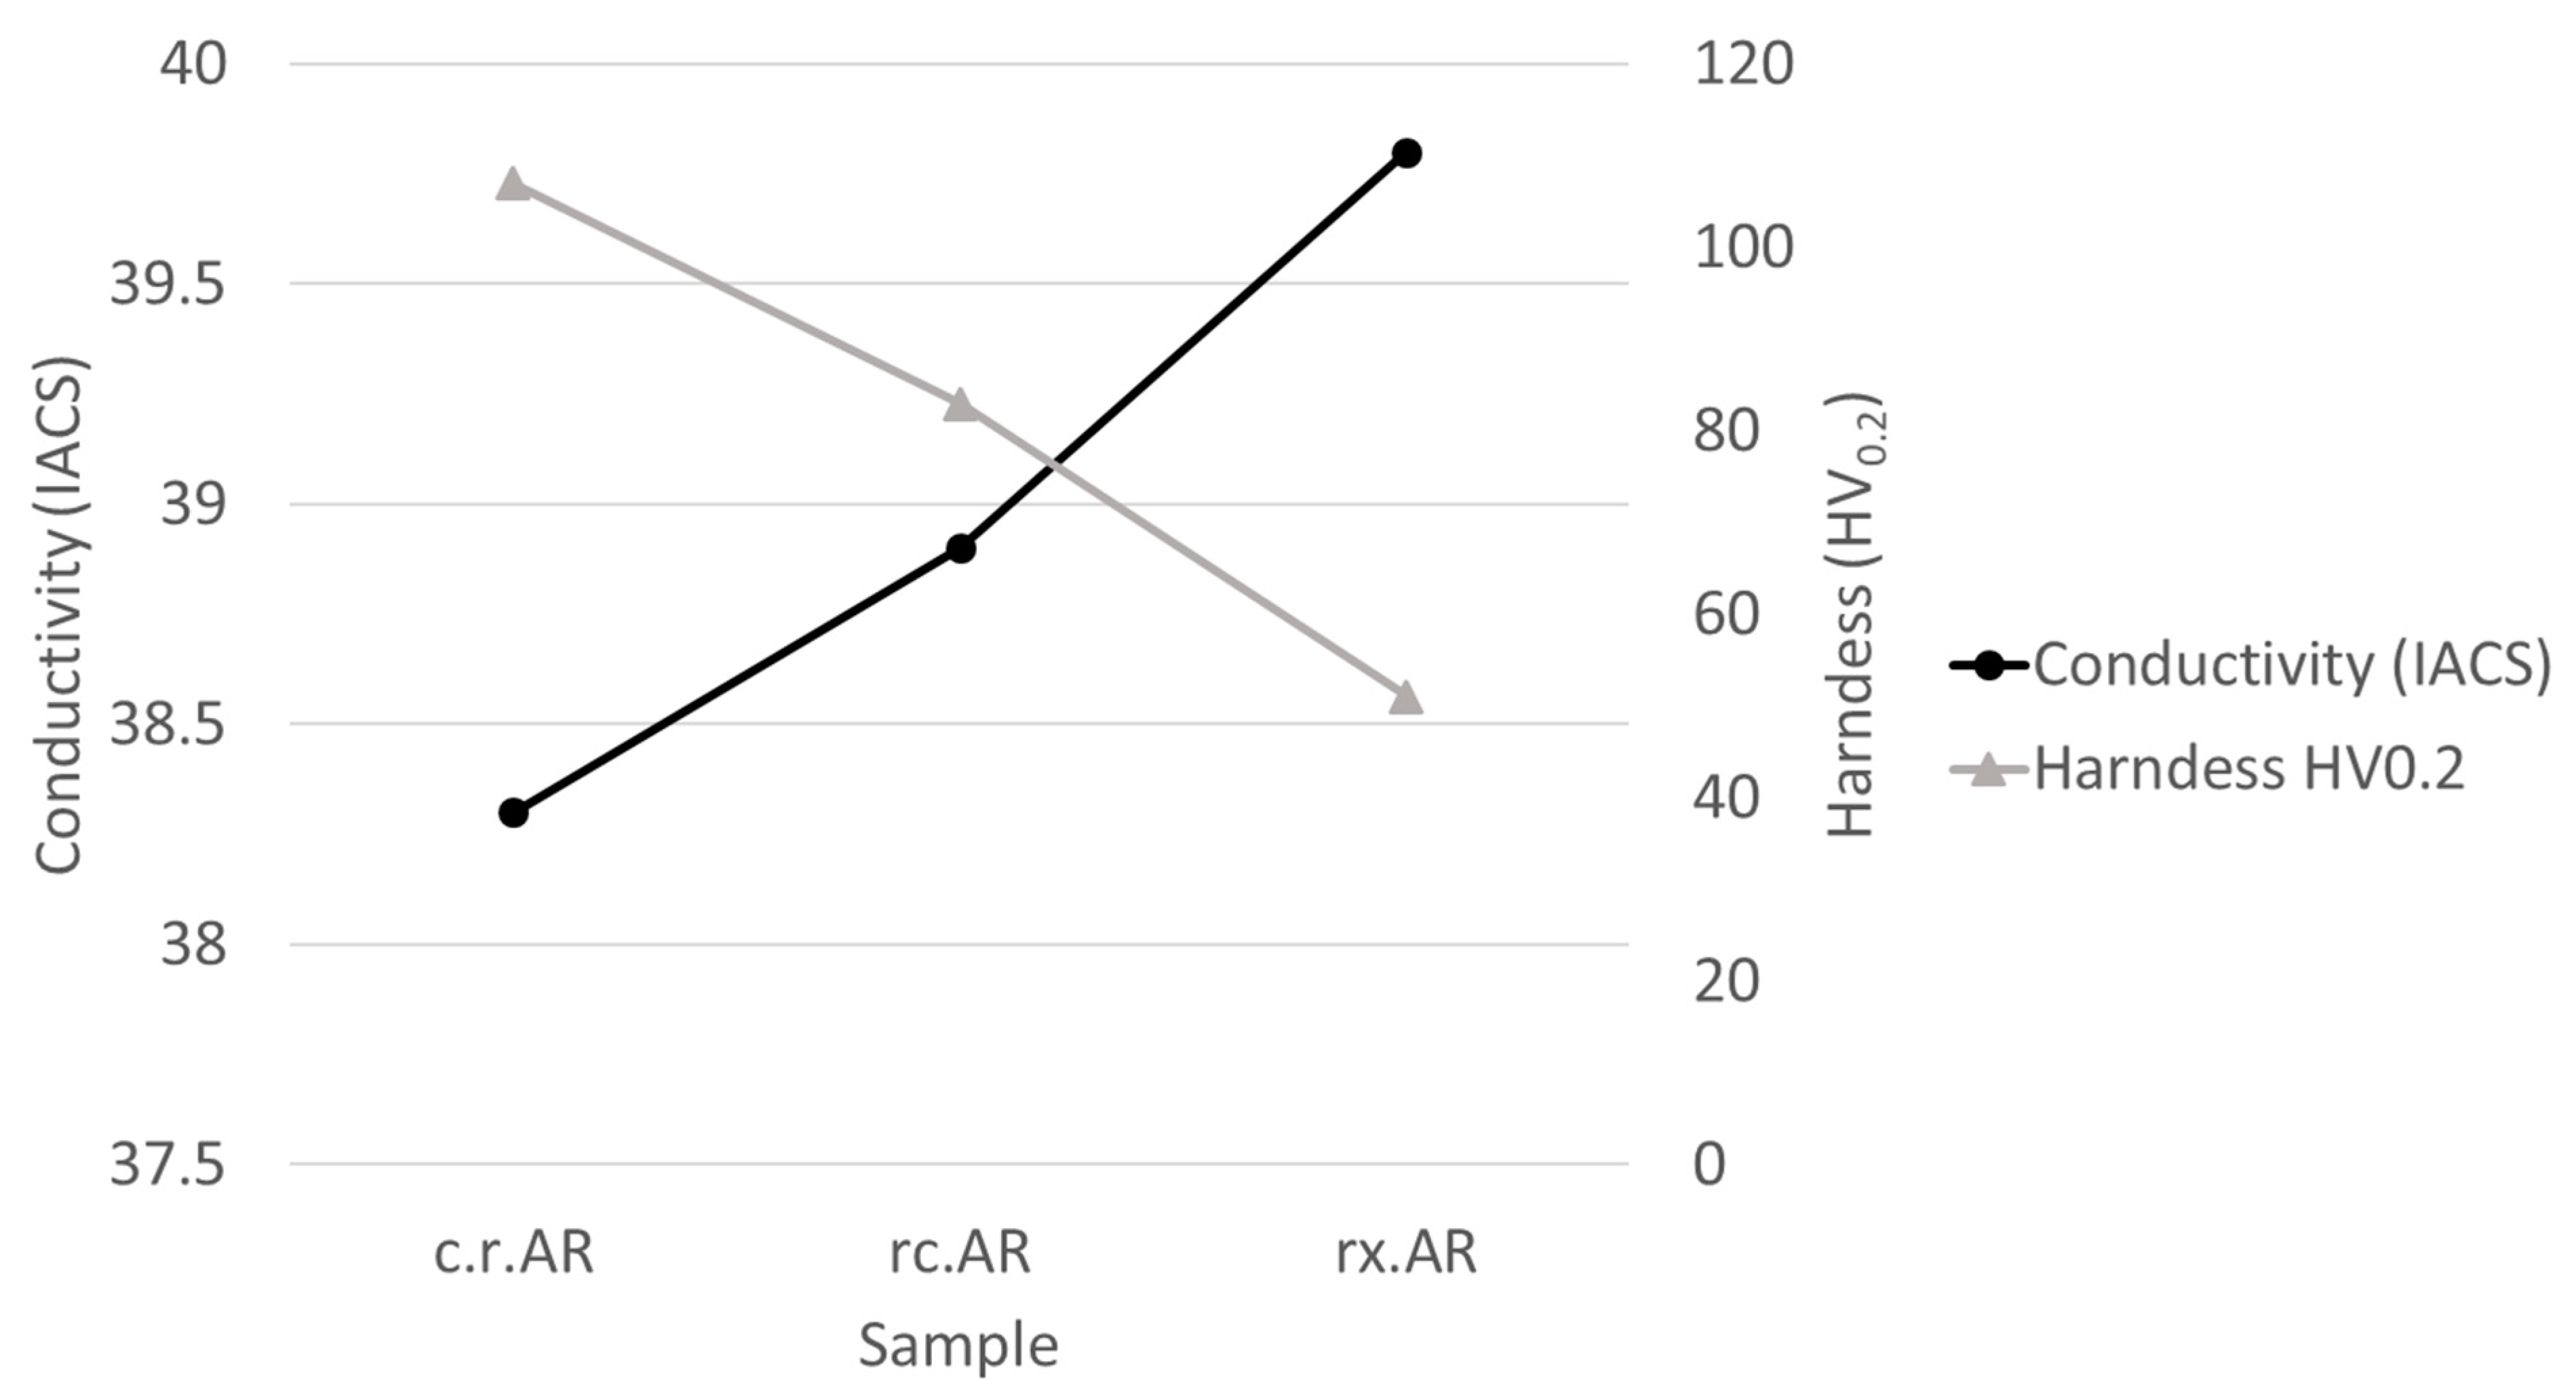
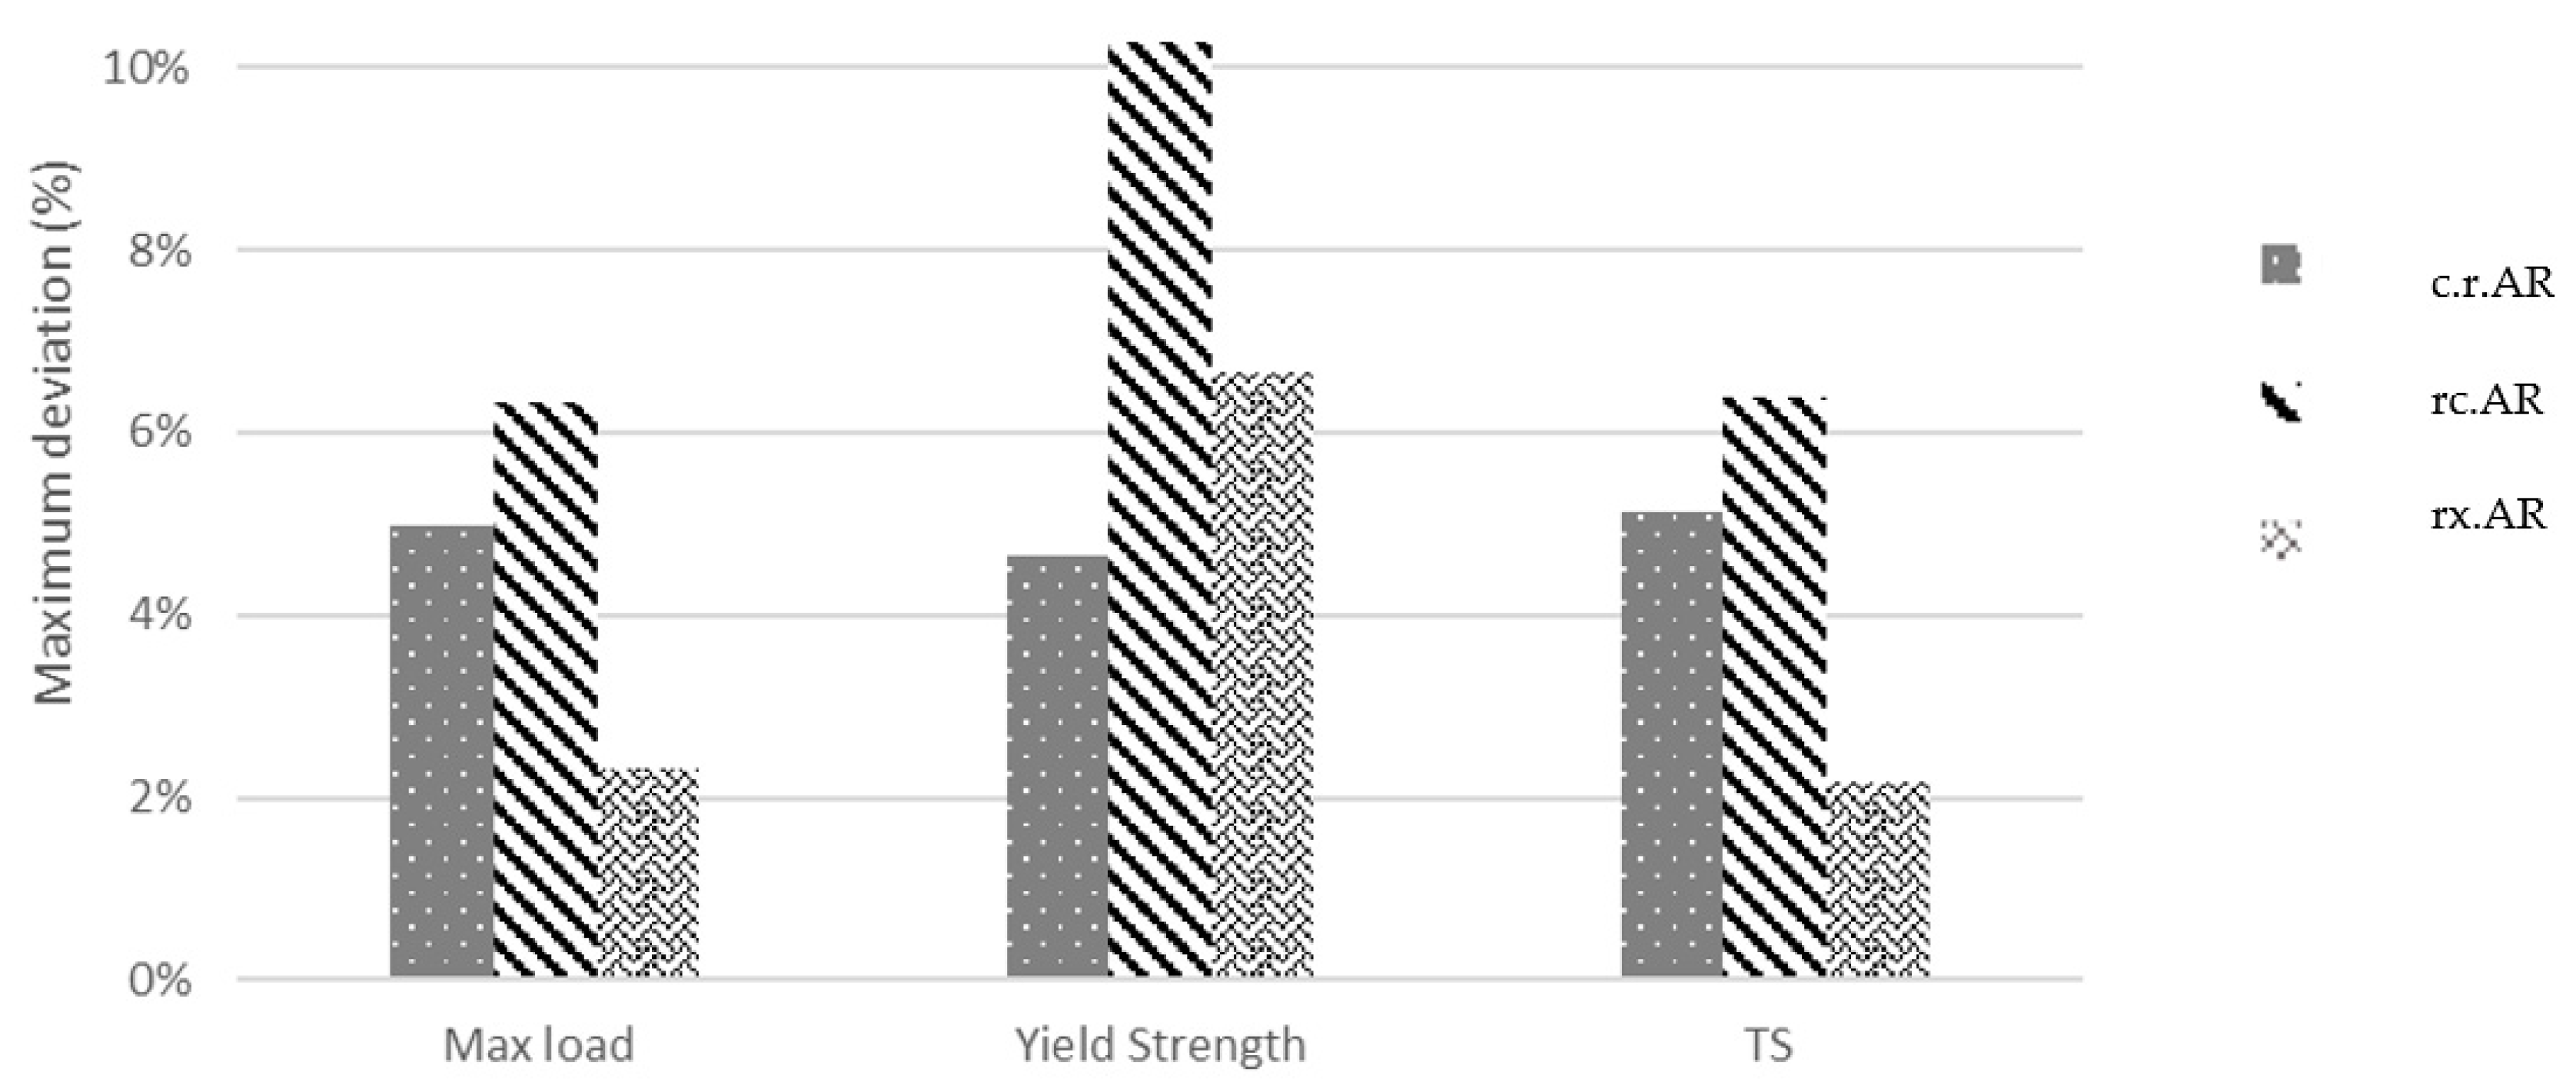
| Sample ID | Max Load (N) | Rp0.2 (Mpa) | Rm (Mpa) | Ag (%) | ∆r | rm | Conductivity (IACS%) | Hardness HV0.2 |
|---|---|---|---|---|---|---|---|---|
| c.r.RD | 1932.5 ± 2.1 | 300 ± 5.7 | 325 ± 0.0 | 4 ± 1.4 | 0.05 | 0.88 | 38.3 | 107 |
| c.r.45 | 1932.5 ± 2.1 | 288 ± 15.6 | 324.5 ±0.7 | 3 ± 0.0 | ||||
| c.r.TR | 2034 ± 1.4 | 302 ± 2.8 | 342 ± 0.0 | 4 ± 1.4 | ||||
| rc.RD | 1469 ± 1.4 | 209.5 ± 3.5 | 247 ± 0.0 | 7.5 ± 0.7 | −0.20 | 1.44 | 38.9 | 83 |
| rc.45 | 1443.5 ± 4.9 | 221.5 ± 2.1 | 242.5 ± 0.7 | 7.5 ± 0.7 | ||||
| rc.TR | 1541 ± 5.7 | 233.5 ± 2.1 | 259 ± 1.4 | 5.5 ± 0.7 | ||||
| rx.RD | 1102 ± 1.4 | 70.5 ± 9.2 | 185 ± 0.0 | 17.5 ± 07 | −0.14 | 1.05 | 39.8 | 51 |
| rx.45 | 1077 ± 2.8 | 70 ± 7.1 | 181 ± 0.0 | 18 ± 1.4 | ||||
| rx.TR | 1076.5 ± 6.0 | 75 ± 1.4 | 181 ± 3.5 | 18.5 ± 0.0 |
| Sample ID | Condition | IPF Intensity | GOS | |
|---|---|---|---|---|
| c.r.AR | Deformed | 2.7 | 0°–1° | 3.7 |
| 1°–10° | 95.1 | |||
| rc.AR | Recovered | 2.4 | 0°–1° | 18.7 |
| 1°–10° | 66.6 | |||
| rx.AR | Recrystallized | 2.0 | 0°–1° | 73.3 |
| 1°–10° | 26.1 | |||
| c.r.AR | c.r.RD | c.r.45 | c.r.TR | |
|---|---|---|---|---|
| KAM values | 0.3 | 0.5 | 0.4 | 0.6 |
| Misorientation angles | ||||
| 2–5o | 69.8 | 70.6 | 77.7 | 70.0 |
| 5–15o | 9.2 | 23.5 | 15.9 | 23.3 |
| 15–62.5o | 21.0 | 5.9 | 6.4 | 6.7 |
| Rolling components | ||||
| Copper (90, 35, 45) | 1.1 | 12.2 | 0.4 | 0.5 |
| S2 (47, 37, 63) | 40.4 | 10.6 | 1.2 | 0 |
| S3(59, 37, 63) | 12.5 | 43.4 | 0.2 | 0.2 |
| Taylor/Dillamore (90, 27, 45) | 0.3 | 1.8 | 0.5 | 0.1 |
| Brass (35, 45, 90) | 3.4 | 21.7 | 0.1 | 0.1 |
| Recrystallization components | ||||
| Cube (0, 0, 0) | 1.9 | 0.5 | 0 | 0 |
| P (70, 45, 0) | 2.3 | 0.9 | 15.1 | 44.4 |
| Q (58, 18, 0) | 4.2 | 2.0 | 12.1 | 6.1 |
| R (57, 29, 63) | 10.4 | 5.8 | 1.2 | |
| Goss (0, 45, 0) | 1.6 | 2.6 | 64.2 | 1.4 |
| rc.AR | rc.RD | rc.45 | rc.TR | |
|---|---|---|---|---|
| KAM values | 0.1 | 0.8 | 0.9 | 1.0 |
| Misorientation angles | ||||
| 2–5° | 35.9 | 51.9 | 43.8 | 72.6 |
| 5–15° | 7.1 | 28.3 | 29.1 | 16.6 |
| 15–62.5° | 57.0 | 19.8 | 27.1 | 10.7 |
| Rolling components | ||||
| Copper (90, 35, 45) | 40.8 | 8.3 | 0.7 | 0.6 |
| S2 (47, 37, 63) | 6.5 | 15.6 | 2.7 | 0.4 |
| S3(59, 37, 63) | 45.2 | 31.6 | 1.3 | 0.2 |
| Taylor/Dillamore (90, 27, 45) | 2.6 | 2.4 | 0.7 | 0.2 |
| Brass (35, 45, 90) | 29.5 | 11.9 | 0.5 | 0.5 |
| Recrystallization components | ||||
| Cube (0, 0, 0) | 1.5 | 5.6 | 1.2 | 1.4 |
| P (70, 45, 0) | 0.3 | 0.6 | 9.4 | 7.2 |
| Q (58, 18, 0) | 1.1 | 3.9 | 2.9 | 19.4 |
| R (57, 29, 63) | 5.6 | 6.1 | 0 | 0.4 |
| Goss (0, 45, 0) | 0.5 | 2.3 | 5.7 | 0.1 |
| rx.AR | rx.RD | rx.45 | rx.TR | |
|---|---|---|---|---|
| KAM values | 0.1 | 1.0 | 0.8 | 1.0 |
| Misorientation angles | ||||
| 2–5° | 3.4 | 70.4 | 39.4 | 63.7 |
| 5–15° | 4.6 | 8.1 | 11.5 | 8.3 |
| 15–62.5° | 92.0 | 21.6 | 49.1 | 28.0 |
| Rolling components | ||||
| Copper (90, 35, 45) | 6.4 | 3.6 | 5.1 | 5.8 |
| S2 (47, 37, 63) | 22.0 | 3.0 | 11.3 | 2.9 |
| S3(59, 37, 63) | 1.4 | 15.9 | 5.8 | 9.4 |
| Taylor/Dillamore (90, 27, 45) | 1.1 | 13.2 | 2.8 | 2.5 |
| Brass (35, 45, 90) | 8.5 | 12.1 | 0.5 | 2.8 |
| Recrystallization components | ||||
| Cube (0, 0, 0) | 0.1 | 1.3 | 0.4 | 9.1 |
| P (70, 45, 0) | 2.6 | 0.8 | 3.7 | 10.8 |
| Q (58, 18, 0) | 8.2 | 8.4 | 10.0 | 8.8 |
| R (57, 29, 63) | 0.1 | 6.7 | 4.3 | 4.8 |
| Goss (0, 45, 0) | 23.6 | 0.0 | 5.6 | 0.8 |
Publisher’s Note: MDPI stays neutral with regard to jurisdictional claims in published maps and institutional affiliations. |
© 2021 by the authors. Licensee MDPI, Basel, Switzerland. This article is an open access article distributed under the terms and conditions of the Creative Commons Attribution (CC BY) license (https://creativecommons.org/licenses/by/4.0/).
Share and Cite
Papadopoulou, S.; Loukadakis, V.; Zacharopoulos, Z.; Papaefthymiou, S. Influence of Uniaxial Deformation on Texture Evolution and Anisotropy of 3104 Al Sheet with Different Initial Microstructure. Metals 2021, 11, 1729. https://doi.org/10.3390/met11111729
Papadopoulou S, Loukadakis V, Zacharopoulos Z, Papaefthymiou S. Influence of Uniaxial Deformation on Texture Evolution and Anisotropy of 3104 Al Sheet with Different Initial Microstructure. Metals. 2021; 11(11):1729. https://doi.org/10.3390/met11111729
Chicago/Turabian StylePapadopoulou, Sofia, Vasilis Loukadakis, Zisimos Zacharopoulos, and Spyros Papaefthymiou. 2021. "Influence of Uniaxial Deformation on Texture Evolution and Anisotropy of 3104 Al Sheet with Different Initial Microstructure" Metals 11, no. 11: 1729. https://doi.org/10.3390/met11111729
APA StylePapadopoulou, S., Loukadakis, V., Zacharopoulos, Z., & Papaefthymiou, S. (2021). Influence of Uniaxial Deformation on Texture Evolution and Anisotropy of 3104 Al Sheet with Different Initial Microstructure. Metals, 11(11), 1729. https://doi.org/10.3390/met11111729