Article

Analysis of As-Built Microstructures and Recrystallization Phenomena on Inconel 625 Alloy Obtained via Laser Powder Bed Fusion (L-PBF)

PIMM Laboratory, UMR 8006 ENSAM-CNRS-CNAM, HESAM University, 151 Boulevard de L’hôpital, 75013 Paris, France
*
Author to whom correspondence should be addressed.
Metals 2021, 11(4), 619; https://doi.org/10.3390/met11040619
Submission received: 24 March 2021 / Revised: 4 April 2021 / Accepted: 6 April 2021 / Published: 12 April 2021
(This article belongs to the Special Issue Additive Manufacturing of Metals with Lasers II)

Abstract

:
The microstructures induced by the laser-powder bed fusion (L-PBF) process have been widely investigated over the last decade, especially on austenitic stainless steels (AISI 316L) and nickel-based superalloys (Inconel 718, Inconel 625). However, the conditions required to initiate recrystallization of L-PBF samples at high temperatures require further investigation, especially regarding the physical origins of substructures (dislocation densities) induced by the L-PBF process. Indeed, the recrystallization widely depends on the specimen substructure, and in the case of the L-PBF process, the substructure is obtained during rapid solidification. In this paper, a comparison is presented between Inconel 625 specimens obtained with different laser-powder bed fusion (L-PBF) conditions. The effects of the energy density (VED) values on as-built and heat-under microstructures are also investigated. It is first shown that L-PBF specimens created with high-energy conditions recrystallize earlier due to a larger density of geometrically necessary dislocations. Moreover, it is shown that lower energy densities offers better tensile properties for as-built specimens. However, an appropriate heat treatment makes it possible to homogenize the tensile properties.

1. Introduction

The laser powder bed fusion (L-PBF) process is now widely recognized as the most powerful and efficient additive manufacturing process for building complex 3D shapes with a high degree of precision and combined with satisfactory metallurgical properties. Moreover, the capacities of L-PBF machines have been increased to produce larger parts more quickly—the building chambers have recently been enlarged (e.g., from 850 to 1000 mm in building height) and some of them offer up to four lasers, which are used simultaneously.
Many authors have investigated the classical triad between process optimization, microstructures and mechanical properties for a large range of classical L-PBF metallic alloys, such as 316L or maraging steels [1,2], superalloys (such as Inconel 625 or Inconel 718 [3,4]), Al-Si alloys, or Ti6Al4V titanium alloy [5,6], among many others. More exotic or challenging materials such as tungsten [7], copper [8], and noble metals (i.e., silver [9]) have also already been studied. However, even for rather usual L-PBF alloys such as Ni-based superalloys or austenitic stainless steel, the attractive mechanical properties, combining high mechanical resistance and high ductility, still pose open questions that demand a better understanding. For instance, Wang et al. [10] obtained higher ultimate tensile strength (UTS) and elongation at break (A%) values on an as-built L-PBF 316L stainless steel samples than on a forged alloy. Regarding L-PBF, a challenging question is also to understand whether it is possible to avoid heat treatment (HT) after the process due to the use of as-built microstructures or to lower the standard temperatures used for hot isostatic pressing (HIP) or HT.
A well-known aspect is that L-PBF samples exhibit anisotropic mechanical behaviors with superior mechanical strength perpendicular to the building direction (BD) during tensile testing. This feature can be considered as a major drawback, however it can easily be suppressed with a recrystallization stage using an adapted heat treatment. The influence of solid solution heat treatment on Inconel 625 L-PBF parts was investigated by Kreitcberg et al. [11]. After heat treatment, the morphological and crystallographic textures initially aligned with the building direction are transformed into an equiaxed microstructure with randomly oriented grains, leading to isotropic mechanical behavior.
In many studies, the driving force for recrystallization of L-PBF samples is assumed to be due to a large density of dislocations generated during the process and located near solidification cell boundaries. Such high dislocation densities, resulting in considerable stored energy [12], are usually combined with microsegregation areas—for instance Mo and Nb on Inconel 625 [13] or Cr and Mo on 316L steel [14]. However, pure metals can also recrystallize after L-PBF, as indicated by Li et al. [15] on pure titanium. This indicates that microsegregation does not necessarily play a major role in the accumulation of dislocations near solidification cell boundaries. In this specific field, the dependence between recrystallization phenomena, L-PBF process parameters, and microstructures of as-built samples is another open question.
Other investigations on L-PBF Inconel 625 have addressed the formation of precipitates on as-built or heat-treated alloys. For instance, using Transmission Electron Microscopy (TEM) analysis, Amato et al. [16] evidenced tiny (10–20 nm) and globular γ″ precipitates, while Li et al. [17] highlighted ~100 nm precipitates enriched with Mo and Nb on as-built Inconel 625. Marchese et al. [18] also evidenced 10–50 nm NbC precipitates inside solidification cells. After a stress-relief heat treatment at 870 °C, Lass et al. [19] indicated the simultaneous and fast precipitation of δ and γ″ phases, favored by the accumulation of Nb in inter-cell areas.
All investigations mentioned above indicate that as-built L-PBF Inconel 625 exhibits specific microstructures compared with conventionally processed (cast or wrought) alloys, and that dedicated heat treatments can promote either faster precipitation kinetics or full recrystallization due to a combination of microsegregated zones and the high density of dislocations. However, there is still a lack of information concerning the as-built Inconel 625 microstructure, especially considering the amount of stored energy or the density of dislocations induced by L-PBF and their relation with subsequent recrystallization at high temperature.
These are the main objectives of the current paper:
(1) To investigate thoroughly the effects of manufacturing parameters on microstructure and mechanical properties of as-built Inconel 625 samples, and more specifically to estimate the density of dislocations for three selected L-PBF conditions;
(2) To address recrystallization aspects occurring at elevated temperature (1100 °C) and their effects on microstructures and mechanical properties through the combined use of electron backscatter diffraction (EBSD), hardness determination, and X-ray diffraction. Additionally, a dedicated and original experimental protocol is carried out to estimate the equivalent plastic deformation corresponding to as-built L-PBF samples, to provide a better insight into the relations between recrystallization parameters and L-PBF conditions.

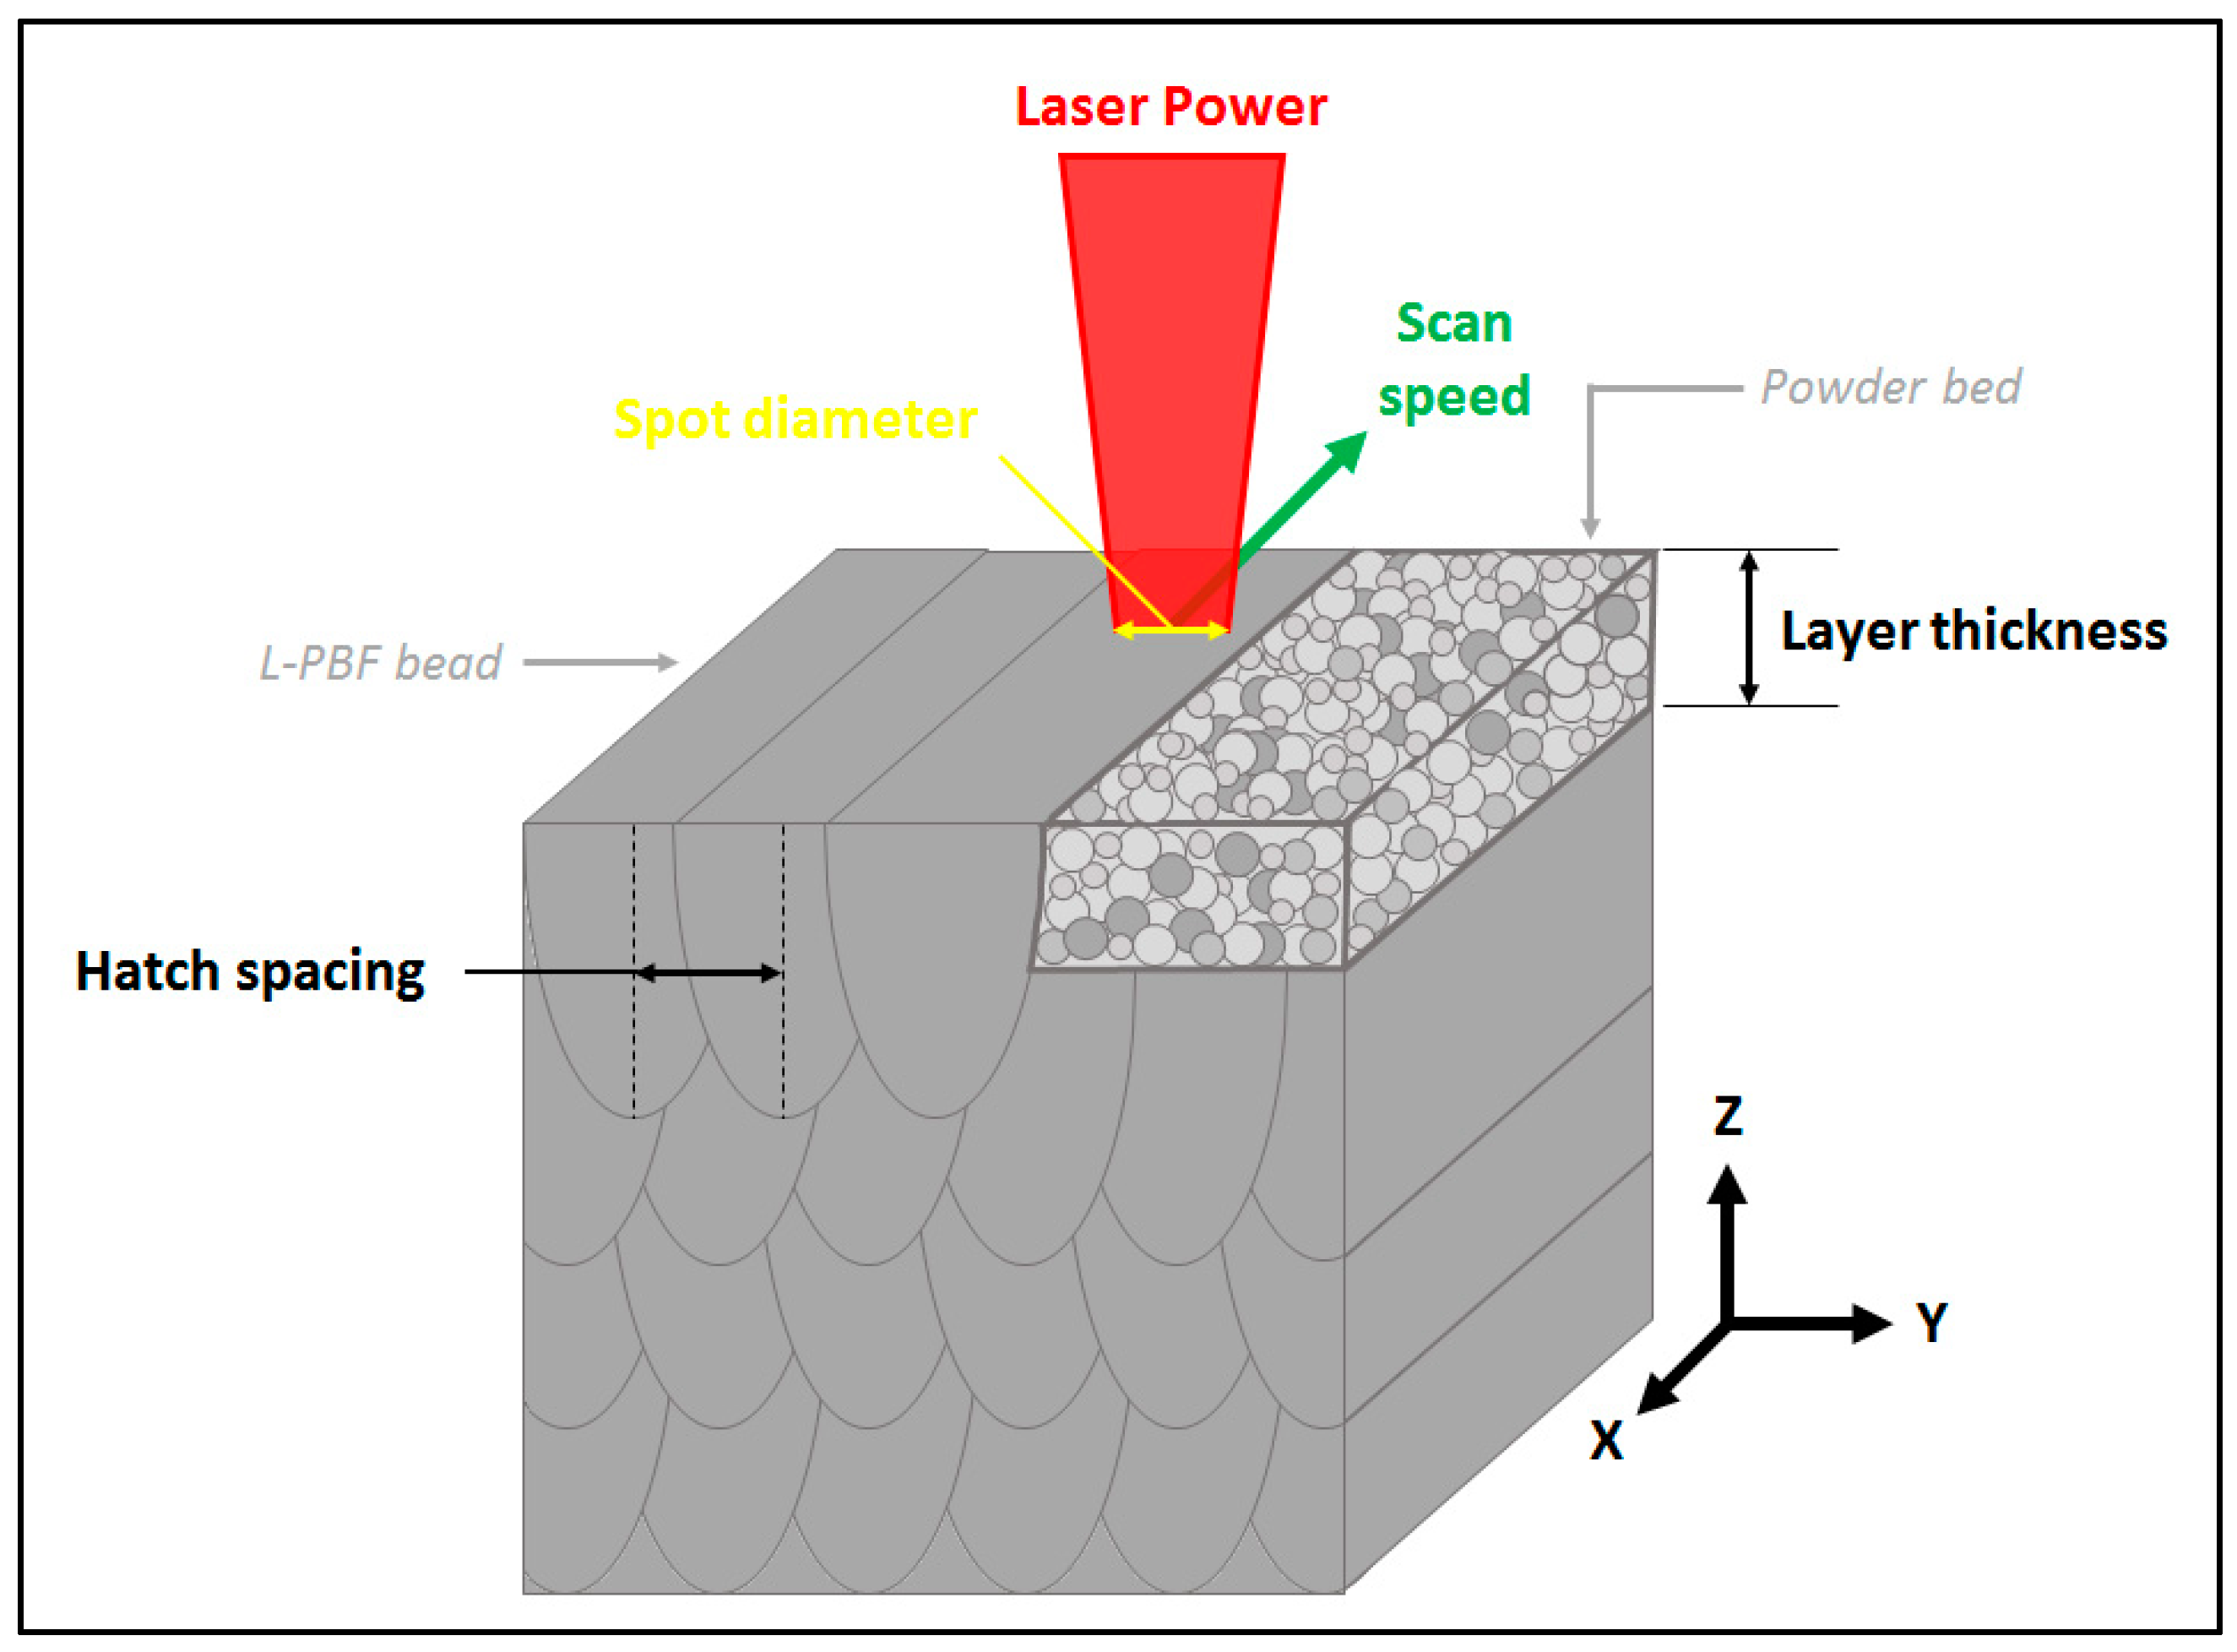
2. Materials and Methods

Experimental L-PBF tests were carried out on a SLM 125 HL machine (from SLM Solutions GmbH, Lübeck, Germany) with argon shielding and 50 µm layer heights. Three L-PBF conditions were used for the parametric investigations, named L-PBF-1 (warm condition), L-PBF-2 (mild condition), and L-PBF-3 (cold condition). The objective was to manufacture samples using three different L-PBF conditions to determine the effects of the process parameters on the microstructures and mechanical properties. The first condition is a standard one in terms of Volume Energy Density (VED) and is equivalent to the manufacturing condition proposed by the machine manufacturer (L-PBF-2). The second one is a low-VED condition (L-PBF-3) and the third one is a high-VED condition (L-PBF-1). Three build plates (one for each process condition) containing 23 rectangular samples (10 × 10 × 22 mm3) were manufactured. The conditions only differed by their scanning speeds (0.225 m/s, 0.45 m/s, and 0.9 m/s) and the resulting VEDs, with all other parameters kept constant. The VED (J/mm3) is defined as follows (1), with P representing the laser power (W), V representing the scan speed (mm/s), and D representing the laser spot diameter (mm). The experimental L-PBF conditions are summarized in Table 1 and illustrated in Figure 1.
V E D =   4   ×   P V   ×   π   ×   D 2 ,
Four build plates were manufactured: three containing tensile specimens (4 vertical and 4 horizontal), i.e., one per manufacturing condition (Figure 2), with the final one containing a trapezoidal specimen devoted to a specific work on recrystallization. This trapezoidal specimen was manufactured vertically with the L-PBF-2 conditions. It was then heat-treated (1100 °C, 3 h, under air) and water-quenched in order to cut it into flat test specimens of 2 mm thickness, as indicated in Figure 3.
The same commercial gas-atomized Inconel 625 powder from Oerlikon (D10 = 21 µm, D50 = 35 µm, D90 = 58 µm, where D10, D50, and D90 are the sizes below which 10%, 50%, and 90% of the material is contained, respectively) was used for all the L-PBF tests. Scanning electron microscopy (SEM) analysis revealed mostly spherical particles (Figure 4). The chemical composition is given in Table 2. For the 3D trials, 25-mm-thick 316L building platforms were used in the L-PBF process, whereas 4-mm-thick Inconel 625 sheets were used for process optimization on single beads.
Single L-PBF beads and 3D samples were analyzed using optical microscopy, after polishing up to 1 µm diamond suspension. Electron backscatter diffraction (EBSD) samples underwent an additional finishing step with an oxide polishing suspension (OP-S) for 10 min. The analysis of porosity was carried out using a ×50 magnification, resulting in a 1.37 µm/pixel resolution. Five images corresponding to an analyzed area of 47.5 mm2 were captured and binarized using imageJ® software (version 1.52r 26, National Institutes of Health, Bethesda, MD, USA). The porosity of the sample was then estimated using the ratio of black to white pixels as described by De Terris et al. [20].
In the second step, the microstructures were examined by means of electron backscatter diffraction (EBSD) in a scanning electron microscope Philips XL 40 SEM (Philips, Amsterdam, The Netherlands) equipped with a Nordif UF-1000 detector (Nordif, Trondheim, Norway) before and after a 1100 °C, 3 h heat treatment. For each sample, a large area of 5.6 mm2 was analyzed on the entire surface, using 10 independent EBSD maps (0.75 mm side) with a step size of 1 µm. This was found to be sufficient to provide the general trend of process impacts on the microstructural features. At higher magnification (at the micron scale), the microstructures were examined using scanning electron microscopy (SEM), after a chemical etching in a solution containing 92% HCl, 5% H2SO4, and 3% HNO3 over approximately 30 to 90 s. X-ray diffraction was carried out on an X’PERT PANalytical θ-2θ goniometer equipped with a copper source (Malvern Panalytical, Malvern, UK) and more specifically the estimation of 2nd and 3rd order stresses through X-ray peak broadening, was also used to give additional information on microstructures.
As for the mechanical response, 150 kgf Rockwell hardness tests (Testwell, Gennevilliers, France) were used as a simple method to evaluate the progression of recrystallization (10 macro-indentations over the entire surface of a vertical cross-section for each sample). Moreover, 200 gf Vickers microhardness tests (Presi, Eybens, France) were carried out to estimate local mechanical gradients (one matrix of 20 × 50 micro indentations spaced 200 μm apart per sample). Lastly, tensile tests (Instron, Japan) with 2 tests per manufacturing conditions, at an elongation rate of 2 mm/min (corresponding to a strain-rate of ~3.33 × 10⁻³ s−1) were carried out at room temperature on as-built and heat-treated L-PBF samples (L0 = 10 mm, section = 8 × 4 mm2). Before being tested, the tensile specimens were polished to grade P4000 in order to control precisely the dimensions of the effective section (that was controlled individually for each specimen before testing) and to prevent roughness from impacting the tests.
Fifteen L-PBF cubic samples were used for the analysis of the recrystallization kinetics, which were put into a furnace at 1100 °C. Every 3 min, one sample was removed from the furnace, water-quenched, and analyzed using hardness tests to provide an estimation of recrystallization processes. It should be noted that after each opening of the furnace, it was found that the temperature (controlled and measured by a thermocouple) decreased by 6 to 10 °C for a few seconds ( ~ 20 to 30 s), before returning to the set temperature (1100 °C). This slight temperature decrease was not considered to have an impact on the following study. In a second step, EBSD analyses were carried out on a more limited number of samples corresponding to different stages of the recrystallization process, which were identified thanks to the Rockwell C hardness tests.

3. Results and Discussion

3.1. Analysis of As-Built Samples

3.1.1. Samples Porosity

The sample porosity was first determined using optical microscopy carried out on as-polished samples (without etching) and image analysis (after binarization and thresholding) using ImageJ® software (version 1.52r 26, National Institutes of Health, Bethesda, MD, USA). On the one hand, for all investigated L-PBF conditions, the porosity was shown to be lower than 0.3% vol (Figure 5). The warmer condition appeared to lead to denser specimens, even if differences in porosity were systematically obtained from the same build plate between samples located at the center part of the build platform and the right part (closer to the gas flow entry). In the case of samples produced with a low VED (L-PBF-3, cold condition), the most porous samples were located on the gas flow side and exhibited porosities of the “lack of fusion” type, while in the case of samples produced with a high VED (L-PBF-1, warm condition), the most porous samples were on the gas fumes side and had keyhole porosities.

3.1.2. EBSD Analysis

The L-PBF as-built microstructures were investigated using EBSD (Figure 6). Columnar grains oriented along the building direction (BD) were systematically observed, regardless of the process conditions. These columnar grains resulted from the competition between the thermal gradient and the epitaxial growth on the preceding layer. At the scale of a multitude of L-PBF beads superimposed horizontally and vertically, the main thermal gradient was vertical, i.e., along the building direction [21]. Moreover, from solidification theory, it is known that the main direction of growth of face-centered cubic (FCC) crystals is in the [1] direction. The most recognized explanation is that the directions containing the fewest atoms (family of [1] for the FCC crystal) are the fastest to develop during solidification, while the growth according to the densest planes is the slowest. Cells oriented at [1] will, therefore, germinate along the thermal gradient of the part. Using the intercept method (30 vertical and horizontal lines) for each EBSD map of each sample, it is possible to estimate the average grain sizes parallel and perpendicular to the BD. Aspect ratios of 2.3, 2.2, and 1.9 were estimated for L-PBF-1, L-PBF-2, and L-PBF-3 conditions, respectively. However, due to using the intercept method, such aspect ratios seemed to be underestimated at least for a number of very large grains, for which values of more than 4 were found (Figure 6).

3.1.3. Analysis of Dislocation Density

Nye [22], Cottrell [23], and Ashby [24] studies on dislocations led to separation of the total dislocation densities of crystals into two types of dislocations: geometrically necessary dislocations (GNDs) and statistically stored dislocations (SSDs). The first type (GNDs) is related to the strain gradients due to the geometrical constraints of the crystal lattice. These dislocations of the same sign accommodate the lattice curvature (i.e., misorientation). GNDs play a significant role in strengthening effects for alloys [25,26]. All other dislocations with a vanishing net Burgers’ vector are of the SSD type. SSDs are stored due to an accumulation process—they trap each other in a random way and do not produce any significant misorientation. SSDs are assumed to move and glide to relax the stress without leaving a geometrical plastic effect in the material. Note, however, that the separation between GNDs and SSDs depends on the observation scale.
On the one hand, the Williamson-Smallman approach [27,28] allows estimation of the dislocation density of a material from the broadening of X-ray diffraction (XRD) Bragg peaks by comparing the reflections of various (hkl) planes. On the other hand, GNDs can be extracted from EBSD misorientation data. These two methods are implemented below.

X-ray Diffraction Measurements

For the three L-PBF conditions samples, X-ray diffractograms were obtained (Figure 7) for specific analysis of peak broadening of (111), (200), (220), and (311) planes based on the Williamson-Smallman approach. For each manufacturing condition, the diffractograms were comparable to those presented in [16,17,19,29]. For this analysis, the instrumental contribution to integral widths of Bragg peaks (so-called instrumental broadening) was distinguished from the broadening of our polycrystalline sample by considering a reference LaB6 powder (standard reference material (SRM) 660c from National Institute of Standards and Technology(NIST)) known to provide negligible broadening. The difference in peak broadening between the various specimens was found to be significantly larger than the experimental uncertainty (Figure 8). In the first step, the following Williamson-Hall [27] formula (2) was used to separate the peak broadening due to crystal size from the one due to lattice defects.
F W H M × cos θ =   0.9   × λ D S + η × 4 sin θ ,
Here, FWHM is the full width at half maximum, θ is the Bragg angle, λ is the wavelength, Ds the mean crystal size, and η the root mean square of the lattice distortion ( η < ε 2 > , with ε being the local elastic strain and <.> being the volume average). In the second step, assuming an homogeneous distribution of dislocations, the Williamson-Smallman [28] relation (3) with b Burgers’ vector allows estimation of the density of dislocations ρD in FCC metals.
ρ D =   16.1 × < ε 2 > b 2 ,
In this study, the Burgers’ vector was determined via the lattice parameter a obtained through the XRD analyses. For ½{111}<110> dislocations, b = a 2 2 . The measured values ranged from 3.601 to 3.604 nm and the calculated value of b was ~0.255 nm. It can be noticed that XRD is essentially sensitive to SSDs, as these dislocations create more strain heterogeneities of the crystal lattice [30]. Here, ρD values of 1.7 × 10¹⁵ m−2, 8.9 × 10¹⁴ m−2, and 4.9 × 10¹⁴ m−2 were obtained for L-PBF-1, L-PBF-2, and L-PBF-3 samples, respectively. These values can be compared to 316L stainless steel that has been cold worked from 4% (ρD = 0.5 × 10¹⁵ m−2) to 11% (ρD = 1.5 × 10¹⁵ m−2) [31].

Estimation of GND Density from EBSD Data

The Mtex Matlab toolbox (version 5.1.0) [32] combined with dedicated scripts was used for mapping and averaging of the GND distribution through the analysis of in-grain orientation gradients, using the procedure detailed by Moussa et al. [33,34]. This procedure consists of the computation of the misorientation between neighboring EBSD pixels as a function of the distance between these pixels in order to account for measurement noise and spacing between EBSD points (steps). The slope of the curve provides the local orientation gradient from which the GND density (ρGND) can be estimated (4).
ρ G N D =   α θ b x
In (4), α is a constant ranging from 2 to 4; α equals 2 for a pure tilt boundary or 4 for a pure twist boundary [33]. In the present study, we assigned the average value of 3 to this constant, as the type of boundary was not clearly identified; θ is the true misorientation angle (i.e., the misorientation angle minus the measurement noise), b is the Burgers’ vector fixed to 2.55 nm (from XDR previous results), and x is the acquisition step size (1 µm). This procedure was found to apply very well to our specimens, as indicated in Figure 9.
Figure 10 indicates largely heterogeneous GND densities (ρGND) across the microstructure, with strong concentrations along bands corresponding to subgrain boundaries. For each specimen, ten EBSD maps of 750 × 750 µm2 each were measured, leading to a total surface area of 5.6 mm2. Although the distribution of GNDs was strongly heterogeneous in each map, the difference between the mean GND densities obtained for each single map (in a given specimen) appeared to be very small; in the worst case we measured a variation of 12.7% (L-PBF-2 sample). This indicated a good stationarity of the microstructures and that each map can be considered as a representative surface element. The average dislocation density in each sample was then estimated by the average over the 10 EBSD maps. We obtained slightly increasing VED values of 2.34 × 10¹⁵ m−2, 1.97 × 10¹⁵ m−2, and 1.62 × 10¹⁵ m−2 for warm, mild, and cold L-PBF conditions, respectively (Figure 10). The difference between these estimations was larger than the variability between individual maps in a single specimen, and therefore it is considered here as being statistically representative. These results are comparable to those of Sow et al. [35] and are also consistent with the tendency observed with XRD analysis and associated ρD data; the warmer L-PBF conditions generate higher-density dislocations.
Such ρGND values obtained on L-PBF samples are at least one order of magnitude higher than those obtained with conventional cast processing and are close to the dislocation densities of severely work-hardened materials, such as those obtained by Gao et al. [36] on cold-rolled Inconel 625 after work-hardening to 62% (GND density of 1.12 × 10¹⁵ m−2 [36]). These results were probably due to high deformation rates during melt pool shrinkage, which can be expected near solidification cell boundaries, as shown by Salman et al. [37] on 316L stainless steel.
Different studies have highlighted the advantages of using this EBSD-based method to estimate GND density, but have also pointed out its limitations. First, Moussa et al. [33] suggested that the major drawback of this approach is that 3D information is calculated from 2D measurements, even if for Calcagnotto et al. [38] the comparison of results obtained from 2D EBSD and 3D EBSD data were reliable (unlike for Field et al. [39], for whom the differences obtained varied from a factor of 1.2 to 2). In addition, Field et al. [39] specified that the GND densities they obtained were 10–30% of the overall estimated dislocation density, as they did not take into account SSDs. This observation was also made by Birosca et al. [25], according to whom the GND density largely depends on the grain orientation, as often encountered in the studies related to crystal plasticity (i.e., see Plancher et al. [40]). They demonstrated that although GND measurements by means of EBSD can provide great insight into dislocation accumulation and its behaviour, it is critical to consider the SSD type, which also contributes to the strengthening of the materials. Thus, TEM observation is essential to achieve a complete description of the material strain hardening via dislocation mechanisms. Finally, others authors have used this approach to show relationships between dislocation density evolution and strain [39,41,42,43], as they considered the GND densities obtained from EBSD analyses to be reliable (provided that measurements are made in comparable conditions).
In the present study, the estimation of dislocation densities using EBSD and XRD is interesting for the purpose of qualifying and comparing the impacts of the scanning speeds of different samples manufactured using the L-PBF process under identical observation and analysis conditions. The qualitative agreement between both techniques, the higher densities achieved under warmer conditions, and the fact that the obtained differences between specimens were larger than the experimental uncertainties showed that results were reliable. However, one should keep in mind that neither EBSD nor XRD provide fully quantitative results.

3.1.4. Analysis of Solidification Cells

After chemical etching, the micrographs of L-PBF samples clearly revealed small solidification cells, with inter-cell distances ranging between 0.6 µm (cold) and 1.1 µm (warm) and cells mostly oriented parallel to the BD (Figure 11). Similar cell dimensions were observed on as-built Inconel 625 by Li et al. [29], Zhang et al. [13], and Marchese et al. [18,44]. The micrographs also revealed tiny precipitates (~30–50 nm) within solidification cells of as-built L-PBF samples, which were not investigated in the current study. Although these precipitates have not been investigated more precisely, according to Amato et al. [16] or Murr et al. [45], this could be the γ″ phase, which is coherent with the matrix, and therefore not observable on XRD diffractograms (Figure 7).
Considering the inter-cell distance, Kou [46] and Li et al. [29] gave a simple relation (5) to estimate the cooling rates Q (K/s) of each L-PBF sample, whereby d is the inter-cell distance (µm) and w and n are associated with the material constants (for nickel-based alloys, n = 1/3, w ≈ 50 μm.(K/s)n [29,47]).
d   = w   ×   Q n ,
In the case of L-PBF conditions 1, 2, and 3, the cooling rates are in the same range (1.2 × 10⁵ K/s, 2.3 × 10⁵ K/s, and 4.4 × 10⁵ K/s, respectively) and close to the low range given in the literature of 105 to 107 K/s [48,49,50]. However, a slight decrease in the cooling rate can still be noted with more energetic manufacturing conditions. Therefore, larger dislocations densities could be due to larger fusion zones provoking larger shrinkage during solidification. Indeed, the micrographic cross-sections (Figure 12) exhibited larger L-PBF beads as the VED increased.

3.1.5. Vickers Microhardness

Finally, the Vickers microhardness values of the three as-built samples were analyzed in the vertical cross-section (i.e., parallel to the building direction), showing that if the VED increases, the microhardness seems to increase too (Table 3). This result was probably due to the higher dislocation densities inside samples manufactured with a higher VED. These values were similar to those found in the literature for Inconel 625 samples manufactured using the L-PBF process (348 HV ± 53) [17,29,44,51,52].

3.2. Influence of Heat Treatments on Resulting Microstructures

Heat treatments under air conditions at 1100 °C followed by water quenching were carried out to estimate the recrystallization conditions for as-built materials. This temperature was chosen according to the Inconel 625 time-temperature-transformation diagram [53], which shows that beyond this temperature, no precipitate should be formed, and that those present in the as-built material should be dissolved. On each L-PBF building platform, 23 cubic samples were manufactured for each process condition (warm, mild, or cold); eight were kept for analysis of the as-built microstructures (see the previous section), while the remaining 15 samples were used for dedicated heat treatments at 1100 °C. In the first step the influence of a conventional 3 h, 1100 °C heat treatment on the resulting microstructure was presented, while in the second step the recrystallization stages were analyzed at different dwell times.

3.2.1. Microstructures after Heat Treatment

As shown previously, as-built L-PBF samples exhibit large numbers of GNDs (~2 × 10¹⁵ m−2) or SSDs (~1 × 10¹⁵ m−2), depending on the process conditions. The corresponding stored energy is expected to allow L-PBF specimens to recrystallize during subsequent heat treatment at high temperature, such as for severely work-hardened metals.
To confirm this assumption, a 3 h, 1100 °C HT was first applied to the three as-built L-PBF samples. EBSD analyses carried out on the three L-PBF samples confirmed that the columnar microstructure disappeared completely and turned into a fully equiaxed grain structure with randomly oriented grains (Figure 13). An average grain diameter of 41 ± 5 µm was then obtained, regardless of the initial L-PBF process conditions. Simultaneously, the GND density decreased by one order of magnitude, with average values of 1.6 × 10¹⁴ m−2 ± 0.4, together with a decrease of the Rockwell hardness from 25 ± 1 HRC on as-built L-PBF to 12 ± 1 HRC after heat treatment, regardless of the process conditions. This can be logically explained by the restauration of the dislocation structure during heat treatment.
It was found that after recrystallization, the hardness measurements using the Rockwell C method no longer seemed suitable because of the low measured values. In our case, the measurements were used for direct comparisons between different conditions using the same material, which makes them less critical, however another method (Brinell or Vickers hardness) would have been more appropriate. This is why the Vickers microhardness values were characterized for the as-built and heat-treated samples (180 min). The results obtained also reflected a drop in hardness from 317 HV0.2 on as-built L-PBF samples to 227 HV0.2 after heat treatment.

3.2.2. Analysis of Recrystallization Kinetics

The first parts of the hardness curves (Figure 14) exhibited steep decreases of the hardness, corresponding to primary recrystallization, with new equiaxed grains nucleating and growing from starting columnar grains. This was clearly shown in the EBSD maps for short durations (Figure 15).
In the second step, the decreases in hardness became smoother then reached nearly stable values. This phase corresponded to secondary recrystallization, whereby equiaxed grains coalesce and form larger ones. The change of slope in the HRC = f(t) curve occurred at the time threshold trec, for which the as-built material reached full recrystallization. The heat-treated L-PBF samples also exhibited annealing twins (Figure 15), in contrast to the as-built ones, which exhibited columnar structures.
The combined evolution of the grain size (equivalent diameter measurement, for which twins boundaries are not considered) (Figure 16a) and GND density (Figure 16b) with time allowed more precise estimation of the threshold times to full recrystallization corresponding to stable and lowered HRC and GND density values compared to as-built samples.
A clear dependence is shown between the hardness (Figure 14) and grain size (Figure 16a): above trec, equiaxed grains clearly grow from 36 µm at trec for mild and warm samples to 45 µm at 180 min and from 26 µm at trec to 39 µm for the cold L-PBF sample. This confirms the secondary recrystallization stage and associated grain growth.
An interesting result is that L-PBF samples manufactured with the higher VED (i.e., the lower scan speed) recrystallize sooner (trec-1 = 9 min) than mild (trec-2 = 12 min) and cold (trec-3 = 24 min) samples, in accordance with their higher initial dislocation density. Such relations between stored energy and recrystallization kinetics have been observed on several materials, e.g., in the study by Gerber et al. [54]. Additionally, similar time thresholds were obtained with hardness (Figure 14) and GND data (Figure 16b) confirming that hardness determinations provide a satisfactory insight into the dislocation microstructure. During heat treatment of equivalent duration, as long as the dislocation density is sufficiently high to provide enough driving force for recrystallization, new equiaxed grains nucleate. However, when the dislocation density reaches a lower limit, no more nucleation occurs and new grains start growing. At the end of the recrystallization process, the GND values were reduced by a factor of 10.

3.3. Tensile Tests on As-Built and Heat-Treated L-PBF Samples

Monotonic tensile tests were carried out on as-built L-PBF samples vertically or horizontally oriented with respect to the building direction (Figure 2). For each condition (building orientation + cold, mild, or warm processing), two tensile tests were performed to check the repeatability of the results. The results are summarized in Table 4. As found by Kreitcberg et al. [11], the lowest yield stress σY and ultimate tensile strength UTS but higher elongation to failure A% were obtained for vertically oriented, as-built L-PBF samples. Moreover, lower mechanical strength was obtained with the L-PBF-3 (warm) conditions; the more the VED increased, the more the mechanical properties decreased. This might be caused by three effects:
  • The influence of grain boundaries on mechanical resistance (Hall-Petch-like effect). This would explain why horizontally oriented samples (i.e., the samples with columnar grains perpendicular to the loading axis) exhibited higher σY and UTS values. In this configuration, there is a higher density of grain boundaries perpendicular to the axis of the load to oppose the movement of the dislocations;
  • The effect of the crystallographic texture, as (100)-oriented grains exhibited lower yield stress than other ones [55];
  • A possible influence of nano-precipitates, explaining why the warmer L-PBF samples, having the higher ρGND, exhibited the lower resistance to tensile loading. In comparison with Kreitcberg et al. [11,56], the elongation lengths to failure of as-built L-PBF samples were two times lower in the present work, maybe due to larger amounts of porosities (0.03% to 0.26%).
After recrystallization annealing at 1100 °C, a quasi-isotropic mechanical behavior was observed, with very low scattering between the mechanical properties of L-PBF-1, 2, and 3 specimens. Higher elongation lengths to failure (around 24 +/− 2%) and lower yield strengths (365 +/− 24 MPa) were also obtained, which can be explained by the reduction of the dislocation density.
The results obtained here for as-built test specimens manufactured horizontally (L-PBF-1, 2, and 3 H) were slightly lower than those obtained by Nguejio et al. [52]. This difference can be explained by the fact that these authors worked with less energetic manufacturing parameters than us (P/V ratio = 0.247 J/mm [52] vs. 0.307 J/mm here), and we have previously shown that when the energy density supplied for manufacturing decreases, the tensile properties are improved.

3.4. Comparison of As-Built and Work-Hardened Recrystallized L-PBF Samples

Questions remain concerning not only the physical origin of the large density of induced dislocations in as-built L-PBF microstructures, but also the amount of thermally induced hardening (strengthening achieved via rapid solidification) that allows as-built L-PBF samples to recrystallize.
An original experiment was designed and carried out to compare the equivalent work hardening and resulting stored energy induced by tensile plastic deformation to the microstructures of as-built L-PBF samples. The objectives were also to estimate the plastic deformation that a recrystallized specimen should undergo in order to reach a stored energy level similar to as-built L-PBF specimens. For this purpose, a trapezoidal sample (Figure 3) allowing graded plastic deformations to be generated was manufactured by L-PBF and heat-treated for 3 h at 1100 °C in order to generate a homogeneous recrystallized microstructure with low dislocation density. From this massive trapezoidal sample, four thick sections (2 mm) were cut and polished up to the OP-S step. Three of them were deformed under tension (elongation rate: 0.4 mm/min) up to a maximum stress value of 637 MPa. This value was determined by an initial tensile test on a trapezoidal sample, which was conducted until breaking. As this specimen broke around 708 MPa, the maximum stress to avoid the rupture of the following specimens was established at ~ 90% of the previous one. This corresponded to applying a force of 6500 N in the thinnest section (10.2 mm2). Finally, after the tensile deformation, the specimens were heat-treated at 1100 °C for 9, 12, or 24 min (respectively warm, mild, and cold trec) to estimate plastic deformation thresholds provoking recrystallization. The following procedure was used:
  • During tensile tests, digital image correlation (DIC) was used to measure the 2D full-field strains (i.e., elastic and plastic strains) on the specimens’ flat surfaces. The software used was VIC 2D® (version 6, Correlated Solutions, University of South Carolina, Columbia, CA, USA) with a B/W Vieworks® 29 MPixel camera (Vieworks, Anyang, Korea). For instance, in Figure 17, a 10.69% plastic deformation was measured in the highly deformed part of the trapezoidal sample;
  • After tensile tests, EBSD maps coupled with an analysis of GND density and hardness filiations were carried out to estimate dependencies between local deformation, hardness, and GND density values (Figure 18). It can clearly be seen that the GND density changed with the deformation; the more this increased, the more the GND density increased too. This observation has already been made by different authors [39,41,42,43] for different materials (IF steel or OFHC copper) deformed under tension or for aluminum deformed under compression. As shown in Figure 18b, in this study a linear dependency is shown between the ρGND and local deformation;
  • Assuming the same linear εp/ρGND dependence at higher strain values and knowing the GND densities of as-built L-PBF samples, an estimation of the equivalent plastic deformation for each L-PBF condition could be attempted, giving values of 20.1% for L-PBF-1 (warm), 16.8% for L-PBF-2 (mild), and 13.9% for L-PBF-3 (cold).
Finally, three trapezoidal samples deformed under the same conditions were heat-treated at 1100 °C over 9, 12, and 24 min (these durations corresponded to the critical recrystallization times trec identified for the warm, mild, and cold process conditions, respectively, as shown in Figure 14. EBSD analyses revealed that GND densities dropped down by a factor 2 in the thinner cross-section, where the highest GND level (and strain) was found for the three different heat treatment durations, as shown in Figure 19a. In each case, similar GND densities were reached (average GND density of 6.3 × 10¹⁴ m−2 ± 0.45), which were approximately 2 times higher than the L-PBF samples after the trec heat treatment (~3.4 × 10¹⁴ m−2). Moreover, the grain size was shown to decrease at this same location (Figure 19b) to reach the same size in each case ( ~ 32 µm ± 0.4). This average grain size was in the range of the trec grain size reached for L-PBF samples (Figure 16a). These phenomena show that the microstructure recrystallized due to the high dislocation density introduced with the tensile test and show that a sufficient dislocation density is necessary to initiate the recrystallization.

4. Conclusions

  • Inconel 625 samples were produced with three different laser--powder bed fusion process conditions (respectively named “warm”, “mild”, and “cold”). As-built microstructures analyzed with EBSD in both cases exhibited columnar grains along the building direction but indicated higher densities of geometrically necessary dislocations (GND), ranging from 1.62 × 10¹⁵ m−2 to 2.34 × 10¹⁵ m−2 as the VED increased;
  • The same dependence of the dislocation density with the VED was also found by the analysis of XRD Bragg peak broadening, which was consistent with microhardness data;
  • All of the manufacturing conditions resulted in fine cellular microstructures, ranging from 0.6 to 1.1 µm;
  • After being subjected to a 3 h, 1100 °C heat treatment, L-PBF samples were shown to fully recrystallize. Moreover, the recrystallization occurred earlier for high-energy (warm) L-PBF conditions (9 min), generating higher amounts of dislocations compared to the low-energy (cold) L-PBF conditions (24 min). These microstructural particularities induced a specific mechanical behavior for each condition;
  • The raw L-PBF test samples with the columnar grain axis parallel to the load direction presented the lowest yield stress σY and UTS values (444 MPa and 718 MPa, respectively) but the highest elongation to failure A% (21%) compared to the test samples with columnar grains perpendicular to the load direction (633 MPa and 933 MPa and 12%, respectively). In addition, it was observed that L-PBF process parameters inducing higher dislocation densities produce samples with lower mechanical resistance;
  • Fortunately, the recrystallization heat treatment made it possible to cancel these effects of manufacturing orientation and manufacturing parameters on the mechanical properties;
  • By imposing a controlled tensile deformation on trapezoidal L-PBF samples combined with digital image correlation and EBSD analysis, equivalent plastic deformation values ranging between 13% (cold) and 20% (warm) could be estimated, providing new insight into the recrystallization driving force of as-built L-PBF samples and its dependence on process conditions;
  • In view of this work, it would be interesting to compare the recrystallization behavior of L-PBF samples with wrought and work-hardened samples. In addition, Transmission Electron Microscopy (TEM) analyses should be carried out on the as-built samples to give better insight into the dislocation distributions or precipitation kinetics of the as-built microstructures. Finally, an in-depth characterization of any precipitates and their roles and impacts on recrystallization in the analysis of GNDs would be an interesting prospect for future studies.

Author Contributions

Conceptualization, T.D.T., O.C., Z.H.-H., and P.P.; methodology, T.D.T.; software, T.D.T.; validation, O.C., Z.H.-H., and P.P.; formal analysis, T.D.T.; investigation, T.D.T., H.H., and V.M.; writing—original draft preparation, P.P.; writing—review and editing, T.D.T.; supervision, P.P. All authors have read and agreed to the published version of the manuscript.

Funding

This research received no external funding.

Institutional Review Board Statement

Not applicable.

Informed Consent Statement

Not applicable.

Acknowledgments

This work was carried out within the frame of the Fabrication Additive pour Intensification de Réacteurs (FAIR) project led by Air Liquide and granted by Banque Publique d’Investissement (BPI) France. All the partners of the FAIR project are acknowledged for their fruitful discussions.

Conflicts of Interest

The authors declare no conflict of interest.

References

  1. Bai, Y.; Wang, D.; Yang, Y.; Wang, H. Effect of heat treatment on the microstructure and mechanical properties of maraging steel by selective laser melting. Mater. Sci. Eng. A 2019, 760, 105–117. [Google Scholar] [CrossRef]
  2. Liverani, E.; Toschi, S.; Ceschini, L.; Fortunato, A. Effect of selective laser melting (SLM) process parameters on microstructure and mechanical properties of 316L austenitic stainless steel. J. Mater. Process. Technol. 2017, 249, 255–263. [Google Scholar] [CrossRef]
  3. Pleass, C.; Jothi, S. Influence of powder characteristics and additive manufacturing process parameters on the microstructure and mechanical behaviour of Inconel 625 fabricated by Selective Laser Melting. Addit. Manuf. 2018, 24, 419–431. [Google Scholar] [CrossRef]
  4. Moussaoui, K.; Rubio, W.; Mousseigne, M.; Sultan, T.; Rezai, F. Effects of Selective Laser Melting additive manufacturing parameters of Inconel 718 on porosity, microstructure and mechanical properties. Mater. Sci. Eng. A 2018, 735, 182–190. [Google Scholar] [CrossRef] [Green Version]
  5. Zhang, J.; Song, B.; Wei, Q.; Bourell, D.; Shi, Y. A review of selective laser melting of aluminum alloys: Processing, microstructure, property and developing trends. J. Mater. Sci. Technol. 2019, 35, 270–284. [Google Scholar] [CrossRef]
  6. Wang, Z.; Xiao, Z.; Tse, Y.; Huang, C.; Zhang, W. Optimization of processing parameters and establishment of a relationship between microstructure and mechanical properties of SLM titanium alloy. Opt. Laser Technol. 2019, 112, 159–167. [Google Scholar] [CrossRef]
  7. Guo, M.; Gu, D.; Xi, L.; Zhang, H.; Zhang, J.; Yang, J.; Wang, R. Selective laser melting additive manufacturing of pure tungsten: Role of volumetric energy density on densification, microstructure and mechanical properties. Int. J. Refract. Met. Hard Mater. 2019, 84. [Google Scholar] [CrossRef]
  8. Yan, X.; Chang, C.; Dong, D.; Gao, S.; Ma, W.; Liu, M.; Liao, H.; Yin, S. Microstructure and mechanical properties of pure copper manufactured by selective laser melting. Mater. Sci. Eng. A 2020, 789, 139615. [Google Scholar] [CrossRef]
  9. Robinson, J.; Stanford, M.; Arjunan, A. Correlation between selective laser melting parameters, pore defects and tensile properties of 99.9% silver. Mater. Today Commun. 2020, 25, 101550. [Google Scholar] [CrossRef]
  10. Wang, X.; Muñiz-Lerma, J.A.; Shandiz, M.A.; Sanchez-Mata, O.; Brochu, M. Crystallographic-orientation-dependent tensile behaviours of stainless steel 316L fabricated by laser powder bed fusion. Mater. Sci. Eng. A 2019, 766, 138395. [Google Scholar] [CrossRef]
  11. Kreitcberg, A.; Brailovski, V.; Turenne, S. Effect of heat treatment and hot isostatic pressing on the microstructure and mechanical properties of Inconel 625 alloy processed by laser powder bed fusion. Mater. Sci. Eng. A 2017, 689, 1–10. [Google Scholar] [CrossRef]
  12. Wierzbanowski, K.; Tarasiuk, J.; Bacroix, B.; Miroux, A.; Castelnau, O. Deformation characteristics important for nucleation process. Case of low-carbon steel. Arch. Metall. 1999, 44, 183–201. [Google Scholar]
  13. Zhang, F.; Levine, L.E.; Allen, A.J.; Campbell, C.E.; Lass, E.A.; Cheruvathur, S.; Stoudt, M.R.; Williams, M.E.; Idell, Y. Homogenization kinetics of a nickel-based superalloy produced by powder bed fusion laser sintering. Scr. Mater. 2017, 131, 98–102. [Google Scholar] [CrossRef] [Green Version]
  14. Yan, F.; Xiong, W.; Faierson, E.J. Grain Structure Control of Additively Manufactured Metallic Materials. Materials 2017, 10, 1260. [Google Scholar] [CrossRef] [Green Version]
  15. Li, C.-L.; Won, J.W.; Choi, S.-W.; Choe, J.-H.; Lee, S.; Park, C.H.; Yeom, J.-T.; Hong, J.K. Simultaneous achievement of equiaxed grain structure and weak texture in pure titanium via selective laser melting and subsequent heat treatment. J. Alloy Compd. 2019, 803, 407–412. [Google Scholar] [CrossRef]
  16. Amato, K.; Hernandez, J.; Murr, L.E.; Martinez, E.; Gaytan, S.M.; Shindo, P.W.; Collins, S. Comparison of Microstructures and Properties for a Ni-Base Superalloy (Alloy 625) Fabricated by Electron Beam Melting. J. Mater. Sci. Res. 2012, 1, 3. [Google Scholar] [CrossRef]
  17. Li, C.; White, R.; Fang, X.; Weaver, M.; Guo, Y. Microstructure evolution characteristics of Inconel 625 alloy from selective laser melting to heat treatment. Mater. Sci. Eng. A 2017, 705, 20–31. [Google Scholar] [CrossRef]
  18. Marchese, G.; Colera, X.G.; Calignano, F.; Lorusso, M.; Biamino, S.; Minetola, P.; Manfredi, D. Characterization and Comparison of Inconel 625 Processed by Selective Laser Melting and Laser Metal Deposition. Adv. Eng. Mater. 2017, 19. [Google Scholar] [CrossRef]
  19. Lass, E.A.; Stoudt, M.R.; Williams, M.E.; Katz, M.B.; Levine, L.E.; Phan, T.Q.; Gnaeupel-Herold, T.H.; Ng, D.S. Formation of the Ni3Nb δ-Phase in Stress-Relieved Inconel 625 Produced via Laser Powder-Bed Fusion Additive Manufacturing. Met. Mater. Trans. A 2017, 48, 5547–5558. [Google Scholar] [CrossRef] [Green Version]
  20. De Terris, T.; Andreau, O.; Peyre, P.; Adamski, F.; Koutiri, I.; Gorny, C.; Dupuy, C. Optimization and comparison of porosity rate measurement methods of Selective Laser Melted metallic parts. Addit. Manuf. 2019, 28, 802–813. [Google Scholar] [CrossRef]
  21. Calandri, M.; Yin, S.; Aldwell, B.; Calignano, F.; Lupoi, R.; Ugues, D. Texture and Microstructural Features at Different Length Scales in Inconel 718 Produced by Selective Laser Melting. Materials 2019, 12, 1293. [Google Scholar] [CrossRef] [PubMed] [Green Version]
  22. Nye, J.F. Some geometrical relations in dislocated crystals. Acta Metall. 1953, 1, 153–162. [Google Scholar] [CrossRef]
  23. Cottrell, A.H. The Mechanical Properties of Matter; Wiley: New York, NY, USA, 1964. [Google Scholar]
  24. Ashby, M.F. The deformation of plastically non-homogeneous materials. Philos. Mag. 1970, 21, 399–424. [Google Scholar] [CrossRef]
  25. Birosca, S.; Liu, G.; Ding, R.; Jiang, J.; Simm, T.; Deen, C.; Whittaker, M. The dislocation behaviour and GND development in a nickel based superalloy during creep. Int. J. Plast. 2019, 118, 252–268. [Google Scholar] [CrossRef] [Green Version]
  26. Zhang, J.; Wang, B.; Wang, H. Geometrically necessary dislocations distribution in face-centred cubic alloy with varied grain size. Mater. Charact. 2020, 162, 110205. [Google Scholar] [CrossRef]
  27. Williamson, G.; Hall, W. X-ray line broadening from filed aluminium and wolfram. Acta Met. 1953, 1, 22–31. [Google Scholar] [CrossRef]
  28. Williamson, G.K.; Smallman, R.E., III. Dislocation densities in some annealed and cold-worked metals from measurements on the X-ray debye-scherrer spectrum. Philos. Mag. 1956, 1, 34–46. [Google Scholar] [CrossRef]
  29. Li, S.; Wei, Q.; Shi, Y.; Zhu, Z.; Zhang, D. Microstructure Characteristics of Inconel 625 Superalloy Manufactured by Selective Laser Melting. J. Mater. Sci. Technol. 2015, 31, 946–952. [Google Scholar] [CrossRef]
  30. Wauthier-Monnin, A.; Chauveau, T.; Castelnau, O.; Réglé, H.; Bacroix, B. The evolution with strain of the stored energy in different texture components of cold-rolled IF steel revealed by high resolution X-ray diffraction. Mater. Charact. 2015, 104, 31–41. [Google Scholar] [CrossRef]
  31. Murugesan, S.; Kuppusami, P.; Mohandas, E.; Vijayalakshmi, M. X-ray diffraction Rietveld analysis of cold worked austenitic stainless steel. Mater. Lett. 2012, 67, 173–176. [Google Scholar] [CrossRef]
  32. Hielscher, R. MTEX Toolbox. 2015. Available online: https://mtex-toolbox.github.io/ (accessed on 23 June 2019).
  33. Moussa, C.; Bernacki, M.; Besnard, R.; Bozzolo, N. About quantitative EBSD analysis of deformation and recovery substructures in pure Tantalum. IOP Conf. Ser. Mater. Sci. Eng. 2015, 89, 7. [Google Scholar] [CrossRef]
  34. Moussa, C.; Bernacki, M.; Besnard, R.; Bozzolo, N. Statistical analysis of dislocations and dislocation boundaries from EBSD data. Ultramicroscopy 2017, 179, 63–72. [Google Scholar] [CrossRef] [Green Version]
  35. Sow, M.; De Terris, T.; Castelnau, O.; Hamouche, Z.; Coste, F.; Fabbro, R.; Peyre, P. Influence of beam diameter on Laser Powder Bed Fusion (L-PBF) process. Addit. Manuf. 2020, 36, 101532. [Google Scholar] [CrossRef]
  36. Gao, Y.; Ding, Y.; Chen, J.; Xu, J.; Ma, Y.; Wang, X. Effect of twin boundaries on the microstructure and mechanical properties of Inconel 625 alloy. Mater. Sci. Eng. A 2019, 767, 138361. [Google Scholar] [CrossRef]
  37. Salman, O.; Gammer, C.; Chaubey, A.; Eckert, J.; Scudino, S. Effect of heat treatment on microstructure and mechanical properties of 316L steel synthesized by selective laser melting. Mater. Sci. Eng. A 2019, 748, 205–212. [Google Scholar] [CrossRef]
  38. Calcagnotto, M.; Ponge, D.; Demir, E.; Raabe, D. Orientation gradients and geometrically necessary dislocations in ultrafine grained dual-phase steels studied by 2D and 3D EBSD. Mater. Sci. Eng. A 2010, 527, 2738–2746. [Google Scholar] [CrossRef]
  39. Field, D.P.; Merriman, C.C.; Allainbonasso, N.; Wagner, F. Quantification of dislocation structure heterogeneity in deformed polycrystals by EBSD. Model. Simul. Mater. Sci. Eng. 2012, 20. [Google Scholar] [CrossRef]
  40. Plancher, E.; Tajdary, P.; Auger, T.; Castelnau, O.; Favier, V.; Loisnard, D.; Marijon, J.-B.; Maurice, C.; Michel, V.; Robach, O.; et al. Validity of Crystal Plasticity Models Near Grain Boundaries: Contribution of Elastic Strain Measurements at Micron Scale. JOM 2019, 71, 3543–3551. [Google Scholar] [CrossRef] [Green Version]
  41. Jiang, J.; Ben Britton, T.; Wilkinson, A.J. The orientation and strain dependence of dislocation structure evolution in monotonically deformed polycrystalline copper. Int. J. Plast. 2015, 69, 102–117. [Google Scholar] [CrossRef] [Green Version]
  42. Kundu, A.; Field, D.P. Geometrically Necessary Dislocation Density Evolution in Interstitial Free Steel at Small Plastic Strains. Met. Mater. Trans. A 2018, 49, 3274–3282. [Google Scholar] [CrossRef]
  43. Nowakowski, P.; Wiezorek, J.; Bathula, V.; Mielo, S.; Khanal, S.; Bonifacio, C.; Fischione, P. SEM and TEM characterization of plastic deformation structures in Aluminum by EBSD, TKD, and PED-based orientation imaging techniques. Microsc. Microanal. 2018, 24, 2182–2183. [Google Scholar] [CrossRef] [Green Version]
  44. Marchese, G.; Lorusso, M.; Parizia, S.; Bassini, E.; Lee, J.-W.; Calignano, F.; Manfredi, D.; Terner, M.; Hong, H.-U.; Ugues, D.; et al. Influence of heat treatments on microstructure evolution and mechanical properties of Inconel 625 processed by laser powder bed fusion. Mater. Sci. Eng. A 2018, 729, 64–75. [Google Scholar] [CrossRef]
  45. Murr, L.E.; Gaytan, S.M.; Ramirez, D.A.; Martinez, E.; Hernandez, J.; Amato, K.N.; Shindo, P.W.; Medina, F.R.; Wicker, R.B. Metal Fabrication by Additive Manufacturing Using Laser and Electron Beam Melting Technologies. J. Mater. Sci. Technol. 2012, 28, 1–14. [Google Scholar] [CrossRef]
  46. Mathers, G. Welding metallurgy. In The Welding of Aluminium and Its Alloys; Woodhead Publishing: Cambridge, UK, 2002; pp. 10–34. [Google Scholar] [CrossRef]
  47. Stefanescu, D.M. Science and Engineering of Casting Solidification, 3rd ed.; Springer International Publishing: Cham, Switzerland, 2015. [Google Scholar]
  48. Rafi, H.K.; Karthik, N.V.; Gong, H.; Starr, T.L.; Stucker, B.E. Microstructures and Mechanical Properties of Ti6Al4V Parts Fabricated by Selective Laser Melting and Electron Beam Melting. J. Mater. Eng. Perform. 2013, 22, 3872–3883. [Google Scholar] [CrossRef]
  49. Bertoli, U.S.; Guss, G.; Wu, S.; Matthews, M.J.; Schoenung, J.M. In-situ characterization of laser-powder interaction and cooling rates through high-speed imaging of powder bed fusion additive manufacturing. Mater. Des. 2017, 135, 385–396. [Google Scholar] [CrossRef]
  50. Vilaro, T.; Colin, C.; Bartout, J.; Nazé, L.; Sennour, M. Microstructural and mechanical approaches of the selective laser melting process applied to a nickel-base superalloy. Mater. Sci. Eng. A 2012, 534, 446–451. [Google Scholar] [CrossRef]
  51. Srinivasan, R.; Chen-Nan, S.; Baicheng, Z.; Jack, S.W.; Pei, W.; Sharon, N.M.L.; Tao, L.; Jun, W. Mechanical Properties and Microstructures of As Printed and Heat Treated Samples of Selective Laser Melted IN625 Alloy Powder. MATEC Web Conf. 2015, 30, 2002. [Google Scholar] [CrossRef] [Green Version]
  52. Nguejio, J.; Szmytka, F.; Hallais, S.; Tanguy, A.; Nardone, S.; Martinez, M.G. Comparison of microstructure features and mechanical properties for additive manufactured and wrought nickel alloys 625. Mater. Sci. Eng. A 2019, 764, e138214. [Google Scholar] [CrossRef]
  53. Floreen, S.; Fuchs, G.; Yang, W. The Metallurgy of Alloy 625. Superalloys 1994, 718, 13–37. [Google Scholar]
  54. Gerber, P.; Tarasiuk, J.; Chauveau, T.; Bacroix, B. A quantitative analysis of the evolution of texture and stored energy during annealing of cold rolled copper. Acta Mater. 2003, 51, 6359–6371. [Google Scholar] [CrossRef]
  55. Gu, T.; Medy, J.-R.; Klosek, V.; Castelnau, O.; Forest, S.; Hervé-Luanco, E.; Lecouturier-Dupouy, F.; Proudhon, H.; Renault, P.-O.; Thilly, L.; et al. Multiscale modeling of the elasto-plastic behavior of architectured and nanostructured Cu-Nb composite wires and comparison with neutron diffraction experiments. Int. J. Plast. 2019, 122, 1–30. [Google Scholar] [CrossRef] [Green Version]
  56. Kreitcberg, A.; Brailovski, V.; Turenne, S. Elevated temperature mechanical behavior of IN625 alloy processed by laser powder-bed fusion. Mater. Sci. Eng. A 2017, 700, 540–553. [Google Scholar] [CrossRef]
Figure 1. Schematic process of the main manufacturing parameters of the laser-powder bed fusion (L-PBF) approach.
Metals 11 00619 g001
Figure 2. Building platforms for L-PBF-1, 2, and 3 with tensile specimens.
Metals 11 00619 g002
Figure 3. L-PBF trapezoidal sample used to analyzing recrystallization thresholds: (a) sample dimensions; (b) 11.2-mm-thick as-built specimens; (c) 2-mm-thick specimen obtained after cutting and mechanical polishing.
Metals 11 00619 g003
Figure 4. Scanning electron microscopy of the IN625 gas-atomized powder used in this study. The observations revealed mostly spherical particles.
Metals 11 00619 g004
Figure 5. Analysis of porosity (indicated in vol%) on cross-sections using optical microscopy for the L-PBF-3 (a) and L-PBF-1 (b) conditions at three different locations (left, center, and right) on the building platform.
Metals 11 00619 g005
Figure 6. Electron backscatter diffraction (EBSD) map (with the building direction (BD) parallel to the [1] direction) of as-built (a) warm, (b) mild, and (c) cold L-PBF conditions, showing strong concentrations in [1] directions along the BD. Similar columnar grain structures are shown with aspect ratios of 2.3, 2.2, and 1.9 (intercept method).
Metals 11 00619 g006
Figure 7. X-ray diffractograms of L-PBF samples.
Metals 11 00619 g007
Figure 8. Differences in peak broadening between the various specimens compared to the experimental uncertainty measured on a reference (LaB6 powder).
Metals 11 00619 g008
Figure 9. The orientation gradient d/dx, which allows estimation of the density of the geometrically necessary dislocations (GND), is measured by considering the linear increase of the kernel average misorientation (KAM) as a function of the distance between EBSD pixels, as reprinted from [33] (a). In the vast majority of our data, a very clear linear tendency was found, indicating a well-adapted procedure to our specimens (b).
Metals 11 00619 g009
Figure 10. GND maps of as-built (a) warm, (b) mild, and (c) cold L-PBF microstructures. The corresponding average dislocation densities were 2.34 × 10¹⁵ m−2 (a), 1.97 × 10¹⁵ m−2 (b), and 1.62 × 10¹⁵ m−2 (c).
Metals 11 00619 g010
Figure 11. Substructures obtained on (a) L-PBF-1 (warm), (b) L-PBF-2 (mild), and (c) L-PBF-3 (cold). All L-PBF samples were cellular.
Metals 11 00619 g011
Figure 12. Etched micrographic cross-sections showing L-PBF beads for (a) warm, (b) mild, and (c) cold conditions, and allowing the measurement of the melt pool dimensions (depth and width) of the last layer. Here, SD indicates the scan direction of the last layer.
Metals 11 00619 g012
Figure 13. EBSD maps of L-PBF samples after 1100 °C, 3 h solid solution heat treatment. Recrystallization occurred for each L-PBF condition: (a) L-PBF-1; (b) L-PBF-2; (c) L-PBF-3.
Metals 11 00619 g013
Figure 14. Hardness versus holding time during heat treatment at 1100 °C for L-PBF-1, 2, and 3 conditions. Threshold times trec corresponding to complete sample recrystallization are indicated with arrows. Shorter recrystallization times (~9 min) were obtained for the warmer L-PBF condition (L-PBF-1).
Metals 11 00619 g014
Figure 15. Influence of dwell time at 1100 °C on the microstructures for the three L-PBF conditions (above the mentioned time thresholds trec, recrystallization is completed).
Metals 11 00619 g015
Figure 16. (a) Grain size (equivalent diameter) and (b) GND density versus heat treatment duration at 1100 °C for the three L-PBF conditions. Shorter recrystallization times (9 min) were obtained for the warmer condition (L-PBF-1).
Metals 11 00619 g016
Figure 17. Total strain field along the tensile direction obtained by digital image correlation on a trapezoidal heat-treated L-PBF sample for a 6500 N force applied in the thinnest section (10.2 mm2). Here, 11% maximum plastic deformation was measured in the thinner zone at a position around 18 mm.
Metals 11 00619 g017
Figure 18. (a) GND density along the (O-y) axis of the trapezoidal sample for a 6500 N load in the thinnest section (a maximum of 1.3 × 10¹⁵ m−2 was obtained for 11% local deformation) and (b) near-linear dependence between the dislocation density and plastic deformation in the 0–11% range.
Metals 11 00619 g018
Figure 19. Influence of a 1100 °C heat treatment on the (a) GND density values and (b) grain sizes of trapezoidal samples. Specific recrystallization holding times were selected from each L-PBF condition: L-PBF-1 trec = 9 min; L-PBF-2 trec = 12 min; L-PBF-3 trec = 24 min.
Metals 11 00619 g019
Table 1. Laser-powder bed fusion (L-PBF) process parameters, including the volume energy density (VED; J/mm3).
ParametersL-PBF-1L-PBF-2L-PBF-3
Laser Power P (W)275275275
Scan speed V (mm/s)224449897
Hatch H (µm)757575
Spot Diameter D (µm)959595
Layer thickness t (µm)505050
VED (J/mm3)1768844
Table 2. Chemical composition of the Inconel 625 powder used.
ElementsNiCrMoNbFeAlTi
% (weight)Balance22.079.323.670.330.170.15
Table 3. Vickers microhardness values of the three L-PBF samples.
Manufacturing ConditionsL-PBF-1L-PBF-2L-PBF-3
HV0.2320 ± 10318 ± 12314 ± 11
Table 4. Mechanical properties of as-built and heat-treated L-PBF samples (H = horizontal direction perpendicular to the building direction (BD); V= vertical direction parallel to the BD). Two samples were tested for each condition.
ParametersσY (MPa)UTS (MPa)A%
L-PBF-1H601 ± 15908 ± 514 ± 1
V444 ± 15718 ± 918 ± 2
L-PBF-2H610 ± 6907 ± 1612 ± 2
V500 ± 24762 ± 2416 ± 2
L-PBF-3H633 ± 2933 ± 212 ± 2
V592 ± 4837 ± 421 ± 2
L-PBF-1 + HTH368 ± 2828 ± 325 ± 3
V341 ± 7746 ± 2624 ± 2
L-PBF-2 + HTH357 ± 4814 ± 422 ± 1
V346 ± 9769 ± 124 ± 1
L-PBF-3 + HTH379 ± 2835 ± 1423 ± 0
V407 ± 7849 ± 228 ± 0
Publisher’s Note: MDPI stays neutral with regard to jurisdictional claims in published maps and institutional affiliations.

