
Investigation on Laser Welding of Al Ribbon to Cu Sheet: Weldability, Microstructure, and Mechanical and Electrical Properties


 and
and 
Abstract
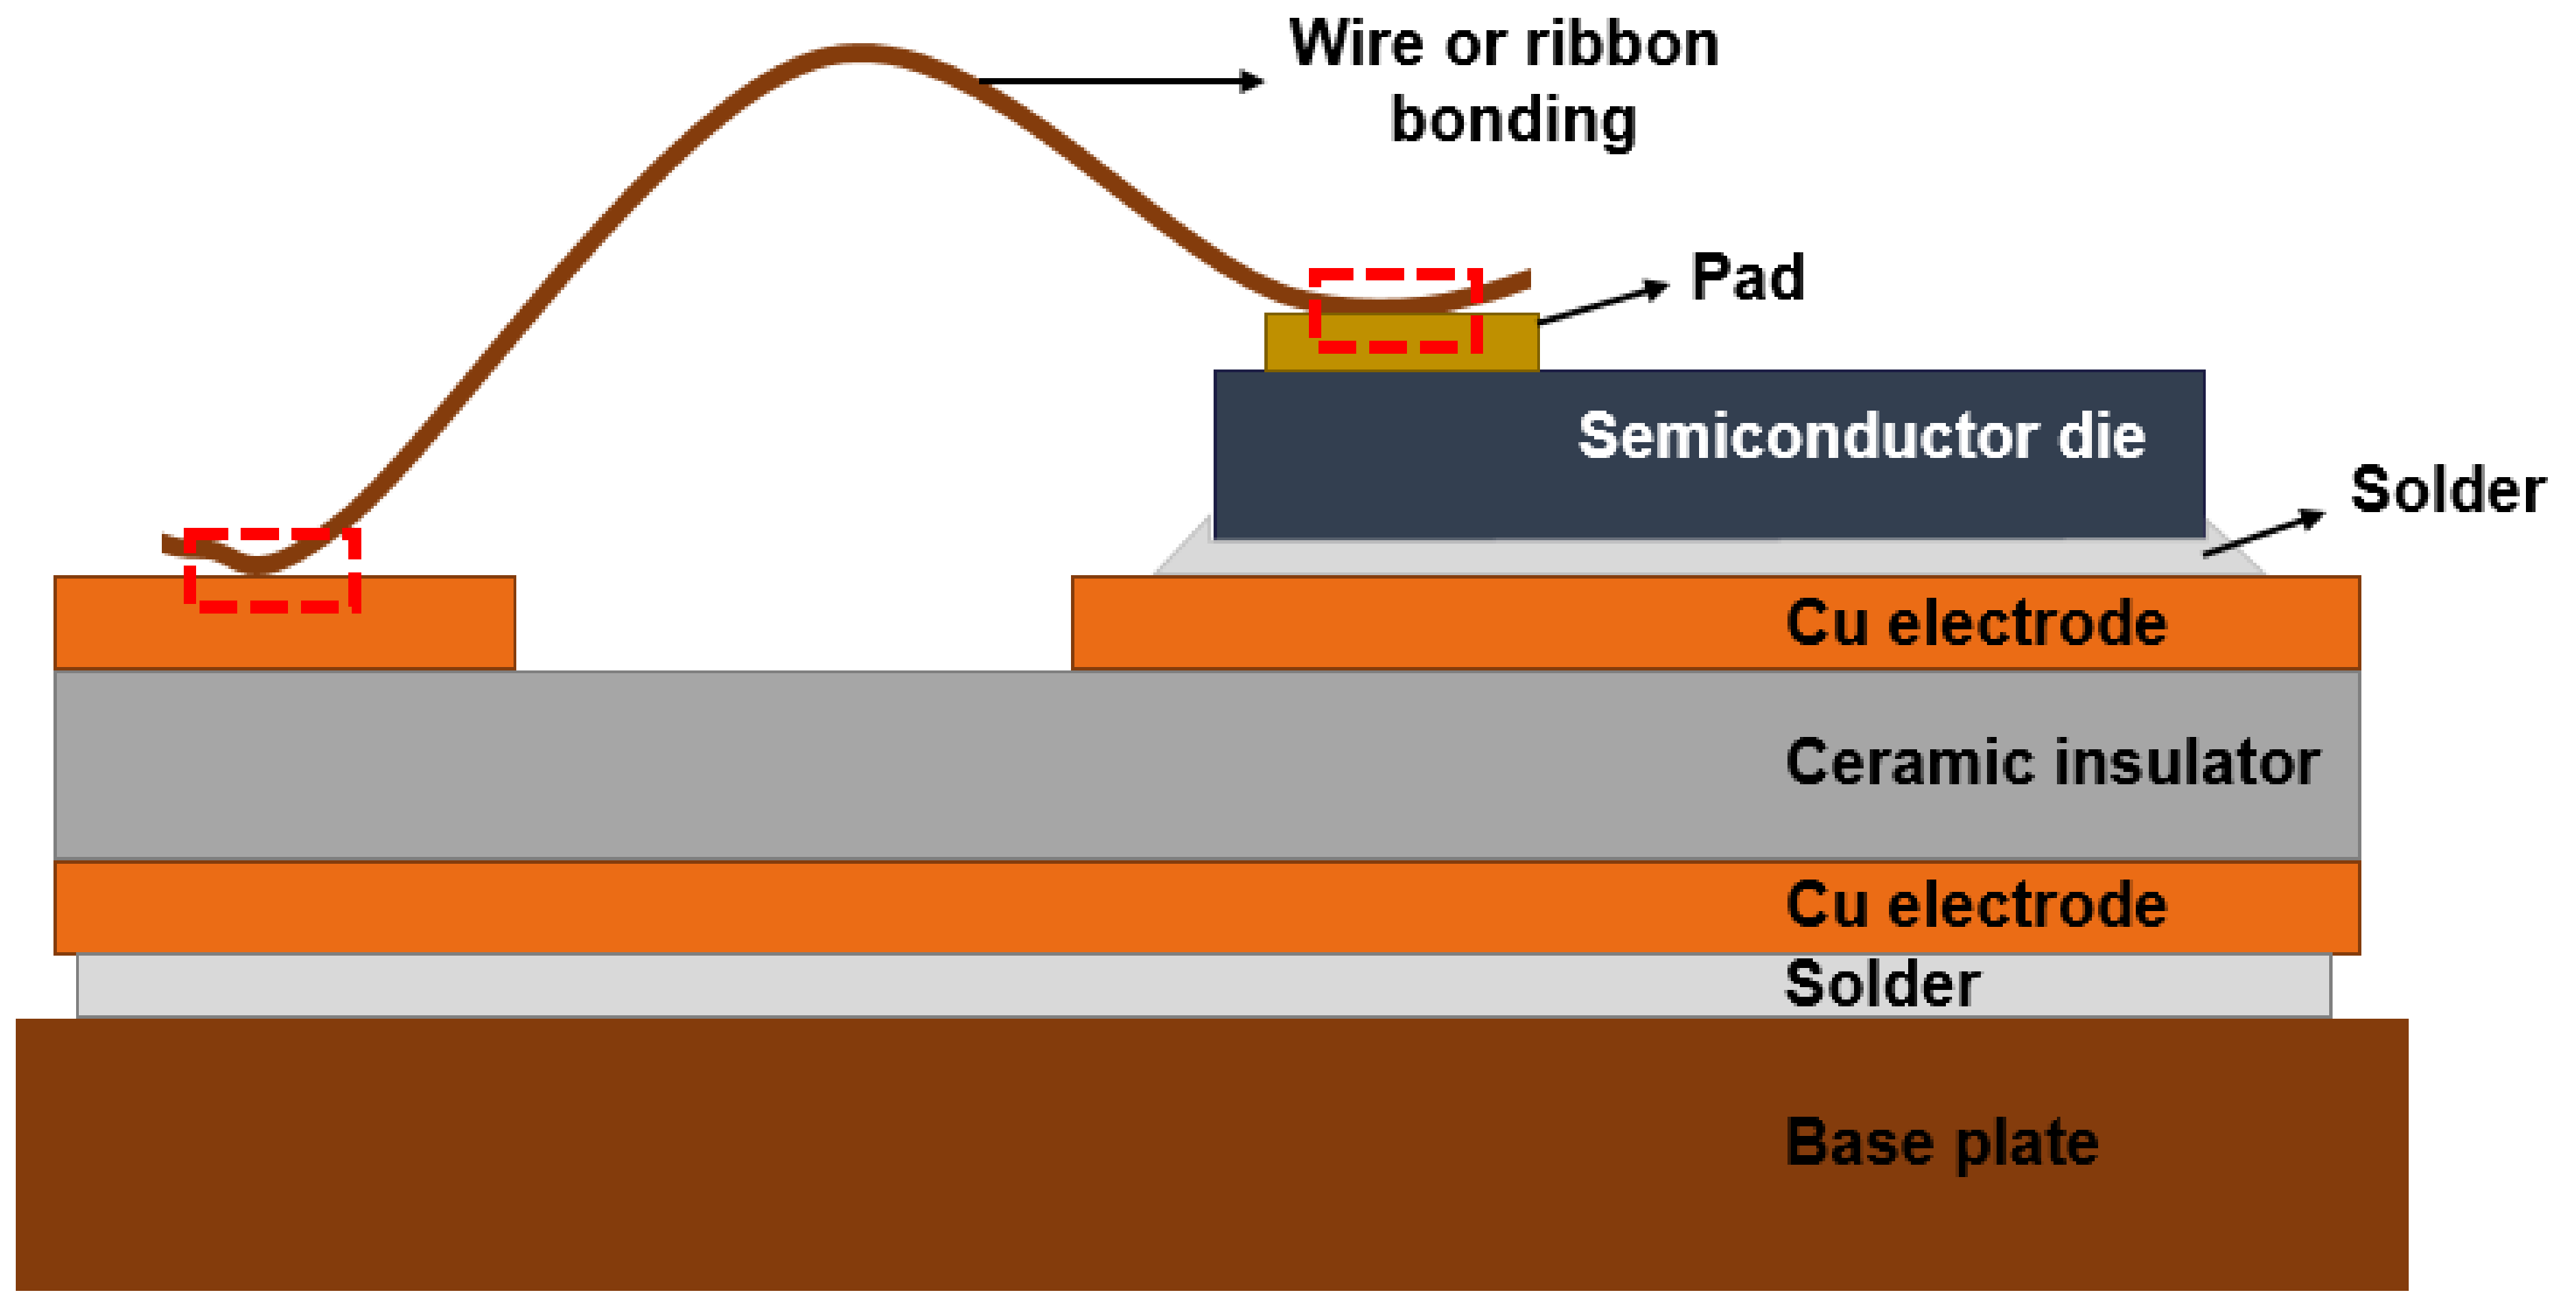
1. Introduction
2. Materials and Methods
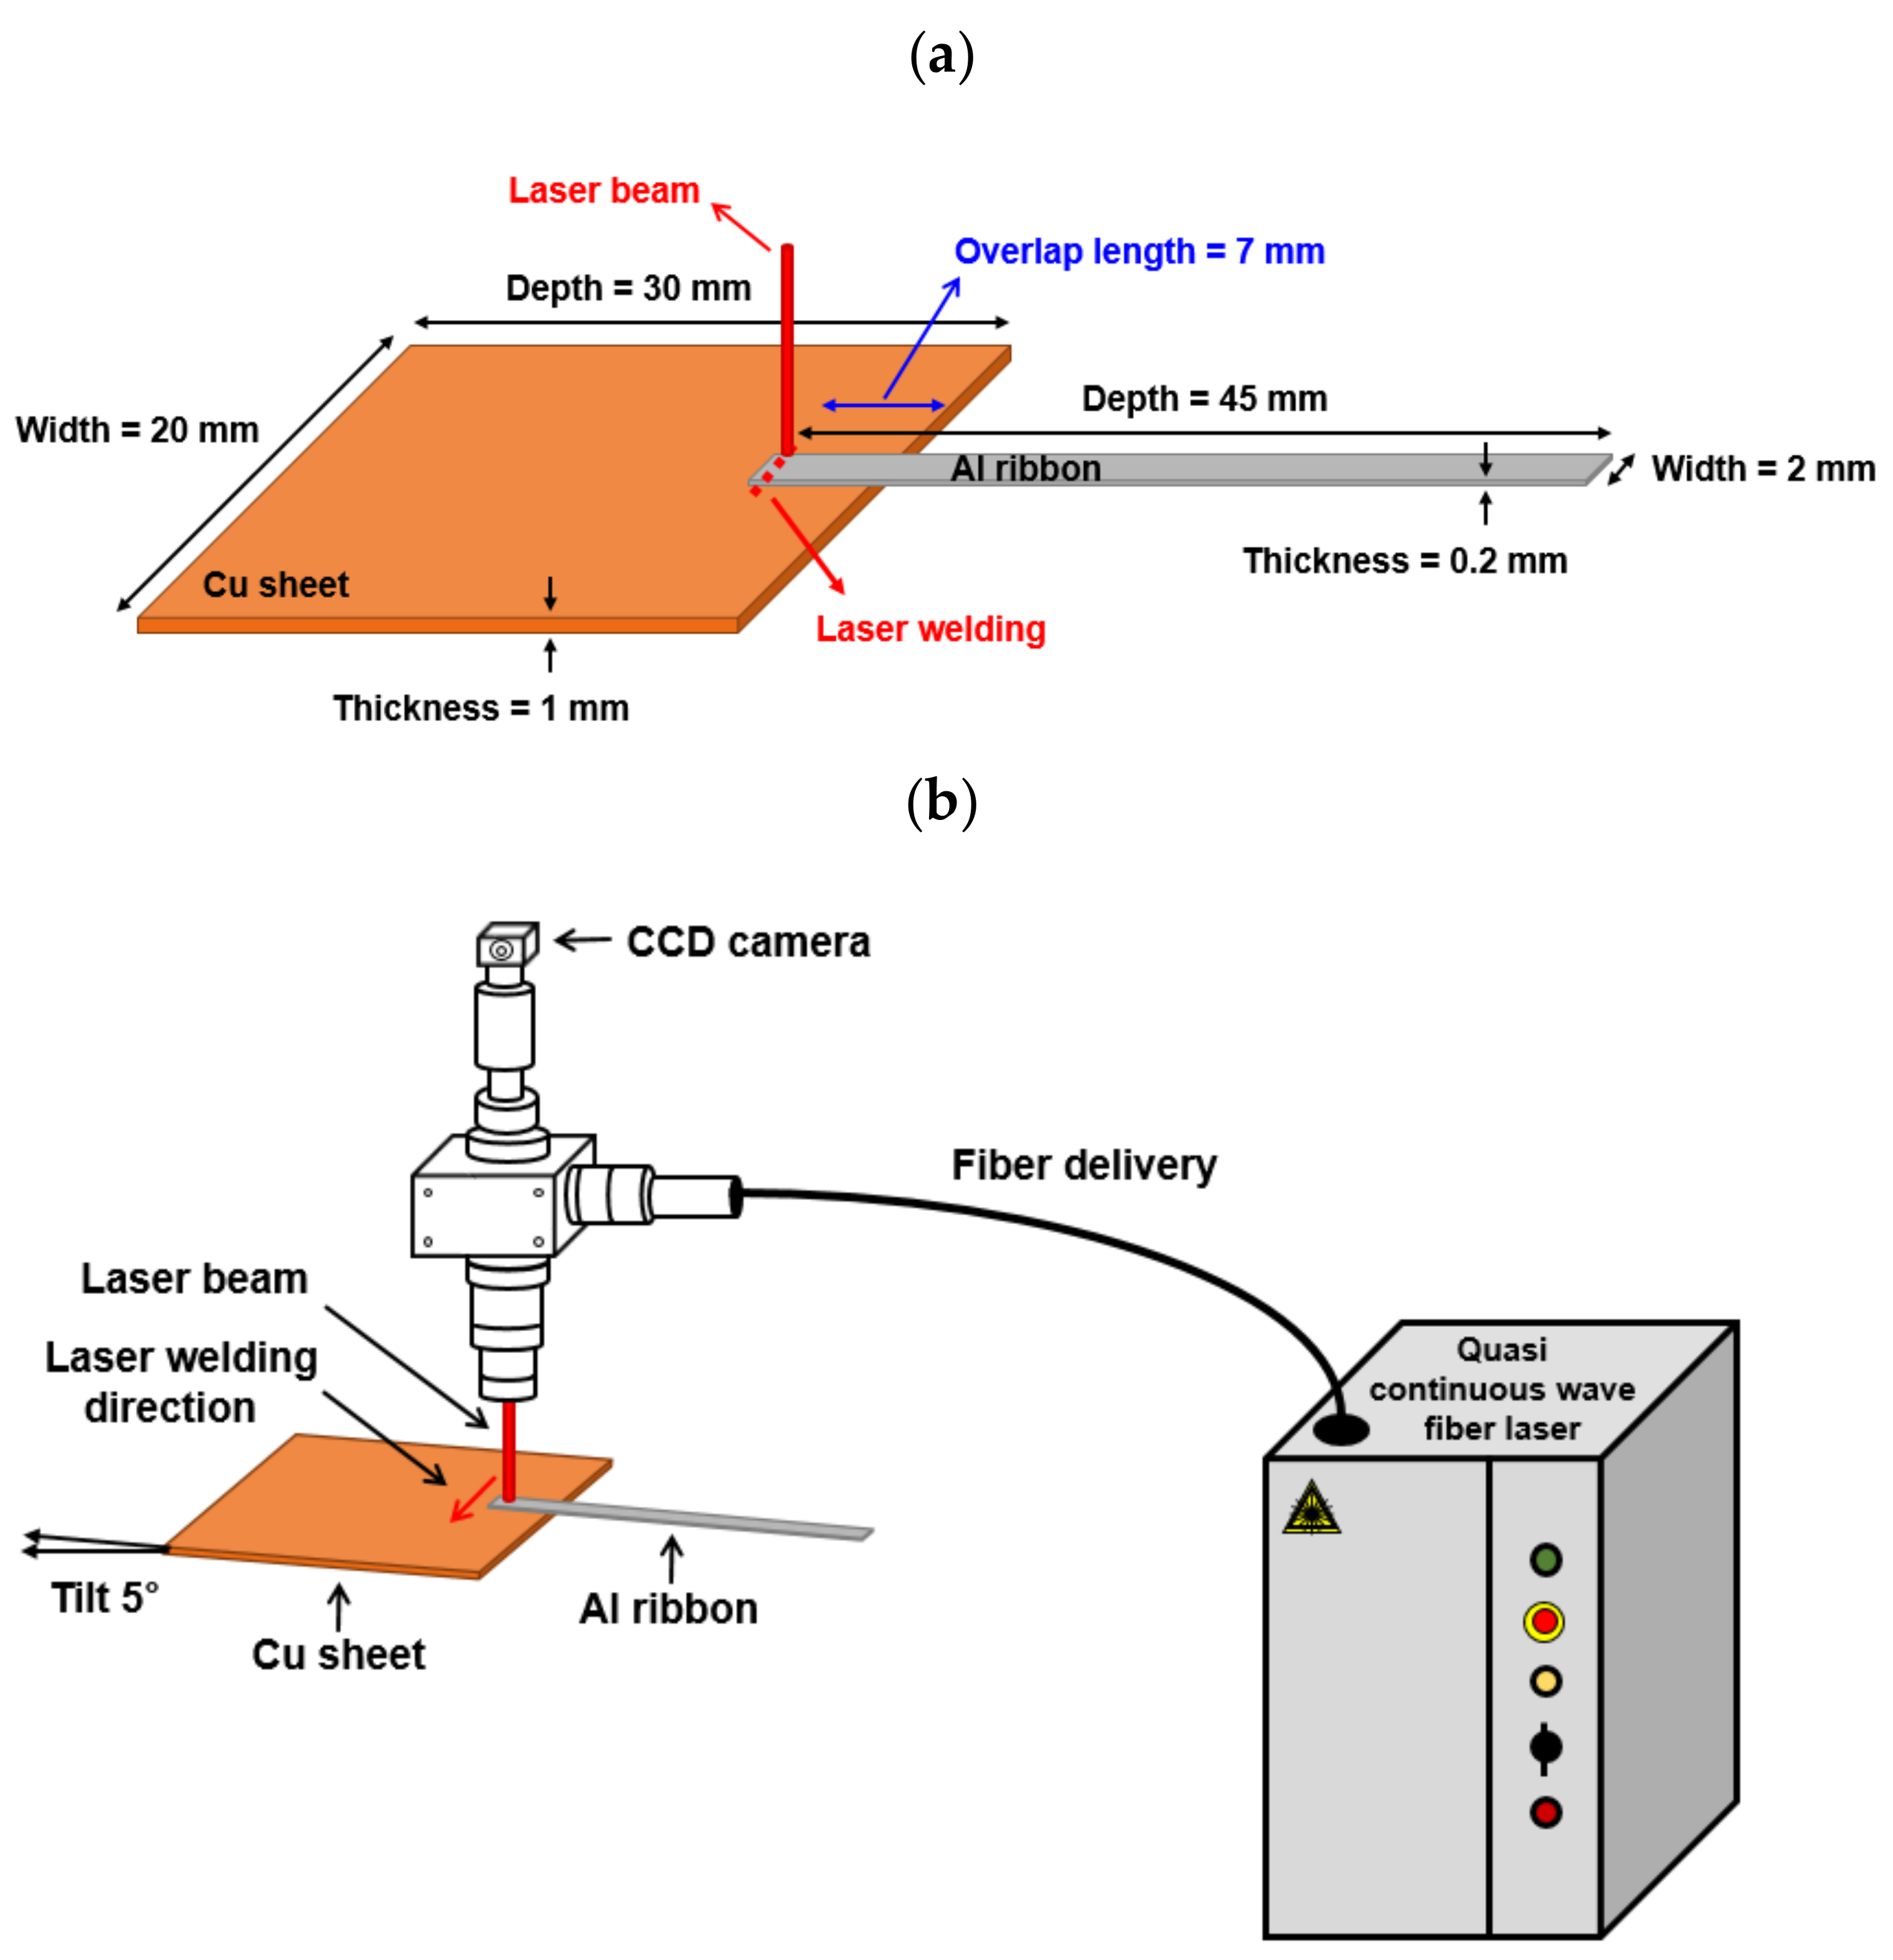
2.1. Materials and Experimental Setup for Laser Welding of Al/Cu
2.2. Metallographic Characterization
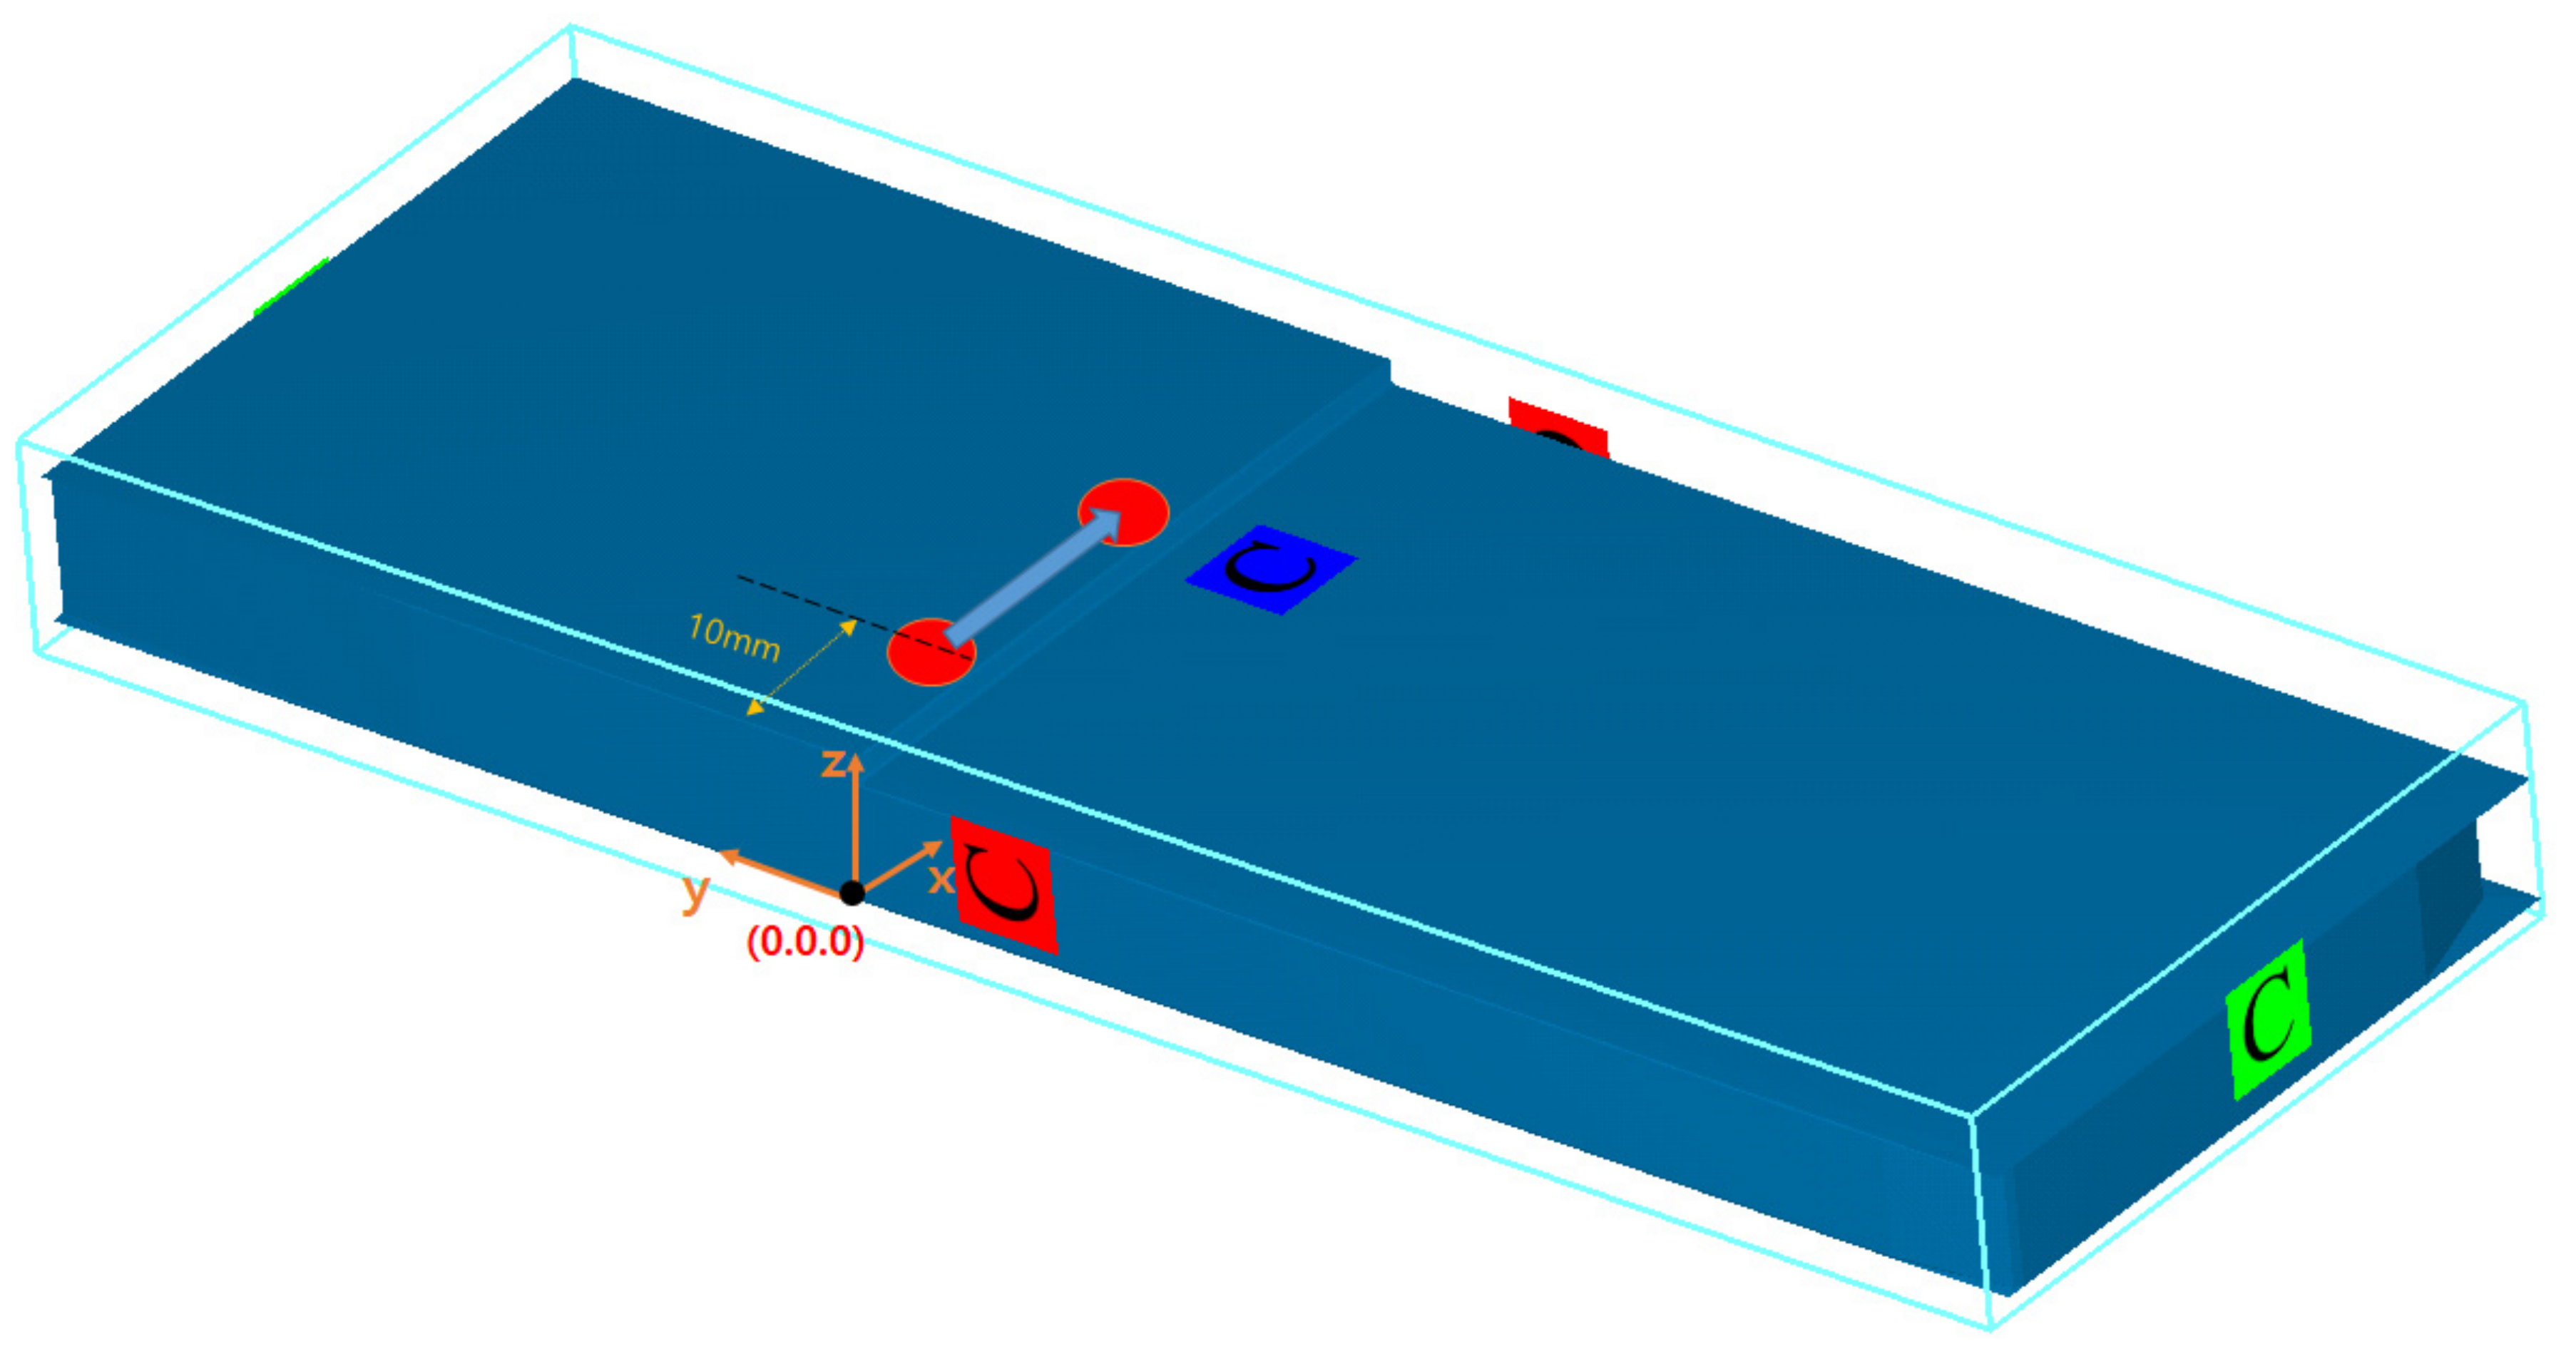
2.3. Numerical Simulation Modeling
2.3.1. Boundary Conditions
2.3.2. Laser Heat Source Model
2.3.3. Surface Tension Model
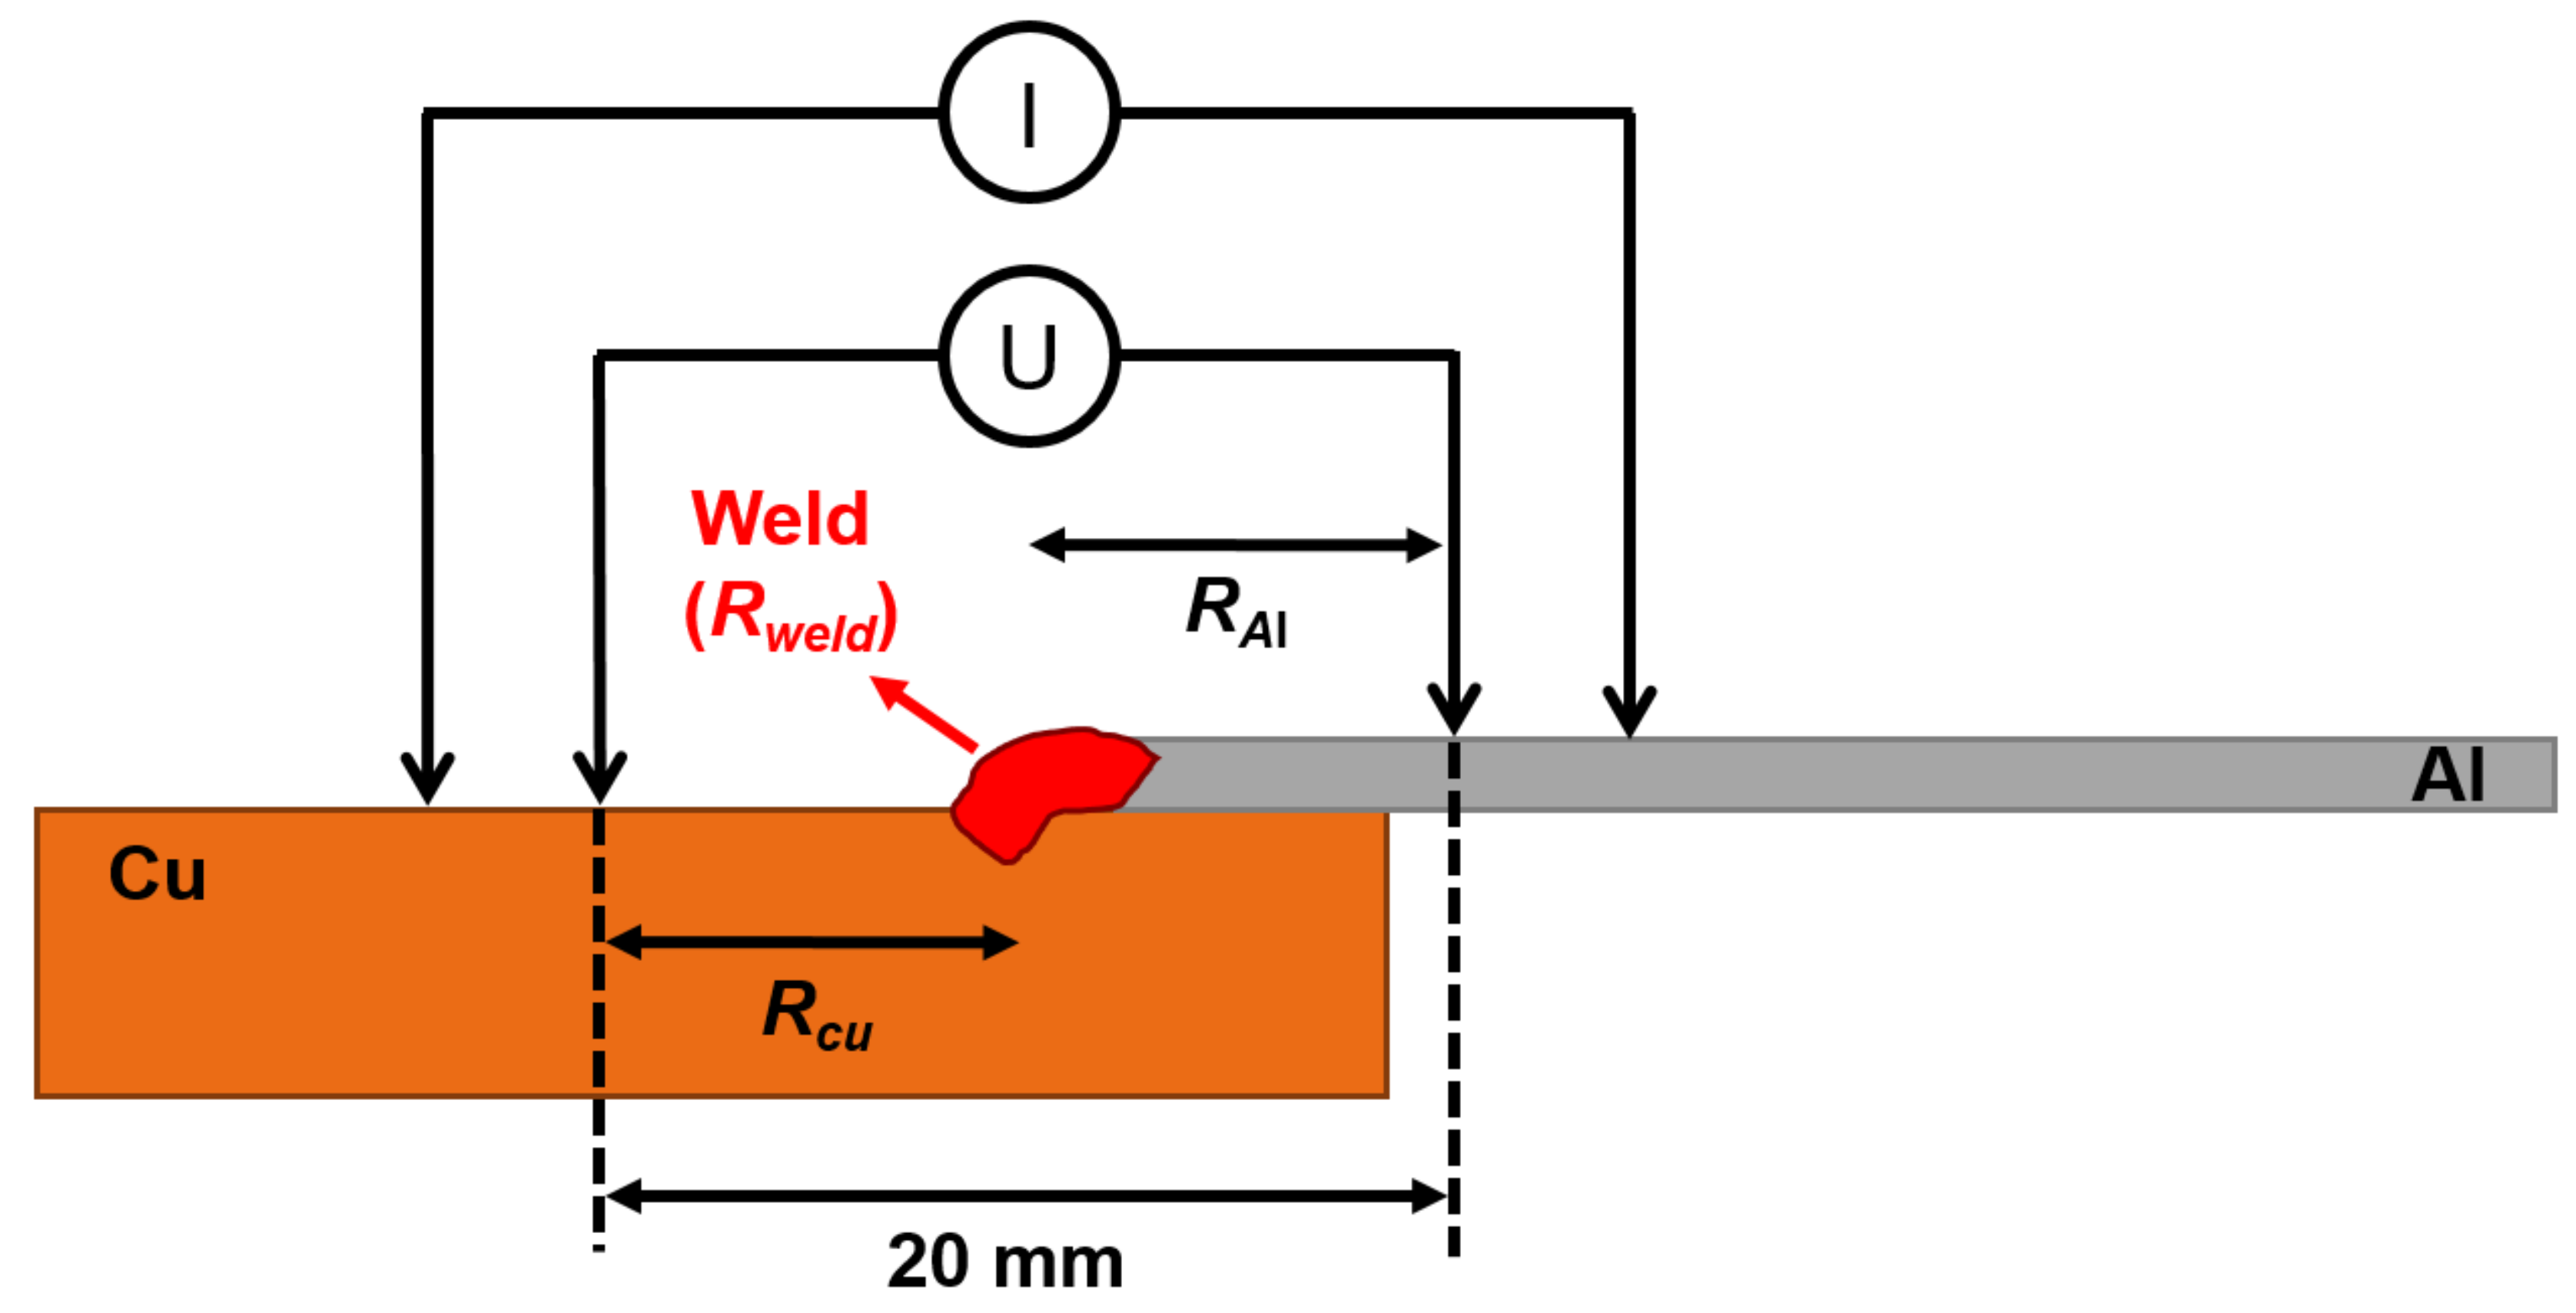
2.4. Mechanical and Electrical Properties
3. Results and Discussion
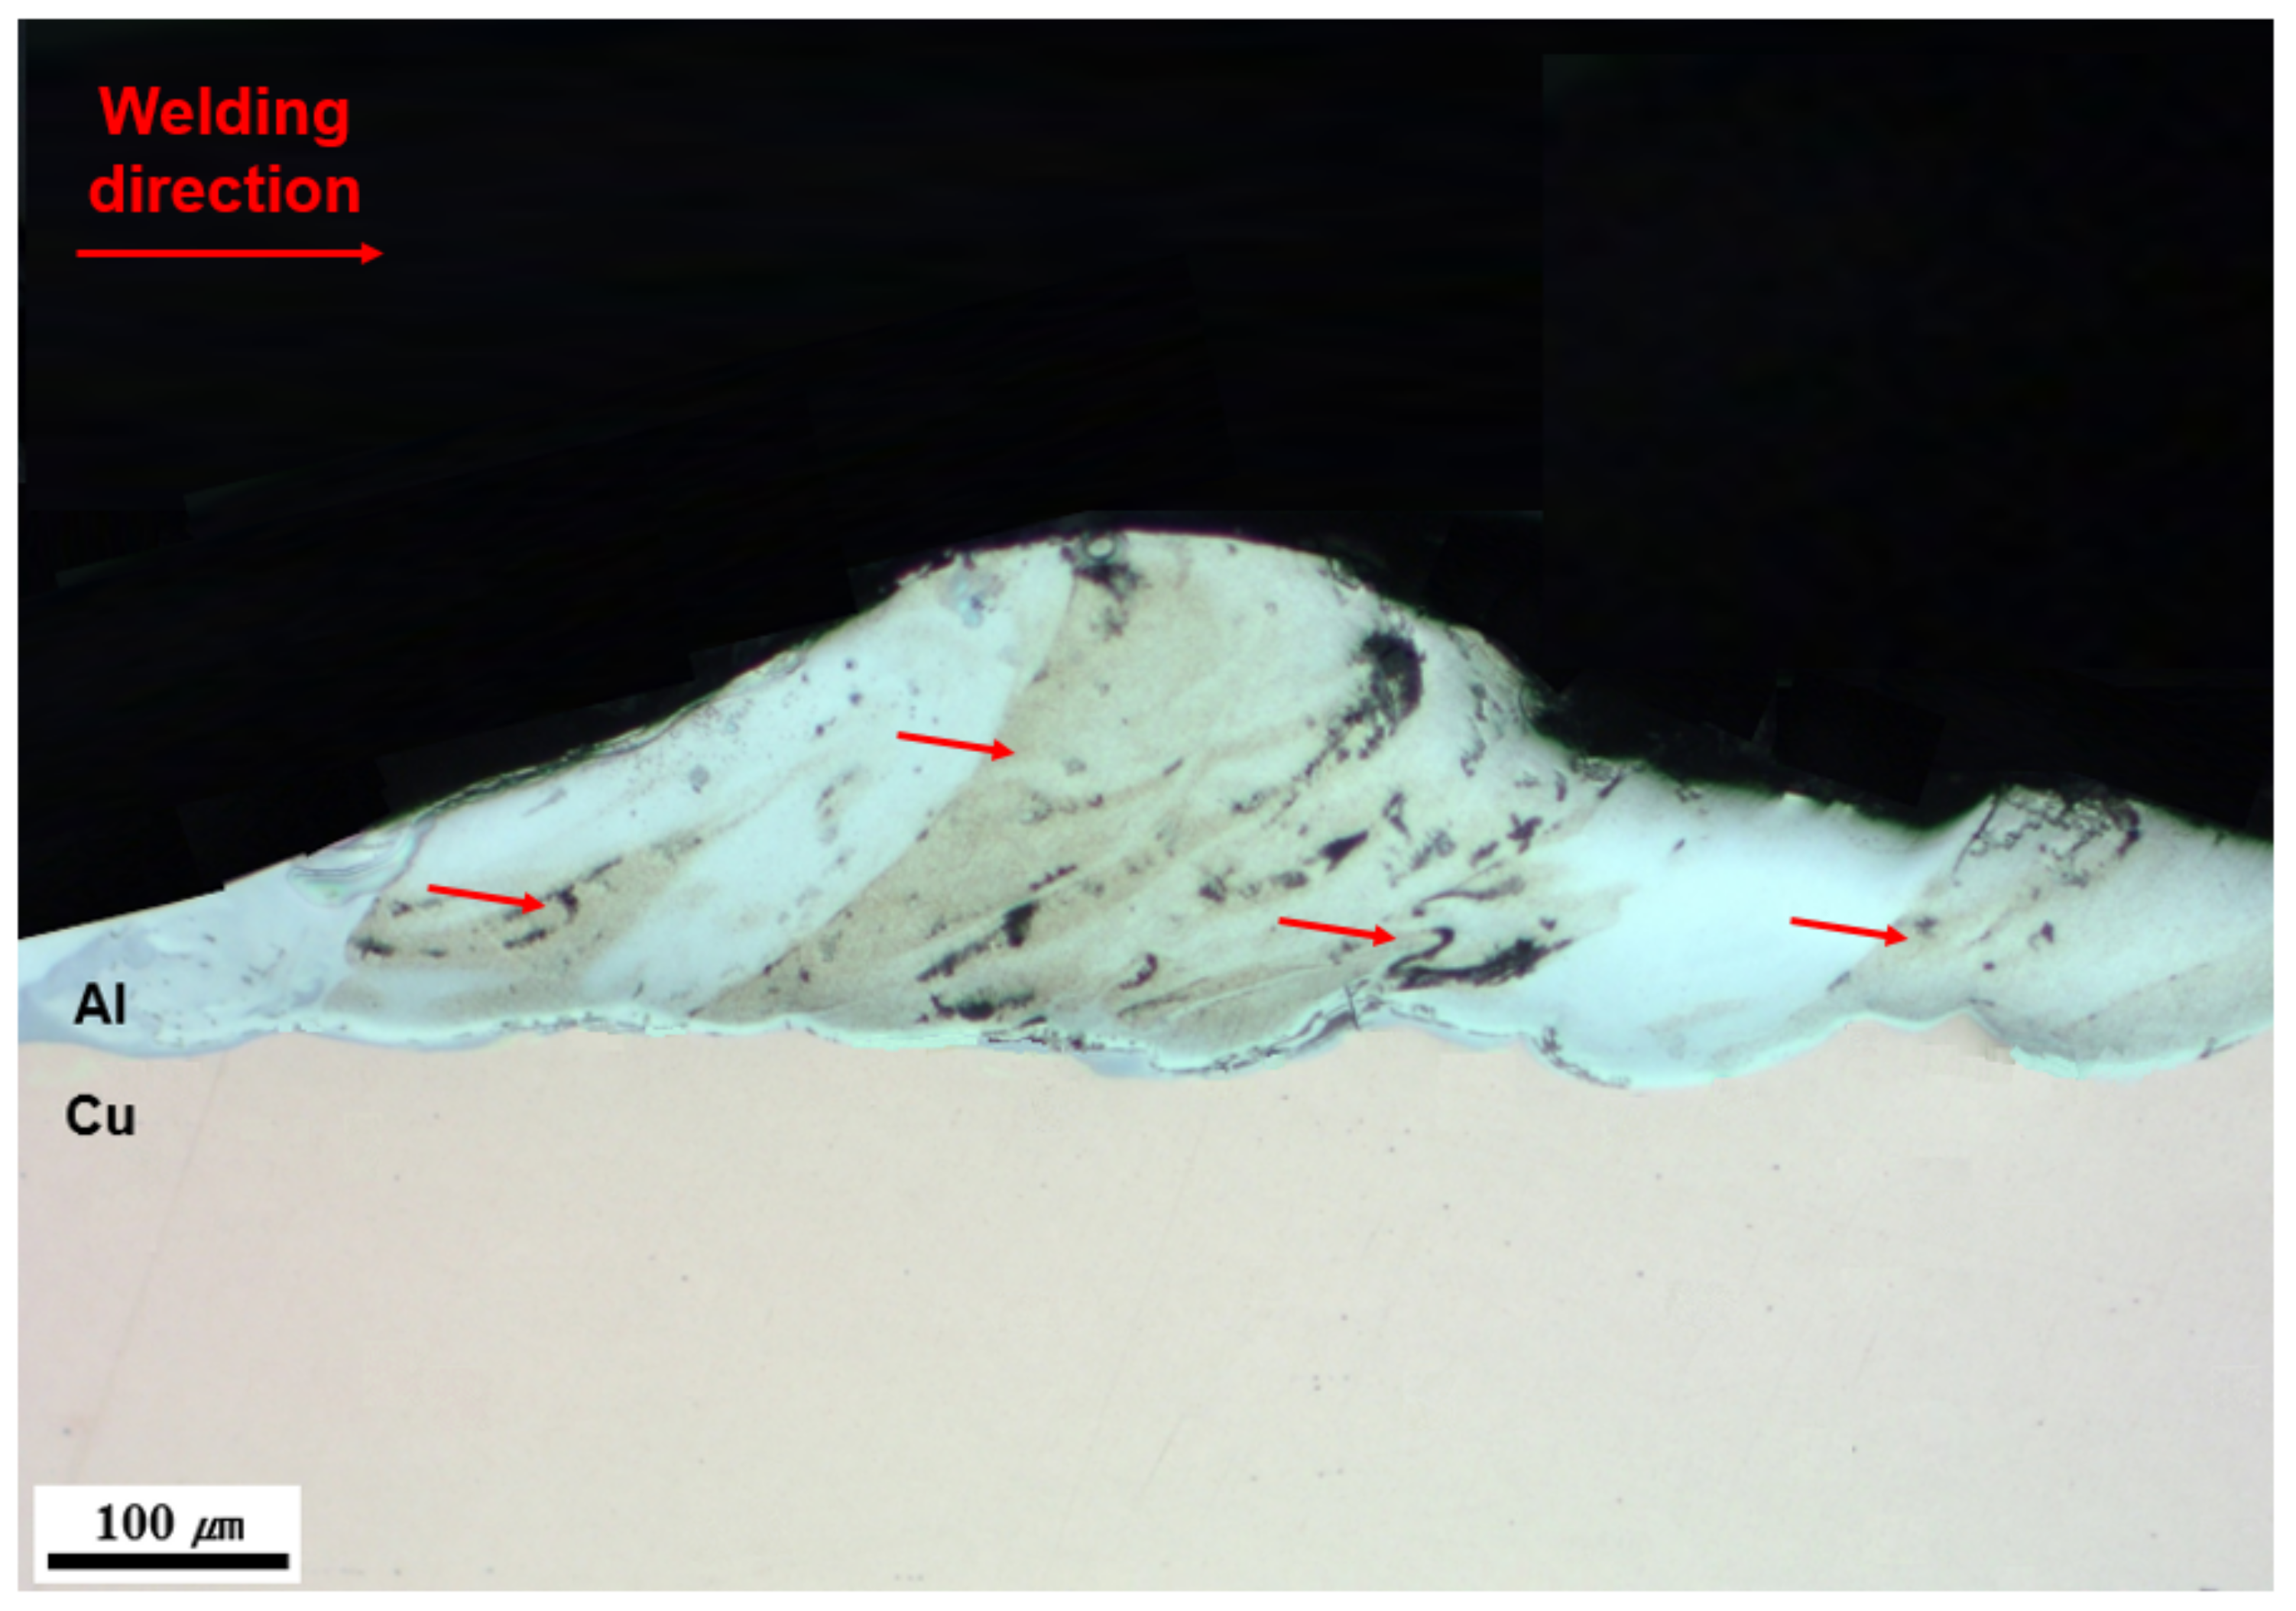
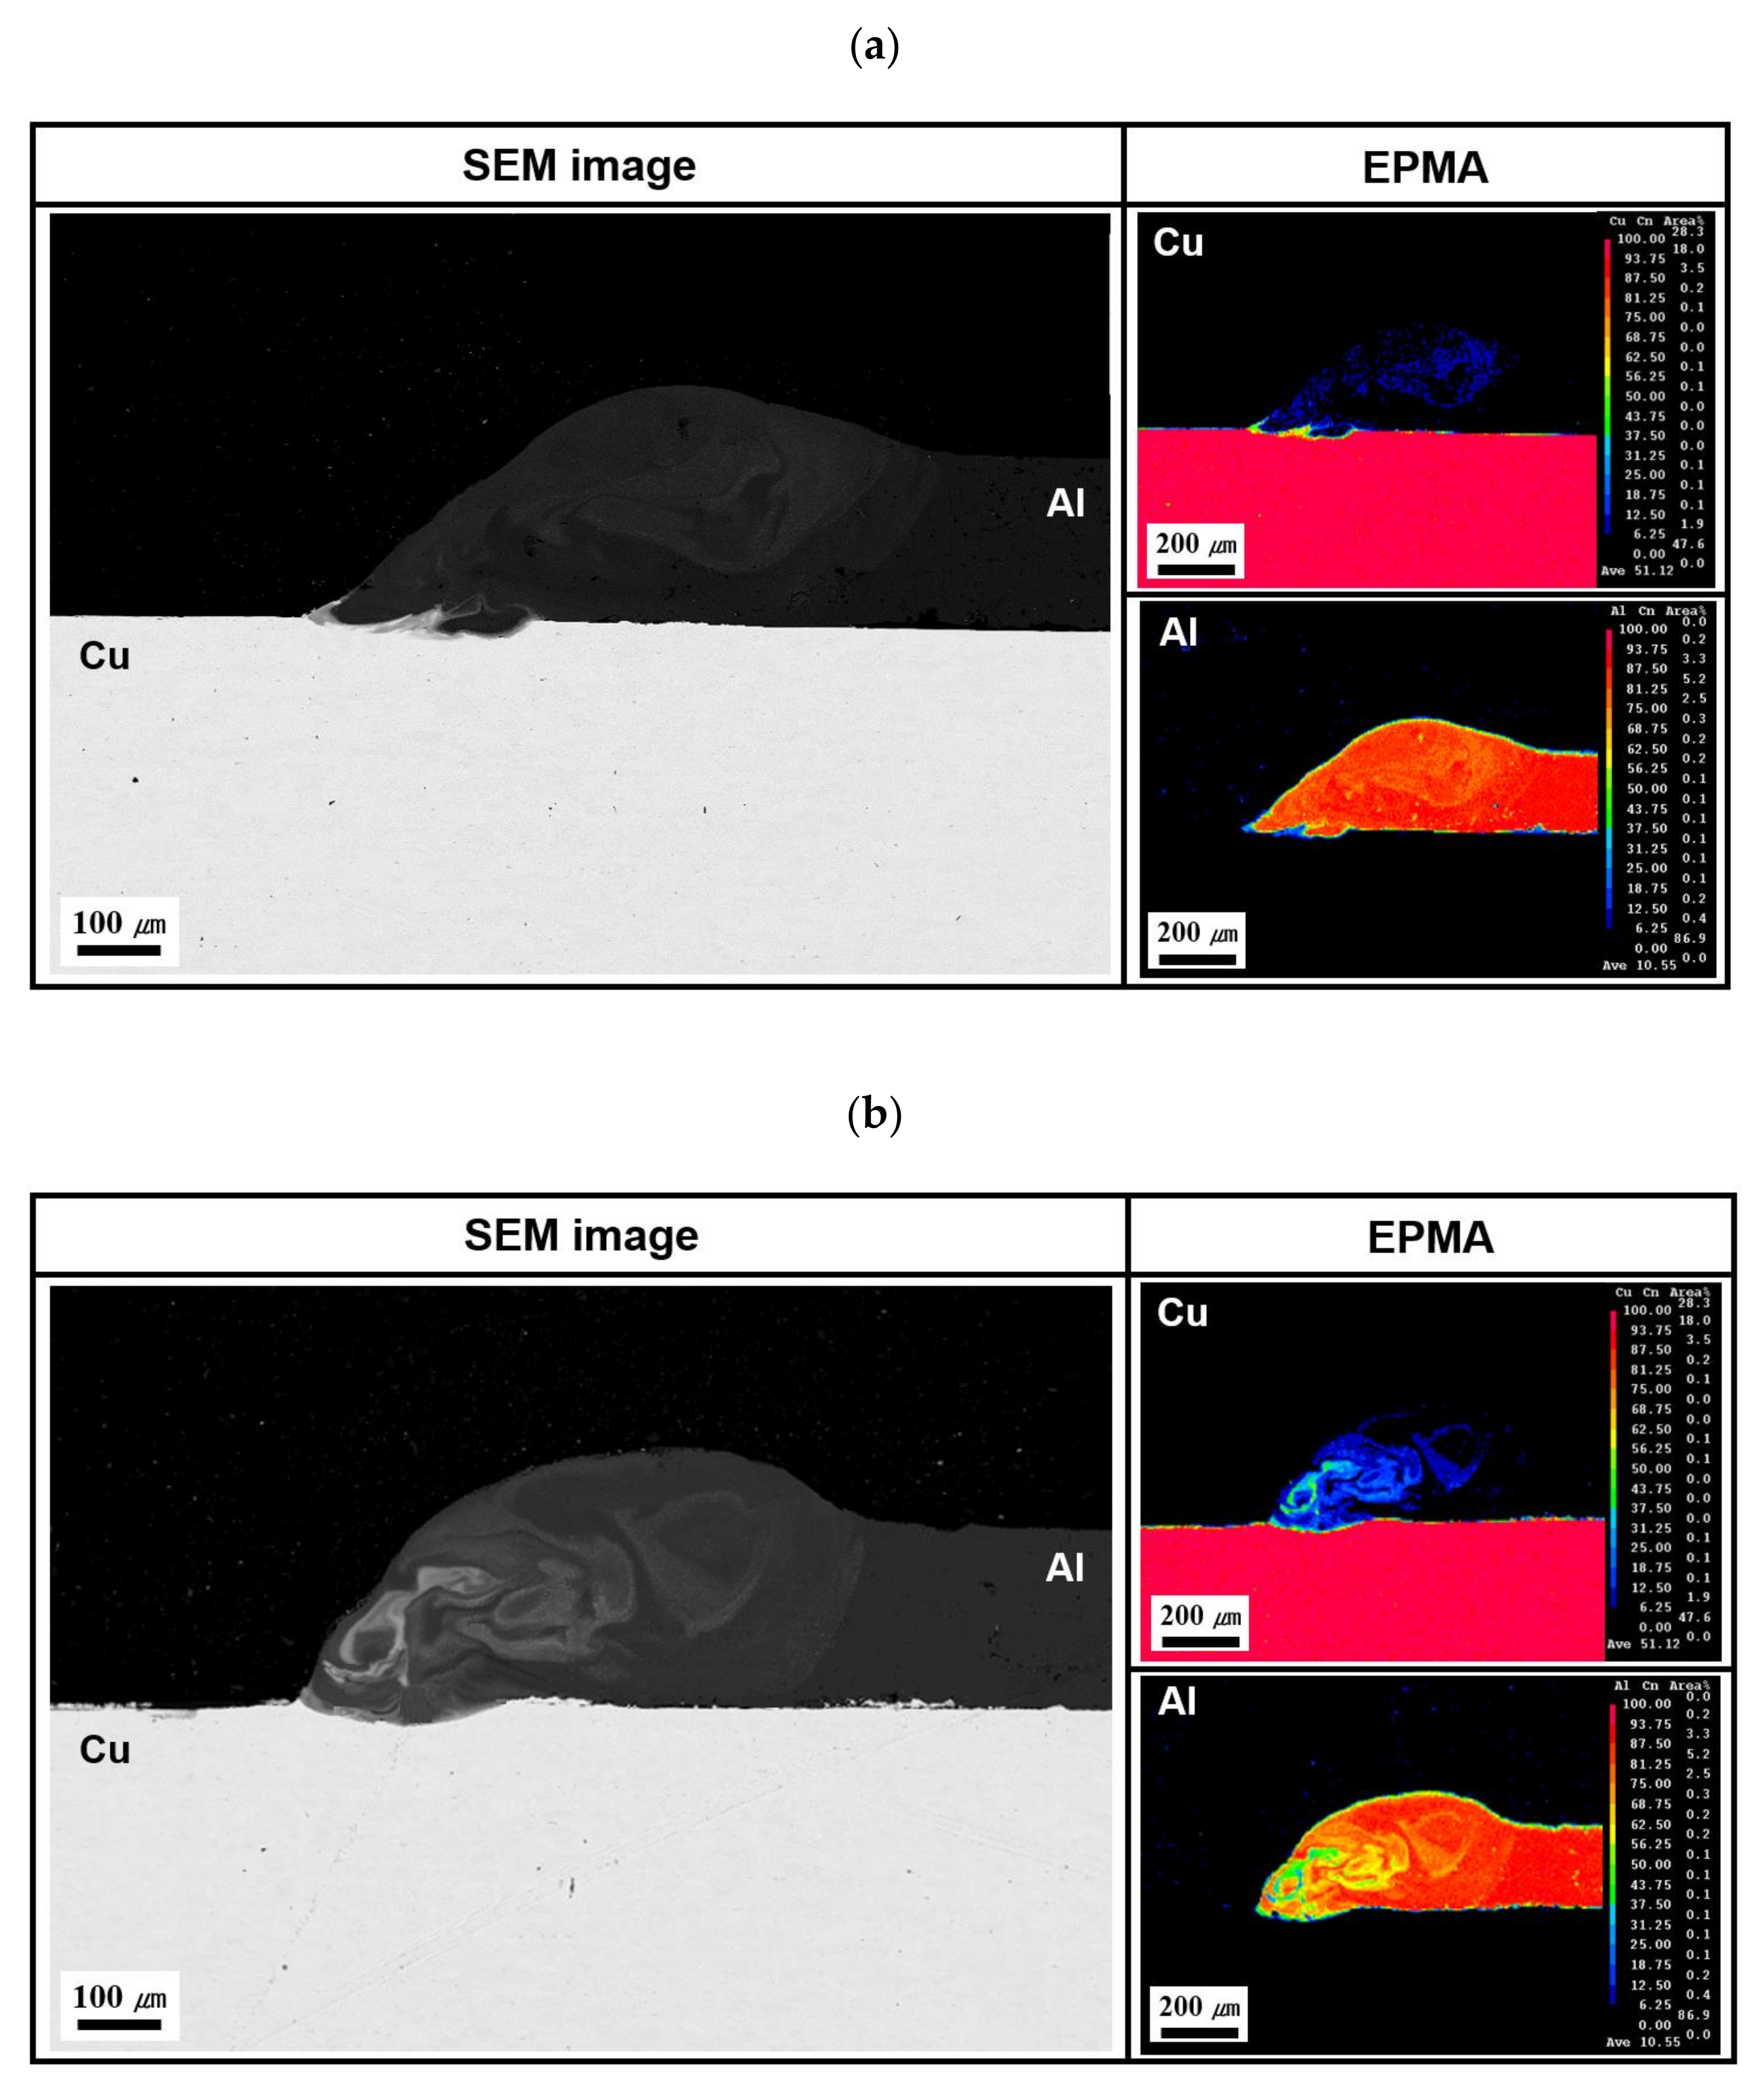
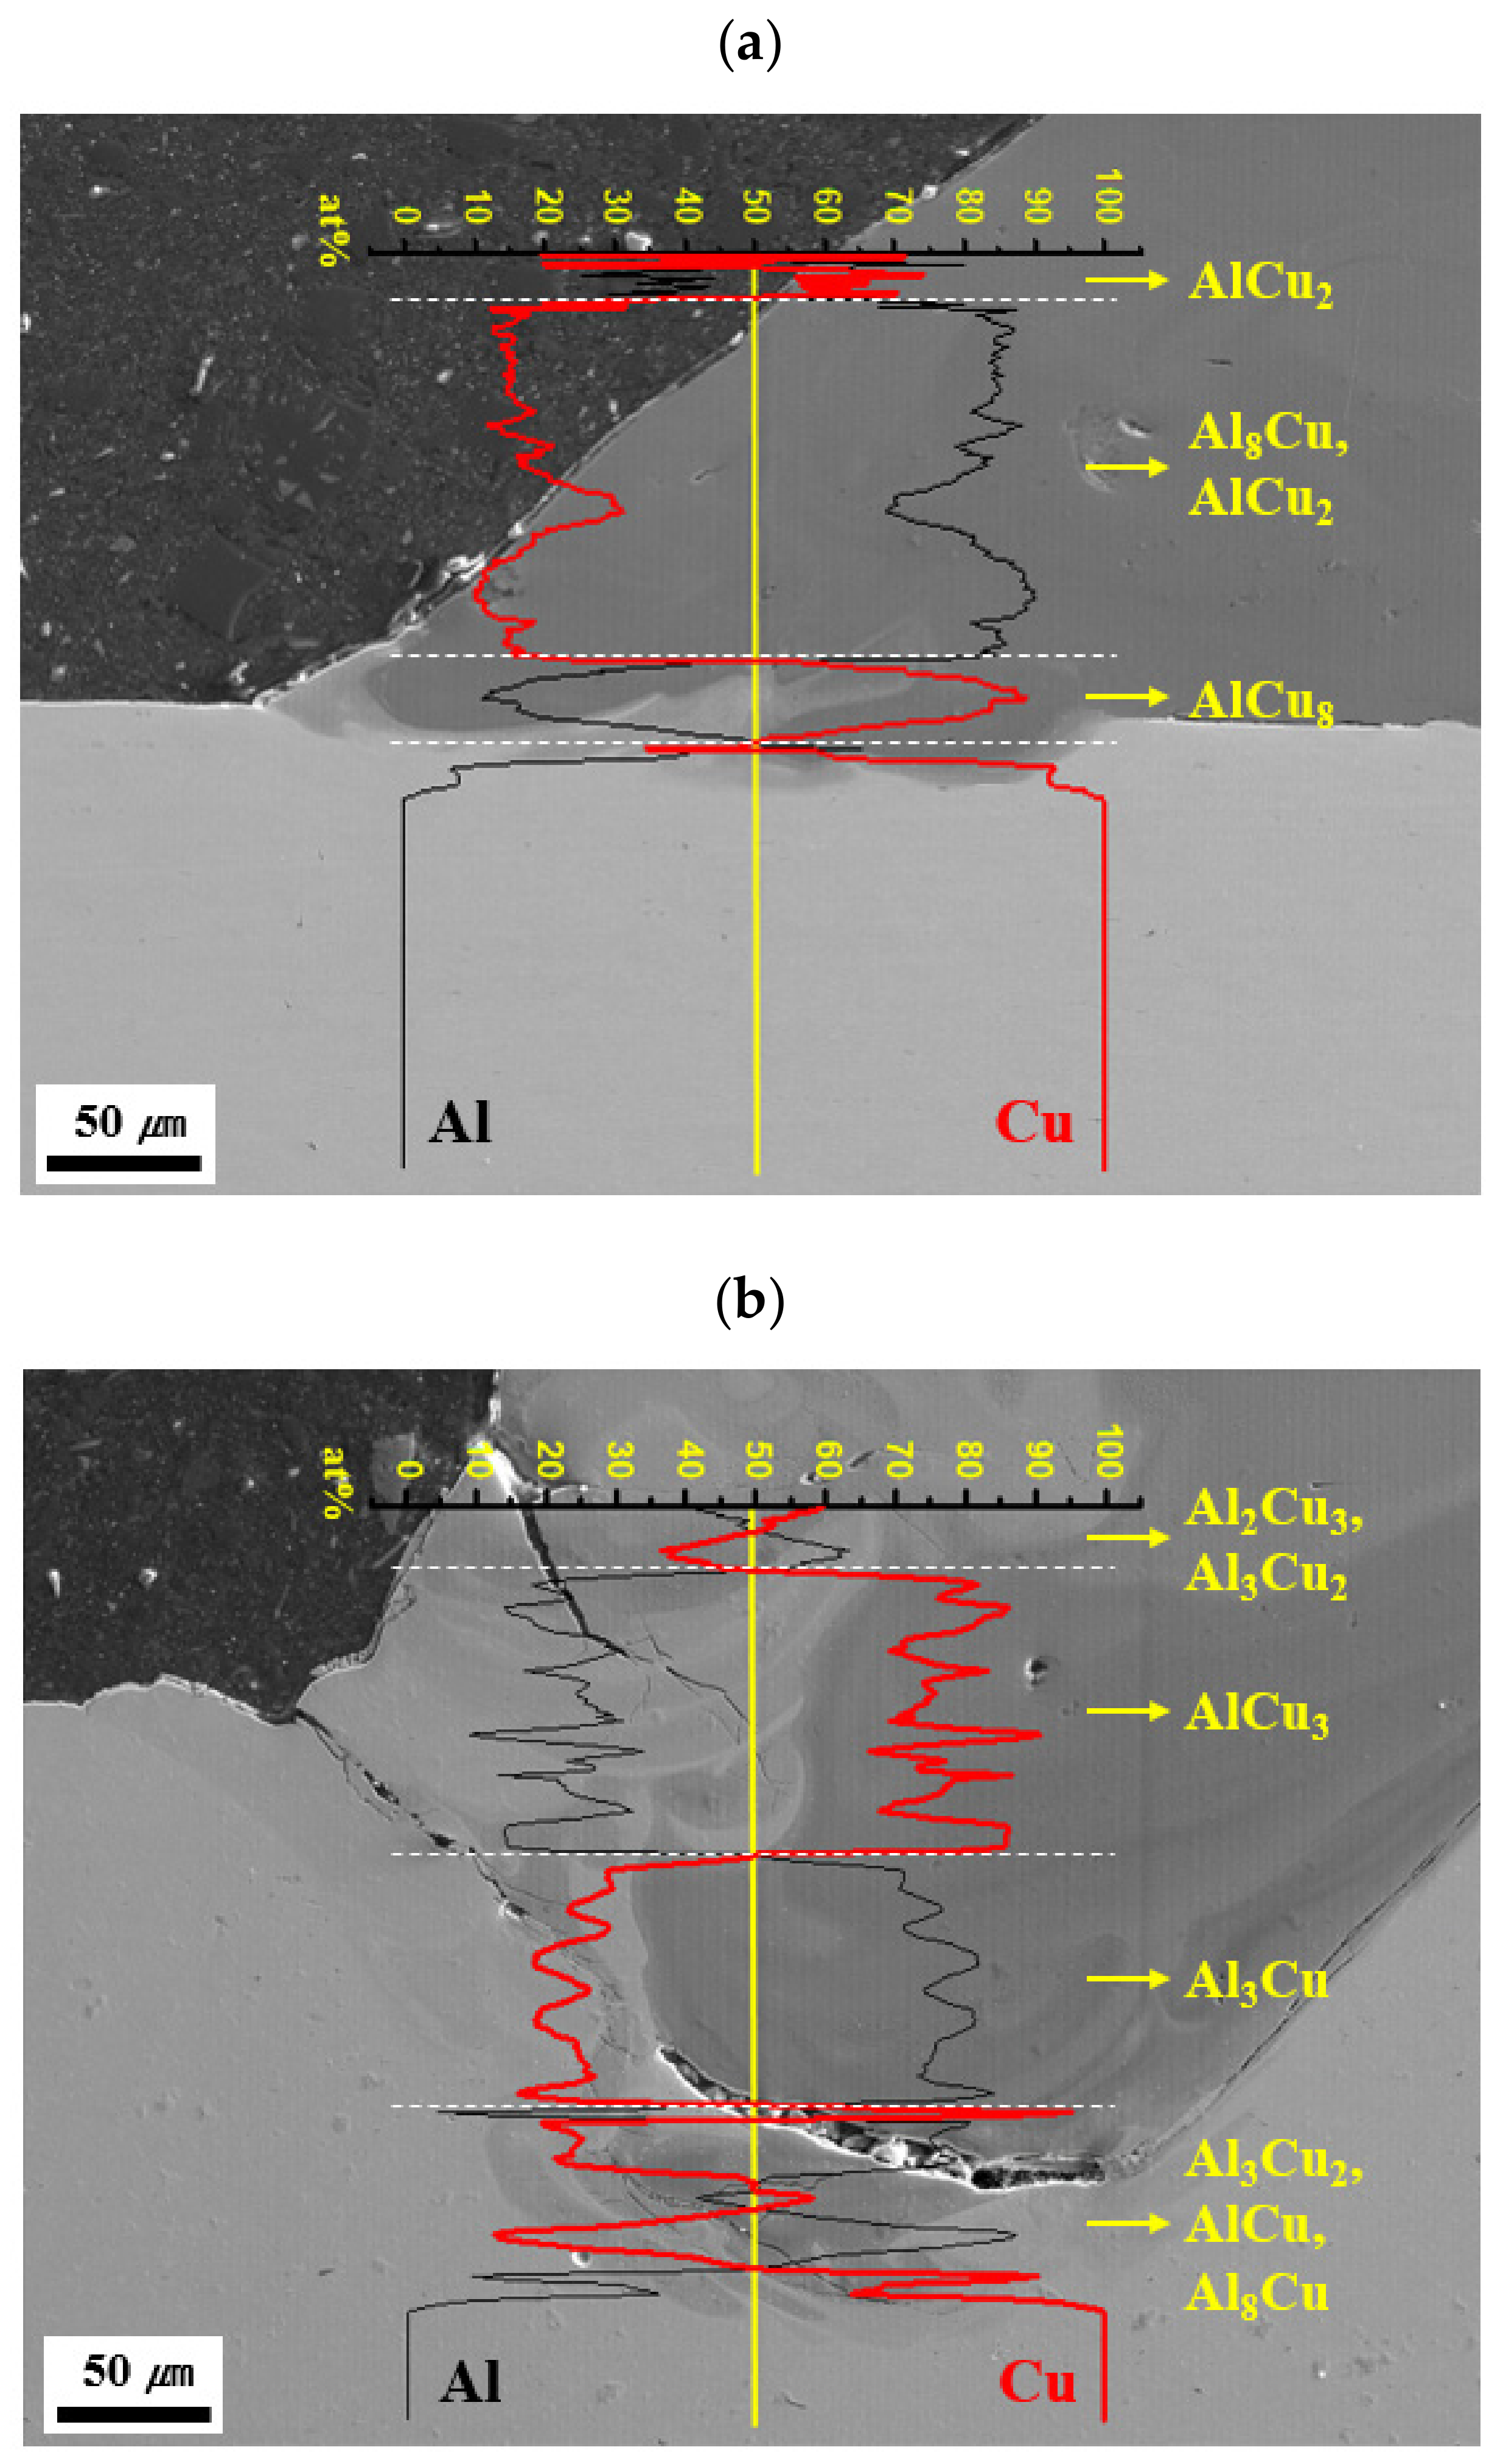
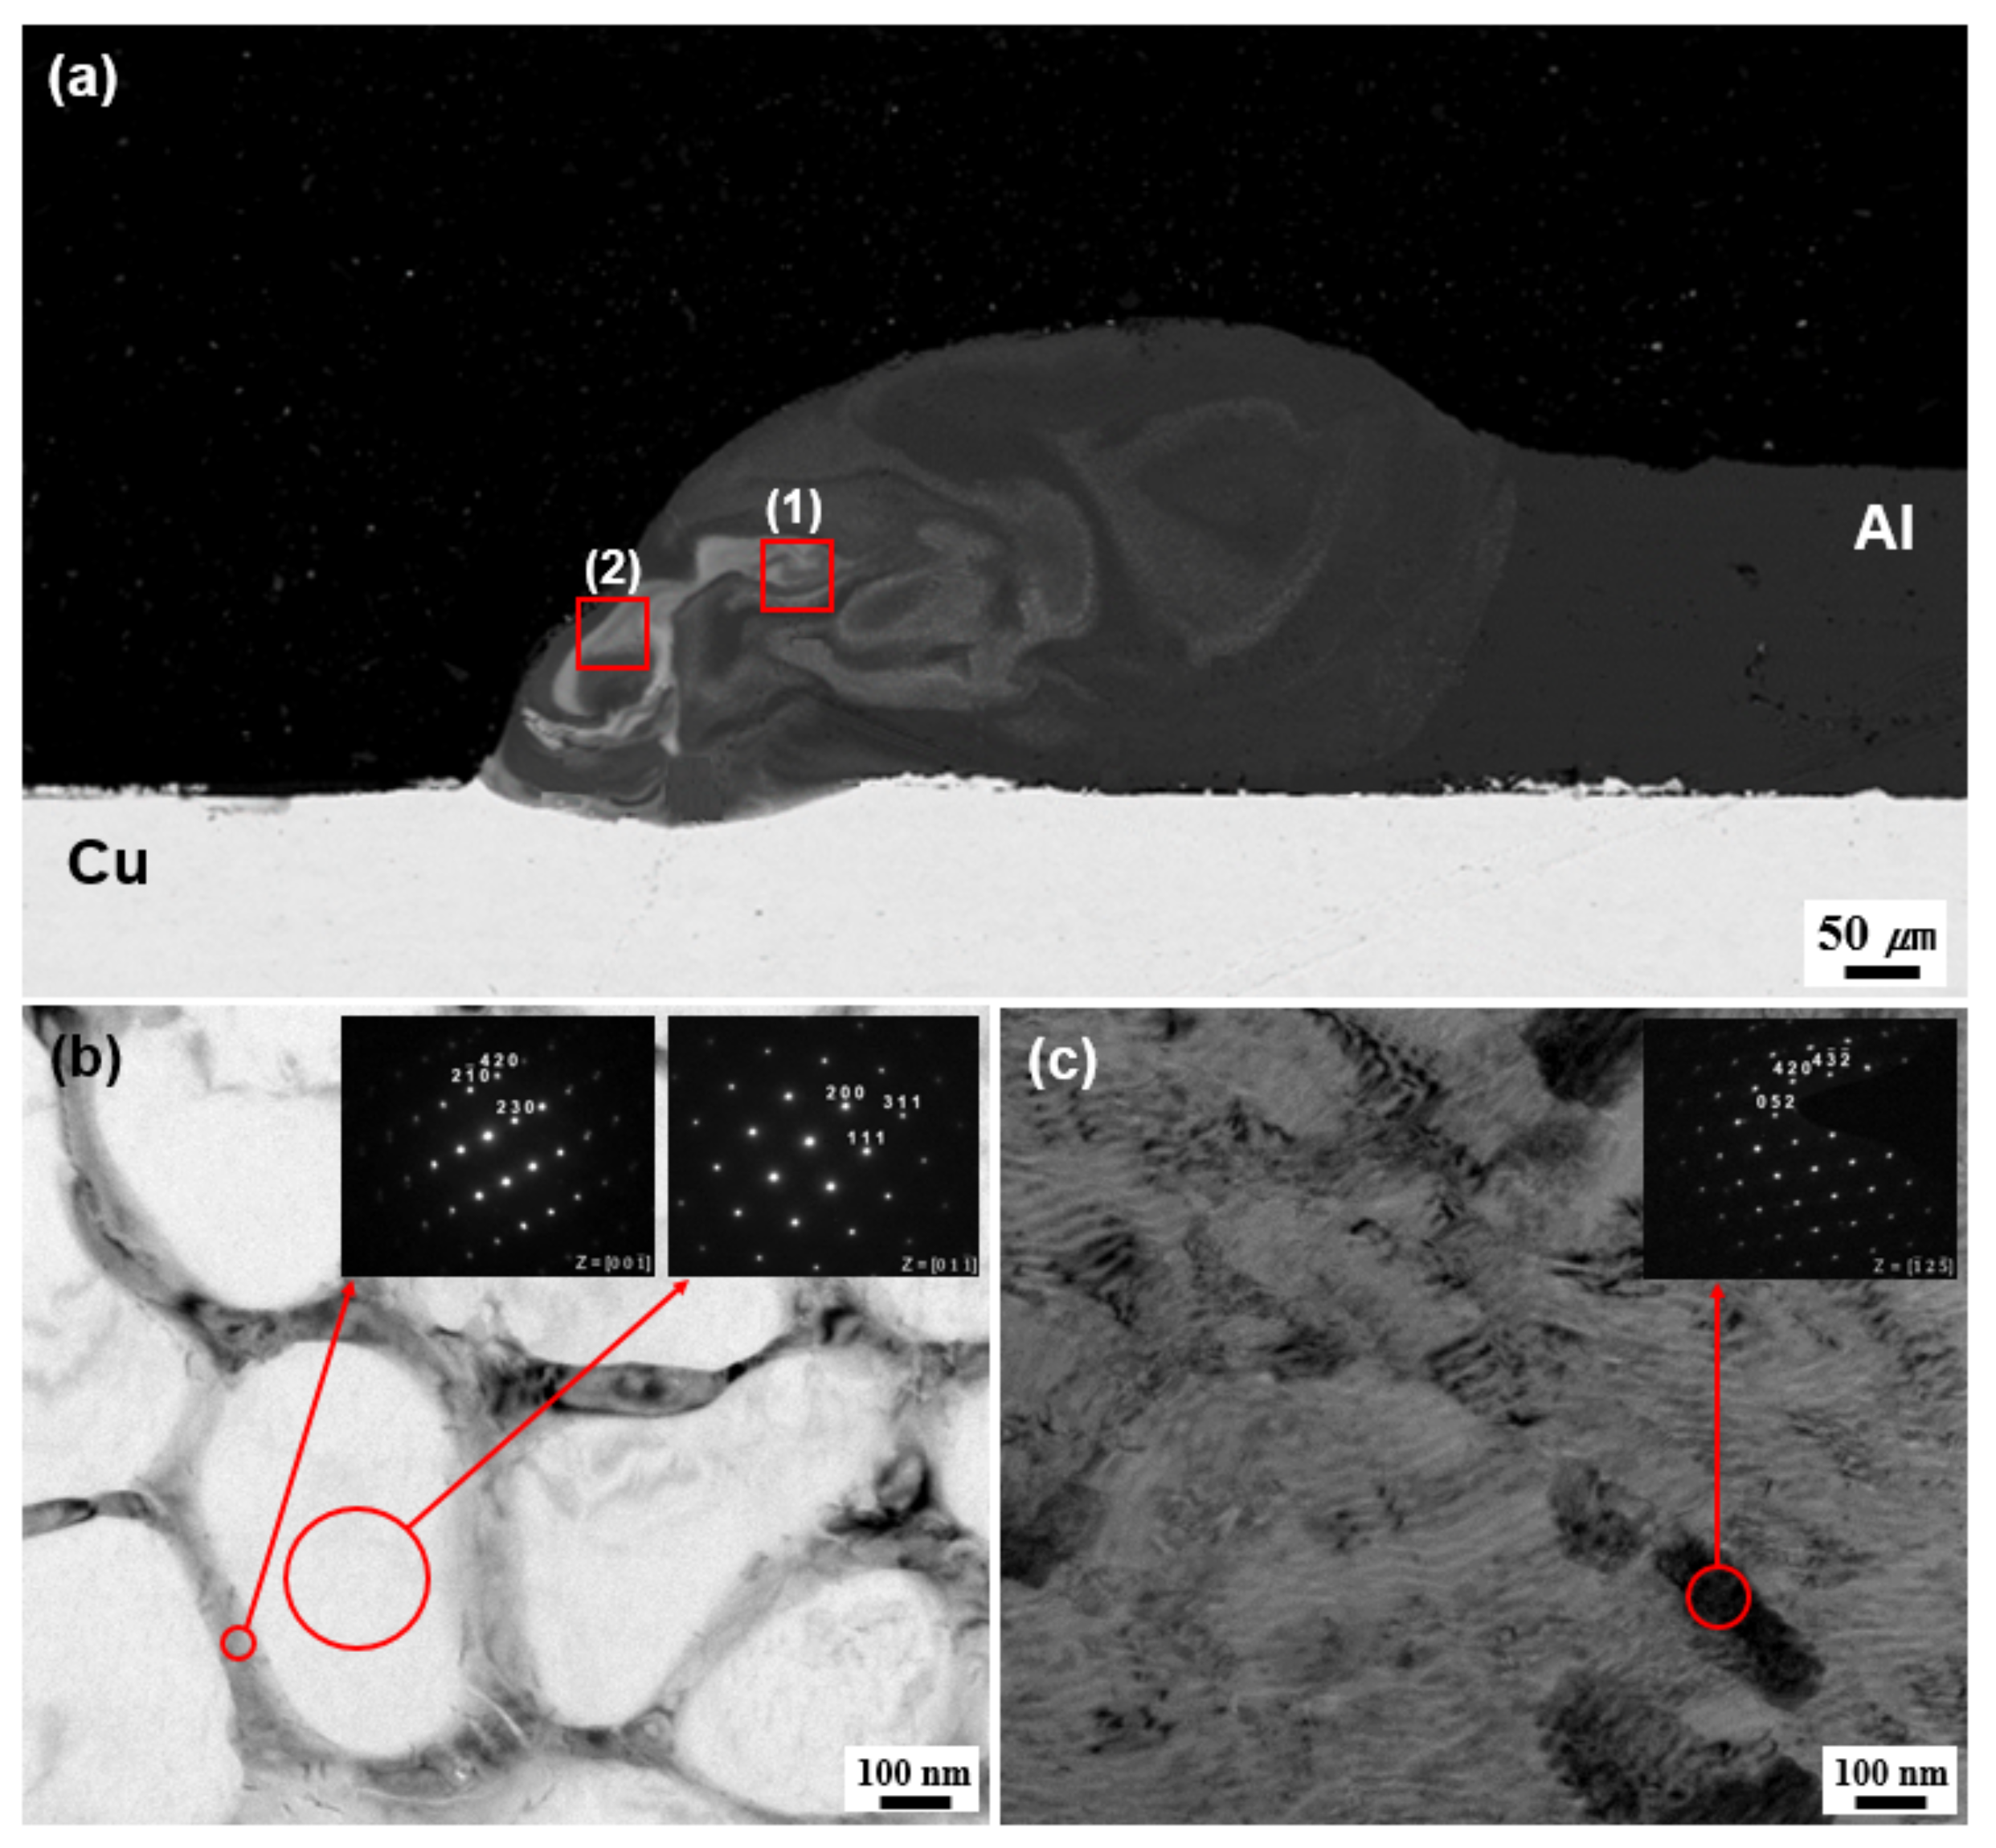
3.1. Microstructures
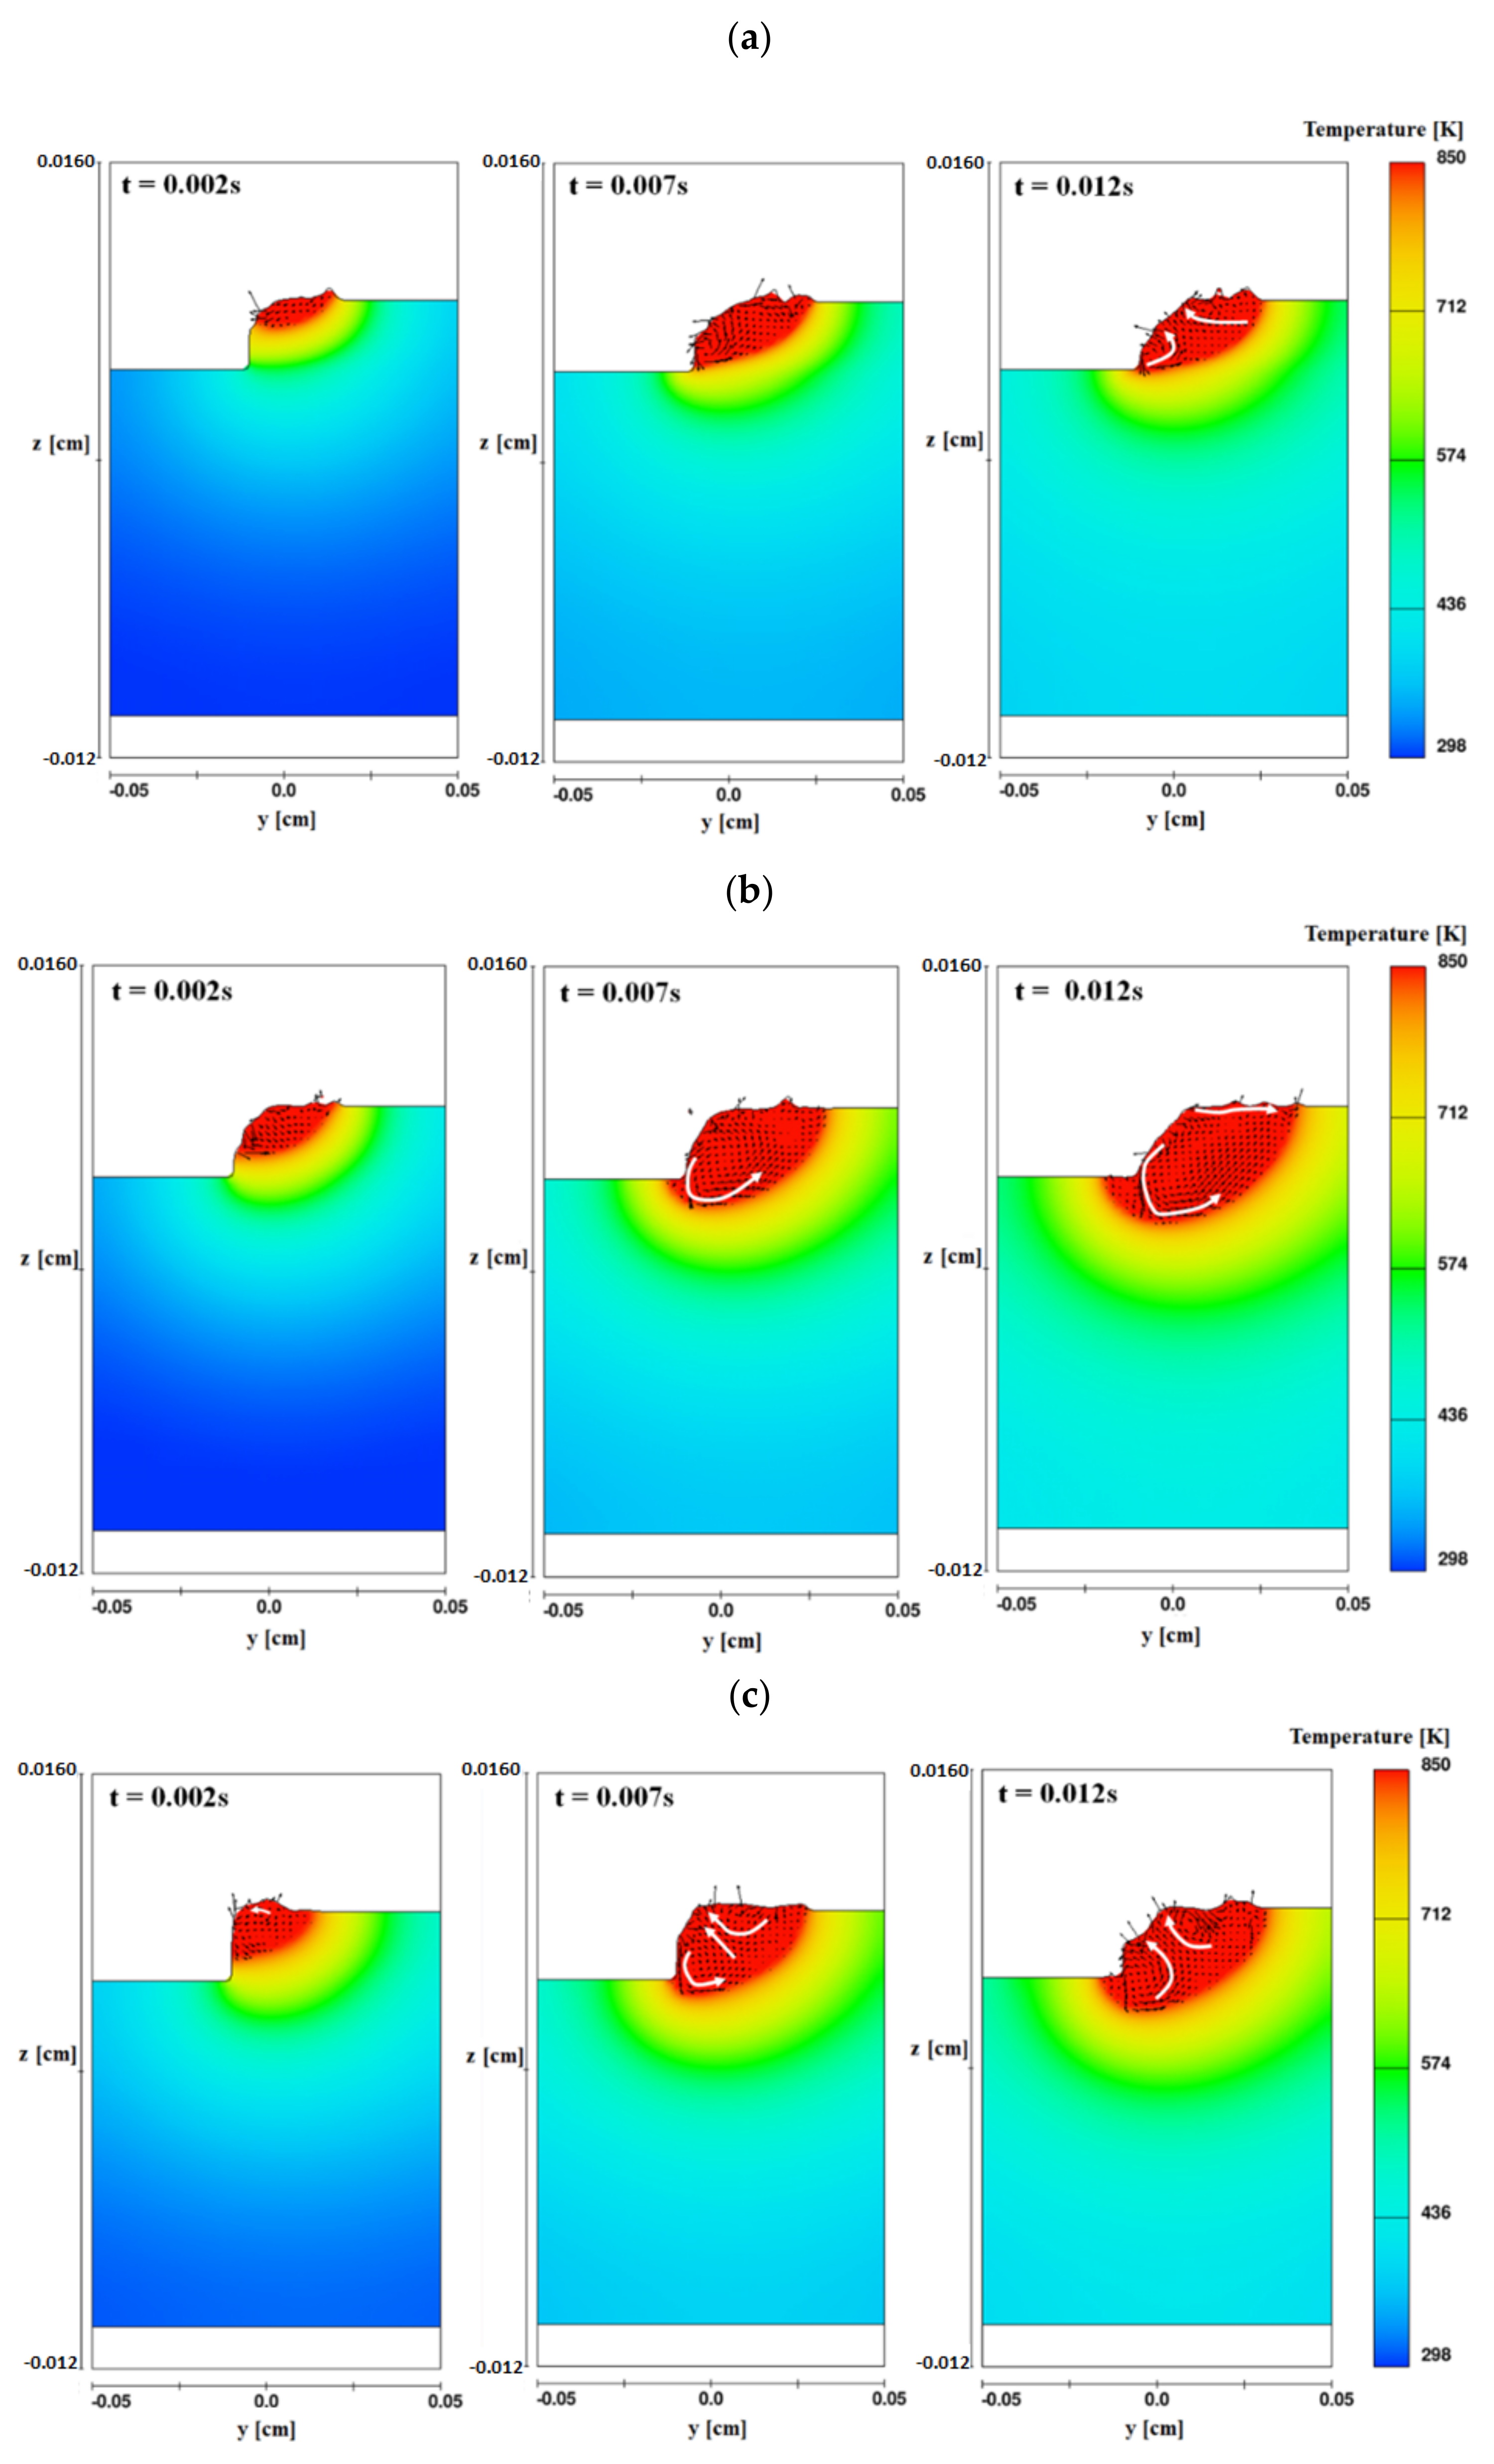
3.2. Numerical Simulation Results
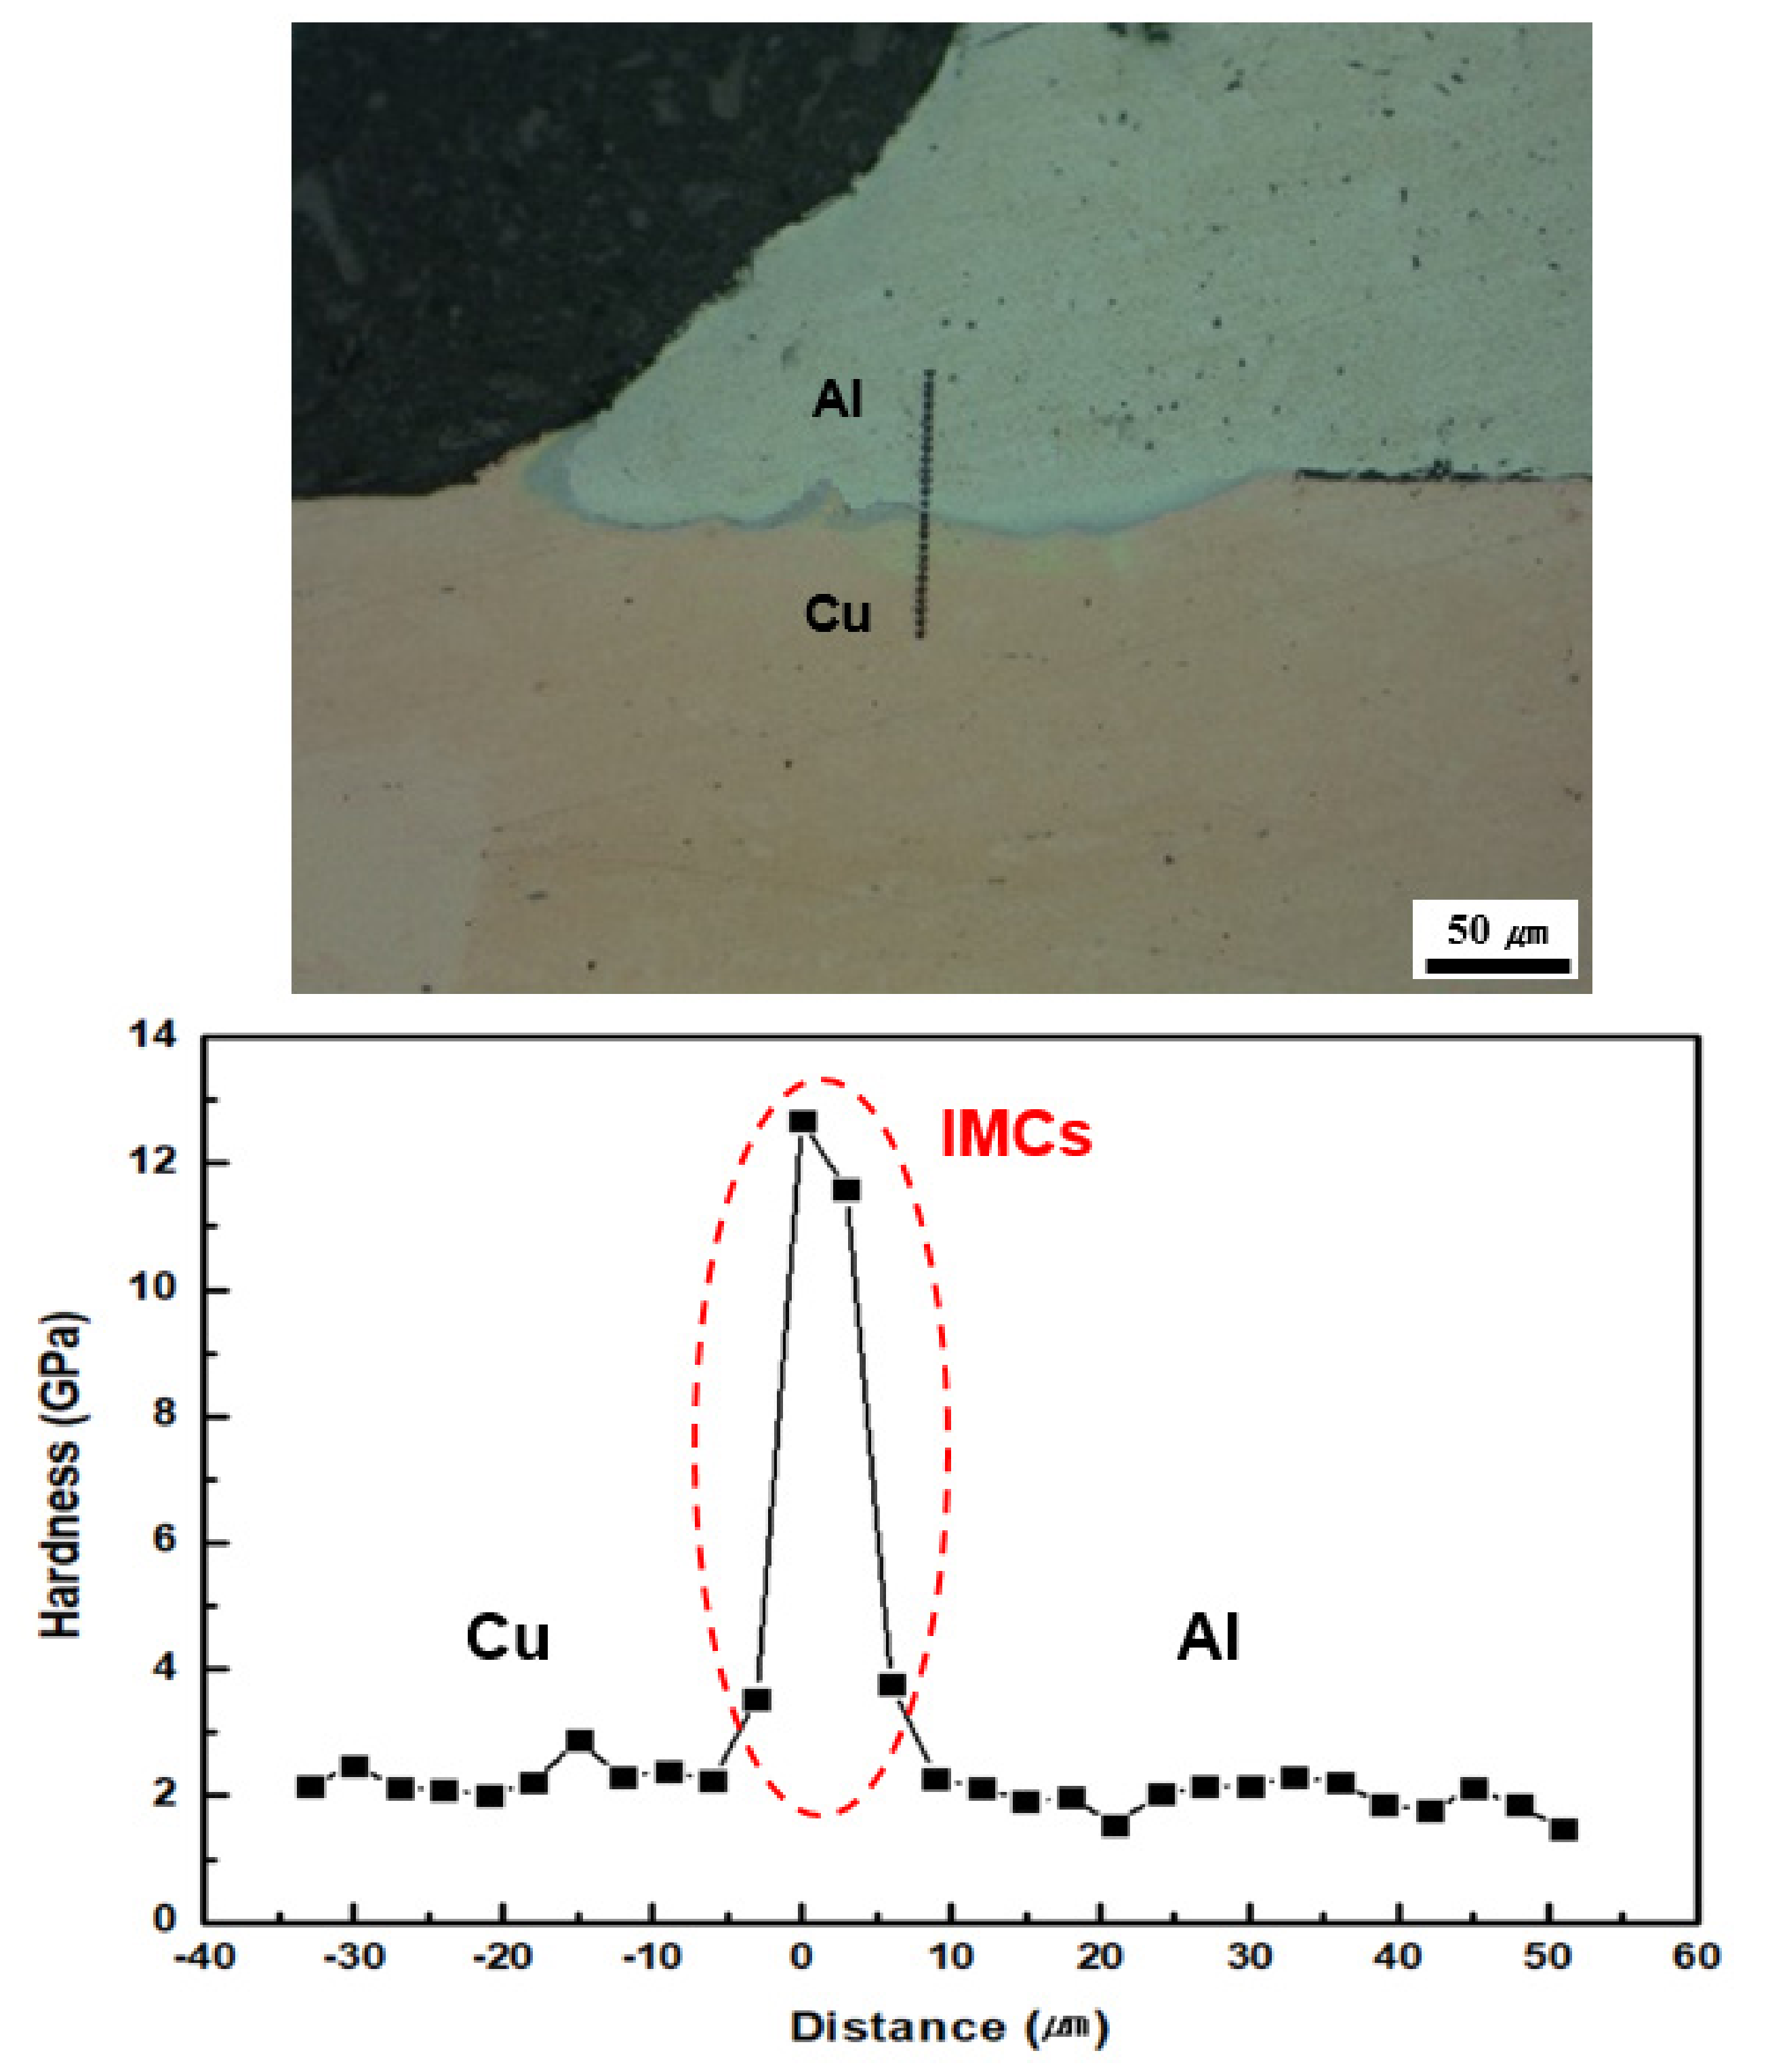
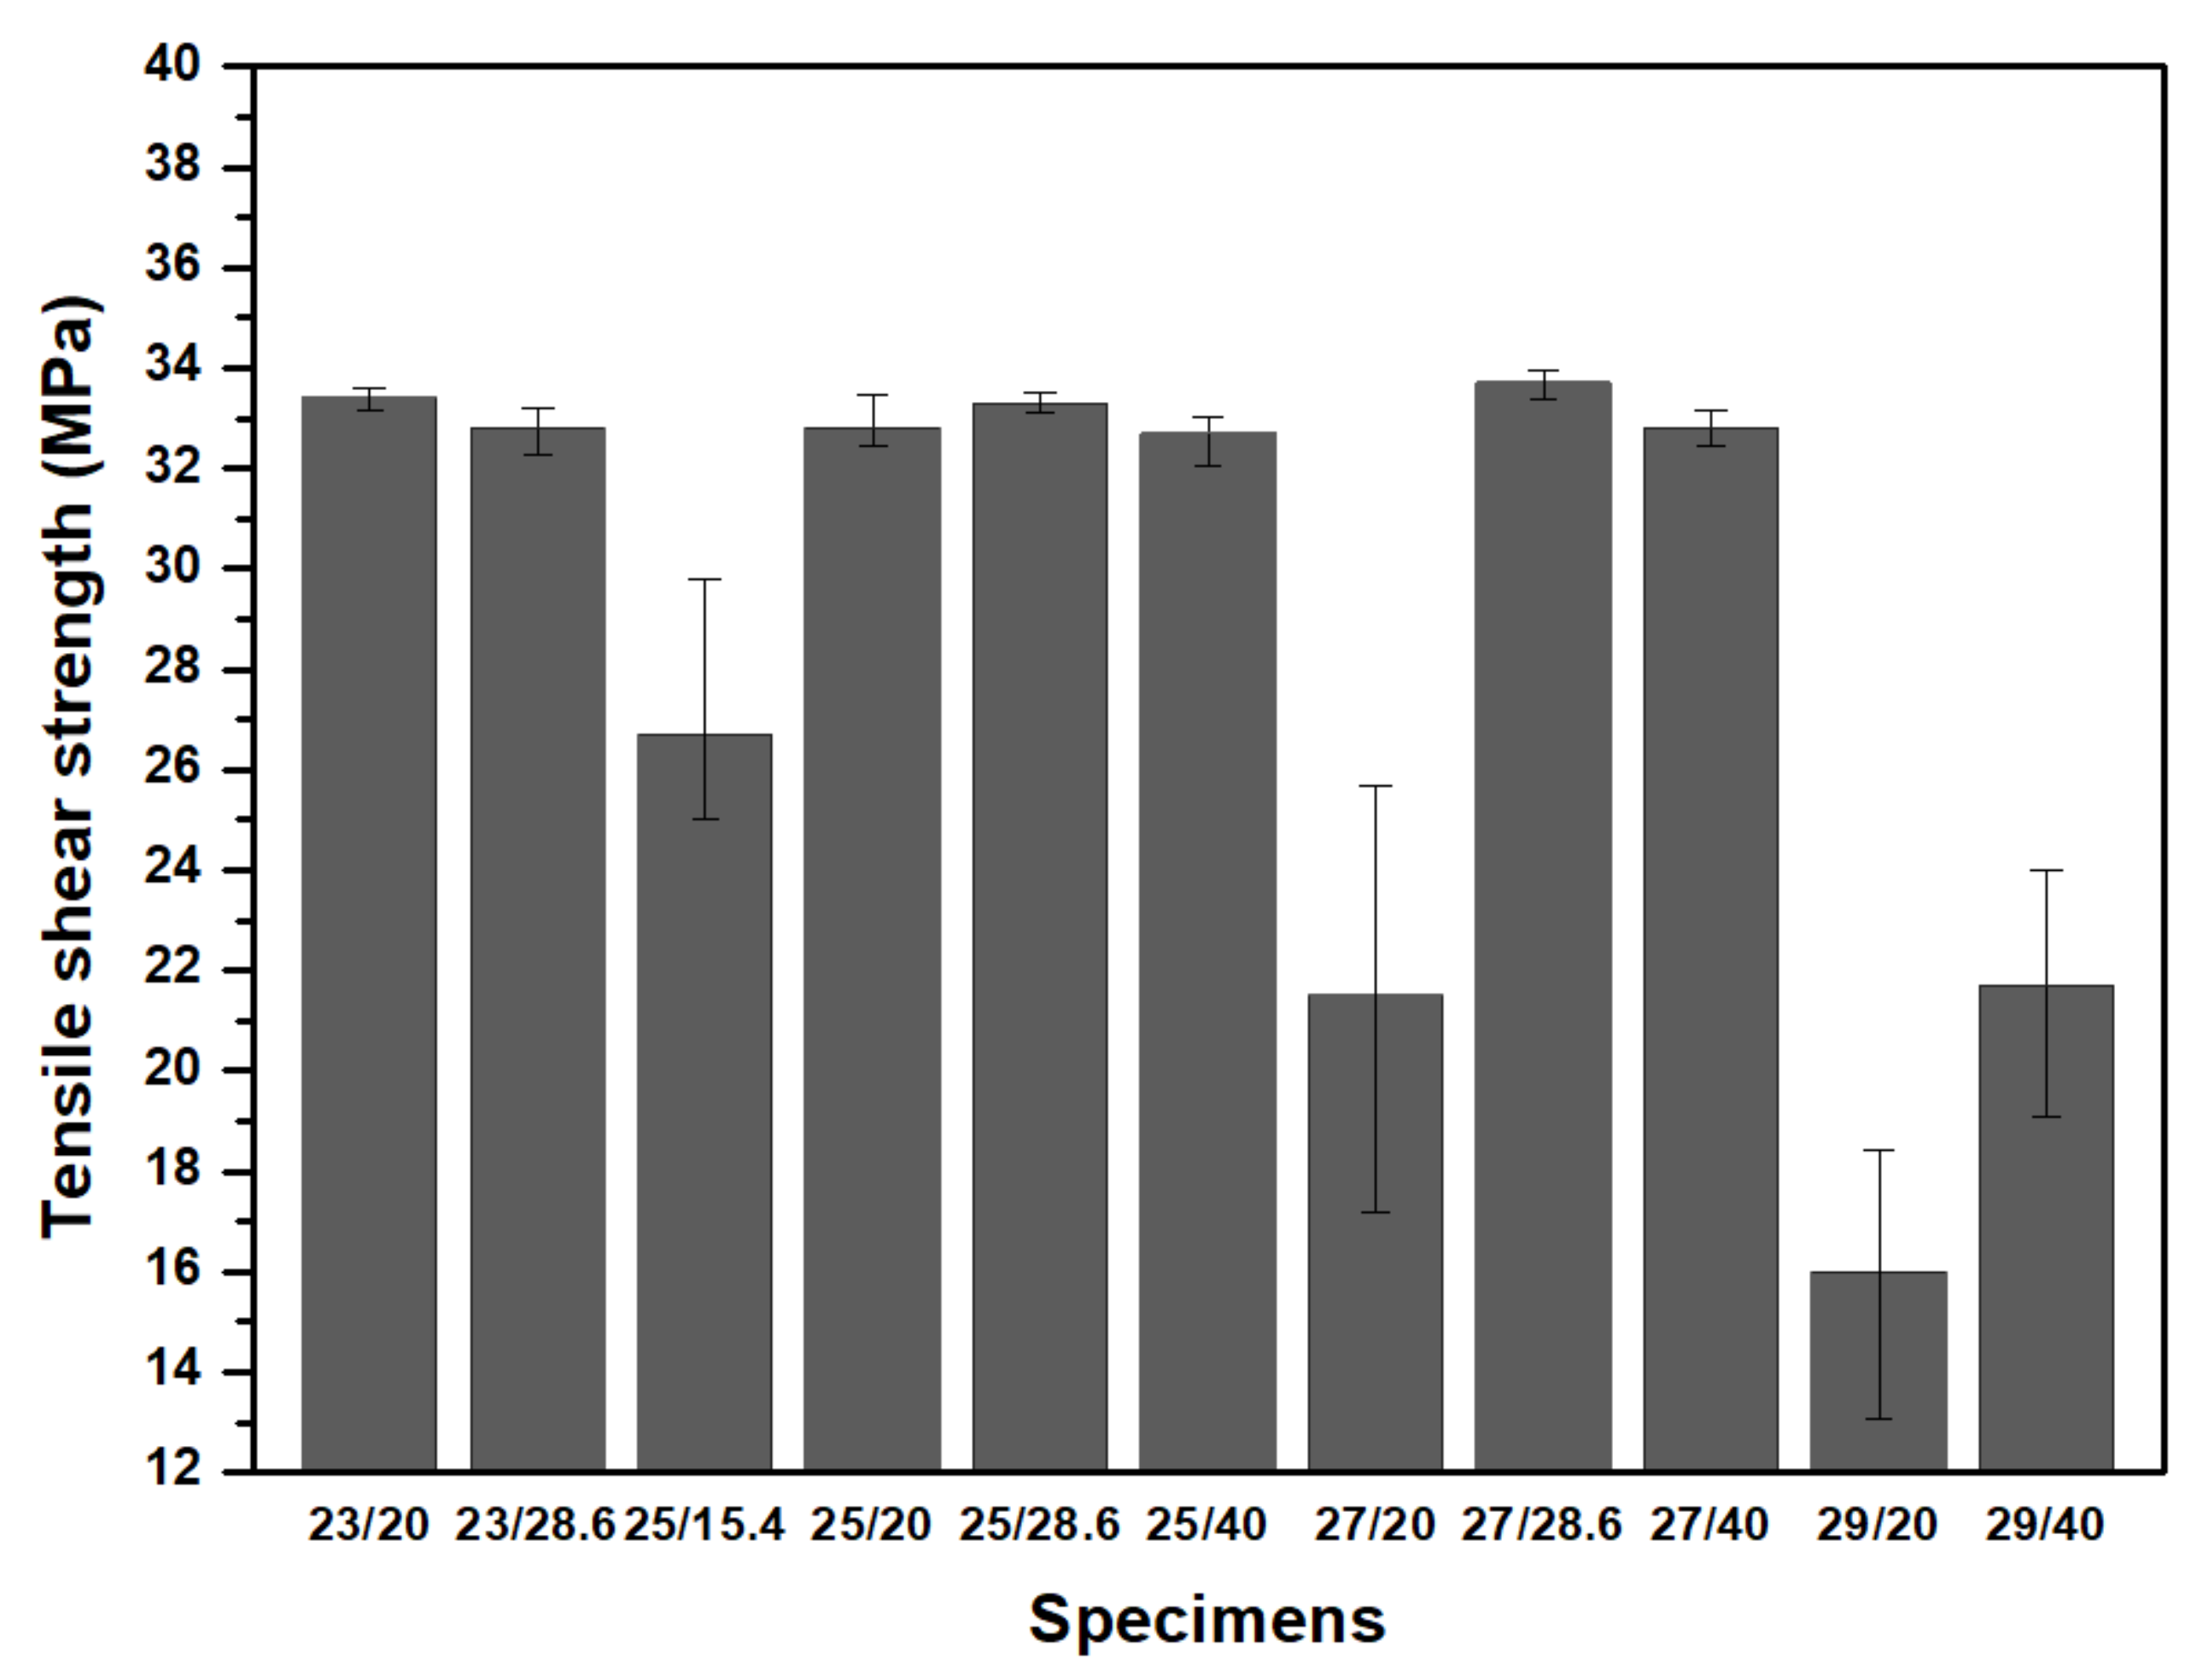
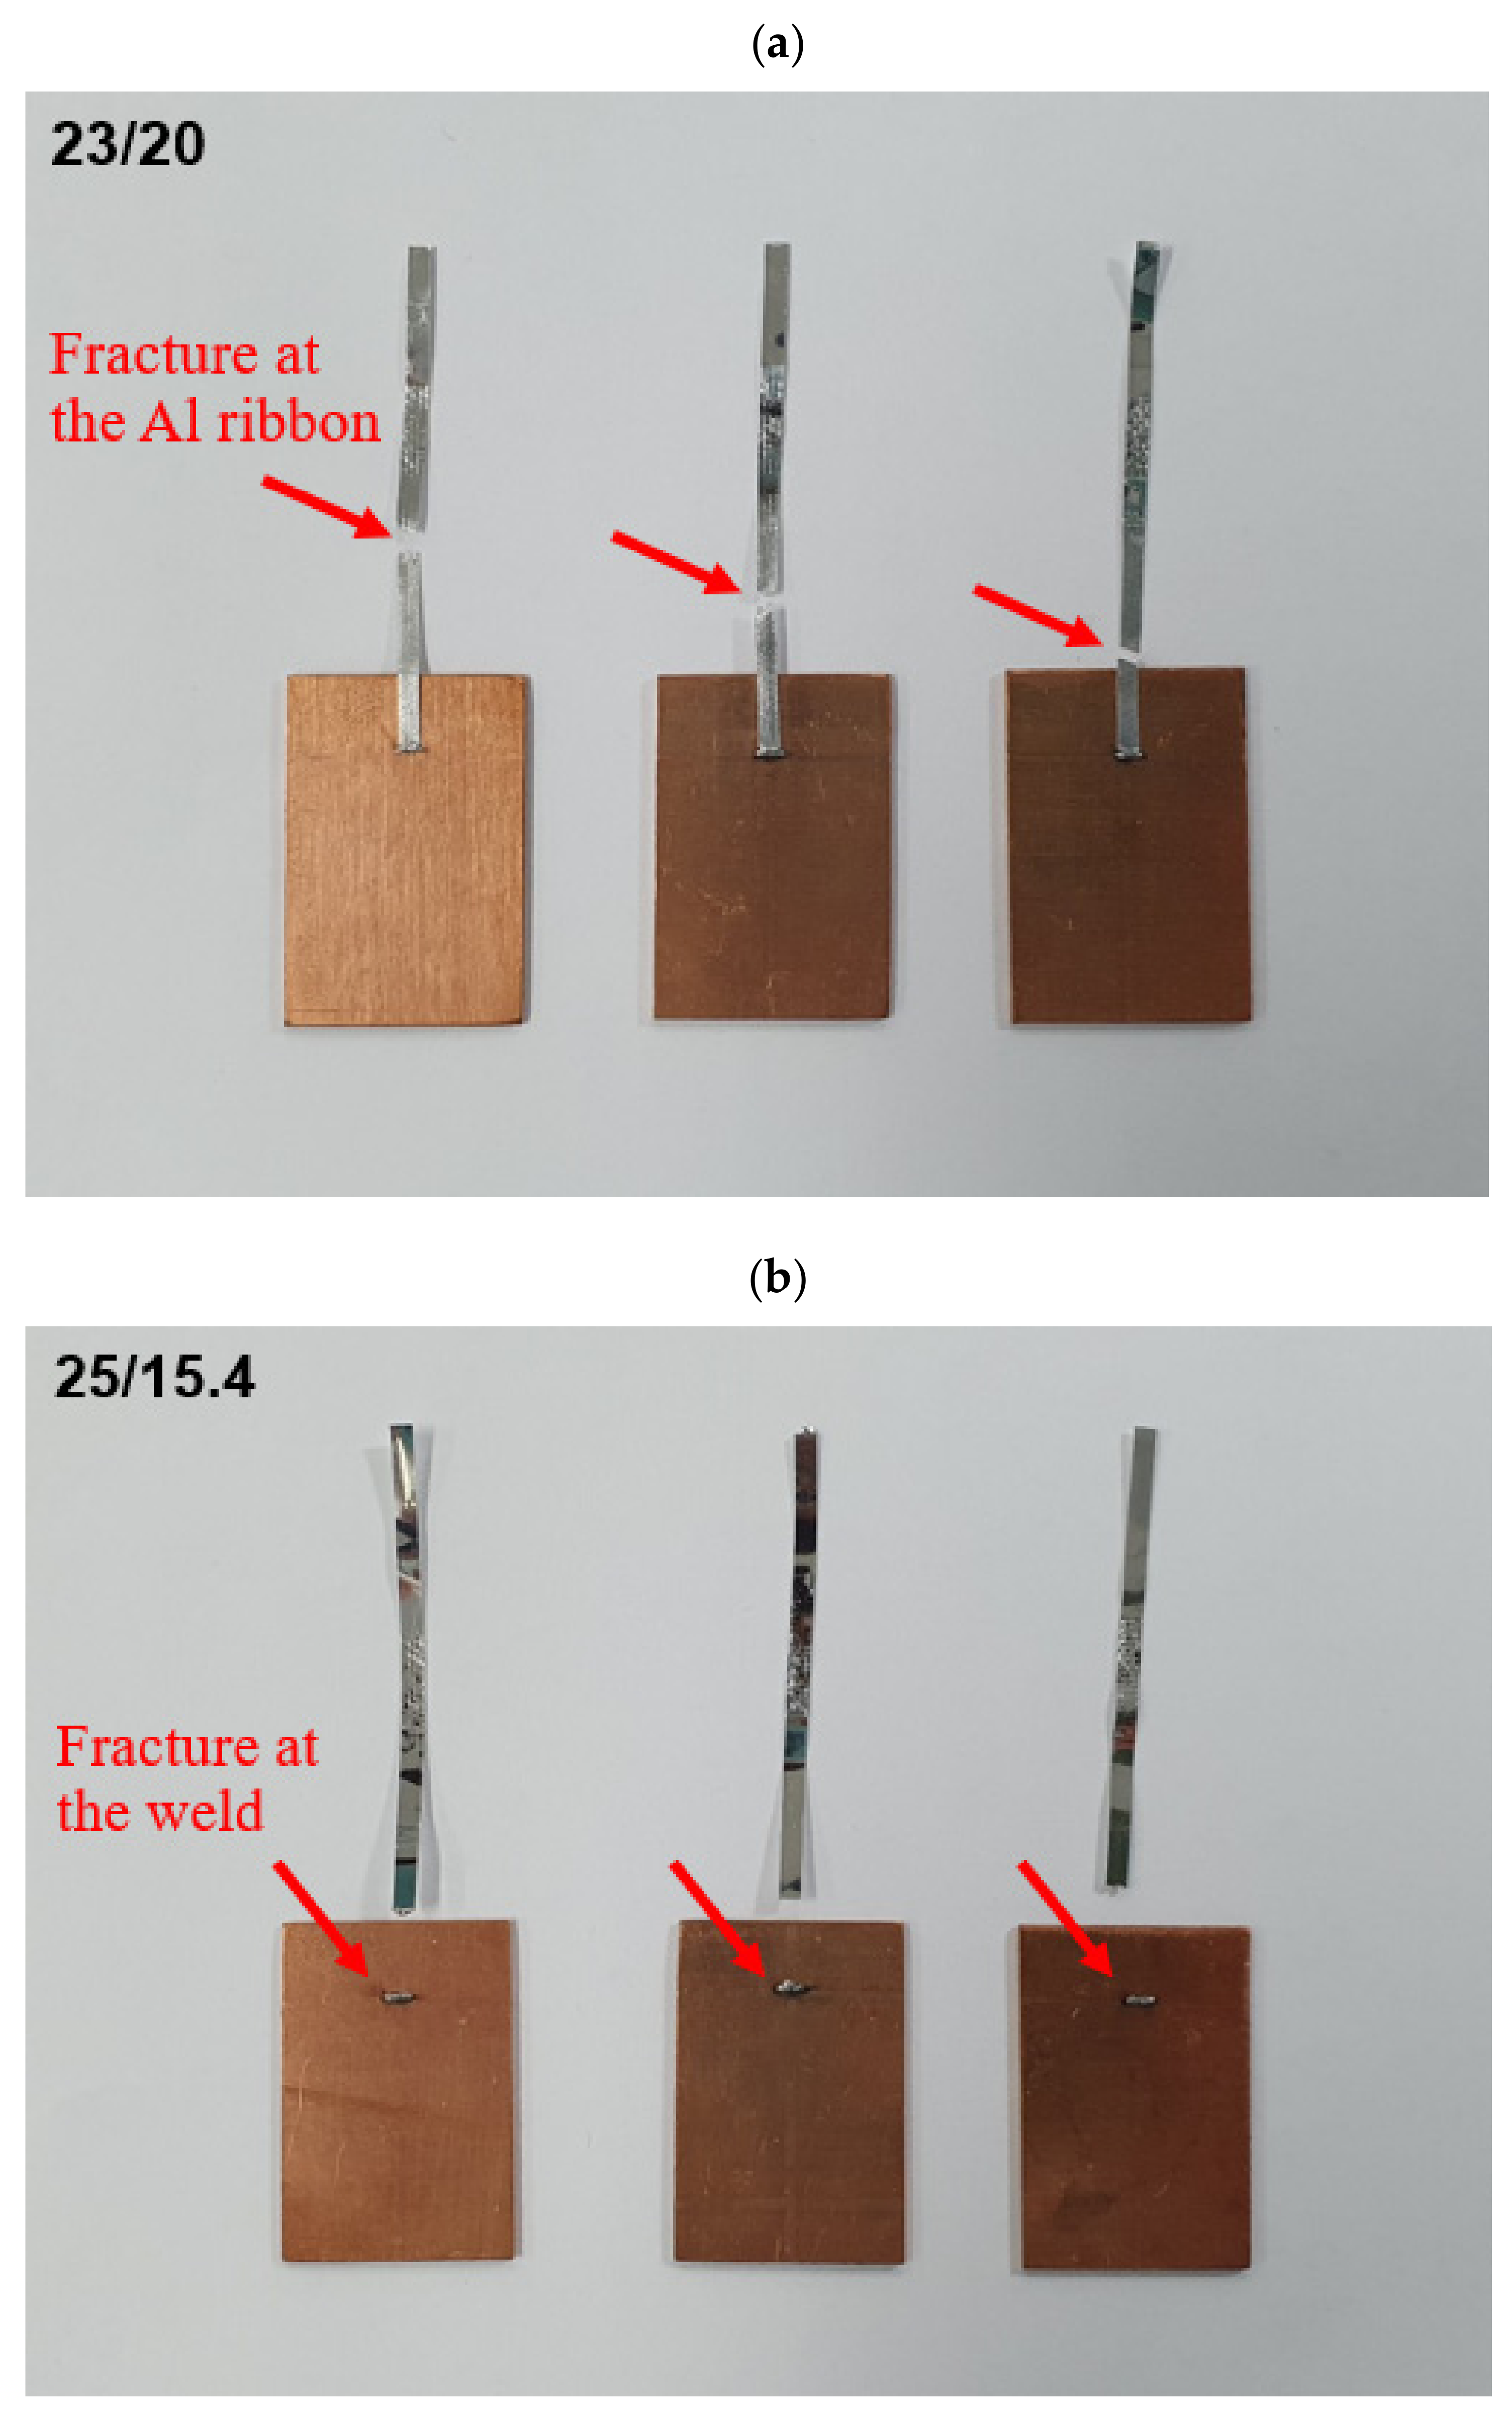
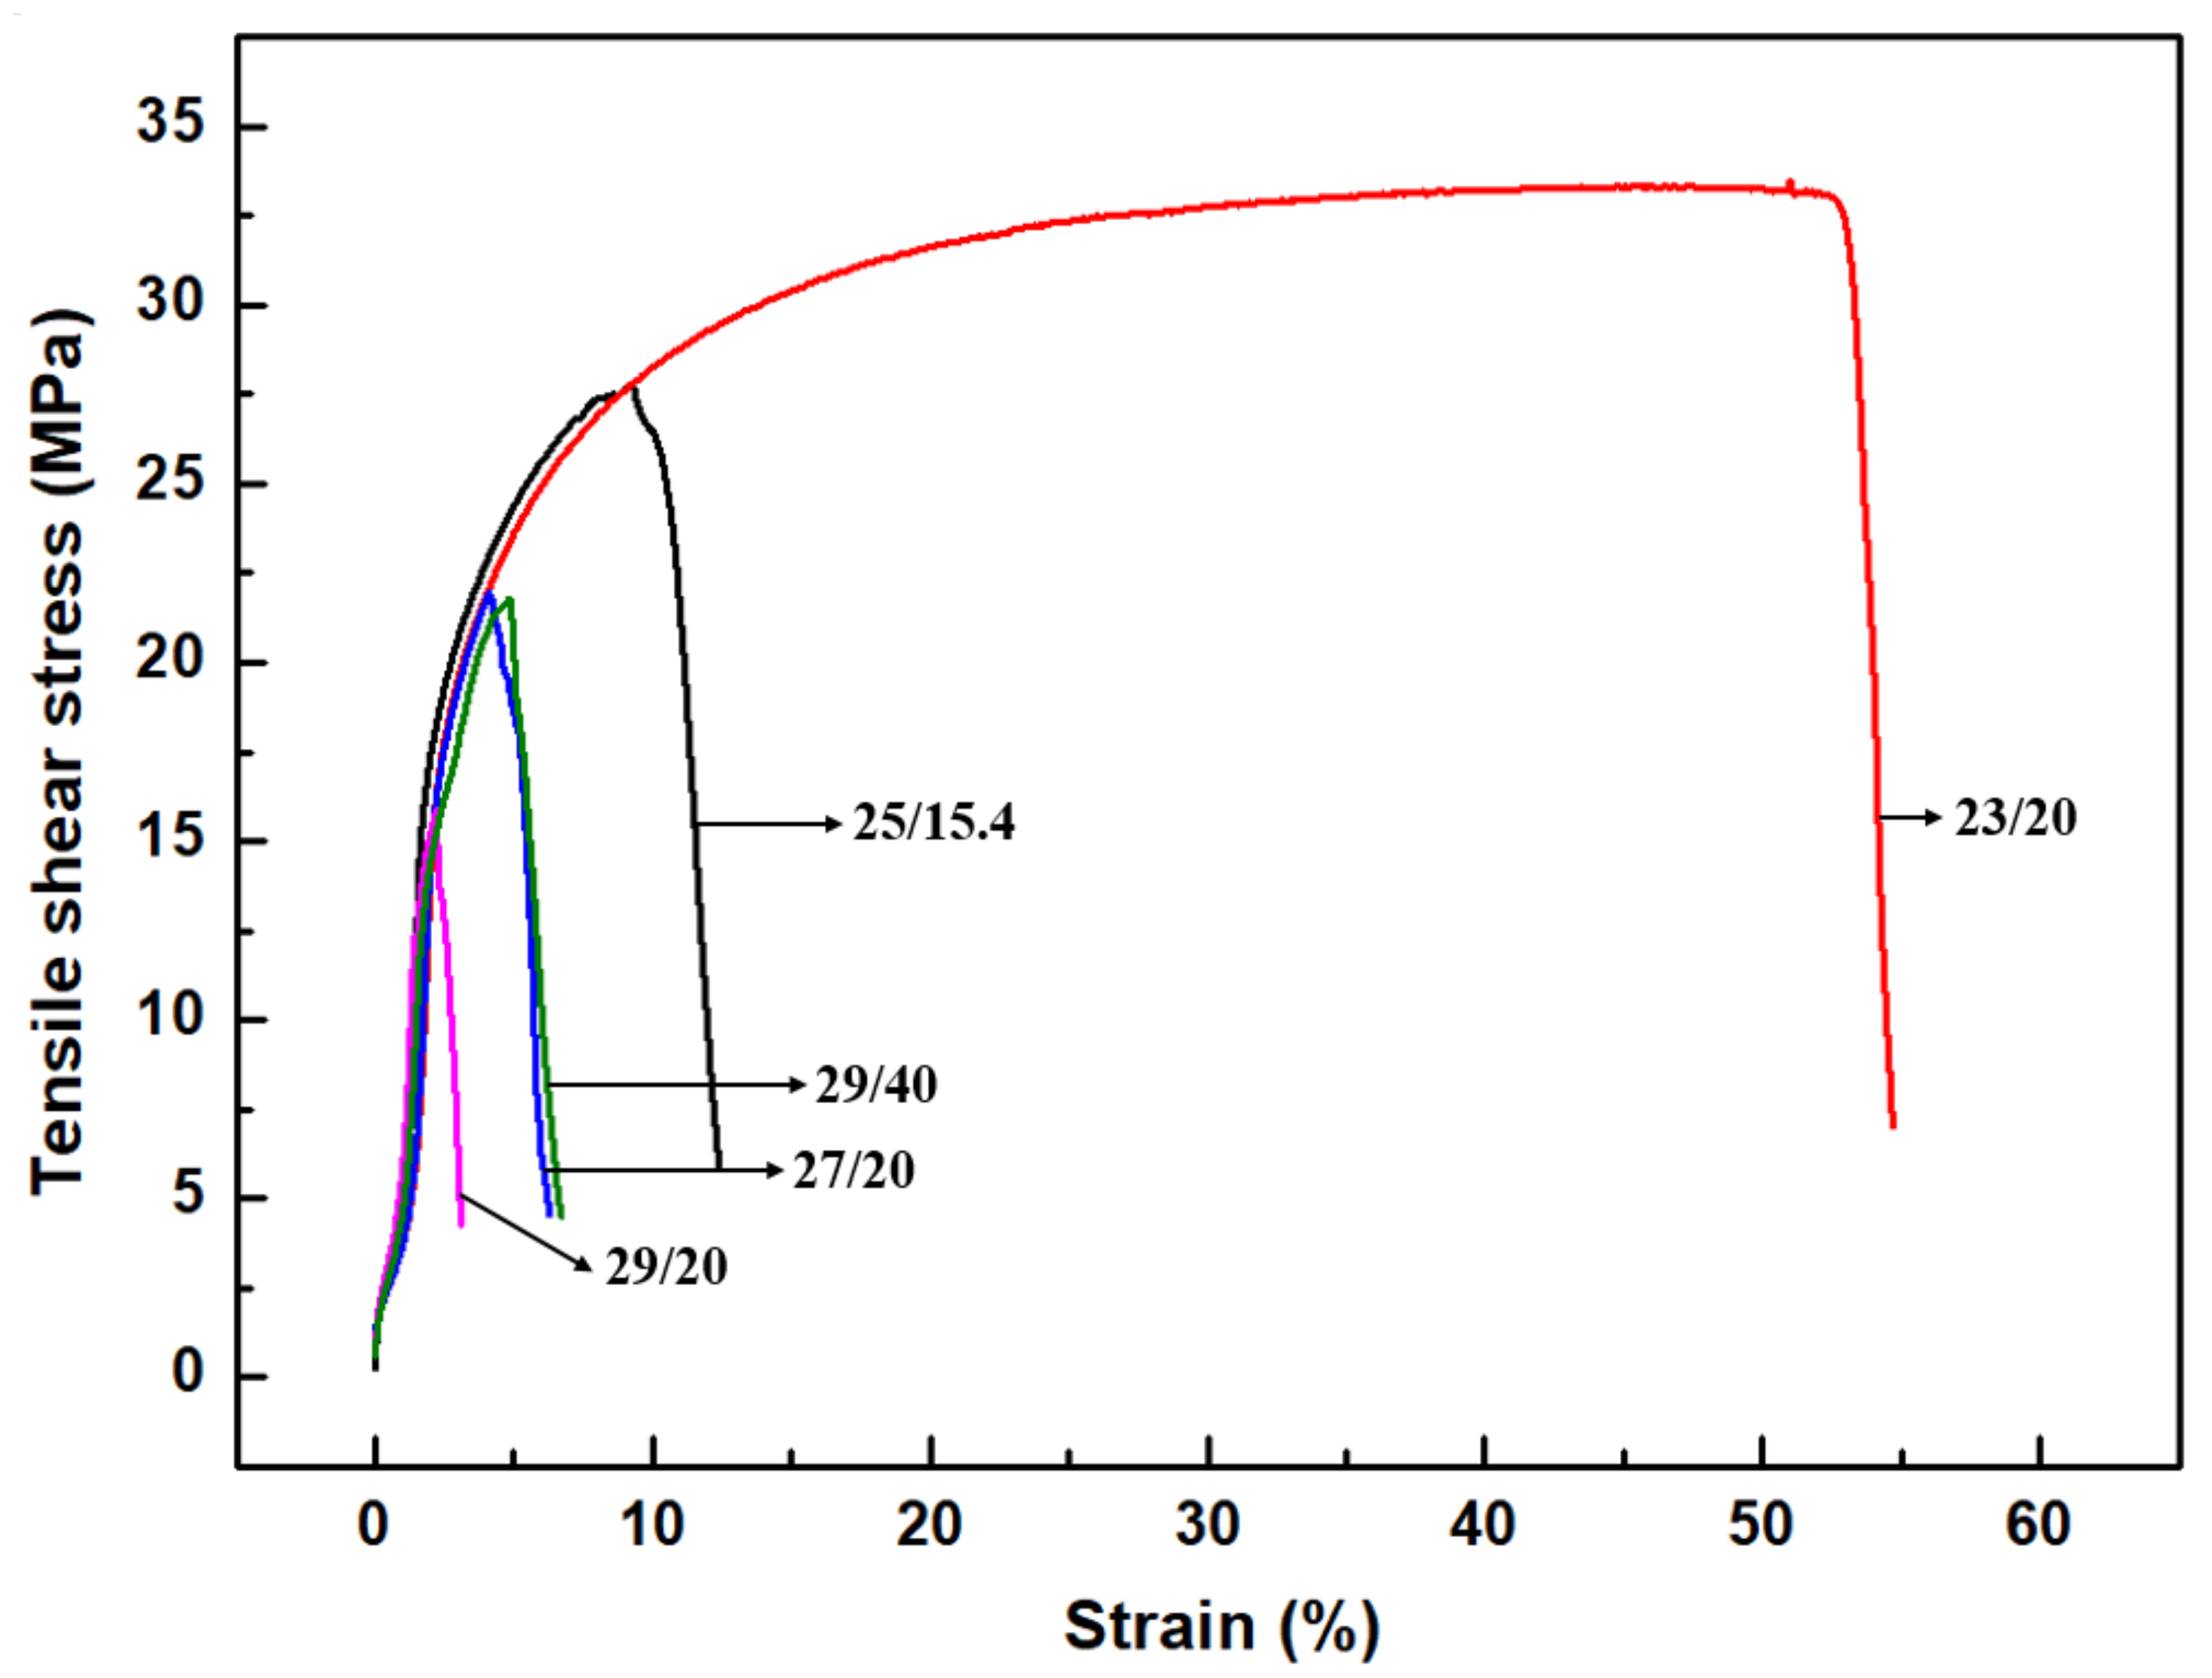
3.3. Microhardness and Tensile Shear Strength
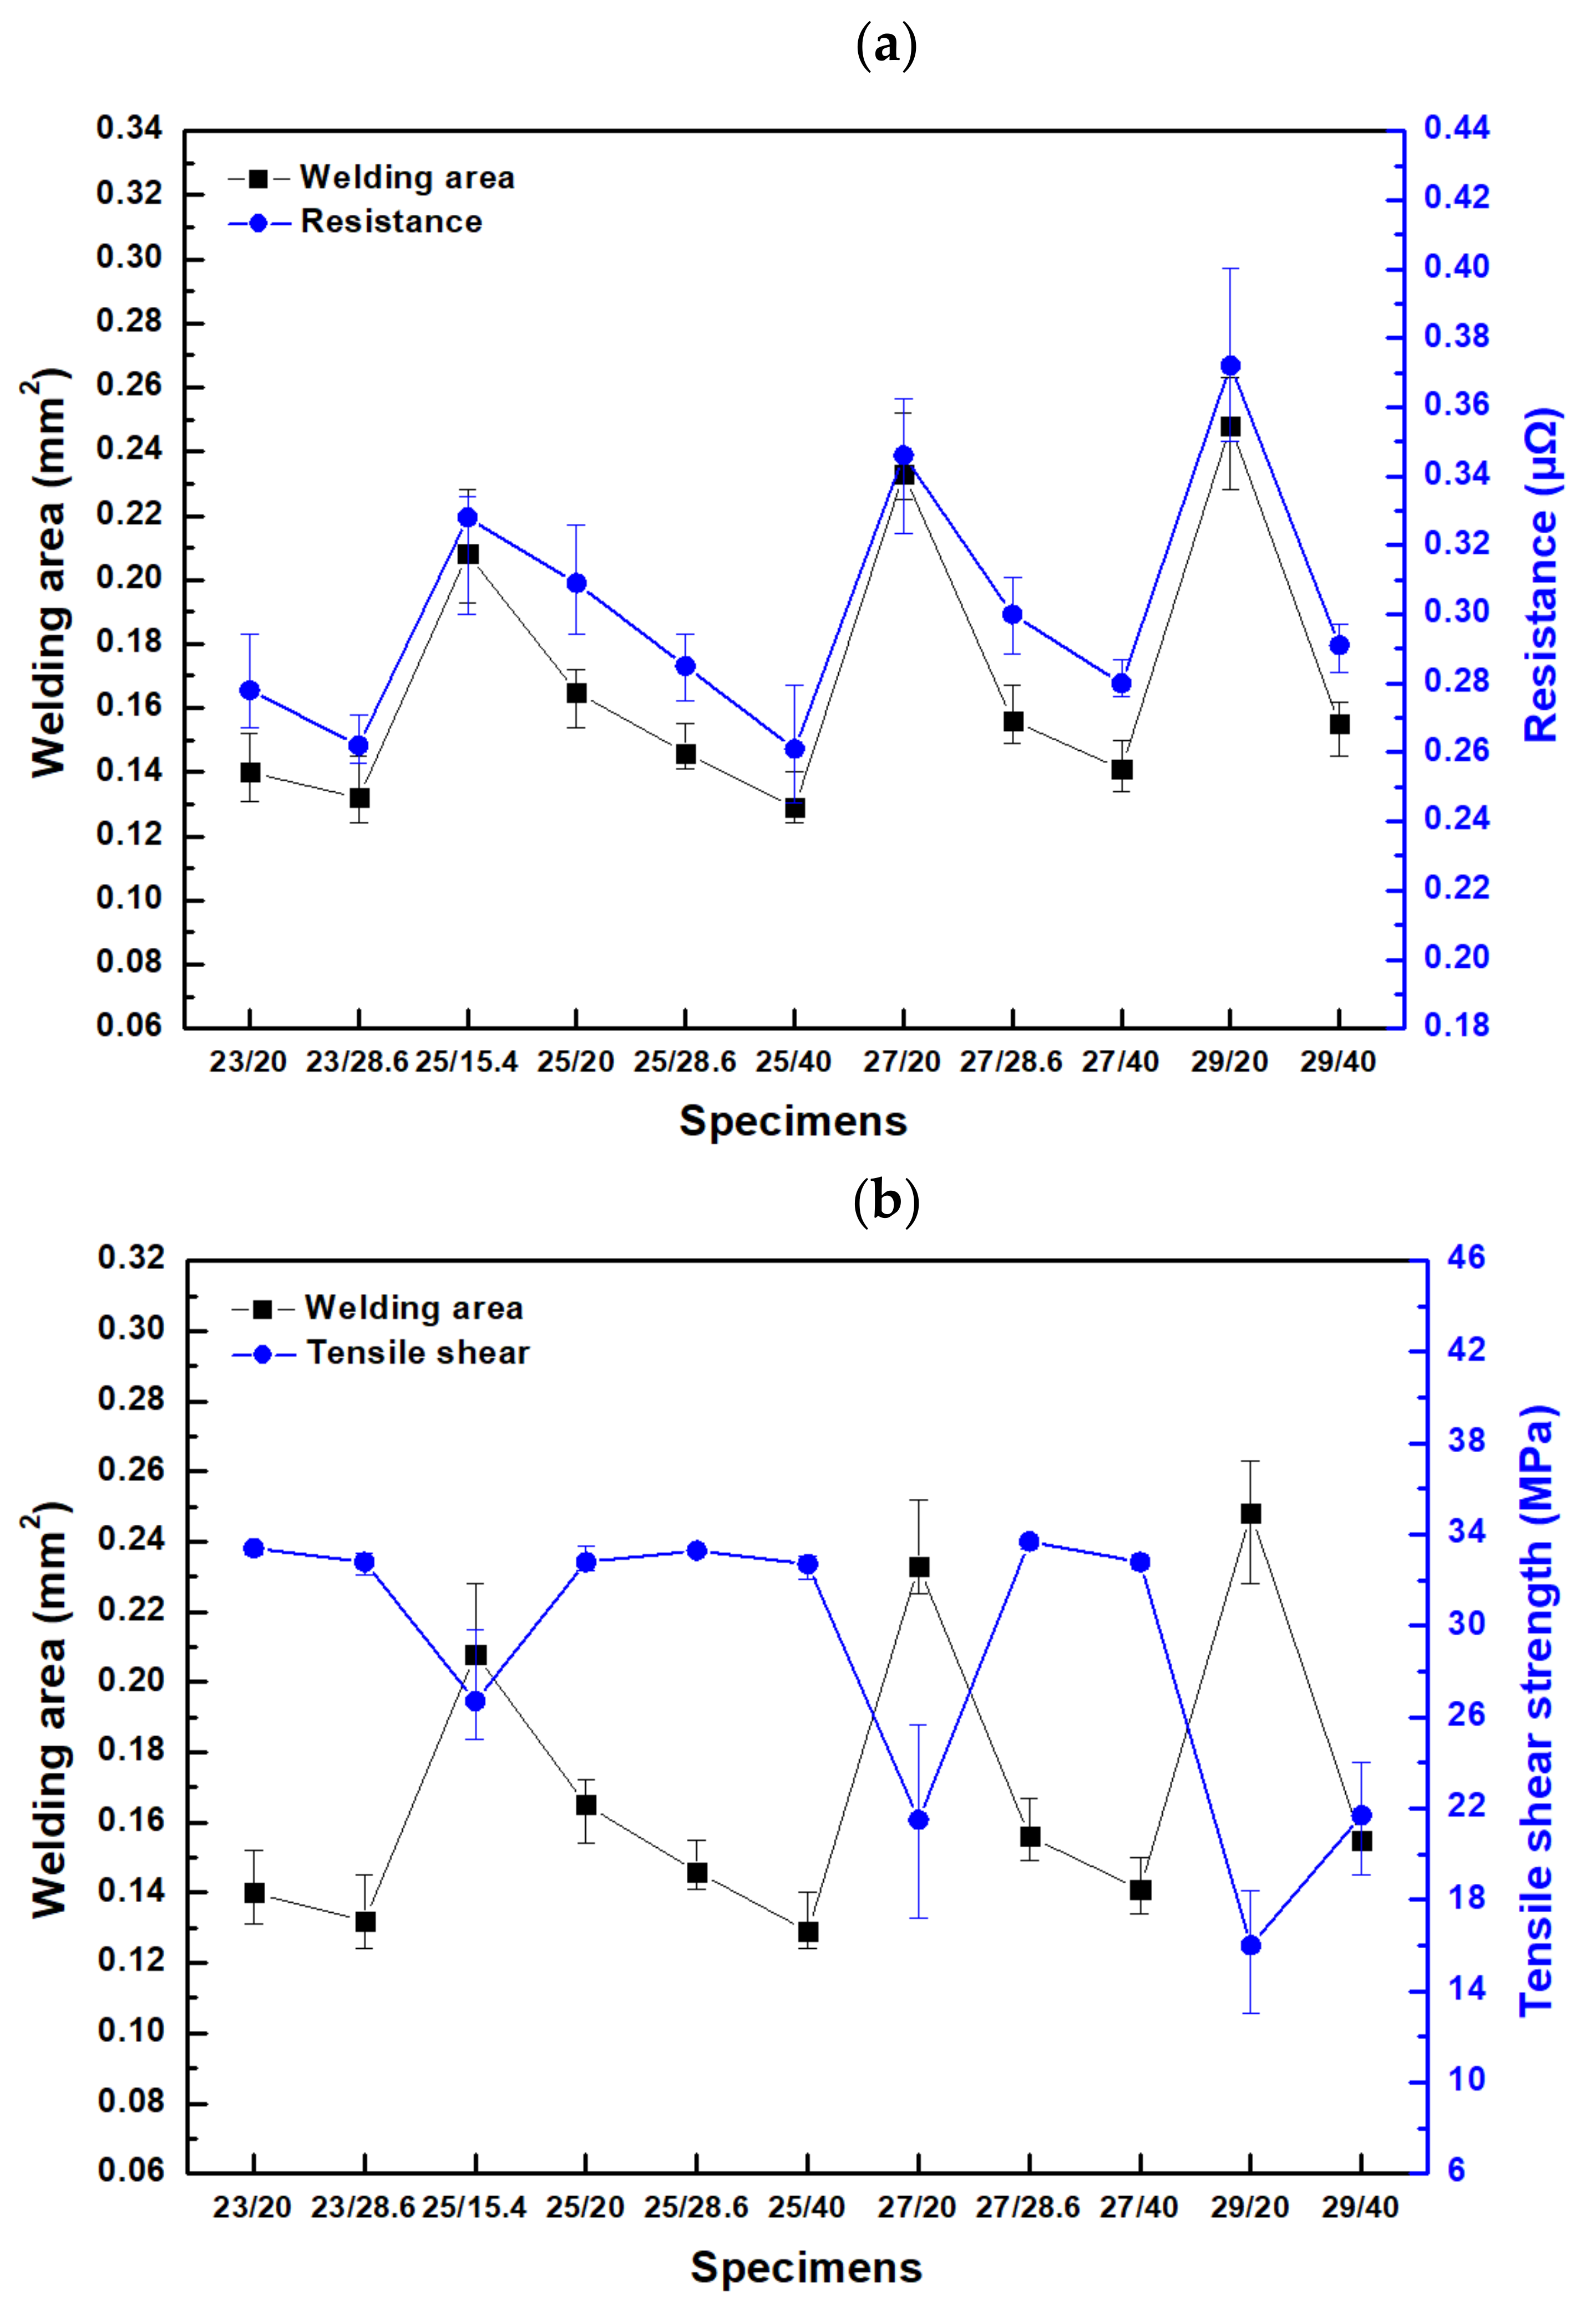
3.4. Correlation between the Welding Area and Electrical and Mechanical Properties
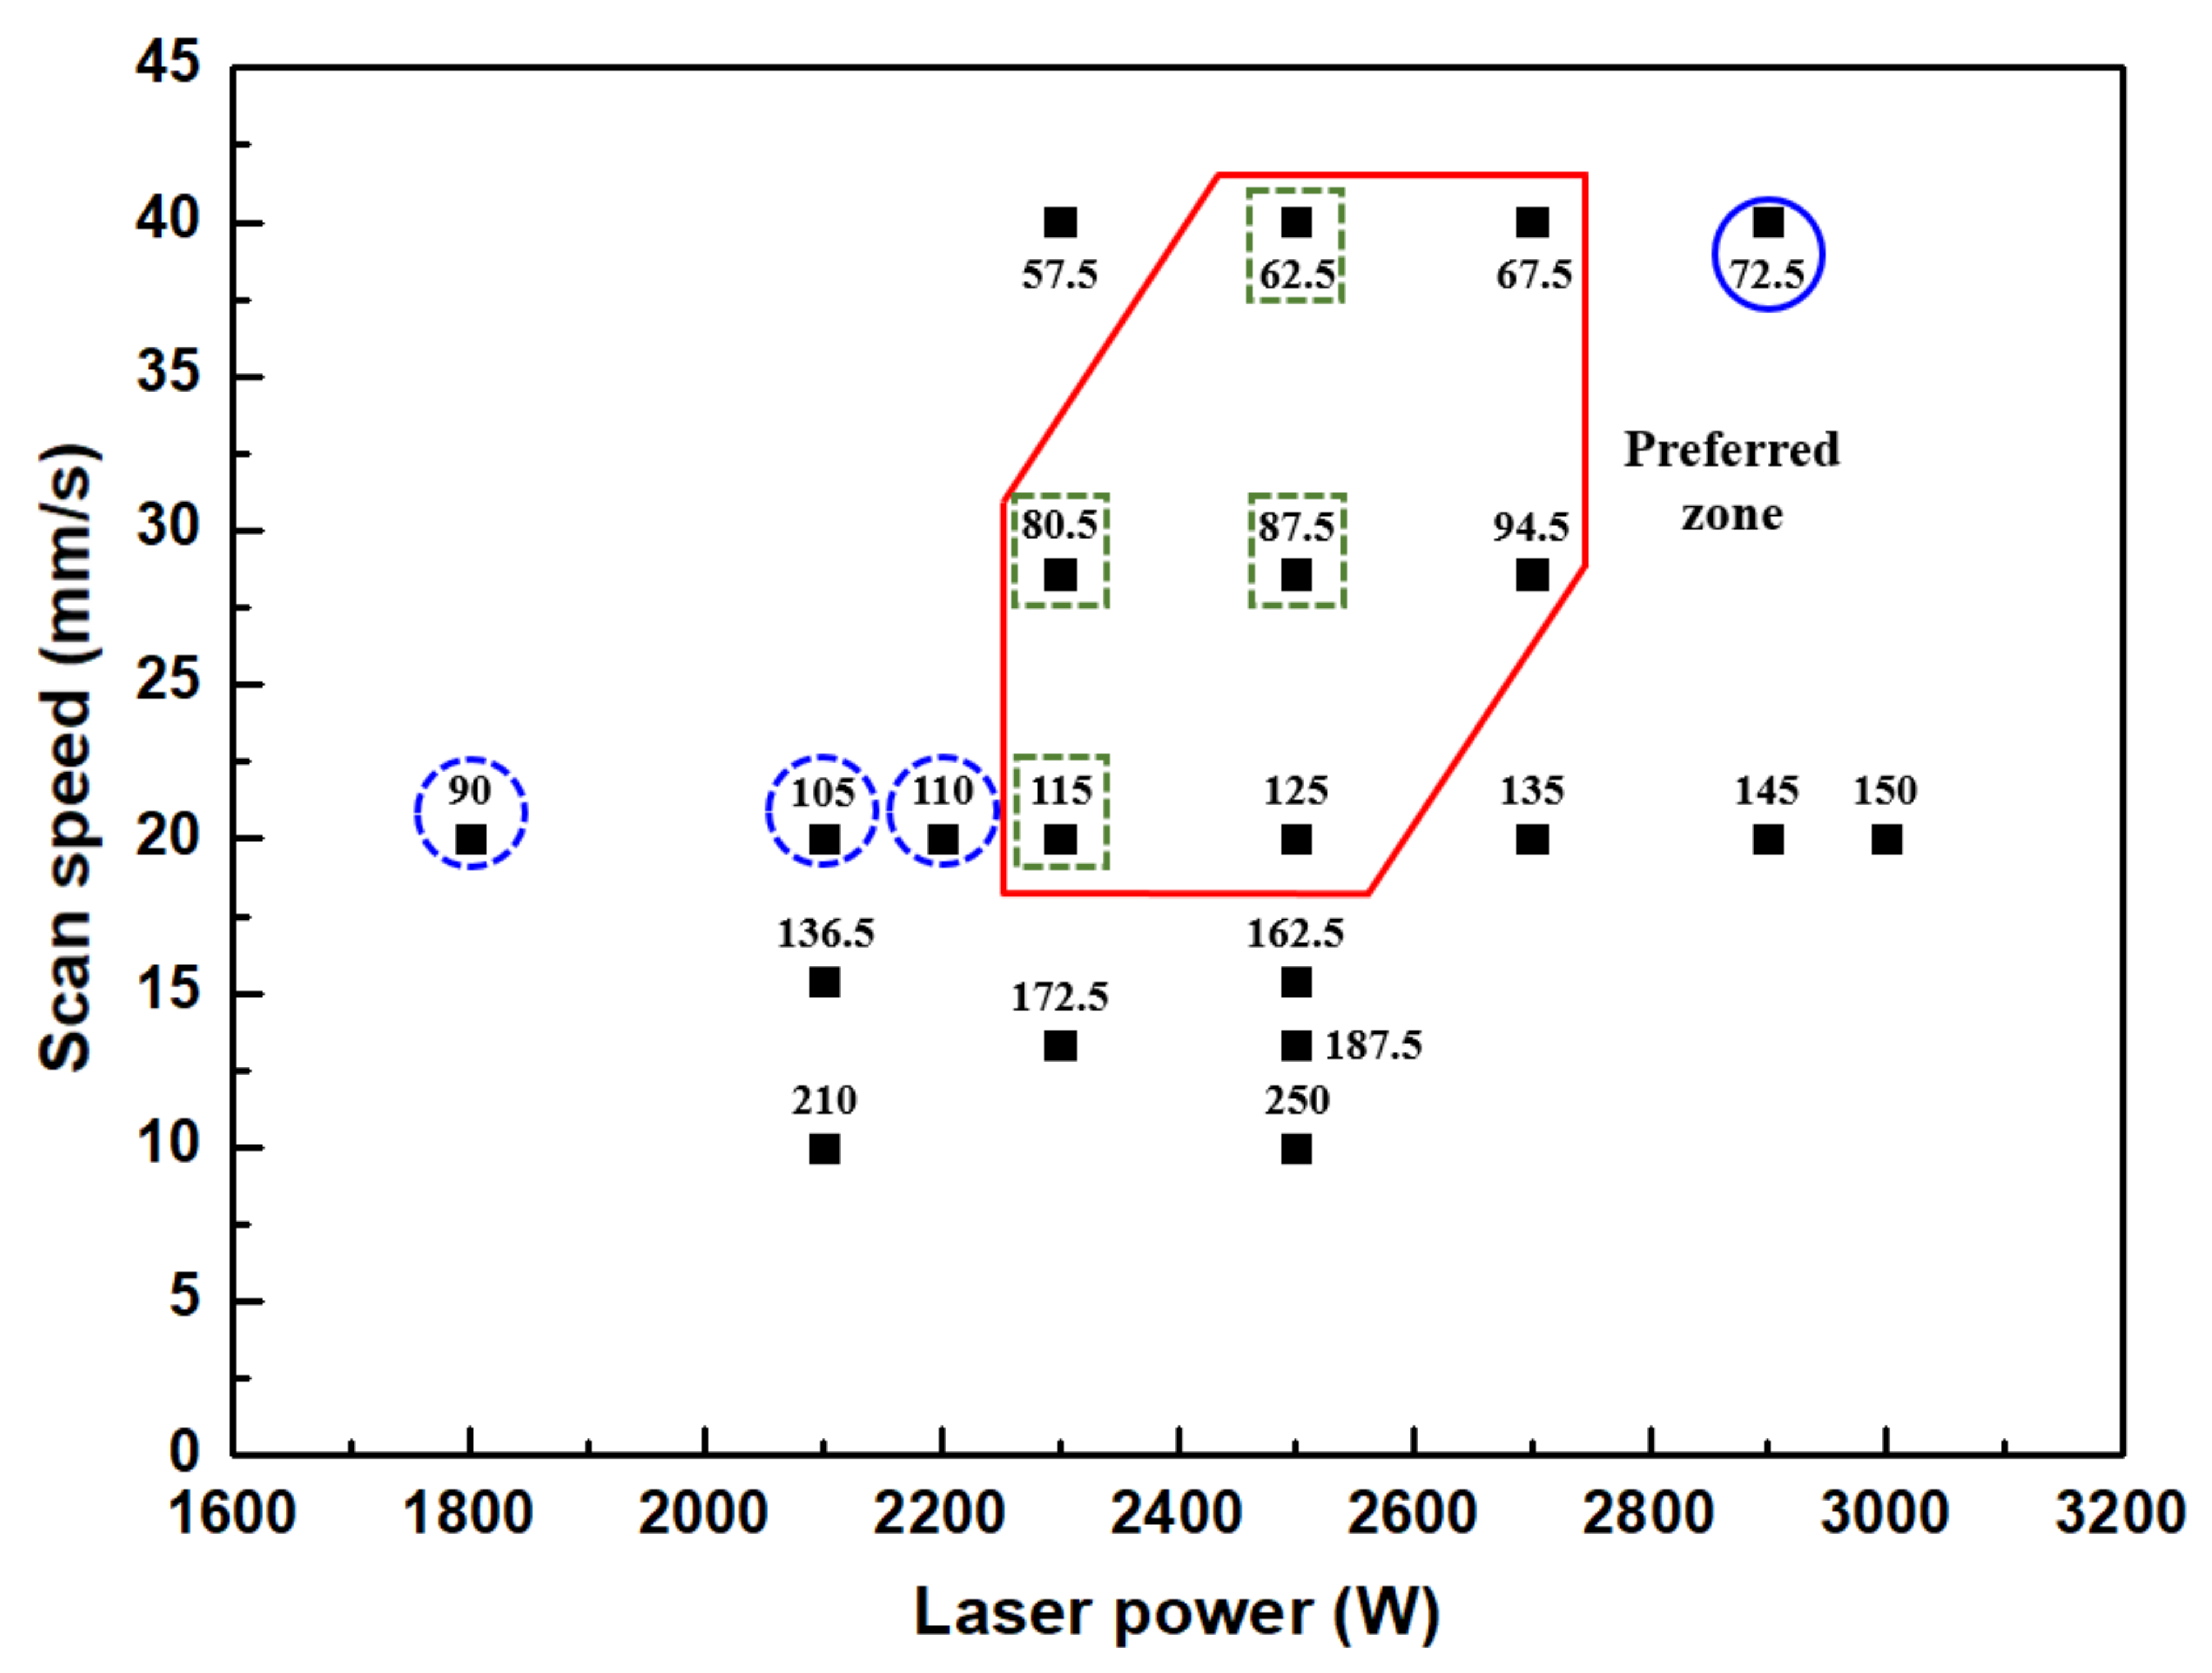
3.5. Development of Process Window
4. Conclusions
Author Contributions
Funding
Data Availability Statement
Conflicts of Interest
References
- Schwartz, M.M.; Aircraft, S. Introduction to Brazing and Soldering. ASM Int. 2018, 6. [Google Scholar] [CrossRef]
- Vianco, P.T. Corrosion issues in solder joint design and service. Weld. J. 1999, 78, 39–46. [Google Scholar]
- Shi, Y.; Li, J.; Zhang, G.; Huang, J.; Gu, Y. Corrosion Behavior of Aluminum-Steel Weld-Brazing Joint. J. Mater. Eng. Perform. 2016, 25, 1916–1923. [Google Scholar] [CrossRef]
- Harman, G.G. Wire Bonding in Microelectronics: Materials, Processes, Reliability and Yield, 3rd ed.; McGraw-Hill Education: New York, NY, USA, 2010; ISBN 9780071642651. [Google Scholar]
- Aonuma, M.; Nakata, K. Dissimilar metal joining of ZK60 magnesium alloy and titanium by friction stir welding. Mater. Sci. Eng. B Solid State Mater. Adv. Technol. 2012, 177, 543–548. [Google Scholar] [CrossRef]
- Sasaki, T.; Watanabe, T.; Hosokawa, Y.; Yanagisawa, A. Analysis for relative motion in ultrasonic welding of aluminium sheet. Sci. Technol. Weld. Jt. 2012, 18, 19–24. [Google Scholar] [CrossRef]
- Maeda, M.; Sato, T.; Inoue, N.; Yagi, D.; Takahashi, Y. Anomalous microstructure formed at the interface between copper ribbon and tin-deposited copper plate by ultrasonic bonding. Microelectron. Reliab. 2011, 51, 130–136. [Google Scholar] [CrossRef]
- Maeda, M.; Yagi, D.; Takahashi, Y. Interfacial microstructure between copper ribbon and nickel-coated copper plate formed by ultrasonic bonding. Q. J. Jpn. Weld. Soc. 2013, 31, 188–191. [Google Scholar] [CrossRef]
- Sun, Z.; Ion, J.C. Laser welding of dissimilar metal combinations. J. Mater. Sci. 1995, 30, 4205–4214. [Google Scholar] [CrossRef]
- Yan, S.; Hong, Z.; Watanabe, T.; Jingguo, T. CW/PW dual-beam YAG laser welding of steel/aluminum alloy sheets. Opt. Lasers Eng. 2010, 48, 732–736. [Google Scholar] [CrossRef]
- Mehlmann, B.; Gehlen, E.; Olowinsky, A.; Gillner, A. Laser micro welding for ribbon bonding. Phys. Procedia 2014, 56, 776–781. [Google Scholar] [CrossRef]
- Nwanoro, K.C.; Lu, H.; Yin, C.; Bailey, C. An analysis of the reliability and design optimization of aluminium ribbon bonds in power electronics modules using computer simulation method. Microelectron. Reliab. 2018, 87, 1–14. [Google Scholar] [CrossRef]
- Li, H.; Cao, B.; Yang, J.W.; Liu, J. Modeling of resistance heat assisted ultrasonic welding of Cu-Al joint. J. Mater. Process. Technol. 2018, 256, 121–130. [Google Scholar] [CrossRef]
- Davis, J.R. Copper and Copper Alloys. In ASM Speciality Handbook; ASM International: Almere, The Netherlands, 2001; ISBN 2001022956. [Google Scholar]
- Rabkin, D.M.; Ryabov, V.R.; Lozovskaya, A.V.; Dovzhenko, V.A. Preparation and properties of copper-aluminum intermetallic compounds. Sov. Powder Metall. Met. Ceram. 1970, 9, 695–700. [Google Scholar] [CrossRef]
- Chen, C.Y.; Chen, H.L.; Hwang, W.S. Influence of interfacial structure development on the fracture mechanism and bond strength of aluminum/copper bimetal plate. Mater. Trans. 2006, 47, 1232–1239. [Google Scholar] [CrossRef]
- Schmidt, P.A.; Schweier, M.; Zaeh, M.F. Joining of lithium-ion batteries using laser beam welding: Electrical losses of welded aluminum and copper joints. J. Laser Appl. 2012, 915. [Google Scholar] [CrossRef]
- Smith, S.; Blackburn, J.; Gittos, M.; De Bono, P.; Hilton, P. Welding of dissimilar metallic materials using a scanned laser beam. J. Laser Appl. 2013, 493. [Google Scholar] [CrossRef]
- Solchenbach, T.; Plapper, P. Mechanical characteristics of laser braze-welded aluminium-copper connections. Opt. Laser Technol. 2013, 54, 249–256. [Google Scholar] [CrossRef]
- Kraetzsch, M.; Standfuss, J.; Klotzbach, A.; Kaspar, J.; Brenner, B.; Beyer, E. Laser Beam Welding with High-Frequency Beam Oscillation: Welding of Dissimilar Materials with Brilliant Fiber Lasers. Phys. Procedia 2011, 12, 142–149. [Google Scholar] [CrossRef]
- Solchenbach, T.; Plapper, P.; Cai, W. Electrical performance of laser braze-welded aluminum-copper interconnects. J. Manuf. Process. 2014, 16, 183–189. [Google Scholar] [CrossRef]
- Lee, S.J.; Nakamura, H.; Kawahito, Y.; Katayama, S. Effect of welding speed on microstructural and mechanical properties of laser lap weld joints in dissimilar Al and Cu sheets. Sci. Technol. Weld. Jt. 2014, 19, 111–118. [Google Scholar] [CrossRef]
- Mai, T.A.; Spowage, A.C. Characterisation of dissimilar joints in laser welding of steel-kovar, copper-steel and copper-aluminium. Mater. Sci. Eng. A 2004, 374, 224–233. [Google Scholar] [CrossRef]
- Zhang, G.; Takahashi, Y.; Heng, Z.; Takashima, K.; Misawa, K. Ultrasonic weldability of al ribbon to cu sheet and the dissimilar joint formation mode. Mater. Trans. 2015, 56, 1842–1851. [Google Scholar] [CrossRef]
- Zhu, B.; Zhen, L.; Xia, H.; Su, J.; Niu, S.; Wu, L.; Tan, C.; Chen, B. Effect of the scanning path on the nanosecond pulse laser welded Al/Cu lapped joint. Opt. Laser Technol. 2021, 139, 106945. [Google Scholar] [CrossRef]
- Kumar, A.; Gupta, M.P.; Banerjee, J.; Neogy, S.; Keskar, N.; Bhatt, R.B.; Behere, P.G.; Biswas, D.J. Micro-Welding of Stainless Steel and Copper Foils Using a Nano-Second Pulsed Fiber Laser. Lasers Manuf. Mater. Process. 2019, 6, 158–172. [Google Scholar] [CrossRef]
- Trinh, L.N.; Lee, D. The Characteristics of Laser Welding of a Thin Aluminum Tab and Steel Battery Case for Lithium-Ion Battery. Metals 2020, 10, 842. [Google Scholar] [CrossRef]
- Cho, D.W.; Park, J.H.; Moon, H.S. A study on molten pool behavior in the one pulse one drop GMAW process using computational fluid dynamics. Int. J. Heat Mass Transf. 2019, 139, 848–859. [Google Scholar] [CrossRef]
- Cho, W.I.; Na, S.J.; Cho, M.H.; Lee, J.S. Numerical study of alloying element distribution in CO2 laser-GMA hybrid welding. Comput. Mater. Sci. 2010, 49, 792–800. [Google Scholar] [CrossRef]
- Cho, D.W.; Kiran, D.V.; Na, S.J. Analysis of molten pool behavior by flux-wall guided metal transfer in low-current submerged arc welding process. Int. J. Heat Mass Transf. 2017, 110, 104–112. [Google Scholar] [CrossRef]
- Cho, W.-I.; Na, S.-J. Impact of Wavelengths of CO2, Disk, and Green Lasers on Fusion Zone Shape in Laser Welding of Steel. J. Weld. Jt. 2020, 38, 235–240. [Google Scholar] [CrossRef]
- Sim, A.; Chun, E.J.; Cho, D.W. Numerical Simulation of Surface Softening Behavior for Laser Heat Treated Cu-Bearing Medium Carbon Steel. Met. Mater. Int. 2020, 26, 1207–1217. [Google Scholar] [CrossRef]
- Jarwitz, M.; Fetzer, F.; Weber, R.; Graf, T. Weld seam geometry and electrical resistance of laser-welded, aluminum-copper dissimilar joints produced with spatial beam oscillation. Metals 2018, 8, 510. [Google Scholar] [CrossRef]
- Weigl, M.; Albert, F.; Schmidt, M. Enhancing the ductility of laser-welde copper-aluminum connections by using adapted filler materia. Phys. Procedia 2011, 12, 335–341. [Google Scholar] [CrossRef]
- Chen, J.; Lai, Y.S.; Wang, Y.W.; Kao, C.R. Investigation of growth behavior of Al-Cu intermetallic compounds in Cu wire bonding. Microelectron. Reliab. 2011, 51, 125–129. [Google Scholar] [CrossRef]
- Chen, H.; Yang, L.; Long, J. First-principles investigation of the elastic, Vickers hardness and thermodynamic properties of Al-Cu intermetallic compounds. Superlattices Microstruct. 2015, 79, 156–165. [Google Scholar] [CrossRef]
- Liu, H.J.; Shen, J.J.; Zhou, L.; Zhao, Y.Q.; Liu, C.; Kuang, L.Y. Microstructural characterisation and mechanical properties of friction stir welded joints of aluminium alloy to copper. Sci. Technol. Weld. Jt. 2011, 16, 92–99. [Google Scholar] [CrossRef]
- Hug, E.; Bellido, N. Brittleness study of intermetallic (Cu, Al) layers in copper-clad aluminium thin wires. Mater. Sci. Eng. A 2011, 528, 7103–7106. [Google Scholar] [CrossRef]
- Braunović, M.; Alexandrov, N. Intermetallic Compounds At Aluminum-To-Copper Electrical Interfaces: Effect of Temperature And Electric Current. IEEE Trans. Compon. Packag. Manuf. Technol. Part A 1994, 17, 78–85. [Google Scholar] [CrossRef]
- Lee, W.B.; Bang, K.S.; Jung, S.B. Effects of intermetallic compound on the electrical and mechanical properties of friction welded Cu/Al bimetallic joints during annealing. J. Alloys Compd. 2005, 390, 212–219. [Google Scholar] [CrossRef]


| Number | Specimen | Laser Power (W) | Scan Speed (mm/s) | Heat Input (J/mm) |
|---|---|---|---|---|
| 1 | - | 1800 | 20 | 90 |
| 2 | - | 2100 | 10 | 210 |
| 3 | - | 2100 | 15.4 | 136.5 |
| 4 | - | 2100 | 20 | 105 |
| 5 | - | 2200 | 20 | 110 |
| 6 | - | 2300 | 10 | 172.5 |
| 7 | - | 2300 | 13.3 | 172.5 |
| 8 | 23/20 | 2300 | 20 | 115 |
| 9 | 23/28.6 | 2300 | 28.6 | 80.5 |
| 10 | - | 2500 | 10 | 250 |
| 11 | - | 2500 | 13.3 | 187.5 |
| 12 | 25/15.4 | 2500 | 15.4 | 162.5 |
| 13 | 25/20 | 2500 | 20 | 125 |
| 14 | 25/28.6 | 2500 | 28.6 | 87.5 |
| 15 | 25/40 | 2500 | 40 | 62.5 |
| 16 | 27/20 | 2700 | 20 | 135 |
| 17 | 27/28.6 | 2700 | 28.6 | 94.5 |
| 18 | 27/40 | 2700 | 40 | 67.5 |
| 19 | 29/20 | 2900 | 20 | 145 |
| 20 | 29/40 | 2900 | 40 | 72.5 |
| 21 | - | 3000 | 20 | 150 |
| Symbol | Nomenclature | Symbol | Nomenclature |
|---|---|---|---|
| Density (2.8 g/cm3) | P | Pressure on the free surface boundary | |
| Velocity vector | Radius of the surface curvature | ||
| Kinematic viscosity (0.013 gm/cm/s) | Surface tension | ||
| Body force | Surface tension at the melting temperature, 1000 dyne/cm | ||
| Enthalpy | Material temperature | ||
| Enthalpy source of droplet | Laser heat efficiency, 0.075 | ||
| Thermal conductivity Al: 1.87 × 10⁷ erg/s/cm/L Cu: 3.37 × 10⁷ erg/s/cm/L | Laser power (W) | ||
| Specific heat 1.093 × 10⁷ erg/gm/L | Surface tension gradient Negative: −0.3 dyne/cm/T Positive: 0.3 dyne/cm/T | ||
| Enthalpy of solid | Laser beam radius | ||
| Enthalpy between solid and liquid 3.89 × 109 cm2 /s2 | Heat input from laser | ||
| Solidus temperature, 850 K | Heat loss from convection | ||
| Liquidus temperature, 775 K | Heat loss from radiation | ||
| Normal vector to free surface | Heat loss from evaporation |
| Specimen | Intermetallic Compounds |
|---|---|
| 23/20 | AlCu2, Al8Cu, AlCu8 |
| 25/28.6 | Al2Cu, Al4Cu9, Al13Cu, Al9Cu11 |
| 25/15.4 | Al2Cu3, Al3Cu2, AlCu3, Al3Cu, AlCu, Al8Cu |
| 27/20 | Al2Cu3, AlCu2, AlCu3, AlCu7, AlCu |
| Case | Laser Power (W) | Scan Speed (mm/s) | Surface Tension at Melting Temperature (dyne/cm) | Surface Tension Gradient (dyne/cm/K) |
|---|---|---|---|---|
| 1 | 2300 | 20 | 1000 | −0.2 |
| 2 | 2500 | 15.4 | 1000 | −0.2 |
| 3 | 2500 | 15.4 | 1000 | 0.2 |
| 4 | 2500 | 15.4 | - | - |
| Specimens | Tensile Shear Strength (MPa) | Electrical Resistance (μΩ) | Welding Area (mm2) |
|---|---|---|---|
| 23/20 | 33.4 | 0.278 | 0.140 |
| 23/28.6 | 32.8 | 0.262 | 0.132 |
| 25/15.4 | 26.7 | 0.328 | 0.208 |
| 25/20 | 32.8 | 0.309 | 0.165 |
| 25/28.6 | 33.3 | 0.285 | 0.146 |
| 25/40 | 32.7 | 0.261 | 0.129 |
| 27/20 | 21.5 | 0.346 | 0.233 |
| 27/28.6 | 33.7 | 0.300 | 0.156 |
| 27/40 | 32.8 | 0.280 | 0.141 |
| 29/20 | 16 | 0.372 | 0.248 |
| 29/40 | 21.7 | 0.291 | 0.155 |
Publisher’s Note: MDPI stays neutral with regard to jurisdictional claims in published maps and institutional affiliations. |
© 2021 by the authors. Licensee MDPI, Basel, Switzerland. This article is an open access article distributed under the terms and conditions of the Creative Commons Attribution (CC BY) license (https://creativecommons.org/licenses/by/4.0/).
Share and Cite
Shin, W.-S.; Cho, D.-W.; Jung, D.; Kang, H.; Kim, J.O.; Kim, Y.-J.; Park, C. Investigation on Laser Welding of Al Ribbon to Cu Sheet: Weldability, Microstructure, and Mechanical and Electrical Properties. Metals 2021, 11, 831. https://doi.org/10.3390/met11050831
Shin W-S, Cho D-W, Jung D, Kang H, Kim JO, Kim Y-J, Park C. Investigation on Laser Welding of Al Ribbon to Cu Sheet: Weldability, Microstructure, and Mechanical and Electrical Properties. Metals. 2021; 11(5):831. https://doi.org/10.3390/met11050831
Chicago/Turabian StyleShin, Won-Sang, Dae-Won Cho, Donghyuck Jung, Heeshin Kang, Jeng O Kim, Yoon-Jun Kim, and Changkyoo Park. 2021. "Investigation on Laser Welding of Al Ribbon to Cu Sheet: Weldability, Microstructure, and Mechanical and Electrical Properties" Metals 11, no. 5: 831. https://doi.org/10.3390/met11050831
APA StyleShin, W.-S., Cho, D.-W., Jung, D., Kang, H., Kim, J. O., Kim, Y.-J., & Park, C. (2021). Investigation on Laser Welding of Al Ribbon to Cu Sheet: Weldability, Microstructure, and Mechanical and Electrical Properties. Metals, 11(5), 831. https://doi.org/10.3390/met11050831