Abstract
The influences of Li content on the corrosion behavior of TC4 (Ti6Al4V) titanium alloy were explored when the TC4 titanium alloy was immersed in Al–Li alloy melt containing 0%, 1%, and 2% lithium at 680 °C, 700 °C, and 720 °C for 0.5 h, 1 h, and 2 h. The structure and growth law of the diffusion reaction layer at solid–liquid interface were studied, and the growth kinetic equation of the diffusion reaction layer was established. In addition, Ti content in Al–Li alloy melt was determined and its dissolution rate was calculated. The results showed that with the increase of lithium content in the melt, the thickness of the diffusion reaction layer (DRL) between TC4 titanium alloy and the melt increased significantly, and the activation energies of the diffusion reaction obtained were 141.28 kJ·mol−1 in liquid Al, 86.62 kJ·mol−1 in liquid Al–1Li alloy, and 43.42 kJ·mol−1 in liquid Al–2Li alloy, respectively. The dissolution rate of Ti in Al–Li alloy melts increased with the increase of lithium content in melts. When the holding time reached 3 h in a TC4 crucible, the content of Ti dissolved in the Al–2Li alloy melt was 0.105 wt%.
1. Introduction
In recent years, with the increasing development of the aviation industry, the research and development of related materials have entered a new stage. Aluminum–lithium alloy is widely used as structural material in various aircrafts due to its low density, high strength, good corrosion resistance, and fatigue resistance [1,2,3]. In order to obtain high-quality Al–Li alloy products and meet the requirements of the increasingly developed aviation industry, one of the most effective measures is updating the previous outdated melting process and equipment [4,5]. At present, iron-based alloy, such as stainless steels, containers are widely used in the smelting of aluminum alloys. However, the high-temperature molten aluminum alloys have strong chemical activity and corrosion ability, and it is easy to destroy the purity of the melt by dissolving the elements such as iron and nickel in the container and taking them into the melt [6]. In casting, these harmful elements will be introduced into aluminum alloy ingot, forming various thick phases Fe-containing or Ni-containing in the matrix [7,8], which will have a strong splitting effect on the matrix, decreasing the mechanical properties of the alloy, especially plasticity [9,10]. As the most harmful elements in aluminum alloy [11], in the standard of Al alloy for aerospace application, the content of Fe was limited below 0.15 wt% to ensure the mechanical properties are maintained, especially fracture toughness. In order to eliminate the harmful effects of the Fe-containing phase, some researchers use the pure titanium or titanium alloy to fabricate the melting containers and tools [12], due to their superior corrosion [13]. The saturated solubility of titanium in aluminum at 700 is less than 0.21 wt %, which is far less than that of Fe in aluminum. When a certain amount of titanium dissolved in melt, it can also be used as the grain refiner of aluminum alloy to refine the grain size and improve the formability and mechanical properties of final products [14]. Therefore, it is of great theoretical and practical value to study the corrosion behavior of titanium alloy in aluminum–lithium alloy melt. So far, many researchers [15,16,17] have shown that the chemical composition of aluminum alloy melt has a great influence on its corrosion ability. However, there is a lack of research work about the effect of lithium on the dissolution of titanium in aluminum alloy melt, and the evolution and growth law of the diffusion reaction layer (DRL) at the solid–liquid interface. Therefore, the corrosion behavior of TC4 (Ti6Al4V) titanium alloy in the aluminum–lithium alloy melts with different lithium content was explored to establish the growth kinetic equation of diffusion reaction layer (DRL) and determined the dissolved quantity of titanium in the alloy melt. The experimental conditions were designed according to technological parameters used in the industrial production of aluminum–lithium alloy smelting. The study will provide the experimental basis for the optimization of the aluminum–lithium alloy smelting process and equipment up-gradation.
2. Experimental
2.1. Material Preparation
The high purity forms of Al ingot (99.9%), Li ingot (99.9%), and TC4 sheets were selected as raw materials. The nominal composition of TC4 alloy is shown in Table 1. The analyzed chemical composition of the Al–Li alloy was determined by an inductively-coupled plasma atomic emission spectroscope (ICP-AES), which is also listed in Table 1. The dimension of the TC4 sheet was 50 mm × 20 mm× 2 mm. To remove the oxide film, TC4 sheets were polished and cleaned in a bath of acetone before immersing in the melt.

Table 1.
Analyzed chemical composition of TC4 alloy and Al–Li alloy (wt%).
The material preparation was divided into two steps: melting and holding treatment. The melting process was carried out in a medium-frequency induction furnace with a graphite crucible. First, the Al ingot was put in the graphite crucible. After the Al ingot was completely melted and its temperature reached 720 °C, the C2Cl6 was used to degas and the dross was cleared off. The Li ingot was pressed into the melt when the melt temperature fell to 710 °C, and then, molten salt (60% LiCl and 40% LiF) was sprinkled over the surface of the melt as a covering agent to avoid the burning loss of Li. When the melt mixed well, the melting process was finished and the holding treatment process was ready to start. The melt was transferred from the graphite crucible to a preheated corundum (Al2O3) crucible with an inner diameter of 80 mm and a height of 100 mm. At the same time, the TC4 sheet was suspended perpendicularly in the melt. Then, the crucible was transferred to the holding furnace at the temperature of 680 °C, 700 °C, and 720 °C, respectively. Thereafter, the crucibles were taken out after 0.5 h, 1 h, and 2 h, successively, and cooled to room temperature. The Li contents of the melts were 0, 1.0 wt%, and 2.0 wt%, separately. A schematic diagram of the experiment process is shown in Figure 1. In order to explore the effect of the lithium content of Al–Li melt on the corrosion resistance of containers (crucible) made of TC4 titanium alloy, liquid Al alloys with different lithium contents were put into a crucible made of TC4 alloy at 700 °C and held for 0.5 h, 1 h, 2 h, and 3 h. Then, the cooled Al–xLi alloy was taken out from the TC4 alloy crucible.

Figure 1.
Schematic diagram of the experimental process.
2.2. Characterizations and Testing
Samples for microstructure observation were cut at the middle of TC4 sheets. In the experiment, we chose the positions where the reaction layer was flat and uniform in thickness for observation and statistics. The DRL at these positions grow well, which reflects the growth law of reaction layers. The morphology of microstructure in the interface and elemental content was characterized on a SSX-550 (Shimadzu, Kyoto, Japan) scanning electron microscope equipped with an attached energy diverse X-ray spectroscope. The average DRL thickness in the SEM images was measured by Image-Pro Plus (6.0, Media Cybernetics, Rockville, MD, USA). To ensure the accuracy of the experimental data, the DRL thickness values were obtained at different SEM micrographs three times. Based on the measure data, a DRL growth kinetic equation was established. The Ti content of Al–Li alloy was determined by inductively coupled plasma-atomic emission spectrometry (ICP-AES). The ICP analysis was performed on the cooled Al–xLi alloy samples at the center of the ingot three times. In addition, the JXA-8530 (JEOL, Kyoto, Japan) emission electron probe micro analyzer was carried out to analyze the distribution of elements at the interface.
3. Results
3.1. DRL Microstructure and Composition
Figure 2a,c,e shows the microstructures of Al–2Li/TC4 solid/liquid interface after holding at 680 °C for 0.5 h, 1 h, and 2 h, respectively. Figure 2b,d,f is the EDS line scan results of Ti and Al content in the corresponding SEM images. The left side of the SEM image is the solidified structure of the Al–Li alloy, and the right side is the TC4 titanium alloy. In Figure 2a, a diffusion reaction layer (DRL) with a thickness of about 10 μm can be observed between the Al–Li alloy and the TC4 titanium alloy, and a metallurgical bonding formed on both sides of the interface. The interface between the diffusion reaction layer (DRL) and aluminum–lithium alloy side is a zigzag. The interface between DRL and the TC4 side is relatively straight. The entire DRL is dense solid. It can be observed from the EDS line scanning result in Figure 2b that the closer to the TC4 titanium alloy side, the lower the Al content is in DRL, which indicates that the Ti element was continuously dissolved by the melt and the Al element was continuously diffused to DRL. As the holding time increased, the TC4 alloy was corroded and DRL became thicker. When holding 1 h, DRL divided into two parts, dense solid layer with cracks near TC4 and granular phases near the Al–2Li alloy, as shown in Figure 2c. Some protrusions formed at the interface between DRL and the TC4 titanium alloy. It can be observed from the EDS line scanning result in Figure 2d, that no matter what the dense reactant near the TC4 titanium alloy side or the granular particles on the aluminum–lithium melt side was, the energy spectrum intensity of Al and Ti were consistent, which shows that these reactants in DRL have the same composition. It is not difficult to find, from Figure 2e, that when the holding time was further extended, the TC4 alloy was significantly corroded, and the interface between the DRL and the TC4 titanium alloy became tortuous, and many protrusions appeared. The thickness of the DRL gradually increased with the further increase in the holding time. The area of the granular phase in DRL was also increasing, and the size of many granular reactants became smaller. It can be found from Figure 2f that, near the aluminum–lithium melt side, the energy spectrum intensity lines of Al and Ti elements fluctuate greatly many times. This shows that the granular reactants in DRL are independent of each other and have a large gap. The EDS analysis was performed to identify the phase composition of points A–C in Figure 2e, and the results are listed in Table 2. Combined with Al–Ti binary phase diagram [16], it can be inferred that the small rod-like phase (point A), the granular phase (point B), and dense solid (point C) close to the TC4 alloy are an Al3Ti compound. The Al3Ti phase is the only type of reactant in this study, because the Al3Ti phase has the lowest formation energy compared with AlTi, Al5Ti2, AlTi3, Al2Ti, and other phases [18,19].
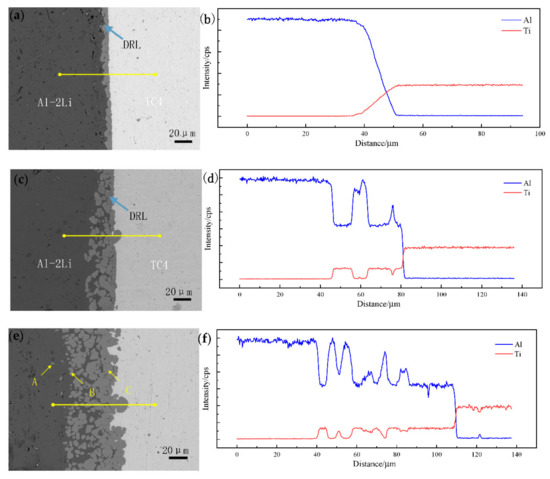
Figure 2.
Morphologies of DRL and EDS line scanning of TC4/Al–2Li; (a,b) 680 °C/0.5 h; (c,d) 680 °C/1 h; (e,f) 680 °C/2 h.

Table 2.
EDS analysis of the results in Figure 2 (at.%).
Figure 3 is the area scanning image of the Al–2Li/TC4 solidified structure interface after holding at 720 °C for 2 h by EPMA. In the figure, the distribution of each element is represented by different colors and brightness. As shown in Figure 3a–c, Al element is mainly distributed in the left of the interface, and only a small amount of Al diffuses into DRL. The Ti element is not only distributed in DRL, but also in melt far from the interface. Therefore, this shows that when the TC4 titanium alloy is held in the Al–2Li alloy melt at 720 °C for 2 h, the Ti atoms do not undergo large, long distance diffusion from the interface to the alloy melt. Most Ti atoms exist in the diffusion reaction layer in the form of Al3Ti.

Figure 3.
Element distribution on the interface (a) SEM photo; (b) Al; (c) Ti.
3.2. Growth Kinetics of Diffusion Reaction Layer
Figure 4 shows the influence of holding time and lithium content on the interfacial microstructure at 700 °C. In general, with the extension of the holding time, the average thickness of diffusion reaction layer increases. In the melt with high lithium content, the thickness of the diffusion reaction layer increases rapidly, while in the melt with low lithium content, the increase in the thickness of the diffusion reaction layer is not obvious. The addition of lithium enhanced the corrosion ability of Al melt to TC4 alloy. When TC4 alloy in Al melt without lithium, the microstructure of the diffusion reaction layer at the solid–liquid interface is thin and dense. DRL is only 10 μm when the holding time reaches 2 h. However, in the case of Al–2Li, both sides of the diffusion reaction layer are uneven. When the holding time reaches 2 h, the distribution of metal compounds in DRL is loose or even independent. In order to explore the growth law of diffusion reaction layer with different lithium content, the thickness of the diffusion reaction layer in the melt was measured at the temperatures of 680 °C, 700 °C, and 720 °C and the holding times of 0.5 h, 1 h, and 2 h, respectively, as shown in Table 3, from which the growth kinetic equation of the diffusion reaction layer was established.
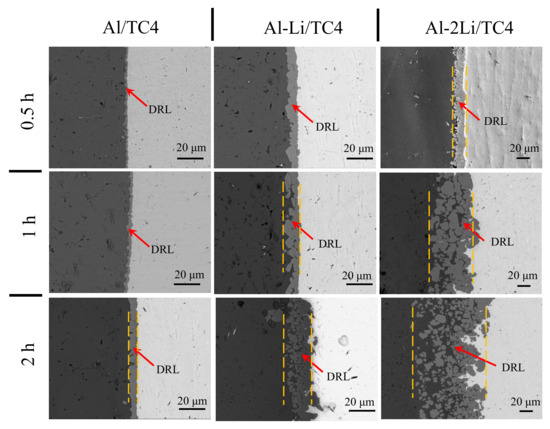
Figure 4.
Influence of holding time and Li content of the melt on the micro-structural morphology at 700 °C.

Table 3.
Measurements of thickness of DRL.
As the corrosion of aluminum–lithium alloy melt to TC4 alloy belongs to the diffusion corrosion, the growth law of diffusion reaction layer thickness can be expressed as Equation (1).
Take the logarithm of the Equation (1):
where d is the thickness of diffusion reaction layer, mm; t is the holding time, min; K is the growth coefficient of diffusion reaction layer; n is the growth index. According to the experimental data in Table 3, the relationship between lnd and lnt was plotted, and the values of n and lnK were obtained by linear fitting, and the results are shown in Figure 5.
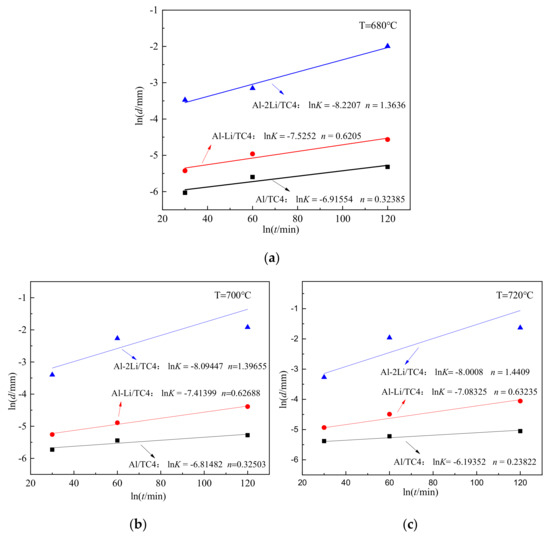
Figure 5.
The relationship between the logarithm of DRL thickness and holding time; (a) 680 °C; (b) 700 °C; (c) 720 °C.
According to the Arrhenius equation [19], the relationship between K and the reaction temperature T should be as follows:
Take the logarithm of the Equation (3):
where K0 is the constant of the growth coefficient; Q is the activation energy of growth, J·mol−1; R is the gas constant (8.314 J·mol−1·K−1). According to the data obtained in Table 3, the relationship between lnK and 1/T is drawn, as shown in Figure 6.
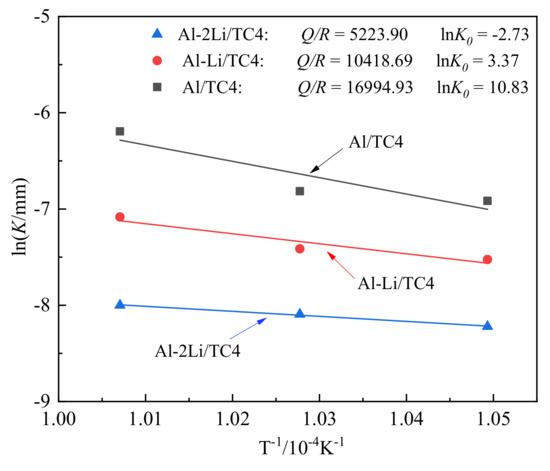
Figure 6.
Temperature dependence of K for TC4 in liquid Al–xLi alloy.
According to the linear fitting slope in Figure 6, the diffusion activation energies of DRL growth for TC4 alloy in melts of Al, Al–1Li, and Al–2Li were calculated, and the obtained values were 141.28 kJ·mol−1, 86.62 kJ·mol−1, and 43.42 kJ·mol−1, respectively. It can be seen that the addition of lithium can significantly reduce the diffusion activation energy between the melts and TC4 alloy. According to the above analysis and calculation data, the growth kinetic equation of the diffusion reaction layer at the solid–liquid interface can be established. Taking the Al–1Li/TC4 liquid–solid interface diffusion reaction couple as an example, the growth kinetic equation of the reaction products is:
where d is the thickness of DRL, μm; T is the heat preservation temperature, K; t is the heat preservation time, min; n is the growth index, and the average value is 0.628.
3.3. Effect of Lithium on the Dissolution Rate of Titanium
In order to explore the effect of lithium content of Al–Li melt on the corrosion of containers made of TC4 titanium alloy in industrial production, the dissolution rate of titanium was studied by simulating the process conditions in industrial production. Liquid Al alloys with different lithium content were put into a crucible made of TC4 alloy at 700 °C and held for a certain period of time. ICP analysis was performed on the samples after air-cooling. The concentrations of Ti in the alloy are listed in Table 4. After converting the data to the number of dissolved moles of Ti per unit melt contact area, the relationship between Ti and the holding time was plotted and Figure 7 was obtained, and the slope R of linear regression was obtained, namely, the dissolution rate of Ti per unit melt contact area.

Table 4.
Dependence of concentration of Ti in the melt on holding time.
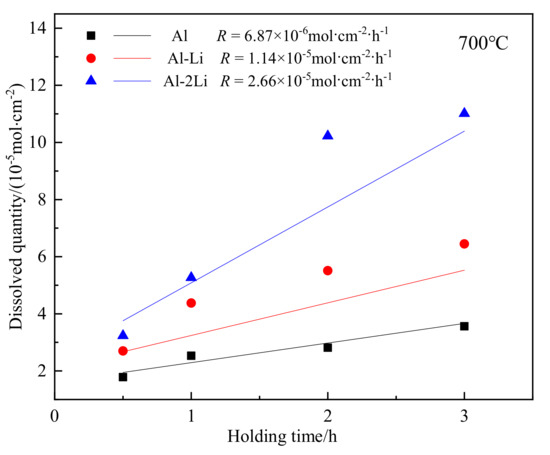
Figure 7.
Influence of Li content of the melt on dissolution rates of Ti.
4. Discussion
4.1. The Structure Evolution of DRL
According to the microstructure evolution at the interface of Al–xLi/TC4 alloys as shown in Figure 4, the evolution process of DRL with increases in holding time can be divided into three steps, as shown in Figure 8.
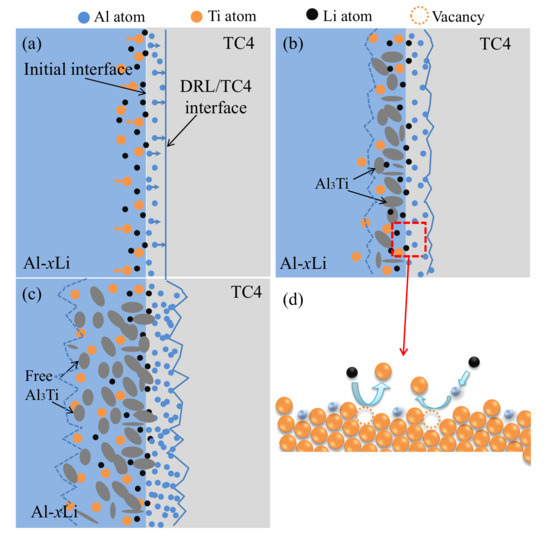
Figure 8.
Conceptual model of structural evolution in Al–xLi/TC4 liquid–solid interface diffusion layer. (a) Formation of primary Al3Ti laye (b) Growth of Al3Ti layer (c) Granular Al3Ti particles separated from the Al3Ti layer (d) Atomic diffusion diagram.
- (1)
- Formation ofAl3Ti layer at the interface of solid TC4 and liquid Al–xLi alloy:
The liquid Al–xLi alloys wet TC4 sheet and spread out to the surface of TC4 rapidly under capillary action after TC4 was immersed into Al–xLi melts [20]. Al ions in liquid Al–xLi alloy diffused to TC4 through the liquid and solid interface, and Ti ions in TC4 alloy diffused to liquid Al–xLi alloy as well, as shown in Figure 8a. Dissolved Al load at interface increased with increases in holding time, which resulted in dissolved quality saturation of Al and formation of AlTi3 layer between solid TC4 and liquid Al–xLi alloy, due to combining Ti with Al atoms, as shown in Figure 8b.
- (2)
- Formation of granular Al3Ti near Al3Ti layer:
Al3Ti layer grows up with increases in holding time, its volume expands because the density of the TC4 alloy (4.5 g/cm3) is higher than that of Al3Ti (3.4 g/cm3). The internal stress is produced in the Al3Ti layer because of the growth resistance and the crackles formed in the Al3Ti layer when stress reaches its breaking strength, which results in infiltration of liquid Al–xLi alloy into crackles, growth of crackles, and formation of granular Al3Ti. The granular Al3Ti particles separated from the Al3Ti layer and scattered in liquid Al–xLi alloy near the Al3Ti layer, as shown in Figure 8c.
- (3)
- Growth of Al3Ti layer and generation of small Al3Ti particles:
The Al atoms diffuse into the Al3Ti layer farther along crackles with increases in holding time [20]. More protrusions appeared in the TC4 side owing to fast growth of the Al3Ti layer at these points resulting from deep cracks and short diffusion distance [21]. At the same time, the size of Al3Ti particles in the Al–xLi alloy liquid became smaller continually, because they were dissolved by liquid Al–xLi alloy, which formed rod-like Al3Ti particles and these particles were dissociated in liquid Al–xLi alloy, as shown in Figure 8d.
4.2. Influence Mechanism of Lithium on Diffusion Reaction Layer
It is well known that diffusion is the directed migration of atoms, whose driving force is the concentration difference of chemical composition at two sides of interface. When temperature rises, the diffusion speed and migration speed increases because atom momentum enhances [22,23]. The atoms are present in ion state in liquid metals. The activity of the ions increases obviously with the decrease in the bounding force of the atoms. Alloying elements also have an effect on the diffusion behavior of the atoms in matrix [17,24]. The migration speed of Li ions is very high because of their high chemical activity and the higher the diffusion coefficient in liquid Al–Li alloys [25]. The Li ions accelerate migration of Al ions in liquid Al–Li alloys, because they drag Al ions owing to large difference in electro-negativity between Al and Li ions, i.e., Li ions accelerate the diffusion speed of Al ions to TC4 alloy in this study, which can be found in the diffusion activation energies of DRL growth for TC4 alloy in Al melts with different Li content, as shown in Figure 5. The diffusion activation energies of DRL growth in Al melts without Li is 141.28 kJ·mol−1; that decreases in Al melts with 1% Li 86.62 kJ·mol−1 and drops dramatically to 43.42 kJ·mol−1. From DRL thickness when TC4 alloy is immersed in pure Al, Al–1Li, and Al–2Li melts for 120 min at 720 °C, as shown in Table 3, the thickness of DRL in Al melt is 6.4 μm only, that in Al–1Li melt increases to 17.3 μm, and that in Al–2Li melt enhances to 186.2 μm, which means that the Li accelerates the corrosion of TC4 alloy in Al–xLi melt.
5. Conclusions
- (1).
- After immersing at 680 °C to ~720 °C for 0.5 h to ~2 h, a diffusion reaction layer (DRL) composed of an Al3Ti compound was formed at the liquid/solid interface of Al–Li alloy melt/TC4 alloy. The DRL thickness increased with increases in holding time, temperature, and lithium content in the melt.
- (2).
- The lithium reduced the activation energy of the diffusion reaction and increased the ability of melt to dissolve the TC4 titanium alloy. At 700 °C, the growth kinetic equation of DRL is as follows:
- (3).
- At 700 °C, with the increase of lithium content in aluminum–lithium alloy melt, the dissolution rate of Ti increased significantly. When the holding time reaches 3 h, the Ti content in Al–2Li alloy melt is 0.105 wt%.
- (4).
- Application of crucibles and tools made of TC4 titanium alloy to smelt aluminum–lithium alloys can effectively eliminate the pollution of the melt caused by the dissolution of iron-containing appliances in the melt. Under the conventional melting temperature and time conditions of aluminum–lithium alloy, the titanium content in the melt is kept at a low level, and the TC4 titanium alloy appliances are not severely affected by the dissolution and corrosion of the aluminum–lithium alloy.
Author Contributions
Conceptualization, J.C. and X.W.; methodology, J.C. and X.W.; validation, J.C.; formal analysis, X.W. and F.W.; investigation, F.W. and Q.Y.; resources, X.W. and J.C.; data curation, F.W. and Q.Y.; writing—original draft preparation, F.W.; writing—review and editing, F.W. and Q.Y.; visualization, F.W.; supervision, X.W.; project administration, J.C. and X.W.; funding acquisition, J.C. and X.W. All authors have read and agreed to the published version of the manuscript.
Funding
This work was supported by the Fundamental Research Funds for the National Natural Science Foundation of China(U1608252, U1708251); the Key Research and Development Program of Liaoning(2020JH2/10700003); Liaoning Revitalization Talents Program, China (XLYC1807027).
Institutional Review Board Statement
Not applicable.
Informed Consent Statement
Not applicable.
Conflicts of Interest
The authors declare no conflict of interest.
References
- Rioja, R.J.; Liu, J. The Evolution of Al-Li Base Products for Aerospace and Space Applications. Metall. Mater. Trans. A 2012, 43, 3325–3337. [Google Scholar] [CrossRef]
- Yu, N.; Shang, J.; Cao, Y. Comparative Analysis of Al-Li Alloy and Aluminum Honeycomb Panel for Aerospace Application by Structural Optimization. Math. Probl. Eng. 2015, 2015, 815257. [Google Scholar] [CrossRef]
- Williams, J.C.; Starke, E.A. Progress in structural materials for aerospace systems. Acta Mater. 2003, 51, 5775–5799. [Google Scholar] [CrossRef]
- Akhtar, N.; Akhtar, W.; Wu, S.J. Melting and casting of lithium containing aluminium alloys. Int. J. Cast Met. Res. 2015, 28, 1–8. [Google Scholar] [CrossRef]
- Niraj, N.; Govind, K.; Suseelan, N. Studies on Al-Cu-Li-Mg-Ag-Zr alloy processed through vacuum induction melting (VIM) technique. Mater. Sci. Eng. A 2007, 454, 500–507. [Google Scholar]
- Wang, J.H.; Yi, D.Q.; Su, X.P. Solution kinetic of Al3Fe and Al9FeNi phases in aluminum allou melt. Trans. Nonferrous Met. Soc. China 2007, 17, 591–595. [Google Scholar]
- Song, D.-F.; Wang, S.-C.; Zhao, Y.-L.; Liu, S.-H.; DU, Y.; Kang, Y.-H.; Wang, Z.; Zhang, W.-W. Effect of melt holding on morphological evolution and sedimentation behavior of iron-rich intermetallic phases in Al-Si-Fe-Mn-Mg alloy. Trans. Nonferrous Met. Soc. China 2020, 30, 1–13. [Google Scholar] [CrossRef]
- Singh, H. Hot corrosion studies on plasma spray coatings over some Ni- and Fe- based super-alloys. J. Therm. Spray Technol. 2005, 14, 311–312. [Google Scholar]
- Ji, S.; Yang, W.; Gao, F.; Watson, D.; Fan, Z. Effect of iron on the microstructure and mechanical property of Al–Mg–Si–Mn and Al–Mg–Si die cast alloys. Mater. Sci. Eng. A 2013, 564, 130–139. [Google Scholar] [CrossRef]
- Zhou, H.; Cai, Q.; Wu, H.B.; Shan, Y.; Liu, X. Effect of Ni on the Microstructure and Mechanical Property of Annealing and Tempering Pre-hardened Plastic Mould Steel. New Technol. New Process 2012, 3, 67–70. [Google Scholar]
- Sun, Y.M. Elimination Measures of Harmful Iron Element in Aluminum Alloy. Foundry Technol. 2009, 30, 520–522. [Google Scholar]
- Wang, F.; Wang, X.; Cui, J. Effect of Low-Frequency Electromagnetic Casting on Micro-Structure and Macro-Segregation of 5A90 Alloy Ingots. Materials 2020, 13, 2720. [Google Scholar] [CrossRef] [PubMed]
- Zhao, Z.-Y.; Li, L.; Bai, P.-K.; Jin, Y.; Wu, L.-Y.; Li, J.; Guan, R.-G.; Qu, H.-Q. The heat treatment influence on the microstructure and hardness of TC4 titanium alloy manufactured via selective laser melting. Materials 2018, 11, 1318. [Google Scholar] [CrossRef]
- Banerji, A.; Reif, W. Development of Al-Ti-C grain refiners containing TiC. Metall. Trans. A 1986, 17, 2127. [Google Scholar] [CrossRef]
- Ogawa, T.; Hasunuma, S.; Shirawachi, T. Effect of Chemical Composition and Relative Humidity on the Humid Gas Stress Corrosion Cracking of Aluminum Alloys. J. High Press. Inst. Jpn. 2019, 57, 24–33. [Google Scholar] [CrossRef]
- Wang, X.; Liao, X.; Ma, C.; Zhang, S.; Liu, Y.; Chen, H. Effects of chemical composition on the corrosion behavior of A7N01S-T5 Al alloys. Int. J. Mod. Phys. B 2015, 29, 27. [Google Scholar] [CrossRef]
- Delijic, K.; Markoli, B. The influence of the chemical composition on the corrosion performances of a medium strength Al-Mg-Si (6XXX) type alloys. Metall. Mater. Eng. 2014, 20, 131–140. [Google Scholar] [CrossRef]
- Okamoto, H. Al-Ti (aluminum-titanium). J. Phase Equilib. 1993, 14, 764. [Google Scholar] [CrossRef]
- Jiang, S.; Li, S. Formation mechanism and prediction of new phases in binary metallic liquid/solid interface. Rare Met. 2011, 30, 486–491. [Google Scholar] [CrossRef]
- Jiang, S.Y.; Li, S.C.; Zhang, L. Microstructure evolution of Al–Ti liquid–solid interface. Trans. Nonferrous Met. Soc. China 2013, 23, 3545–3552. [Google Scholar] [CrossRef]
- Huo, P.; Zhao, Z.; Bai, P.; Yuan, X.; Wang, Q.; Zhao, R.; Zhang, L.; Du, W.; Han, B.; Wang, Y. Deformation evolution and fracture mechanism of porous TC4 alloy scaffolds fabricated using selective laser melting under uniaxial compression. J. Alloys Compd. 2021, 861, 158529. [Google Scholar] [CrossRef]
- Li, H.; Yan, L.; Meng, L.; Li, Y.; Ai, F.; Zhang, H.; Jiang, Z. Effect of Ni on the microstructure and diffusion behavior at the interface of WC/high-speed steel composites. Metals 2021, 11, 341. [Google Scholar] [CrossRef]
- Gu, C.Q. Foundation of Materials Engineering; Beijing Machinery Industry Press: Beijing, China, 2003; p. 288. [Google Scholar]
- Wu, Y.J.; Lan, T. Study on Infiltration Combustion Synthesis (ICS) of TiAl Intermetallic Compound. Rare Met. Mater. Eng. 1996, 25, 17. [Google Scholar]
- Zhang, Y.S.; Zhao, S.M. Study on the Li diffusion coefficient measurement in liquid Al. Acta Chim. 1990, 4, 690–693. [Google Scholar]
Publisher’s Note: MDPI stays neutral with regard to jurisdictional claims in published maps and institutional affiliations. |
© 2021 by the authors. Licensee MDPI, Basel, Switzerland. This article is an open access article distributed under the terms and conditions of the Creative Commons Attribution (CC BY) license (https://creativecommons.org/licenses/by/4.0/).